Embed Size (px)
Citation preview

Sleep Health 3 (2017) 6–19
Contents lists available at ScienceDirect
Sleep HealthJournal of the National Sleep Foundation
j ourna l homepage: s leephea l th journa l .o rg
National Sleep Foundation's sleep quality recommendations:
first report☆Maurice Ohayon, MD, DSc, PhD a,⁎, Emerson M. Wickwire, PhD b,c, Max Hirshkowitz, PhD d,e,Steven M. Albert, PhD, MS f, Alon Avidan, MD, MPH g, Frank J. Daly, PhD h, Yves Dauvilliers, MD, PhD i,Raffaele Ferri,MD j, Constance Fung,MD,MSHS k, DavidGozal,MD l, NancyHazen, PhD m, AndrewKrystal,MD n,Kenneth Lichstein, PhD o, Monica Mallampalli, PhD, MSC p, Giuseppe Plazzi, MD q,r, Robert Rawding, PhD s,Frank A. Scheer, PhD t, Virend Somers, MD, PhD u, Michael V. Vitiello, PhD v
a Stanford Sleep Epidemiology Research Center, Division of Public Mental Health and Population Sciences, Stanford University School of Medicine, Palo Alto, CA, USAb Department of Psychiatry, University of Maryland School of Medicine, Baltimore, MD, USAc Sleep Disorders Center, Division of Pulmonary and Critical Care Medicine, University of Maryland School of Medicine, Baltimore, MD, USAd Division of Public Mental Health and Population Sciences, School of Medicine, Stanford University, Stanford, CA, USAe Department of Medicine, Baylor College of Medicine, Houston, TX, USAf Department of Behavioral and Community Health Sciences, University of Pittsburgh Graduate School of Public Health, Pittsburgh, PAg UCLA Sleep Disorders Center, UCLA Neurology Clinic, Department of Neurology, UCLA, Los Angeles, CA, USAh Department of Biomedical Sciences, College of Osteopathic Medicine, University of New England, Biddeford, ME, USAi Sleep Disorders Center, Department of Neurology, Gui-de-Chauliac Hospital, CHU Montpellier, Montpellier, Francej Department of Neurology I.C., Oasi Institute for Research on Mental Retardation and Brain Aging (IRCCS), Troina, Italyk David Geffen School of Medicine at UCLA, VA Greater Los Angeles Healthcare System, Los Angeles, CA, USAl Department of Pediatrics, The University of Chicago Medicine Comer Children's Hospital, University of Chicago, Chicago, IL, USAm Human Development and Family Sciences, University of Texas at Austin, Austin, TX, USAn Neurosciences Medicine, Duke Clinical Research Institute, Durham, NC, USAo Sleep Research Project, Department of Psychology, The University of Alabama, Tuscaloosa, AL, USAp Scientific Affairs, Society for Women's Health Research, Washington, DC, USAq Department of Biomedical and Neuromotor Sciences, University of Bologna, Bologna, Italyr IRCCS Istituto delle Scienze Neurologiche di Bologna, Bologna, Italys Department of Biology, Gannon University, Erie, PA, USA.t Medical Chronobiology Program, Division of Sleep and Circadian Disorders, Brigham & Women's Hospital, Boston, MA, USAu Department of Internal Medicine, Mayo Clinic, Rochester, MN, USAv Department of Psychiatry and Behavioral Sciences, University of Washington, Seattle, WA, USA
a b s t r a c ta r t i c l e i n f o
☆ Endorsed by National Sleep Foundation, American Assogy Society, Society for Research on Biological Rhythms, S⁎ Corresponding author.
E-mail address: [email protected] (M. Oh
http://dx.doi.org/10.1016/j.sleh.2016.11.0062352-7218/© 2016 Published by Elsevier Inc. on behalf of
Keywords:
Sleep qualitySleep efficiencySleep architectureAgingObjectives: To provide evidence-based recommendations and guidance to the public regarding indicators ofgood sleep quality across the life-span.Methods: The National Sleep Foundation assembled a panel of experts from the sleep community andrepresentatives appointed by stakeholder organizations (Sleep Quality Consensus Panel). A systemat-ic literature review identified 277 studies meeting inclusion criteria. Abstracts and full-text articles
were provided to the panelists for review and discussion. A modified Delphi RAND/UCLA Appropriate-ness Method with 3 rounds of voting was used to determine agreement.Results: For most of the sleep continuity variables (sleep latency, number of awakenings N5 minutes, wakeafter sleep onset, and sleep efficiency), the panel members agreed that these measures were appropriateindicators of good sleep quality across the life-span. However, overall, there was less or no consensus re-garding sleep architecture or nap-related variables as elements of good sleep quality.Conclusions: There is consensus among experts regarding some indicators of sleep quality among otherwisehealthy individuals. Education and public health initiatives regarding good sleep quality will requireociation of Anatomists, American Physiological Society, Gerontological Society of America, Human Anatomy and Physiol-ociety for Research of Human Development, and Society for Women's Health Research.
ayon).
National Sleep Foundation. All rights reserved.

7M. Ohayon et al. / Sleep Health 3 (2017) 6–19
sustained and collaborative efforts from multiple stakeholders. Future research should explore how sleeparchitecture and naps relate to sleep quality. Implications and limitations of the consensus recommenda-tions are discussed.
© 2016 Published by Elsevier Inc. on behalf of National Sleep Foundation. All rights reserved.
Table 1Search terms used in the systematic review
Sleep terms Indicators
Sleep quality AwakeningsSleep efficiency ArousalsRestorative sleep MovementSleep consolidation RestlessnessRestful sleep ArchitectureEfficient sleep Spindle activityRefreshing sleep DurationHigh-value sleep Time in bedHigh-grade sleep Environmental factorsSatisfactory sleep Stages of sleepSleep depth Sleep cyclesDeep sleep Phases of sleep
PerceptionsRestorative
Introduction
Good sleep quality is a well-recognized predictor of physical andmental health, wellness, and overall vitality. Although, the term“sleep quality” is widely used by researchers, clinicians, and the pub-lic, this expression lacks definitional consensus. To date, no consistentguidance is available from the scientific community regarding whatconstitutes normal or optimal, healthy sleep and good sleep quality.
The Webster dictionary's simple definition of quality is “howgood or bad something is.”1 Thus, a global approach for indexingsleep quality often involves soliciting a self-rating. Such indiceslikely reflect an individual's satisfaction with his or her sleep. Anextension of this approach involves correlating self-rated sleepquality against other measures such as environmental factors,the timing of sleep, physiologically derived indices, polysomno-graphic parameters, behavior, pharmacologic interventions, and/or the presence of sleep disorders. One obvious limitation of rely-ing on self-report when assessing sleep quality is the loss of con-sciousness during sleep, which makes individuals poor self-observers of this particular behavior.
An alternative approach to defining sleep quality involvesdeconstructing it into its particular objective components. Withinthis paradigm, “quality” is defined as a combination of constituent el-ements or processes judged as valuable. It is this approach that guid-ed the current investigation. The purpose of this study was to searchfor a composite of objectively identifiable sleep features underlyingsleep quality. Many questions related to sleep quality and its poten-tial outcomes on health (eg, mood and cognitive performance)exist; however, those questions are outside the scope of this article.
The need for such clarity on sleep quality is of particular andtimely importance given the rapid increase in public awarenessof sleep as an important component of health and overall well-being. Millions of individuals are using commercially availablesleep tracking devices. These devices purport to measure sleepquality and quantity. Therefore, there exists a need to defineclearly both sleep quantity and quality using the best scientificevidence available. Sleep quantity recommendations were pre-viously addressed by a National Sleep Foundation (NSF) SleepDuration Recommendation consensus panel.2 Continuing thisprocess, the NSF assembled a panel of experts to answer thequestion, “What is good sleep quality?” The overall objectivesof this Sleep Quality Consensus Panel (SQCP) were to providescientifically sound recommendations regarding indicators ofgood sleep quality at different ages across the life-span.
Methods
Participants
To ensure a wide range of perspectives regarding indicators ofsleep quality, the NSF assembled an expert panel comprising sleepexperts as well as experts in other areas of science and medicine.Because one objective of the SQCP was to provide interpretablerecommendations to the public, it was important to includenon–sleep experts from related scientific domains. The 18-member panel included representatives selected by stakeholder
organizations (n = 10) as well as sleep experts selected by theNSF (n = 8). Stakeholder organizations that appointed represen-tatives included the American Academy of Neurology, American Geri-atrics Society, American Physiological Society, American Association ofAnatomists, Gerontological Society of America, Human Anatomy andPhysiology Society, Sleep Research Society, Society for Research onBiological Rhythms, Society for Research of Human Development, andthe Society for Women's Health Research.
Procedures
Literature reviewTo ensure that all panelists had access to the same body of evi-
dence, theNSF performed a systematic review of peer-reviewed liter-ature encompassing the years 2005-2015 using PubMed, Web ofScience, CINAHL Plus, EBSCO, and MEDLINE databases. Search termswere developed, reviewed, and agreed upon by the panel (seeTable 1). Inclusion criteria for individual studies were the following:
□ Published in English language□ Published in peer-reviewed scientific journal□ Studied human subjects□ Used objective measures of sleep quality.
A total of 3928 unique articles were identified, 386 articleswere selected for full-text review, and 277 studiesmet the final in-clusion criteria. A flowchart of literature search results is depictedin Fig. 1. Study data (ie, sample characteristics, country, studytype, measures, and results) were extracted and summarized inalphabetical tables. Separate summary tables were developed foreach age group. These tables and the corresponding full-text arti-cles were distributed to panelists for review to inform their rat-ings. Key articles are summarized in Supplementary table(Appendix A).
Panel deliberations and consensus votingPanelists were initially tasked with defining age categories and
possible indicators of good sleep quality. Based on the literature

Fig. 1. Flow chart of literature search results.
8 M. Ohayon et al. / Sleep Health 3 (2017) 6–19
review and consistent with previous recommendations regardingsleep duration,2 panelists agreed on 9 age categories from birththrough old age: newborn (0-3 months), infant (4-11 months),toddler (1-2 years), preschooler (3-5 years), school aged (6-13 years), teenager (14-17 years), young adult (18-25 years),adult (26-64 years), and older adult (≥65 years).
Similarly, 12 possible indicators of sleep quality were identified,including 4 sleep continuity variables (sleep latency, awakeningsN5 minutes,wake after sleep onset, sleep efficiency), 5 sleep architec-ture variables (rapid eye movement [REM] sleep, N1 sleep, N2 sleep,N3 sleep, arousals), and 3 nap variables (naps per 24 hours, nap dura-tion, and days per week with at least one nap). Table 2 presents

Table 2Indicators considered by the panel
Term Measurement Synonyms Definition
Sleep efficiency Percent (%) Ratio of total sleep time to time in bedSleep latency Minutes Length of time, in minutes, it takes to transition from wake to sleepREM sleepa Percent (%) Paradoxical sleep Ratio of time spent in REM sleep to total sleep timeN1 sleepa Percent (%) Light sleep; non-REM (NREM) sleep 1 Ratio of time spent in N1 sleep to total sleep timeN2 sleepa Percent (%) NREM sleep 2 Ratio of time spent in N2 sleep to total sleep timeN3 sleepa Percent (%) Slow-wave sleep; deep sleep;
NREM sleep 3Ratio of time spent in N3 sleep to total sleep time
Naps Number (#) Sleep episode Number of naps per 24-h periodNap duration Minutes Sleep episode Average length of each nap, in minutesNap frequency Days Sleep episode Number of days, in the past 7, that a nap occurredArousals Number per hour An abrupt change from “deeper” stage of NREM sleep to a “lighter” stage,
or from REM sleep toward wakefulness, with the possibility of awakeningat the final outcome. May be accompanied by increased tonic electromyographicactivity and heart rate, as well as by an increased number of body movements
Awakenings (N5 min) Number per night Number of episodes, per night, in which an individual is awake forgreater than 5 min
Wake after sleep onset Minutes Amount of time, in minutes, spent awake after sleep hasbeen initiated and before final awakening
a REM, N1, N2, and N3 sleep are acronyms commonly defined in sleep medicine.
9M. Ohayon et al. / Sleep Health 3 (2017) 6–19
indicators considered by the panel. Due to the large number of ageranges and possible sleep indicators, it was necessary to considerwhether any indicators were not appropriate for one or moreage groups. An initial round of voting (round 0) was conductedto rate each possible indicator as appropriate, uncertain, or inap-propriate. The panel agreed to keep appropriate and uncertain in-dicators and eliminate inappropriate indicators for the next roundof voting.
Once all indicators were established, panelists were askedto consider each indicator for each age category. To answerthe question, “How appropriate is this indicator of good sleepquality,” panelists reviewed the assembled scientific literatureand met a total of 5 times (by conference call or in-person). Theballot consisted of a standardized response format for eachpossible indicator at each age-group, as follows: “For [agegroup], a [sleep quality indicator] of [value] indicates goodsleep quality.”
Over a 6-month interval during which scientific findings wereread, reviewed, and discussed, each panelist participated in 3 roundsof voting, as follows:
□ The initial vote was cast independently.□ The second round took place at an in-person meeting
6 months later. During the in-person meeting, panelistsreviewed round 1 results, deliberated, and participated in thesecond round of independent voting.
□ The third and final round of independent voting took place2weeks after the in-personmeeting, and ballots were submit-ted electronically.
Appropriateness was rated from 1 (ie, extremely inappropri-ate) to 9 (ie, extremely appropriate). A modified Delphi RAND/UCLA Appropriateness Method3 was used to synthesize the collec-tive judgment of experts about the appropriateness of each prop-osition, based on their interpretation of available scientificevidence. In this approach, expert consensus recommendationsare defined as appropriate (panel median of 7-9, without dis-agreement), uncertain (panel median of 4-6 or any median withdisagreement), or inappropriate (panel median of 1-3, withoutdisagreement). Agreement occurs when 80% or more of votes fallwithin any 3-point range (ie, 1-3, 4-6, or 7-9). Disagreementtakes place when more than 20% of votes fall outside any 3-pointrange.
Results
Appropriateness of possible indicators (round 0)
Among newborns, REM activity and number of awakenings wererated appropriate indicators for grading sleep quality. N3 sleep wasrated uncertain. All other possible indicators were rated inappropri-ate and removed from future consideration. Among infants, N1sleep and N2 sleepwere rated inappropriate and removed; nap dura-tion and nap frequencywere rated uncertain and included alongwithall other possible indicators, which had been rated appropriate. Foreach remaining age category, all possible indicators were rated ap-propriate for inclusion and included in future consensus voting.
Panel deliberations and consensus voting (rounds 1-3)
For all included indicators, panelists were tasked with answeringthe question, “For [age group,] a [sleep quality indicator] of [value] in-dicates good sleep quality.” Votes that resulted in consensus are pre-sented below.
Sleep continuity measures
Sleep latencyAcross all age groups, a sleep latency of ≤15 minutes (ie, 0-15)
was rated as an appropriate measure for indexing good sleep qual-ity. Sleep latencies ranging from 16 to 30 minutes were judgedsimilarly to be good sleep quality. For all age groups exceptingolder adults, a sleep latency of 45-60 minutes (ie, 46-60 minutes)indicates poor sleep quality. For all age groups, a sleep latencyN60 minutes indicates poor sleep quality. Results are presentedin Fig. 2.
Awakenings N5 minutesAcross all age groups, 1 or fewer awakening (ie, 0 or 1 awakening)
per night indicate good sleep quality. Among older adults, 2 awaken-ings per night also qualify as indicating good sleep quality. For all agegroups, 4 or more awakenings (ie, 4 or 5 awakenings) per night werevoted as not an appropriate indicator for good sleep quality. Amongteens, more than 3 awakenings per night do not indicate good sleepquality (Fig. 3).

Fig. 2. Expert consensus regarding sleep latency across the life-span. White indicates that panelists agreed that this measure was an appropriate indicator of good sleep quality (ie,≥80% of votes were 7-9). Dots indicate that panelists were uncertain or there was disagreement (ie, ≥80% of votes were 4-6 or ≥20% of votes fell outside any 3-point range). Blackindicates that panelists agreed that this measure was not an appropriate indicator of good sleep quality (ie, ≥80% of votes were 1-3).
10 M. Ohayon et al. / Sleep Health 3 (2017) 6–19
Wake after sleep onsetFor all age groups from preschoolers through older adults, a wake
after sleep onset of ≤20minutes (ie, ≤10 or 11–20 minutes) indicatesgood sleep quality. For all age groups from preschoolers throughadults, a wake after sleep onset ≥51 minutes (ie, 51-60 or ≥61 mi-nutes) does not indicate good sleep quality. In addition, for school-aged children, young adults, and adults, a wake after sleep onset of≥41minutes (ie, 41-50, 51-60, or N60 minutes) also does not indicategood sleep quality (Fig. 4).
Sleep efficiencyAcross all age groups, a sleep efficiency of ≥85% (ie, 85%-94% or ≥95%)
was judged as an appropriate indicator of good sleep quality. Across allage groups except young adults, a sleep efficiency ≤74% (ie, ≤64% or65%-74%) does not indicate good sleep quality. Among young adults, asleep efficiency ≤64% does not indicate good sleep quality (Fig. 5).
Sleep architecture measures
REM sleepAmong newborns, a REM sleep ≥41% indicates good sleep quality.
Among adults, a REM sleep of 21%-30% indicates good sleep quality.Among newborns, infants, toddlers, preschoolers, and teens, a REMsleep of ≤10% does not indicate good sleep quality. Among newborns,a REM sleep of ≤20% also does not indicate good sleep quality. Amongyoung adults, adults, and older adults, a REM sleep of ≥41% does notindicate good sleep quality (Fig. 6).
N1 sleepAmong school-aged children, teens, young adults, and adults, N1
sleep of ≤5% indicates good quality sleep. Among toddlers, pre-schoolers, school-aged children, teens, young adults, and adults, N1sleep of ≥20% (ie, 20%-25% or ≥26%) does not indicate good sleep
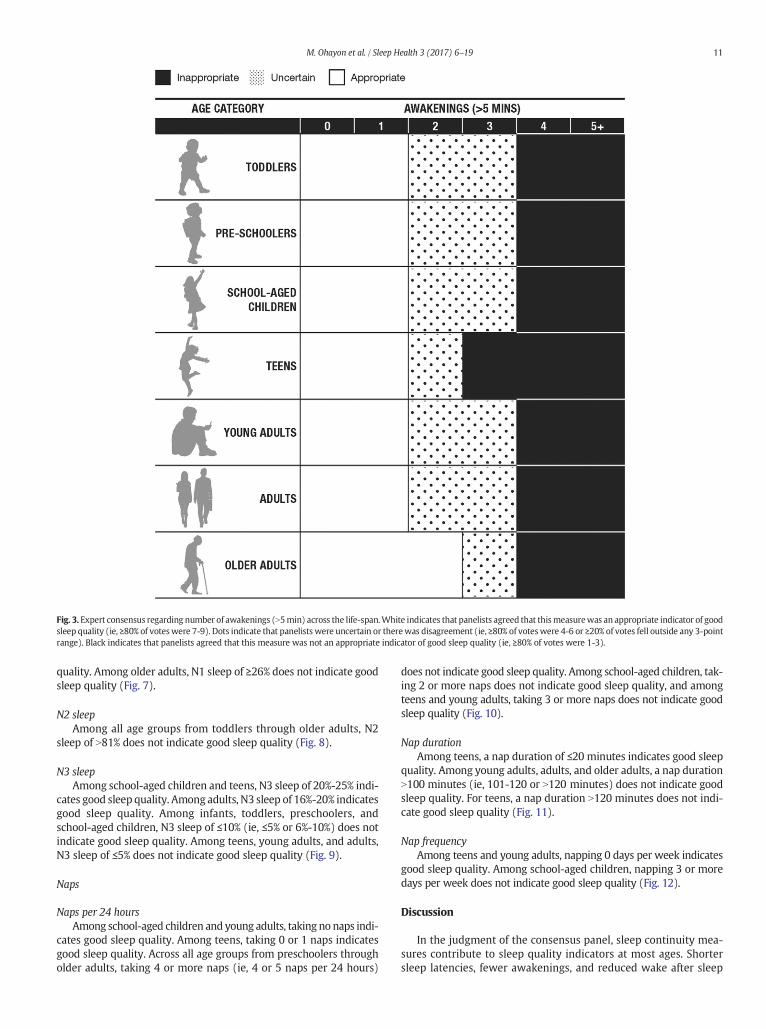
Fig. 3. Expert consensus regarding number of awakenings (N5min) across the life-span.White indicates that panelists agreed that thismeasurewas an appropriate indicator of goodsleep quality (ie, ≥80% of voteswere 7-9). Dots indicate that panelists were uncertain or therewas disagreement (ie, ≥80% of voteswere 4-6 or ≥20% of votes fell outside any 3-pointrange). Black indicates that panelists agreed that this measure was not an appropriate indicator of good sleep quality (ie, ≥80% of votes were 1-3).
11M. Ohayon et al. / Sleep Health 3 (2017) 6–19
quality. Among older adults, N1 sleep of ≥26% does not indicate goodsleep quality (Fig. 7).
N2 sleepAmong all age groups from toddlers through older adults, N2
sleep of N81% does not indicate good sleep quality (Fig. 8).
N3 sleepAmong school-aged children and teens, N3 sleep of 20%-25% indi-
cates good sleep quality. Among adults, N3 sleep of 16%-20% indicatesgood sleep quality. Among infants, toddlers, preschoolers, andschool-aged children, N3 sleep of ≤10% (ie, ≤5% or 6%-10%) does notindicate good sleep quality. Among teens, young adults, and adults,N3 sleep of ≤5% does not indicate good sleep quality (Fig. 9).
Naps
Naps per 24 hoursAmong school-aged children and young adults, taking no naps indi-
cates good sleep quality. Among teens, taking 0 or 1 naps indicatesgood sleep quality. Across all age groups from preschoolers througholder adults, taking 4 or more naps (ie, 4 or 5 naps per 24 hours)
does not indicate good sleep quality. Among school-aged children, tak-ing 2 or more naps does not indicate good sleep quality, and amongteens and young adults, taking 3 or more naps does not indicate goodsleep quality (Fig. 10).
Nap durationAmong teens, a nap duration of ≤20 minutes indicates good sleep
quality. Among young adults, adults, and older adults, a nap durationN100 minutes (ie, 101-120 or N120 minutes) does not indicate goodsleep quality. For teens, a nap duration N120 minutes does not indi-cate good sleep quality (Fig. 11).
Nap frequencyAmong teens and young adults, napping 0 days per week indicates
good sleep quality. Among school-aged children, napping 3 or moredays per week does not indicate good sleep quality (Fig. 12).
Discussion
In the judgment of the consensus panel, sleep continuity mea-sures contribute to sleep quality indicators at most ages. Shortersleep latencies, fewer awakenings, and reduced wake after sleep

Fig. 4. Expert consensus regarding wake after sleep onset across the life-span. White indicates that panelists agreed that this measure was an appropriate indicator of good sleepquality (ie, ≥80% of votes were 7-9). Dots indicate that panelists were uncertain or there was disagreement (ie, ≥80% of votes were 4-6 or ≥20% of votes fell outside any 3-pointrange). Black indicates that panelists agreed that this measure was not an appropriate indicator of good sleep quality (ie, ≥80% of votes were 1-3).
12 M. Ohayon et al. / Sleep Health 3 (2017) 6–19
onset were viewed as indicators of good sleep quality, regardless ofage. Similarly, higher sleep efficiency indicates good sleep qualityacross all age groups, and lower sleep efficiency indicates poorsleep. In aggregate, these findings are consistent with past epidemio-logic and meta-analytic findings.4
Results regarding sleep architecture and naps were less consistent.There was disagreement (ie, 80% consensus was not reached) regard-ing many indicators due to a paucity of epidemiologic data amonghealthy individuals in particular age groups. Nonetheless, 2 consensusfindings regarding sleep architecture warrant consideration. First,among young adults, adults, and older adults, there was agreementthat elevated REM sleep (ie, ≥41%) does not indicate good sleepquality. Second, in all age groups except older adults, there was agree-ment that reducedN3 sleep (ie, ≤5%) does not indicate good sleepqual-ity. From a public health perspective, these findings address commonmisperceptions, namely, that more REM sleep is always better.
Regarding naps, fewer naps per 24 hours generally indicategood sleep quality, and more naps per 24 hours do not indicate goodsleepquality. Over the life-span, longer napsdonot indicate good sleep.
Although the SQCP has taken an important step forward, the fol-lowing limitations should be noted when considering our results.
1. Some indicators of good sleep quality might be relative ratherthan absolute. Many panelists agreed that unlike sleep
pathophysiology that defines a disorder when it reachesdiagnostic criteria, sleep architecture variables might be betterconsidered in relation to one another rather than individually. Asleep-architecture compositemeasure indexing pattern normalcymight prove more appropriate for determining sleep quality.Available literature mainly tests sleep architecture variables sepa-rately; consequently, the panel was unable to address this issue.
2. Sleep changes as we age, and there are no universallyaccepted delineations of age category or developmentalstage. Furthermore, sleep quality also varies between menand women, with sex-dependent changes across the life-span. Thus, the definition of adults in this analysis includedmen as well as both premenopausal and postmenopausalwomen. The current project used age cutoffs to parallel thoseused in defining optimal sleep duration across the life-span.2
3. Techniques used in sleep quality studies vary widely. For exam-ple, objective sleep measures determined by polysomnographymay differ from those derived from actigraphy. It is unclearto what extent these inconsistencies influenced the decisionmaking.
4. With respect to napping and sleep quality, the literature doesnot consistently differentiate between planned and unplannednaps. Consequently, the SQCP was unable to adequately ad-dress this important question.

Fig. 5. Expert consensus regarding sleep efficiency across the life-span.White indicates that panelists agreed that thismeasurewas an appropriate indicator of good sleep quality (ie,≥80% of votes were 7-9). Dots indicate that panelists were uncertain or there was disagreement (ie, ≥80% of votes were 4-6 or ≥20% of votes fell outside any 3-point range). Blackindicates that panelists agreed that this measure was not an appropriate indicator of good sleep quality (ie, ≥80% of votes were 1-3).
13M. Ohayon et al. / Sleep Health 3 (2017) 6–19
5. Sleep undergoes seasonal changes. Some of these rhythmvariations stem from changes in light exposure and are com-plicated by the geographic latitude in which an individualresides. Other variations related to schedule alterations arerelated to school or work.
6. Research measures of sleep quality, such as slow wavepower, were not considered here. Although valuable for cer-tain scientific applications, such measures were judged toprovide limited insight for the home setting of the generalpopulation.
The current results suggest a number of practical and re-search applications. Our findings highlight the multidimension-al nature and complexity of sleep quality. During deliberations,it became clear that scientific literature gaps frequentlyprevented consensus. These gaps need to be filled by future
research. Key among these is advancing understanding ofsleep architecture as an indicator of sleep quality. Finally, en-hanced assessment of sleep quality is essential to ensure consis-tency across measures. For example, although panelists agreedthat ≥41 minutes of wake after sleep onset does not indicategood sleep quality at most ages, panelists also agreed that 4 ormore awakenings of ≥5 minutes (ie, ≥20 minutes total) do notindicate good sleep quality at most ages. Future research shouldconsider the following:
□ Systematically exploring the relationship between subjectivesleep quality (and/or sleep satisfaction) and objective sleepmeasures in different age groups
□ Further evaluation of sleep microarchitectural indices asso-ciated with sleep quality
□ Developing and testing composite measures for sleep quality
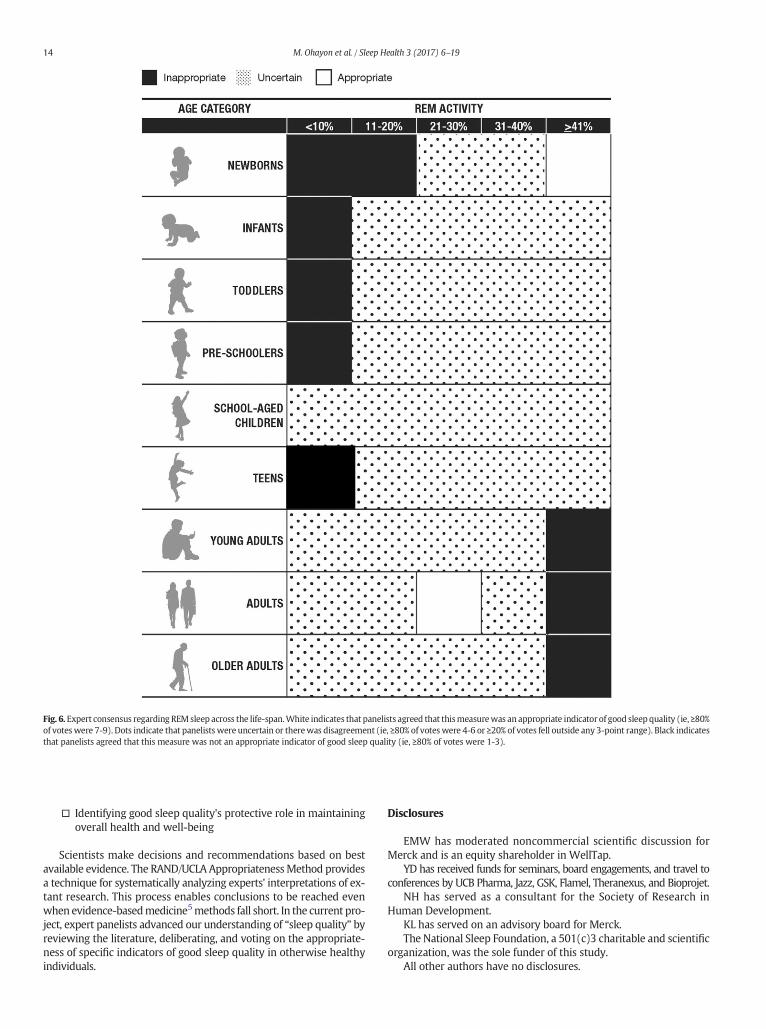
Fig. 6. Expert consensus regarding REMsleep across the life-span.White indicates that panelists agreed that thismeasurewas an appropriate indicator of good sleep quality (ie, ≥80%of voteswere 7-9). Dots indicate that panelists were uncertain or therewas disagreement (ie, ≥80% of voteswere 4-6 or ≥20% of votes fell outside any 3-point range). Black indicatesthat panelists agreed that this measure was not an appropriate indicator of good sleep quality (ie, ≥80% of votes were 1-3).
14 M. Ohayon et al. / Sleep Health 3 (2017) 6–19
□ Identifying good sleep quality's protective role in maintainingoverall health and well-being
Scientists make decisions and recommendations based on bestavailable evidence. The RAND/UCLA AppropriatenessMethod providesa technique for systematically analyzing experts' interpretations of ex-tant research. This process enables conclusions to be reached evenwhen evidence-basedmedicine5methods fall short. In the current pro-ject, expert panelists advanced our understanding of “sleep quality” byreviewing the literature, deliberating, and voting on the appropriate-ness of specific indicators of good sleep quality in otherwise healthyindividuals.
Disclosures
EMW has moderated noncommercial scientific discussion forMerck and is an equity shareholder in WellTap.
YD has received funds for seminars, board engagements, and travel toconferences by UCB Pharma, Jazz, GSK, Flamel, Theranexus, and Bioprojet.
NH has served as a consultant for the Society of Research inHuman Development.
KL has served on an advisory board for Merck.The National Sleep Foundation, a 501(c)3 charitable and scientific
organization, was the sole funder of this study.All other authors have no disclosures.

Fig. 7. Expert consensus regarding N1 sleep across the life-span.White indicates that panelists agreed that this measurewas an appropriate indicator of good sleep quality (ie, ≥80%of voteswere 7-9). Dots indicate that panelists were uncertain or therewas disagreement (ie, ≥80% of voteswere 4-6 or ≥20% of votes fell outside any 3-point range). Black indicatesthat panelists agreed that this measure was not an appropriate indicator of good sleep quality (ie, ≥80% of votes were 1-3).
15M. Ohayon et al. / Sleep Health 3 (2017) 6–19

Fig. 8. Expert consensus regarding N2 sleep across the life-span.White indicates that panelists agreed that thismeasurewas an appropriate indicator of good sleep quality (ie, ≥80%of voteswere 7-9). Dots indicate that panelists were uncertain or therewas disagreement (ie, ≥80% of voteswere 4-6 or ≥20% of votes fell outside any 3-point range). Black indicatesthat panelists agreed that this measure was not an appropriate indicator of good sleep quality (ie, ≥80% of votes were 1-3).
16 M. Ohayon et al. / Sleep Health 3 (2017) 6–19

Fig. 9. Expert consensus regarding N3 sleep across the life-span.White indicates that panelists agreed that this measurewas an appropriate indicator of good sleep quality (ie, ≥80%of voteswere 7-9). Dots indicate that panelists were uncertain or therewas disagreement (ie, ≥80% of voteswere 4-6 or ≥20% of votes fell outside any 3-point range). Black indicatesthat panelists agreed that this measure was not an appropriate indicator of good sleep quality (ie, ≥80% of votes were 1-3).
17M. Ohayon et al. / Sleep Health 3 (2017) 6–19
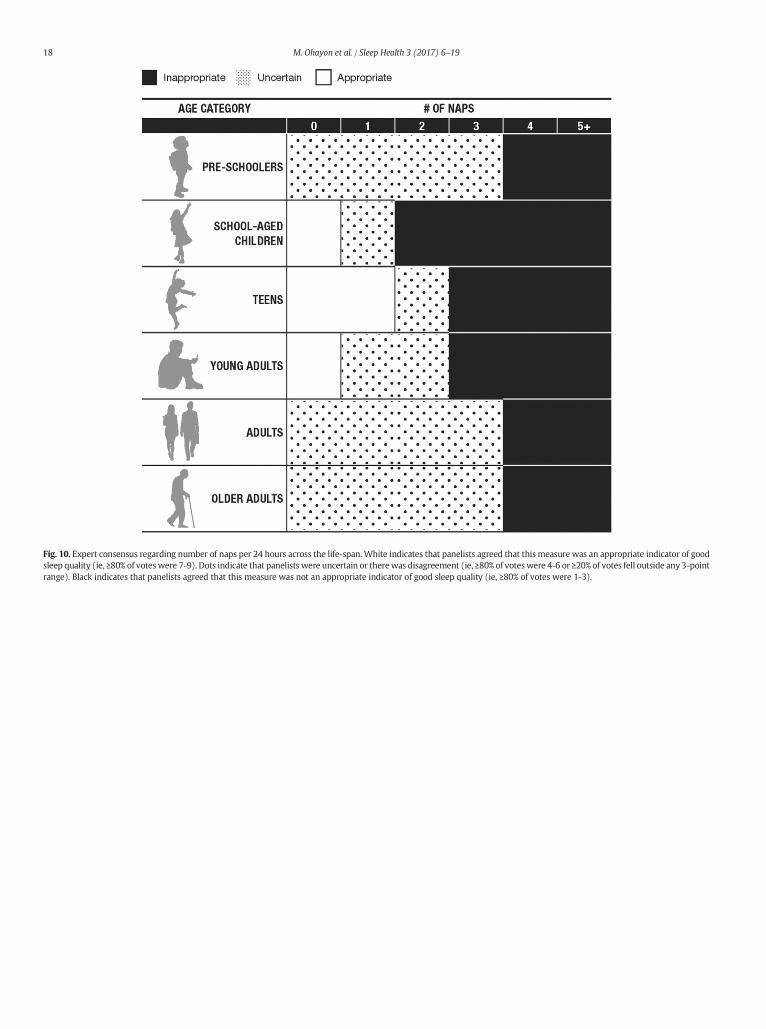
Fig. 10. Expert consensus regarding number of naps per 24 hours across the life-span.White indicates that panelists agreed that this measure was an appropriate indicator of goodsleep quality (ie, ≥80% of voteswere 7-9). Dots indicate that panelists were uncertain or therewas disagreement (ie, ≥80% of voteswere 4-6 or ≥20% of votes fell outside any 3-pointrange). Black indicates that panelists agreed that this measure was not an appropriate indicator of good sleep quality (ie, ≥80% of votes were 1-3).
18 M. Ohayon et al. / Sleep Health 3 (2017) 6–19

Fig. 11. Expert consensus regarding nap duration across the life-span.White indicates that panelists agreed that thismeasurewas an appropriate indicator of good sleep quality (ie,≥80% of votes were 7-9). Dots indicate that panelists were uncertain or there was disagreement (ie, ≥80% of votes were 4-6 or ≥20% of votes fell outside any 3-point range). Blackindicates that panelists agreed that this measure was not an appropriate indicator of good sleep quality (ie, ≥80% of votes were 1-3).
Fig. 12. Expert consensus regarding nap frequency (number of naps per week) across the life-span. White indicates that panelists agreed that this measure was an appropriate in-dicator of good sleep quality (ie, ≥80% of votes were 7-9). Dots indicate that panelists were uncertain or there was disagreement (ie, ≥80% of votes were 4-6 or ≥20% of votes felloutside any 3-point range). Black indicates that panelists agreed that this measure was not an appropriate indicator of good sleep quality (ie, ≥80% of votes were 1-3).
19M. Ohayon et al. / Sleep Health 3 (2017) 6–19
Appendix A. Supplementary data
Supplementary data to this article can be found online at http://dx.doi.org/10.1016/j.sleh.2016.11.006.
References
1. Webster M. Webster M. Dictionary; 2014.
2. Hirshkowitz M,Whiton K, Albert SM, et al. National Sleep Foundation's sleep time du-ration recommendations:methodology and results summary. Sleep Health. 2015;1(1):40–43.
3. Fitch K, Bernstein SJ, Aguilar MD, Burnand B, LaCalle JR. The RAND/UCLA Appropri-ateness Method User's Manual; 2001.
4. Ohayon MM, Carskadon MA, Guilleminault C, Vitiello MV. Meta-analysis of quanti-tative sleep parameters from childhood to old age in healthy individuals: develop-ing normative sleep values across the human lifespan. Sleep. 2004;27:1255–1274.
5. Sackett DL, Rosenberg WM, Gray JA, Haynes RB, Richardson WS. Evidence basedmedicine: what it is and what it isn't. BMJ. 1996;312(7023):71–72.