Embed Size (px)
Citation preview

VARIATION IN THE TROPHIC POSITION OF SPINY DOGFISH (SQUALUS
ACANTHIAS) IN THE NORTHEASTERN PACIFIC OCEAN: AN APPROACH USING
CARBON AND NITROGEN STABLE ISOTOPES
By
Alexander George Andrews III
RECOMMENDED: __________________________________________ Dr. Gordon H. Kruse __________________________________________
Dr. Matthew J. Wooller
__________________________________________ Dr. Nicola Hillgruber, Advisory Committee Co-Chair
__________________________________________ Dr. Robert J. Foy, Advisory Committee Co-Chair
__________________________________________ Dr. Trent M. Sutton, Program Head, Fisheries Division
APPROVED: __________________________________________ Dr. Michael A. Castellini Dean, School of Fisheries and Ocean Sciences __________________________________________ Dr. Lawrence K. Duffy, Dean of the Graduate School __________________________________________
Date

VARIATION IN THE TROPHIC POSITION OF SPINY DOGFISH (SQUALUS
ACANTHIAS) IN THE NORTHEASTERN PACIFIC OCEAN: AN APPROACH USING
CARBON AND NITROGEN STABLE ISOTOPES
A
THESIS
Presented to the Faculty
of the University of Alaska Fairbanks
in Partial Fulfillment of the Requirements
for the Degree of
MASTER OF SCIENCE
By
Alexander G. Andrews III
Fairbanks, Alaska
December 2010

iii
Abstract
Spiny dogfish (Squalus acanthias) are among the most abundant shark species in
the Gulf of Alaska (GOA). An increase in relative biomass of spiny dogfish in 2003 and
2007 inspired interest in this species as a commercial resource. However, very little was
known about the ecology of this species in the GOA. This study investigated the trophic
role of spiny dogfish in the GOA, British Columbia (BC), and Washington using stable
isotope analysis of carbon and nitrogen. Specifically, we examined the trophic position
(TP) of spiny dogfish in relation to length, sex, and geographic region. Weathervane
scallops (Patinopecten caurinus) were used as a stable isotopic baseline organism. Spiny
dogfish between 52 to 113 cm length had δ15N values that ranged geographically from
10.8‰ to 15.6‰; δ15N was linearly related to length. In contrast, lipid-normalized δ13C’
values ranged from -21.2‰ to -16.8‰ and were not linearly related to length. In the
GOA, TP of spiny dogfish ranged from 3.3 to over 4.1, with Kodiak having the highest
TPs for spiny dogfish of a given length. Our results indicated that size-based ontogenetic
changes in TP of spiny dogfish are important and should be incorporated into mass-
balance, food-web models such as Ecopath.

iv
Table of Contents
Page
Signature Page .............................................................................................................. i
Title Page ..................................................................................................................... ii
Abstract ....................................................................................................................... iii
Table of Contents ........................................................................................................ iv
List of Figures ............................................................................................................ vii
List of Tables ............................................................................................................ viii
List of Appendices ...................................................................................................... ix
Acknowledgements ...................................................................................................... x
General Introduction .................................................................................................... 1
Chapter 1 .................................................................................................................... 11
1.1 Abstract .................................................................................................... 11
1.2 Introduction .............................................................................................. 13
1.3 Methods.................................................................................................... 17
1.4 Results/Discussion ................................................................................... 18
1.4.1 Isotopic differences between sexes in Yakutat Bay ........................... 18
1.4.2 Isotopic differences among sites ........................................................ 19
1.4.3 Trophic level and diet implications .................................................... 20
1.4.4 Food-web and habitat implications .................................................... 21
1.4.5 Spatial gradients in other ecosystems ................................................ 23
1.5 Conclusion ............................................................................................... 23

v
Page
1.6 Acknowledgements .................................................................................. 25
1.7 References ................................................................................................ 30
Chapter 2 .................................................................................................................... 37
2.1 Abstract .................................................................................................... 37
2.2 Introduction .............................................................................................. 39
2.3 Materials and Methods ............................................................................. 45
2.3.1 Sample collection .................................................................................. 45
2.3.2 Sample processing and stable isotope analysis ..................................... 46
2.3.3 Trophic position calculation ................................................................. 48
2.3.4 Lipid normalization ............................................................................... 48
2.3.5 Statistical analysis ................................................................................. 49
2.3.5.1 Weathervane scallops ......................................................................... 49
2.3.5.2 Spiny dogfish ..................................................................................... 50
2.3.5.2.1 Interannual variation ....................................................................... 50
2.3.5.2.2 Linear relationship between δ15N and δ13C and length .................. 51
2.3.5.2.3 Differences between sexes .............................................................. 51
2.3.5.2.4 Differences among sites .................................................................. 51
2.4 Results ...................................................................................................... 52
2.4.1 Weathervane scallops ............................................................................ 52
2.4.2 Spiny dogfish ........................................................................................ 53
2.4.2.1 Summary of δ15N and δ13C ................................................................ 53

vi
Page
2.4.2.2 Interannual variation of δ15N and δ13C .............................................. 54
2.4.2.3 Relationship between δ15N and δ13C and length ................................ 54
2.4.2.4 δ15N differences between sexes ......................................................... 55
2.4.2.5 Isotopic differences among sites ........................................................ 55
2.4.2.6 Adjusted trophic position ................................................................... 56
2.5 Discussion ................................................................................................ 56
2.6 Acknowledgements .................................................................................. 68
2.7 References ................................................................................................ 85
Appendices ..................................................................................................... 98
General Conclusions ................................................................................................ 103

vii
List of Figures
Page
1.1 Sampling locations ............................................................................................... 26
1.2 Mean (SE) δ13C values and δ15N values for male and female spiny dogfish ...... 27
1.3 Mean (SE) δ13C versus δ15N values of male spiny dogfish ................................. 28
2.1 Number and location of spiny dogfish sampled in the Gulf of Alaska ................ 69
2.2 Approximate locations of weathervane scallop samples ..................................... 70
2.3 Weathervane scallop δ15N values for 2004 and 2005 .......................................... 71
2.4 Weathervane scallop δ15N values in the Gulf of Alaska ...................................... 72
2.5 Weathervane scallop δ15N values in the pooled NMFS regulatory areas ............ 73
2.6 Spiny dogfish δ13C’ (lipid-normalized δ13C) values ............................................ 74
2.7 Linear relationship between spiny dogfish δ15N and length ................................ 75
2.8 Linear relationship between spiny dogfish δ13C and length ................................ 76
2.9 Linear relationship between spiny dogfish δ13C’ (lipid normalized) and length . 77
2.10 δ15N differences between sexes ......................................................................... 78
2.11 Boxplot of δ13C’ (lipid-normalized δ13C) values ............................................... 79
2.12 Fitted linear relationships ................................................................................... 80

viii
List of Tables
Page
1.1 Mean (SD) of stable isotope ratios (δ15N and δ13C) of spiny dogfish ................. 29
2.1 Spiny dogfish sample sizes (N) at each site ......................................................... 81
2.2 Sample site and region, date, bottom depth, and mean δ15N ............................... 82
2.3 Parameters, test statistics, and sample sizes (N) for linear relationships ............. 83
2.4 Pairwise comparisons of δ13C’ (lipid-normalized δ13C) values among sites ....... 84

ix
List of Appendices
Page
A.1 Sampling site, date, gear, and sample location ................................................... 98
A.2 Specimen ID number, carbon and nitrogen ratio (C:N), and isotopes .............. 100

x
Acknowledgements
I thank my co-advisors Dr. Nicola Hillgruber and Dr. Robert Foy for providing
advice and guidance throughout this process. I wish to express my deepest gratitude to
Dr. Nicola Hillgruber. She joined my committee at a key point in time and encouraged
me to persevere and write. Additionally, she provided excellent editing assistance and
promoted my ability to think critically. I could not have completed this thesis without her
help. I thank Dr. Robert Foy for the numerous memorable discussions on topics ranging
from sample sizes to food-webs; these conversations were crucial and guided my design
of this study. My committee members Dr. Matthew Wooller and Dr. Gordon Kruse
provided keen scientific acumen. I value Dr. Matthew Wooller’s enthusiasm regarding
the use of stable isotope techniques in ecology as well as his eye for simple yet telling
experimental design. I thank Dr. Gordon Kruse for sharing both his vast knowledge of
fisheries in Alaska and his insights into what types of biological information are
important.
A number of people helped with sample collections. First and foremost, I thank
Cindy Tribuzio (NOAA-ABL) for graciously offering spiny dogfish samples and data
collected in her concurrent doctorate study at the UAF-SFOS. Thanks to ADFG-Kodiak,
Greg Bargmann (WA-WDFW), Dean Courtney (NOAA-ABL), Vince Gallucci (UW),
Jackie King (DFOS), and Nicole Vega (UW) for providing and assisting with spiny
dogfish sample collection. Thanks to Jeff Barnhart (ADFG-Kodiak) for assisting with the
collection of weathervane scallops. Also, my great appreciation to NOVA Fisheries Inc.
for providing weathervane scallop samples. Tremendous thanks to Mr. Tom Minio (F/V

xi
Provider), and Mr. John Lemar and Mr. Glenn Mikkelson (F/V Ocean Hunter); these
captains voluntarily collected scallop samples at no cost.
I am grateful for the statistical advice provided by Franz Mueter (UAF-SFOS) and
Terry Quinn (UAF-SFOS). This project would not have been possible without the
expertise of Norma Haubenstock and Tim Howe at the UAF-Alaska Stable Isotope
Facility. They welcomed me to the lab and guided me through the process of prepping
samples. I valued lab meetings with fellow graduate students and especially appreciated
discussions with Jen Marsh, Andrew Eller, Ashwin Sreenivasan, and Wes Strasburger.
Also, thanks to Gabrielle Hazelton and Louisa Hayes at UAF-SFOS for all the
administrative support that they have provided over the years. Funding was provided by
the Cooperative State Research, Education and Extension Service, U.S. Department of
Agriculture. I would also like to thank my colleagues at NOAA-ABL for supporting me
during the writing stage of this project.
I truly would not have been able to achieve this goal without the unfaltering
support and patience of my wife, Ellen Andrews. I am extremely grateful (and indebted)
to my parents Alex and Joanne Andrews for supporting me during this endeavor; they
have always believed in me and my abilities.

1
General Introduction
In 2005 at the onset of this project, total biomass estimates of spiny dogfish
(Squalus acanthias) in the Gulf of Alaska (GOA) based on the 2003 National Marine
Fisheries Service trawl survey data peaked at an all-time high of 99,000 metric tons (mt).
After declining in 2005, biomass estimates in 2007 again increased to a new peak of
162,000 mt (Tribuzio et al. 2009). Although surrounded by a large degree of uncertainty,
these biomass estimates still generated interest in the commercial harvest of this species
in the GOA. In addition, many fishing communities in the GOA voiced concerns about
increasing catches of spiny dogfish and the potential impact this species might exert on
fish species targeted by the sport and commercial fisheries. Yet, little was known about
spiny dogfish in the waters of the GOA. Most of the biological information available on
this species was collected from outside the GOA from studies in British Columbia,
Washington, or even farther away in the Atlantic Ocean (Bonham 1954; Jones and Geen
1977; Bowman et al. 1984). Consequently, it was apparent that a better understanding of
this species in the GOA was needed to address questions about potential commercial
harvest or predatory impact of spiny dogfish in the GOA.
Spiny dogfish are distributed throughout temperate and subarctic latitudes in the
Pacific and Atlantic oceans occurring at depths to 675 m (Castro 1983). Along the west
coast of North America, spiny dogfish range from Baja California to the Bering Sea, west
along the Aleutians to Russia, and south to Japan (Castro 1983). As generalist
opportunists, spiny dogfish predate upon a variety of prey items that include fishes,
mollusks, and crustaceans (Bonham 1954; Jones and Geen 1977; Tribuzio 2010). As

2
spiny dogfish grow and mature, they shift from diets of predominantly pelagic to more
demersal prey items (Beamish and Sweeting 2009), target larger prey items, and ingest
primarily fishes (Bowman et al. 1984; Alonso et al. 2002; Tribuzio 2010). These include
some of the key forage species in the North Pacific ecosystem, such as Pacific herring
(Clupea pallasii) and capelin (Mallotus villosus) that many piscivorous fishes, seabirds,
and marine mammals also depend upon (Jones and Geen 1977).
The life-history parameters of spiny dogfish likely influence the vulnerability of
this species to commercial fishing. They are slow growing, late maturing, and long lived
(McFarlane and Beamish 1987). In the GOA, the age and length at 50% maturity for
females (males) is 36 (21) years and 97 (75) cm (total length extended), respectively
(Tribuzio 2010). In British Columbia, maximum ages are in excess of 80 years
(McFarlane and Beamish 1987). Spiny dogfish also have a low fecundity (1-15 pups) and
a 22-24 month gestation period (Holden 1977; Tribuzio 2004). Management must
carefully consider these life-history parameters to insure the sustainability of a potential
commercial fishery targeting this species.
Targeted fisheries for spiny dogfish have occurred in both the North Atlantic and
North Pacific Oceans. In the northwestern Atlantic Ocean, U.S. commercial catches
increased five-fold in the late eighties and early nineties (Rago et al. 1998), peaking at
27,000 mt in 1996 (NMFS 2001). In 1998, this fishery was declared over-fished and a
fishery management plan that reduced catch limits was adopted in early 2000 (ASMFC
2002). Early in the 20th century, development of fisheries on the west coast of North
America was driven primarily by the need for spiny dogfish liver oil, which was used in a

3
variety of applications, including machine oil, illumination, and tanning (Castro 1983).
By World War II, intense fisheries along the west coast targeted spiny dogfish for
vitamin A found in their liver. By the late 1940s, these fisheries declined due to reduced
numbers of spiny dogfish, importation of vitamin A, and the production of synthetic
vitamin A (Castro 1983; Ketchen 1986). In the mid-1970s, west coast fisheries began
again harvesting spiny dogfish for food for export to Europe (Ketchen 1986). At present,
spiny dogfish fisheries in British Columbia and Washington continue, although there is
evidence that some of the stocks targeted in Washington’s inland marine waters have
declined (Palsson 2009).
Alaska has no directed fisheries for spiny dogfish, however, this species can be
retained as bycatch in both state and federally managed waters. An exception to this is the
availability of an Alaska Department of Fish and Game Commissioner’s Permit for the
Cook Inlet region, which allows a small-scale targeted spiny dogfish fishery; however, to
date, this has not attracted much interest. In federal waters of the GOA, spiny dogfish are
managed as part of the combined shark complex that includes Pacific sleeper sharks
(Somniosus pacificus), salmon sharks (Lamna ditropis), and spiny dogfish. On average,
spiny dogfish comprise 53% of the total shark catch (Tribuzio et al. 2010). Decreases or
increases in the abundance and biomass of one or several species can upset the balance in
the ecosystem and may lead to a re-structuring of ecological communities (Fogarty and
Murawski 1998; Frank et al. 2005). Understanding catches of predators, such as sharks,
are particularly important as their abundance can influence the GOA ecosystem through
top-down processes (Myers et al. 2007). Clearly, there is a need to improve our

4
understanding of the biology of spiny dogfish in the GOA before a targeted fishery may
be implemented; research into the life-history of spiny dogfish should include, but not be
limited to, the trophic role of these sharks in the northeastern Pacific Ocean.
Nitrogen (δ15N) and carbon (δ13C) stable isotope ratios have been used as a tool to
describe food-web linkages, trophic status, and source of primary production (DeNiro
and Epstein 1978; DeNiro and Epstein 1981; Rau et al. 1992). It is possible to construct
food-webs and determine trophic status using the enrichment properties of 15N, as there is
typically an enrichment between prey and consumer of 3.4 ± 1.1‰ (Minagawa and Wada
1984). Also, planktonic phytoplankton is depleted in 13C relative to benthic sources and
therefore, δ13C can be used to distinguish between different sources of primary
productivity at the base of the food-web (France 1995). Sources of primary productivity
provide the initial δ15N values that are propagated up the food chain; therefore, it is
important to understand how δ15N values vary at the base of the food chain and to
determine an isotopic baseline (Cabana and Rasmussen 1996; Post 2002). This is
especially important when a study encompasses a large geographic area. Trophic roles of
elasmobranchs are often explored using TP based on gut content analysis (Cortes 1999);
however, a number of studies have established that nitrogen stable isotope analysis is a
useful tool in determining the TP of elasmobranchs as a reliable alternative method to gut
content analysis (Rau et al. 1983; Fisk et al. 2002; Estrada et al. 2003; MacNeil et al.
2005).

5
Potential changes in spiny dogfish biomass and the relative lack of biological
information specific to the GOA provided the impetus for this thesis and a companion
study (Tribuzio 2010). In addition, findings of a panel exploring ecosystem-based
management practices have provided specific data requirements needed for improving
fishery management. These recommendations included developing a conceptual model of
the food-web at each life-history stage over time and describing how removals will affect
the trophic structure (NMFS 1999). The findings demonstrate the necessity of studies that
explore the trophic role of marine species of a range of size classes. In Chapter 1, I focus
on assessing the large-scale geographical variation in TP of spiny dogfish in the
northeastern Pacific Ocean. In an effort to limit the variables affecting the results, this
initial work focused on a narrow size range of mostly males from several sites in
Washington, British Columbia, and the eastern Gulf of Alaska. In Chapter 2, I broadened
my sampling to include a large size range of both males and females from sampling sites
ranging from Kodiak Island to British Columbia. Specifically, my objectives for this
chapter were (1) to examine the effects of length and sex on the TP of spiny dogfish and
(2) to assess large-scale geographical differences in TP of spiny dogfish in the Alaskan
waters of the GOA. My results demonstrate the importance of size-based ontogenetic
changes in TP of spiny dogfish in the northeastern Pacific Ocean.
References
Alonso, M. K., E. A. Crespo, N. A. Garcia, S. N. Pedraza, P. A. Mariotti, and N. J. Mora.
2002. Fishery and ontogenetic driven changes in the diet of the spiny dogfish,

6
Squalus acanthias, in Patagonian waters, Argentina. Environmental Biology of
Fishes 63(2):193-202.
ASMFC (Atlantic States Marine Fisheries Commission). 2002. Interstate fishery
management plan for spiny dogfish. Atlantic States Marine Fisheries
Commission. Washington, DC.
Beamish, R. J., and R. M. Sweeting. 2009. Spiny dogfish in the pelagic waters of the
Strait of Georgia and Puget Sound. Pages 101-118 in V. F. Gallucci, G. A.
McFarlane, and G. G. Bargmann, editors. Biology and management of dogfish
sharks. American Fisheries Society, Bethesda, Maryland.
Bonham, K. 1954. Food of the dogfish Squalus acanthias. Fisheries Research Papers
1(2):25-36.
Bowman, R., R. Eppi, and M. Grosslein. 1984. Diet and consumption of spiny dogfish in
the Northwest Atlantic. ICES C.M.1984/G:27, Copenhagen, Denmark.
Cabana, G., and J. B. Rasmussen. 1996. Comparison of aquatic food chains using
nitrogen isotopes. Proceedings of the National Academy of Sciences
93(20):10844-10847.
Castro, J. I. 1983. The sharks of North American waters. Texas A&M University Press,
College Station.
Cortes, E. 1999. Standardized diet compositions and trophic levels of sharks. ICES
Journal of Marine Science 56(5):707-717.
DeNiro, M. J., and S. Epstein. 1978. Influence of diet on the distribution of carbon
isotopes in animals. Geochimica et Cosmochimica Acta 42:495-506.
7
DeNiro, M. J., and S. Epstein. 1981. Influence of diet on the distribution of nitrogen
isotopes in animals. Geochimica et Cosmochimica Acta 45(3):341-351.
Estrada, J. A., A. N. Rice, M. E. Lutcavage, and G. B. Skomal. 2003. Predicting trophic
position in sharks of the north-west Atlantic Ocean using stable isotope analysis.
Journal of the Marine Biological Association of the United Kingdom 83(6):1347-
1350.
Fisk, A. T., S. A. Tittlemier, J. L. Pranschke, and R. J. Norstrom. 2002. Using
anthropogenic contaminants and stable isotopes to assess the feeding ecology of
Greenland sharks. Ecology 83(8):2162-2172.
Fogarty, M. J., and S. A. Murawski. 1998. Large-scale disturbance and the structure of
marine systems: Fishery impacts on Georges Bank. Ecological Applications 8(1,
supplement):S6-S22.
France, R. L. 1995. Carbon-13 enrichment in benthic compared to planktonic algae:
foodweb implications. Marine Ecology Progress Series 124(1-3):307-312.
Frank, K. T., B. Petrie, J. S. Choi, and W. C. Leggett. 2005. Trophic cascades in a
formerly cod-dominated ecosystem. Science 308:1621-1623.
Holden, M. J. 1977. Elasmobranchs. Pages 187-215 in A. Gulland, editor. Fish
population dynamics. J. Wiley and Sons, New York.
Jones, B. C., and G. H. Geen. 1977. Food and feeding of spiny dogfish (Squalus
acanthias) in British Columbia waters. Journal of the Fisheries Research Board of
Canada 34(11):2067-2078.
8
Ketchen, K. S. 1986. The spiny dogfish (Squalus acanthias) in the Northeast Pacific and
a history of its utilization. Canadian Special Publication of Fisheries and Aquatic
Sciences 88:78 p. Ottawa
MacNeil, M. A., G. B. Skomal, and A. T. Fisk. 2005. Stable isotopes from multiple
tissues reveal diet switching in sharks. Marine Ecology Progress Series 302:199-
206.
McFarlane, G. A., and R. J. Beamish. 1987. Validation of the dorsal spine method of age
determination for spiny dogfish. Pages 287-300 in R. C. Summerfelt, and G. E.
Hall, editors. The Iowa State University Press, Ames.
Minagawa, M., and E. Wada. 1984. Stepwise enrichment of 15N along food chains:
further evidence and the relation between δ15N and animal age. Geochimica et
Cosmochimica Acta 48:1135-1140.
Myers, R. A., J. K. Baum, T. D. Shepherd, S. P. Powers, and C. H. Peterson. 2007.
Cascading effects of the loss of apex predatory sharks from a coastal ocean.
Science 315(5820):1846-1850.
NMFS (National Marine Fisheries Service). 1999. Ecosystem-based fishery management:
a report to Congress by the ecosystem principles advisory panel. National Marine
Fisheries Service, Washington DC.
NMFS (National Marine Fisheries Service). 2001. United States National Plan of Action
for the Conservation and Management of Sharks, Silver Spring, Maryland.

9
Palsson, W. A. 2009. The status of spiny dogfish in Puget Sound. Pages 53-65 in V. F.
Gallucci, G. A. McFarlane, and G. G. Bargmann, editors. Biology and
management of dogfish sharks. American Fisheries Society, Bethesda, Maryland.
Post, D. M. 2002. Using stable isotopes to estimate trophic position: models, methods,
and assumptions. Ecology 83(3):703-718.
Rago, P. J., K. A. Sosebee, J. K. T. Brodziak, S. A. Murawski, and E. D. Anderson. 1998.
Implications of recent increases in catches on the dynamics of Northwest Atlantic
spiny dogfish (Squalus acanthias). Fisheries Research 39:165-181.
Rau, G. H., D. G. Ainley, J. L. Bengtson, J. J. Torres, and T. L. Hopkins. 1992. 15N/14N
and 13C/12C in Weddell Sea birds, seals, and fish: implications for diet and trophic
structure. Marine Ecology Progress Series 84:1-8.
Rau, G. H., and coauthors. 1983. Animal 13C/12C correlates with trophic level in pelagic
food webs. Ecology 64(5):1314-1318.
Tribuzio, C. A. 2004. An investigation of the reproductive physiology of two North
Pacific shark species: spiny dogfish (Squalus acanthias) and salmon shark
(Lamna ditropis). Master's thesis. University of Washington, Seattle.
Tribuzio, C. A. 2010. Life history, demography, and ecology of the spiny dogfish
(Squalus acanthias) in the Gulf of Alaska. Doctoral dissertation. University of
Alaska Fairbanks, Fairbanks.
Tribuzio, C. A., K. Echave, C. Rodgveller, J. Heifetz, and K. Goldman. 2010. Gulf of
Alaska Stock Assessment and Fishery Evaluation Report. North Pacific Fishery
Management Council, Seattle, Washington.

10
Tribuzio, C. A., C. Rodgveller, J. Heifetz, and K. Goldman. 2009. Gulf of Alaska Stock
Assessment and Fishery Evaluation Report. North Pacific Fishery Management
Council, Seattle, Washington.

11
Chapter 1
Geographical variation in the carbon and nitrogen stable isotope ratios in spiny dogfish in
the northeastern Pacific Ocean1
1.1 Abstract
Spiny dogfish Squalus acanthias biomass has increased in the Gulf of Alaska, yet
little is known about the ecological niche that dogfish fill in this ecosystem. Trophic
position is an important indicator of the ecological role of an organism. To explore the
trophic position of dogfish, we analyzed the nitrogen and carbon stable isotope ratios of
60 dogfish from five locations between Washington and the Gulf of Alaska. The mean
δ15N values for dogfish ranged from 12.0‰ (central Gulf of Alaska) to 13.4‰ (Howe
Sound, British Columbia) and the mean δ13C values ranged from –21.3‰ (Yakutat Bay,
Alaska) to –17.9‰ (Puget Sound, Washington). Sites to the north tended to be
significantly depleted in the heavy isotopes of both nitrogen and carbon. The differences
in nitrogen isotope ratios among sites were attributed to potential changes in dogfish
feeding behavior and trophic position. Differences in carbon isotope ratios suggested that
dogfish utilize different food-webs along the northeastern Pacific Ocean shelf.
Additionally, it was hypothesized that feeding differentially in offshore versus inshore
food-webs or targeting pelagic versus benthic prey species may explain the isotopic 1Andrews, A. G. III and R. J. Foy. 2009. Geographical variation in the carbon and nitrogen stable isotope ratios in spiny dogfish in the northeastern Pacific Ocean. Pages 269-276 in V. F. Gallucci, G. A. McFarlane, and G. G. Bargmann, editors. Biology and management of dogfish sharks. American Fisheries Society, Bethesda, Maryland.

12
variability. These results are preliminary and require additional tests before conclusions
can be made about the trophic position of dogfish in this region. Future work will explore
stable isotope variability at lower trophic levels to test the hypothesis that entire food-
webs are isotopically shifted owing to differences in isotopic fractionation at the base of
the food-web. Also, trophic level differences among dogfish size classes and between
sexes will be explored among a greater diversity of locations to better describe the
ecological consequences of increased biomass of dogfish in the northeastern Pacific
Ocean.

13
1.2 Introduction
Spiny dogfish Squalus acanthias have been one of the most abundant and
economically important species of shark in North American waters (Castro 1983).
Dogfish are distributed throughout temperate and subarctic latitudes in the Pacific and
Atlantic Oceans occurring at depths to 1,244 m (Castro 1983; Mecklenburg et al. 2002).
Fisheries catches in British Columbia suggest that a greater proportion of dogfish occur at
20 m in the summer and 100 m in the winter (Ketchen 1986). Along the west coast of
North America, dogfish range from Baja California to the Bering Sea, west along the
Aleutians to Russia, and south to Japan (Castro 1983).
Shark populations throughout the world have received a great deal of attention
because of their relative trophic position and the effects of fishing on population biomass
(Kitchell et al. 2002). In the Gulf of Alaska (GOA), spiny dogfish biomass estimates are
variable and have shown an increasing trend in recent years. Biomass estimates from
groundfish surveys have ranged from 19,000 to 162,000 metric tons (mt) between 1990
and 2007 (Courtney et al. 2006; Conrath and Foy 2009). The incidental catch in
commercial fisheries over a similar period from 1997 to 2006 was variable yet increased
substantially from 117 mt in 2002 to 1,324 mt in 2006. Estimates of abundance from
stock-assessment models based on incidental catch were also variable and much higher
than estimates based only on survey or catch per unit effort (CPUE) (Rice et al. 2009).
The apparent increasing biomass trend and the spike in incidental catch have led to
interest by some commercial groups in developing dogfish fisheries in Alaska.
While increasing numbers of spiny dogfish may suggest a targeted fishery could

14
be viable, the vulnerability of sharks to overfishing (Walker 1998; Musick et al. 2000)
makes it imperative that managers proceed with caution. Dogfish are slow growing, late
maturing, and long lived (McFarlane and Beamish 1987). In British Columbia, the age
and length at 50% maturity for females is 35.5 years and 93.9 cm (total length extended)
(Saunders and McFarlane 1993) and maximum ages are in excess of 80 years (McFarlane
and Beamish 1987). Dogfish have a low fecundity (1–15 pups) and a 22–24 month
gestation period (Holden 1977; Tribuzio et al. 2009). Management should carefully
consider these life-history characteristics along with the ecological role of dogfish to
ensure sustainability of potential fisheries and appropriate conservation of the species.
To better understand the effects of increased spiny dogfish biomass on the North
Pacific ecosystem, studies should be focused on the ecological niche that dogfish fill.
Specifically, little is known about the trophic role of dogfish in the northeastern Pacific
Ocean. In many marine systems, sharks are considered top predators (Hinman 1998;
Cortés 1999) that have an important role in structuring the community (Frank et al.
2005). During the 1970s, 1980s, and 1990s off the coast of New England, the Georges
Bank fish community changed significantly from a gadid and flatfish dominated system
to a system dominated by skates and small sharks, including dogfish (Fogarty and
Murawski 1998; Collie and DeLong 1999). In the 1990s, increasing dogfish fisheries and
their subsequent collapse contributed to additional ecosystem level reorganizations of the
marine community occupying the Georges Bank. Although sharks are an important
consumer and considered to be a top predator in marine food-webs, the trophic position
of many sharks is unknown (Cortés 1999).

15
Spiny dogfish are opportunistic feeders that consume a wide range of prey items
that include: small schooling fishes, hake, cod, flatfishes, juvenile salmon, crabs, shrimp,
euphausiids, jellyfish, ctenophores, octopus, and squid (Bonham 1954; Jones and Geen
1977). Independent studies in the Atlantic and Pacific oceans have indicated that diet
compositions are dependent on the availability of different prey (Jones and Geen 1977;
Bowman et al. 1984; Alonso et al. 2002). Furthermore, diet shifts have been correlated
with ontogenetic changes. In British Columbia, larger dogfish had a greater proportion of
fishes in their diet and tended to feed more demersally than smaller dogfish (Jones and
Geen 1977). Seasonal variation in the diet and the diversity of prey items consumed
(Jones and Geen 1977) suggest that increased spiny dogfish biomass and subsequent total
consumption by dogfish might impact numerous northeastern Pacific species.
Effective management of spiny dogfish and their commercially important prey
will require ontogenetic and spatially specific data on their diet and trophic position.
Trophic levels of sharks have been calculated by combining diet analyses with published
data on the trophic level of each prey category (Cortés 1999). Alternatively, stable
isotope analysis has been used to predict the trophic level of sharks including blue shark
Prionace glauca, shortfin mako Isurus oxyrinchus, thresher shark Alopias vulpinus,
basking shark Cetorhinus maximus (Rau et al. 1983; Estrada et al. 2003), Greenland
shark Somniosus microcephalus (Fisk et al. 2002), and spiny dogfish (Fry 1988).
Estimation of shark trophic level based on stable isotope values was not different from
direct observations of stomach contents (Estrada et al. 2003). Stable isotope analyses
integrate feeding patterns over longer periods and are thus more appropriate for trophic
16
level assessment than other methods (Polunin and Pinnegar 2000). This suggests that
stable isotope analysis is appropriate to quantify the diet and trophic position of dogfish
(also see Hazlett et al. 2009).
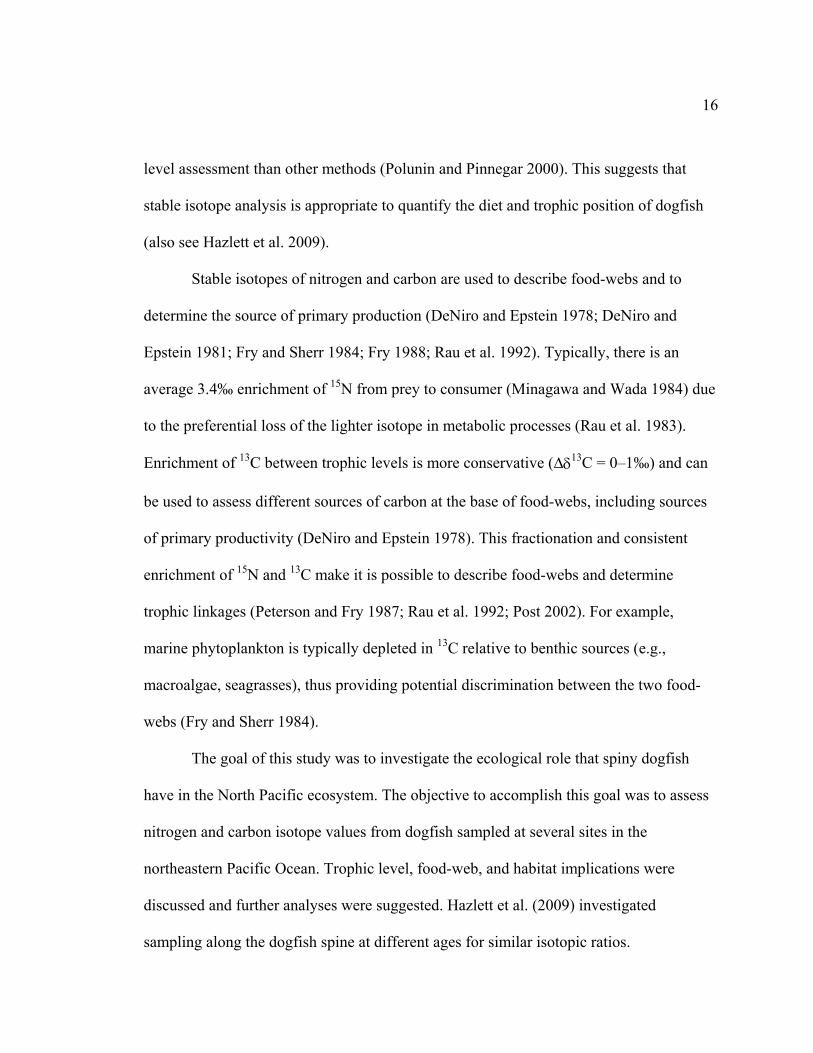
Stable isotopes of nitrogen and carbon are used to describe food-webs and to
determine the source of primary production (DeNiro and Epstein 1978; DeNiro and
Epstein 1981; Fry and Sherr 1984; Fry 1988; Rau et al. 1992). Typically, there is an
average 3.4‰ enrichment of 15N from prey to consumer (Minagawa and Wada 1984) due
to the preferential loss of the lighter isotope in metabolic processes (Rau et al. 1983).
Enrichment of 13C between trophic levels is more conservative (∆δ13C = 0–1‰) and can
be used to assess different sources of carbon at the base of food-webs, including sources
of primary productivity (DeNiro and Epstein 1978). This fractionation and consistent
enrichment of 15N and 13C make it is possible to describe food-webs and determine
trophic linkages (Peterson and Fry 1987; Rau et al. 1992; Post 2002). For example,
marine phytoplankton is typically depleted in 13C relative to benthic sources (e.g.,
macroalgae, seagrasses), thus providing potential discrimination between the two food-
webs (Fry and Sherr 1984).
The goal of this study was to investigate the ecological role that spiny dogfish
have in the North Pacific ecosystem. The objective to accomplish this goal was to assess
nitrogen and carbon isotope values from dogfish sampled at several sites in the
northeastern Pacific Ocean. Trophic level, food-web, and habitat implications were
discussed and further analyses were suggested. Hazlett et al. (2009) investigated
sampling along the dogfish spine at different ages for similar isotopic ratios.
17
1.3 Methods
Spiny dogfish were opportunistically collected in June, July, and August 2005
from five distinct sites in the northeastern Pacific Ocean: Puget Sound, Washington;
Howe Sound, British Columbia; Dixon Entrance, Alaska; Yakutat Bay, Alaska; and
central GOA (Figure 1.1). Ten males of similar size (overall range: 72–87 cm) were
collected from each region using either baited longlines or trawls. In addition, ten females
from the same size range were collected from Yakutat Bay, Alaska.
The second dorsal spine with attached dorsal muscle tissue was removed from
each individual, frozen (0°C) in plastic bags, and transported to laboratory facilities for
further processing. In the laboratory, samples were partially thawed at ambient
temperature and a clean piece of white muscle tissue was excised from an area near the
base of the spine. Tissue samples were placed in glass vials, freeze dried for 24 h, and
homogenized.
Stable nitrogen and carbon isotopes were analyzed at the Alaska Stable Isotope
Facility, University of Alaska Fairbanks. Samples were processed in a Costech ECS4010
elemental analyzer (EA) that is interfaced through a CONFLO III to a Finnigan
DeltaplusXP isotope ratio mass spectrometer. All samples were run in duplicate. Each
sample was weighed (0.2–0.4-mg subsamples) and placed in a tin capsule. Based on
replicates of peptone, analytical errors were 0.15‰ and 0.13‰ for δ15N and δ13C,
respectively. Results are presented in delta (δ) notation calculated using the following
formula:

18
δX‰ = [(Rsample – Rstandard)/(Rstandard)] • 1,000,
where R is ratio of the heavy isotope to the light isotope (e.g., 15N/14N, and 13C/12C) for a
given element. Recognized standards of Vienna-PeeDee Belemnite (VPDB) for carbon
and atmospheric air (AIR) for nitrogen were used for comparison with sample ratios.
Means and standard deviations of δ15N and δ13C were calculated for males from
each of the regions and for males and females from Yakutat Bay. Statistical differences
between males and females from Yakutat Bay were assessed with a t-test. Statistical
differences among stations were assessed with an analysis of variance (ANOVA)
followed by posthoc Tukey tests for equal sample sizes.
1.4 Results/Discussion
1.4.1 Isotopic differences between sexes in Yakutat Bay
No significant differences were found for δ15N and δ13C values between female
and male spiny dogfish collected from Yakutat Bay (δ15N: t = 0.99, P = 0.333; δ13C: t =
0.91, P = 0.353). Mean δ15N values were 12.1‰ and 12.4‰ for females and males,
respectively (Figure 1.2a). Mean values for δ13C were –21.5‰ for females and –21.3‰
for males (Figure 1.2b). In contrast, diets of mature male and female spiny dogfish off the
coast of Argentina were significantly different based on the specific overlap index
(Alonso et al. 2002). In that study, mature females had higher numbers of squid in their
diet. Since spiny dogfish are known to form schools that are segregated by size and sex
(Ketchen 1986), future work in the northeastern Pacific Ocean will explore the variation
between males and females across a range of size classes.

19
1.4.2 Isotopic differences among sites
Mean δ15N values for spiny dogfish ranged from 12.0‰ (central GOA) to 13.4‰
(Howe Sound, British Columbia) and were significantly different among sites (Table 1.1 ;
F = 10.72, P < 0.001). Specifically, δ15N values for spiny dogfish from the central GOA
and Yakutat Bay were significantly lower than from Dixon Entrance, Howe Sound, or
Puget Sound (Figure 1.3). Mean δ13C values ranged from –21.3‰ (Yakutat Bay, Alaska)
to –17.9‰ (Puget Sound, Washington) and were also significantly different among sites
(Table 1.1 ; F = 24.05, P < 0.001). Values of δ13C from the central GOA were not
significantly different than those for Yakutat Bay, Dixon Entrance, or Howe Sound.
However, δ13C of Yakutat Bay samples were significantly lower than values from all
sites south of Yakutat Bay. Mean δ13C of dogfish from Dixon Entrance and Howe Sound
were not significantly different. Values of δ13C from Puget Sound, Washington, were
significantly higher than from all other sites, possibly indicating that the pelagic system
has less of an influence on these fish (Figure 1.3).
Isotopic values of spiny dogfish on the Georges Bank in the Atlantic Ocean were
lower than in this study; mean (SD) δ15N values were 11.2 (0.8‰) and mean (SD) δ13C
values were –17.4 (0.6‰) (Fry 1988). In the Celtic Sea, isotopic values of dogfish
(length: 60–66 cm; n = 6) were similar to those on the Georges Bank; mean (SD) δ15N
values were 11.6 (0.6‰) and mean (SD) δ13C values were –17.0 (0.4‰) (Domi et al.
2005). The lower N and C isotopic values in Atlantic dogfish might suggest that they
occupy a lower trophic level and different feeding niche than spiny dogfish in the north

20
Pacific. However, the Celtic Sea dogfish were smaller than those in this study so
differences may be related to ontogenetic changes in feeding behavior. Also, differences
between upper trophic levels from these two ecosystems may reflect differences in
fractionation during primary production at the base of the food-web (France 1995;
Cabana and Rasmussen 1996; Post 2002).
1.4.3 Trophic level and diet implications
Differences in δ15N among sites suggested that spiny dogfish occupy different
trophic positions in the northeastern Alaska region than further south along the Alaskan
and Canadian coast. On average, a δ15N increase of 3.4‰ occurs between a predator and
consumer and represents a single trophic level (Minagawa and Wada 1984). The largest
difference in mean δ15N observed in this study was 1.4‰ between Central GOA and
British Columbia. This difference could indicate that dogfish have a different role and fill
different feeding niches in the ecosystem at these sites. In addition, interannual
differences in δ15N of 2.7‰ have been observed in annuli of dogfish spines (Hazlett et al.
2009). Their results indicate that individual dogfish display temporal variability in trophic
positions. These findings coupled with our results provide further evidence that dogfish
are capable of taking advantage of different prey sources and of occupying different
habitats throughout their lifespan. These changes may be correlated to growth and
ontogeny.
Differences in δ13C among sites suggested that spiny dogfish diets can be
categorized based on three regions: the northeastern Alaska region, central region of the

21
northeastern Pacific, and Washington. Puget Sound, Washington, samples had the most
enriched values of all the sites, suggesting an even more unique diet for dogfish from this
site.
1.4.4 Food-web and habitat implications
Variability in carbon and nitrogen isotopic ratios may indicate differences in
production and initial nitrogen and carbon fixing during primary production among the
study sites. Baseline isotope values of δ15N and δ13C indicate the variability at the base of
the food-web and can vary between distinct ecological systems (Cabana and Rasmussen
1996; Post 2002). Patterns of variation for δ15N and δ13C values found in zooplankton
collected from the Bering, Chukchi, and Beaufort seas were linked to variability in the
growth rates of primary producers (Schell et al. 1998). Enriched δ13C have also been
correlated with faster growth rates in diatoms (Fry 1991).
Variability in both the nitrogen and carbon stable isotopes indicated that spiny
dogfish are feeding in different food-webs and in potentially different habitats over the
spatial range of this study. Depleted amounts of 13C in the Yakutat and central GOA
dogfish may indicate participation in a more pelagic food-web based on phytoplankton at
the base of the food-web, whereas enriched 13C in the dogfish from southern sites may
indicate that a higher proportion of prey originates from benthic communities. Marine
benthic algae isotopes tends to be more enriched than isotopes of marine phytoplankton
and benthic food-webs tend to have more trophic links (McConnaughey and McRoy
1979; France 1995).
Differences in the type of food-web used by spiny dogfish may be correlated to

22
the difference between inshore and offshore habitats. The Yakutat samples, and to a
greater extent the Central GOA samples, may represent a population of dogfish that
predominantly feed on pelagic prey items and are strongly tied to the phytoplankton-
based food-web typical of offshore systems. The potential increased use of benthic food-
webs in the southern sites may be indicative of feeding closer to shore in shallower
waters. Specifically, the samples from Puget Sound, Washington, were more enriched
than any other site, indicating a unique food-web. Interestingly, the isotopic values from
dogfish in Howe Sound do not indicate the same change to a benthic food-web. Possible
foraging in inshore and offshore waters by the shortfin mako shark in the Northwest
Atlantic Ocean led to a large range of δ15N (12.2–15.2‰) and δ13C values (–17.1 to –
15.9‰) (Estrada et al. 2003).
To account for variation at the base of the food-web that can propagate up the
food-web and lead to variation at higher trophic levels, indicator species are often used in
studies with high spatial extent. Bivalve mollusks, including mussels and scallops, have
been used successfully in both freshwater and marine systems to measure the variation in
δ13C and δ15N at the base of the food-web (Cabana and Rasmussen 1996; Vander Zanden
et al. 1997; Vander Zanden and Rasmussen 1999; Post 2002; Jennings and Warr 2003;
Howard et al. 2005). Future studies to assess the spatial variability in the trophic structure
of spiny dogfish in the northeastern Pacific Ocean will incorporate analyses of
weathervane scallops Patinopecten caurinus to gain insight into possible baseline
isotopic variation among ecosystems. Weathervane scallops are a widely available
primary consumer whose distribution overlaps with dogfish in the northeastern Pacific

23
Ocean.
1.4.5 Spatial gradients in other ecosystems
Spatial gradients of species-specific isotopic values exist over large distances in
other ecosystems similar to those investigated in this study. Higher δ13C values were
found at lower latitudes in the Southern Ocean in seabirds and their prey (Quillfeldt et al.
2005). Isotope ratios (δ13C) of Neocalanus cristatus copepods are enriched by 4‰ in
Prince William Sound (PWS) compared to the GOA (Kline 1996). Gradients of δ13C in
particulate organic matter (0.5–3.5‰), zooplankton (3.1–3.7‰), and larvae fish (4.3‰)
were found between continental shelf and slope/deep ocean waters that were within 40–
45 km of each other off the coast of Vancouver Island (Perry et al. 1999). Therefore,
similar processes are likely to drive δ13C and δ15N variability over large spatial areas and
may lend insight into the latitudinal differences found in this study of spiny dogfish from
the northeastern Pacific Ocean.
1.5 Conclusion
This study provides a preliminary assessment of the diet and trophic position of
spiny dogfish in the northeastern Pacific Ocean. The significant range of nitrogen and
carbon stable isotope values provides evidence that dogfish are occupying different
trophic positions and potentially different habitats in this region. These data may indicate
that dogfish range from a more pelagic, lower trophic position in the GOA and Yakutat to
having a greater reliance on benthically derived prey of a higher trophic position in the
more southern and, in some cases, enclosed habitats of Dixon Entrance, Howe Sound,

24
and Puget Sound. Diet studies have shown that dogfish are opportunists that prey on
seasonally abundant prey (Jones and Geen 1977). This opportunistic feeding behavior
coupled with the results of this study suggest that dogfish may be capable of filling a
wide range of feeding niches as their population increases. However, further data are
needed on baseline isotope values from each ecosystem and food-web to accurately
assess trophic position.
Finally, it is not known whether the spiny dogfish population in the North Pacific
is increasing due to actual population increases or to a distributional shift from southern
latitudes. Evidence for some migration potential in the British Columbia dogfish
population exists (McFarlane and King 2003). Further research into the trophic role of
spiny dogfish should continue to explore geographic variation, size-class, and sex
comparisons, and baseline variation. Understanding the geographic variation of the
trophic position of an organism could play an increasingly important role in developing
ecosystem-modeling approaches to fisheries management. Spatially explicit data on
trophic position will provide necessary data for the complex food-web models necessary
to adequately assess the fluctuations in dogfish-stock size and potential commercial
fishery interactions.

25
1.6 Acknowledgments
We thank M. Wooller for his insight into stable isotope analyses and for sharing
his breadth of knowledge of the ecological applications of these techniques. We thank C.
Tribuzio for graciously sharing samples and data collected for her doctorate work on
spiny dogfish at the University of Alaska Fairbanks and to G. Kruse for his support. G.
Bargmann, D. Courtney, V. Gallucci, J. King, and N. Vega assisted with sample
collections. J. Marsh and J. Nash contributed to discussions on methods and objectives.
We also thank N. Haubenstock and T. Howe at the Alaska Stable Isotope Facility for
their assistance and expertise processing samples. Funding was provided by the
Cooperative State Research, Education and Extension Service, U.S. Department of
Agriculture.

26
Figure 1.1. Sampling locations in Puget Sound (Washington); Howe Bay (British
Columbia, Canada); and Gulf of Alaska, Yakutat Bay, and Dixon Entrance (Alaska).

27
Figure 1.2. Mean (SE) δ13C values and δ15N values for male and female spiny dogfish
Squalus acanthias collected from Yakutat Bay, Alaska, during 2005.

28
Figure 1.3. Mean (SE) d15N versus d13C values of male spiny dogfish collected from
five locations sampled during 2005 in the northeastern Pacific Ocean.

29
Table 1.1. Mean (SD) of stable isotope ratios (δ15N and δ13C) of spiny dogfish collected
during 2005 from five different sites in the northeastern Pacific Ocean.
Site N Sex Month
collected Length
range (cm) Mean (SD) δ15N (‰)
Mean (SD) δ13C (‰)
Central Gulf of Alaska (GOA) 10 male Aug 72.2 - 86.0 11.98 (0.58) -20.75 (0.70) Yakutat Bay, Alaska 10 male June 74.5 - 87.0 12.41 (0.68) -21.27 (0.57) Yakutat Bay, Alaska 10 female June 74.5 - 86.0 12.13 (0.55) -21.48 (0.42) Dixon Entrance 10 male July 78.0 - 83.5 13.38 (0.60) -19.77 (0.89) Howe Sound, British Columbia 10 male Aug 77.6 - 82.4 13.42 (0.37) -20.21 (0.62) Puget Sound, Washington 10 male June 71.0 - 86.7 13.32 (0.86) -17.93 (1.19)

30
1.7 References
Alonso, M. K., E. A. Crespo, N. A. Garcia, S. N. Pedraza, P. A. Mariotti, and N. J. Mora.
2002. Fishery and ontogenetic driven changes in the diet of the spiny dogfish,
Squalus acanthias, in Patagonian waters, Argentina. Environmental Biology of
Fishes 63(2):193–202.
Bonham, K. 1954. Food of the dogfish Squalus acanthias. Fisheries Research Papers
1(2):25–36.
Bowman, R., R. Eppi, and M. Grosslein. 1984. Diet and consumption of spiny dogfish in
the Northwest Atlantic. ICES C. M.1984/G:27, Copenhagen, Denmark.
Cabana, G., and J. B. Rasmussen. 1996. Comparison of aquatic food chains using
nitrogen isotopes. Proceedings of the National Academy of Sciences, USA
93(20):10844–10847.
Castro, J. I. 1983. The sharks of North American waters. Texas A&M University Press,
College Station.
Collie, J. S., and A. K. DeLong. 1999. Multispecies interactions in the Georges Bank fish
community. Pages 187–210 in Ecosystem approaches for fisheries management.
Proceedings of the 1998 Wakefield Fisheries Symposium: Ecosystem
Considerations in Fisheries Management. University of Alaska, Alaska Sea Grant
Publication AK-SG-99–01, Fairbanks.
Conrath, C. L., and R. J. Foy. 2009. A history of the distribution and abundance of spiny
dogfish in Alaskan waters. Pages 119–126 in V. F. Gallucci, G. A. McFarlane,
and G. G. Bargmann, editors. Biology and management of dogfish sharks.

31
American Fisheries Society, Bethesda, Maryland.
Cortés, E. 1999. Standardized diet compositions and trophic levels of sharks. ICES
Journal of Marine Science 56(5):707–717.
Courtney, D. L., C. A. Tribuzio, K. J. Goldman, and J. S. Rice. 2006. GOA Sharks. Pages
481–562 in North Pacific Groundfish Stock Assessment and Fishery Evaluation
Report. North Pacific Fishery Management Council (NPFMC), Anchorage,
Alaska.
DeNiro, M. J., and S. Epstein. 1978. Influence of diet on the distribution of carbon
isotopes in animals. Geochimica et Cosmochimica Acta 42:495–506.
DeNiro, M. J., and S. Epstein. 1981. Influence of diet on the distribution of nitrogen
isotopes in animals. Geochimica et Cosmochimica Acta 45(3):341–351.
Domi, N., J. M. Bouquegneau, and K. Das. 2005. Feeding ecology of five commercial
shark species of the Celtic Sea through stable isotope and trace metal analysis.
Marine Environmental Research 60(5):551–569.
Estrada, J. A., A. N. Rice, M. E. Lutcavage, and G. B. Skomal. 2003. Predicting trophic
position in sharks of the north-west Atlantic Ocean using stable isotope analysis.
Journal of the Marine Biological Association of the United Kingdom 83(6):1347–
1350.
Fisk, A. T., S. A. Tittlemier, J. L. Pranschke, and R. J. Norstrom. 2002. Using
anthropogenic contaminants and stable isotopes to assess the feeding ecology of
Greenland sharks. Ecology 83(8):2162–2172.
Fogarty, M. J., and S. A. Murawski. 1998. Large-scale disturbance and the structure of

32
marine systems: fishery impacts on Georges Bank. Ecological Applications 8(1,
supplement):S6–S22.
France, R. L. 1995. Carbon-13 enrichment in benthic compared to planktonic algae: food
web implications. Marine Ecology Progress Series 124(1–3):307–312.
Frank, K. T., B. Petrie, J. S. Choi, and W. C. Leggett. 2005. Trophic cascades in a
formerly cod-dominated ecosystem. Science 308:1621–1623.
Fry, B. 1988. Food web structure on Georges Bank from stable C, N, and S isotopic
compositions. Limnology and Oceanography 33(5):1182–1190.
Fry, B., and S. C. Wainright. 1991. Diatom sources of 13C-rich carbon in marine food
webs. Marine Ecology Progress Series 76(2):149-157.
Fry, B., and E. B. Sherr. 1984. δ13C measurements as indicators of carbon flow in marine
and freshwater ecosystems. Contributions in Marine Science 27:13–47.
Hazlett, S., N. Misarti, A. G. Andrews, G. A. McFarlane, and M. J. Wooller. 2009. Stable
isotopic variability along spiny dogfish spines: implications for retrospective
ecological studies. Pages 259–267 in V. F. Gallucci, G. A. McFarlane, and G. G.
Bargmann, editors. Biology and management of dogfish sharks. American
Fisheries Society, Bethesda, Maryland.
Hinman, K. 1998. Ocean roulette: conserving swordfish, sharks and other threatened
pelagic fish in longline-infested waters. National Coalition for Marine
Conservation, Leesburg, Virginia.
Holden, M. J. 1977. Elasmobranchs. Pages 187–215 in A. Gulland, editor. Fish
population dynamics. J. Wiley and Sons, New York.

33
Howard, J. K., K. M. Cuffey, and M. Solomon. 2005. Toward using Margaritifera
falcata as an indicator of base level nitrogen and carbon isotope ratios: insights
from two California coast range rivers. Hydrobiologia 541(1):229–236.
Jennings, S., and K. J. Warr. 2003. Environmental correlates of large-scale spatial
variation in the δ15N of marine animals. Marine Biology 142(6):1131–1140.
Jones, B. C., and G. H. Geen. 1977. Food and feeding of spiny dogfish (Squalus
acanthias) in British Columbia waters. Journal of the Fisheries Research Board of
Canada 34(11):2067–2078.
Ketchen, K. S., 1986. The spiny dogfish (Squalus acanthias) in the Northeast Pacific and
a history of its utilization. Canadian Special Publication of Fisheries and Aquatic
Sciences 88:78 p. Ottawa.
Kitchell, J. F., T. E. Essington, C. H. Boggs, D. E. Schindler, and C. J. Walters. 2002.
The role of sharks and longline fisheries in a pelagic ecosystem of the Central
Pacific. Ecosystems 5:202–216.
Kline, T. C., Jr. 1997. Confirming forage fish food web dependencies in Prince William
Sound using natural stable isotope tracers. In Forage fishes in marine ecosystems.
Proceedings of the International Symposium on the Role of Forage Fishes in
Marine Ecosystems. University of Alaska, Alaska Sea Grant Publication AK-SG-
97-01, Fairbanks.
McConnaughey, T., and C. P. McRoy. 1979. Food-web structure and the fractionation of
carbon isotopes in the Bering Sea. Marine Biology 53(3):257–262.
McFarlane, G. A., and R. J. Beamish. 1987. Validation of the dorsal spine method of age

34
determination for spiny dogfish. Pages 287–300 in R. C. Summerfelt and G. E.
Hall, editors. The age and growth of fish. The Iowa State University Press, Ames.
McFarlane, G. A., and J. R. King. 2003. Migration patterns of spiny dogfish (Squalus
acanthias) in the North Pacific Ocean. Fisheries Bulletin 101:358–367.
Mecklenburg, C. W., T. A. Mecklenburg, and L. K. Thorsteinson. 2002. Fishes of
Alaska. American Fisheries Society, Bethesda, Maryland.
Minagawa, M., and E. Wada. 1984. Stepwise enrichment of 15N along food chains:
further evidence and the relation between delta 15N and animal age. Geochimica
et Cosmochimica Acta 48:1135–1140.
Musick, J. A., G. Burgess, G. Cailliet, M. Camhi, and S. Fordham. 2000. Management of
sharks and their relatives (Elasmobranchii). Fisheries 25(3):9–13.
Perry, R. I., P. A. Thompson, D. L. Mackas, P. J. Harrison, and D. R. Yelland. 1999.
Stable carbon isotopes as pelagic food web tracers in adjacent shelf and slope
regions off British Columbia, Canada. Canadian Journal of Fisheries and Aquatic
Sciences. 56:2477–2486.
Peterson, B. J., and B. Fry. 1987. Stable isotopes in ecosystem studies. Annual Review of
Ecology and Systematics 18:293–320.
Polunin N. V. C., Pinnegar J. K. 2000. Trophic level dynamics inferred from stable
isotopes of carbon and nitrogen. Pages 69–73 in Fishing down the Mediterranean
food webs? The Mediterranean Science Commission (CIESM), CIESM
Workshop Series 12, Kerkyra, Greece.
Post, D. M. 2002. Using stable isotopes to estimate trophic position: models, methods,

35
and assumptions. Ecology 83(3):703–718.
Quillfeldt, P., R. A. R. McGill, and R. W. Furness. 2005. Diet and foraging areas of
Southern Ocean seabirds and their prey inferred from stable isotopes: review and
case study of Wilson’s storm-petrel. Marine Ecology Progress Series 295:295–
304.
Rau, G. H., D. G. Ainley, J. L. Bengtson, J. J. Torres, and T. L. Hopkins. 1992. 15N/14N
and 13C/12C in Weddell Sea birds, seals, and fish: implications for diet and trophic
structure. Marine Ecology Progress Series 84:1–8.
Rau, G. H., A. J. Mearns, D. R. Young, R. J. Olson, H. A. Schafer, and I. R. Kaplan.
1983. Animal 13C/12C correlates with trophic level in pelagic food webs. Ecology
64(5):1314–1318.
Rice, J. S., V. F. Gallucci, and G. H. Kruse. 2009. Evaluation of the precision of age
estimates for spiny dogfish. Pages 161–168 in V. F. Gallucci, G. A. McFarlane,
and G. G. Bargmann, editors. Biology and management of dogfish sharks.
American Fisheries Society, Bethesda, Maryland.
Saunders, M. W., and G. A. McFarlane. 1993. Age and length at maturity of the female
spiny dogfish, Squalus acanthias, in the Strait of Georgia, British Columbia,
Canada. Environmental Biology of Fishes 38:49–57.
Schell, D. M., B. A. Barnett, and K. A. Vinette. 1998. Carbon and nitrogen isotope ratios
in zooplankton of the Bering, Chukchi and Beaufort seas. Marine Ecology
Progress Series 162:11–23.
Tribuzio, C. A., V. F. Gallucci, and G. G. Bargmann. 2009.Reproductive biology and

36
management implications for spiny dogfish in Puget Sound, Washington. Pages
181–194 in V. F. Gallucci, G. A. McFarlane, and G. G. Bargmann, editors.
Biology and management of dogfish sharks. American Fisheries Society,
Bethesda, Maryland.
Vander Zanden, M. J., G. Cabana, and J. B. Rasmussen. 1997. Comparing trophic
position of freshwater fish calculated using stable nitrogen isotope ratios (δ15N)
and literature dietary data. Canadian Journal of Fisheries and Aquatic Sciences
54(5):1142–1158.
Vander Zanden, M. J., and J. B. Rasmussen. 1999. Primary consumer δ13C and δ15N and
the trophic position of aquatic consumers. Ecology 80(4):1395–1404.
Walker, T. I. 1998. Can shark resources be harvested sustainably? A question revisited
with a review of shark fisheries. Marine and Freshwater Resources 49:553–72.

37
Chapter 2
Ontogenetic and spatial variation in the trophic position of spiny dogfish, Squalus
acanthias, in the northeastern Pacific Ocean2
2.1 Abstract
Spiny dogfish Squalus acanthias are one of the most abundant shark species in
the Gulf of Alaska (GOA) and are captured as bycatch in commercial and recreational
fisheries. During the last decade, evidence of increasing numbers spurred interest in
developing a commercial fishery on this species in the GOA. However, because very
little is known about the ecology and abundance of this species in Alaskan waters and the
trophic position (TP) of spiny dogfish is poorly understood, the effects of the removal of
spiny dogfish biomass on the North Pacific Ocean ecosystem are unknown. This study
investigated the feeding ecology of spiny dogfish in the GOA using stable isotope
analysis of carbon and nitrogen to examine TP in relation to length, sex, and geographic
region. Samples were collected from the GOA (n=410) to the inside waters of
southwestern British Columbia (BC, n=81). Weathervane scallops Patinopecten caurinus
were used as a stable isotopic baseline for estimation of TP of spiny dogfish in the GOA.
Values of δ15N from spiny dogfish of length 52 to 113 cm (total length extended) ranged
from a minimum of 10.8‰ (Yakutat and northeastern GOA (NEGOA)) to a maximum of
15.6‰ (Kodiak), while δ13C values ranged from -23.1‰ (Yakutat) to -16.3‰ (BC). Both
2 Andrews, A. G. III, N. Hillgruber, R. J. Foy, G. H. Kruse, and M. J. Wooller. Transactions of the American Fisheries Society. To be submitted.

38
δ15N and δ13C were linearly related to length at most sites. However, to account for
variation in lipid content in the muscle, we normalized lipids for δ13C; lipids are depleted
in δ13C. Lipid-normalized δ13C’values ranged from -21.2‰ (Yakutat and NEGOA) to -
16.8‰ (BC) and were not linearly related to length. In the GOA, where spiny dogfish
TPs were adjusted for spatial variability in a baseline organism, TP ranged from 3.3 to
over 4.1. Kodiak had the highest TPs in the GOA for spiny dogfish of a given length. In
contrast, the lowest TPs were observed at sites in the eastern GOA. Our results improve
our understanding of ontogenetic dietary changes, specifically how size-specific dietary
patterns influence the role of spiny dogfish in the North Pacific ecosystem.

39
2.2 Introduction
The spiny dogfish Squalus acanthias is a circumglobal shark species that occurs
in the temperate and subarctic waters of the Pacific and Atlantic Ocean (Castro 1983).
This species inhabits waters from the surface to 675 m (Castro 1983; C. A. Tribuzio,
NOAA, personal communication). Along the west coast of North America, spiny dogfish
range from Baja California to the Bering Sea, west along the Aleutians to Russia, and
south to Japan (Castro 1983). Spiny dogfish have been one of the most abundant and
economically important shark species in North American waters (Castro 1983). Despite
life-history characteristics, such as longevity, low natural mortality, and late maturity,
that predispose this species to overfishing (Saunders and McFarlane 1993; King and
McFarlane 2003), targeted fisheries for spiny dogfish have occurred in both the North
Atlantic and North Pacific Oceans; in Alaska, regulations have been approved for a
small-scale targeted fishery in Cook Inlet and a bycatch fishery in Yakutat. However,
interest in commercial exploitation has remained low.
Spiny dogfish biomass estimates based on bottom trawl surveys in the GOA
indicate an increasing trend from 1990 until 2007 (Courtney et al. 2006; Tribuzio et al.
2009), stemming increasing interest in a targeted commercial spiny dogfish fishery.
However, biomass estimates for spiny dogfish in 2009 were the lowest since 1987
(Tribuzio et al. 2009), adding uncertainty as about the veracity of an increase in spiny
dogfish abundance. These unpredictable changes or uncertainties in spiny dogfish
biomass estimates clearly demonstrate the need for a better understanding of the ecology
and life-history of this species. Not only is it important to understand the effects of a

40
large spiny dogfish biomass in the GOA, but it is important to understand the
concomitant effects on the ecosystem that commercial fishing could have due to a
reduction of biomass. Little is known about the ecology of spiny dogfish in the GOA
ecosystem; only one study examined dietary patterns and trophic linkages of spiny
dogfish in the GOA (Tribuzio 2010). However, because of the trophic connectivity
between different species inhabiting a given ecosystem, some studies indicate that
reduction in the abundance and biomass of one or several species can dramatically upset
the balance in the ecosystem and lead to a re-structuring of ecological communities
(Fogarty and Murawski 1998; Frank et al. 2005). Other studies however, have concluded
that a reduction in predator abundance may not significantly benefit the prey (Stevens et
al. 2000). In light of changes in spiny dogfish biomass in the GOA, a better
understanding of the size-specific trophic role of this species is essential not only to better
describe dynamics and functions of the GOA ecosystems but also to assess potential
consequences for the GOA ecosystems as a result of fishery removals of this important
predator.
Spiny dogfish are omnivorous opportunists that consume a wide range of prey
items, including fishes, mollusks, and crustaceans (Bonham 1954; Jones and Geen 1977;
Bowman et al. 1984; Ebert et al. 1992; Laptikhovsky et al. 2001; Tribuzio 2010). Prey
composition in spiny dogfish may be a function of size and vary with season, prey
abundance, and geographical region (Bowman et al. 1984; Alonso et al. 2002; Tribuzio
2010). Spiny dogfish, particularly at larger sizes, are important piscivorous predators in
the ecosystem; e.g., in British Columbian waters, forage fishes, such as Pacific herring

41
Clupea pallasii, eulachon Thaleichthys pacificus, and capelin Mallotus villosus made up
more than half of the prey items ingested by spiny dogfish (Jones and Green 1977). The
seasonal variation in their diet composition and the opportunistic nature of this species
suggests that increased spiny dogfish biomass might significantly impact the food-web of
the northeast Pacific Ocean. Trophic linkages of an organism can be examined with
different techniques, such as gut content or stable isotope analysis. With a few exceptions
(Hazlett et al. 2008; Andrews and Foy 2009) in the North Pacific Ocean, trophic studies
on spiny dogfish have relied on gut content analysis. Gut content analysis is valuable in
describing recent feeding patterns, but unless diets are collected throughout the year, may
not be optimal for assessing the ecological role of a species that may switch its diet
frequently, such as the spiny dogfish.
Stable nitrogen (δ15N) and carbon isotope (δ13C) ratios are another tool that can
be used to describe food-web linkages and to determine the source of primary production
(DeNiro and Epstein 1978; DeNiro and Epstein 1981; Fry and Sherr 1984; Fry 1988; Rau
et al. 1992). Typically, there is an enrichment of the heavy isotope 15N from prey to
consumer of approximately 3.4 ± 1.1 ‰ (Minagawa and Wada 1984). Using the
enrichment properties of 15N, it is possible to construct food-webs and determine trophic
linkages (Peterson and Fry 1987; Rau et al. 1992). In contrast to stable nitrogen isotope
ratios, δ13C can be used to distinguish between different sources of primary productivity
at the base of the food-web. Typically, marine planktonic phytoplankton is depleted in
13C relative to benthic sources in large part due to the boundary effect which restricts the
diffusion of CO2 creating a limiting step for benthic algae (e.g., macroalgae) (Fry and

42
Sherr 1984; France 1995). Therefore, δ13C values are useful in differentiating habitat use
of consumers during ontogenetic movements or seasonal migrations.
Isotopic values of primary producers may vary by geographic area or season and
these variations can lead to variation in isotopic values of higher consumers (Hobson and
Welch 1992; Cabana and Rasmussen 1996; Hoekstra et al. 2002). Therefore, isotopic
values of consumers alone are misleading and need to be adjusted for baseline isotopic
variation among sites and ecosystems to provide a more accurate estimate of an
organism’s absolute trophic position (TP)(Post 2002; Jennings and Warr 2003). Filter-
feeding bivalve mollusks, including mussels and scallops, have been used successfully in
freshwater and marine systems to measure the variation in δ13C and δ15N at the base of
the food-web (Cabana and Rasmussen 1996; Vander Zanden et al. 1997; Vander Zanden
and Rasmussen 1999; Post 2002; Jennings and Warr 2003; Howard et al. 2005).
Ecological roles of elasmobranchs are often explored using TP based on gut
content analysis (Cortes 1999; Ebert and Bizzarro 2007). However, a mounting number
of studies have established that nitrogen stable isotope analysis is a useful tool in
determining the TP of elasmobranchs as a reliable alternative method to gut content
analysis (e.g., blue shark Prionace glauca, shortfin mako Isurus oxyrinchus, thresher
shark Alopias vulpinus, basking shark Cetorhinus maximus, and Greenland shark
Somniosus microcephalus)(Rau et al. 1983; Fisk et al. 2002; Estrada et al. 2003;
MacNeill et al. 2005). Fisk et al. (2002) hypothesized that elasmobranch nitrogen stable
isotope values may lead to an underestimate of TP due to the presence of both urea and
trimethylamine oxide (TMAO) in the tissues; as waste products, the urea and TMAO

43
were thought to contain isotopically, lighter nitrogen (Fisk et al. 2002). Evidence from a
number of studies, however, suggests that the presence of nitrogenous wastes in
elasmobranchs has no effect on their stable isotope values and that an accurate TP can be
estimated based on their δ15N values (Estrada et al. 2003; Logan and Lutcavage 2010).
Stable isotope signatures vary with the body tissue type used for analysis (Tieszen
et al. 1983). Some tissues, such as liver, have a fast turnover rate of 30 d to 5 months
(MacNeil et al. 2006). Other tissues, such as muscle tissue, are replaced more slowly. As
a result, stable isotope signatures of muscle tissues in elasmobranchs, as with teleosts,
may represent an average of a diet assimilated in the previous year or longer (Hesslein et
al. 1993; MacNeil et al. 2006; Logan and Lutcavage 2010); thus, the use of muscle tissue
can indicate only long-term shifts, such as ontogenetic habitat changes. In contrast,
seasonal migrations can most likely not be resolved by using the stable isotope signatures
of muscle tissue.
The trophic role of spiny dogfish in the Atlantic and Pacific Oceans has been
studied using nitrogen and carbon stable isotopes (Fry 1988; Domi et al. 2005; Andrews
and Foy 2009; Hazlett et al. 2009; Logan and Lutcavage 2010). In these studies, however,
spiny dogfish were often only one of many fishes analyzed and sample sizes and length
ranges were generally small. In the Pacific Ocean, stable isotope values collected along
the length of spiny dogfish spines were examined providing evidence that spiny dogfish
may change their feeding and habitat use with ontogeny (Hazlett et al. 2009). In the
northeastern Pacific Ocean, differences in stable isotope values from wide ranging
geographical regions were observed, suggesting geographical differences in feeding

44
patterns (Andrews and Foy 2009); the isotopic baseline variability among these sites,
however, was unknown thus making it impossible to clearly assess the TP of these sharks
by area.
The environmental structure of the northeastern Pacific Ocean likely plays an
important role in the range of trophic linkages in the diverse food-webs. The northeastern
Pacific Ocean is dominated by a counterclockwise circulation, the subarctic gyre
(Weingartner 2007). The eastward flowing North Pacific Current bifurcates at a transition
zone near the coast of British Columbia and continues northward as the Alaska Current
and southward as the California Current (Stabeno et al. 2004). The shelf waters of the
GOA are heavily influenced by the Alaska Coastal Current, which is driven by the
predominant southerly winds and large input of freshwater. The Alaska Current is
transformed into the Alaska Stream along the Alaska Peninsula; while parts of the Alaska
Stream flows into the eastern Bering Sea, the majority of it continues southwesterly and
back-circulates into the subarctic gyre. The Alaska Coastal Current follows the coastline
of Alaska before being injected into the Bering Sea. The counterclockwise circulation of
the GOA gyre results in upwelling at the center of the gyre and downwelling along the
gyre margins (Weingartner 2007). In spite of the nearshore downwelling, the waters are
surprisingly productive due in part to across-shelf nutrient transport (Stabeno et al. 2004).
This productive system supports large abundances of economically important fish stocks
including Pacific salmon Oncorhynchus spp., walleye pollock Theragra chalcogramma,
Pacific cod Gadus macrocephalus, and Pacific halibut Hippoglossus stenolepis. Also, a
number of elasmobranch species which take advantage of these productive waters, such

45
as the salmon shark Lamna ditropis, the Pacific sleeper shark Somniosus pacificus, and
the spiny dogfish, are abundant in these waters.
The primary goal of this project was to describe patterns in the TP of male and
female spiny dogfish in the northeast Pacific Ocean, from British Columbia to Kodiak
Island, Alaska. Weathervane scallops Patinopecten caurinus were used to understand the
underlying isotopic baseline variability allowing for an adjustment of spiny dogfish TPs
between sites in the GOA. Specifically, our objectives for this study were (1) to examine
the effects of length and sex on the TP of spiny dogfish and (2) to assess large-scale
geographical differences in TP of spiny dogfish in the Alaskan waters of the GOA.
2.3 Materials and Methods
2.3.1 Sample collection
Spiny dogfish were collected in the northeastern Pacific Ocean off British
Columbia and Alaska using baited longlines, trawls, set nets, and sportfishing gear (i.e.,
rod and reel) during April to September 2004-2006 (Table 2.1; Figure 2.1). Sampling
closely followed a protocol approved by the University of Alaska Animal Care and Use
Committee (IACUC no’s 04-38 and 04-36). After capture, spiny dogfish were measured
for length (total length extended) to the nearest 0.1 cm and weight to the nearest 0.1 kg.
In addition, sex was determined and sampling depth was recorded for each specimen
(Table A-1).
For the isotope analysis, the second dorsal spine with attached white muscle tissue
was removed from each specimen. Spines with attached tissue were placed in plastic

46
bags, frozen at -20º C, and transported to laboratory facilities for additional processing. A
total of 491 spiny dogfish were analyzed for stable isotope ratios. The majority of
samples (n=451) were selected from 2005; however, in order to explore interannual
variation in stable isotope signatures, additional samples from one site (Yakutat) from
2004 (n=20) and from 2006 (n=19) were processed.
In this study, we used weathervane scallops, a bivalve ranging from California to
the southern Bering Sea (Foster 1991), to adjust for baseline isotopic variations. In 2005
and 2006, weathervane scallops were obtained from nine sites in the GOA (2005, n=1;
2006, n=8), ranging from Lituya Bay in the eastern GOA to the Shumagin Islands in the
western GOA, and from two sites in the southeastern Bering Sea (2005, n=1; 2006, n=1)
(Figure 2.2; Table 2.2; Table A-2). Immediately after capture, scallop adductor muscles
were placed in plastic bags and frozen at -20º C for further processing in the lab. At each
site, 10 scallops were analyzed for nitrogen and carbon stable isotopes. Weathervane
scallop data from the GOA were used to determine the isotopic baseline of nitrogen and
to explore interannual variation, while scallop data from the Bering Sea were used to
explore interannual variation at one site.
2.3.2 Sample processing and stable isotope analysis
Spiny dogfish samples were partially thawed and a small, clean piece of white
muscle tissue was excised from an area near the base of each spine and placed in a glass
vial. The spine was retained for aging as part of a companion study (Tribuzio 2010).
Tissue samples of spiny dogfish were refrozen prior to being freeze dried for

47
approximately 24 h. Freeze dried samples were pulverized in the glass vial using a quartz
rod to homogenize tissue.
Weathervane scallop samples were partially thawed, weighed, and a small, clean
piece of tissue was excised from the center of the adductor muscle and placed in a glass
vial. Similar to the shark tissue samples, scallop tissue samples were freeze dried for
approximately 24 h, after which they were pulverized to homogenize the tissue.
Stable nitrogen and carbon isotopes were analyzed at the Alaska Stable Isotope
Facility, University of Alaska Fairbanks. Samples were processed in a Costech ECS4010
elemental analyzer that was interfaced through a CONFLO III to a Finnigan DeltaplusXP
isotope ratio mass spectrometer. Of each sample, a subsample weighing 0.16-0.51 mg
was taken, weighed to the nearest 0.01 mg, and placed in a tin capsule. A portion of spiny
dogfish tissue (n=3) and scallop tissue samples (n=4) were run in replicates of five to
determine the quality of sample homogenization. Due to the low standard deviations (SD)
and coefficient of variations (CV), it was determined that running replicates on all
samples would not be necessary (spiny dogfish: SD < 0.25 and CV < 2.0 % for δ15N and
SD < 0.24 and CV < 1.2 % for δ13C; scallops: SD < 0.16 for δ15N and SD < 0.0.05 for
δ13C). The analytical precision was based on the SD of the replicates of the internal
standard peptone; SD < 0.18 for δ15N and SD < 0.17 for δ13C.
Results are presented in delta (δ) notation and calculated using the following
formula:

48
δX‰ = [(Rsample – Rstandard) / (Rstandard)] * 1,000, (1)
where X is the stable isotope of interest and R is the ratio of the heavy isotope to the light
isotope (e.g., 15N/14N or 13C/12C) for the given element. Recognized standards of
atmospheric air for nitrogen and Vienna-PeeDee Belemnite for carbon were used for
comparison with sample ratios.
2.3.3 Trophic position calculation
In this study, we used weathervane scallops, a primary consumer, to examine
patterns in baseline variation of isotopic values by geographic areas and year. The
following equation was used to adjust the isotopic values of spiny dogfish to account for
baseline variability:
Trophic Position (TP) = λ + (δ15Nhigher consumer – δ15Nbase) / Δn (2)
where:
λ = TP of the organism used to estimate δ15Nbase;
Δn = enrichment in δ15N per trophic level;
TPspiny dogfish = 2.5 + (δ15Nspiny dogfish – δ15Nscallop) / 3.4.
2.3.4 Lipid-normalization
Compared to proteins, lipids are depleted in 13C; as a result, the lipid content of a
given tissue can influence carbon stable isotope values of that tissue (DeNiro and Epstein

49
1977). Here, we used the C:N ratio as a proxy for lipid content to adjust for variable lipid
content of samples. The C:N ratio was calculated from the %C and %N of each
individual sample measured by the mass spectrometer. To correct δ13C values measured
in muscle tissues with varying amounts of lipids, a lipid-normalization based on the C:N
ratios was conducted (McConnaughey and McRoy 1979). For the lipid-normalization, the
following equations, which were developed and implemented by McConnaughey and
McRoy (1979) and validated by Kline et al. (1998), were used:
L = 93 / [1 + (0.246*C:N – 0.775)-1] (3)
δ13C’ = δ13C + D[-0.207 + 3.90 / (1 + 287 / L)], (4)
where:
δ13C’ = lipid-normalized δ13C;
L = calculated lipid;
D = 6‰ (isotopic difference between protein and lipid).
2.3.5 Statistical analysis
2.3.5.1 Weathervane scallops
Geographic variation in scallop nitrogen stable isotopes between the Bering Sea
and GOA was assessed using a Mann-Whitney test. For all tests, we confirmed that
assumptions for normality (Anderson-Darling test) and equal variances were met (F-test
or Bartlett’s test for equal variances). The GOA was separated into the National Marine
Fisheries Service (NMFS) regulatory areas of western GOA (WGOA), central GOA

50
(CGOA), and eastern GOA (EGOA). Interannual variation of δ15N was assessed in the
EGOA and the Bering Sea using either a Mann-Whitney test or a two sample t-test.
Samples were pooled in each NMFS regulatory area (i.e., EGOA, CGOA, and WGOA)
and overall differences were assessed with a one-way analysis of variance (ANOVA). If
significant differences were found, a post-hoc Tukey test was performed to determine
potential differences between sites. Mean δ15N values were calculated for each of the
NMFS regulatory areas if significant differences were found.
2.3.5.2 Spiny dogfish
Spiny dogfish samples were categorized into seven sites based on general location
of capture. The seven sites range that from Kodiak Island to British Columbia and
include: Kodiak, Cook Inlet, Prince William Sound (PWS), northeastern GOA
(NEGOA), Yakutat Bay (Yakutat), southeastern GOA (SEGOA), and British Columbia
(BC).
2.3.5.2.1 Interannual variation
Interannual variations of nitrogen and carbon stable isotopes in spiny dogfish
were explored by examining samples collected in three years (2004 (n=20), 2005 (n=87),
and 2006 (n=19)) at the Yakutat site. Analysis of covariance (ANCOVA) was used to
explore differences in δ15N among years. Length was used as a covariate based on the
linear relationship between δ15N and length. First, the model included an interaction term.
If the interaction term was not significant, then the analysis was repeated excluding the
interaction term to explore for differences in δ15N among years. Due to the lack of a

51
linear relationship between δ13C’ and length an ANCOVA was not necessary and
therefore an ANOVA was used to explore differences in δ13C’ among years.
2.3.5.2.2 Linear relationship between δ15N and δ13C and length
The relationship between δ15N, δ13C, and δ13C’ (lipid-normalized) versus length
was explored at each site. Significance of the linear relationship was determined using the
p-values. The R2 values were used as an indicator of the goodness of fit and to assess the
influence of length on variations in δ15N, δ13C, and δ13C’.
2.3.5.2.3 Differences between sexes
Differences in δ15N between male and female spiny dogfish were assessed with an
ANCOVA at individual sites. Length was used as the covariate based on the linear
relationship between δ15N and length. Initially, an interaction term was included to
assess whether the slopes were constant. If the interaction term was not significant, then
the analysis was repeated excluding the interaction term to explore for differences in δ15N
among sexes. If no differences were determined between males and females, then all fish
were pooled for further analyses.
2.3.5.2.4 Differences among sites
The analysis of difference in δ15N among sites was confined to the GOA where
weathervane scallops were collected to provide an isotopic baseline correction.
Differences in δ15N among sites in the GOA were assessed with ANCOVA using length
as the covariate. Initially, an interaction term was included to assess whether the slopes
were constant. If the interaction term was not significant, then the analysis was repeated

52
excluding the interaction term to explore for differences in δ15N among sites. Multiple
comparisons were performed with a post-hoc Tukey test.
Differences in δ13C’ (lipid-normalized) among sites were assessed with a one-way
ANOVA. A post-hoc Tukey test was used to perform multiple comparisons among sites.
Results were considered statistically significant at a p-value of <0.05 for all statistical
analyses.
2.4 Results
2.4.1 Weathervane scallops
Weathervane scallop δ15N values differed significantly between the Bering Sea
and the GOA (Mann-Whitney test, W = 1992.0, p < 0.001). A non-parametric test was
used because the data were not normally distributed (Anderson-Darling test for
normality, A2 = 4.395, n = 110, p < 0.005). Consequently, interannual variation of
weathervane scallop δ15N values was explored separately for only those areas with
samples from multiple years, namely the Bering Sea and the EGOA for the years 2005
and 2006. For the Bering Sea, there was no significant difference in δ15N between 2005
and 2006 (independent samples t-test, t = -1.66, d.f. = 18, p = 0.115; Figure 2.3A); these
data were normally distributed (Anderson-Darling test for normality, A2 = 0.423, n = 20,
p = 0.289). For the EGOA, there was a significant difference in δ15N between 2005 and
2006 (Mann-Whitney test, W = 349.0, p = 0.023; Figure 2.3B); these data were normally
distributed but had unequal variances (Anderson-Darling test for normality, A2 = 0.327, n
= 50, p = 0.512; F-Test for equal variances, Test statistic = 0.08, p < 0.001). Despite the

53
differences in δ15N between 2005 and 2006, for the purposes of this study it was assumed
that in the GOA interannual variation was not a significant factor and these values
represented the isotopic baseline for all years that spiny dogfish were sampled in this
study, 2004 – 2006.
In the GOA, mean δ15N values of weathervane scallops ranged from 8.3‰ ± 0.1
(Mean ± SE; NW of Icy Bay) to 9.3‰ ± 0.1 (N of Lituya Bay (Table 2.2, Figure 2.4).
Within the NMFS regulatory areas, the assumption of equal variance was not met.
However, when sampling locations were pooled into the three regulatory areas, namely
the WGOA, the CGOA, and the EGOA, the assumption of equal variance was met and
there was no significant difference among sites (ANOVA F2,87 = 1.74, p = 0.182; Figure
2.5). Thus, a mean stable nitrogen value for the entire GOA (n=90) was calculated (mean
δ15N = 8.7 ± 0.1 ‰) and used as the baseline nitrogen isotopic value to adjust spiny
dogfish nitrogen values and calculate TP.
2.4.2 Spiny dogfish
2.4.2.1 Summary of δ15N and δ13C
A total of 186 males and 305 females were sampled, ranging in length from 61 to
96 cm and 52 to 113 cm, respectively. These length ranges bracket the size at 50%
maturity (75 cm for males; and 97 cm for females) found in the GOA (Tribuzio 2010);
therefore, our samples represent both immature and mature fish. Given that age at 50%
maturity is 21 and 36 years for males and females, respectively (Tribuzio 2010), our
samples also include a large range of ages that encompass several decades. Individual

54
spiny dogfish δ15N values ranged from a minimum of 10.8 ‰ (PWS, NEGOA, and
Yakutat) to a maximum of 15.6 ‰ (Kodiak), while δ13C values ranged from -23.1 ‰
(Yakutat) to -16.3 ‰ (BC). Lipid-normalized δ13C’values ranged from -21.2 ‰ (Yakutat
and NEGOA) to -16.8 ‰ (BC) (Table 2.1).
2.4.2.2 Interannual variation of δ15N and δ13C
The interannual variation of nitrogen stable isotopes was explored using samples
obtained from Yakutat in 2004 – 2006. There was no significant interaction between
length and year (interaction term F2,120 = 2.05, p = 0.133). After excluding the interaction
term, nitrogen stable isotope values did not differ significantly among years (ANCOVA
F2,122 = 2.00, p = 0.139). Similarly, sampling year also had no significant effect on lipid-
normalized carbon stable isotopes, δ13C’ values (ANOVA F 2,123 = 2.50, p =
0.086)(Figure 2.6).
2.4.2.3 Relationship between δ15N and δ13C and length
For spiny dogfish ranging in length from 52 to 113 cm (see Table 2.1 for length
ranges for a given site), both δ15N and δ13C were linearly related to length at most sites
(Figures 2.7 and 2.8). For δ15N, the regressions were significant for all sites except for
Cook Inlet and SEGOA; however, the p-value for Cook Inlet was nearly significant
(Table 2.3). The R2 values ranged from a low of 0.01 (SEGOA) to as high as 0.50
(Kodiak). While regressions for δ13C were significant at all sites (Table 2.3), results were
quite different for lipid-normalized δ13C’ values; none of the regressions at the other sites
were significant (Table 2.3, Figure 2.9).

55
2.4.2.4 δ15N differences between sexes
The following sites had no significant interaction between sex and length: Kodiak
(interaction term F1,82 = 0.17, p = 0.678), Cook Inlet (interaction term F1,28 = 0.38, p =
0.543), NEGOA (interaction term F1,41 = 1.74, p = 0.195), Yakutat (interaction term F1,122
= 1.86, p = 0.175), SEGOA (interaction term F1,72 = 1.29, p = 0.260), and BC (interaction
term F1,77 = 2.66, p = 0.107). After excluding the interaction term, the analysis was
repeated for these sites when length remained significant. Sex was found to not be a
significant factor at these sites: Kodiak F1,83 = 1.11, p = 0.294; and Yakutat F1,123 = 1.09,
p = 0.299. BC F1,78 = 0.05, p = 0.818 (Figure 2.10).
2.4.2.5 Isotopic differences among sites
Differences in δ15N values were compared among all those GOA sites, where
baseline data had been collected. Kodiak, PWS, NEGOA, and Yakutat had significant
linear relationships between δ15N and spiny dogfish length (Table 2.3). There was no
significant interaction between length and site; interaction term F3,294 = 2.44, p = 0.064.
When the analysis was repeated excluding the interaction term, δ15N was found to differ
significantly among sites (F3,297 = 17.53, p <0.001). A pairwise comparison determined
that PWS, NEGOA, and Yakutat were not significantly different from each other, but all
three were significantly lower than Kodiak.
Because there was no significant linear relationship between δ13C’ and length, we
explored differences among all sites using a one-way ANOVA. Lipid-normalized, δ13C’
differed significantly among sites (ANOVA F6,484 = 71.00, p < 0.001, Figure 2.11).
56
Overall, mean δ13C’ values from BC and SEGOA were more enriched than all other sites;
- 18.9 ± 0.1 ‰ and -19.4 ± 0.1 ‰ respectively (Mean ± SE). Yakutat, NEGOA, and PWS
were not significantly different from each other, and similarly, Kodiak and Cook Inlet
were not significantly different from each other (Table 2.4).
2.4.2.6 Adjusted trophic position
Based on the results of the ANCOVA, we determined that the best fitting
relationship between δ15N and length had a constant slope. The fitted values were used to
calculate a baseline adjusted TP. A value of 2.5 was used as the TP of weathervane
scallops as it is unlikely that scallops selectively feed entirely on phytoplankton, which
would give them a TP of 2.0. Instead it is more likely that, in addition to phytoplankton,
weathervane scallops will ingest particulate organic matter and small zooplankton. Spiny
dogfish ranging in length from 63 to 109 cm had a predicted TP that increased with
length, ranging from 3.5 to 4.2 in Kodiak. In Yakutat, TP increased from 3.3 to 4.1 for
spiny dogfish ranging in length from 61 to 113 cm. In summary, GOA spiny dogfish of a
given length had the highest TP in Kodiak, while those sharks collected in Yakutat,
NEGOA, and PWS had the lowest TP (Figure 2.12).
2.5 Discussion
This study demonstrated that there is a clear ontogenetic shift in spiny dogfish
diet. Body size of fishes is very important in fish trophodynamics (Peters 1983) and can
play a major role in how species interact within an ecosystem. Size-based ontogenetic
changes in diet have been well documented in a variety of fishes including
elasmobranchs (Lowe et al. 1996; Estrada et al. 2006; Ellis and Musick 2007; Menard et

57
al. 2007; Galvan et al. 2010; Nakazawa et al. 2010). In spite of the important and widely
known effect of size on diet, it is to date still largely ignored (Werner and Gilliam 1984).
At five of seven sites, spiny dogfish δ15N values were linearly related to length
supporting a positive association between TP and length. In the GOA, where spiny
dogfish TPs were adjusted for the baseline, TP ranged from 3.3 to over 4.1. Extrapolating
this relationship to the maximum size (130 cm; Ketchen 1972) of spiny dogfish, the TPs
of spiny dogfish can be expected to increase by over 1 TP from immature to large mature
fish. Therefore, it must be concluded that spiny dogfish are interacting with their
ecosystem in significantly different ways during their transition to maturity in the GOA.
The results of this study support findings from diet analyses that spiny dogfish
prey items are a function of size (Jones and Geen 1977; Bowman et al. 1984;
Laptikhovsky et al. 2001; Alonso et al. 2002; Tribuzio 2010). In the northwest Atlantic
Ocean, spiny dogfish appeared to switch to more abundant prey items and broadened
their diets to include a wide variety of fishes with increasing size (Bowman et al. 1984).
In the southern Atlantic Ocean, larger spiny dogfish were also found to consume larger
prey items, such as octopods Benthoctopus spp. and Enteroctopus megalocyathus and
hoki Macruronus magellanicus (Laptikhovsky et al. 2001). In Patagonian waters,
immature spiny dogfish had a higher occurrence of ctenophores while mature females
had ingested higher numbers of squid; a significant difference in the dorsal mantle length
of squid was also observed between immature and mature female spiny dogfish (Alonso
et al. 2002). In the Pacific Ocean, similar patterns have been observed where fishes
become an increasingly important diet item for larger spiny dogfish (Jones and Geen

58
1977). Our results support the findings of a recent study from the GOA that larger spiny
dogfish capitalized on larger prey and exhibited a diet of higher diversity, but that the
prey items themselves were also of a higher trophic level (Tribuzio 2010). These studies
were able to detect and document changes in the diet and more specifically the size of the
prey items with an increase in spiny dogfish size. Our results provide further insight that
spiny dogfish are not only expanding their diet to include larger prey items, but are
clearly accessing prey items that are of a higher trophic level with increasing size. With
increasing size, spiny dogfish in the GOA are significantly increasing their TP by
consuming prey of a higher TP. In the GOA, these prey items include forage fish species
such as Pacific herring and capelin, two forage fish species that are of importance to a
variety of piscivorous predators (Jones and Geen 1977; Tribuzio 2010).
Understanding differences in the trophic roles between sexes can provide further
insight into the trophic role of a species and the partition of resources (Box et al. 2010).
For example, male and female pearly razorfish Xyrichtys novacula in the Mediterranean
Sea differed in δ15N, possibly as a result of the larger more aggressive males (Box et al.
2010). In contrast, there was no difference between male and female piked spurdog
Squalus megalops, a congener of the spiny dogfish, off the Australian coast (Braccini et
al. 2005), while off the coast of Argentina differences in the diets were found among
immature, mature male, and immature female spiny dogfish (Alonso et al. 2002). Spiny
dogfish are known to form large schools segregated by size, sex, and maturity (Ketchen
1986); therefore, it is likely that males and females may be exposed to very different prey
fields. Tribuzio (2010) found shrimp to be an important prey item in males, more so than

59
females; however, these results may have been influenced by size differences, because
most sampled males tended to be smaller than females (Tribuzio 2010). In the current
study, we used an ANCOVA to explore differences between sexes. For a given length,
there was no significant difference in δ15N between male and female spiny dogfish at
Kodiak, Yakutat, and BC; these sites are considered to better represent the population
than the other sites, which may have been under-sampled and had a combination of poor
length distributions, skewed sex ratios, and low sample sizes, which may have led to an
interaction between sex and length. The combination of stable isotope analysis and a
statistical analysis that compensates for a wide range of lengths (i.e., ANCOVA) may
lessen the confusion describing diet differences in males and females found in other
studies. Our results lead us to conclude that in Alaskan waters of the GOA, male and
female spiny dogfish of similar length were feeding at the same TP.
Exploration of the differences in TP among sites was limited to the GOA where
we had weathervane scallop samples, which allowed us to determine the isotopic
baseline. Isotopic values of consumers alone may poorly represent the TP of the
organism. Adjusting for baseline isotopic variation among sites and ecosystems will
allow for better estimates of the “absolute” TP of an organism (Post 2002; Estrada et al.
2003; Jennings and Warr 2003). Our initial study found significant regional variation in
nitrogen stable isotopes among five sites ranging from Washington to the eastern GOA
(Andrews and Foy 2009). However, this earlier work lacked data on the variation of the
isotopic baseline among sites, thereby making it difficult to describe and discuss food-
web or dietary changes among sites (Post 2002).

60
Weathervane scallops were selected as a baseline organism to measure the
isotopic variability of primary production at the base of the food-web. Given that filter
feeding bivalves primarily consume phytoplankton, they are useful as natural collectors
of baseline nitrogen isotopic values. This and the spatial overlap between spiny dogfish
and weathervane scallops in the GOA allowed for an adjustment of the TP of spiny
dogfish and a comparison of spiny dogfish isotope values to be made across regions that
may have had different isotopic baseline values (Vander Zanden et al. 1997; Vander
Zanden and Rasmussen 1999; Jennings and Warr 2003). In the Bering Sea, the
interannual variation was not a significant factor for samples collected opportunistically
from 2005 and 2006. In the EGOA we also collected scallop samples in 2005 and 2006,
and determined that there was a significant difference in δ15N between years in this area
and that the samples had unequal variances. However, our sampling design was
somewhat flawed. Due to the difficulty obtaining samples from 2005, we were limited to
comparing 2005 samples from a single site to 2006 samples from four sites. Given that
the mean value of the single site from 2005 fell in the middle of the surrounding 2006
sites, for the purposes of this study we chose to make the assumption that our 2006
isotopic baseline data was representative of the 2005 isotopic baseline and therefore
could be used to adjust our spiny dogfish isotopic values.
Overall, we found weathervane scallops δ15N values to be relatively stable in the
WGOA and CGOA, while in the EGOA they were more variable both in mean values
and the sample variances among sites. This may be due to the influence of large inputs of
freshwater and silt from the many glacial inlets along the coastline of the EGOA. In

61
general, the sampling depths in the EGOA were shallower than the sites in CGOA and
WGOA. On Georges Bank in the northwestern Atlantic Ocean, scallop δ13C values
increased with decreasing depth, while δ15N values showed no relationship to depth;
however, in the same study, differences in δ15N values of up to 1 ‰ were observed at a
single site and this degree of variability was considered acceptable based on studies of
animals feeding on similar diets in a laboratory setting (Fry 1988). However, there are
important life-history characteristics of spiny dogfish that lead us to pooling the
weathervane scallop into larger NMFS regulatory areas where unequal variance was no
longer of statistical significance. Spiny dogfish are known to migrate several hundred
nautical miles or more within a year, with rarer movements occurring between North
America and Japan (Ketchen 1986; McFarlane and King 2003). In addition, recent
evidence describes the turnover rate in muscle tissue of sharks to be greater than one year
(Logan and Lutcavage 2010). Given the slow turnover rates in muscle tissue and the fact
that this species is highly mobile and capable of travelling large distances within a year,
we considered it necessary and appropriate to pool our isotopic baseline data into the
relatively large NMFS regulatory areas. In the GOA, we found no difference in the
isotopic baseline among WGOA, CGOA, and EGOA. Therefore, differences among sites
for spiny dogfish δ15N are assumed to represent actual differences in prey types and food-
webs.
It has been well documented that spiny dogfish switch prey to take advantage of
high abundances of a certain prey items (Bonham 1954; Beamish et al. 1992). Therefore,
62
one would expect to find regional differences in TP if one region has more abundant prey
or if one region is comprised of different food-webs. Alternately, food chain length in
different habitats can lead to differences in TP. The food-web of the continental shelf
ecosystem of the northwestern Atlantic Ocean was found to contain a high number of
links, possibly leading to higher δ15N values found in small shortfin mako shark Isurus
oxyrinchus frequenting inshore habitats (Link 2002; Estrada et al. 2003). Also,
McConnaughey and McRoy (1979) hypothesized that the benthic food chain is likely to
be longer due to the inclusion of bacteria and meiofauna; presumably, an omnivorous
opportunist like the spiny dogfish would take advantage of benthic organisms to higher
degree while nearshore than when offshore.
In the GOA, our Kodiak site had higher TPs for a given size than NEGOA, PWS,
and Yakutat. As turnover rates are very slow in shark muscle (Logan and Lutcavage
2010), this may indicate a shift in prey items or feeding behavior that persists long
enough to alter the stable isotope signatures. Spiny dogfish in the waters surrounding
Kodiak Island may be capitalizing on abundant prey items found there or may have a
longer residence time in nearshore waters. Based on carbon stable isotope ratios from
marine planktonic and marine benthic sources found in the literature, the spiny dogfish
sampled in this study display values that straddle these values possibly indicating that
spiny dogfish are benefitting from both sources (France 1995). Our lipid-normalized
δ13C’ values provide some evidence that spiny dogfish from Kodiak may utilize
nearshore or benthic habitats slightly more intensively than those from PWS, NEGOA,
and Yakutat. The wider continental shelf surrounding Kodiak versus a much narrower
63
shelf off the NEGOA may provide a partial explanation. Furthermore, NEGOA, PWS,
and Yakutat did not have significantly different TP to length relationships, nor did the
δ13C’ values differ significantly among these sites. These results suggest that spiny
dogfish in this EGOA statistical area are feeding at the same TP and are likely
participating in very similar food-webs. It is important to note that several studies have
found a latitudinal versus δ13C effect, where δ13C is less enriched at higher latitudes
(Quillfeldt et al. 2005; Menard et al. 2007). However, our data are more complicated than
these previous studies and includes a larger range of both pelagic and benthic habitats.
Spiny dogfish δ13C’ values were not linearly related to length (Table 2.3). The
lack of a linear relationship of the lipid-normalized carbon isotope values to length
provides evidence that there is not a significant habitat shift with ontogeny for spiny
dogfish over the length range sampled. It has been noted, though, that our dataset did not
include spiny dogfish pups or very young immatures, for which an ontogenetic habitat
shift would have been expected because dogfish are thought to feed more pelagically as
juveniles and become more demersal as adults (Jones and Geen 1977; Beamish and
Sweeting 2009). Diet studies in British Columbia documented that the prey of younger
spiny dogfish were primarily pelagic, while adults depended on pelagic prey to a lesser
degree and become increasingly demersal (Jones and Geen 1977).
Stable isotope analysis can be useful in revealing ontogenetic diet changes over
large temporal scales on the order of years to decades. Several studies have explored
isotopic turnover rates in teleost fishes and elasmobranchs, demonstrating that it is
unlikely that seasonal changes in diet can be revealed with stable isotopic analysis of

64
muscle tissue (Hesslein et al. 1993; MacNeil et al. 2005; MacNeil et al. 2006; Logan and
Lutcavage 2010). As some of these studies conclude, it would be beneficial to perform
stable isotope analysis on multiple tissues to elucidate seasonal diet changes (MacNeil et
al. 2005; Logan and Lutcavage 2010). Muscle tissue can only reveal short-term diet
changes in small, fast-growing fishes, such as larval and juvenile stages; in red drum
Sciaenops ocellatus larvae, for example, a shift in diet was observed in δ15N within 1-2
days and a complete turnover was accomplished in only 10 days (Herzka and Holt 2000).
The lack of spiny dogfish pups and early immature stages in this study made it unlikely
that we would observe any short-term diet changes. In Yakutat, we analyzed spiny
dogfish from 2004-2006 and found no indication of diet change on an annual scale. These
findings indicate that, at least over 2004 - 2006, there was no large-scale shift in the diets
or feeding ecology of spiny dogfish in the Yakutat region. Regime shifts have been
described by others by using changes in species composition and biomass (Anderson and
Piatt 1999; Mueter and Norcross 2000). Stable isotope analysis could be developed as
another technique for monitoring and documenting regime shifts. Furthermore, stable
isotope analysis could prove to be an important tool in quantifying the effects of climate
change on fishes and other marine organisms.
The need for understanding size-specific dietary needs and TP becomes more
important with the increased interest in ecosystem-based fishery management (Marasco
et al. 2007). Ecosystem models, such as Ecosim and Ecopath, can be improved with
additional knowledge of the trophic role of different life-history stages of a species
(Pauly et al. 2000). One study used ecosystem models to compare three large marine

65
ecosystems (i.e., Bering Sea, GOA, and Aleutian Islands), but used only a single TP of
4.3 for spiny dogfish potentially generating misleading results (Aydin et al. 2007). Based
on our results, a TP of 4.3 would only represent the largest females in the population,
which are typically more rare (Tribuzio et al. 2009). Stable isotope analysis can provide
size-specific information on TPs for any number of species, and may provide more
accurate TPs that are based on integrated diets over many months to a year.
Our estimates of spiny dogfish TP include a lower range of TPs than what were
found in a concurrent diet study that examined spiny dogfish of similar lengths (Tribuzio
2010). Diet studies that are unable to collect specimens year round may be missing
seasonally occurring prey items or prey items that are quickly digested and may therefore
bias the TP estimate of the predator. Spiny dogfish, for example, are known to consume
ctenophores, which break down quickly and are hard to preserve in stomach samples
(Jones and Geen 1977). In the GOA, gelatinous prey items that are not observed in
stomach samples and prey items of a lower TP may make up more of the diet of spiny
dogfish in the under-sampled winter months and could be influencing the TPs calculated
from stable isotopes. In a study using stable isotope analysis in the Celtic Sea in the
northeast Atlantic Ocean, a TP of 3.4 was calculated for spiny dogfish of approximately
63 cm length (Pinnegar et al. 2002). In Yakutat, these results closely align with our
results based, namely on a predicted TPs of 3.3 and 3.4 for spiny dogfish of 61 cm and 66
cm lengths, respectively. Another study using stable isotope analysis determined that
spiny dogfish on the Georges Bank had stable nitrogen isotope values within the range of
our values, although, they tended to be on the lower end of our ranges (Fry 1988). The

66
lengths of the spiny dogfish were not published, therefore, it is difficult to draw
conclusions from this comparison.
On a final note, spiny dogfish biomass will continue to fluctuate in the
northeastern Pacific Ocean, but it is unknown whether future physical and biological
changes in the GOA ecosystem would support a long-term increase in the population of
spiny dogfish. Studies focused on the effects of climate change and fisheries predict that
fish distributions will move toward higher latitudes (Perry et al. 2005). The Pacific
Decadal Oscillation (PDO) index has varied between positive and negative anomalies and
most recently has been negative, although it was positive during the high abundance
years of spiny dogfish. If the relative abundance of spiny dogfish in the GOA is linked to
warmer sea surface temperatures, then spiny dogfish numbers may increase as
temperatures rise. Competition between elasmobranchs (including spiny dogfish) and
commercially important gadoids has been a concern on Georges Bank (Fogarty and
Murawski 1998; Collie and DeLong 1999). Although, there is recent dietary evidence
that predation by elasmobranchs is not a contributing factor (Link et al. 2002), the
complexity of marine ecosystems in general makes it difficult to sort out the cause of
trophic cascades. Our results demonstrate that spiny dogfish have a range of TPs from at
least 3.3 to over 4.2 in the GOA. A TP on the lower end of this range would mean that
spiny dogfish are occupying the same TP as many small schooling fishes (e.g., herring,
and capelin), soles (e.g., rex sole Glyptocephalus zachirus and yellowfin sole Limanda
aspera, and skates (e.g., Aleutian skate Bathyraja aleutica(Aydin et al. 2007); the middle
range of TPs that spiny dogfish occupy would be in the range of salmon Oncorhynchus

67
spp., rockfish (Scorpaenidae), walleye pollock Theragra chalcogramma, and baleen
whales (Aydin et al. 2007); while the upper range encompasses TPs that are occupied by
some skates, sablefish Anoplopoma fimbria, Pacific cod Gadus macrocephalus, and
piscivorous seabirds (Aydin et al. 2007). Therefore, large spiny dogfish are an important
predator in the GOA ecosystem and share high TPs along with other top predators that
include piscivorous seabirds and fishes. In an effort to understand species competition,
future work should focus on direct interactions between spiny dogfish and other top
predators and their prey to explore whether certain prey items are of a limited supply.

68
2.6 Acknowledgements
We thank C. Tribuzio for graciously sharing spiny dogfish samples collected for her
doctorate at the University of Alaska Fairbanks. Thanks to ADF&G Kodiak, G.
Bargmann, D. Courtney, V. Gallucci, J. King, and N. Vega for providing and assisting
with spiny dogfish sample collection. Thanks to J. Barnhart for assisting with the
collection of weathervane scallops. Also, we thank NOVA Fisheries Inc. for providing
weathervane scallop samples. We thank N. Haubenstock and T. Howe at the Alaska
Stable Isotope Facility for their assistance and expertise processing samples. We are
grateful for the statistical advice offered by F. Mueter and T. Quinn II. Funding was
provided by the Cooperative State Research, Education and Extension Service, U.S.
Department of Agriculture.

69
Figure 2.1. Number and location of spiny dogfish sampled in the Gulf of Alaska. For the
purposes of our study, samples collected between Prince William Sound and Yakutat are
considered northeastern Gulf of Alaska. Two hundred meter bathymetric line is indicated.

70
Figure 2.2. Approximate locations of weathervane scallop samples from the Gulf of
Alaska. Scallops were pooled into the National Marine Fisheries Service regulatory areas
of western Gulf of Alaska (WGOA), central GOA (CGOA), and eastern GOA (EGOA).
Two hundred meter bathymetric line is indicated.

71
Figure 2.3. Weathervane scallop δ15N values for 2004 and 2005 in the (A) Bering Sea
and (B) eastern Gulf of Alaska (EGOA). In the Bering Sea, there was no significant
difference in δ15N values between 2005 and 2006 (independent samples t-test, t = -1.66,
d.f. = 18, p = 0.115). In the EGOA, there was a significant difference in δ15N values
between 2005 and 2006 (Mann-Whitney test, W = 349.0, p = 0.023). Boxes represent the
represent the 5th and 95th percentiles, whiskers represent the 10th and 90th percentiles, and
black dots represent the 5th and 95th percentiles. Horizontal bars represent the medians.
Sample sizes are reported.
Year 2005 2006δ1
5 N
8
9
10
11A B
n=10 n=40n=10 n=10
2005 2006

72
Figure 2.4. Weathervane scallop δ15N values in the Gulf of Alaska. All scallops were
collected in 2006 except S of Icy Bay (2005). Each site represents a sample size of ten.
Compass headings that precede sites provide additional information on the location of the
sampling area. National Marine Fisheries Service (NMFS) regulatory areas are shown for
western GOA (WGOA), central GOA (CGOA) and eastern GOA (EGOA). Boxes
represent the 25th and 75th percentile and whiskers represent the 10th and 90th percentiles.
Horizontal bars represent the medians.
Shum
agin
Isla
ndN
Shum
agin
Isla
ndS
of C
ape
Doug
las
NE D
istric
t Kod
iak
SW K
ayak
Isla
ndNW
of I
cy B
ayS
of Ic
y Bay
200
5S
of Y
akut
at B
ayN
of L
ituya
Bay
δ15N
7.5
8.0
8.5
9.0
9.5
10.0
10.5
WGOA CGOA EGOA
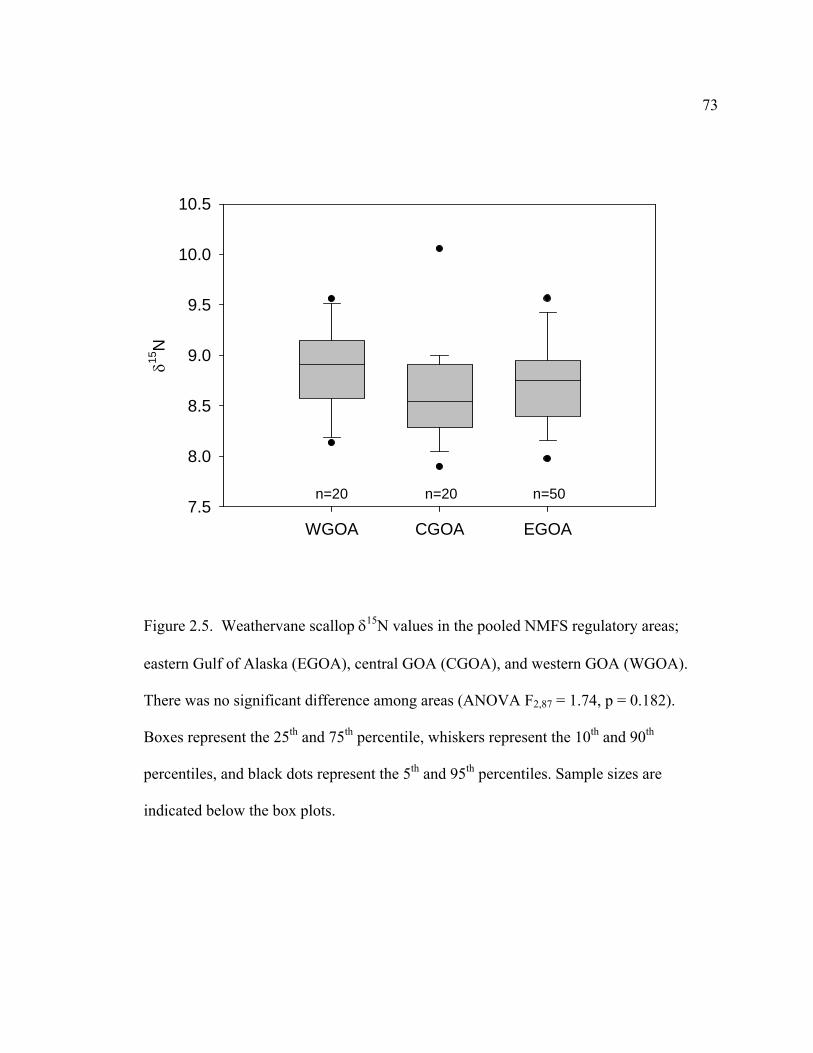
73
Figure 2.5. Weathervane scallop δ15N values in the pooled NMFS regulatory areas;
eastern Gulf of Alaska (EGOA), central GOA (CGOA), and western GOA (WGOA).
There was no significant difference among areas (ANOVA F2,87 = 1.74, p = 0.182).
Boxes represent the 25th and 75th percentile, whiskers represent the 10th and 90th
percentiles, and black dots represent the 5th and 95th percentiles. Sample sizes are
indicated below the box plots.
WGOA CGOA EGOA
δ15N
7.5
8.0
8.5
9.0
9.5
10.0
10.5
n=20 n=20 n=50

74
Figure 2.6. Spiny dogfish δ13C’ (lipid-normalized) values from samples collected from
Yakutat in 2004, 2005, and 2006. Sampling year had no significant effect on δ13C’ values
(ANOVA F 2,123 = 2.50, p = 0.086). Boxes represent the 25th and 75th percentile, whiskers
represent the 10th and 90th percentiles, and black dots represent the 5th and 95th
percentiles. Sample sizes are indicated below the box plots.
Year
2004 2005 2006
δ13C
'
-21.5
-21.0
-20.5
-20.0
-19.5
-19.0
-18.5
n=20 n=87 n=19

75
Figure 2.7. Linear relationship between spiny dogfish δ15N and length (cm) at all sites
including Kodiak, Cook Inlet, Prince William Sound (PWS), northeastern Gulf of Alaska
(NEGOA), Yakutat Bay (Yakutat), southeastern GOA (SEGOA), and British Columbia
(BC). All sites have a significant (p<0.05) linear relationship except SEGOA (p=0.175)
and Cook Inlet (p=0.055)(Table 2.3).
δ15N
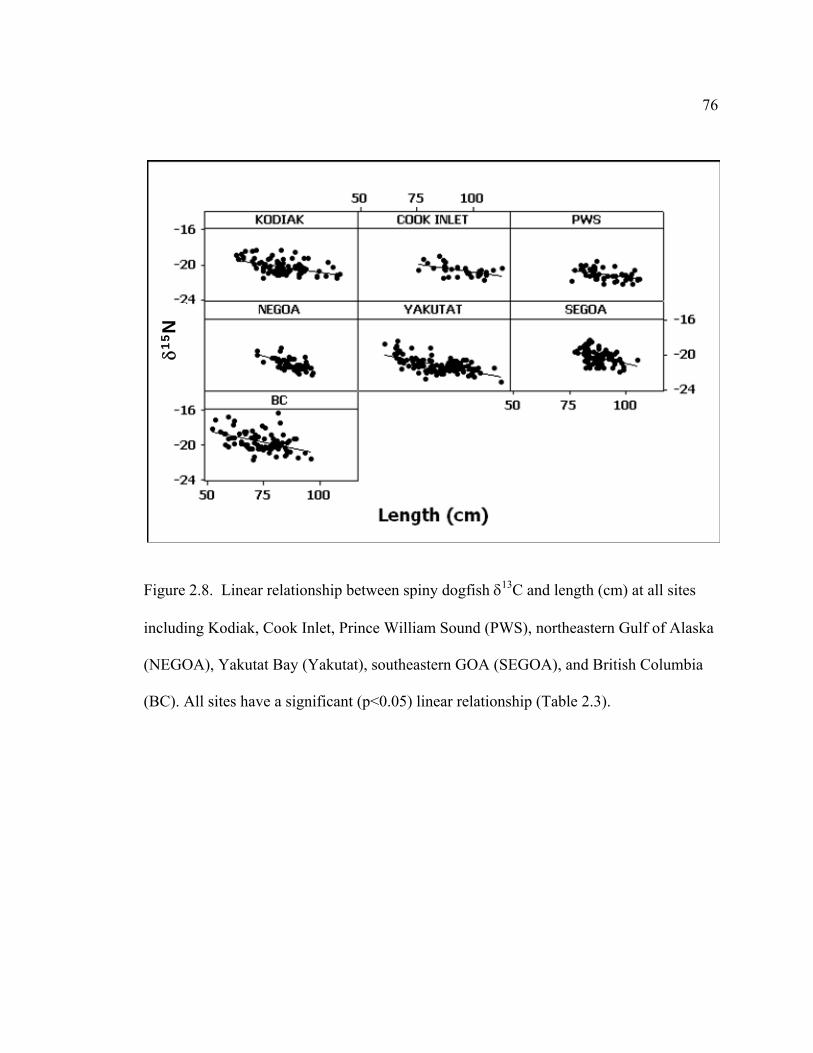
76
Figure 2.8. Linear relationship between spiny dogfish δ13C and length (cm) at all sites
including Kodiak, Cook Inlet, Prince William Sound (PWS), northeastern Gulf of Alaska
(NEGOA), Yakutat Bay (Yakutat), southeastern GOA (SEGOA), and British Columbia
(BC). All sites have a significant (p<0.05) linear relationship (Table 2.3).
δ15N

77
Figure 2.9. Linear relationship between spiny dogfish δ13C’ (lipid-normalized δ13C) and
length (cm) at all sites including Kodiak, Cook Inlet, Prince William Sound (PWS),
northeastern Gulf of Alaska (NEGOA), Yakutat Bay (Yakutat), southeastern GOA
(SEGOA), and British Columbia (BC). None of these sites have a significant (p<0.05)
linear relationship.
-16
-20
-24
1007550
1007550
-16
-20
-24
1007550
-16
-20
-24
KODIAK
Length (cm)
d13C
'
COOK INLET PWS
NEGOA YAKUTAT SEGOA
BC
δ13C
’

78
Figure 2.10. δ15N differences between sexes. Linear relationship between spiny dogfish
δ15N and length (cm) at all sites including Kodiak, Cook Inlet, Prince William Sound
(PWS), northeastern GOA (NEGOA), Yakutat Bay (Yakutat), southeastern GOA
(SEGOA), and British Columbia (BC). Males are depicted with squares and females are
depicted with circles. Sex could not be tested as a factor at all sites. Sex was not
significant (p<0.05) at the following sites: Kodiak F1,83 = 1.11, p = 0.294; and Yakutat
F1,123 = 1.09, p = 0.299. BC F1,78 = 0.05, p = 0.818.
16
14
12
1007550
1007550
16
14
12
1007550
16
14
12
BC
Length (cm)
COOK INLET KODIAK
NEGOA PWS SEGOA
YAKUTAT
MaleFemale
Sex
δ15N

79
Figure 2.11. Boxplot of δ13C’ (lipid-normalized δ13C) values in the northeastern Pacific
Ocean. Lipid-normalized, δ13C’, differed significantly among sites (ANOVA F6,484 =
71.00, p < 0.001). See Table 2.4 for results of pairwise comparison. Boxes represent the
25th and 75th percentile, whiskers represent the 10th and 90th percentiles, and black dots
represent the 5th and 95th percentiles.
Kodiak
Cook Inlet
PWS
NEGOA
Yakutat
SEGOA BC
Y D
ata
-22
-21
-20
-19
-18
-17
-16
δ13C
’

80
12011010090807060
4.4
4.2
4.0
3.8
3.6
3.4
3.2
Length (cm)
Pred
icte
d TP
KODIAKNEGOA
PWSYAKUTAT
Figure 2.12. Fitted linear relationships between spiny dogfish trophic position (TP) to
length (cm) for each site: Kodiak, Prince William Sound (PWS), northeastern Gulf of
Alaska (NEGOA), and Yakutat.

81
Table 2.1. Spiny dogfish sample sizes (N) at each site for males (M) and females (F) with mean values and standard deviation
(SD) for lengths (total length extended), δ15N, δ13C, δ13C’, and carbon to nitrogen ratios (C:N). Indicated are the sampling
areas of this study, Kodiak, Cook Inlet, Prince William Sound (PWS), northeastern Gulf of Alaska (NEGOA), Yakutat,
southeastern Gulf of Alaska (SEGOA), and British Columbia (BC).
Sex Length (cm) δ15N δ13C δ13C' C:N
Site N M F Range Mean ± SD Range Mean ± SD Range Mean ± SD Range Mean ± SD Mean ± SD
KODIAK 86 41 45 63.0 ‐ 109 84.1 ± 10.5 11.7 ‐ 15.6 13.2 + 0.9 ‐21.6 ‐ ‐18.4 ‐20.3 ± 0.8 ‐20.9 ‐ ‐18.7 ‐19.7 ± 0.5 4.7 ± 1.0
COOK INLET 32 6 26 76.0 ‐ 113.1 94.3 ± 9.5 11.8 ‐ 15.0 13.8 + 0.7 ‐21.8 ‐ ‐19.0 ‐20.7 ± 0.7 ‐20.5 ‐ ‐19.3 ‐19.8 ± 0.3 5.0 ± 0.8
PWS 45 14 31 76.0 ‐ 106 91.6 ± 8.6 10.8 ‐ 14.0 12.9 + 0.8 ‐22.3 ‐ ‐19.6 ‐21.2 ± 0.7 ‐20.6 ‐ ‐19.3 ‐20.1 ± 0.3 5.5 ± 1.0
NEGOA 45 12 33 72.2 ‐ 97.3 87.0 ± 6.1 10.8 ‐ 14.1 12.6 + 0.8 ‐22.3 ‐ ‐19.2 ‐21.0 ± 0.7 ‐21.2 ‐ ‐18.8 ‐20.3 ± 0.5 5.0 ± 1.0
YAKUTAT 126 35 91 60.5 ‐ 112.6 84.3 ± 11.1 10.8 ‐ 14.2 12.7 + 0.7 ‐23.1 ‐ ‐18.4 ‐21.1 ± 0.9 ‐21.2 ‐ ‐18.8 ‐20.1 ± 0.5 5.4 ± 1.3
SEGOA 76 37 39 77.0 ‐ 105.0 87.5 ± 5.8 11.0 ‐ 14.7 13.4 + 0.8 ‐21.9 ‐ ‐18.3 ‐20.2 ± 0.9 ‐20.6 ‐ ‐17.6 ‐19.4 ± 0.6 5.0 ± 0.9
BC 81 41 40 52.3 ‐ 96.2 74.0 ± 9.9 11.3 ‐ 14.7 13.3 + 0.6 ‐21.7 ‐ ‐16.3 ‐19.6 ± 1.1 ‐20.2 ‐ ‐16.8 ‐18.9 ± 0.5 5.0 ± 1.3

82
Table 2.2. Sample site and region, date, bottom depth, and mean δ15N ± standard error
(SE) values for weathervane scallops collected for isotopic baseline. Sampling sites are
Bering Sea, Shumagin Islands, north of (N) Shumagin Islands, south of (S) Cape
Douglas, northeast (NE) District Kodiak, southwest of (SW) Kayak Island, northwest of
(NW) Icy Bay, south of (S) Icy Bay, south of (S) Yakutat Bay, and north of (N) Lituya
Bay. Sampling regions are Bering Sea (BS), western Gulf of Alaska (WGOA), central
Gulf of Alaska (CGOA), and eastern Gulf of Alaska (EGOA).
Site Region N Date Year Depth (m) δ15N (mean ± SE)
Bering Sea BS 10 11/15/2006 2006 95 10.3 ± 0.2
Bering Sea BS 10 12/23/2005 2005 95 10.7 ± 0.1
Shumagin Island WGOA 10 10/25/2006 2006 86 8.9 ± 0.1
N Shumagin Island WGOA 10 10/28/2006 2006 117 8.8 ± 0.1
S of Cape Douglas CGOA 10 8/2/2006 2006 110 8.6 ± 0.1
NE District Kodiak CGOA 10 11/1/2006 2006 91 8.6 ± 0.2
SW Kayak Island EGOA 10 7/3/2006 2006 77 8.3 ± 0.1
NW of Icy Bay EGOA 10 9/28/2006 2006 64 8.3 ± 0.1
S of Icy Bay 2005 EGOA 10 10/1/2005 2005 68 8.9 ± 0.0
S of Yakutat Bay EGOA 10 9/5/2006 2006 69 8.7 ± 0.1
N of Lituya Bay EGOA 10 8/24/2006 2006 73 9.3 ± 0.1

83
Table 2.3. Parameters, test statistics, and sample sizes (N) for linear relationships between length (cm) and δ15N, δ13C, and
δ13C’ for spiny dogfish for all sampling sites, Kodiak, Cook Inlet, Prince William Sound (PWS), northeastern Gulf of Alaska
(NEGOA), Yakutat, southeastern Gulf of Alaska (SEGOA), and British Columbia (BC).
δ15N α β R2 R2adj. F‐value p‐value N
Kodiak 8.1 0.0612 50.6% 50.0% 86.14 < 0.001 86
Cook Inlet 11.3 0.0261 11.8% 8.8% 4.00 0.055 32
PWS 9.1 0.0418 21.7% 19.8% 11.89 0.001 45
NEGOA 8.0 0.0534 16.8% 14.9% 8.70 0.005 45
Yakutat 9.4 0.0388 33.4% 32.8% 62.09 < 0.001 126
SEGOA 11.6 0.0204 2.5% 1.1% 1.87 0.175 76
BC 10.8 0.0347 28.3% 27.4% 31.12 < 0.001 81
δ13C α β R2 R2adj. F‐value p‐value N Kodiak ‐17.0 ‐0.0386 24.1% 23.2% 26.74 < 0.001 86 Cook Inlet ‐17.3 ‐0.0361 26.5% 24.1% 10.83 0.003 32 PWS ‐17.9 ‐0.0359 21.5% 19.7% 11.77 0.001 45 NEGOA ‐14.6 ‐0.0743 40.0% 38.6% 28.66 <0.001 45 Yakutat ‐17.1 ‐0.0484 39.8% 39.3% 81.89 < 0.001 126 SEGOA ‐15.0 ‐0.0602 16.9% 15.7% 15.00 < 0.001 76 BC ‐15.7 ‐0.0526 20.9% 19.9% 20.87 < 0.001 81
δ13C' α β R2 R2adj. F‐value p‐value N Kodiak ‐20.5 0.0092 4.5% 3.4% 3.97 0.050 86 Cook Inlet ‐20.5 0.0074 4.7% 1.5% 1.46 0.236 32 PWS ‐20.1 0.0001 0.0% 0.0% 0.00 0.986 45 NEGOA ‐19.9 ‐0.0035 0.2% 0.0% 0.10 0.754 45 Yakutat ‐19.9 ‐0.0032 0.6% 0.0% 0.69 0.407 126 SEGOA ‐18.0 ‐0.0164 2.5% 1.2% 1.91 0.171 76 BC ‐19.3 0.0051 0.8% 0.0% 0.67 0.415 81
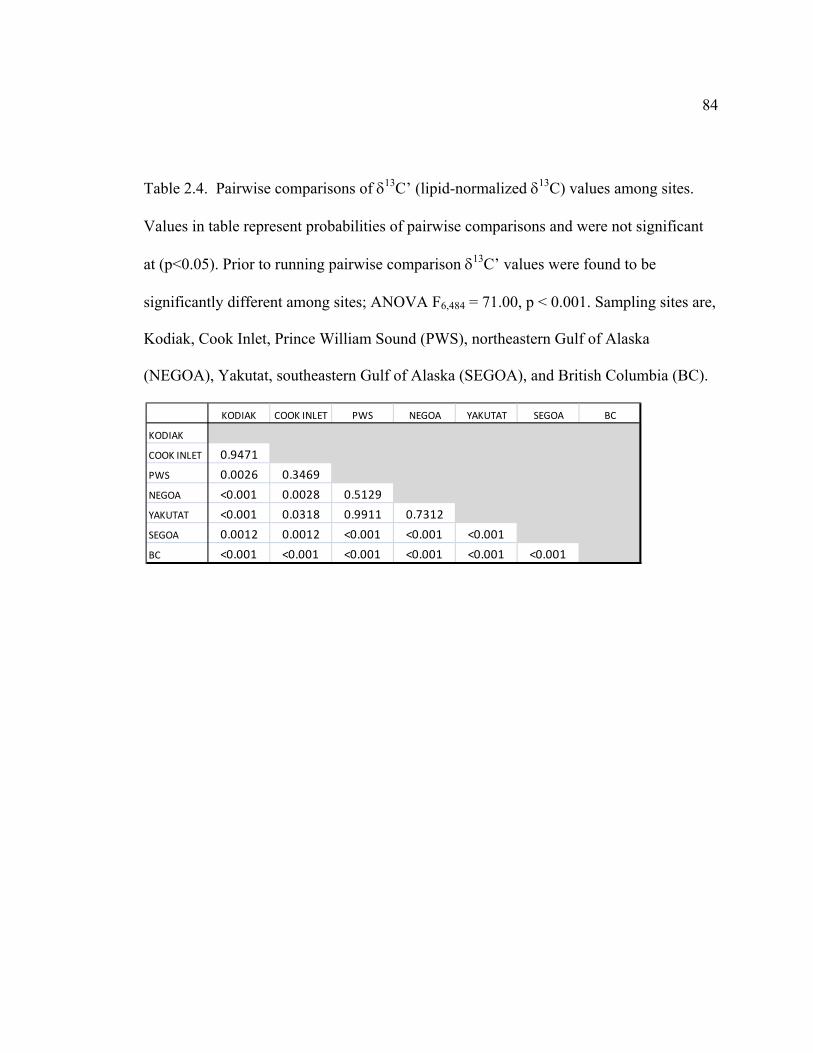
84
Table 2.4. Pairwise comparisons of δ13C’ (lipid-normalized δ13C) values among sites.
Values in table represent probabilities of pairwise comparisons and were not significant
at (p<0.05). Prior to running pairwise comparison δ13C’ values were found to be
significantly different among sites; ANOVA F6,484 = 71.00, p < 0.001. Sampling sites are,
Kodiak, Cook Inlet, Prince William Sound (PWS), northeastern Gulf of Alaska
(NEGOA), Yakutat, southeastern Gulf of Alaska (SEGOA), and British Columbia (BC).
KODIAK COOK INLET PWS NEGOA YAKUTAT SEGOA BC
KODIAK
COOK INLET 0.9471
PWS 0.0026 0.3469
NEGOA <0.001 0.0028 0.5129
YAKUTAT <0.001 0.0318 0.9911 0.7312
SEGOA 0.0012 0.0012 <0.001 <0.001 <0.001
BC <0.001 <0.001 <0.001 <0.001 <0.001 <0.001

85
2.7 References
Alonso, M. K., E. A. Crespo, N. A. Garcia, S. N. Pedraza, P. A. Mariotti, and N. J. Mora.
2002. Fishery and ontogenetic driven changes in the diet of the spiny dogfish,
Squalus acanthias, in Patagonian waters, Argentina. Environmental Biology of
Fishes 63(2):193-202.
Anderson, P. J., and J. F. Piatt. 1999. Community reorganization in the Gulf of Alaska
following ocean climate regime shift. Marine Ecology Progress Series 189:117-
123.
Andrews, A. G., and R. J. Foy. 2009. Geographical variation in the carbon and nitrogen
stable isotope ratios in spiny dogfish in the northeastern Pacific Ocean. Pages
269-276 in V. F. Gallucci, G. A. McFarlane, and G. G. Bargmann, editors.
Biology and management of dogfish sharks. American Fisheries Society,
Bethesda, Maryland.
Aydin, K., S. Gaichas, I. Ortiz, D. Kinzey, and N. Friday. 2007. A comparison of the
Bering Sea, Gulf of Alaska, and Aleutian Islands large marine ecosystems
through food web modeling. U.S. Department of Commerce. NOAA Tech Memo.
NMFS-AFSC-178, 298p.
Beamish, R. J., and R. M. Sweeting. 2009. Spiny dogfish in the pelagic waters of the
Strait of Georgia and Puget Sound. Pages 101-118 in V. F. Gallucci, G. A.

86
McFarlane, and G. G. Bargmann, editors. Biology and management of dogfish
sharks. American Fisheries Society, Bethesda, Maryland.
Beamish, R. J., B. L. Thomson, and G. A. McFarlane. 1992. Spiny dogfish predation on
chinook and coho salmon and the potential effects on hatchery-produced salmon.
Transactions of the American Fisheries Society 121(4):444-455.
Bonham, K. 1954. Food of the dogfish Squalus acanthias. Fisheries Research Papers
1(2):25-36.
Bowman, R., R. Eppi, and M. Grosslein. 1984. Diet and consumption of spiny dogfish in
the Northwest Atlantic. ICES C. M.1984/G:27, Copenhagen, Denmark.
Box, A., S. Deudero, A. Blanco, A. M. Grau, and F. Riera. 2010. Differences in δ13C and
δ15N stable isotopes in the pearly razorfish Xyrichtys novacula related to the sex,
location and spawning period. Journal of Fish Biology 76(10):2370-2381.
Braccini, J. M., B. M. Gillanders, and T. I. Walker. 2005. Sources of variation in the
feeding ecology of the piked spurdog (Squalus megalops): implications for
inferring predator-prey interactions from overall dietary composition. ICES
Journal of Marine Science 62(6):1076-1094.
Cabana, G., and J. B. Rasmussen. 1996. Comparison of aquatic food chains using
nitrogen isotopes. Proceedings of the National Academy of Sciences
93(20):10844-10847.

87
Castro, J. I. 1983. The sharks of North American waters. Texas A&M University Press,
College Station.
Collie, J. S., and A. K. DeLong. 1999. Multispecies interactions in the Georges Bank fish
community. Pages 187-210 in Ecosystem approaches for fisheries management.
Proceedings of the 1998 Wakefield Fisheries Symposium: Ecosystem
Considerations in Fisheries Management. University of Alaska, Alaska Sea Grant
Publication AK-SG-99-01, Fairbanks.
Cortes, E. 1999. Standardized diet compositions and trophic levels of sharks. ICES
Journal of Marine Science 56(5):707-717.
Courtney, D. L., C. A. Tribuzio, K. J. Goldman, and J. S. Rice. 2006. Gulf of Alaska
Stock Assessment and Fishery Evaluation Report. North Pacific Fishery
Management Council, Seattle, Washington.
DeNiro, M. J., and S. Epstein. 1977. Mechanism of carbon isotope fractionation
associated with lipid synthesis. Science 197:261-263.
DeNiro, M. J., and S. Epstein. 1978. Influence of diet on the distribution of carbon
isotopes in animals. Geochimica et Cosmochimica Acta 42:495-506.
DeNiro, M. J., and S. Epstein. 1981. Influence of diet on the distribution of nitrogen
isotopes in animals. Geochimica et Cosmochimica Acta 45(3):341-351.

88
Domi, N., J. M. Bouquegneau, and K. Das. 2005. Feeding ecology of five commercial
shark species of the Celtic Sea through stable isotope and trace metal analysis.
Marine Environmental Research 60(5):551-569.
Ebert, D. A., and J. J. Bizzarro. 2007. Standardized diet compositions and trophic levels
of skates (Chondrichthyes : Rajiformes : Rajoidei). Environmental Biology of
Fishes 80(2-3):221-237.
Ebert, D. A., L. J. V. Compagno, and P. D. Cowley. 1992. A preliminary investigation of
the feeding ecology of squaloid sharks off the west coast of southern Africa.
Pages 601-609 in A. I. L. Payne, K. H. Brink, K. H. Mann, and R. Hilborn,
editors. Benguela Trophic Functioning. Cape Town, South Africa.
Ellis, J. K., and J. A. Musick. 2007. Ontogenetic changes in the diet of the sandbar shark,
Carcharhinus plumbeus, in lower Chesapeake Bay and Virginia (USA) coastal
waters. Environmental Biology of Fishes 80(1):51-67.
Estrada, J. A., A. N. Rice, M. E. Lutcavage, and G. B. Skomal. 2003. Predicting trophic
position in sharks of the north-west Atlantic Ocean using stable isotope analysis.
Journal of the Marine Biological Association of the United Kingdom 83(6):1347-
1350.
Estrada, J. A., A. N. Rice, L. J. Natanson, and G. B. Skomal. 2006. Use of isotopic
analysis of vertebrae in reconstructing ontogenetic feeding ecology in white
sharks. Ecology 87(4):829-834.

89
Fisk, A. T., S. A. Tittlemier, J. L. Pranschke, and R. J. Norstrom. 2002. Using
anthropogenic contaminants and stable isotopes to assess the feeding ecology of
Greenland sharks. Ecology 83(8):2162-2172.
Fogarty, M. J., and S. A. Murawski. 1998. Large-scale disturbance and the structure of
marine systems: Fishery impacts on Georges Bank. Ecological Applications 8(1,
supplement):S6-S22.
Foster, N. R. 1991. Intertidal bivalves: a guide to the common marine bivalves of Alaska.
University of Alaska Press, Fairbanks.
France, R. L. 1995. Carbon-13 enrichment in benthic compared to planktonic algae:
foodweb implications. Marine Ecology Progress Series 124(1-3):307-312.
Frank, K. T., B. Petrie, J. S. Choi, and W. C. Leggett. 2005. Trophic cascades in a
formerly cod-dominated ecosystem. Science 308:1621-1623.
Fry, B. 1988. Food web structure on Georges Bank from stable C, N, and S isotopic
compositions. Limnology and Oceanography 33(5):1182-1190.
Fry, B., and E. B. Sherr. 1984. δ13C measurements as indicators of carbon flow in marine
and freshwater ecosystems. Contributions in Marine Science 27:13-47.
Galvan, D. E., C. J. Sweeting, and W. D. K. Reid. 2010. Power of stable isotope
techniques to detect size-based feeding in marine fishes. Marine Ecology Progress
Series 407:271-278.
90
Hazlett, S. D., N. Misarti, A. G. Andrews, G. A. McFarlane, and M. J. Wooller. 2009.
Stable isotopic variability along spiny dogfish spines: implications for
retrospective ecological studies. Pages 259-267 in V. F. Gallucci, G. A.
McFarlane, and G. G. Bargmann, editors. Biology and management of dogfish
sharks. American Fisheries Society, Bethesda, Maryland.
Herzka, S. Z., and G. J. Holt. 2000. Changes in isotopic composition of red drum
(Sciaenops ocellatus) larvae in response to dietary shifts: potential applications to
settlement studies. Canadian Journal of Fisheries and Aquatic Sciences 57(1):137-
147.
Hesslein, R. H., K. A. Hallard, and P. Ramlal. 1993. Replacement of sulfur, carbon, and
nitrogen in tissue of growing broad whitefish (Coregonus nasus) in response to a
change in diet traced by δ34S, δ13C, and δ15N. Canadian Journal of Fisheries and
Aquatic Sciences 50(10):2071-2076.
Hobson, K. A., and H. E. Welch. 1992. Determination of trophic relationships within a
high Arctic marine food web using δ13C and δ15N analysis. Marine Ecology
Progress Series 84:9-18.
Hoekstra, P. F., and coauthors. 2002. Trophic ecology of bowhead whales (Balaena
mysticetus) compared with that of other Arctic marine biota as interpreted from
carbon-, nitrogen-, and sulfur-isotope signatures. Canadian Journal of Zoology
80(2):223-231.

91
Howard, J. K., K. M. Cuffey, and M. Solomon. 2005. Toward using Margaritifera
falcata as an indicator of base level nitrogen and carbon isotope ratios: insights
from two California coast range rivers. Hydrobiologia 541(1):229-236.
Jennings, S., and K. J. Warr. 2003. Environmental correlates of large-scale spatial
variation in the δ15N of marine animals. Marine Biology 142(6):1131-1140.
Jones, B. C., and G. H. Geen. 1977. Food and feeding of spiny dogfish (Squalus
acanthias) in British Columbia waters. Journal of the Fisheries Research Board of
Canada 34(11):2067-2078.
Ketchen, K. S. 1972. Size at maturity, fecundity, and embryonic growth of the spiny
dogfish (Squalus acanthias) in British Columbia waters. Journal of the Fisheries
Research Board of Canada 29(12):1717-1723.
Ketchen, K. S. 1986. The spiny dogfish (Squalus acanthias) in the Northeast Pacific and
a history of its utilization. Canadian Special Publication of Fisheries and Aquatic
Sciences 88:78 p. Ottawa.
King, J. R., and G. A. McFarlane. 2003. Marine fish life history strategies: applications to
fishery management. Fisheries Management and Ecology 10(4):249-264.
Laptikhovsky, V. V., A. I. Arkhipkin, and A. C. Henderson. 2001. Feeding habits and
dietary overlap in spiny dogfish Squalus acanthias (Squalidae) and narrowmouth
92
catshark Schroederichthys bivius (Scyliorhinidae). Journal of the Marine
Biological Association of the United Kingdom 81(6):1015-1018.
Link, J. 2002. Does food web theory work for marine ecosystems? Marine Ecology
Progress Series 230:1-9.
Link, J. S., L. P. Garrison, and F. P. Almeida. 2002. Ecological interactions between
elasmobranchs and groundfish species on the northeastern US continental shelf. I.
Evaluating predation. North American Journal of Fisheries Management
22(2):550-562.
Logan, J. M., and M. E. Lutcavage. 2010. Stable isotope dynamics in elasmobranch
fishes. Hydrobiologia 644(1):231-244.
Lowe, C. G., B. M. Wetherbee, G. L. Crow, and A. L. Tester. 1996. Ontogenetic dietary
shifts and feeding behavior of the tiger shark, Galeocerdo cuvier, in Hawaiian
waters. Environmental Biology of Fishes 47(2):203-211.
MacNeil, M. A., K. G. Drouillard, and A. T. Fisk. 2006. Variable uptake and elimination
of stable nitrogen isotopes between tissues in fish. Canadian Journal of Fisheries
and Aquatic Sciences 63(2):345-353.
MacNeil, M. A., G. B. Skomal, and A. T. Fisk. 2005. Stable isotopes from multiple
tissues reveal diet switching in sharks. Marine Ecology Progress Series 302:199-
206.
93
MacNeill, M. A., G. B. Skomal, and A. T. Fisk. 2005. Stable isotopes from multiple
tissues reveal diet switching in sharks. Marine Ecology Progress Series 302:199-
206.
Marasco, R. J., and coauthors. 2007. Ecosystem-based fisheries management: some
practical suggestions. Canadian Journal of Fisheries and Aquatic Sciences
64(6):928-939.
McConnaughey, T., and C. P. McRoy. 1979. Food-web structure and the fractionation of
carbon isotopes in the Bering Sea. Marine Biology 53(3):257-262.
McFarlane, G. A., and J. R. King. 2003. Migration patterns of spiny dogfish (Squalus
acanthias) in the North Pacific Ocean. Fishery Bulletin 101(2):358-367.
Menard, F., A. Lorrain, M. Potier, and F. Marsac. 2007. Isotopic evidence of distinct
feeding ecologies and movement patterns in two migratory predators (yellowfin
tuna and swordfish) of the western Indian Ocean. Marine Biology 153(2):141-
152.
Minagawa, M., and E. Wada. 1984. Stepwise enrichment of 15N along food chains:
further evidence and the relation between δ15N and animal age. Geochimica et
Cosmochimica Acta 48:1135-1140.

94
Mueter, F. J., and B. L. Norcross. 2000. Changes in species composition of the demersal
fish community in nearshore waters of Kodiak Island, Alaska. Canadian Journal
of Fisheries and Aquatic Sciences 57:1169-1180.
Nakazawa, T., and coauthors. 2010. Is the relationship between body size and trophic
niche position time-invariant in a predatory fish? First stable isotope evidence.
Plos One 5(2):e9120.
Pauly, D., V. Christensen, and C. Walters. 2000. Ecopath, Ecosim, and Ecospace as tools
for evaluating ecosystem impact of fisheries. ICES Journal of Marine Science
57(3):697-706.
Perry, A. L., P. J. Low, J. R. Ellis, and J. D. Reynolds. 2005. Climate change and
distribution shifts in marine fishes. Science 308(5730):1912-1915.
Peters, R. H. 1983. The ecological implications of body size. Cambridge University
Press, Cambridge, Massachusetts.
Peterson, B. J., and B. Fry. 1987. Stable isotopes in ecosystem studies. Annual Review of
Ecology and Systematics 18:293-320.
Pinnegar, J. K., S. Jennings, C. M. O'Brien, and N. V. C. Polunin. 2002. Long-term
changes in the trophic level of the Celtic Sea fish community and fish market
price distribution. Journal of Applied Ecology 39(3):377-390.

95
Post, D. M. 2002. Using stable isotopes to estimate trophic position: models, methods,
and assumptions. Ecology 83(3):703-718.
Quillfeldt, P., R. A. R. McGill, and R. W. Furness. 2005. Diet and foraging areas of
Southern Ocean seabirds and their prey inferred from stable isotopes:review and
case study of Wilson's storm-petrel. Marine Ecology Progress Series 295:295-
304.
Rau, G. H., D. G. Ainley, J. L. Bengtson, J. J. Torres, and T. L. Hopkins. 1992. 15N/14N
and 13C/12C in Weddell Sea birds, seals, and fish: implications for diet and trophic
structure. Marine Ecology Progress Series 84:1-8.
Rau, G. H., and coauthors. 1983. Animal 13C/12C correlates with trophic level in pelagic
food webs. Ecology 64(5):1314-1318.
Saunders, M. W., and G. A. McFarlane. 1993. Age and length at maturity of the female
spiny dogfish, Squalus acanthias, in the Strait of Georgia, British Columbia,
Canada. Environmental Biology of Fishes 38:49-57.
Stabeno, P. J., and coauthors. 2004. Meteorology and oceanography of the northern Gulf
of Alaska. Continental Shelf Research 24:859-897.
Stevens, J. D., R. Bonfil, N. K. Dulvy, and P. A. Walker. 2000. The effects of fishing on
sharks, rays, and chimaeras (chondrichthyans), and the implications for marine
ecosystems. ICES Journal of Marine Science 57(3):476-494.

96
Tieszen, L. L., T. W. Boutton, K. G. Tesdahl, and N. A. Slade. 1983. Fractionation and
turnover of stable carbon isotopes in animal tissues: implications for δ13C analysis
of diet. Oecologia 57:32-37.
Tribuzio, C. A. 2010. Life history, demography, and ecology of the spiny dogfish
(Squalus acanthias) in the Gulf of Alaska. Doctoral dissertation. University of
Alaska Fairbanks, Fairbanks.
Tribuzio, C. A., C. Rodgveller, J. Heifetz, and K. Goldman. 2009. Gulf of Alaska Stock
Assessment and Fishery Evaluation Report. North Pacific Fishery Management
Council, Seattle, Washington.
Vander Zanden, M. J., G. Cabana, and J. B. Rasmussen. 1997. Comparing trophic
position of freshwater fish calculated using stable nitrogen isotope ratios (δ15N)
and literature dietary data. Canadian Journal of Fisheries and Aquatic Sciences
54(5):1142-1158.
Vander Zanden, M. J., and J. B. Rasmussen. 1999. Primary consumer δ13C and δ15N and
the trophic position of aquatic consumers. Ecology 80(4):1395-1404.
Weingartner, T. J. 2007. The physical environment of the Gulf of Alaska. Pages 12-44 in
R. Spies, editor. Long-term ecological change in the northern Gulf of Alaska.
Elsevier, Oxford, United Kingdom.

97
Werner, E. E., and J. F. Gilliam. 1984. The ontogenetic niche and species interactions in
size structured populations. Annual Review of Ecology and Systematics 15:393-
425.

98
Appendices
Table A-1. Sampling site, date, gear and sample location (latitude, longitude) for sample
size (N) of male and female spiny dogfish collected for this study. Indicated are the
sampling areas of this study, Kodiak, Cook Inlet, Prince William Sound (PWS),
northeastern Gulf of Alaska (NEGOA), Yakutat, southeastern Gulf of Alaska (SEGOA),
and British Columbia (BC). Gear used for shark collection included, sport (i.e., rod and
reel), setnet (SN), baited longlines (LL), midwater trawl (MT), and bottom trawl (BT).
Region Site Date Gear N Males Females Latitude Longitude Alaska COOK INLET 6/26/2005 sport 13 3 10 59.23 153.34 Alaska COOK INLET 6/27/2005 sport 12 1 11 59.20 153.33 Alaska COOK INLET 6/28/2005 sport 6 2 4 59.20 153.33 Alaska COOK INLET 6/27/2006 SN 1 0 1 60.14 151.53 Alaska CROSS SOUND 4/21/2005 LL 1 0 1 58.19 136.84 Alaska CROSS SOUND 4/22/2005 LL 2 0 2 58.15 136.87 Alaska CROSS SOUND 4/23/2005 LL 6 0 6 58.08 136.44 Alaska CROSS SOUND 4/24/2005 LL 5 1 4 58.07 136.42 Alaska EGOA 7/9/2005 LL 21 16 5 54.65 132.84 Alaska EGOA 7/11/2005 LL 6 3 3 54.90 134.29 Alaska EGOA 7/14/2005 LL 6 2 4 55.93 134.90 Alaska EGOA 7/16/2005 LL 14 7 7 56.38 135.35 Alaska EGOA 7/17/2005 LL 5 4 1 56.85 136.00 Alaska EGOA 7/18/2005 LL 8 3 5 57.19 136.23 Alaska EGOA 7/19/2005 LL 1 0 1 57.62 136.54 Alaska EGOA 7/22/2005 LL 1 1 0 57.88 137.38 Alaska EGOA 7/28/2005 LL 1 1 0 59.42 140.94 Alaska EGOA 8/1/2005 LL 34 7 27 59.75 143.59 Alaska EGOA 8/1/2005 LL 1 1 0 59.68 143.37 Alaska EGOA 8/4/2005 LL 1 1 0 59.52 144.71 Alaska EGOA 8/5/2005 LL 8 2 6 59.50 145.53 Alaska KODIAK 6/21/2005 MT 2 1 1 57.91 151.81 Alaska KODIAK 6/21/2005 MT 9 3 6 57.97 151.67 Alaska KODIAK 6/21/2005 MT 8 5 3 57.98 151.78 Alaska KODIAK 6/21/2005 MT 8 4 4 57.99 151.99 Alaska KODIAK 6/21/2005 MT 2 1 1 57.97 152.09 Alaska KODIAK 6/21/2005 MT 1 1 0 57.94 152.20 Alaska KODIAK 6/21/2005 MT 2 1 1 57.94 151.99 Alaska KODIAK 7/5/2005 MT 1 0 1 56.93 152.93 Alaska KODIAK 7/5/2005 MT 2 2 0 56.86 152.63 Alaska KODIAK 7/6/2005 MT 3 1 2 56.91 153.42 Alaska KODIAK 7/8/2005 MT 4 1 3 56.72 153.66 Alaska KODIAK 7/10/2005 MT 3 2 1 56.81 154.33 Alaska KODIAK 7/10/2005 MT 2 2 0 56.84 154.39

99
Table A-1, continued. Alaska KODIAK 7/10/2005 MT 3 3 0 56.78 154.48 Alaska KODIAK 7/10/2005 MT 3 1 2 56.86 154.42 Alaska KODIAK 7/10/2005 MT 3 1 2 56.76 154.40 Alaska KODIAK 7/10/2005 MT 1 0 1 56.76 154.48 Alaska KODIAK 7/10/2005 MT 1 1 0 56.85 154.50 Alaska KODIAK 7/11/2005 MT 2 2 0 56.76 154.24 Alaska KODIAK 9/6/2005 MT 7 3 4 57.99 153.16 Alaska KODIAK 9/7/2005 MT 3 1 2 57.86 153.12 Alaska KODIAK 9/7/2005 MT 7 2 5 57.92 153.25 Alaska KODIAK 9/7/2005 MT 4 3 1 57.94 153.30 Alaska KODIAK 9/7/2005 MT 5 0 5 57.97 153.39 Alaska PWS 9/5/2005 LL 2 2 0 60.94 146.89 Alaska PWS 9/5/2005 LL 2 1 1 61.03 146.76 Alaska PWS 9/6/2005 LL 8 4 4 60.90 146.98 Alaska PWS 9/7/2005 LL 1 0 1 60.94 146.70 Alaska PWS 9/7/2005 LL 1 1 0 60.54 147.88 Alaska PWS 9/8/2005 LL 31 6 25 60.59 146.74 Alaska YAKUTAT 7/28/2004 sport 10 0 10 59.60 139.85 Alaska YAKUTAT 7/28/2004 sport 3 0 3 59.59 139.81 Alaska YAKUTAT 7/29/2004 sport 7 0 7 59.65 139.99 Alaska YAKUTAT 6/28/2005 LL 51 20 31 59.51 140.06 Alaska YAKUTAT 6/29/2005 LL 10 4 6 59.60 139.83 Alaska YAKUTAT 6/30/2005 LL 26 11 15 59.52 140.10 Alaska YAKUTAT 7/18/2006 SN 19 0 19 59.56 139.84 British Columbia BC 7/28/2005 BT 29 13 16 48.64 123.35 British Columbia BC 8/5/2005 BT 2 2 0 49.86 125.09 British Columbia BC 8/5/2005 BT 2 0 2 49.91 125.16 British Columbia BC 8/5/2005 BT 9 6 3 49.92 125.15 British Columbia BC 8/5/2005 BT 7 7 0 49.91 125.14 British Columbia BC 8/6/2005 BT 10 0 10 49.50 124.03 British Columbia BC 8/25/2005 LL 22 13 9 49.55 123.40

100
Table A-2. Specimen ID number, carbon to nitrogen ratio (C:N), and isotope values
(δ15N and δ13C) for weathervane scallops collected from four different sites, Bering Sea
(BS), eastern Gulf of Alaska (EGOA), central GOA (CGOA), and western GOA
(WGOA). Sampling locations within sites were, Bering Sea, Shumagin Islands, north of
(N) Shumagin Islands, south of (S) Cape Douglas, northeast (NE) District Kodiak,
southwest of (SW) Kayak Island, northwest of (NW) Icy Bay, south of (S) Icy Bay, south
of (S) Yakutat Bay, and north of (N) Lituya Bay.
ID C:N δ15N
δ13C
Location Site Date Depth (m)
1 3.39 10.74 -17.32 Bering Sea BS 11/15/2006 95 2 3.39 10.40 -17.81 Bering Sea BS 11/15/2006 95 3 3.45 9.91 -17.42 Bering Sea BS 11/15/2006 95 4 3.56 10.10 -17.49 Bering Sea BS 11/15/2006 95 5 3.40 10.33 -17.97 Bering Sea BS 11/15/2006 95 6 3.36 10.55 -17.57 Bering Sea BS 11/15/2006 95 7 3.54 9.09 -17.54 Bering Sea BS 11/15/2006 95 8 3.33 10.35 -17.76 Bering Sea BS 11/15/2006 95 9 3.33 10.90 -17.53 Bering Sea BS 11/15/2006 95
10 3.40 10.97 -17.52 Bering Sea BS 11/15/2006 95 11 3.71 8.79 -16.80 S of Cape Douglas CGOA 8/2/2006 110 12 3.81 8.14 -17.05 S of Cape Douglas CGOA 8/2/2006 110 13 3.67 8.99 -16.78 S of Cape Douglas CGOA 8/2/2006 110 14 3.55 8.97 -16.98 S of Cape Douglas CGOA 8/2/2006 110 15 3.55 8.63 -17.03 S of Cape Douglas CGOA 8/2/2006 110 16 3.90 8.25 -16.92 S of Cape Douglas CGOA 8/2/2006 110 17 3.61 8.58 -17.10 S of Cape Douglas CGOA 8/2/2006 110 18 3.70 8.49 -16.97 S of Cape Douglas CGOA 8/2/2006 110 19 3.65 8.95 -16.87 S of Cape Douglas CGOA 8/2/2006 110 20 3.72 8.40 -17.03 S of Cape Douglas CGOA 8/2/2006 110 21 3.50 8.66 -16.71 Shumagin Island WGOA 10/25/2006 86 22 3.65 8.13 -16.72 Shumagin Island WGOA 10/25/2006 86 23 3.30 8.97 -16.53 Shumagin Island WGOA 10/25/2006 86 24 3.40 8.79 -16.37 Shumagin Island WGOA 10/25/2006 86 25 3.29 8.43 -16.60 Shumagin Island WGOA 10/25/2006 86 26 3.55 9.56 -16.46 Shumagin Island WGOA 10/25/2006 86 27 3.47 9.33 -16.79 Shumagin Island WGOA 10/25/2006 86 28 3.55 9.17 -16.59 Shumagin Island WGOA 10/25/2006 86 29 3.64 9.20 -16.92 Shumagin Island WGOA 10/25/2006 86

101
Table A-2, continued.
30 3.53 9.08 -16.82 Shumagin Island WGOA 10/25/2006 86 31 3.17 7.63 -17.56 NW of Icy Bay EGOA 9/28/2006 64 32 3.63 7.86 -17.92 NW of Icy Bay EGOA 9/28/2006 64 33 3.30 8.17 -17.80 NW of Icy Bay EGOA 9/28/2006 64 34 3.32 8.22 -17.64 NW of Icy Bay EGOA 9/28/2006 64 35 3.24 8.76 -17.83 NW of Icy Bay EGOA 9/28/2006 64 36 3.27 8.70 -17.63 NW of Icy Bay EGOA 9/28/2006 64 37 3.36 8.15 -17.96 NW of Icy Bay EGOA 9/28/2006 64 38 3.14 8.69 -17.73 NW of Icy Bay EGOA 9/28/2006 64 39 3.32 8.53 -18.01 NW of Icy Bay EGOA 9/28/2006 64 40 3.40 8.21 -17.91 NW of Icy Bay EGOA 9/28/2006 64 41 3.16 9.10 -17.55 N of Lituya Bay EGOA 8/24/2006 73 42 3.24 9.55 -18.02 N of Lituya Bay EGOA 8/24/2006 73 43 3.19 9.83 -17.95 N of Lituya Bay EGOA 8/24/2006 73 44 3.17 9.51 -17.72 N of Lituya Bay EGOA 8/24/2006 73 45 3.08 9.44 -17.76 N of Lituya Bay EGOA 8/24/2006 73 46 3.26 9.58 -18.00 N of Lituya Bay EGOA 8/24/2006 73 47 3.19 9.16 -17.92 N of Lituya Bay EGOA 8/24/2006 73 48 3.29 9.34 -17.78 N of Lituya Bay EGOA 8/24/2006 73 49 3.17 8.80 -18.08 N of Lituya Bay EGOA 8/24/2006 73 50 3.30 8.87 -18.24 N of Lituya Bay EGOA 8/24/2006 73 51 3.47 8.66 -17.99 S of Yakutat Bay EGOA 9/5/2006 69 52 3.29 8.55 -17.94 S of Yakutat Bay EGOA 9/5/2006 69 53 3.39 8.55 -17.90 S of Yakutat Bay EGOA 9/5/2006 69 54 3.44 8.68 -18.07 S of Yakutat Bay EGOA 9/5/2006 69 55 3.48 8.79 -17.75 S of Yakutat Bay EGOA 9/5/2006 69 56 3.40 8.77 -17.80 S of Yakutat Bay EGOA 9/5/2006 69 57 3.44 8.92 -18.07 S of Yakutat Bay EGOA 9/5/2006 69 58 3.37 9.00 -17.99 S of Yakutat Bay EGOA 9/5/2006 69 59 3.43 8.83 -17.91 S of Yakutat Bay EGOA 9/5/2006 69 60 3.52 8.67 -17.96 S of Yakutat Bay EGOA 9/5/2006 69 61 3.52 8.55 -16.87 N Shumagin Island WGOA 10/28/2006 117 62 3.54 9.05 -17.04 N Shumagin Island WGOA 10/28/2006 117 63 3.36 8.84 -16.63 N Shumagin Island WGOA 10/28/2006 117 64 3.36 8.16 -16.71 N Shumagin Island WGOA 10/28/2006 117 65 3.37 8.85 -16.72 N Shumagin Island WGOA 10/28/2006 117 66 3.29 8.73 -16.57 N Shumagin Island WGOA 10/28/2006 117 67 3.23 8.39 -16.71 N Shumagin Island WGOA 10/28/2006 117 68 3.57 9.53 -16.97 N Shumagin Island WGOA 10/28/2006 117 69 3.43 8.98 -16.96 N Shumagin Island WGOA 10/28/2006 117 70 3.56 9.04 -16.66 N Shumagin Island WGOA 10/28/2006 117 71 3.41 8.42 -18.47 SW Kayak Island EGOA 7/3/2006 77 72 3.36 8.16 -18.40 SW Kayak Island EGOA 7/3/2006 77 73 3.37 8.17 -18.40 SW Kayak Island EGOA 7/3/2006 77

102
Table A-2, continued.
74 3.33 8.40 -18.59 SW Kayak Island EGOA 7/3/2006 77 75 3.31 8.40 -18.17 SW Kayak Island EGOA 7/3/2006 77 76 3.20 8.37 -18.23 SW Kayak Island EGOA 7/3/2006 77 77 3.34 8.54 -18.45 SW Kayak Island EGOA 7/3/2006 77 78 3.30 8.36 -18.44 SW Kayak Island EGOA 7/3/2006 77 79 3.47 8.46 -18.52 SW Kayak Island EGOA 7/3/2006 77 80 3.37 8.07 -18.58 SW Kayak Island EGOA 7/3/2006 77 81 3.63 10.88 -18.14 Bering Sea 2005 BS 12/23/2005 95 82 3.43 10.62 -17.51 Bering Sea 2005 BS 12/23/2005 95 83 3.40 11.26 -17.46 Bering Sea 2005 BS 12/23/2005 95 84 3.53 10.74 -17.51 Bering Sea 2005 BS 12/23/2005 95 85 3.40 11.08 -17.39 Bering Sea 2005 BS 12/23/2005 95 86 3.32 10.46 -17.29 Bering Sea 2005 BS 12/23/2005 95 87 3.36 10.15 -17.31 Bering Sea 2005 BS 12/23/2005 95 88 3.51 10.56 -17.49 Bering Sea 2005 BS 12/23/2005 95 89 3.42 10.65 -17.38 Bering Sea 2005 BS 12/23/2005 95 90 3.36 10.34 -17.50 Bering Sea 2005 BS 12/23/2005 95 91 3.27 8.85 -18.28 S of Icy Bay 2005 EGOA 10/1/2005 68 92 3.25 9.14 -18.31 S of Icy Bay 2006 EGOA 10/1/2005 68 93 3.29 8.83 -18.05 S of Icy Bay 2007 EGOA 10/1/2005 68 94 3.43 8.90 -18.03 S of Icy Bay 2008 EGOA 10/1/2005 68 95 3.24 9.14 -18.10 S of Icy Bay 2009 EGOA 10/1/2005 68 96 3.46 8.77 -18.35 S of Icy Bay 2010 EGOA 10/1/2005 68 97 3.34 8.75 -17.83 S of Icy Bay 2011 EGOA 10/1/2005 68 98 3.39 8.94 -17.84 S of Icy Bay 2012 EGOA 10/1/2005 68 99 3.29 8.97 -18.26 S of Icy Bay 2013 EGOA 10/1/2005 68
100 3.32 8.85 -18.01 S of Icy Bay 2014 EGOA 10/1/2005 68 101 3.70 8.76 -17.79 NE District Kodiak CGOA 11/1/2006 91 102 3.67 8.38 -17.48 NE District Kodiak CGOA 11/1/2006 91 103 3.43 8.68 -17.73 NE District Kodiak CGOA 11/1/2006 91 104 3.40 8.22 -17.69 NE District Kodiak CGOA 11/1/2006 91 105 3.47 10.11 -17.61 NE District Kodiak CGOA 11/1/2006 91 106 3.44 9.00 -17.55 NE District Kodiak CGOA 11/1/2006 91 107 3.60 8.04 -17.98 NE District Kodiak CGOA 11/1/2006 91 108 3.51 7.89 -17.96 NE District Kodiak CGOA 11/1/2006 91 109 3.70 8.51 -17.51 NE District Kodiak CGOA 11/1/2006 91 110 3.54 8.40 -17.52 NE District Kodiak CGOA 11/1/2006 91

103
General Conclusions
Relatively high spiny dogfish biomass estimates and anecdotal evidence from
fishing communities has provided an impetus for this and other studies investigating the
biology of spiny dogfish in the Gulf of Alaska (GOA). Although, trends in spiny dogfish
biomass estimates remain unclear, it is apparent there is an urgent need to acquire a better
understanding about life-history patterns and parameters of this species in the GOA. This
study was initiated to explore the feeding ecology of spiny dogfish using stable isotope
techniques in order to elucidate their trophic role in the GOA and therefore better
understand potential impacts of this species on the GOA ecosystem through trophic
connections.
In Chapter 1, my initial work on spiny dogfish, I demonstrated that large-scale
geographic variation exists in both carbon and nitrogen stable isotopes of spiny dogfish
muscle. These results led me to conclude that spiny dogfish are capable of occupying a
variety of habitat niches in both pelagic and nearshore environments and may feed at
higher trophic positions (TPs) in some of these nearshore habitats. However, these results
were based on only small sample sizes (n = 60) and were mostly males (n = 50). In
addition, there was no information available on the baseline variability of stable isotopes
throughout the study area, so any conclusions on the TP of spiny dogfish by region have
to be viewed with caution.
It was apparent that in order to examine differences in TP among regions, a better
understanding of the underlying baseline variability in stable nitrogen isotopes had to be
analyzed. As part of Chapter 2, I collected weathervane scallops (Patinopecten caurinus)

104
a primary consumer in the GOA to adjust the TP of spiny dogfish. In the GOA, I found
that although variability existed within some regions mean values were not significantly
different between the western, central, and eastern GOA. Therefore in the GOA,
differences among spiny dogfish nitrogen stable isotope values were interpreted as
representing actual difference in their TPs.
Based on results from my initial work, I also expanded my sampling to include
spiny dogfish males (n = 186) and females (n = 305) from a broader geographical range
in the GOA (western Kodiak to British Columbia) and a larger range in lengths (i.e., 52
to 113 cm). I found differences in TPs of spiny dogfish from different regions of the
GOA, providing stronger evidence that spiny dogfish are flexible in their feeding
behavior and are capable of feeding at higher or lower TPs in different parts of their
geographic range. Specifically, spiny dogfish fed at a higher TP in the Kodiak area, while
they fed at a lower TP at sites in the eastern GOA (i.e., Prince William Sound,
northeastern GOA shelf, and Yakutat Inlet). Evidence from our lipid-normalized δ13C’
values suggests that spiny dogfish in Kodiak may utilize nearshore or benthic habitats
slightly more intensively than spiny dogfish in the eastern GOA. Therefore, the width of
the continental shelf may be contributing to the TP at which spiny dogfish feed because
the shelf surrounding Kodiak Island is wider than the narrower shelf in the eastern GOA.
In addition, spiny dogfish increase their TP as they increase in length. This
ontogenetic change in TP associated with diet changes was found at all sites explored in
this study demonstrating a common and widespread trait in the feeding ecology of spiny
dogfish (Jones and Geen 1977; Alonso et al. 2002; Tribuzio 2010). For the length ranges

105
I explored, I found an increase of almost a full TP. Thus, spiny dogfish at the lower end
of the length examined may be feeding on lower TP organisms (e.g., euphausiids) while
those at the upper length may focus on forage fishes (e.g., Pacific herring (Clupea
pallasii). Furthermore, males and females of similar sizes appear to have very similar TPs
in the northeastern Pacific Ocean.
The results of this study help increase our understanding of the trophic role of
spiny dogfish in the GOA. Size-based ontogenetic changes in diet appear to be important
factors and should be incorporated into mass balance food-web models (e.g., Ecopath) to
provide more realistic output. The sex of spiny dogfish on the other hand, appeared to be
less important for feeding patterns. Also, we observed notable differences in the TP of
spiny dogfish by geographic regions. While not fully understood at the moment, these
geographical differences are important and should be further investigated. My research
demonstrates that the combination of stable isotope analysis, together with some of the
statistical methods used here, could be applied to elucidate the trophic role of other fishes
in the GOA and may lead to the improvement of our understanding of this complex
ecosystem and its food-webs.
References
Alonso, M. K., E. A. Crespo, N. A. Garcia, S. N. Pedraza, P. A. Mariotti, and N. J. Mora.
2002. Fishery and ontogenetic driven changes in the diet of the spiny dogfish,
Squalus acanthias, in Patagonian waters, Argentina. Environmental Biology of
Fishes 63(2):193-202.

106
Jones, B. C., and G. H. Geen. 1977. Food and feeding of spiny dogfish (Squalus
acanthias) in British Columbia waters. Journal of the Fisheries Research Board of
Canada 34(11):2067-2078.
Tribuzio, C. A. 2010. Life history, demography, and ecology of the spiny dogfish
(Squalus acanthias) in the Gulf of Alaska. Doctoral dissertation. University of
Alaska Fairbanks, Fairbanks.