Embed Size (px)
Citation preview
Variation in the Care of Surgical Conditions:Spinal Stenosis
A Dartmouth Atlas of Health Care Series

Variation in the Care of Surgical Conditions: Spinal StenosisA Dartmouth Atlas of Health Care Series
DEPARTMENT OF SURGERY
The Dartmouth Institute of Health Policy & Clinical Practice and Dartmouth-Hitchcock Medical Center
Brook I. Martin, PhD, MPHAnna N.A. Tosteson, ScDJon D. Lurie, MD, MSSohail K. Mirza, MD, MPH
The Dartmouth Institute of Health Policy & Clinical Practice
Philip R. Goodney, MD, MSNino Dzebisashvili, PhDDavid C. Goodman, MD, MSKristen K. Bronner, MA
A DARTMOUTH ATLAS OF HEALTH CARE SERIES I

A DARTMOUTH ATLAS OF HEALTH CARE SERIES III
Table of Contents
Foreword ............................................................................................................................................................. v
Introduction ......................................................................................................................................................... 1Variation in decision-making for surgical conditions ...........................................................................................................2New developments that have influenced surgical decision-making ....................................................................................4Challenges to improving surgical decision-making and the goals of this series .................................................................6Influencing the key decision-makers: Patients, primary care physicians, surgeons, and policymakers ..............................8References ........................................................................................................................................................................10
Back pain in the United States ........................................................................................................................ 11Before surgery ..................................................................................................................................................................13
Patient decisions about back pain: challenges in treatment choices ............................................................................................. 13Non-surgical options for the treatment of spinal stenosis .............................................................................................................. 15
During surgery ..................................................................................................................................................................16Older treatments or newer methods? Trends and geographic variation in surgical treatments for spinal stenosis ....................... 16
After surgery .....................................................................................................................................................................20Complications ................................................................................................................................................................................ 20
Beyond surgery .................................................................................................................................................................24The need for shared decision-making ........................................................................................................................................... 24Conclusions ................................................................................................................................................................................... 25
Methods ............................................................................................................................................................................26References ........................................................................................................................................................................35

Foreword
The new Dartmouth Atlas series on variation in the care of surgical conditions, including this report on the surgical treatment of back pain resulting from spinal stenosis, raises new questions regarding surgical management of both common and less frequently occurring medical conditions. This report carefully details the issues surrounding spinal stenosis, including the physical and economic burden, the difficulties of obtaining a definitive diagnosis, and patient decision-making, and, as in previous Atlas analyses, emphasizes geographic practice variation in surgical treatment rates. However, the report also takes a more longitudinal view. The changes over time in which procedure is favored to treat back pain and spinal stenosis are particularly fascinating, driven as they appear to be by a mix of clinical evidence—including emerging long-term results—and physicians’ opinions and personal experience. Registries and clinical trials should go a long way toward producing the kind of widely applicable data upon which patient decision support tools should be based. Patients want to know procedure and facility-based risks and benefits. Just as the future of medicine is personalization of diagnosis and treatment, so too the future of decision support is to increasingly provide information tailored to the person and his or her health care environment. Ultimately, it is the active participation of fully informed patients that can address the question of “which rate is right,” so provocatively posed by the Dartmouth Atlas analyses. I look forward to future analyses targeting other common, preference-sensitive interventions, where reports such as this can highlight opportunities for improvement.
Michael J. Barry, M.D.
President, Informed Medical Decisions FoundationClinical Professor of Medicine, Harvard Medical School
A DARTMOUTH ATLAS OF HEALTH CARE SERIES v

A DARTMOUTH ATLAS OF HEALTH CARE SERIES 1
Variation in the Care of Surgical ConditionsA Dartmouth Atlas of Health Care Series
Introduction
Twenty-first century surgery is among the great accomplishments of medicine. Sur-geons have led some of the most important improvements in care quality, safety, and efficiency. Surgical methods are now highly effective for some of the most serious and previously intractable medical conditions, ranging from arthrosclerosis to obesity to chronic back pain. Today, surgical procedures work better and entail lower risk, less pain, and less time in the hospital.
As the scope and quality of surgical care continues to advance, there is still much that remains to be done to optimize care for patients. For many conditions, surgery is one of several care options, and in some instances, there are several types of surgical procedures available. Research into the effectiveness and adverse effects of a surgical procedure compared to alternatives is often incomplete. While qual-ity has generally improved over time, outcomes can differ across hospitals and surgeons. Too often, treatment options, whether medical or surgical, are recom-mended without patients fully understanding the choices and participating in the decision; and these recommendations can vary markedly from one physician to the next. Finally, the costs of care continue to rise and often differ across health care systems, even the most reputable and prestigious. Why can the “best” surgical care at one academic medical center cost twice as much as another?
This Dartmouth Atlas of Health Care series reports on unwarranted regional varia-tion in the care of several conditions for which surgery is one important treatment option. Unwarranted variation is the differences in care that are not explained by patient needs or preferences. Each report begins with an examination of the underlying condition, the available treatment options before surgery, and the role of shared decision-making. The care during surgery is then presented, including aspects of quality, risks, and costs. The next section is concerned with the care of patients after surgery, including hospital readmissions and ambulatory care.
The bottom line is that the greatest promise of surgery still lies before us. These reports show that quality is often excellent, but not in all places. Variation in surgical rates is high and represents both gaps in outcomes research and poor patient deci-sion quality. Outcomes differ from place to place even when controlling for patient differences. The opportunities for better and more efficient care are substantial and will require renewed efforts in research and clinical quality improvement.
A Dartmouth Atlas of Health Care Series
2 vARIATION IN THE CASE OF SURGICAL CONDITIONS
Variation in decision-making for surgical conditions
Experienced leaders and educators in surgery often emphasize to their trainees and students that performing an operation is easy: choosing the right patients for surgery is much more difficult. Over the last decade, important changes have occurred related to how surgeons and patients decide whether, when, where, and how to best perform surgery. In the past, surgeons commonly played a paternalistic role, and many surgeons made decisions for their patients, relying on their own training and experience.
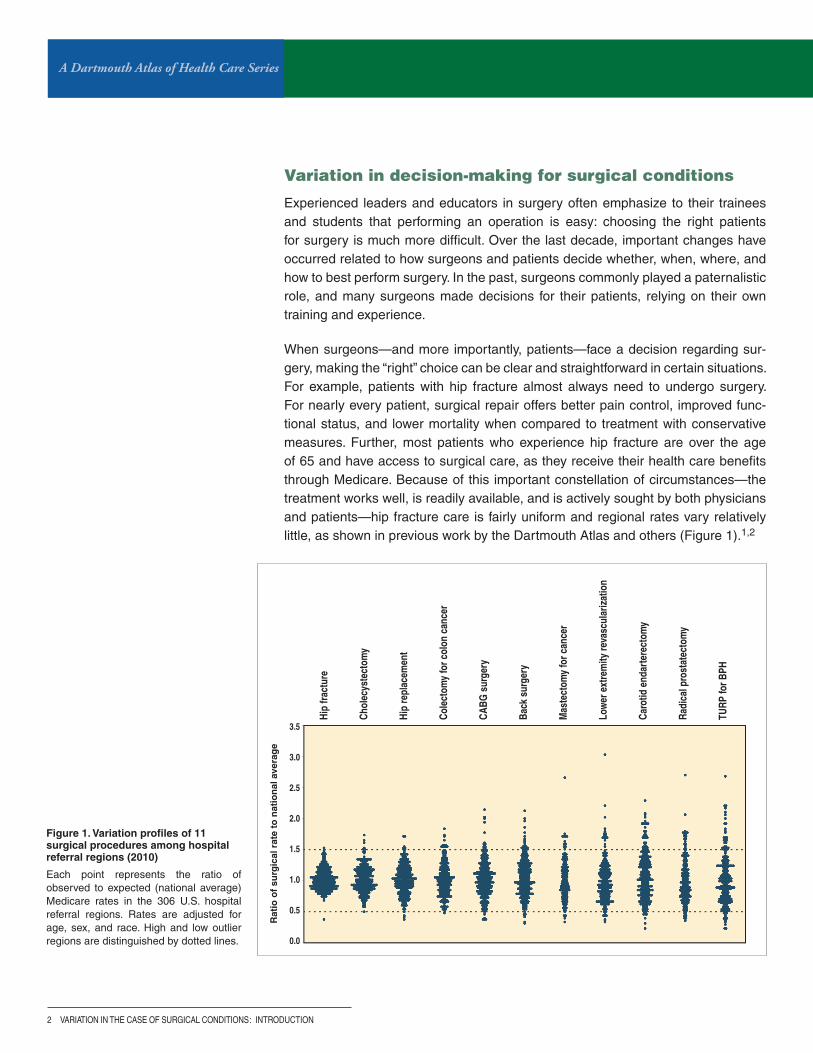
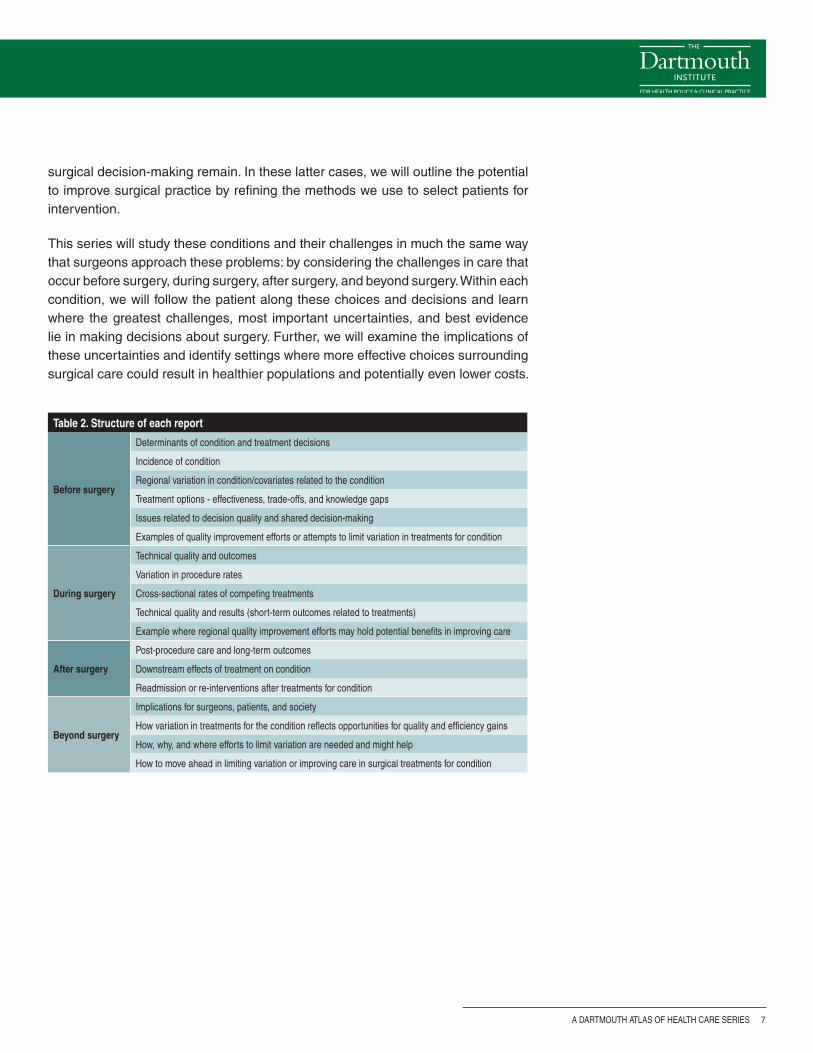
When surgeons—and more importantly, patients—face a decision regarding sur-gery, making the “right” choice can be clear and straightforward in certain situations. For example, patients with hip fracture almost always need to undergo surgery. For nearly every patient, surgical repair offers better pain control, improved func-tional status, and lower mortality when compared to treatment with conservative measures. Further, most patients who experience hip fracture are over the age of 65 and have access to surgical care, as they receive their health care benefits through Medicare. Because of this important constellation of circumstances—the treatment works well, is readily available, and is actively sought by both physicians and patients—hip fracture care is fairly uniform and regional rates vary relatively little, as shown in previous work by the Dartmouth Atlas and others (Figure 1).1,2
Figure 1. Variation profiles of 11 surgical procedures among hospital referral regions (2010)
Each point represents the ratio of observed to expected (national average) Medicare rates in the 306 U.S. hospital referral regions. Rates are adjusted for age, sex, and race. High and low outlier regions are distinguished by dotted lines.
: INTRODUCTION
Rat
io o
f su
rgic
al r
ate
to n
atio
nal
ave
rag
e
Hip
fract
ure
Chol
ecys
tect
omy
Hip
repl
acem
ent
Cole
ctom
y fo
r col
on c
ance
r
CABG
sur
gery
Back
sur
gery
Mas
tect
omy
for c
ance
r
Low
er e
xtre
mity
reva
scul
ariz
atio
n
Caro
tid e
ndar
tere
ctom
y
Radi
cal p
rost
atec
tom
y
TURP
for B
PH3.5
3.0
2.5
2.0
1.5
1.0
0.5
0.0
A DARTMOUTH ATLAS OF HEALTH CARE SERIES 3
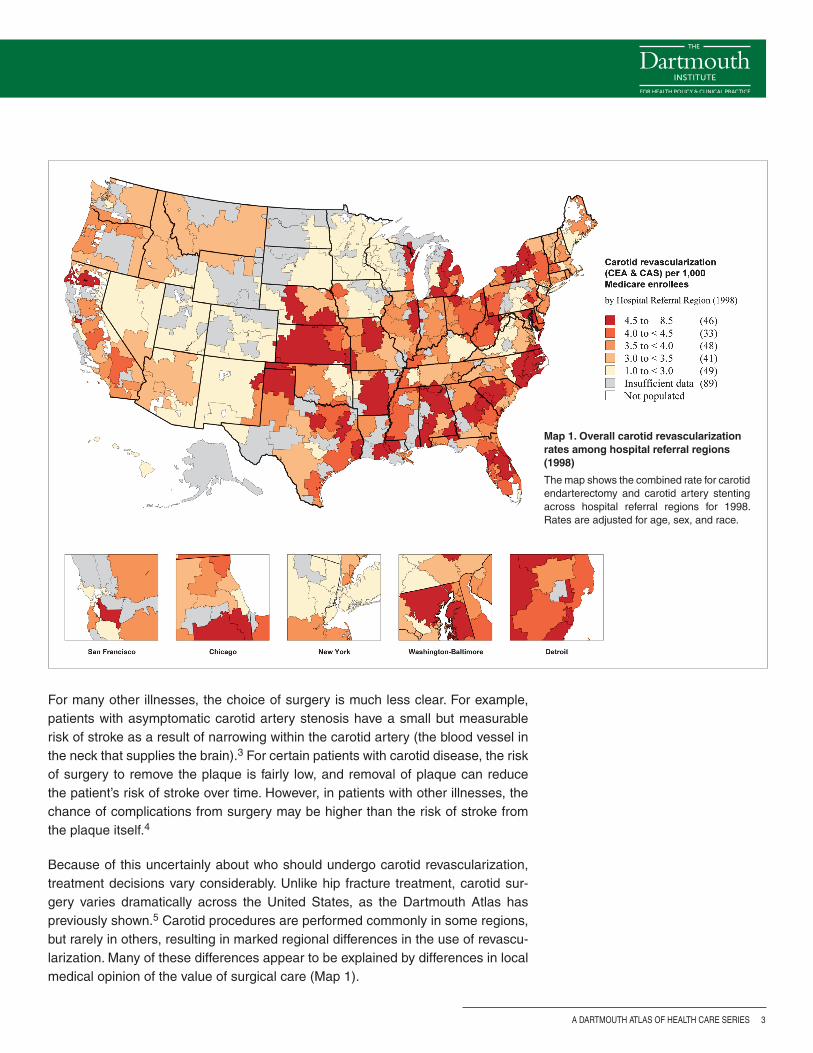
For many other illnesses, the choice of surgery is much less clear. For example, patients with asymptomatic carotid artery stenosis have a small but measurable risk of stroke as a result of narrowing within the carotid artery (the blood vessel in the neck that supplies the brain).3 For certain patients with carotid disease, the risk of surgery to remove the plaque is fairly low, and removal of plaque can reduce the patient’s risk of stroke over time. However, in patients with other illnesses, the chance of complications from surgery may be higher than the risk of stroke from the plaque itself.4
Because of this uncertainly about who should undergo carotid revascularization, treatment decisions vary considerably. Unlike hip fracture treatment, carotid sur-gery varies dramatically across the United States, as the Dartmouth Atlas has previously shown.5 Carotid procedures are performed commonly in some regions, but rarely in others, resulting in marked regional differences in the use of revascu-larization. Many of these differences appear to be explained by differences in local medical opinion of the value of surgical care (Map 1).
Map 1. Overall carotid revascularization rates among hospital referral regions (1998)
The map shows the combined rate for carotid endarterectomy and carotid artery stenting across hospital referral regions for 1998. Rates are adjusted for age, sex, and race.
A Dartmouth Atlas of Health Care Series
4 vARIATION IN THE CASE OF SURGICAL CONDITIONS
New developments that have influenced surgical decision-making
How can surgeons and patients make the best decisions? In the past, many inves-tigators reasoned that the surgeons who achieved the best results were likely to have the largest practices, and using this seemingly simple metric would ensure that patients received good surgical care. However, this assumption ignored the fact that it is difficult for surgeons to know who really achieves the “best” results. Many outcomes (such as death after carotid surgery) occur uncommonly, and a single surgeon has little ability to compare his or her results to those of other surgeons.
Given this challenge, over the last two decades, efforts to organize, measure, and improve results in surgical practice via quality improvement initiatives have developed, despite substantial obstacles. Patterns of surgical practice vary broadly across different regions of the United States, making it challenging to study and compare patients and outcomes. Further, the process of collecting, studying, and improving surgical outcomes represented a formidable challenge a decade ago, when most medical information lived in paper records, arranged in leaning stacks of bulging charts.
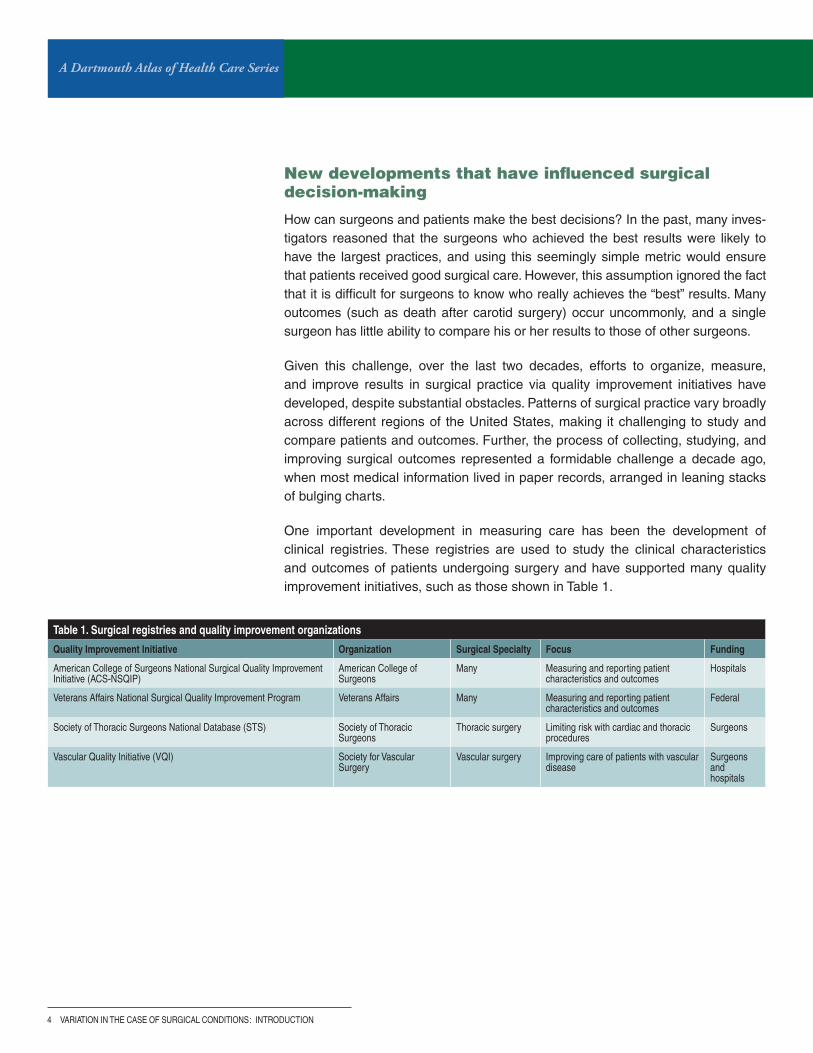
One important development in measuring care has been the development of clinical registries. These registries are used to study the clinical characteristics and outcomes of patients undergoing surgery and have supported many quality improvement initiatives, such as those shown in Table 1.
Table 1. Surgical registries and quality improvement organizations
Quality Improvement Initiative Organization Surgical Specialty Focus Funding
American College of Surgeons National Surgical Quality Improvement Initiative (ACS-NSQIP)
American College of Surgeons
Many Measuring and reporting patient characteristics and outcomes
Hospitals
veterans Affairs National Surgical Quality Improvement Program veterans Affairs Many Measuring and reporting patient characteristics and outcomes
Federal
Society of Thoracic Surgeons National Database (STS) Society of Thoracic Surgeons
Thoracic surgery Limiting risk with cardiac and thoracic procedures
Surgeons
vascular Quality Initiative (vQI) Society for vascular Surgery
vascular surgery Improving care of patients with vascular disease
Surgeons and hospitals
: INTRODUCTION
A DARTMOUTH ATLAS OF HEALTH CARE SERIES 5
Uncertainty regarding benefits
and risks of surgery
Information for patients and surgeons
to guide decisions
Uncertainty regarding benefits
and risks of surgery
Information for patients and surgeons
to guide decisions
Variation in surgical decisions: AFTER the evolution of registries, etc.
Variation in surgical decisions: BEFORE the evolution of registries, etc.
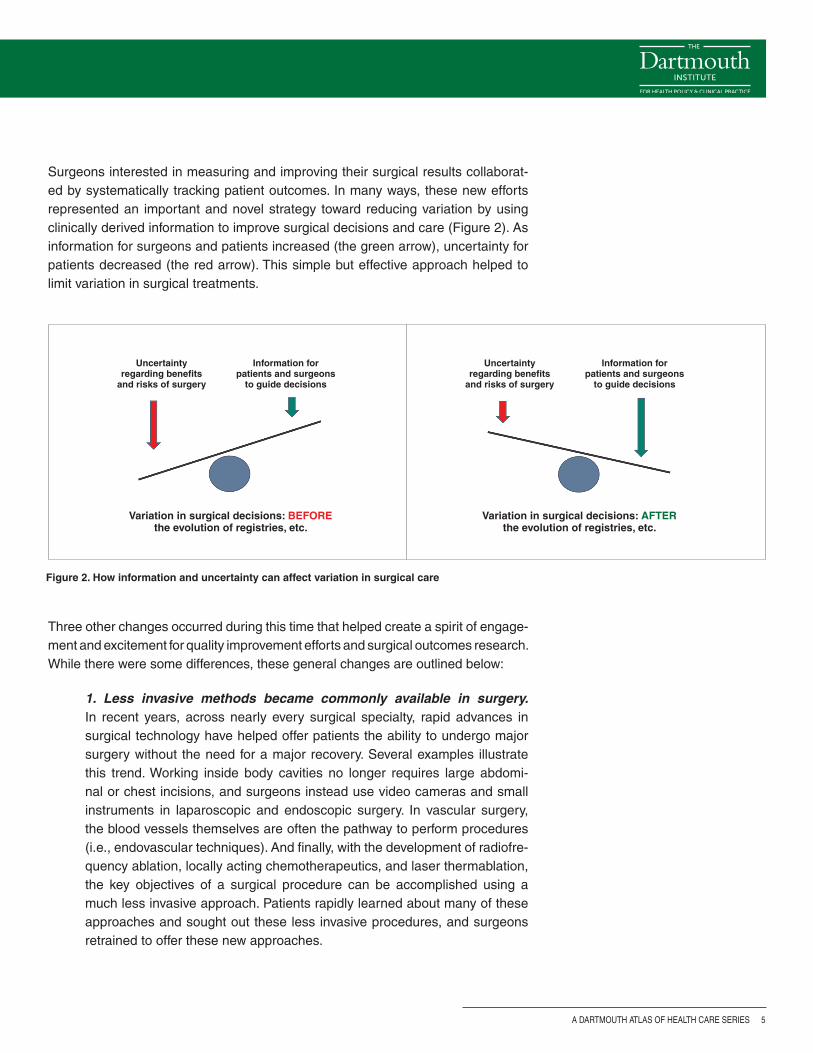
Surgeons interested in measuring and improving their surgical results collaborat-ed by systematically tracking patient outcomes. In many ways, these new efforts represented an important and novel strategy toward reducing variation by using clinically derived information to improve surgical decisions and care (Figure 2). As information for surgeons and patients increased (the green arrow), uncertainty for patients decreased (the red arrow). This simple but effective approach helped to limit variation in surgical treatments.
Figure 2. How information and uncertainty can affect variation in surgical care
Three other changes occurred during this time that helped create a spirit of engage-ment and excitement for quality improvement efforts and surgical outcomes research. While there were some differences, these general changes are outlined below:
1. Less invasive methods became commonly available in surgery. In recent years, across nearly every surgical specialty, rapid advances in surgical technology have helped offer patients the ability to undergo major surgery without the need for a major recovery. Several examples illustrate this trend. Working inside body cavities no longer requires large abdomi-nal or chest incisions, and surgeons instead use video cameras and small instruments in laparoscopic and endoscopic surgery. In vascular surgery, the blood vessels themselves are often the pathway to perform procedures (i.e., endovascular techniques). And finally, with the development of radiofre-quency ablation, locally acting chemotherapeutics, and laser thermablation, the key objectives of a surgical procedure can be accomplished using a much less invasive approach. Patients rapidly learned about many of these approaches and sought out these less invasive procedures, and surgeons retrained to offer these new approaches.
A Dartmouth Atlas of Health Care Series
6 vARIATION IN THE CASE OF SURGICAL CONDITIONS
2. Surgeons learned about data management and quality improvement. In places like Northern New England,6,7 the Veterans Administration,8 and others,9 leaders in surgical outcomes assessment built the systems neces-sary to study and improve surgical care. These regional and national quality improvement efforts grew to become the infrastructure that allowed surgeons and patients to know when, how, where, and why surgical procedures were being performed. These initiatives set the stage for an emphasis on achiev-ing the best outcomes.
3. Surgeons, patients, and payers put a new emphasis on measuring and reporting. Armed with gigabytes of data and advanced analytic sys-tems, surgeons were now able to quickly analyze their outcomes. The ability to determine the structural and process measures associated with the best outcomes allowed surgeons new insights into what works and what does not. For example, surgeons used information from studies based on registries to demonstrate the benefits of processes of care, such as perioperative antibi-otic administration, or of evolving procedures, such as bariatric surgery for patients with morbid obesity. Payers’ and patients’ expectations grew; they demanded the best operation, at the right time, with the highest quality.
Challenges to improving surgical decision-making and the goals of this series
Of course, several challenges accompanied these new developments. Who will pay for continued efforts to organize and measure surgical practice? How should results be shared and compared, especially among competitors? Would efforts to use the newest, latest, or most profitable device win out over the goal of improving quality and efficiency? Would surgeons, a group steeped in tradition and often slow to change, adopt these new approaches?
These questions have different answers in different settings. In some cases, such as in coronary bypass surgery, cardiac surgeons adopted outcomes assessment and quality improvement broadly, quickly, and enthusiastically. However, in other settings, such as surgery for prostate cancer or lower extremity vascular disease, efforts toward quality measurement and outcomes assessment have been taken up more slowly, and the impact of these initiatives remains less striking.
Why might some surgeons improve their decisions using these new strategies while other surgeons choose not to try these approaches? In this series of reports, we will use several examples to illustrate the challenges. We will describe, across a broad spectrum of conditions, advances in surgical decision-making, including shared decision-making, which have resulted in less variation in care, improved patient satisfaction, and better outcomes. We will also describe settings wherein these strategies have been less successful, and variations in surgery rates and
: INTRODUCTION
A DARTMOUTH ATLAS OF HEALTH CARE SERIES 7
Table 2. Structure of each report
Before surgery
Determinants of condition and treatment decisions
Incidence of condition
Regional variation in condition/covariates related to the condition
Treatment options - effectiveness, trade-offs, and knowledge gaps
Issues related to decision quality and shared decision-making
Examples of quality improvement efforts or attempts to limit variation in treatments for condition
During surgery
Technical quality and outcomes
variation in procedure rates
Cross-sectional rates of competing treatments
Technical quality and results (short-term outcomes related to treatments)
Example where regional quality improvement efforts may hold potential benefits in improving care
After surgery
Post-procedure care and long-term outcomes
Downstream effects of treatment on condition
Readmission or re-interventions after treatments for condition
Beyond surgery
Implications for surgeons, patients, and society
How variation in treatments for the condition reflects opportunities for quality and efficiency gains
How, why, and where efforts to limit variation are needed and might help
How to move ahead in limiting variation or improving care in surgical treatments for condition
surgical decision-making remain. In these latter cases, we will outline the potential to improve surgical practice by refining the methods we use to select patients for intervention.
This series will study these conditions and their challenges in much the same way that surgeons approach these problems: by considering the challenges in care that occur before surgery, during surgery, after surgery, and beyond surgery. Within each condition, we will follow the patient along these choices and decisions and learn where the greatest challenges, most important uncertainties, and best evidence lie in making decisions about surgery. Further, we will examine the implications of these uncertainties and identify settings where more effective choices surrounding surgical care could result in healthier populations and potentially even lower costs.
A Dartmouth Atlas of Health Care Series
8 vARIATION IN THE CASE OF SURGICAL CONDITIONS
Influencing the key decision-makers: Patients, primary care physicians, surgeons, and policymakers
In the past, when it came to making a decision about surgery, the surgeon’s recom-mendation was considered the most important opinion. His or her perspective was often critical in determining the use of a particular surgical procedure, especially for “preference-sensitive” care: care for conditions where there is no single “right” rate for every population or patient.
Current models of care suggest that better outcomes occur when full information about treatment options is shared with patients, who are then assisted in sharing the decision with the physician. This information often needs to come not only from surgeons, but also from primary care physicians who help patients choose among the different options, each with their likely outcomes and trade-offs. (For more information about patient-centered medical decision-making, please visit the Dartmouth Center for Informed Choice at http://tdi.dartmouth.edu/research/engaging/informed-choice and the Informed Medical Decisions Foundation at www.informedmedicaldecisions.org). In addition to reaching patients, the best information needs to reach policymakers who make decisions about how we spend our health care dollars, such that our resources provide the most effective care for patients with surgical conditions.
: INTRODUCTION
Shared Decision-Making
Dale Collins Vidal, MDProfessor of Surgery, Geisel School of Medicine; Director, Center for Shared Decision Making, Dartmouth-Hitchcock
Much of the striking variation in the use of surgical procedures reported in this Dartmouth Atlas series can be attributed to differing physi-cian opinions about the value of one surgery over another, or a single surgical option compared to other treatments such as medication, active surveillance, or physical therapy. Each option can have different potential benefits as well as short and long-term side effects. For a given condition, any of the options may be a reasonable alternative. The decision is often further complicated by incomplete evidence regarding both benefit and harm.
It is particularly important to note that many informed patients have different perspectives than their physicians about the benefits and trade-offs of treatment options. The final choice of treatment should be made by patients who have been informed about the choices, including the pros and cons of each approach and any uncertainty about the evidence that supports each option. In addition, the health care team needs to help patients clarify their own goals and partner with patients to make joint decisions.
This process of engaging patients in decisions about their care is known as shared decision-making. Shared decision-making is a col-laborative process that allows patients and their providers to make health care treatment decisions together, taking into account the best scientific evidence available, as well as the patient’s values and preferences. The right choice for one patient may not be the same as the next. In this series, Dartmouth Atlas investigators will consider many clinical situations where there is no single “right” choice and highlight areas where shared decision-making may have an important role for patients with surgical conditions.
A DARTMOUTH ATLAS OF HEALTH CARE SERIES 9
In summary, this series of Atlas reports is intended to help patients, physicians, and policymakers recognize where improvements in science have helped to limit variation and improve surgical care; but more importantly, for each of the surgical conditions we study, we hope to identify specific clinical settings and situations where variation in the treatment of surgical condition remains, and outline the best opportunities for improvement in surgical care that lie ahead.
A Dartmouth Atlas of Health Care Series
10 vARIATION IN THE CASE OF SURGICAL CONDITIONS
References1. Wennberg DE, Birkmeyer JD, eds. The Dartmouth Atlas of Cardiovascular Health Care. American Hospital
Press, Chicago, IL: 1999.
2. Birkmeyer JD, Sharp SM, Finlayson SR, Fisher ES, Wennberg JE. Variation profiles of common surgical procedures. Surgery. 1998;124:917-923.
3. Endarterectomy for asymptomatic carotid artery stenosis. Executive Committee for the Asymptomatic Carotid Atherosclerosis Study. JAMA. 1991;273:1421-1428.
4. Wallaert JB, De Martino RR, Finlayson SR, Walsh DB, Corriere MA, Stone DH, Cronenwett JL, Goodney PP. Carotid endarterectomy in asymptomatic patients with limited life expectancy. Stroke. 2012;43:1781-1787.
5. Goodney PP, Travis LL, Malenka D, Bronner KK, Lucas FL, Cronenwett JL, Goodman DC, Fisher ES. Regional variation in carotid artery stenting and endarterectomy in the Medicare population. Circ Cardiovasc Qual Outcomes. 2010;3:15-24.
6. O’Connor GT, Plume SK, Olmstead EM, Coffin LH, Morton JR, Maloney CT, Nowicki ER, Tryzelaar JF, Hernandez F, Adrian L, et al. A regional prospective study of in-hospital mortality associated with coronary artery bypass grafting. The Northern New England Cardiovascular Disease Study Group. JAMA. 1991;266:803-809.
7. Cronenwett JL, Likosky DS, Russell MT, Eldrup-Jorgensen J, Stanley AC, Nolan BW. A regional registry for quality assurance and improvement: The Vascular Study Group of Northern New England (VSGNNE). J Vasc Surg. 2007;46:1093-1101.
8. Khuri SF, Daley J, Henderson W, Hur K, Demakis J, Aust JB, Chong V, Fabri PJ, Gibbs JO, Grover F, Hammermeister K, Irvin G, 3rd, McDonald G, Passaro E, Jr., Phillips L, Scamman F, Spencer J, Stremple JF. The Department of Veterans Affairs’ NSQIP: The first national, validated, outcome-based, risk-adjusted, and peer-controlled program for the measurement and enhancement of the quality of surgical care. National VA Surgical Quality Improvement Program. Annals of Surgery. 1998;228:491-507.
9. Flum DR, Fisher N, Thompson J, Marcus-Smith M, Florence M, Pellegrini CA. Washington state’s approach to variability in surgical processes/outcomes: Surgical Clinical Outcomes Assessment Program (SCOAP). Surgery. 2005;138:821-828.
: INTRODUCTION
A DARTMOUTH ATLAS OF HEALTH CARE SERIES 11
Back pain in the United States
Back pain is a leading cause of morbidity and disability in the United States.1 It is estimated that up to 80% of people will experience low back pain at some point during their lifetimes.2,3 At any given point in time, about 26% of U.S. adults have low back pain, and 14% have neck pain.4,5 Back pain that lasts at least two weeks occurs in 13.8% of the U.S. population annually, accounting for 2-3% of all physi-cian visits, and is the second most common reason for hospitalizations.4,6-8
About 30 million people in the United States receive professional medical care for a spine problem each year.9 The prevalence of back pain under treatment remained stable from 1997 to 2005 and then declined slightly between 2006 and 2008, pos-sibly due to a decrease in the use of elective procedures during the economic recession.9,10 However, while the prevalence of back pain has remained fairly sta-ble over time, the percentage of patients who describe their back pain as “chronic” has increased, from less than 5% in 1992 to more than 10% of all patients with back pain in 2006.11,12
Economic burden of low back pain
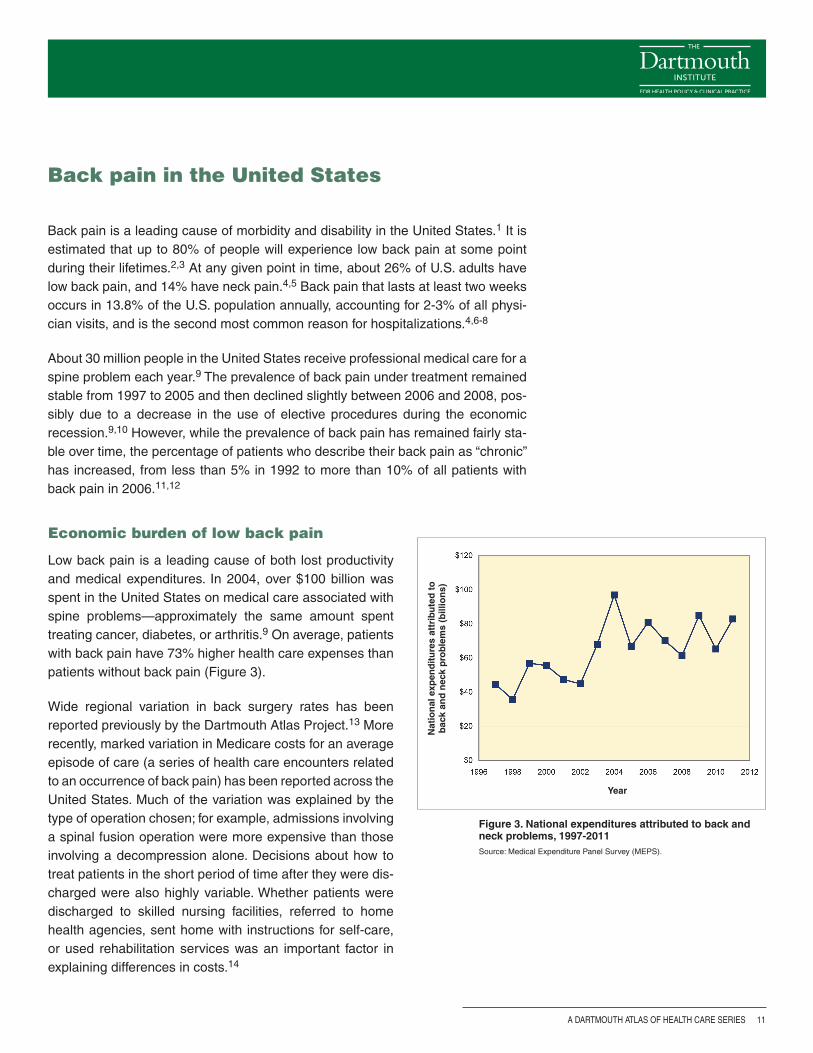
Low back pain is a leading cause of both lost productivity and medical expenditures. In 2004, over $100 billion was spent in the United States on medical care associated with spine problems—approximately the same amount spent treating cancer, diabetes, or arthritis.9 On average, patients with back pain have 73% higher health care expenses than patients without back pain (Figure 3).
Wide regional variation in back surgery rates has been reported previously by the Dartmouth Atlas Project.13 More recently, marked variation in Medicare costs for an average episode of care (a series of health care encounters related to an occurrence of back pain) has been reported across the United States. Much of the variation was explained by the type of operation chosen; for example, admissions involving a spinal fusion operation were more expensive than those involving a decompression alone. Decisions about how to treat patients in the short period of time after they were dis-charged were also highly variable. Whether patients were discharged to skilled nursing facilities, referred to home health agencies, sent home with instructions for self-care, or used rehabilitation services was an important factor in explaining differences in costs.14
Figure 3. National expenditures attributed to back and neck problems, 1997-2011Source: Medical Expenditure Panel Survey (MEPS).
Year
Nat
ion
al e
xpen
dit
ure
s at
trib
ute
d t
o
bac
k an
d n
eck
pro
ble
ms
(bill
ion
s)
A Dartmouth Atlas of Health Care Series
12 vARIATION IN THE CASE OF SURGICAL CONDITIONS: SPINAL STENOSIS
A focus on lumbar spinal stenosis
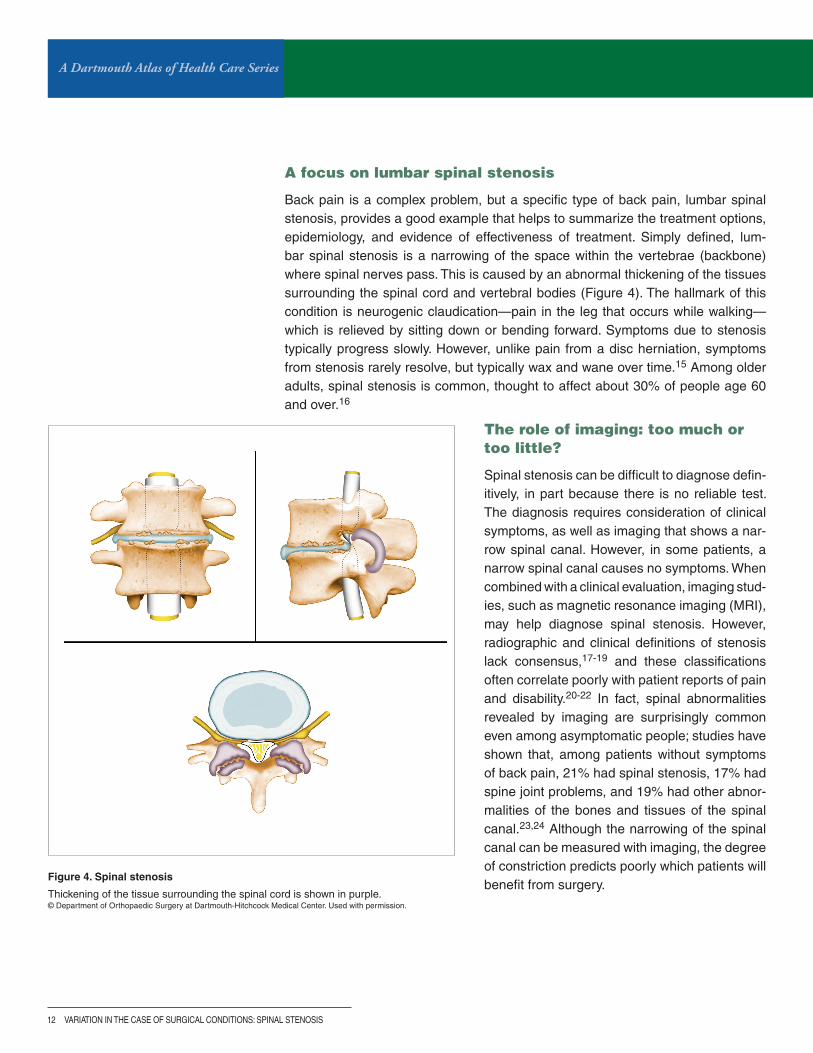
Back pain is a complex problem, but a specific type of back pain, lumbar spinal stenosis, provides a good example that helps to summarize the treatment options, epidemiology, and evidence of effectiveness of treatment. Simply defined, lum-bar spinal stenosis is a narrowing of the space within the vertebrae (backbone) where spinal nerves pass. This is caused by an abnormal thickening of the tissues surrounding the spinal cord and vertebral bodies (Figure 4). The hallmark of this condition is neurogenic claudication—pain in the leg that occurs while walking—which is relieved by sitting down or bending forward. Symptoms due to stenosis typically progress slowly. However, unlike pain from a disc herniation, symptoms from stenosis rarely resolve, but typically wax and wane over time.15 Among older adults, spinal stenosis is common, thought to affect about 30% of people age 60 and over.16
Figure 4. Spinal stenosis
Thickening of the tissue surrounding the spinal cord is shown in purple.© Department of Orthopaedic Surgery at Dartmouth-Hitchcock Medical Center. Used with permission.
The role of imaging: too much or too little?
Spinal stenosis can be difficult to diagnose defin-itively, in part because there is no reliable test. The diagnosis requires consideration of clinical symptoms, as well as imaging that shows a nar-row spinal canal. However, in some patients, a narrow spinal canal causes no symptoms. When combined with a clinical evaluation, imaging stud-ies, such as magnetic resonance imaging (MRI), may help diagnose spinal stenosis. However, radiographic and clinical definitions of stenosis lack consensus,17-19 and these classifications often correlate poorly with patient reports of pain and disability.20-22 In fact, spinal abnormalities revealed by imaging are surprisingly common even among asymptomatic people; studies have shown that, among patients without symptoms of back pain, 21% had spinal stenosis, 17% had spine joint problems, and 19% had other abnor-malities of the bones and tissues of the spinal canal.23,24 Although the narrowing of the spinal canal can be measured with imaging, the degree of constriction predicts poorly which patients will benefit from surgery.
A DARTMOUTH ATLAS OF HEALTH CARE SERIES 13
Before surgery
Patient decisions about back pain: challenges in treatment choices
There are multiple treatment options for people with lumbar spinal stenosis, includ-ing medication and physical therapy, steroid injections, and surgery. While the use of tests and treatments for spinal stenosis has grown in recent years, this increase does not appear to be caused by higher prevalence of the disease;25 rather, patients are receiving higher intensity care.
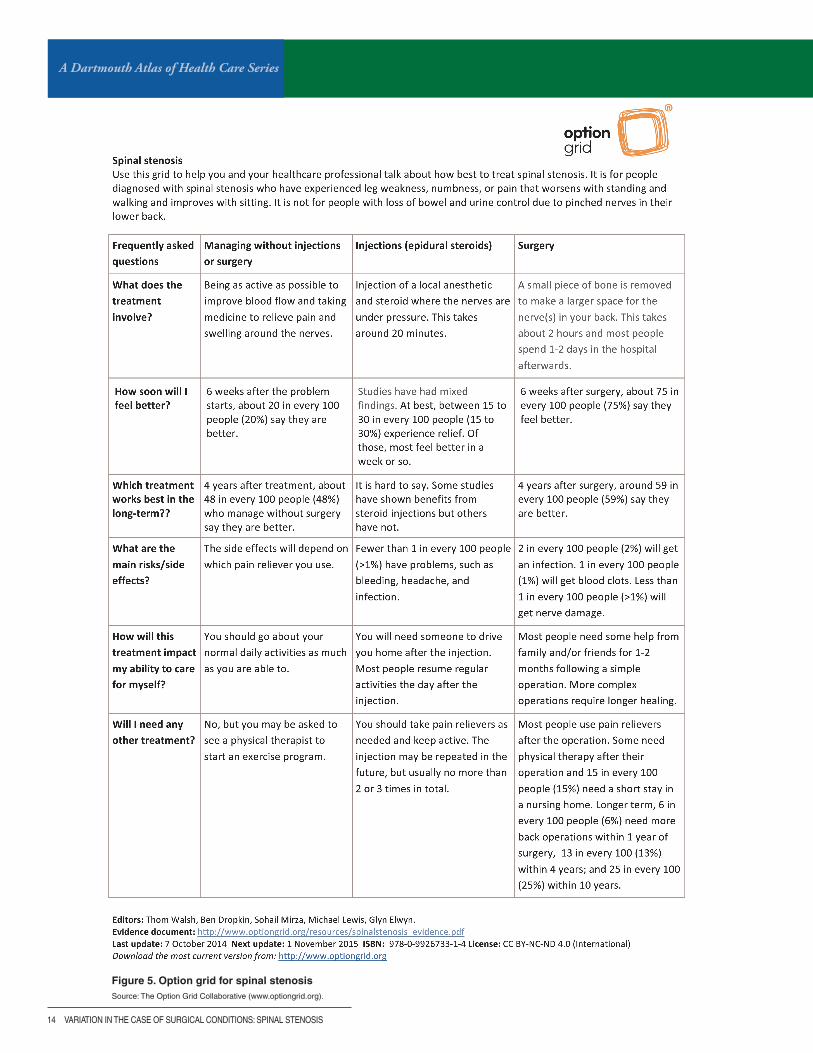
Given the many different treatment options for spinal stenosis, many patients would benefit from shared decision-making, a formal process of educating patients about the risks and benefits of treatment options and engaging them in decisions that promote care consistent with their values and preferences. The Spine Center at Dartmouth-Hitchcock Medical Center and Dr. James Weinstein led a National Insti-tutes of Health-funded trial, the Spine Patient Outcomes Research Trial (SPORT), that studied ways to give patients the best information possible about the differ-ent treatments for back pain and which decisions were associated with the best outcomes (www.dartmouth-hitchcock.org/spine/sport.html). Similar efforts to help patients make the best, most informed decisions—even in the context of a brief clinic visit—have been undertaken by The Decision Laboratory, led by Dr. Glyn Elwyn (www.optiongrid.org). These decision support tools aim to help patients and providers compare alternative treatment options, even with complex conditions such as back pain and spinal stenosis (Figure 5).
As outlined in this report, patients with spinal stenosis often suffer from chronic pain and disability. While successfully navigating these health problems is difficult, resources are available at:
The American Academy of Orthopaedic Surgeons: orthoinfo.aaos.org/topic.cfm?topic=A00575
National Institute of Arthritis and Musculoskeletal and Skin Diseases: www.niams.nih.gov/Health_Info/Back_Pain/
Anthem BlueCross BlueShield: www.anthem.com/wps/portal/ahpprovider?content_path=provider/noapplication/f1/s0/t0/pw_b156442.htm&state=in&rootLevel=1&label=Low%20Back%20Pain%20Tools%20for%20Patients%20and%20Providers
Dartmouth-Hitchcock Medical Center: www.dartmouth-hitchcock.org/medical-information/health_encyclopedia/aa121240#zx3768
A Dartmouth Atlas of Health Care Series
14 vARIATION IN THE CASE OF SURGICAL CONDITIONS: SPINAL STENOSIS
Figure 5. Option grid for spinal stenosisSource: The Option Grid Collaborative (www.optiongrid.org).
A DARTMOUTH ATLAS OF HEALTH CARE SERIES 15
Non-surgical options for the treatment of spinal stenosis
Medical management: Medications are commonly used as initial therapy for common spinal problems, including spinal stenosis. Typical medications include non-steroidal anti-inflammatory drugs (NSAIDs), analgesics, COX-2 inhibitors, muscle relaxants, certain anticonvulsants (e.g., Neurontin), and certain anti-depression medications (e.g., Cymbalta). Systematic reviews highlight a moderate short-term benefit of most of these drugs to relieve pain, but, like nearly all medica-tions, they also have risks.26-28
Although the use of opioids (also referred to as narcotics) in the treatment of back pain has been discouraged in clinical guidelines, there was a 423% increase in opi-oid use among people with back problems from 1997 to 2005.25 The availability of more potent opioid analgesics since 1997 has been accompanied by higher rates of opioid-related complications, leading to emergency department visits, psychi-atric conditions, and death.26,29-31 It is unclear why these treatment patterns have occurred, as the wide geographic variation in opioid use does not appear to reflect disease prevalence, injury, or surgical procedures.32 Opioid use for the long-term management of chronic spinal problems is not supported by scientific evidence of safety and effectiveness.33,34 While more than half of “regular” prescription opioid users have back pain,35 a report from the Cochrane collaboration states that “…opioids for long-term management of chronic [low back pain] remains questionable” and guidelines from the American College of Physicians and the American Pain Society have called for reassessing patients who fail to respond to a time-limited course of opioids.26,33,36
Non-operative therapy: The benefits of medical care, chiropractic care, physical therapy, and other non-surgical interventions to treat spinal stenosis have not been demonstrated.16,37,38 There is some evidence that exercise improves leg pain and functioning compared to no treatment, but these measures do not alter the natu-ral progression of stenosis.39 Nevertheless, one-third of the patients in the Spine Patient Outcomes Research Trial (SPORT) study’s unstructured non-operative treatment group reported significant improvements in symptoms at four years.40
This may be as due to “tincture of time” as any treatment offered.
Epidural steroid injections: Wide geographic variation in epidural steroid injec-tions has also been reported in the United States. Their use does not correlate to evidence-based indications of sciatica or radiculopathy;41,42 does not reduce the rate of subsequent surgery;43-48 and does not appear to obviate the need for opi-oids, surgery, or medical visits among the elderly U.S. population.42,49 One recent large randomized trial found no short-term benefit of epidural steroid injection rela-tive to injection with lidocaine, a short-term anesthetic, in treating patients with lumbar spinal stenosis.50
A Dartmouth Atlas of Health Care Series
16 vARIATION IN THE CASE OF SURGICAL CONDITIONS: SPINAL STENOSIS
During surgeryOlder treatments or newer methods? Trends and geographic variation in surgical treatments for spinal stenosis
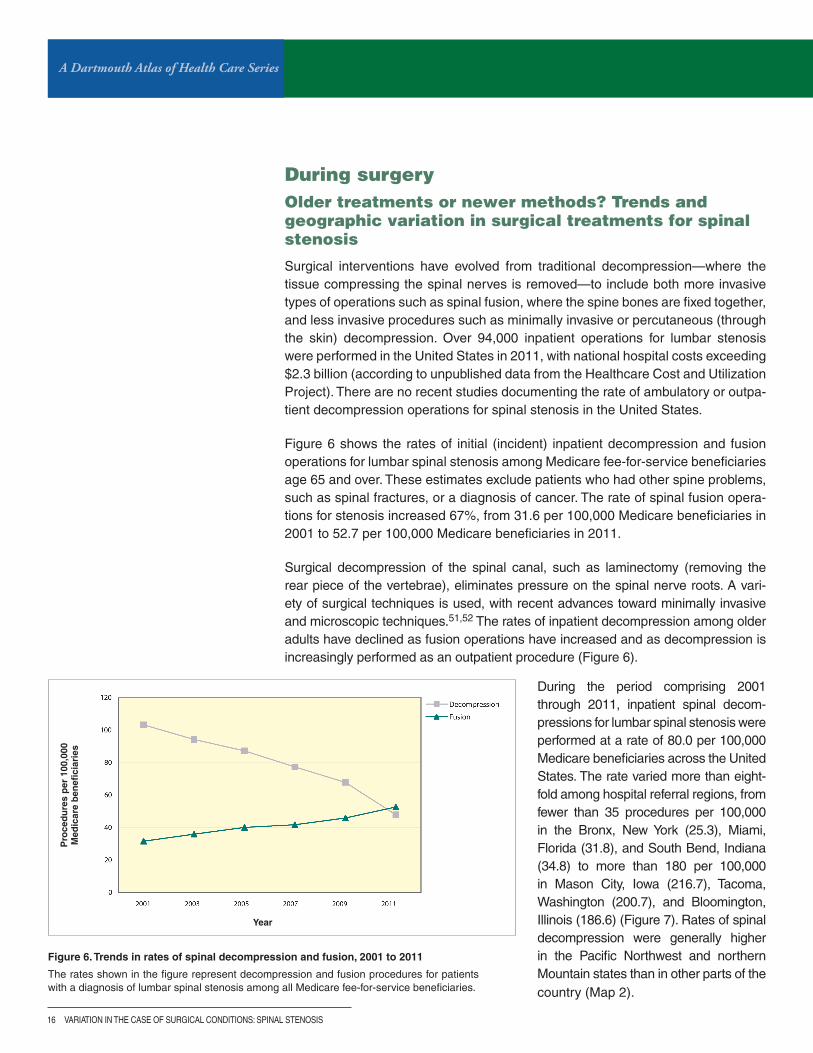
Surgical interventions have evolved from traditional decompression—where the tissue compressing the spinal nerves is removed—to include both more invasive types of operations such as spinal fusion, where the spine bones are fixed together, and less invasive procedures such as minimally invasive or percutaneous (through the skin) decompression. Over 94,000 inpatient operations for lumbar stenosis were performed in the United States in 2011, with national hospital costs exceeding $2.3 billion (according to unpublished data from the Healthcare Cost and Utilization Project). There are no recent studies documenting the rate of ambulatory or outpa-tient decompression operations for spinal stenosis in the United States.
Figure 6 shows the rates of initial (incident) inpatient decompression and fusion operations for lumbar spinal stenosis among Medicare fee-for-service beneficiaries age 65 and over. These estimates exclude patients who had other spine problems, such as spinal fractures, or a diagnosis of cancer. The rate of spinal fusion opera-tions for stenosis increased 67%, from 31.6 per 100,000 Medicare beneficiaries in 2001 to 52.7 per 100,000 Medicare beneficiaries in 2011.
Surgical decompression of the spinal canal, such as laminectomy (removing the rear piece of the vertebrae), eliminates pressure on the spinal nerve roots. A vari-ety of surgical techniques is used, with recent advances toward minimally invasive and microscopic techniques.51,52 The rates of inpatient decompression among older adults have declined as fusion operations have increased and as decompression is increasingly performed as an outpatient procedure (Figure 6).
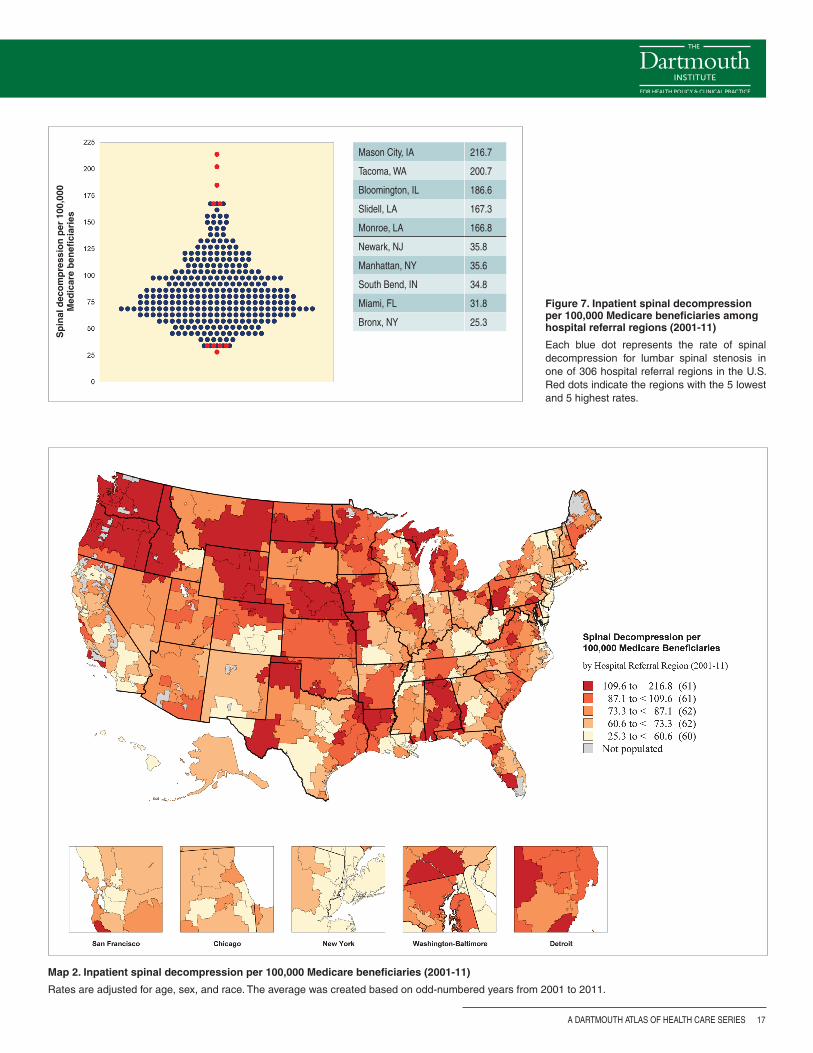
During the period comprising 2001 through 2011, inpatient spinal decom-pressions for lumbar spinal stenosis were performed at a rate of 80.0 per 100,000 Medicare beneficiaries across the United States. The rate varied more than eight-fold among hospital referral regions, from fewer than 35 procedures per 100,000 in the Bronx, New York (25.3), Miami, Florida (31.8), and South Bend, Indiana (34.8) to more than 180 per 100,000 in Mason City, Iowa (216.7), Tacoma, Washington (200.7), and Bloomington, Illinois (186.6) (Figure 7). Rates of spinal decompression were generally higher in the Pacific Northwest and northern Mountain states than in other parts of the country (Map 2).
Figure 6. Trends in rates of spinal decompression and fusion, 2001 to 2011
The rates shown in the figure represent decompression and fusion procedures for patients with a diagnosis of lumbar spinal stenosis among all Medicare fee-for-service beneficiaries.
Year
Pro
ced
ure
s p
er 1
00,0
00
Med
icar
e b
enefi
ciar
ies
A DARTMOUTH ATLAS OF HEALTH CARE SERIES 17
Figure 7. Inpatient spinal decompression per 100,000 Medicare beneficiaries among hospital referral regions (2001-11)
Each blue dot represents the rate of spinal decompression for lumbar spinal stenosis in one of 306 hospital referral regions in the U.S. Red dots indicate the regions with the 5 lowest and 5 highest rates.
Map 2. Inpatient spinal decompression per 100,000 Medicare beneficiaries (2001-11)
Rates are adjusted for age, sex, and race. The average was created based on odd-numbered years from 2001 to 2011.
Mason City, IA 216.7
Tacoma, WA 200.7
Bloomington, IL 186.6
Slidell, LA 167.3
Monroe, LA 166.8
Newark, NJ 35.8
Manhattan, NY 35.6
South Bend, IN 34.8
Miami, FL 31.8
Bronx, NY 25.3
Sp
inal
dec
om
pre
ssio
n p
er 1
00,0
00
Med
icar
e b
enefi
ciar
ies
A Dartmouth Atlas of Health Care Series
18 vARIATION IN THE CASE OF SURGICAL CONDITIONS: SPINAL STENOSIS
Sp
inal
fu
sio
n p
er 1
00,0
00 M
edic
are
ben
efici
arie
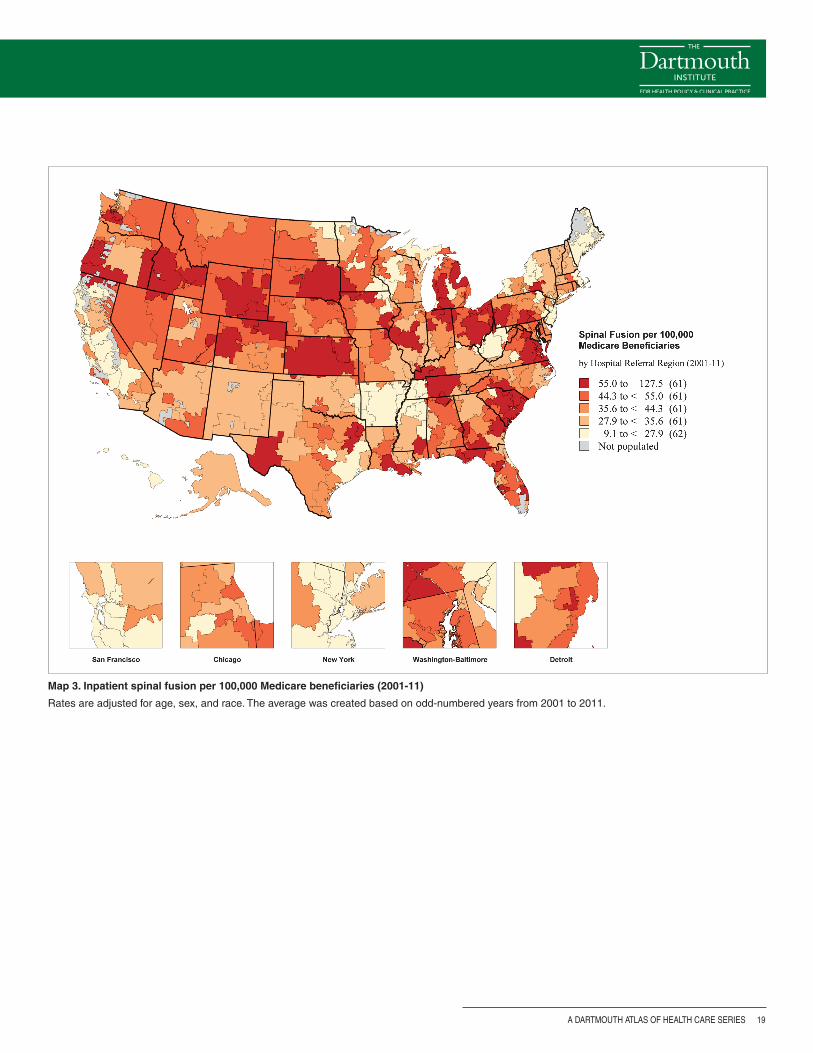
s Bradenton, FL 127.5
Grand Rapids, MI 89.9
Mason City, IA 89.2
Tyler, TX 88.5
Newport News, vA 87.4
Bronx, NY 17.5
Scranton, PA 17.1
Alameda County, CA 14.9
Fresno, CA 12.5
Bangor, ME 9.2
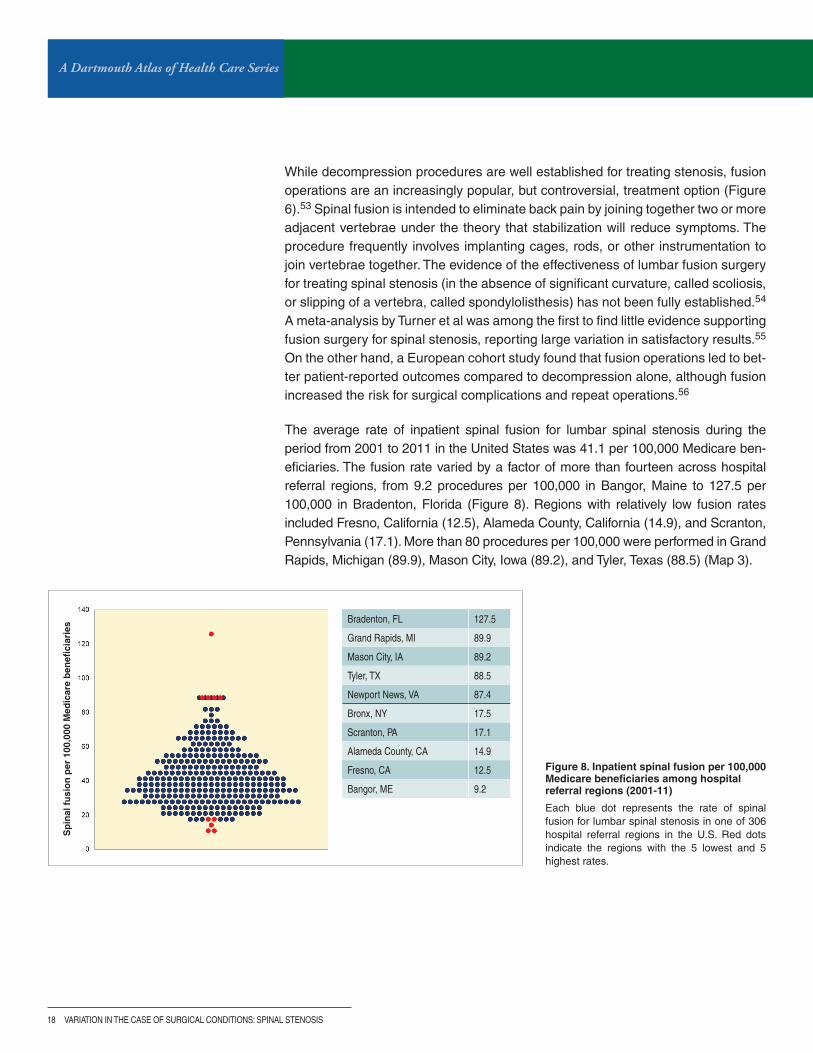
Figure 8. Inpatient spinal fusion per 100,000 Medicare beneficiaries among hospital referral regions (2001-11)
Each blue dot represents the rate of spinal fusion for lumbar spinal stenosis in one of 306 hospital referral regions in the U.S. Red dots indicate the regions with the 5 lowest and 5 highest rates.
While decompression procedures are well established for treating stenosis, fusion operations are an increasingly popular, but controversial, treatment option (Figure 6).53 Spinal fusion is intended to eliminate back pain by joining together two or more adjacent vertebrae under the theory that stabilization will reduce symptoms. The procedure frequently involves implanting cages, rods, or other instrumentation to join vertebrae together. The evidence of the effectiveness of lumbar fusion surgery for treating spinal stenosis (in the absence of significant curvature, called scoliosis, or slipping of a vertebra, called spondylolisthesis) has not been fully established.54 A meta-analysis by Turner et al was among the first to find little evidence supporting fusion surgery for spinal stenosis, reporting large variation in satisfactory results.55 On the other hand, a European cohort study found that fusion operations led to bet-ter patient-reported outcomes compared to decompression alone, although fusion increased the risk for surgical complications and repeat operations.56
The average rate of inpatient spinal fusion for lumbar spinal stenosis during the period from 2001 to 2011 in the United States was 41.1 per 100,000 Medicare ben-eficiaries. The fusion rate varied by a factor of more than fourteen across hospital referral regions, from 9.2 procedures per 100,000 in Bangor, Maine to 127.5 per 100,000 in Bradenton, Florida (Figure 8). Regions with relatively low fusion rates included Fresno, California (12.5), Alameda County, California (14.9), and Scranton, Pennsylvania (17.1). More than 80 procedures per 100,000 were performed in Grand Rapids, Michigan (89.9), Mason City, Iowa (89.2), and Tyler, Texas (88.5) (Map 3).
A DARTMOUTH ATLAS OF HEALTH CARE SERIES 19
Map 3. Inpatient spinal fusion per 100,000 Medicare beneficiaries (2001-11)
Rates are adjusted for age, sex, and race. The average was created based on odd-numbered years from 2001 to 2011.
A Dartmouth Atlas of Health Care Series
20 vARIATION IN THE CASE OF SURGICAL CONDITIONS: SPINAL STENOSIS
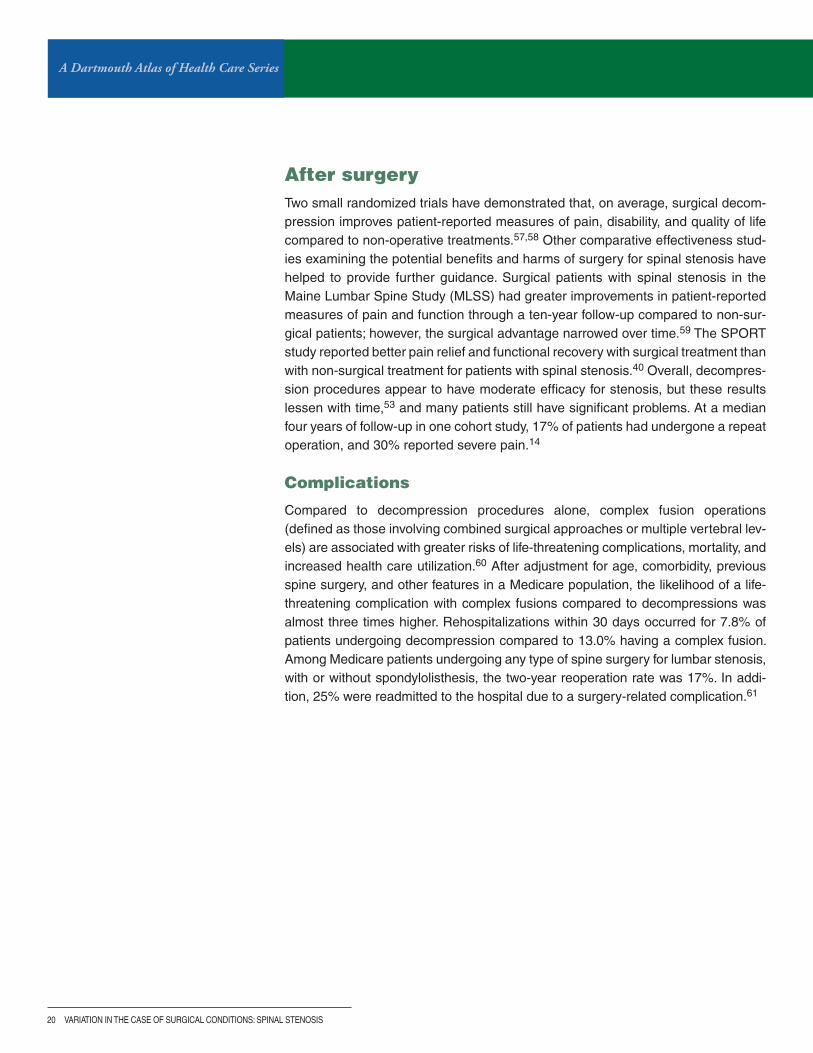
After surgeryTwo small randomized trials have demonstrated that, on average, surgical decom-pression improves patient-reported measures of pain, disability, and quality of life compared to non-operative treatments.57,58 Other comparative effectiveness stud-ies examining the potential benefits and harms of surgery for spinal stenosis have helped to provide further guidance. Surgical patients with spinal stenosis in the Maine Lumbar Spine Study (MLSS) had greater improvements in patient-reported measures of pain and function through a ten-year follow-up compared to non-sur-gical patients; however, the surgical advantage narrowed over time.59 The SPORT study reported better pain relief and functional recovery with surgical treatment than with non-surgical treatment for patients with spinal stenosis.40 Overall, decompres-sion procedures appear to have moderate efficacy for stenosis, but these results lessen with time,53 and many patients still have significant problems. At a median four years of follow-up in one cohort study, 17% of patients had undergone a repeat operation, and 30% reported severe pain.14
Complications
Compared to decompression procedures alone, complex fusion operations (defined as those involving combined surgical approaches or multiple vertebral lev-els) are associated with greater risks of life-threatening complications, mortality, and increased health care utilization.60 After adjustment for age, comorbidity, previous spine surgery, and other features in a Medicare population, the likelihood of a life-threatening complication with complex fusions compared to decompressions was almost three times higher. Rehospitalizations within 30 days occurred for 7.8% of patients undergoing decompression compared to 13.0% having a complex fusion. Among Medicare patients undergoing any type of spine surgery for lumbar stenosis, with or without spondylolisthesis, the two-year reoperation rate was 17%. In addi-tion, 25% were readmitted to the hospital due to a surgery-related complication.61
A DARTMOUTH ATLAS OF HEALTH CARE SERIES 21
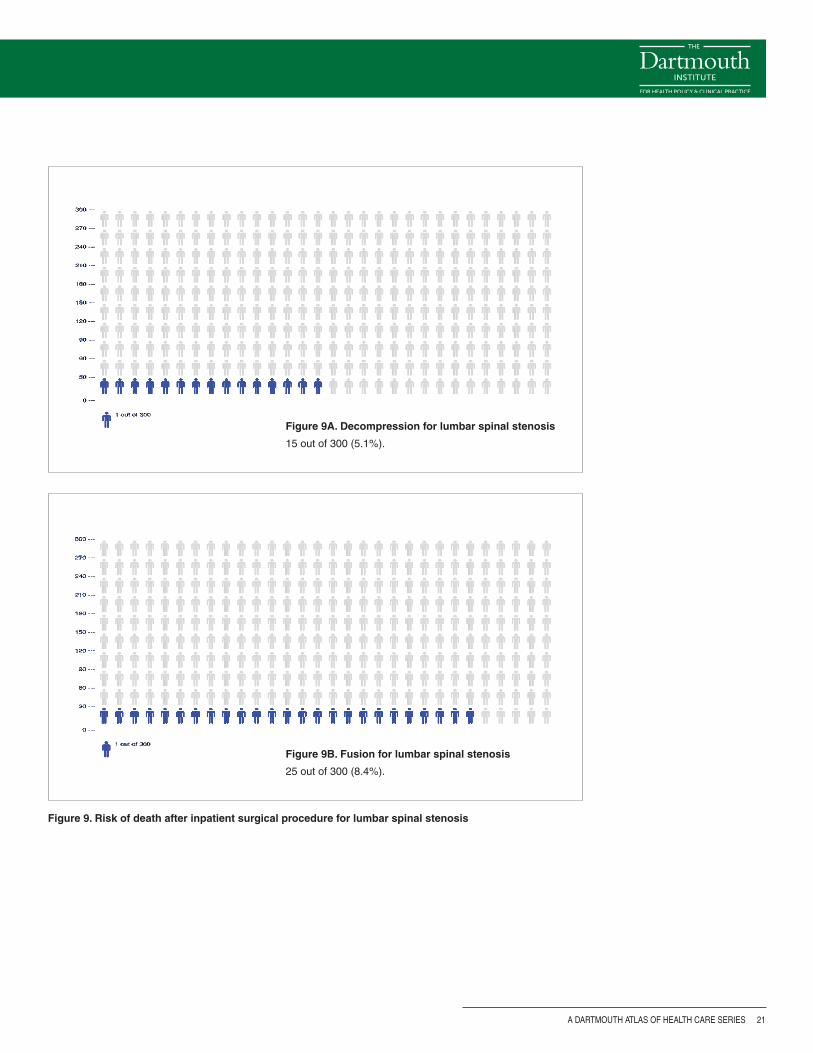
Figure 9. Risk of death after inpatient surgical procedure for lumbar spinal stenosis
Figure 9A. Decompression for lumbar spinal stenosis
15 out of 300 (5.1%).
Figure 9B. Fusion for lumbar spinal stenosis
25 out of 300 (8.4%).
A Dartmouth Atlas of Health Care Series
22 vARIATION IN THE CASE OF SURGICAL CONDITIONS: SPINAL STENOSIS
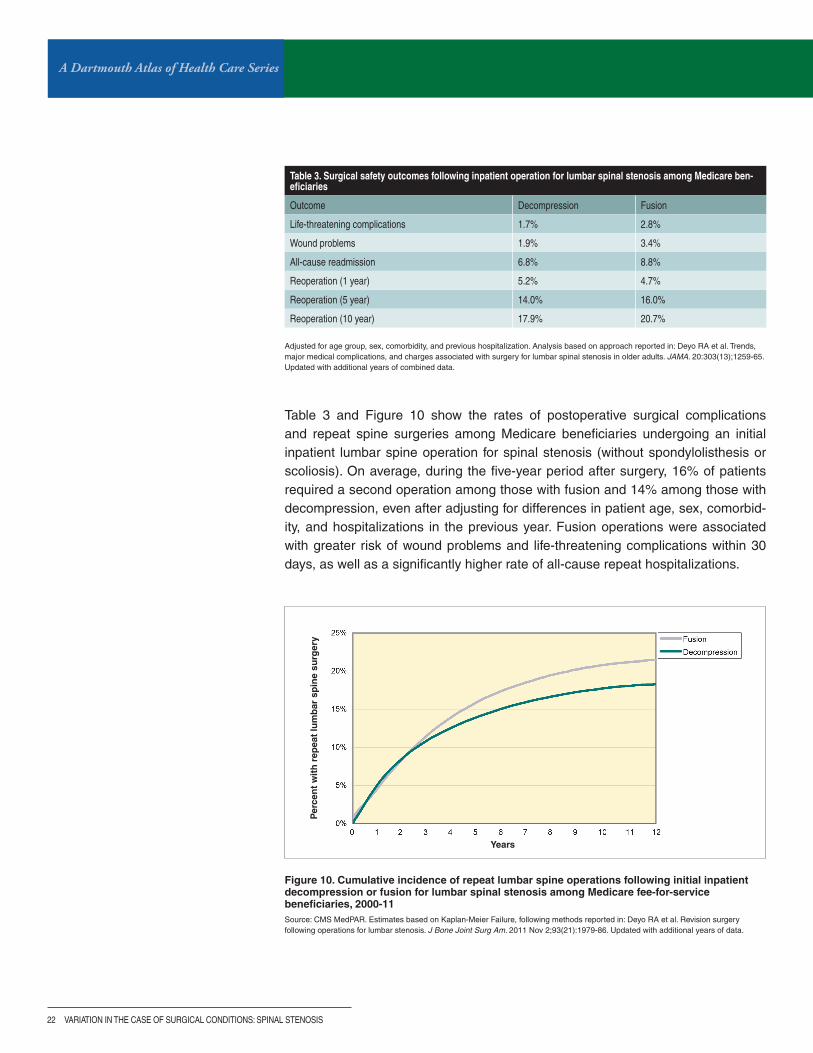
Table 3 and Figure 10 show the rates of postoperative surgical complications and repeat spine surgeries among Medicare beneficiaries undergoing an initial inpatient lumbar spine operation for spinal stenosis (without spondylolisthesis or scoliosis). On average, during the five-year period after surgery, 16% of patients required a second operation among those with fusion and 14% among those with decompression, even after adjusting for differences in patient age, sex, comorbid-ity, and hospitalizations in the previous year. Fusion operations were associated with greater risk of wound problems and life-threatening complications within 30 days, as well as a significantly higher rate of all-cause repeat hospitalizations.
Figure 10. Cumulative incidence of repeat lumbar spine operations following initial inpatient decompression or fusion for lumbar spinal stenosis among Medicare fee-for-service beneficiaries, 2000-11Source: CMS MedPAR. Estimates based on Kaplan-Meier Failure, following methods reported in: Deyo RA et al. Revision surgery following operations for lumbar stenosis. J Bone Joint Surg Am. 2011 Nov 2;93(21):1979-86. Updated with additional years of data.
Years
Per
cen
t w
ith
rep
eat
lum
bar
sp
ine
surg
ery
Adjusted for age group, sex, comorbidity, and previous hospitalization. Analysis based on approach reported in: Deyo RA et al. Trends, major medical complications, and charges associated with surgery for lumbar spinal stenosis in older adults. JAMA. 20:303(13);1259-65. Updated with additional years of combined data.
Table 3. Surgical safety outcomes following inpatient operation for lumbar spinal stenosis among Medicare ben-eficiaries
Outcome Decompression Fusion
Life-threatening complications 1.7% 2.8%
Wound problems 1.9% 3.4%
All-cause readmission 6.8% 8.8%
Reoperation (1 year) 5.2% 4.7%
Reoperation (5 year) 14.0% 16.0%
Reoperation (10 year) 17.9% 20.7%
A DARTMOUTH ATLAS OF HEALTH CARE SERIES 23
Can less invasive alternatives help? New technology, but what evidence?
Interspinious process devices (such as the X-Stop© device, approved by the FDA in late 2005) have recently emerged as a less invasive alternative to decompres-sion procedures. These devices are inserted between the spinous processes of adjacent vertebrae and spread the vertebrae apart to prevent the nerve canals from pressing on the nerves. While industry-sponsored randomized trials suggest an advantage over non-surgical treatments, there are only a few clinical trials compar-ing them to decompression.62-64 While these devices can be placed using only local anesthetics, their use is associated with a higher incidence of reoperation. Inter-spinous distraction procedures appear to have fewer life-threatening complications at the time of the operation, but lead to more subsequent revision operations.65,66 Other minimally invasive decompression techniques are under development, but the evidence necessary to support their use remains limited.
A Dartmouth Atlas of Health Care Series
24 vARIATION IN THE CASE OF SURGICAL CONDITIONS: SPINAL STENOSIS
Beyond surgeryTrends and variation in treatments for lumbar spinal stenosis likely reflect an aging population, a lack of consensus about the best treatment options, and changes in surgical technologies. While decompression may remain the gold standard for patients for whom non-operative treatments have failed, it is increasingly performed on an outpatient basis, using minimally invasive techniques, and incorporating spinal spacers. Additionally, some patients may seek to undergo lumbar fusion operations. Some have viewed fusion as obviating the need for additional treat-ments. Sadly, this does not bear out in observation of readmissions, complications, and repeat spine surgery rates.
The need for shared decision-making
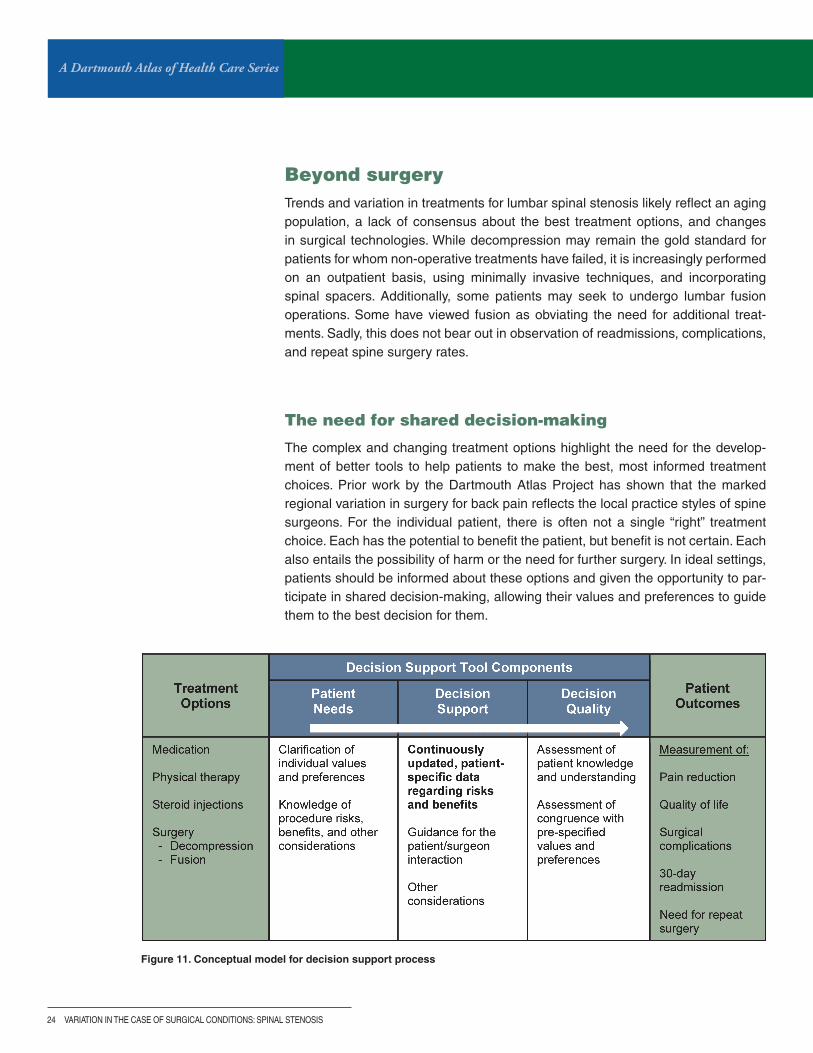
The complex and changing treatment options highlight the need for the develop-ment of better tools to help patients to make the best, most informed treatment choices. Prior work by the Dartmouth Atlas Project has shown that the marked regional variation in surgery for back pain reflects the local practice styles of spine surgeons. For the individual patient, there is often not a single “right” treatment choice. Each has the potential to benefit the patient, but benefit is not certain. Each also entails the possibility of harm or the need for further surgery. In ideal settings, patients should be informed about these options and given the opportunity to par-ticipate in shared decision-making, allowing their values and preferences to guide them to the best decision for them.
Figure 11. Conceptual model for decision support process
A DARTMOUTH ATLAS OF HEALTH CARE SERIES 25
Procedures such as spinal fusion have become increasingly common in recent years. These operations, unfortunately, can result in complications, some requir-ing readmission to the hospital. These findings point to significant opportunities to improve safety and effectiveness in treating back pain. Long-term surveillance of safety measures and patient-reported outcomes are rare in spine surgery but are critically important for informing patients and other stakeholders about the value of spinal procedures.
Conclusions
Surgery for back pain, especially for patients with spinal stenosis, has changed dramatically in recent years but continues to vary from one region to the next. While surgical outcomes research has provided information about when and how these changes have occurred over time, patients are still subject to the accident of geography. In one region, patients are more likely to be offered decompression; in another, fusion; and in a third, medical management may be more common. We know very little about how the variation in care patterns has affected patients and their lives. While more needs to be done to improve the treatments for spinal stenosis and back pain, there is a more immediate opportunity to improve care by implementing shared decision-making. A higher quality decision-making process would help patients find the choice best aligned with their values and preferences.
A Dartmouth Atlas of Health Care Series
26 vARIATION IN THE CASE OF SURGICAL CONDITIONS: SPINAL STENOSIS
Methods
Data sources and cohort formation: We examined the 100% sample of the Medi-care Provider Analysis and Review (MedPAR) file for patients undergoing an initial inpatient lumbar spinal fusion or decompression operation for spinal stenosis from 2001 to 2011. Each MedPAR claim is coded with up to ten diagnosis and six proce-dure codes. We searched all of these codes to identify patients with spinal stenosis undergoing decompression or fusion operations. Population data for estimating population-based rates came from the Medicare Denominator file and was strati-fied by five-year increments of age, sex, and race (black/non-black). We combined data from 2001 through 2011 to estimate age-, sex-, and race-adjusted trends in the rates of decompression and fusion operations for spinal stenosis per 100,000 Medicare beneficiaries.
We identified inpatient admissions among beneficiaries age 65 and older, excluding those who were on social security disability insurance, had eligibility for end-stage renal disease, or were enrolled in Medicare HMO programs (e.g., Medicare Advan-tage). Admissions associated with the surgical indication of spinal stenosis were identified using a previously published and validated hierarchical coding algorithm (www.researchgate.net/publication/257631899_SPINEDEF_%28Version_6%29_Coding_definitions_for_characterizing_spine-related_medical_encounters). All inpatient admissions that involved an initial (incident) thoracolumbar, lumbar, or lumbosacral fusion or decompression operation for spinal stenosis from 2001 through 2011 were included. However, admissions that included codes for refu-sion, artificial disc replacement, corpectomy, osteotomy, and kyphectomy were excluded. We further excluded admissions that contained codes for non-degenera-tive lumbar spinal admissions, such as spinal fracture, vertebral dislocation, spinal cord injury, cervical or thoracic conditions, and inflammatory spondylopathy. Finally, we excluded admissions associated with codes for accidents, neoplasm, HIV or immune deficiency, intraspinal abscess, or osteomyelitis.
Surgical complications: Orthopaedic device complications, wound problems, life-threatening medical complications, and repeat surgery were ascertained for each patient. To calculate the rate and difference in surgical risk between fusion and decompression, we performed a logistic regression for each type of compli-cation, including variables for patient age, sex, race, comorbidity, and previous hospitalizations. Similarly, we examined differences in long-term rates of repeat spine operation between decompression and fusion. We used a Cox proportional hazard regression model to examine differences in the time until a first reoperation between patients undergoing initial decompression and fusion operations.
A DARTMOUTH ATLAS OF HEALTH CARE SERIES 27
Economic analyses: For the economic analyses presented in this report, we updated our previously published analysis of the Medical Expenditure Panel Sur-vey9 with data through 2012 to estimate the treated prevalence and the economic burden of back and neck problems in the United States. MEPS is a household survey of medical expenditures weighted to represent national estimates. We focused on adults (> 17 years) with self-reported neck and back problems mapped to spine-related codes from the International Classification of Disease (ICD-9-CM). Inflation-adjusted, survey-weighted generalized linear regression models, adjust-ing for age, sex, and Charlson comorbidity, were used to calculate the incremental difference in health care costs between patients with and without spine problems.
A Dartmouth Atlas of Health Care Series
28 vARIATION IN THE CASE OF SURGICAL CONDITIONS: SPINAL STENOSIS
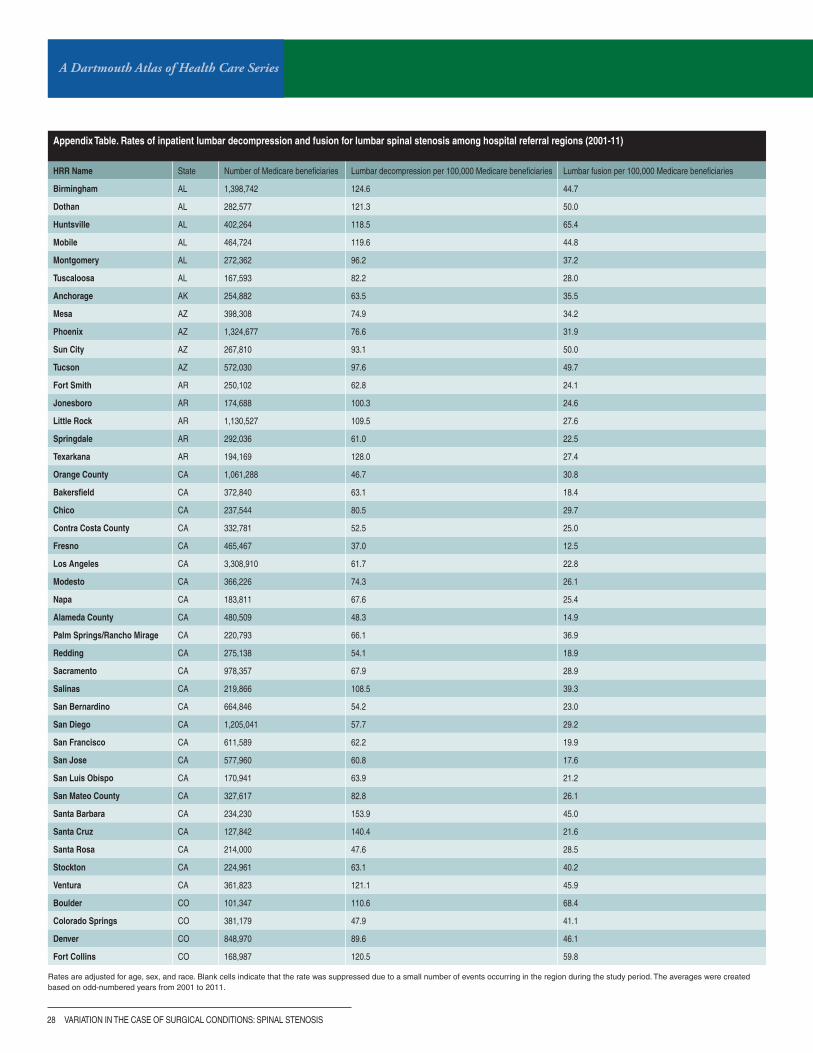
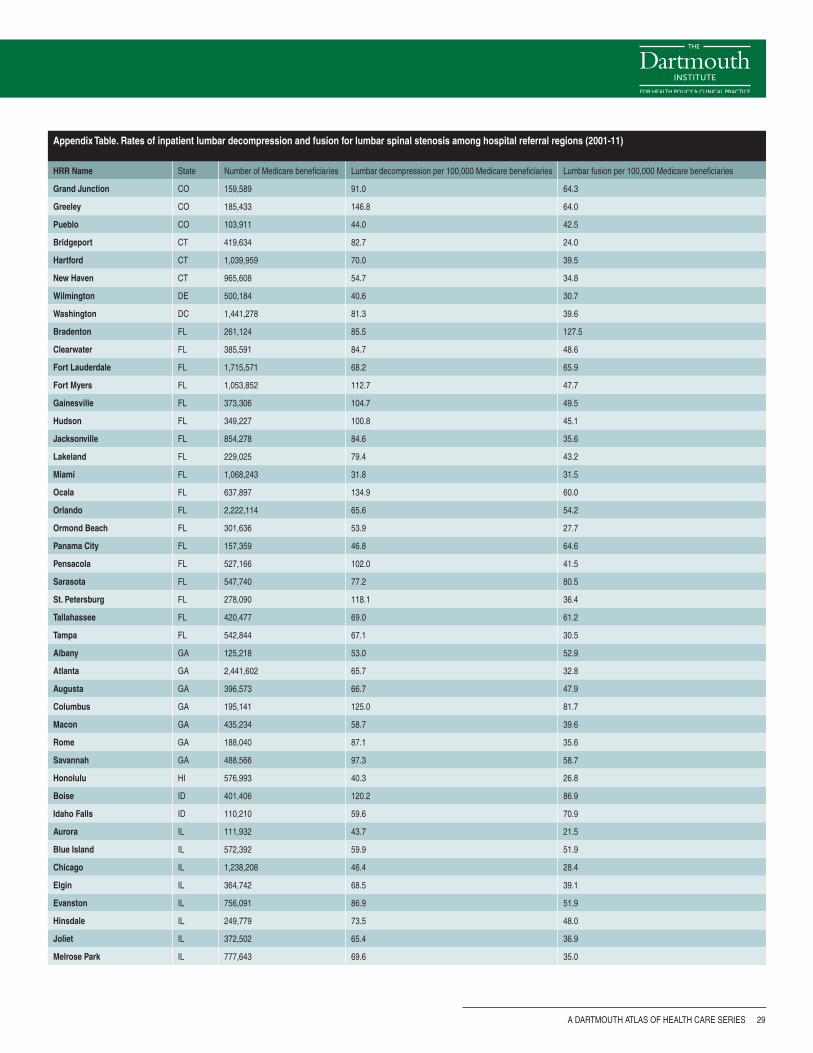
Rates are adjusted for age, sex, and race. Blank cells indicate that the rate was suppressed due to a small number of events occurring in the region during the study period. The averages were created based on odd-numbered years from 2001 to 2011.
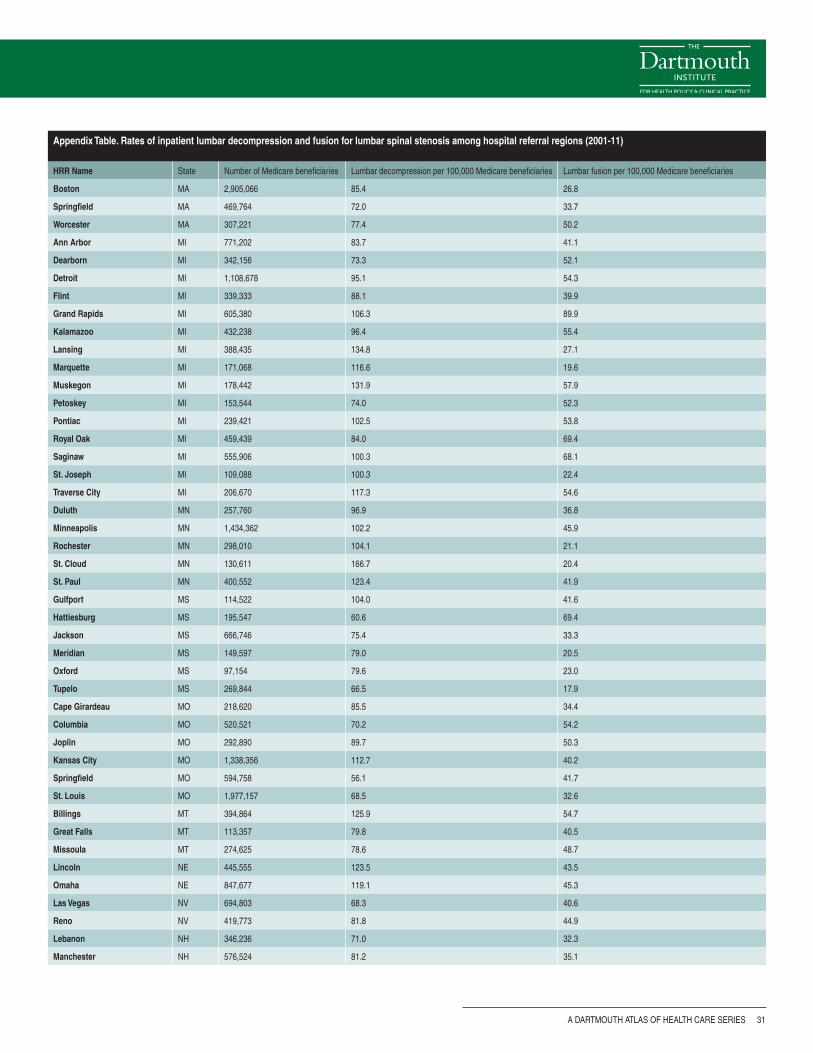
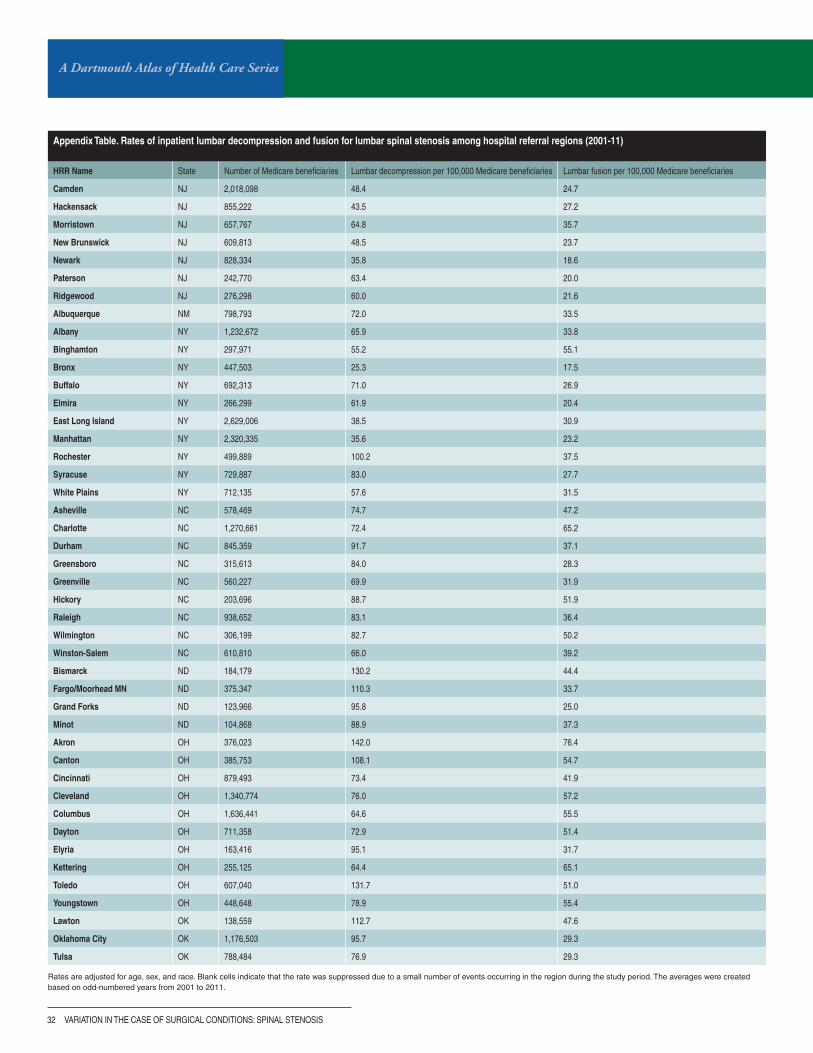
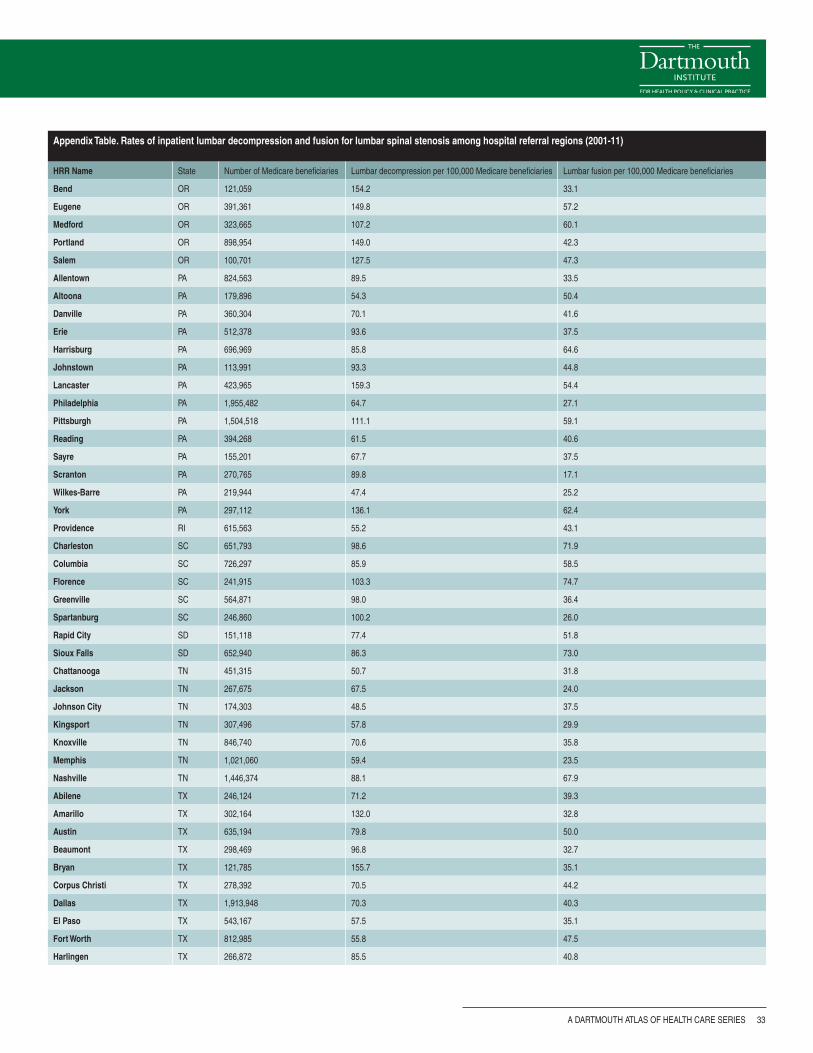
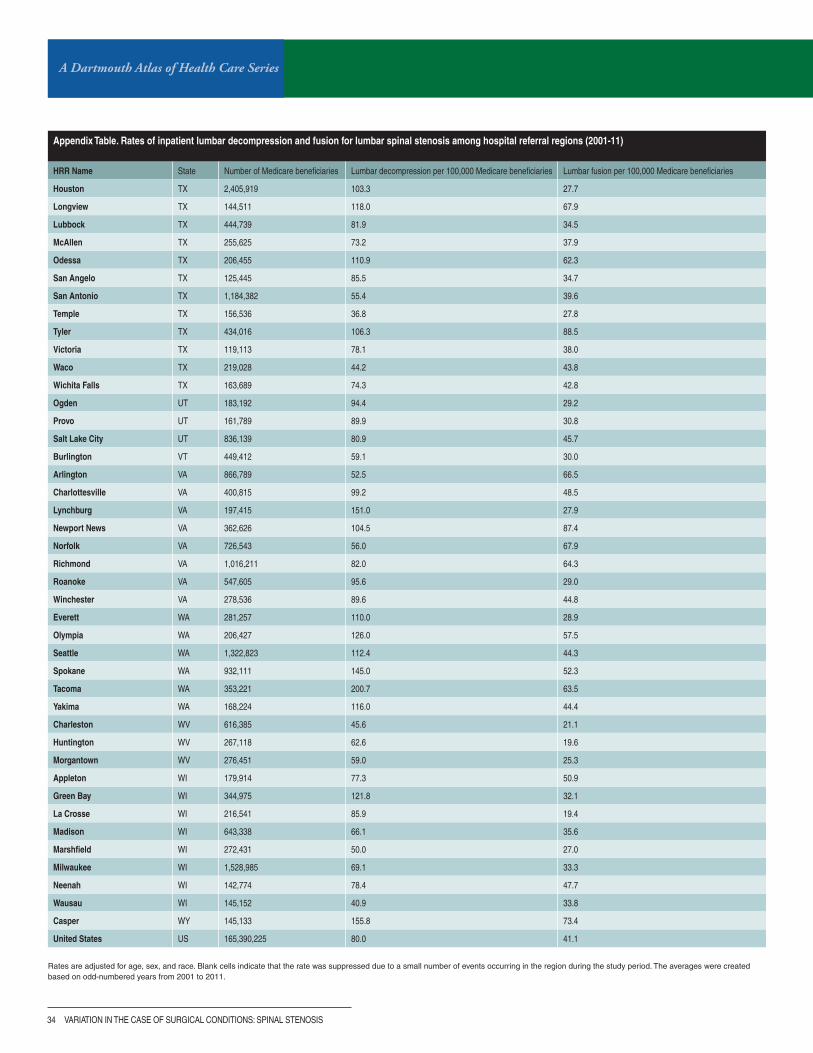
Appendix Table. Rates of inpatient lumbar decompression and fusion for lumbar spinal stenosis among hospital referral regions (2001-11)
HRR Name State Number of Medicare beneficiaries Lumbar decompression per 100,000 Medicare beneficiaries Lumbar fusion per 100,000 Medicare beneficiaries
Birmingham AL 1,398,742 124.6 44.7
Dothan AL 282,577 121.3 50.0
Huntsville AL 402,264 118.5 65.4
Mobile AL 464,724 119.6 44.8
Montgomery AL 272,362 96.2 37.2
Tuscaloosa AL 167,593 82.2 28.0
Anchorage AK 254,882 63.5 35.5
Mesa AZ 398,308 74.9 34.2
Phoenix AZ 1,324,677 76.6 31.9
Sun City AZ 267,810 93.1 50.0
Tucson AZ 572,030 97.6 49.7
Fort Smith AR 250,102 62.8 24.1
Jonesboro AR 174,688 100.3 24.6
Little Rock AR 1,130,527 109.5 27.6
Springdale AR 292,036 61.0 22.5
Texarkana AR 194,169 128.0 27.4
Orange County CA 1,061,288 46.7 30.8
Bakersfield CA 372,840 63.1 18.4
Chico CA 237,544 80.5 29.7
Contra Costa County CA 332,781 52.5 25.0
Fresno CA 465,467 37.0 12.5
Los Angeles CA 3,308,910 61.7 22.8
Modesto CA 366,226 74.3 26.1
Napa CA 183,811 67.6 25.4
Alameda County CA 480,509 48.3 14.9
Palm Springs/Rancho Mirage CA 220,793 66.1 36.9
Redding CA 275,138 54.1 18.9
Sacramento CA 978,357 67.9 28.9
Salinas CA 219,866 108.5 39.3
San Bernardino CA 664,846 54.2 23.0
San Diego CA 1,205,041 57.7 29.2
San Francisco CA 611,589 62.2 19.9
San Jose CA 577,960 60.8 17.6
San Luis Obispo CA 170,941 63.9 21.2
San Mateo County CA 327,617 82.8 26.1
Santa Barbara CA 234,230 153.9 45.0
Santa Cruz CA 127,842 140.4 21.6
Santa Rosa CA 214,000 47.6 28.5
Stockton CA 224,961 63.1 40.2
Ventura CA 361,823 121.1 45.9
Boulder CO 101,347 110.6 68.4
Colorado Springs CO 381,179 47.9 41.1
Denver CO 848,970 89.6 46.1
Fort Collins CO 168,987 120.5 59.8
A DARTMOUTH ATLAS OF HEALTH CARE SERIES 29
Appendix Table. Rates of inpatient lumbar decompression and fusion for lumbar spinal stenosis among hospital referral regions (2001-11)
HRR Name State Number of Medicare beneficiaries Lumbar decompression per 100,000 Medicare beneficiaries Lumbar fusion per 100,000 Medicare beneficiaries
Grand Junction CO 159,589 91.0 64.3
Greeley CO 185,433 146.8 64.0
Pueblo CO 103,911 44.0 42.5
Bridgeport CT 419,634 82.7 24.0
Hartford CT 1,039,959 70.0 39.5
New Haven CT 965,608 54.7 34.8
Wilmington DE 500,184 40.6 30.7
Washington DC 1,441,278 81.3 39.6
Bradenton FL 261,124 85.5 127.5
Clearwater FL 385,591 84.7 48.6
Fort Lauderdale FL 1,715,571 68.2 65.9
Fort Myers FL 1,053,852 112.7 47.7
Gainesville FL 373,306 104.7 49.5
Hudson FL 349,227 100.8 45.1
Jacksonville FL 854,278 84.6 35.6
Lakeland FL 229,025 79.4 43.2
Miami FL 1,068,243 31.8 31.5
Ocala FL 637,897 134.9 60.0
Orlando FL 2,222,114 65.6 54.2
Ormond Beach FL 301,636 53.9 27.7
Panama City FL 157,359 46.8 64.6
Pensacola FL 527,166 102.0 41.5
Sarasota FL 547,740 77.2 80.5
St. Petersburg FL 278,090 118.1 36.4
Tallahassee FL 420,477 69.0 61.2
Tampa FL 542,844 67.1 30.5
Albany GA 125,218 53.0 52.9
Atlanta GA 2,441,602 65.7 32.8
Augusta GA 396,573 66.7 47.9
Columbus GA 195,141 125.0 81.7
Macon GA 435,234 58.7 39.6
Rome GA 188,040 87.1 35.6
Savannah GA 488,566 97.3 58.7
Honolulu HI 576,993 40.3 26.8
Boise ID 401,406 120.2 86.9
Idaho Falls ID 110,210 59.6 70.9
Aurora IL 111,932 43.7 21.5
Blue Island IL 572,392 59.9 51.9
Chicago IL 1,238,208 46.4 28.4
Elgin IL 364,742 68.5 39.1
Evanston IL 756,091 86.9 51.9
Hinsdale IL 249,779 73.5 48.0
Joliet IL 372,502 65.4 36.9
Melrose Park IL 777,643 69.6 35.0
A Dartmouth Atlas of Health Care Series
30 vARIATION IN THE CASE OF SURGICAL CONDITIONS: SPINAL STENOSIS
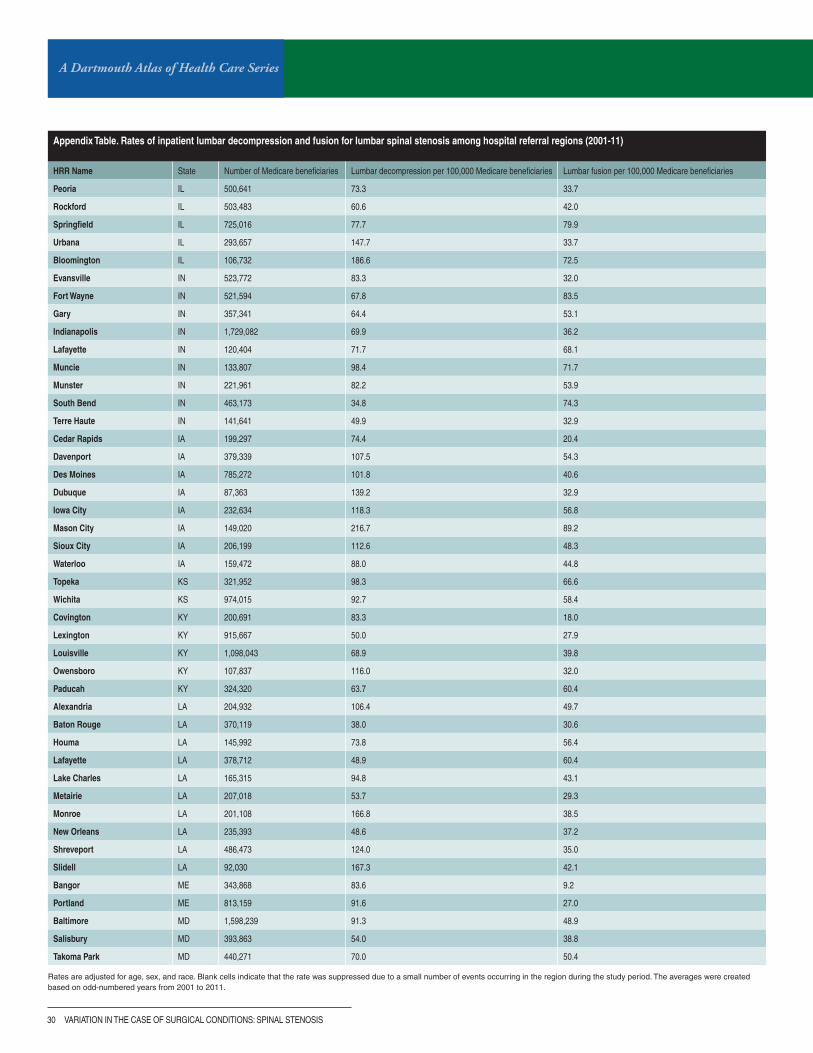
Appendix Table. Rates of inpatient lumbar decompression and fusion for lumbar spinal stenosis among hospital referral regions (2001-11)
HRR Name State Number of Medicare beneficiaries Lumbar decompression per 100,000 Medicare beneficiaries Lumbar fusion per 100,000 Medicare beneficiaries
Peoria IL 500,641 73.3 33.7
Rockford IL 503,483 60.6 42.0
Springfield IL 725,016 77.7 79.9
Urbana IL 293,657 147.7 33.7
Bloomington IL 106,732 186.6 72.5
Evansville IN 523,772 83.3 32.0
Fort Wayne IN 521,594 67.8 83.5
Gary IN 357,341 64.4 53.1
Indianapolis IN 1,729,082 69.9 36.2
Lafayette IN 120,404 71.7 68.1
Muncie IN 133,807 98.4 71.7
Munster IN 221,961 82.2 53.9
South Bend IN 463,173 34.8 74.3
Terre Haute IN 141,641 49.9 32.9
Cedar Rapids IA 199,297 74.4 20.4
Davenport IA 379,339 107.5 54.3
Des Moines IA 785,272 101.8 40.6
Dubuque IA 87,363 139.2 32.9
Iowa City IA 232,634 118.3 56.8
Mason City IA 149,020 216.7 89.2
Sioux City IA 206,199 112.6 48.3
Waterloo IA 159,472 88.0 44.8
Topeka KS 321,952 98.3 66.6
Wichita KS 974,015 92.7 58.4
Covington KY 200,691 83.3 18.0
Lexington KY 915,667 50.0 27.9
Louisville KY 1,098,043 68.9 39.8
Owensboro KY 107,837 116.0 32.0
Paducah KY 324,320 63.7 60.4
Alexandria LA 204,932 106.4 49.7
Baton Rouge LA 370,119 38.0 30.6
Houma LA 145,992 73.8 56.4
Lafayette LA 378,712 48.9 60.4
Lake Charles LA 165,315 94.8 43.1
Metairie LA 207,018 53.7 29.3
Monroe LA 201,108 166.8 38.5
New Orleans LA 235,393 48.6 37.2
Shreveport LA 486,473 124.0 35.0
Slidell LA 92,030 167.3 42.1
Bangor ME 343,868 83.6 9.2
Portland ME 813,159 91.6 27.0
Baltimore MD 1,598,239 91.3 48.9
Salisbury MD 393,863 54.0 38.8
Takoma Park MD 440,271 70.0 50.4
Rates are adjusted for age, sex, and race. Blank cells indicate that the rate was suppressed due to a small number of events occurring in the region during the study period. The averages were created based on odd-numbered years from 2001 to 2011.
A DARTMOUTH ATLAS OF HEALTH CARE SERIES 31
Appendix Table. Rates of inpatient lumbar decompression and fusion for lumbar spinal stenosis among hospital referral regions (2001-11)
HRR Name State Number of Medicare beneficiaries Lumbar decompression per 100,000 Medicare beneficiaries Lumbar fusion per 100,000 Medicare beneficiaries
Boston MA 2,905,066 85.4 26.8
Springfield MA 469,764 72.0 33.7
Worcester MA 307,221 77.4 50.2
Ann Arbor MI 771,202 83.7 41.1
Dearborn MI 342,156 73.3 52.1
Detroit MI 1,108,678 95.1 54.3
Flint MI 339,333 88.1 39.9
Grand Rapids MI 605,380 106.3 89.9
Kalamazoo MI 432,238 96.4 55.4
Lansing MI 388,435 134.8 27.1
Marquette MI 171,068 116.6 19.6
Muskegon MI 178,442 131.9 57.9
Petoskey MI 153,544 74.0 52.3
Pontiac MI 239,421 102.5 53.8
Royal Oak MI 459,439 84.0 69.4
Saginaw MI 555,906 100.3 68.1
St. Joseph MI 109,088 100.3 22.4
Traverse City MI 206,670 117.3 54.6
Duluth MN 257,760 96.9 36.8
Minneapolis MN 1,434,362 102.2 45.9
Rochester MN 298,010 104.1 21.1
St. Cloud MN 130,611 166.7 20.4
St. Paul MN 400,552 123.4 41.9
Gulfport MS 114,522 104.0 41.6
Hattiesburg MS 195,547 60.6 69.4
Jackson MS 666,746 75.4 33.3
Meridian MS 149,597 79.0 20.5
Oxford MS 97,154 79.6 23.0
Tupelo MS 269,844 66.5 17.9
Cape Girardeau MO 218,620 85.5 34.4
Columbia MO 520,521 70.2 54.2
Joplin MO 292,890 89.7 50.3
Kansas City MO 1,338,356 112.7 40.2
Springfield MO 594,758 56.1 41.7
St. Louis MO 1,977,157 68.5 32.6
Billings MT 394,864 125.9 54.7
Great Falls MT 113,357 79.8 40.5
Missoula MT 274,625 78.6 48.7
Lincoln NE 445,555 123.5 43.5
Omaha NE 847,677 119.1 45.3
Las Vegas Nv 694,803 68.3 40.6
Reno Nv 419,773 81.8 44.9
Lebanon NH 346,236 71.0 32.3
Manchester NH 576,524 81.2 35.1
A Dartmouth Atlas of Health Care Series
32 vARIATION IN THE CASE OF SURGICAL CONDITIONS: SPINAL STENOSIS
Appendix Table. Rates of inpatient lumbar decompression and fusion for lumbar spinal stenosis among hospital referral regions (2001-11)
HRR Name State Number of Medicare beneficiaries Lumbar decompression per 100,000 Medicare beneficiaries Lumbar fusion per 100,000 Medicare beneficiaries
Camden NJ 2,018,098 48.4 24.7
Hackensack NJ 855,222 43.5 27.2
Morristown NJ 657,767 64.8 35.7
New Brunswick NJ 609,813 48.5 23.7
Newark NJ 828,334 35.8 18.6
Paterson NJ 242,770 63.4 20.0
Ridgewood NJ 276,298 60.0 21.6
Albuquerque NM 798,793 72.0 33.5
Albany NY 1,232,672 65.9 33.8
Binghamton NY 297,971 55.2 55.1
Bronx NY 447,503 25.3 17.5
Buffalo NY 692,313 71.0 26.9
Elmira NY 266,299 61.9 20.4
East Long Island NY 2,629,006 38.5 30.9
Manhattan NY 2,320,335 35.6 23.2
Rochester NY 499,889 100.2 37.5
Syracuse NY 729,887 83.0 27.7
White Plains NY 712,135 57.6 31.5
Asheville NC 578,469 74.7 47.2
Charlotte NC 1,270,661 72.4 65.2
Durham NC 845,359 91.7 37.1
Greensboro NC 315,613 84.0 28.3
Greenville NC 560,227 69.9 31.9
Hickory NC 203,696 88.7 51.9
Raleigh NC 938,652 83.1 36.4
Wilmington NC 306,199 82.7 50.2
Winston-Salem NC 610,810 66.0 39.2
Bismarck ND 184,179 130.2 44.4
Fargo/Moorhead MN ND 375,347 110.3 33.7
Grand Forks ND 123,966 95.8 25.0
Minot ND 104,868 88.9 37.3
Akron OH 376,023 142.0 76.4
Canton OH 385,753 108.1 54.7
Cincinnati OH 879,493 73.4 41.9
Cleveland OH 1,340,774 76.0 57.2
Columbus OH 1,636,441 64.6 55.5
Dayton OH 711,358 72.9 51.4
Elyria OH 163,416 95.1 31.7
Kettering OH 255,125 64.4 65.1
Toledo OH 607,040 131.7 51.0
Youngstown OH 448,648 78.9 55.4
Lawton OK 138,559 112.7 47.6
Oklahoma City OK 1,176,503 95.7 29.3
Tulsa OK 788,484 76.9 29.3
Rates are adjusted for age, sex, and race. Blank cells indicate that the rate was suppressed due to a small number of events occurring in the region during the study period. The averages were created based on odd-numbered years from 2001 to 2011.
A DARTMOUTH ATLAS OF HEALTH CARE SERIES 33
Appendix Table. Rates of inpatient lumbar decompression and fusion for lumbar spinal stenosis among hospital referral regions (2001-11)
HRR Name State Number of Medicare beneficiaries Lumbar decompression per 100,000 Medicare beneficiaries Lumbar fusion per 100,000 Medicare beneficiaries
Bend OR 121,059 154.2 33.1
Eugene OR 391,361 149.8 57.2
Medford OR 323,665 107.2 60.1
Portland OR 898,954 149.0 42.3
Salem OR 100,701 127.5 47.3
Allentown PA 824,563 89.5 33.5
Altoona PA 179,896 54.3 50.4
Danville PA 360,304 70.1 41.6
Erie PA 512,378 93.6 37.5
Harrisburg PA 696,969 85.8 64.6
Johnstown PA 113,991 93.3 44.8
Lancaster PA 423,965 159.3 54.4
Philadelphia PA 1,955,482 64.7 27.1
Pittsburgh PA 1,504,518 111.1 59.1
Reading PA 394,268 61.5 40.6
Sayre PA 155,201 67.7 37.5
Scranton PA 270,765 89.8 17.1
Wilkes-Barre PA 219,944 47.4 25.2
York PA 297,112 136.1 62.4
Providence RI 615,563 55.2 43.1
Charleston SC 651,793 98.6 71.9
Columbia SC 726,297 85.9 58.5
Florence SC 241,915 103.3 74.7
Greenville SC 564,871 98.0 36.4
Spartanburg SC 246,860 100.2 26.0
Rapid City SD 151,118 77.4 51.8
Sioux Falls SD 652,940 86.3 73.0
Chattanooga TN 451,315 50.7 31.8
Jackson TN 267,675 67.5 24.0
Johnson City TN 174,303 48.5 37.5
Kingsport TN 307,496 57.8 29.9
Knoxville TN 846,740 70.6 35.8
Memphis TN 1,021,060 59.4 23.5
Nashville TN 1,446,374 88.1 67.9
Abilene TX 246,124 71.2 39.3
Amarillo TX 302,164 132.0 32.8
Austin TX 635,194 79.8 50.0
Beaumont TX 298,469 96.8 32.7
Bryan TX 121,785 155.7 35.1
Corpus Christi TX 278,392 70.5 44.2
Dallas TX 1,913,948 70.3 40.3
El Paso TX 543,167 57.5 35.1
Fort Worth TX 812,985 55.8 47.5
Harlingen TX 266,872 85.5 40.8
A Dartmouth Atlas of Health Care Series
34 vARIATION IN THE CASE OF SURGICAL CONDITIONS: SPINAL STENOSIS
Appendix Table. Rates of inpatient lumbar decompression and fusion for lumbar spinal stenosis among hospital referral regions (2001-11)
HRR Name State Number of Medicare beneficiaries Lumbar decompression per 100,000 Medicare beneficiaries Lumbar fusion per 100,000 Medicare beneficiaries
Houston TX 2,405,919 103.3 27.7
Longview TX 144,511 118.0 67.9
Lubbock TX 444,739 81.9 34.5
McAllen TX 255,625 73.2 37.9
Odessa TX 206,455 110.9 62.3
San Angelo TX 125,445 85.5 34.7
San Antonio TX 1,184,382 55.4 39.6
Temple TX 156,536 36.8 27.8
Tyler TX 434,016 106.3 88.5
Victoria TX 119,113 78.1 38.0
Waco TX 219,028 44.2 43.8
Wichita Falls TX 163,689 74.3 42.8
Ogden UT 183,192 94.4 29.2
Provo UT 161,789 89.9 30.8
Salt Lake City UT 836,139 80.9 45.7
Burlington vT 449,412 59.1 30.0
Arlington vA 866,789 52.5 66.5
Charlottesville vA 400,815 99.2 48.5
Lynchburg vA 197,415 151.0 27.9
Newport News vA 362,626 104.5 87.4
Norfolk vA 726,543 56.0 67.9
Richmond vA 1,016,211 82.0 64.3
Roanoke vA 547,605 95.6 29.0
Winchester vA 278,536 89.6 44.8
Everett WA 281,257 110.0 28.9
Olympia WA 206,427 126.0 57.5
Seattle WA 1,322,823 112.4 44.3
Spokane WA 932,111 145.0 52.3
Tacoma WA 353,221 200.7 63.5
Yakima WA 168,224 116.0 44.4
Charleston Wv 616,385 45.6 21.1
Huntington Wv 267,118 62.6 19.6
Morgantown Wv 276,451 59.0 25.3
Appleton WI 179,914 77.3 50.9
Green Bay WI 344,975 121.8 32.1
La Crosse WI 216,541 85.9 19.4
Madison WI 643,338 66.1 35.6
Marshfield WI 272,431 50.0 27.0
Milwaukee WI 1,528,985 69.1 33.3
Neenah WI 142,774 78.4 47.7
Wausau WI 145,152 40.9 33.8
Casper WY 145,133 155.8 73.4
United States US 165,390,225 80.0 41.1
Rates are adjusted for age, sex, and race. Blank cells indicate that the rate was suppressed due to a small number of events occurring in the region during the study period. The averages were created based on odd-numbered years from 2001 to 2011.
A DARTMOUTH ATLAS OF HEALTH CARE SERIES 35
References1 Deyo RA, Phillips WR. Low back pain. A primary care challenge. Spine. 1996 Dec 15;21(24):2826-32.
2 Biering-Sørensen F. A prospective study of low back pain in a general population. III. Medical service--work consequence. Scand J Rehabil Med. 1983;15(2):89-96.
3 Frymoyer JW, Pope MH, Clements JH, Wilder DG, MacPherson B, Ashikaga T. Risk factors in low-back pain. An epidemiological survey. J Bone Joint Surg Am. 1983 Feb;65(2):213-8.
4 Deyo RA, Mirza SK, Martin BI. Back pain prevalence and visit rates: estimates from U.S. national surveys, 2002. Spine. 2006 Nov 1;31(23):2724-7.
5 Lawrence RC, Felson DT, Helmick CG, Arnold LM, Choi H, Deyo RA, Gabriel S, Hirsch R, Hochberg MC, Hunder GG, Jordan JM, Katz JN, Kremers HM, Wolfe F; National Arthritis Data Workgroup. Estimates of the prevalence of arthritis and other rheumatic conditions in the United States. Part II. Arthritis Rheum. 2008 Jan;58(1):26-35.
6 Hart LG, Deyo RA, Cherkin DC. Physician office visits for low back pain. Frequency, clinical evaluation, and treatment patterns from a U.S. national survey. Spine. 1995 Jan 1;20(1):11-9.
7 Deyo RA, Cherkin D, Conrad D, Volinn E. Cost, controversy, crisis: low back pain and the health of the public. Annu Rev Public Health. 1991;12:141-56.
8 Deyo RA, Tsui-Wu YJ. Descriptive epidemiology of low-back pain and its related medical care in the United States. Spine. 1987 Apr;12(3):264-8.
9 Martin BI, Deyo RA, Mirza SK, Turner JA, Comstock BA, Hollingworth W, Sullivan SD. Expenditures and health status among adults with back and neck problems. JAMA. 2008 Feb 13;299(6):656-64.
10 Is the growth in spine procedures in the United States finally beginning to tail off? The Back Letter. 2012 Aug;27(8):85-93.
11 Freburger JK, Holmes GM, Agans RP, Jackman AM, Darter JD, Wallace AS, Castel LD, Kalsbeek WD, Carey TS. The rising prevalence of chronic low back pain. Arch Intern Med. 2009 Feb 9;169(3):251-8.
12 Martin LG, Freedman VA, Schoeni RF, Andreski PM. Trends in disability and related chronic conditions among people ages fifty to sixty-four. Health Affairs. 2010 Apr;29(4):725-31.
13 Weinstein JN, Lurie JD, Olson PR, Bronner KK, Fisher ES. United States’ trends and regional variations in lumbar spine surgery: 1992-2003. Spine. 2006 Nov 1;31(23):2707-14.
14 Schoenfeld AJ, Harris MB, Liu H, Birkmeyer JD. Variations in Medicare payments for episodes of spine surgery. Spine J. 2014 Jul 11. [Epub ahead of print]
15 Johnsson KE, Rosén I, Udén A. The natural course of lumbar spinal stenosis. Clin Orthop Relat Res. 1992 Jun;(279):82-6.
16 Kalichman L, Cole R, Kim DH, Li L, Suri P, Guermazi A, Hunter DJ. Spinal stenosis prevalence and association with symptoms: the Framingham Study. Spine J. 2009 Jul;9(7):545-50.
17 Mamisch N, Brumann M, Hodler J, Held U, Brunner F, Steurer J; Lumbar Spinal Stenosis Outcome Study Working Group Zurich. Radiologic criteria for the diagnosis of spinal stenosis: results of a Delphi survey. Radiology. 2012 Jul;264(1):174-9.
18 Suri P, Rainville J, Kalichman L, Katz JN. Does this older adult with lower extremity pain have the clinical syndrome of lumbar spinal stenosis? JAMA. 2010 Dec 15;304(23):2628-36.
19 Steurer J, Roner S, Gnannt R, Hodler J; LumbSten Research Collaboration. Quantitative radiologic criteria for the diagnosis of lumbar spinal stenosis: a systematic literature review. BMC Musculoskelet Disord. 2011 Jul 28;12:175.
20 Haig AJ. Correlation between disability and MRI findings in lumbar spinal stenosis. Acta Orthop. 2011 Oct;82(5):637; author reply 637-8.
21 Haig AJ, Tong HC, Yamakawa KS, Quint DJ, Hoff JT, Chiodo A, Miner JA, Choksi VR, Geisser ME, Parres CM. Spinal stenosis, back pain, or no symptoms at all? A masked study comparing radiologic and electrodiagnostic diagnoses to the clinical impression. Arch Phys Med Rehabil. 2006 Jul;87(7):897-903.
22 Geisser ME, Haig AJ, Tong HC, Yamakawa KS, Quint DJ, Hoff JT, Miner JA, Phalke VV. Spinal canal size and clinical symptoms among persons diagnosed with lumbar spinal stenosis. Clin J Pain. 2007 Nov-Dec;23(9):780-5.
23 Jarvik JJ, Hollingworth W, Heagerty P, Haynor DR, Deyo RA. The Longitudinal Assessment of Imaging and Disability of the Back (LAIDBack) Study: baseline data. Spine. 2001 May 15;26(10):1158-66.

A Dartmouth Atlas of Health Care Series
36 vARIATION IN THE CASE OF SURGICAL CONDITIONS: SPINAL STENOSIS
24 Boden SD, McCowin PR, Davis DO, Dina TS, Mark AS, Wiesel S. Abnormal magnetic-resonance scans of the cervical spine in asymptomatic subjects. A prospective investigation. J Bone Joint Surg Am. 1990 Sep;72(8):1178-84.
25 Deyo RA, Mirza SK, Turner JA, Martin BI. Overtreating chronic back pain: time to back off? J Am Board Fam Med. 2009 Jan-Feb;22(1):62-8.
26 Chou R, Huffman LH; American Pain Society; American College of Physicians. Medications for acute and chronic low back pain: a review of the evidence for an American Pain Society/American College of Physicians clinical practice guideline. Ann Intern Med. 2007 Oct 2;147(7):505-14.
27 Chan AT, Manson JE, Albert CM, Chae CU, Rexrode KM, Curhan GC, Rimm EB, Willett WC, Fuchs CS. Nonsteroidal antiinflammatory drugs, acetaminophen, and the risk of cardiovascular events. Circulation. 2006 Mar 28;113(12):1578-87.
28 Kuijpers T, van Middelkoop M, Rubinstein SM, Ostelo R, Verhagen A, Koes BW, van Tulder MW. A systematic review on the effectiveness of pharmacological interventions for chronic non-specific low-back pain. Eur Spine J. 2011 Jan;20(1):40-50.
29 Dersh J, Mayer TG, Gatchel RJ, Polatin PB, Theodore BR, Mayer EA. Prescription opioid dependence is associated with poorer outcomes in disabling spinal disorders. Spine. 2008 Sep 15;33(20):2219-27.
30 Doverty M, White JM, Somogyi AA, Bochner F, Ali R, Ling W. Hyperalgesic responses in methadone maintenance patients. Pain. 2001 Feb 1;90(1-2):91-6.
31 Chu LF, Clark DJ, Angst MS. Opioid tolerance and hyperalgesia in chronic pain patients after one month of oral morphine therapy: a preliminary prospective study. J Pain. 2006 Jan;7(1):43-8.
32 McDonald DC, Carlson K, Izrael D. Geographic variation in opioid prescribing in the U.S. J Pain. 2012 Oct;13(10):988-96.
33 Eriksen J, Sjøgren P, Bruera E, Ekholm O, Rasmussen NK. Critical issues on opioids in chronic non-cancer pain: an epidemiological study. Pain. 2006 Nov;125(1-2):172-9.
34 Chaparro LE, Furlan AD, Deshpande A, Mailis-Gagnon A, Atlas S, Turk DC. Opioids compared with placebo or other treatments for chronic low back pain: an update of the Cochrane Review. Spine. 2014 Apr 1;39(7):556-63.
35 Sullivan MD, Edlund MJ, Steffick D, Unützer J. Regular use of prescribed opioids: association with common psychiatric disorders. Pain. 2005 Dec 15;119(1-3):95-103.
36 Chou R, Fanciullo GJ, Fine PG, et al.; for the American Pain Society and American Academy of Pain Medicine Opioid Guidelines Panel. Clinical guidelines for the use of chronic opioid therapy in chronic noncancer pain. J Pain. 2009;10(2):113–130.
37 Parker SL, Godil SS, Mendenhall SK, Zuckerman SL, Shau DN, McGirt MJ. Two-year comprehensive medical management of degenerative lumbar spine disease (lumbar spondylolisthesis, stenosis, or disc herniation): a value analysis of cost, pain, disability, and quality of life. J Neurosurg Spine. 2014 Aug;21(2):143-9.
38 Scientific approach to the assessment and management of activity-related spinal disorders. A monograph for clinicians. Report of the Quebec Task Force on Spinal Disorders. Spine. 1987 Sep;12(7 Suppl):S1-59.
39 Ammendolia C, Stuber K, de Bruin LK, Furlan AD, Kennedy CA, Rampersaud YR, Steenstra IA, Pennick V. Nonoperative treatment of lumbar spinal stenosis with neurogenic claudication: a systematic review. Spine. 2012 May 1;37(10):E609-16.
40 Weinstein JN, Tosteson TD, Lurie JD, Tosteson AN, Blood E, Hanscom B, Herkowitz H, Cammisa F, Albert T, Boden SD, Hilibrand A, Goldberg H, Berven S, An H; SPORT Investigators. Surgical versus nonsurgical therapy for lumbar spinal stenosis. N Engl J Med. 2008 Feb 21;358(8):794-810.
41 Friedly J, Chan L, Deyo R. Increases in lumbosacral injections in the Medicare population: 1994 to 2001. Spine. 2007 Jul 15;32(16):1754-60.
42 Friedly J, Chan L, Deyo R.Geographic variation in epidural steroid injection use in Medicare patients. J Bone Joint Surg Am. 2008 Aug;90(8):1730-7.
43 Airaksinen O, Brox JI, Cedraschi C, Hildebrandt J, Klaber-Moffett J, Kovacs F, Mannion AF, Reis S, Staal JB, Ursin H, Zanoli G; COST B13 Working Group on Guidelines for Chronic Low Back Pain. Chapter 4. European guidelines for the management of chronic nonspecific low back pain. Eur Spine J. 2006 Mar;15 Suppl 2:S192-300.
44 Armon C, Argoff CE, Samuels J, Backonja MM; Therapeutics and Technology Assessment Subcommittee of the American Academy of Neurology. Assessment: use of epidural steroid injections to treat radicular lumbosacral pain: report of the Therapeutics and Technology Assessment Subcommittee of the American Academy of Neurology. Neurology. 2007 Mar 6;68(10):723-9.

A DARTMOUTH ATLAS OF HEALTH CARE SERIES 37
45 Arden NK, Price C, Reading I, Stubbing J, Hazelgrove J, Dunne C, Michel M, Rogers P, Cooper C; WEST Study Group. A multicentre randomized controlled trial of epidural corticosteroid injections for sciatica: the WEST study. Rheumatology. 2005 Nov;44(11):1399-406.
46 Carette S, Leclaire R, Marcoux S, Morin F, Blaise GA, St-Pierre A, Truchon R, Parent F, Levésque J, Bergeron V, Montminy P, Blanchette C. Epidural corticosteroid injections for sciatica due to herniated nucleus pulposus. N Engl J Med. 1997 Jun 5;336(23):1634-40.
47 Cuckler JM, Bernini PA, Wiesel SW, Booth RE Jr, Rothman RH, Pickens GT. The use of epidural steroids in the treatment of lumbar radicular pain. A prospective, randomized, double-blind study. J Bone Joint Surg Am. 1985 Jan;67(1):63-6.
48 Wilson-MacDonald J, Burt G, Griffin D, Glynn C. Epidural steroid injection for nerve root compression. A randomised, controlled trial. J Bone Joint Surg Br. 2005 Mar;87(3):352-5.
49 Friedly J, Nishio I, Bishop MJ, Maynard C. The relationship between repeated epidural steroid injections and subsequent opioid use and lumbar surgery. Arch Phys Med Rehabil. 2008 Jun;89(6):1011-5.
50 Friedly JL, Comstock BA, Turner JA, Heagerty PJ, Deyo RA, Sullivan SD, Bauer Z, Bresnahan BW, Avins AL, Nedeljkovic SS, Nerenz DR, Standaert C, Kessler L, Akuthota V, Annaswamy T, Chen A, Diehn F, Firtch W, Gerges FJ, Gilligan C, Goldberg H, Kennedy DJ, Mandel S, Tyburski M, Sanders W, Sibell D, Smuck M, Wasan A, Won L, Jarvik JG. A randomized trial of epidural glucocorticoid injections for spinal stenosis. N Engl J Med. 2014 Jul 3;371(1):11-21.
51 Mobbs RJ, Li J, Sivabalan P, Raley D, Rao PJ. Outcomes after decompressive laminectomy for lumbar spinal stenosis: comparison between minimally invasive unilateral laminectomy for bilateral decompression and open laminectomy. Neurosurg Spine. 2014 Aug;21(2):179-86.
52 Nomura H, Yanagisawa Y, Arima J, Oga M. Clinical outcome of microscopic lumbar spinous process-splitting laminectomy. J Neurosurg Spine. 2014 Aug;21(2):187-94.
53 Djurasovic M, Glassman SD, Carreon LY, Dimar JR 2nd. Contemporary management of symptomatic lumbar spinal stenosis. Orthop Clin North Am. 2010 Apr;41(2):183-91.
54 Resnick DK, Watters WC 3rd, Mummaneni PV, Dailey AT, Choudhri TF, Eck JC, Sharan A, Groff MW, Wang JC, Ghogawala Z, Dhall SS, Kaiser MG. Guideline update for the performance of fusion procedures for degenerative disease of the lumbar spine. Part 10: lumbar fusion for stenosis without spondylolisthesis. J Neurosurg Spine. 2014 Jul;21(1):62-6.
55 Turner JA, Ersek M, Herron L, Deyo R. Surgery for lumbar spinal stenosis. Attempted meta-analysis of the literature. Spine. 1992 Jan;17(1):1-8.
56 Munting E, Röder C, Sobottke R, Dietrich D, Aghayev E; on behalf of the Spine Tango Contributors. Patient outcomes after laminotomy, hemilaminectomy, laminectomy and laminectomy with instrumented fusion for spinal canal stenosis: a propensity score-based study from the Spine Tango registry. Eur Spine J. 2014 May 20. [Epub ahead of print]
57 Malmivaara A, Slätis P, Heliövaara M, Sainio P, Kinnunen H, Kankare J, Dalin-Hirvonen N, Seitsalo S, Herno A, Kortekangas P, Niinimäki T, Rönty H, Tallroth K, Turunen V, Knekt P, Härkänen T, Hurri H; Finnish Lumbar Spinal Research Group. Surgical or nonoperative treatment for lumbar spinal stenosis? A randomized controlled trial. Spine. 2007 Jan 1;32(1):1-8.
58 Amundsen T, Weber H, Nordal HJ, Magnaes B, Abdelnoor M, Lilleâs F. Lumbar spinal stenosis: conservative or surgical management?: A prospective 10-year study. Spine. 2000 Jun 1;25(11):1424-35; discussion 1435-6.
59 Atlas SJ, Keller RB, Wu YA, Deyo RA, Singer DE. Long-term outcomes of surgical and nonsurgical management of lumbar spinal stenosis: 8 to 10 year results from the maine lumbar spine study. Spine. 2005 Apr 15;30(8):936-43.
60 Deyo RA, Mirza SK, Martin BI, Kreuter W, Goodman DC, Jarvik JG. Trends, major medical complications, and charges associated with surgery for lumbar spinal stenosis in older adults. JAMA. 2010 Apr 7;303(13):1259-65.
61 Ong KL, Auerbach JD, Lau E, Schmier J, Ochoa JA. Perioperative outcomes, complications, and costs associated with lumbar spinal fusion in older patients with spinal stenosis and spondylolisthesis. Neurosurg Focus. 2014 Jun;36(6):E5.
62 Zucherman JF, Hsu KY, Hartjen CA, Mehalic TF, Implicito DA, Martin MJ, Johnson DR 2nd, Skidmore GA, Vessa PP, Dwyer JW, Puccio ST, Cauthen JC, Ozuna RM. A multicenter, prospective, randomized trial evaluating the X STOP interspinous process decompression system for the treatment of neurogenic intermittent claudication: two-year follow-up results. Spine. 2005 Jun 15;30(12):1351-8.

A Dartmouth Atlas of Health Care Series
38 vARIATION IN THE CASE OF SURGICAL CONDITIONS: SPINAL STENOSIS
63 Zucherman JF, Hsu KY, Hartjen CA, Mehalic TF, Implicito DA, Martin MJ, Johnson DR 2nd, Skidmore GA, Vessa PP, Dwyer JW, Puccio S, Cauthen JC, Ozuna RM. A prospective randomized multi-center study for the treatment of lumbar spinal stenosis with the X STOP interspinous implant: 1-year results. Eur Spine J. 2004 Feb;13(1):22-31.
64 Wu AM, Zhou Y, Li QL, Wu XL, Jin YL, Luo P, Chi YL, Wang XY. Interspinous spacer versus traditional decompressive surgery for lumbar spinal stenosis: a systematic review and meta-analysis. PLoS One. 2014 May 8;9(5):e97142.
65 Deyo RA, Martin BI, Ching A, Tosteson AN, Jarvik JG, Kreuter W, Mirza SK. Interspinous spacers compared with decompression or fusion for lumbar stenosis: complications and repeat operations in the Medicare population. Spine. 2013 May 1;38(10):865-72.
66 Hong P, Liu Y, Li H. Comparison of the efficacy and safety between interspinous process distraction device and open decompression surgery in treating lumbar spinal stenosis: a meta analysis. J Invest Surg. 2014 Jul 15. [Epub ahead of print]


The Dartmouth Atlas Working Group
LeadershipElliott S. Fisher, MD, MPH, Dartmouth Atlas Co-Principal InvestigatorDavid C. Goodman, MD, MS, Dartmouth Atlas Co-Principal InvestigatorJonathan S. Skinner, PhD, Senior ScholarJohn E. Wennberg, MD, MPH, Founder of the Dartmouth AtlasKristen K. Bronner, MA, Managing Editor
Senior Authors and FacultyJohn Erik-Bell, MDShannon Brownlee, MSJulie P.W. Bynum, MD, MPHChiang-Hua Chang, PhDPhilip P. Goodney, MD, MSNancy E. Morden, MD, MPHJeffrey C. Munson, MD, MSThérèse A. Stukel, PhDJames N. Weinstein, DO, MS
Analytic and Administrative StaffThomas A. Bubolz, PhDDonald Carmichael, MDivJulie Doherty, BAJennifer Dong, MSDaniel J. Gottlieb, MSJia Lan, MSMartha K. Lane, MAStephanie R. Raymond, BASandra M. Sharp, SMJeremy Smith, MPHYunjie Song, PhDDean T. Stanley, RHCEYin Su, MSStephanie Tomlin, MPARebecca Zaha, MPHWeiping Zhou, MS
Design and ProductionJonathan Sa’adah and Elizabeth Adams
The Dartmouth Atlas Project works to accurately describe how medical resources are distributed and used in the United States. The project offers comprehensive information and analysis about national, regional, and local markets, as well as individual hospitals and their affiliated physicians, in order to provide a basis for improving health and health systems. Through this analysis, the project has demonstrated glaring variations in how health care is delivered across the United States.
A Report of the Dartmouth Atlas Project
The Dartmouth Atlas Project is funded by the Robert Wood Johnson Foundation and the California Healthcare Foundation.
The Dartmouth AtlasThe Dartmouth Institute for Health Policy and Clinical Practice
Center for Health Policy Research
Contact: Annmarie Christensen (603) 653-0897 [email protected]
www.dartmouthatlas.org
10282014_dap1.2 Copyright 2014 by the Trustees of Dartmouth College