Embed Size (px)
Citation preview

ARTICLEdoi:10.1038/nature11405
An anatomically comprehensive atlas ofthe adult human brain transcriptomeMichael J. Hawrylycz1*, Ed S. Lein1*, Angela L. Guillozet-Bongaarts1, Elaine H. Shen1, Lydia Ng1, Jeremy A. Miller1, Louie N. van deLagemaat2, Kimberly A. Smith1, Amanda Ebbert1, Zackery L. Riley1, Chris Abajian1, Christian F. Beckmann3, Amy Bernard1,Darren Bertagnolli1, Andrew F. Boe1, Preston M. Cartagena4, M. Mallar Chakravarty1,5, Mike Chapin1, Jimmy Chong1,Rachel A. Dalley1, Barry David Daly6, Chinh Dang1, Suvro Datta1, Nick Dee1, Tim A. Dolbeare1, Vance Faber1, David Feng1,David R. Fowler7, Jeff Goldy1, Benjamin W. Gregor1, Zeb Haradon1, David R. Haynor8, John G. Hohmann1, Steve Horvath9,Robert E. Howard1, Andreas Jeromin10, Jayson M. Jochim1, Marty Kinnunen1, Christopher Lau1, Evan T. Lazarz1, Changkyu Lee1,Tracy A. Lemon1, Ling Li11, Yang Li1, John A. Morris1, Caroline C. Overly1, Patrick D. Parker1, Sheana E. Parry1, Melissa Reding1,Joshua J. Royall1, Jay Schulkin12, Pedro Adolfo Sequeira13, Clifford R. Slaughterbeck1, Simon C. Smith14, Andy J. Sodt1,Susan M. Sunkin1, Beryl E. Swanson1, Marquis P. Vawter13, Derric Williams1, Paul Wohnoutka1, H. Ronald Zielke15,Daniel H. Geschwind16, Patrick R. Hof17, Stephen M. Smith18, Christof Koch1,19, Seth G. N. Grant2 & Allan R. Jones1
Neuroanatomically precise, genome-wide maps of transcript distributions are critical resources to complement genomicsequence data and to correlate functional and genetic brain architecture. Here we describe the generation and analysis ofa transcriptional atlas of the adult human brain, comprising extensive histological analysis and comprehensivemicroarray profiling of 900 neuroanatomically precise subdivisions in two individuals. Transcriptional regulationvaries enormously by anatomical location, with different regions and their constituent cell types displaying robustmolecular signatures that are highly conserved between individuals. Analysis of differential gene expression and geneco-expression relationships demonstrates that brain-wide variation strongly reflects the distributions of major cellclasses such as neurons, oligodendrocytes, astrocytes and microglia. Local neighbourhood relationships between fineanatomical subdivisions are associated with discrete neuronal subtypes and genes involved with synaptic transmission.The neocortex displays a relatively homogeneous transcriptional pattern, but with distinct features associatedselectively with primary sensorimotor cortices and with enriched frontal lobe expression. Notably, the spatialtopography of the neocortex is strongly reflected in its molecular topography—the closer two cortical regions, themore similar their transcriptomes. This freely accessible online data resource forms a high-resolution transcriptionalbaseline for neurogenetic studies of normal and abnormal human brain function.
The enormous complexity of the human brain is a function of itsprecise circuitry, its structural and cellular diversity, and, ultimately,the regulation of its underlying transcriptome. In rodents, brain-and transcriptome-wide, cellular-resolution maps of transcriptdistributions are widely useful resources to complement genomicsequence data1–3. However, owing to the challenges of a 1,000-foldincrease in size from mouse to human, limitations in post-mortemtissue availability and quality, and the destructive nature of molecularassays, there has been no human counterpart so far. Severalimportant recent studies have begun to analyse transcriptionaldynamics during human brain development4,5, although only in asmall number of relatively coarse brain regions. Characterizingthe complete transcriptional architecture of the human brain willprovide important information for understanding the impact ofgenetic disorders on different brain regions and functional circuits.
Furthermore, conservation and divergence in brain function betweenhumans and other species provide essential information for theunderstanding of drug action, which is often poorly conserved acrossspecies6.
The goal of the Allen Human Brain Atlas is to create a com-prehensive map of transcript usage across the entire adult brain, withthe emphasis on anatomically complete coverage at a fine nuclearresolution in a small number of high-quality, clinically unremarkablebrains profiled with DNA microarrays for quantitative gene-leveltranscriptome coverage. Furthermore, structural brain imaging datawere obtained from each individual to visualize gene expression datain its native three-dimensional anatomical coordinate space, and toallow correlations between imaging and transcriptome modalities.These data are freely accessible via the Allen Brain Atlas data portal(http://www.brain-map.org).
*These authors contributed equally to this work.
1Allen Institute for Brain Science, Seattle, Washington 98103, USA. 2Genes to Cognition Programme, Edinburgh University, Edinburgh EH16 4SB, UK. 3MIRA Institute, University of Twente & DondersInstitute, Radboud University Nijmegen, Nijmegen, Netherlands. 4Department of Psychiatry & Human Behavior, University of California, Irvine, California 92697, USA. 5Kimel Family Translational Imaging-Genetics Laboratory, Centre for Addiction and Mental Health Toronto, Ontario M5S 2S1, Canada. 6University of Maryland School of Medicine, Department of Diagnostic Radiology, University of MarylandMedical Center, Baltimore, Maryland 21201, USA. 7Department of Pathology, University of Maryland School of Medicine, Baltimore, Maryland 21201, USA. 8Department of Radiology, University ofWashington, Seattle, Washington 98195, USA. 9Department of Human Genetics, Gonda Research Center, David Geffen School of Medicine, Los Angeles, California 90095, USA. 10Banyan Biomarkers, Inc.,Alachua, Florida 32615, USA. 11Office of the Chief Medical Examiner, Baltimore, MD, Department of Pediatrics, University of Maryland, Baltimore, Maryland 21201, USA. 12Department of Neuroscience,Georgetown University, School of Medicine, Washington DC 20007, USA. 13Functional Genomics Laboratory, Department of Psychiatry & Human Behavior, School of Medicine, University of California,Irvine, California 92697, USA. 14Histion LLC, Everett, Washington 98204, USA. 15The Eunice Kennedy Shriver NICHD Brain and Tissue Bank for Developmental Disorders, University of Maryland, Baltimore,Maryland 21201, USA. 16Program in Neurogenetics, Department of Neurology and Department of Human Genetics, and Semel Institute, David Geffen School of Medicine-UCLA, Los Angeles, California90095, USA. 17Fishberg Department of Neuroscience and Friedman Brain Institute, Mount Sinai School of Medicine, New York, New York 10029, USA. 18FMRIB, Oxford University, Oxford OX3 9DU, UK.19Computation & Neural Systems, California Institute of Technology, Pasadena, California 91125, USA.
2 0 S E P T E M B E R 2 0 1 2 | V O L 4 8 9 | N A T U R E | 3 9 1
Macmillan Publishers Limited. All rights reserved©2012

Global mapping of transcript distributionsA tissue processing and data collection pipeline was established toimage the brain and subsequently dissect tissue samples fromapproximately 900 anatomically defined sites for RNA isolation andmicroarray analysis (Fig. 1 and Supplementary Methods 1). Twocomplete normal male brains were analysed from donors aged 24and 39 years and are referred to here as Brain 1 and Brain 2(Supplementary Table 1). Briefly, cooled brains underwent in craniomagnetic resonance imaging (MRI) followed by embedding, slabbingand freezing. Whole-brain cryosections were made from each slab,after which the slabs were subdivided and sectioned on 2 3 3 inchslides for histological analysis with Nissl and other markers for struc-ture identification. Defined brain regions were isolated either usingmacrodissection (cortical gyri, other large structures) or laser micro-dissection (LMD; Leica LMD6000, Leica Microsystems) from tissuesections on polyethylene naphthalate (PEN) membrane slides (LeicaMicrosystems). Any given anatomical structure was first identified onthe basis of histological data, and then sampled in a series of contigu-ous coronal slabs in both hemispheres. RNA was isolated from eachsample and used to generate labelled cRNA probes for hybridizationto custom 64K Agilent microarrays. The output of this pipeline was aset of microarrays that sample the entire spatial extent of neocorticalgyri that could be reproducibly identified across individuals, as well assubcortical nuclear structures, at the resolution allowed by Nisslstaining and sample size requirements for microarray analysis. One-hundred and seventy distinct structures were assayed at least oncein both brains, and 146 structures twice or more (Supplementary
Table 2). Sample locations were mapped back into the native brainMRI coordinates and subsequently to Montreal Neurological Institute(MNI) coordinate space7.
These microarray data form the foundation for a publicly accessibleonline atlas, which includes viewers for microarray data visualizationand mining, MRI/histology/sample location, and three-dimensional(3D) visualization of MRI and gene expression. To complement andvalidate the microarray data, several targeted, large-scale in situhybridization (ISH) data sets were generated using a high-throughputISH platform1,8. All of these data are linked with the other databasesavailable via the Allen Brain Atlas data portal (http://www.brain-map.org) to facilitate comparative analyses with developing and adultmouse, rhesus macaque and human.
The output of the data generation pipeline described above is adetailed quantitative map of transcript distribution across the entirebrain. As one example, Fig. 2a depicts the structural distribution of geneexpression related to dopaminergic neurotransmission, illustrating thehighly localized enrichment of genes associated with dopamine syn-thesis, packaging, degradation and postsynaptic signalling. Regionalenrichments were conserved between the two brains (note similar peaksin paired rows for Brain 1 and 2; Fig. 2a) and were consistent withprevious studies9,10. For example, tyrosine hydroxylase (TH) is enrichedin the substantia nigra pars compacta (SNC), ventral tegmental area(VTA), and hypothalamic supraoptic and preoptic nuclei, as well as inthe locus ceruleus, the neurons of which use dopamine as a precursorfor noradrenaline. Similar brain-wide plots for other neurotransmittersystems are provided in Supplementary Fig. 1.
Data access • visualization • mining
Microarray data visualization and search
capabilities
Gene, structure, correlation-based queries
Allen Human Brain Atlas
3D visualization of gene expression data
in MRI coordinate space
Anatomical reference data visualization
e
ontology
Br GM
DiE ET
Hy
Tel Cx
Cxn AO
BF
BG GP
Str
+
+
+
+
+
LIMS
databases
Data integration, storage and retrievald
Mapping microarray sampling
coordinates into 3D MRI coordinate
space
Histological and ISH image processing
Microarray data normalization
Informatics and data analysisc
Medium format anatomical reference dataNissl
SMI-32
ISH markers
Nissl
SMI-32
Imaging MRI
Data modalities
Custom Agilent microarrays
Transcriptional profiling ~1,000 samples per brain
Expert structural annotation
Neuroanatomical
b
NEFHGRIN1GAP43GAD1
Fine structural sample isolation
Sample isolation and processing
a
6
Specimen acquisition
Slabbing, large format sectioning
and histology
2
3
1
Subdivision, medium format
sectioning and histology
4
5
7
8
Slab face
images
Large format anatomical reference data
Whole-brain histology
Figure 1 | Data generation and analysis pipeline. a, Experimental strategy tosubdivide intact brains and isolate precise anatomical samples. b, Anatomicalreference data are collected at each stage, including whole-brain MRI, large-format slab face and histology, medium (2 3 3-inch slide) format Nisslhistology and ISH, and images of dissections. In Brain 2, labelling wasperformed for additional markers as shown. Histology data are used to identifystructures, which are assembled into a database using a formal
neuroanatomical ontology (d), and to guide laser microdissection of samples(a, lower panel). Isolated RNA is used for microarray profiling of ,900 samplesper brain (b, lower panel). c, Microarray data are normalized and samplecoordinates mapped to native 3D MRI coordinates. e, Data visualization andmining tools underlie the online public data resource. Numbers in a andb denote the order of sample processing steps leading to microarray datageneration.
RESEARCH ARTICLE
3 9 2 | N A T U R E | V O L 4 8 9 | 2 0 S E P T E M B E R 2 0 1 2
Macmillan Publishers Limited. All rights reserved©2012

Interestingly, no statistically significant hemispheric differencescould be identified at this fine structural level that were corroboratedin both brains (paired one-sided t-tests, P , 0.01, Benjamini–Hochberg (BH)-corrected). Although surprising given well describedlateralization of function, this finding is consistent with a recent studyof developing human neocortex that failed to identify hemisphericdifferences despite extensive efforts using microarrays and quantitativePCR11. It may be that the basis for lateralization of function involvesmore subtle changes in specific cellular components, differences inrelative area rather than type of functional domains between hemi-spheres, or is more related to functional connectivity patterns thanmolecular differentiation. Given this observation and to increasestatistical power, samples from the two hemispheres for each structurewere pooled for all subsequent analyses. In each brain independently,84% of unique transcripts on the microarrays (29,412, referred to asgenes for this manuscript) were found to be expressed in at least onestructure (91.4% overlap in expressed gene sets between brains), con-sistent with the percentage of genes expressed in mouse brain by ISH(80%; ref. 1) and fetal human brain by microarrays (76%; ref. 11).Expression levels across anatomical structures were strongly correlatedbetween brains (Pearson r 5 0.98, P , 10240), with a highly significant
correlation in differential expression relationships between structures(Pearson r 5 0.46, P , 10240). Later in our analysis we completed datageneration from a single (left) hemisphere of a third specimen. Wefound strong corroboration of overall expression levels and foldchanges between structures in all three brains (Supplementary Fig. 2).
To illustrate the value of these data in understanding the functionalorganization of neurotransmission, we examined the 740 genes iden-tified in the human excitatory postsynaptic density (PSD12), and inparticular those that varied in their neuroanatomical distribution.Thirty-one per cent of PSD genes showed highly regional differentialexpression (Supplementary Methods 2 and Supplementary Table 3)(fold change .5 between any pair of 170 structures, false discoveryrate ,0.01), a significantly greater percentage than that observedacross all genes (21%, P , 1026, Mann–Whitney U-test). As expected,many synapse-associated Gene Ontology (GO) categories13 wereenriched in this gene set, even relative to the PSD genes as a whole,including synapse (GO: 0045202), synaptic vesicle (GO: 0008021),synaptic transmission (GO: 0007268), neurophysiological process(GO: 0050877) and receptor activity (GO: 0004872).
Expression patterns for the most differentially expressed 10% ofthese PSD genes between any pair of structures are displayed in Fig. 2b
Cau
date
nuc
leus
puta
men
Sub
stan
tia n
igra
, par
s co
mpa
cta
Vent
ral t
egm
enta
l are
a
Locu
s ce
rule
usRap
he n
ucle
i of t
he m
edul
la
Fron
tal lob
ePar
ieta
l lob
eTe
mpo
ral lob
eO
ccip
ital lob
eHip
poca
mpu
sStria
tum
Am
ygda
laTh
alam
us
Hyp
otha
lam
us
Mes
ence
phal
onPon
sM
yele
ncep
halo
nCer
ebel
lum
Whi
te m
atte
r
Tyrosine hydroxylase (TH)
Dopa decarboxylase (DDC)
Vesicular amine transporter 1 (SLC18A1)Vesicular amine transporter 1 (SLC18A2)
Monoamine oxidase A (MAOA)Monoamine oxidase B (MAOB)
Catechol-O-methyltransferase (COMT)
Noradrenaline transporter (SLC6A2)Dopamine transporter (SLC6A3)
pamine receptor D1 (Do DRD1(( )Dopamine receptor D2 (D DRD2(( )
Dopamine receptor D3 (DRD3)Dopamine receptor D4 (DRD4)
Dopamine receptor D5 (DRD5)
Synthesis
Packaging
Breakdown
Re-uptake
Receptors
Brain 2Brain 1
Myelin basic protein (MBP)
Myelin oligodendrocyte glycoprotein (MOG)Proteolipid protein 1 (PLP1)
Neurofilament polypeptides (NEFL, NEFM, NEFH)Ankyrin 1, erythrocytic (ANK1)
Visinin-like 1 (VSNL1)Amphiphysin (AMPH)
γ-aminobutyric acid (GABA) B receptor, 2 (GABBR2)
Homer homologue 1 (HOMER1) Disks-large-associated protein 2 (DLGAP2)
Syntaxin 1A (brain) (STX1A)Synaptosomal-associated protein, 25 kDa (SNAP25)
Synaptotagmin I (SYT1)
Phosphodiesterase 2A, cGMP-stimulated (PDE2A)Disks-large-associated protein 3 (DLGAP3)
Myelin basic protein (
Myelin oligodendrocProteolipid protein
NeurofilamentAnkyrin 1, erythr
Visinin-likAmphiphys
γ-aminobutyγγ
Homer Disks
SynSy
Fron
tal lob
e
Par
ieta
l lob
eTe
mpo
ral lob
eO
ccip
ital lob
e
Hip
poca
mpu
sStria
tum
Am
ygda
laTh
alam
usHyp
otha
lam
us
Mes
ence
phal
on
Pon
s
Mye
lenc
epha
lon
Cer
ebel
lum
Whi
te m
atte
r
Precentral gyrus (motor)
Oligodendrocyte-
enriched
Tem
poral p
ole
Fusifo
rm g
yrus
Primar
y visu
al c
orte
x
Hip
pocam
pal
form
atio
n
Cau
date,
put
amen
Glo
bus p
allid
us
Late
ral,
basol
ater
al,
cent
ral n
uclei
Dor
sal t
halam
us
Mid
brain
raphe
Parab
rach
ial n
uclei,
locu
s ce
ruleus
Whi
te m
atte
r
SSSSSSS
ocyte-
ed
Dopamine signalling pathway genes
Postsynaptic density genes
a
b
Figure 2 | Topography of transcript distributions for dopamine-signalling-and postsynaptic-density-associated genes. a, Gene expression profiles ofgenes associated with dopamine signalling plotted across 170 brain structuresin two brains. Expression profiles for each probe plotted as raw microarray datanormalized to mean structural expression, in paired rows to demonstrateconsistency between the two brains. b, Gene-clustered topographic
representation of the 74 most differentially expressed genes in human PSDpreparations12. Gene profiles represent average expression in each structurebetween brains, plotted as deviation from the median. Clusters correspond toselective spatial enrichment of genes related to synaptic function, as well as anoligodendrocyte-enriched gene cluster (front cluster).
ARTICLE RESEARCH
2 0 S E P T E M B E R 2 0 1 2 | V O L 4 8 9 | N A T U R E | 3 9 3
Macmillan Publishers Limited. All rights reserved©2012

(74 genes with at least a 10.6-fold difference). The synapse-associatedgenes clustered into groups enriched in specific regions, indicative of adiverse set of excitatory synapse subtypes. For example, the primarymotor cortex in the precentral gyrus, the origin of the longest rangeprojection neurons, is delineated by selective enrichment of neuro-filament proteins NEFL, NEFM and NEFH, which are frequentlyenriched in long-range projection neurons14. Surprisingly, a numberof the most differentially expressed PSD-associated genes seem to besynthesized by glia, an observation made obvious by the stereotypedstructural distribution of oligodendrocytes in white matter and otherbrain regions and the presence of well known myelin-associated genes(for example, myelin oligodendrocyte glycoprotein, MOG; myelinbasic protein, MBP) in this gene cluster (Fig. 2b, front rows). Thepresence of these proteins in PSD preparations may represent acarry-over of glial fragments. Alternatively, they may be componentsof glutamatergic synapses between neurons and oligodendrocytes,which have been shown to share many properties with neuronal–neuronal synapses15. Overall, these data show remarkable regionalvariation in synaptic gene expression that probably underlies func-tional distinctions between regions.
Global transcriptional architecture of the adult brainWe next investigated the dominant features of transcriptional vari-ation across the brain, beginning with global, brain-wide analysesand moving towards targeted local analyses of specific regions. Aninformative method for identifying biologically relevant patterns inhigh-dimensional microarray data sets is weighted gene co-expressionnetwork analysis (WGCNA)16,17, which groups genes into modulesthat have strongly covarying patterns across the sample set. Thismethod can identify gene expression patterns related to specific celltypes such as neurons and glia from heterogeneous samples such aswhole human cortex18, due to the highly distinct transcriptionalprofiles of these cell types and variation in their relative proportionsacross samples. Each module is represented by an ‘eigengene’ corres-ponding to its expression pattern across structures (first left singularvector of the gene 3 structure matrix16), and genes highly correlatedwith the module eigengene are called ‘hub’ genes. This unbiasedapproach allows a module’s function or cellular specificity to beimputed based on hub gene function, and allows statistical comparisoneither across studies to assign function or between brains to examinepreservation between individuals.
Applied to the entire 911 sample set from Brain 1, genes weregrouped into well-defined co-expression modules with specificanatomical distributions (Fig. 3a, b), consistent with previous studiesin brain tissues18,19. Gene modules were frequently related to primaryneural cell types and molecular functions (Fig. 3b, c). Several modulesidentify genes with enriched expression in neurons (M1–M2), basedon overlap with neural-cell-type-enriched gene sets identified in pre-vious studies18 (second row in Fig. 3b). Genes in these modules areenriched in the neocortex (fifth row in Fig. 3b), and in particularcortical divisions as shown in eigengene plots (Fig. 3c). Hub genesand enriched GO terms for these modules are associated with neuronalstructure and function and energy metabolism, as might be expectedgiven the high metabolic demands of neurons (Supplementary Table 4).Other modules showed subcortical enrichment and correspond toexpression in different types of glia (M8–M12), including microglia,astrocytes and oligodendrocytes. Additionally, one module with strik-ing anatomical specificity for the paraventricular thalamus and centralglial substance (asterisks in M5 eigengene histogram, Fig. 3c) corre-sponded to expression in the ventricular ependymal lining and choroidplexus. One highly regionalized neuron-related module (M6) wasenriched in the striatum (the dopamine receptor DRD1 in Fig. 2a is ahub gene). Thus, a major feature of the adult brain transcriptomeprofiled in this manner is the degree to which anatomical variationreflects the cellular make-up of different brain regions, both neuronaland non-neuronal.
The gene modules identified in Brain 1 were well conserved inBrain 2 as a whole (Fig. 3b), both at the level of regional gene expres-sion patterns (third row) and as measured by a module preservationindex (fourth row) using a summary Z-statistic as described previ-ously20. Modules corresponding to broad neural cell types also showedhighly significant preservation compared to a previous study usinghuman brain samples (ref. 19 and data not shown).
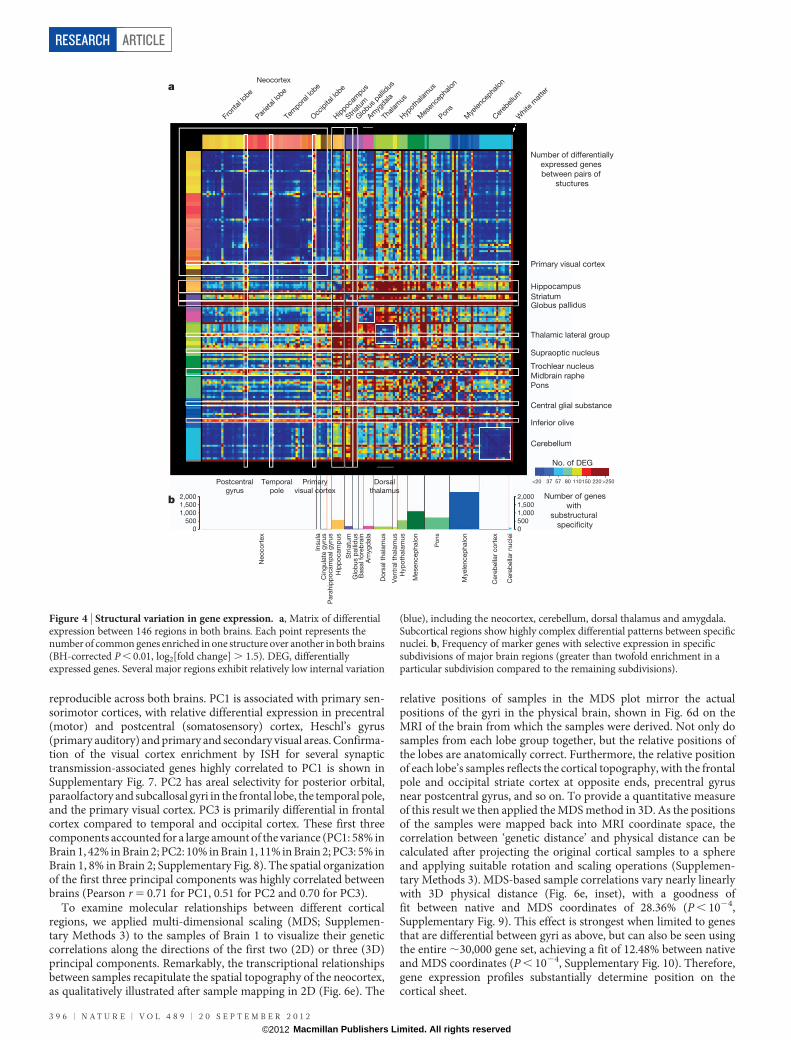
We next took a more direct approach to examine relationshipsbetween regions of the brain based on dissimilarity of gene expres-sion, by tabulating genes exhibiting highly differential expressionbetween all pairs of regions. Significant pairwise differential relation-ships (BH-corrected P , 0.01) were independently recorded ineach brain and a threshold set for at least a 2.8-fold ratio betweenstructures (Supplementary Table 5). Figure 4a illustrates the resultingneuroanatomical molecular ‘blueprint’ common to both brains, byplotting the number of genes differentially expressed between eachpair of structures based on the 11,414 genes passing these criteria inboth brains (individual brain maps in Supplementary Fig. 3).
Many features of the brain transcriptome are apparent with thisvisualization. Remarkably few differences are seen at this fold changethreshold across the neocortex (Fig. 4a, upper left) and cerebellum(lower right), reflecting their stereotyped repetitive cytoarchitecture.Exceptions to this relative cortical homogeneity include the postcentralgyrus (primary sensory cortex), temporal pole (area 38) and primaryvisual cortex (area 17). In contrast, complex differential relationshipswere observed between specific nuclei in subcortical structures. Theglobus pallidus and striatum have highly distinct profiles, as do severalspecific subcortical regions including the midbrain raphe, pontinenuclei and inferior olivary complex. The magnitude of differentialexpression between pairs of structures is also strongly correlated withthe number of differentially expressed genes between these structures(Pearson r 5 0.62, P , 10216; Supplementary Fig. 4).
Interestingly, a large percentage of these common differentiallyexpressed transcripts (48%, or 5,500 probes) are poorly annotated,including probes not mapped to the human genome (HG19;http://genome.ucsc.edu/cgi-bin/hgGateway), mapped to contigsequences, or not mapped to known GENCODE genes21. Approxi-mately 10% of these transcripts had very high correlation with theco-expression modules identified above (Pearson r . 0.7; Sup-plementary Table 6). For example, 38 transcripts demonstrated highcorrelation with the striatal module (M6), and 87 transcripts with theoligodendrocyte-associated module (M12; Fig. 3c), providing ana-tomical ‘guilt-by-association’ annotation of these genes of previouslyunknown function for selective roles in striatal and myelin function,respectively.
Most genes with high variation across brain regions are not selectivefor a single major brain region; rather, they are expressed in multipleregions and non-uniformly within these regions (SupplementaryFig. 5). This suggests that many genes may be quite pleiotropic withrespect to brain function, and that local gene regulation in specificcytoarchitectural nuclei is the most important level of resolution. Tosummarize the complexity of structural variation and examine theextent to which major brain regions display local enrichment in spe-cific fine cytoarchitectural divisions, we created a specificity index foreach major region that measures enrichment in subdivisions of thatregion. This index, defined as the ratio of expression in one subdivisionrelative to the remaining subdivisions in that region (SupplementaryMethods 3 and Supplementary Table 7), measures transcriptionaldiversity within regions. The results in Fig. 4b bear strong similarityto the plot in Fig. 4a, again with the neocortex and cerebellum display-ing the least internal heterogeneity. In contrast, subcortical regionswith many well-defined nuclei show the greatest local heterogeneity,including the myelencephalon, mesencephalon, pons, hippocampusand hypothalamus. It is also possible to identify genes with eitherbrain-wide (global) or within structure (local) ubiquity (Supplemen-tary Table 8). Not surprisingly, these gene sets are enriched for cellular
RESEARCH ARTICLE
3 9 4 | N A T U R E | V O L 4 8 9 | 2 0 S E P T E M B E R 2 0 1 2
Macmillan Publishers Limited. All rights reserved©2012

organelles and ‘housekeeping’ functions (for example, ribosome, mito-chondrion, metabolism).
Local patterning reflects hippocampal cytoarchitectureTo explore local variation, we identified unique transcriptional signa-tures by analysis of variance (ANOVA) for the hippocampus.Following unsupervised hierarchical 2D clustering, cytoarchitecturallydiscrete subdivisions of the hippocampus (dentate gyrus, CA fields andsubiculum) showed distinctive expression patterns sufficiently robustto cluster together like-samples while distinguishing subdivisions fromone another (Fig. 5a). Interestingly, samples from the CA3 and CA4subfields were not discriminable (intermixing in Fig. 5a), consistentwith the view that CA4 is not a functionally distinct subfield from CA3(ref. 22). Similarly robust regional clustering was observed in themesencephalon, pons and myelencephalon (Supplementary Fig. 6 andSupplementary Table 9). Differential expression across hippocampalsubfields could be validated by ISH. For example, the calcium-bindingprotein CALB1 has strong selectivity for the dentate gyrus relative toother hippocampal subdivisions in both brains (Fig. 5b), and cellularspecificity for dentate gyrus granule neurons is demonstrated on anindependent adult brain specimen by ISH in Fig. 5c. Hippocampal
ISH data for CALB1 generated with the same histology platform inadult mouse1 and rhesus macaque23 allowed a phyletic comparison.Interestingly, expression in human differs from that in mouse (Fig. 5d)and rhesus monkey (Fig. 5e), where CALB1 is robustly expressed inCA1 and CA2 in addition to dentate gyrus.
Neocortical transcription reflects spatial topographyOur extensive neocortical sampling allowed us to investigatetranscriptional variation across the neocortex in relation to spatialposition and functional parcellation. Although highly differentialexpression between cortical regions is much less pronounced thanbetween other brain regions (Fig. 4), many genes show statisticallysignificant variation between lobes or gyri at a lower threshold. Wefirst identified the 1,000 genes displaying the most significant vari-ation in expression between 56 gyri in both brains (ANOVA, P , 0.01BH-corrected, ranked by fold change between gyri; SupplementaryTable 10). We then performed principal component analysis (PCA)on the 1,000 (genes) by 56 (sampled gyri) matrices for both brains. Asshown in Fig. 6a–c, the first three principal components had strikingselectivity for specific cortical regions (samples ordered by lobeand roughly rostral to caudal within each lobe) and were generally
* *
*
FL
PL
TL
OL
Ins
Cg
GP
HG
HiF
Str
GP
BF
Am
gE
T
Hy
DT
VT
ME
S
Cb
Cx
Cb
N
Bp
ons
PT
g
MY
WM
*
*
*
FL
PL
TL
OL
Ins
Cg
GP
HG
HiF
Str
GP
BF
Am
gE
T
Hy
DT
VT
ME
S
Cb
Cx
Cb
N
Bp
ons
PT
g
MY
WM
Mo
dule
eig
eng
ene e
xp
ressio
n
M1: Primary sensorimotor cortex
M5: Choroid plexus
M8: Microglia/MCH class II
M10: Astrocyte/cation homeostasis
SCN1A/SCN1B/NEFH
TTC18/DLEC1 /DNALI1
TYROBP/C1QA/C1QB
AQP4/HEPH
M2: Neocortex/neuron/energy metabolism
M6: Striatum
M9: Translational machinery
M12: Oligodendrocyte MOG/ENPP2/PLP1
RPL19/RPS26/EEF1B2
DRD1/RGS9
VDAC1/CLTC0.10
0.05
0.00
–0.05
0.15
0.10
0.05
0.00
0.15
0.10
0.05
0.00
0.05
0.00
–0.05
0.10
0.05
0.00
0.10
0.05
0.00
–0.05
0.100.050.00
0.25
0.20
0.15
0.10
0.05
0.00
0.20
0.15
Cl SbT Cl SbT
Between-brain module preserv.
Cerebral vs sub-cortex t-values
Between-braingene correlation
Cell type
Module label
Heig
ht
0.70
0.75
0.80
0.85
0.90
1.00
0.95
Preservation: 5 10 20
M1 M2 M3 M4 M5 M6 M7 M8
M9
M10
M11
M12 M13
a
b
c
Figure 3 | Global gene networks. a, Cluster dendrogram groups genes intodistinct modules using all samples in Brain 1, with the y axis corresponding toco-expression distance between genes and the x axis to genes (SupplementaryMethods 2). b, Top colour band: colour-coded gene modules. Second band:genes enriched in different cell types (400 genes per cell type18) selectivelyoverlap specific modules. Turquoise, neurons; yellow, oligodendrocytes;purple, astrocytes; white, microglia. Third band: correlation of expressionacross 170 subregions between the two brains. Red corresponds to positivecorrelations and white to no significant correlation. Fourth band: strong
preservation of modules between Brain 1 and Brain 2, measured using a Z-scoresummary (Z $ 10 indicates significant preservation). Fifth band: cortical (red)versus subcortical (green) enrichment (one-side t-test). c, Module eigengeneexpression (y axis) is shown for eight modules across 170 subregions withstandard error. Dotted lines delineate major regions (see Supplementary Table2 for structure abbreviations). An asterisk marks regions of interest. Moduleeigengene classifiers are based on structural expression pattern, putative celltype and significant GO terms. Selected hub genes are shown.
ARTICLE RESEARCH
2 0 S E P T E M B E R 2 0 1 2 | V O L 4 8 9 | N A T U R E | 3 9 5
Macmillan Publishers Limited. All rights reserved©2012
reproducible across both brains. PC1 is associated with primary sen-sorimotor cortices, with relative differential expression in precentral(motor) and postcentral (somatosensory) cortex, Heschl’s gyrus(primary auditory) and primary and secondary visual areas. Confirma-tion of the visual cortex enrichment by ISH for several synaptictransmission-associated genes highly correlated to PC1 is shown inSupplementary Fig. 7. PC2 has areal selectivity for posterior orbital,paraolfactory and subcallosal gyri in the frontal lobe, the temporal pole,and the primary visual cortex. PC3 is primarily differential in frontalcortex compared to temporal and occipital cortex. These first threecomponents accounted for a large amount of the variance (PC1: 58% inBrain 1, 42% in Brain 2; PC2: 10% in Brain 1, 11% in Brain 2; PC3: 5% inBrain 1, 8% in Brain 2; Supplementary Fig. 8). The spatial organizationof the first three principal components was highly correlated betweenbrains (Pearson r 5 0.71 for PC1, 0.51 for PC2 and 0.70 for PC3).
To examine molecular relationships between different corticalregions, we applied multi-dimensional scaling (MDS; Supplemen-tary Methods 3) to the samples of Brain 1 to visualize their geneticcorrelations along the directions of the first two (2D) or three (3D)principal components. Remarkably, the transcriptional relationshipsbetween samples recapitulate the spatial topography of the neocortex,as qualitatively illustrated after sample mapping in 2D (Fig. 6e). The
relative positions of samples in the MDS plot mirror the actualpositions of the gyri in the physical brain, shown in Fig. 6d on theMRI of the brain from which the samples were derived. Not only dosamples from each lobe group together, but the relative positions ofthe lobes are anatomically correct. Furthermore, the relative positionof each lobe’s samples reflects the cortical topography, with the frontalpole and occipital striate cortex at opposite ends, precentral gyrusnear postcentral gyrus, and so on. To provide a quantitative measureof this result we then applied the MDS method in 3D. As the positionsof the samples were mapped back into MRI coordinate space, thecorrelation between ‘genetic distance’ and physical distance can becalculated after projecting the original cortical samples to a sphereand applying suitable rotation and scaling operations (Supplemen-tary Methods 3). MDS-based sample correlations vary nearly linearlywith 3D physical distance (Fig. 6e, inset), with a goodness offit between native and MDS coordinates of 28.36% (P , 1024,Supplementary Fig. 9). This effect is strongest when limited to genesthat are differential between gyri as above, but can also be seen usingthe entire ,30,000 gene set, achieving a fit of 12.48% between nativeand MDS coordinates (P , 1024, Supplementary Fig. 10). Therefore,gene expression profiles substantially determine position on thecortical sheet.
Neo
co
rtex
Insula
Cin
gula
te g
yru
sP
ara
hip
po
cam
pal g
yru
s
Hip
po
cam
pus
Str
iatu
mG
lob
us p
alli
dus
Basal fo
reb
rain
Am
yg
dala
Do
rsal th
ala
mus
Ventr
al th
ala
mus
Hyp
oth
ala
mus
Mesencep
halo
n
Po
ns
Myele
ncep
halo
n
Cere
bella
r co
rtex
Cere
bella
r nucle
i
2,000
1,500
1,000
500
0
2,000
1,500
1,000
500
0
Number of genes
with
substructural
specificity
Primary
visual cortex
Primary visual cortex
StriatumGlobus pallidus
Hippocampus
Cerebellum
Temporal
pole
Dorsal
thalamus
Postcentral
gyrus
Inferior olive
Central glial substance
Trochlear nucleus
Midbrain raphe
Pons
Supraoptic nucleus
Thalamic lateral group
Neocortex
Fron
tal lob
e
Parieta
l lob
e
Tem
poral lo
be
Occ
ipita
l lob
e
Hip
pocam
pus
Striat
um
Glo
bus p
allid
us
Amyg
dala
Thalam
us
Hyp
otha
lam
us
Mes
ence
phalo
n
Pons
Mye
lenc
epha
lon
Cer
ebellum
White
mat
ter
Number of differentially
expressed genes
between pairs of
stuctures
a
b
No. of DEG
<20 37 57 80 110150 220 >250
Figure 4 | Structural variation in gene expression. a, Matrix of differentialexpression between 146 regions in both brains. Each point represents thenumber of common genes enriched in one structure over another in both brains(BH-corrected P , 0.01, log2[fold change] . 1.5). DEG, differentiallyexpressed genes. Several major regions exhibit relatively low internal variation
(blue), including the neocortex, cerebellum, dorsal thalamus and amygdala.Subcortical regions show highly complex differential patterns between specificnuclei. b, Frequency of marker genes with selective expression in specificsubdivisions of major brain regions (greater than twofold enrichment in aparticular subdivision compared to the remaining subdivisions).
RESEARCH ARTICLE
3 9 6 | N A T U R E | V O L 4 8 9 | 2 0 S E P T E M B E R 2 0 1 2
Macmillan Publishers Limited. All rights reserved©2012

DiscussionMolecular studies of human tissues are necessary for understandingthe details of human brain function in the context of specific pathwaysand cell types and how they are affected in disease conditions. Here wedescribe the creation of an anatomically comprehensive transcriptionalmap in a small number of carefully selected, clinically unremarkablespecimens, applying standardized digital molecular brain atlasingmethods used in model organisms3,24,25. The combination ofhistology-guided fine neuroanatomical molecular profiling andmapping of gene expression data into MRI coordinate space producedan anatomically accurate quantitative map of transcript distributionacross the entire human brain. This strategy was borne out in therobust differential molecular profiles of cytoarchitecturally and func-tionally distinct nuclei, providing a high-resolution genome-wide mapof transcript distribution and the ability to analyse genes underlyingthe function of specific brain regions. Similar application of RNAsequencing methods26,27, which were cost-prohibitive and technologic-ally immature when the project was initiated, holds great promise forelucidating finer details of transcriptional regulation in the future.
Regional transcriptional signatures are highly conserved betweenthe two brains assayed. These two individuals were males of similarage and ethnicity and therefore do not capture population or sexdiversity; nevertheless, this high degree of similarity is suggestive of astrong underlying common blueprint for the human brain transcrip-tome and is consistent with other recent studies of human neocorticalgene expression4,5. The availability of an entire hemisphere of a thirdbrain specimen, as remarked above, enabled several confirmatoryanalyses to be performed. In particular, Supplementary Figs 11–13report positively on the network analyses, structural variation of geneexpression, and genetic topography of the neocortex. In summary, thehigh recapitulation of gene expression patterns across all three brainsindicates that the basic transcriptional blueprint is robust across indi-viduals. Ongoing work is focused on processing additional brains ofboth sexes to estimate the consistency of this blueprint.
The primary feature that distinguishes the human brain from thatof other species is the enormous expansion of the neocortex relative to
total brain volume. Our extensive profiling allowed us to ask directlyhow transcription varies across the neocortex. Surprisingly, we find aremarkable degree of transcriptional uniformity compared to otherbrain regions, apparently reflecting the similarity in laminar architec-ture across the entire neocortex28. However, there is significant, albeitless robust, variation in gene expression across cortical areas with twohallmark features. First, individual cortical samples showed suchstrong transcriptional similarities to neighbouring samples that thetopography of the neocortex as a whole can, in part, be reconstructedbased on their molecular profiles. One possible explanation is thatthese proximity relationships mirror lineage relationships of neocor-tical neurons generated from proximal parts of the developingneuroepithelium. Second, some primary sensory and motor regionsdo have distinct whole-transcriptome signatures, probably related totheir specialized cellular and functional architecture. It is also likelythat other more subtle features of cortical parcellation may not havebeen detected in the current analysis, including those identified usingneurotransmitter receptor distributions29 and functional connectivity30.One issue is that gyral patterns do not correlate perfectly with eithercytoarchitectural or functional cortical parcellation. Greater regionaldifferences may emerge if the samples can be grouped either byBrodmann area or on the basis of correlation to functional parcellationsderived from functional imaging studies, now possible given themapping of these data to MRI coordinates. Furthermore, it is likelythat greater variation across areas will be found when assayed at thelevel of specific cortical cell types, as the excitatory neuron types indifferent layers display highly distinct molecular profiles31 that havebeen shown to vary significantly across areas in primate neocortex23.Finally, higher confidence in consistent regional differences shouldemerge as more samples are investigated32. Nevertheless, the relativehomogeneity of the two largest neuronal structures, with ,69 billion(cerebellar cortex) and ,16 billion (cortex) neurons out of the 86billion neurons in the human brain33, is striking and suggests an evolu-tionary expansion of a canonical cortical blueprint34.
Finally, these data allow comparisons between humans and otheranimals, with particular relevance for studies of human disease. The
Value–3–1 1 3
Value–3–1 1 3
CA3CA4CA2Dentate gyrusCA1Subiculum
Intracellular signalling cascade
Lipid, fatty acid and steroid metabolism
Ensheathment of neurons
Neuronal activities
Neurogenesis
Ectoderm development
Cation transport
Cell-adhesion-mediated signalling
Receptor protein serine/threonine
kinase signalling pathway
0
500
1,000
1,500
2,000
0
500
1,000
1,500
2,000
2,500
CA1 CA2 CA3 CA4 DG S
CA1 CA2 CA3 CA4 DG S
Brain 1
Brain 2
Mouse
CA1
CA2
CA3DG
CA1
CA2
DG
Nissl
CALB1 ISH
Macaque
CA1
CA2CA3
CA4
DG
CA1
CA2
DG
NisslNissl
CALB1 ISH
Human
CA1
CA2
CA3
CA4
DGDG
Nissl CALB1 ISHa b c
d e
Figure 5 | Distinct transcriptional profiles of hippocampal subfields andhuman-specific pattern of CALB1 expression. a, 2D clustering of microarraysamples and differentially expressed genes across hippocampal subdivisions(ANOVA, P , 0.01 BH-corrected, top 5,000 genes), with selected enriched GOterms. b, Microarray data for CALB1 shows enrichment in the dentate gyrus (DG)
in both brains (y axis shows normalized raw microarray values). S, subiculum.c, Nissl (left) and CALB1 ISH (right) through adult human hippocampusconfirms dentate-gyrus-selective expression. d, e, Unlike human, CALB1 ISH inthe adult mouse (d) and rhesus macaque (e) show high CALB1 expression in CA1and CA2 (arrows) in addition to dentate gyrus. Scale bars: 1 mm.
ARTICLE RESEARCH
2 0 S E P T E M B E R 2 0 1 2 | V O L 4 8 9 | N A T U R E | 3 9 7
Macmillan Publishers Limited. All rights reserved©2012

current manuscript describes a human-specific pattern for CALB1 inthe hippocampus compared to mouse and rhesus monkey. There arecertain to be many such differences. In this light, these data should beextremely valuable from a translational perspective, allowing analysisof candidate genes and functional parcellation derived from geneticand imaging studies, and as a baseline for investigating neurologicaland neuropsychiatric disease.
METHODS SUMMARYAnatomically comprehensive transcriptional profiling of adult human brainsused high-throughput tissue processing and data generation pipelines for post-mortem brain imaging, anatomical delineation, sample isolation and microarrayanalysis. Data visualization and mining tools were developed to create a publiclyaccessible data resource (http://human.brain-map.org/). Extensive methodo-logical details are supplied in Supplementary Methods 1.Post-mortem tissue acquisition and screening. Tissue was provided by NICHDBrain and Tissue Bank for Developmental Disorders and the University ofCalifornia, Irvine Psychiatry Brain Donor Program. After obtaining informedconsent from decedent next-of-kin, specimens with no known neuropsychiatricor neuropathological history were collected and underwent serology, toxicologyand neuropathological screening, and testing for RNA quality (RNA integritynumber .6). Tissue collection was approved by Institutional Review Boards ofthe Maryland Department of Health and Hygiene, University of MarylandBaltimore and University of California Irvine. Specimens for microarray profiling
were a 24-year-old African American male (Brain 1), a 39-year-old AfricanAmerican male (Brain 2), and a 57-year old Caucasian male (Brain 3;Supplementary Table 1).Sample processing. Brains were imaged in cranio using MRI, cut into 0.5–1.0-cm-thick slabs and frozen. Slabs were subdivided and sectioned to allowhistological staining, anatomical delineation and sample isolation using macro-dissection or laser microdissection. Total RNA was isolated and microarray datawere generated by Beckman Coulter Genomics on Agilent 8 3 60K custom-design arrays (AMADID no. 024915). Sample locations were mapped fromhistology data into MR space using Inkscape (http://www.inkscape.org) andBioImage Suite (http://www.bioimagesuite.org) (Supplementary Methods 1).Microarray data analysis. Weighted Gene Coexpression Analysis (WGCNA)was performed as described (Supplementary Methods 2)16,17,20. Module charac-terizations used Enrichment Analysis Systematic Explorer35. R (http://www.r-project.org/) was used for analysis and visualization (Supplementary Methods2), principal component analysis (PCA), multidimensional scaling (MDS), and totransform MDS embedding into MNI space (Supplementary Methods 3).In situ hybridization. In situ hybridization used a semi-automated non-isotopictechnology platform1.
Received 22 December 2011; accepted 9 July 2012.
1. Lein, E. S. et al. Genome-wide atlas of gene expression in the adult mouse brain.Nature 445, 168–176 (2007).
2. Diez-Roux, G. et al. A high-resolution anatomical atlas of the transcriptome in themouse embryo. PLoS Biol. 9, e1000582 (2011).
Precentral
gyrus
(motor)
Postcentral gyrus
(somatosensory)
Heschl’s gyrus
(auditory)
Primary
visual
cortex
Pearson=0.7093
Brain 1 variance=0.58
Brain 2 variance=0.42
Brain 1
Brain 2
Principal component 1
Primary
visual
cortex
Temporal
pole
Posterior orbital gyrus
Paraolfactory gyrus
Subcallosal gyrus
Pearson=0.5089
Brain 1 variance=0.10
Brain 2 variance=0.11
Principal component 2
Frontal Temporal OccipitalParietal
Dorsal posterior
frontal lobe
Pearson=0.7044
Brain 1 variance=0.05
Brain 2 variance=0.08
Principal component 3
Neocortical genetic topography
0.2
0.1
0.0
PC
2–0.1
–0.2
–0
.3–0
.4
0.40.20.0 PC1–0.2
Primary Visual Cortex
(Area 17)
Primary visual cortex
(area 17)
PeristriatePeristriate
SOGSOGOTGOTG
PcuPcuAnGAnG
SPLSPL
SMGSMG
PoGPoG
PCLPPCLP
PrGPrG
PCLAPCLA
opIFGopIFG
trIFGtrIFG
orIFGorIFGfrofro
SFGSFG
MFGMFG
FPFP
GReGReSRoGSRoG
PaOGPaOG TGTGHGHG
PLTPLT
STGSTGMTGMTG
ITGITG
PLPPLPFuGFuG
TPTP
IRoGIRoGPOrGPOrG
AOrGAOrGMOrGMOrG
LOrGLOrG
Area 17Area 17HGHG
HGHG TPTP
FPFP TPTP
FPFP MOrGMOrG
TPTP PoGPoGSam
ple
co
rrela
tio
n
Normalized physical distance0.0 0.5 1.0 1.5 2.0
0.7
50
.80
0.8
50
.90
0.9
51
.00
orIFGorIFG
MFGMFG
SFGSFGPrGPrG
PoGPoGSPLSPL
SMGSMGAnGAnG
SOGSOG
IOGIOG
ITGITGMTGMTG
STGSTGHGHG
TGTG PLTPLTPLPPLP
TPTP
FPFP IFGIFG trIFGtrIFG
opIFGopIFG
Striate (area 17)Striate (area 17)
PeristriatePeristriate
PeristriatePeristriate
OTGOTG
IOGIOGTPTPGReGRe
SRoGSRoG
FPFP
SFGSFG
PCLPPCLP
PCLAPCLA
PCuPCu
PaOGPaOG
FuG
Frontal
lobe
Temporal
lobe
Parietal
lobe
Occipital
lobe
Lateral view
Medial view
Neocortical spatial topography
a
b
c
d
e
Precentral
gyrus
(motor)
(somatosensory)
Heschl’s gyrus
(auditory)
corte
Pearson=0.7093
Brain 1 variance=0.58
Brain 2 variance=0.42
Brain 1
Brain 2
Prima
visua
corte
Temporal
pole
Posterior orbital gyrus
Paraolfactory gyrus
Subcallosal gyrus
Pearson=0.5089
Brain 1 variance=0.10
Brain 2 variance=0.11
Principal component 2
Frontal Temporal OccipParietal
Dorsal posterior
frontal lobe
Pearson=0.7044
Brain 1 variance=0.05
Brain 2 variance=0.08
Principal component 3
b
c
0.4
0.2
0.0
–0.2
–0.4
FP
-s fro
GR
eIR
oG
LO
rGM
OrG
SR
oG
op
IFG
orI
FG
trIF
GP
aO
GP
OrG
SC
GS
FG
-mS
FG
-IM
FG
-sM
FG
-iP
CL
a-s
PC
La-i
PrG
-prc
PrG
-sI
PrG
-iI
PrG
-cs
Po
G-c
sP
oG
-sI
Po
G-i
IP
oG
-pcs
SP
L-s
SP
L-i
SM
G-s
SM
G-i
An
g-s
An
G-i
Pcu
-sP
cu
-iT
P-s
TP
-iT
P-m
PL
PH
GS
TG
-IS
TG
-iM
TG
-sM
TG
-iIT
G-i
tsIT
G-I
ITG
-mts
Fu
G-i
tsF
uG
-IF
uG
-co
sT
GP
LT
OT
G-s
OT
G-i
SO
G-s
Cu
n-p
est
LiG
-pest
Cu
n-s
trL
iG-s
tr
0.4
0.2
0.0
–0.2
–0.4
0.4
0.2
0.0
–0.2
–0.4
Figure 6 | The neocortical transcriptome reflects primary sensorimotorspecialization and in vivo spatial topography. a–c, First three neocorticalprincipal components, plotted across 57 cortical divisions ordered roughlyrostral to caudal (frontal to occipital pole), are highly reproducible betweenbrains. PC1 (Pearson r 5 0.71) is selective for primary sensory and motor areas(a). PC2 (Pearson r 5 0.51) is differential for specific subdivisions of the frontal,temporal and occipital poles (b), whereas PC3 (Pearson r 5 0.70) is selective forthe caudal portion of the frontal lobe (c). d, e, Relationship between the (x, y, z)location of sampled cortical gyri and their transcriptional similarities. Native
Brain 1 MRI is shown in d with major gyri labelled (Supplementary Table 2).e, MDS applied to the same cortical samples, where distance between pointsreflects similarity in gene expression profiles. Median samples for major gyri arelabelled. Samples cluster by lobe, and both lobe positions and gyral positionsgenerally mirror the native spatial topography, emphasized by arrows in d ande. Inset panel in e plots the relationship (mean 6 1 s.d.) between 3D MDS-basedsimilarity and 3D in vivo sample distance, demonstrating correlations that arestronger between proximal samples and decrease with distance. Selected gyralpairs are labelled. See Supplementary Table 2 for cortical gyrus abbreviations.
RESEARCH ARTICLE
3 9 8 | N A T U R E | V O L 4 8 9 | 2 0 S E P T E M B E R 2 0 1 2
Macmillan Publishers Limited. All rights reserved©2012

3. Baldock, R. A. et al. EMAP and EMAGE: a framework for understanding spatiallyorganized data. Neuroinformatics 1, 309–325 (2003).
4. Kang, H. J. et al. Spatio-temporal transcriptome of the human brain. Nature 478,483–489 (2011).
5. Colantuoni, C. et al. Temporal dynamics and genetic control of transcription in thehuman prefrontal cortex. Nature 478, 519–523 (2011).
6. Markou, A., Chiamulera, C., Geyer, M. A., Tricklebank, M. & Steckler, T. Removingobstacles in neuroscience drug discovery: the future path for animal models.Neuropsychopharmacology 34, 74–89 (2009).
7. Evans, A. C. et al. Anatomical mapping of functional activation in stereotacticcoordinate space. Neuroimage 1, 43–53 (1992).
8. Zeng, H. et al. Large-scale cellular-resolution gene profiling in human neocortexreveals species-specific molecular signatures. Cell 149, 483–496 (2012).
9. Bentivoglio, M. & Morelli, M. in Handbook of Chemical Neuroanatomy. Dopamine(eds Dunnett, S. B., Bentivoglio, M., Bjorklund, A. & Hokfelt, T.) Ch. I 1–107 (Elsevier,2005).
10. Hurd, Y. L. & Hall, H. in Handbook of Chemical Neuroanatomy. (Dopamine) (eds S.B.Dunnett,M.Bentivoglio, A.Bjorklund,&T.Hokfelt)Ch. IX525–571 (Elsevier, 2005).
11. Johnson, M. B. et al. Functional and evolutionary insights into human braindevelopment through global transcriptome analysis. Neuron 62, 494–509,doi:S0896–6273(09)00286–4 (2009).
12. Bayes, A. et al. Characterization of the proteome, diseases and evolution of thehuman postsynaptic density. Nature Neurosci. 14, 19–21 (2011).
13. Huang da, W. Sherman, B. T. & Lempicki, R. A. Systematic and integrative analysisof largegene listsusing DAVIDbioinformatics resources.NatureProtocols4,44–57(2009).
14. Hof, P. R., Nimchinsky, E. A. & Morrison, J. H. Neurochemical phenotype ofcorticocortical connections in the macaque monkey: quantitative analysis of asubset of neurofilament protein-immunoreactive projection neurons in frontal,parietal, temporal, and cingulate cortices. J. Comp. Neurol. 362, 109–133 (1995).
15. Bergles, D. E., Roberts, J. D., Somogyi, P. & Jahr, C. E. Glutamatergic synapses onoligodendrocyte precursor cells in the hippocampus. Nature 405, 187–191(2000).
16. Zhang, B. & Horvath, S. A general framework for weighted gene co-expressionnetwork analysis. Stat. Appl. Genet. Mol. Biol. 4 (2005).
17. Horvath, S. et al. Analysis of oncogenic signaling networks in glioblastomaidentifies ASPM as a molecular target. Proc. Natl Acad. Sci. USA 103,17402–17407 (2006).
18. Oldham, M. C. et al. Functional organization of the transcriptome in human brain.Nature Neurosci. 11, 1271–1282 (2008).
19. Miller, J. A., Horvath, S. & Geschwind, D. H. Divergence of human and mouse braintranscriptome highlights Alzheimer disease pathways. Proc. Natl Acad. Sci. USA107, 12698–12703 (2010).
20. Langfelder, P., Luo,R., Oldham,M.C.&Horvath,S. Ismynetworkmodulepreservedand reproducible? PLoS Comput. Biol. 7, e1001057 (2011).
21. Harrow,J.et al.GENCODE:producinga referenceannotation for ENCODE.GenomeBiol. 7 (suppl. 1), 1–9 (2006).
22. Amaral, D.G.& Insausti, R. inTheHumanNervousSystem (ed.Paxinos,G.) 771–755(Academic, 1990).
23. Bernard, A. et al. Transcriptional architecture of the primate neocortex. Neuron 73,1083–1099 (2012).
24. Hawrylycz, M. et al. Digital atlasing and standardization in the mouse brain. PLoSComput. Biol. 7, e1001065 (2011).
25. Shattuck, D. W. et al. Construction of a 3D probabilistic atlas of human corticalstructures. Neuroimage 39, 1064–1080 (2008).
26. Mortazavi, A., Williams, B. A., McCue, K., Schaeffer, L. & Wold, B. Mapping andquantifying mammalian transcriptomes by RNA-Seq. Nature Methods 5, 621–628(2008).
27. Ameur, A. et al. Total RNA sequencing reveals nascent transcription andwidespread co-transcriptional splicing in the human brain. Nature Struct. Mol. Biol.18, 1435–1440 (2011).
28. DeFelipe, J. & Jones, E. G. Cajal on the Cerebral Cortex: an Annotated Translation ofthe Complete Writings (Oxford Univ. Press, 1988).
29. Zilles, K.et al. Architectonicsof the humancerebral cortexand transmitter receptorfingerprints: reconciling functional neuroanatomy and neurochemistry. Eur.Neuropsychopharmacol. 12, 587–599 (2002).
30. Felleman, D. J. & Van Essen, D. C. Distributed hierarchical processing in theprimate cerebral cortex. Cereb. Cortex 1, 1–47 (1991).
31. Belgard, T. G. et al. A transcriptomic atlas of mouse neocortical layers. Neuron 71,605–616 (2011).
32. Voineagu, I. et al. Transcriptomic analysis of autistic brain reveals convergentmolecular pathology. Nature 474, 380–384 (2011).
33. Herculano-Houzel, S. The human brain in numbers: a linearly scaled-up primatebrain. Front. Hum. Neurosci. 3, 31 (2009).
34. Douglas, R. J.& Martin, K.A. Neuronal circuits of theneocortex.Annu. Rev.Neurosci.27, 419–451 (2004).
35. Hosack, D. A., Dennis, G. Jr, Sherman, B. T., Lane, H. C. & Lempicki, R. A. Identifyingbiological themes within lists of genes with EASE. Genome Biol. 4, R70 (2003).
Supplementary Information is available in the online version of the paper.
Acknowledgements We wish to thank the Allen Institute founders, P. G. Allen andJ. Allen, for their vision, encouragement, and support. We express our gratitude to pastand present Allen Institute staff members R. Adams, K. Aiona, A. Alpisa, J. Arnold,C. Bennet, K. Brouner, S. Butler, E. Byrnes, S. Caldejon, J. Campiche, A. Carey, J. Chen,C. Copeland, C. Cuhaciyan, T. Desta, N. Dotson, S. Faber, T. Fliss, E. Fulfs, G. Gee,T. Gilbert, L. Gourley, G. Gu, J. Heilman, N. Ivanov, K. Keyser, A. Kriedberg, J. Laoenkue,F. Lee, S. Levine, L. Luong, N. Mastan, N. Mosqueda, E. Mott, N. Motz, D. Muzia, K. Ngo,A. Oldre, E. Olson, J. Parente, J. Phillips, L. Potekhina, T. Roberts, K. Roll, D. Rosen,M. Sarreal, S. Shapouri, N. Shapovalova, C. Simpson, D. Simpson, M. Smith, N. Stewart,K. Sweeney, A. Szafer, L. Velasquez, U. Wagley, W. Wakeman, C. White andB. Youngstrom for their technical assistance. We thank C. Long for mechanicalengineering contract work. We thank R. Gullapalli, A. McMillan and R. Morales forpost-mortem magnetic resonance imaging and radiology interpretation of MR data;J. Cottrell, M. Davis, R. Johnson, K. Moraniec, R. Vigorito, A. Weldon and the NICHD Brainand Tissue Bank for Developmental Disorders for tissue acquisition and processing;J. Davis for donor coordination; F. Mamdani, M. Martin, E. Moon, L. Morgan, B. Rollinsand D. Walsh for tissue processing and psychological autopsy (DW); D. Patel formagnetic resonance imaging; and J. Sonnen for consultation on tissuemicroneuropathology. We also thank the External RNA Controls Consortium (ERCC),the US National Institute of Standards (NIST) and Technology, and M.Salit for access toERCCtranscriptsduringPhaseV testing.Wearegrateful toBeckmanCoulterGenomics(formerly Cogenics) and their staff P. Hurban, E. Lobenhofer, K. Phillips, A. Rouse andS. Beaver for microarray data generation and design of the custom Agilent array. Wealso wish to thank the Allen Human Brain Atlas Advisory Council membersD. Geschwind, R. Gibbs, P. Hof, E. Jones, C. Koch, C. Saper, L. Swanson, A. Toga andD. Van Essen for their scientific guidance and dedication to the successful execution ofthis project. The project described was supported in part by Grant Numbers1C76HF15069-01-00 and 1 1C76HF19619-01-00 from the Department of Healthand Human Services Health Resources and Services Administration Awards and itscontents are solely the responsibility of the authors and do not necessarily representthe official views of the Department of Health and Human Services Health Resourcesand Services Administration Awards. S.G.N.G and L.V.L. were supported by the MRCD,Wellcome Trust and European Union Seventh Framework Programme under grants241498 EUROSPIN, 242167 SynSys, and 241995 GENCODYS Projects.
Author Contributions A.R.J., A.L.G.-B., E.H.S. and K.A.S. contributed significantly tooverall project design. A.L.G.-B., E.H.S., K.A.S., A.E. and P.W. managed the tissue andsample processing in the laboratory. D.B., A.F.B., R.A.D., J.G., B.W.G., R.E.H., M.K., T.A.L.,P.D.P., S.E.P., M.R., J.J.R. and B.E.S. contributed to tissue and sample processing. E.H.S.and Z.L.R. contributed to establishing the tissue acquisition pipeline. P.M.C., B.D.D.,D.R.F., L.L., P.A.S., M.P.V. and H.R.Z. contributed to tissue acquisition and MR imaging.Z.L.R., A.B., M.M.C., N.D., A.J., J.M.J., E.T.L., S.C.S. and P.R.H. contributed to protocoldevelopment. S.D., J.M.J., C.R.S. and D.W. provided engineering support. A.L.G.-B.,R.A.D., P.D.P., J.G.H., J.A.Mo., J.J.R. andB.E.S. contributed to the neuroanatomicaldesignand implementation. L.N. and C.D. managed the creation of the data pipeline,visualization and mining tools. L.N., C.D. and C.C.O. contributed to the overall onlineproduct concept. L.N., C.A., M.C., J.C., T.A.D., D.F., Z.H., C.La., Y.L. and A.J.S. contributed tothe creation of the data pipeline, visualization and mining tools. M.J.H., E.S.L., J.A.Mi.,D.H.G., L.N.L., C.F.B., S.M.Sm., S.G.N.G., A.LG.-.B., E.H.S., K.A.S., A.B., D.B., V.F., J.G., D.R.H.,S.H., C.Le., J.S., S.M.Su., P.R.H. and C.K. contributed to data analysis and interpretation.A.R.J. supervised theoverallproject, and themanuscriptwaswrittenbyM.J.H. andE.S.L.with input from other authors.
Author Information Reprints and permissions information is available atwww.nature.com/reprints. The authors declare no competing financial interests.Readers are welcome to comment on the online version of the paper. Correspondenceand requests for materials should be addressed to M.J.H. ([email protected]).
ARTICLE RESEARCH
2 0 S E P T E M B E R 2 0 1 2 | V O L 4 8 9 | N A T U R E | 3 9 9
Macmillan Publishers Limited. All rights reserved©2012