Embed Size (px)
Citation preview
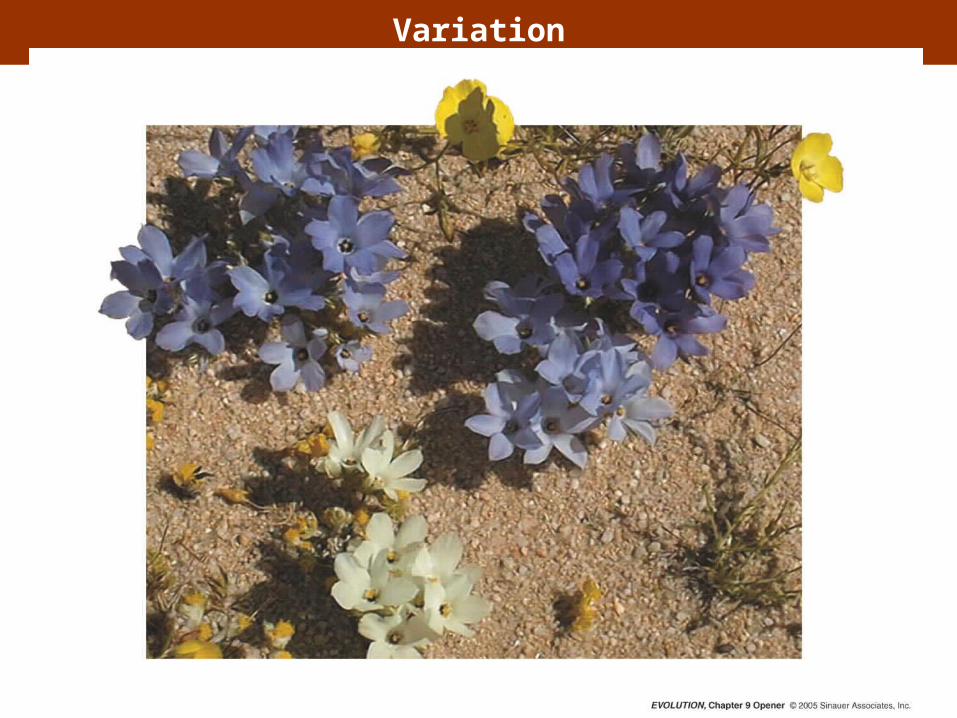
Variation
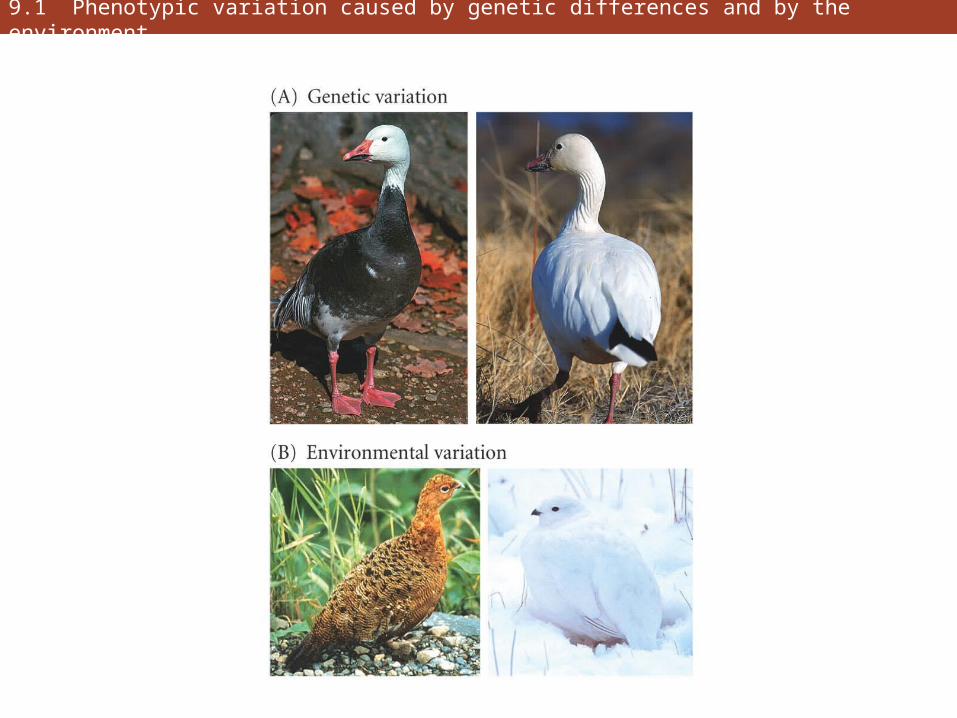
9.1 Phenotypic variation caused by genetic differences and by the environment
• Genetic variation is the foundation of evolution
• Understanding the process of evolution requires understanding of the origin and transmutation of genetic variation
• Phenotype, genotype, locus, allele
• Phenotypic variation can be caused by genetic differences and by the environment
9.1 Phenotypic variation caused by genetic differences and by the environment
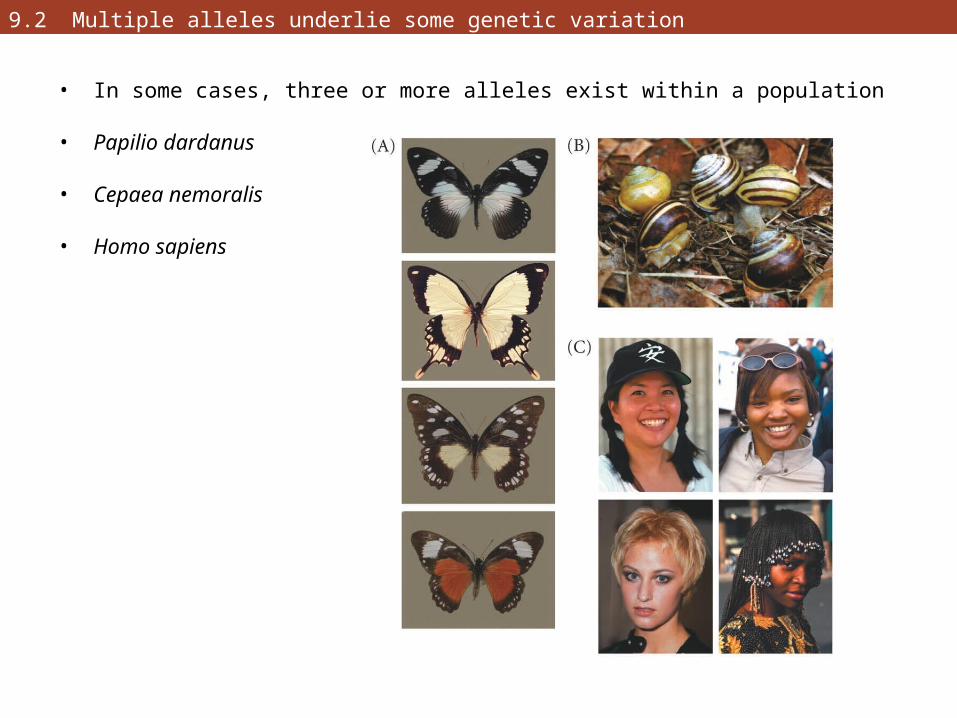
• In some cases, three or more alleles exist within a population
• Papilio dardanus
• Cepaea nemoralis
• Homo sapiens
9.2 Multiple alleles underlie some genetic variation
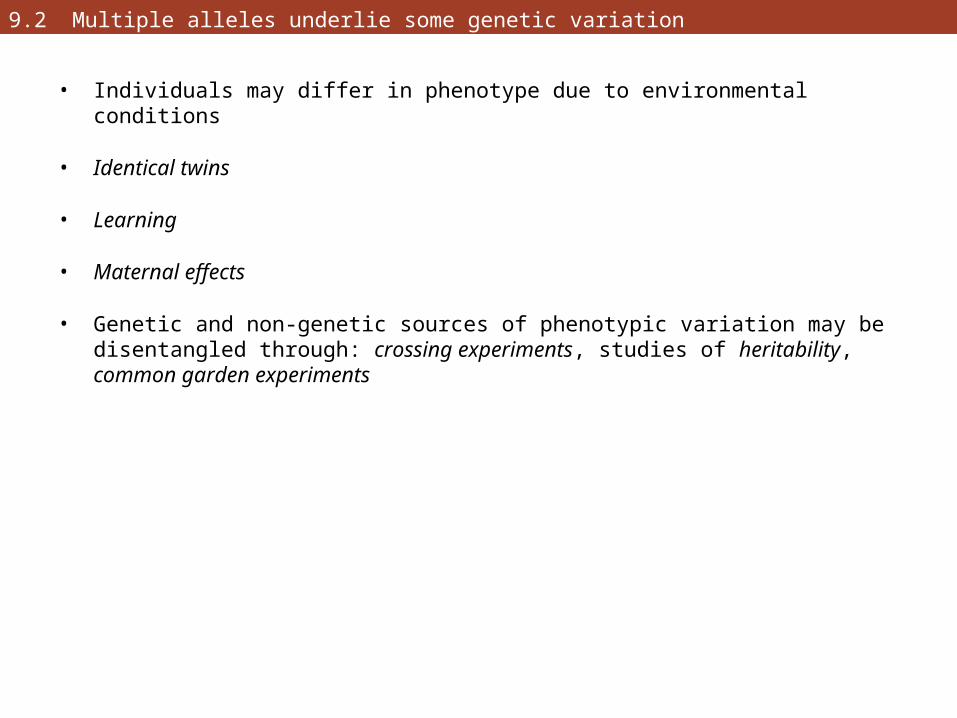
• Individuals may differ in phenotype due to environmental conditions
• Identical twins
• Learning
• Maternal effects
• Genetic and non-genetic sources of phenotypic variation may be disentangled through: crossing experiments, studies of heritability, common garden experiments
9.2 Multiple alleles underlie some genetic variation
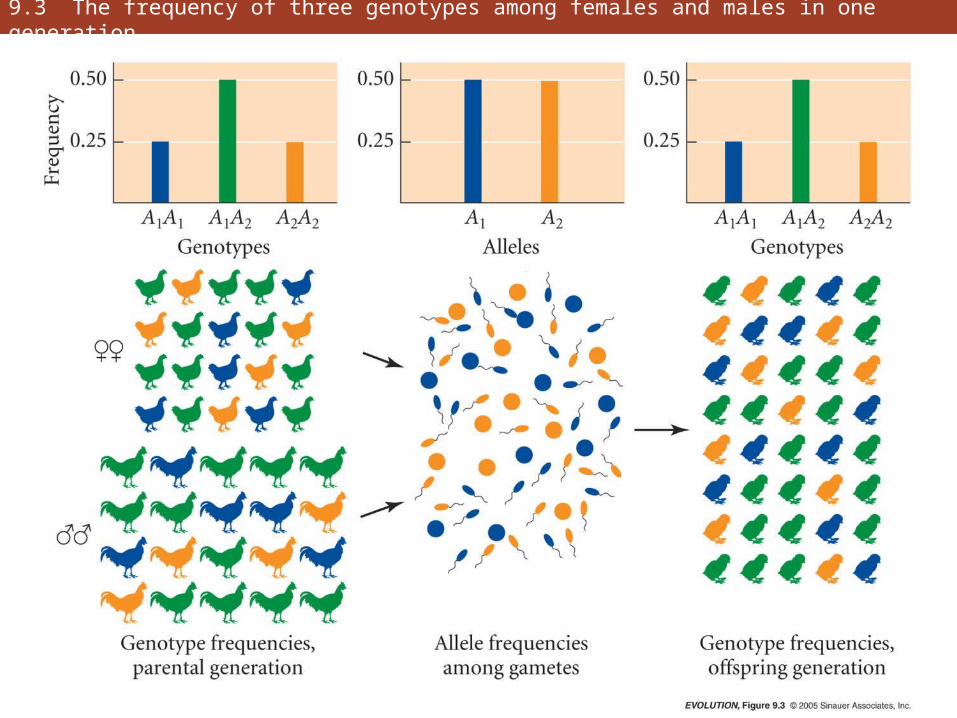
9.3 The frequency of three genotypes among females and males in one generation
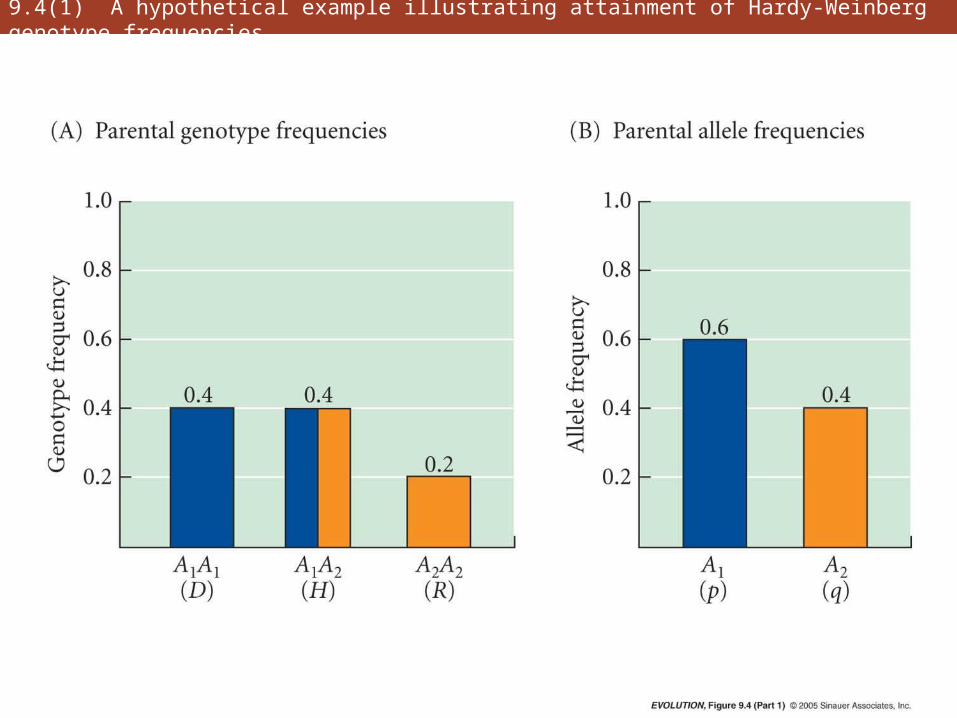
9.4(1) A hypothetical example illustrating attainment of Hardy-Weinberg genotype frequencies
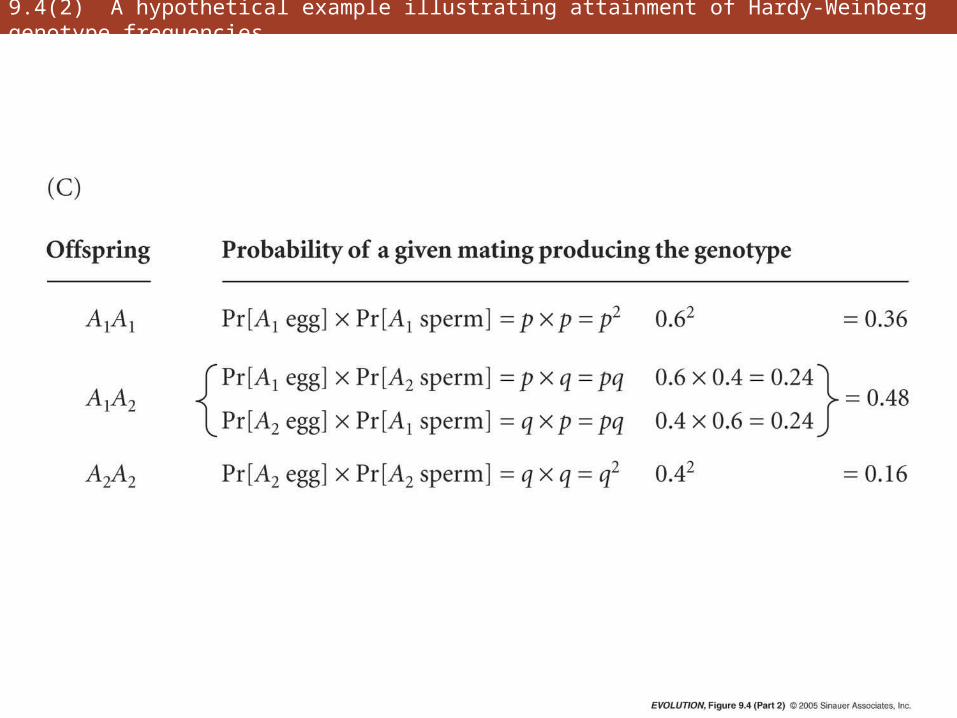
9.4(2) A hypothetical example illustrating attainment of Hardy-Weinberg genotype frequencies
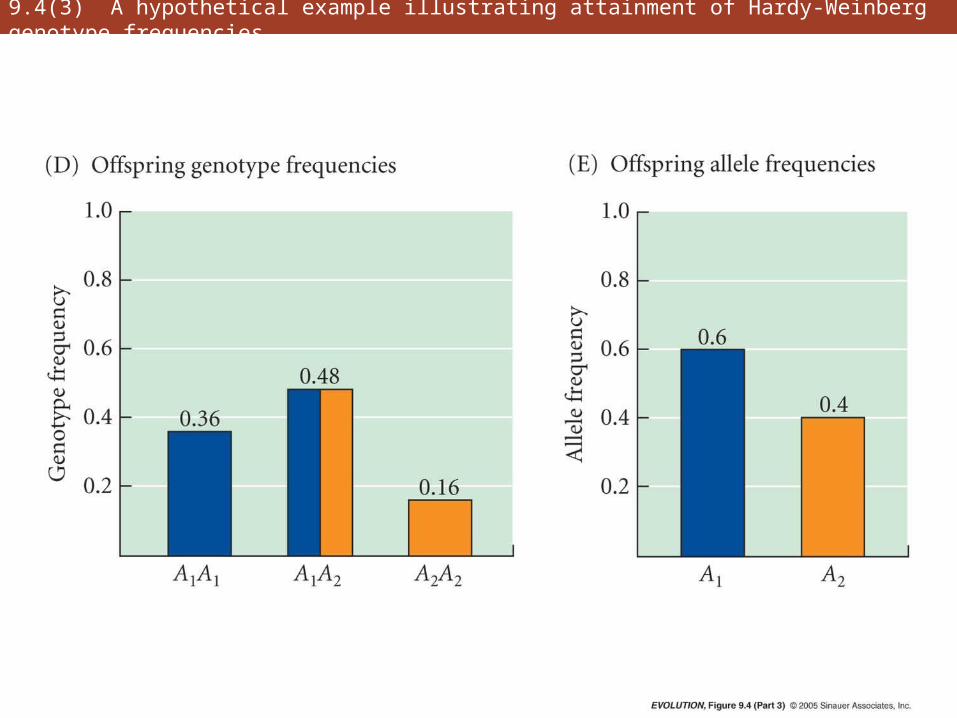
9.4(3) A hypothetical example illustrating attainment of Hardy-Weinberg genotype frequencies
• Hardy-Weinberg principle is foundation on which most of the genetic theory of evolution rests
• Genotypic frequencies attain their H-W values after a single generation of random mating
• Not only genotype frequencies, but also allele frequencies, remain unchanged from generation to generation
• Critical assumptions: random mating, large population, no gene flow, no mutation, no natural selection
• Segregation distortion or meiotic drive
9.4(3) A hypothetical example illustrating attainment of Hardy-Weinberg genotype frequencies
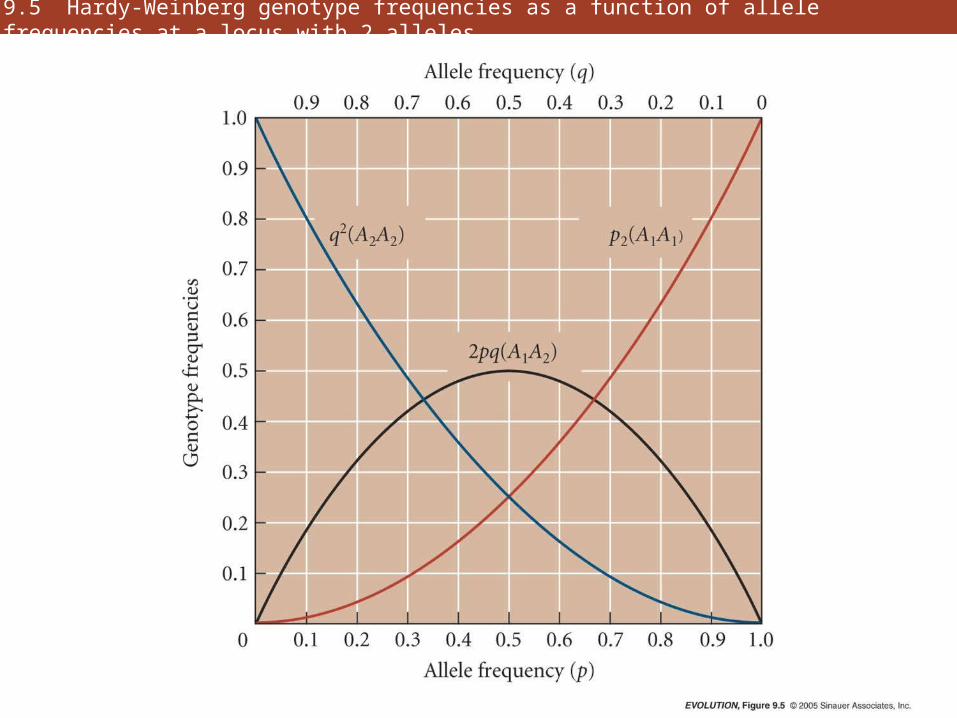
9.5 Hardy-Weinberg genotype frequencies as a function of allele frequencies at a locus with 2 alleles
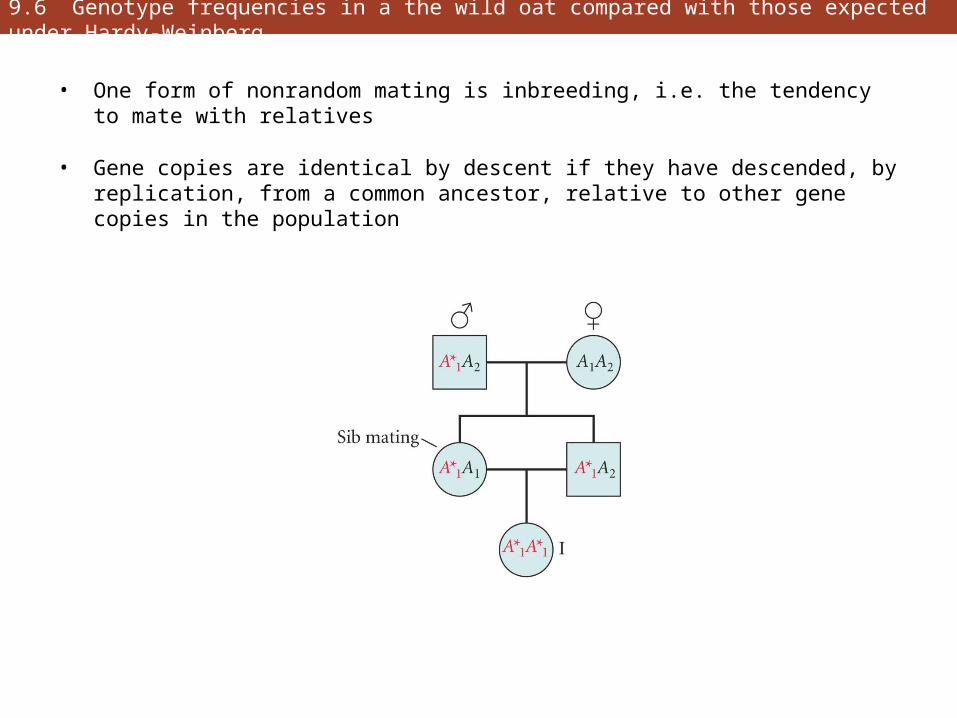
• One form of nonrandom mating is inbreeding, i.e. the tendency to mate with relatives
• Gene copies are identical by descent if they have descended, by replication, from a common ancestor, relative to other gene copies in the population
9.6 Genotype frequencies in a the wild oat compared with those expected under Hardy-Weinberg
• One form of nonrandom mating is inbreeding, i.e. the tendency to mate with relatives
• Gene copies are identical by descent if they have descended, by replication, from a common ancestor, relative to other gene copies in the population
• H = H0(1-F) where H0 is the heterozygote frequency expected if the locus were in H-W equilibrium, and F is the inbreeding coefficient
9.6 Genotype frequencies in a the wild oat compared with those expected under Hardy-Weinberg
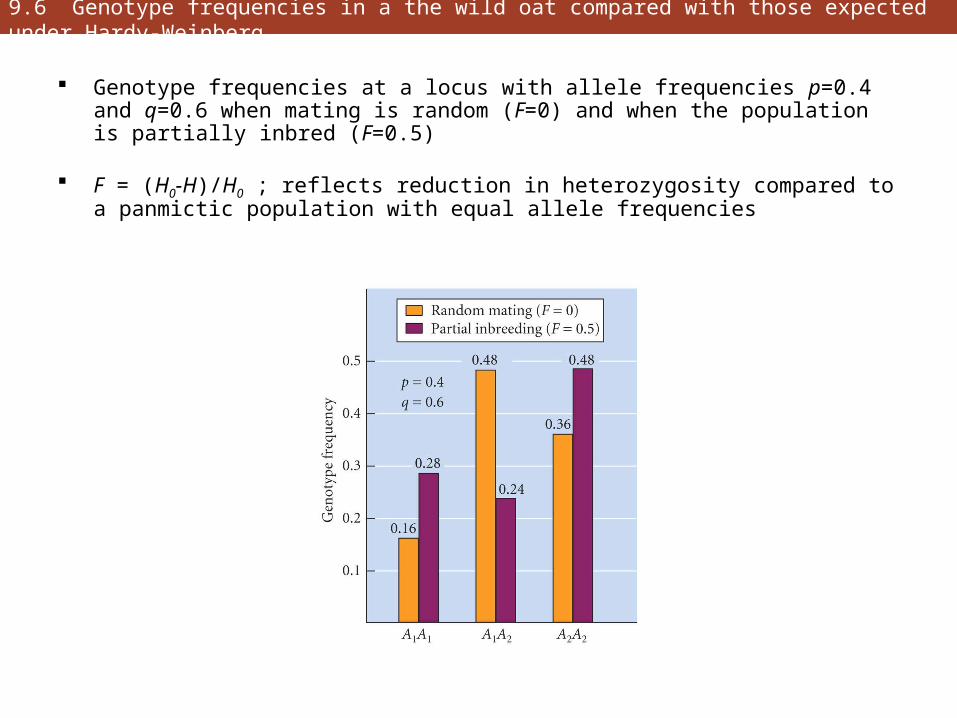
Genotype frequencies at a locus with allele frequencies p=0.4 and q=0.6 when mating is random (F=0) and when the population is partially inbred (F=0.5)
F = (H0-H)/H0 ; reflects reduction in heterozygosity compared to a panmictic population with equal allele frequencies
9.6 Genotype frequencies in a the wild oat compared with those expected under Hardy-Weinberg

9.6 Genotype frequencies in wild oat compared with those expected under Hardy-Weinberg
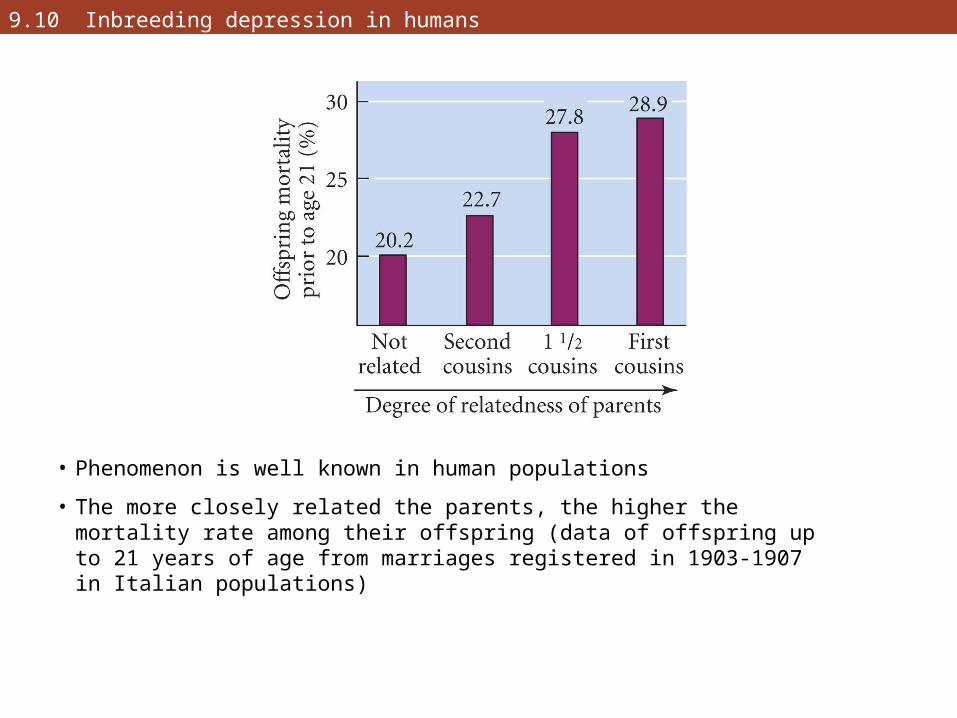
• Phenomenon is well known in human populations
• The more closely related the parents, the higher the mortality rate among their offspring (data of offspring up to 21 years of age from marriages registered in 1903-1907 in Italian populations)
9.10 Inbreeding depression in humans
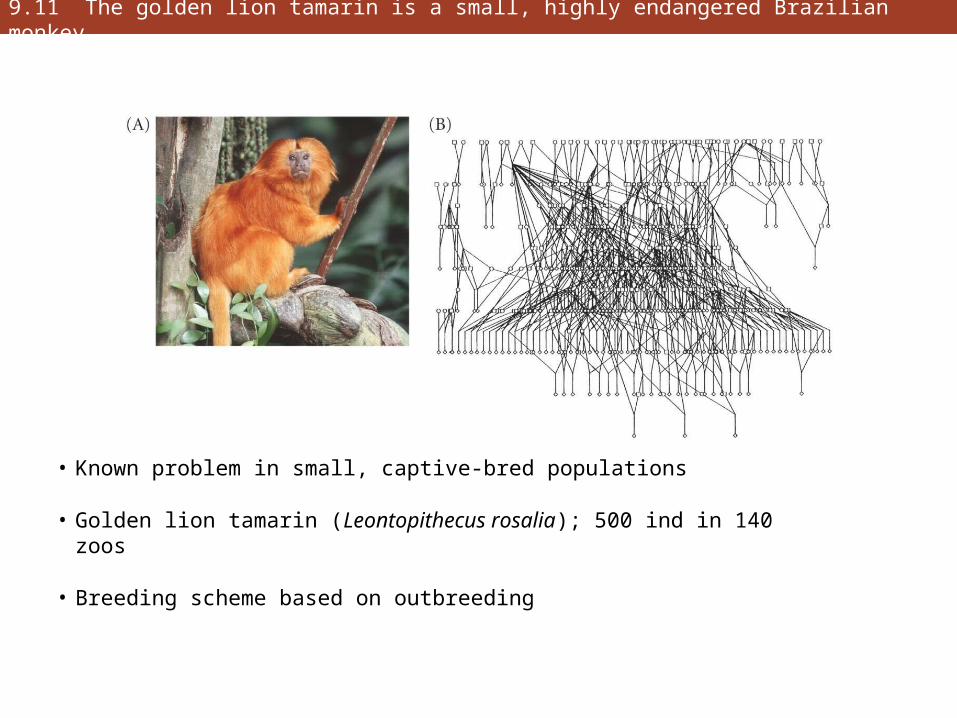
9.11 The golden lion tamarin is a small, highly endangered Brazilian monkey
• Known problem in small, captive-bred populations
• Golden lion tamarin (Leontopithecus rosalia); 500 ind in 140 zoos
• Breeding scheme based on outbreeding
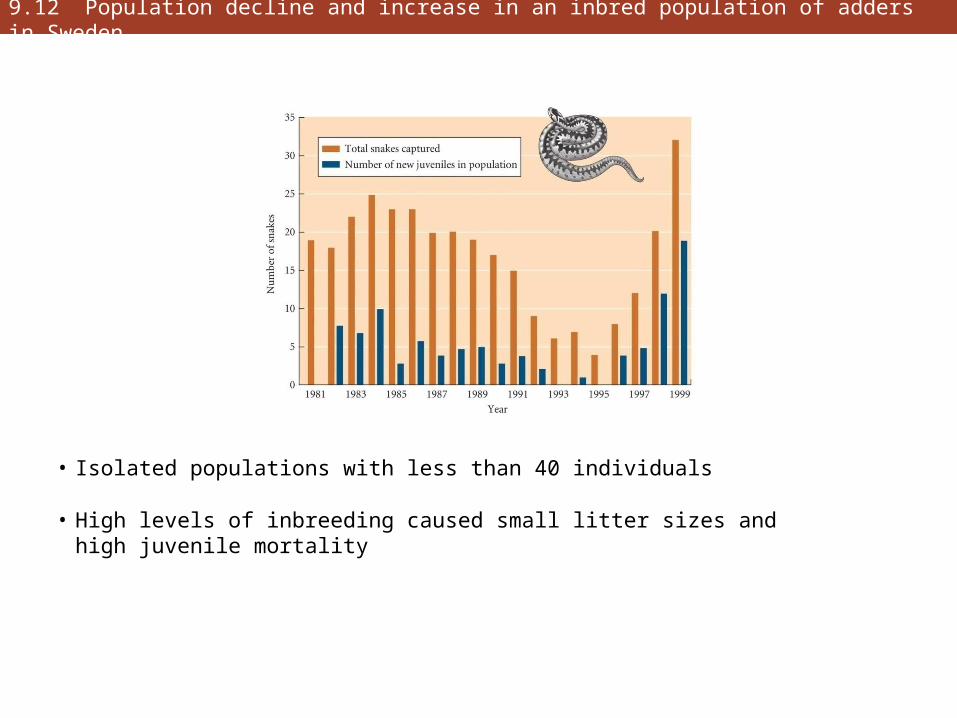
9.12 Population decline and increase in an inbred population of adders in Sweden
• Isolated populations with less than 40 individuals
• High levels of inbreeding caused small litter sizes and high juvenile mortality
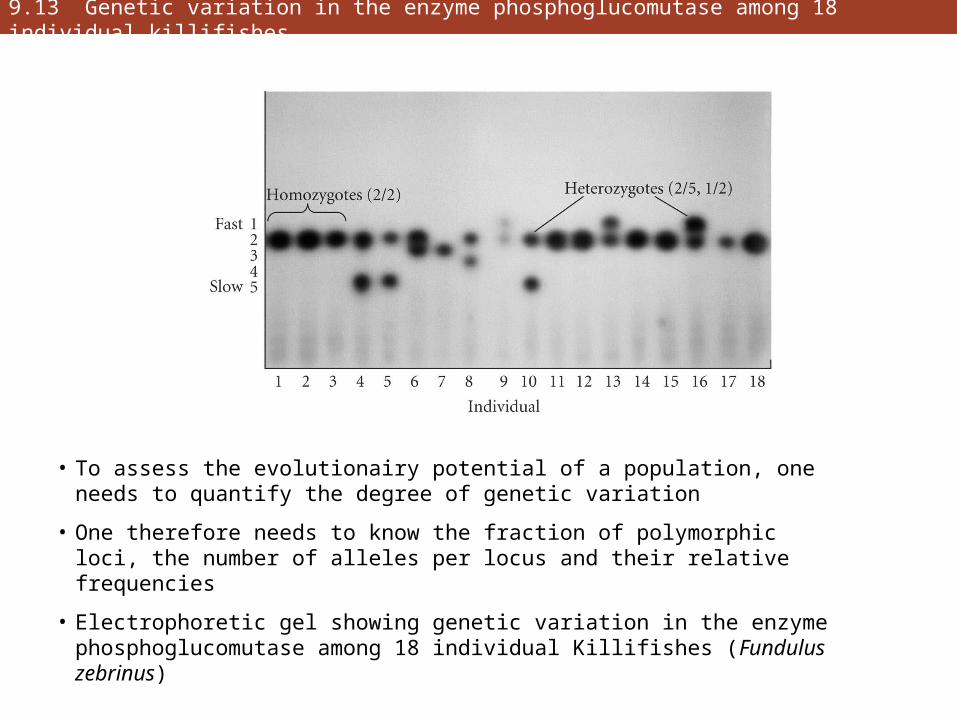
9.13 Genetic variation in the enzyme phosphoglucomutase among 18 individual killifishes
• To assess the evolutionairy potential of a population, one needs to quantify the degree of genetic variation
• One therefore needs to know the fraction of polymorphic loci, the number of alleles per locus and their relative frequencies
• Electrophoretic gel showing genetic variation in the enzyme phosphoglucomutase among 18 individual Killifishes (Fundulus zebrinus)
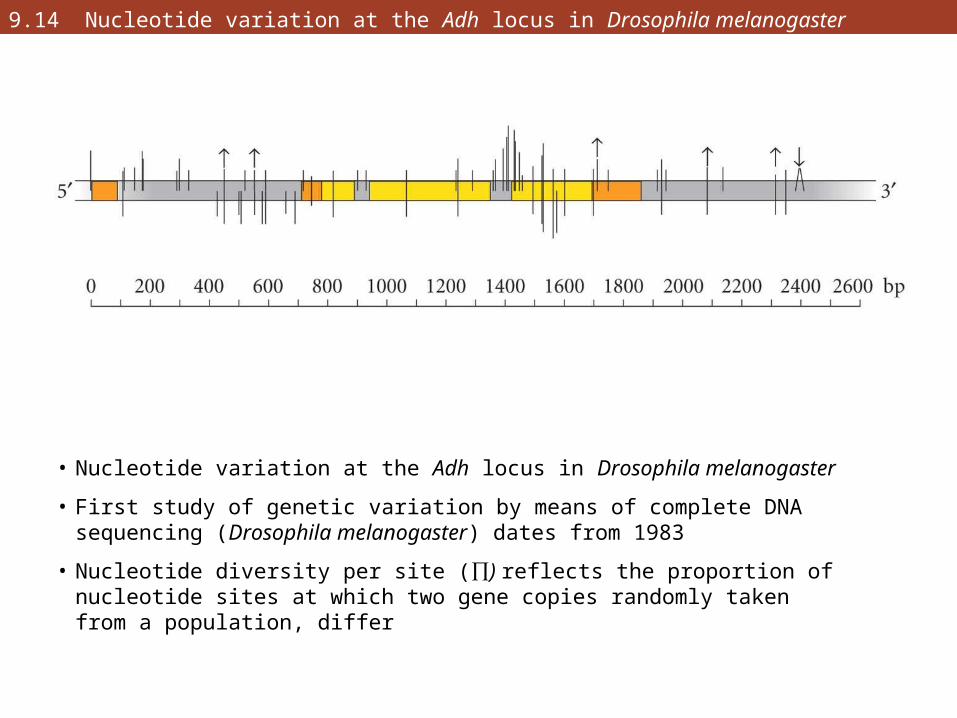
9.14 Nucleotide variation at the Adh locus in Drosophila melanogaster
• Nucleotide variation at the Adh locus in Drosophila melanogaster
• First study of genetic variation by means of complete DNA sequencing (Drosophila melanogaster) dates from 1983
• Nucleotide diversity per site (∏) reflects the proportion of nucleotide sites at which two gene copies randomly taken from a population, differ
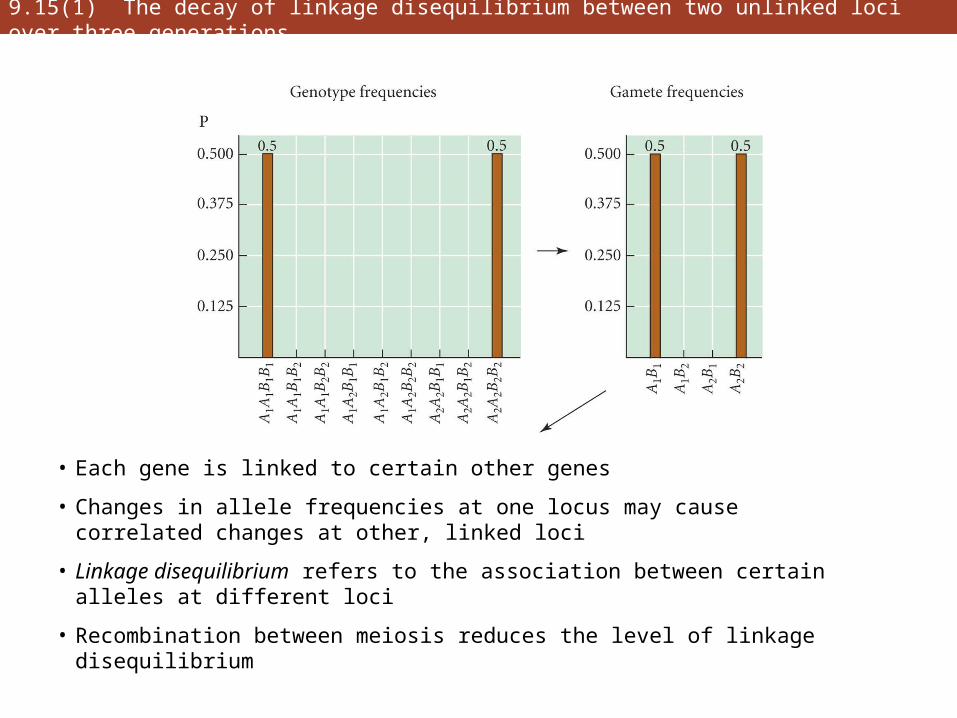
9.15(1) The decay of linkage disequilibrium between two unlinked loci over three generations
• Each gene is linked to certain other genes
• Changes in allele frequencies at one locus may cause correlated changes at other, linked loci
• Linkage disequilibrium refers to the association between certain alleles at different loci
• Recombination between meiosis reduces the level of linkage disequilibrium
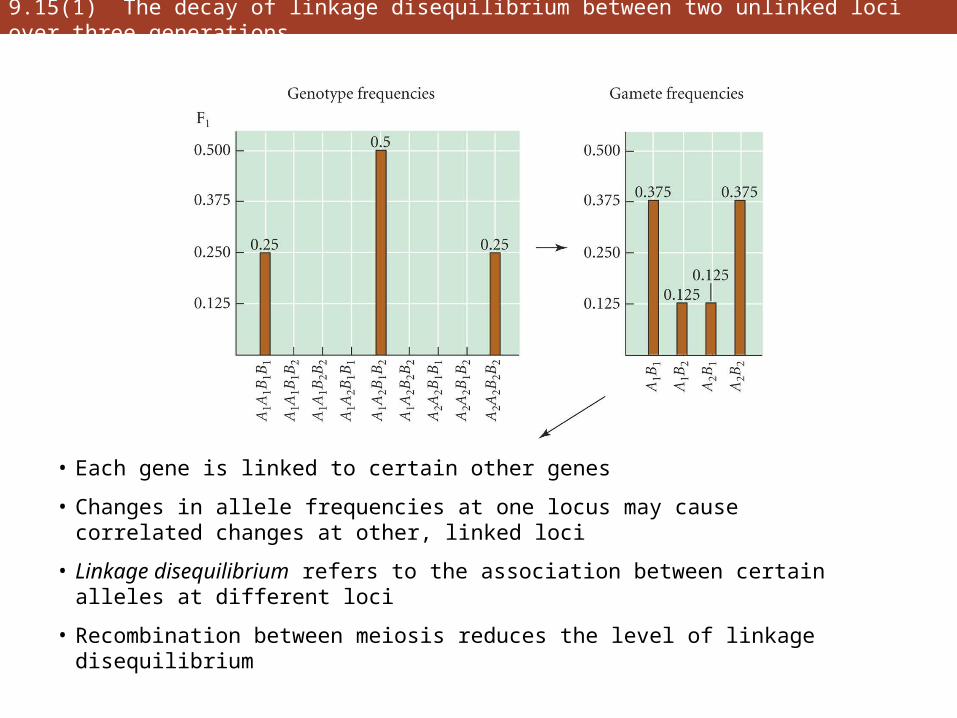
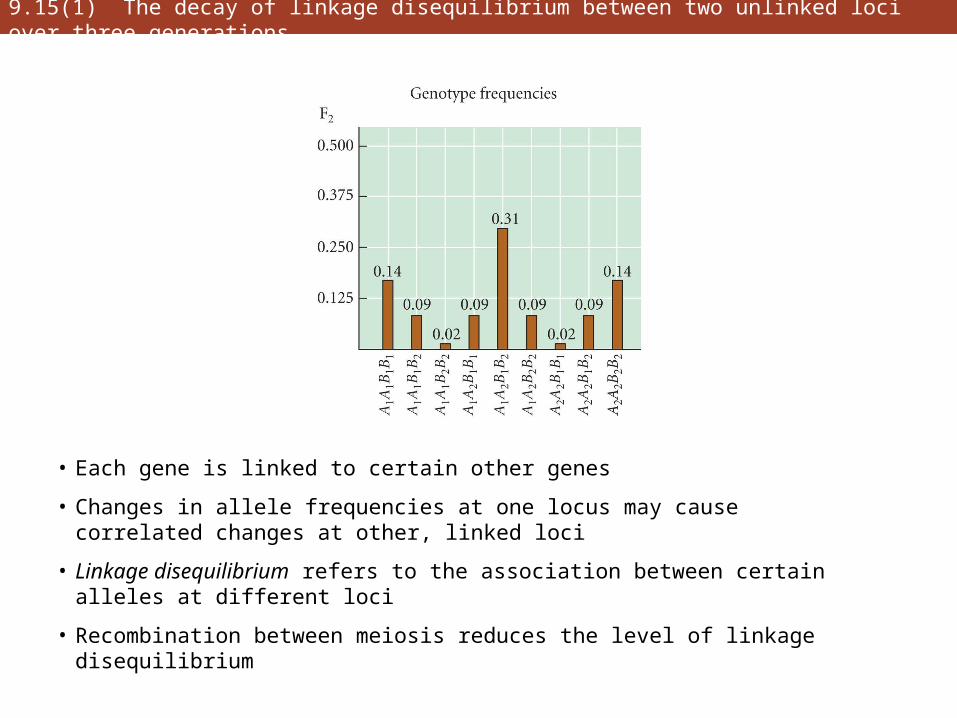
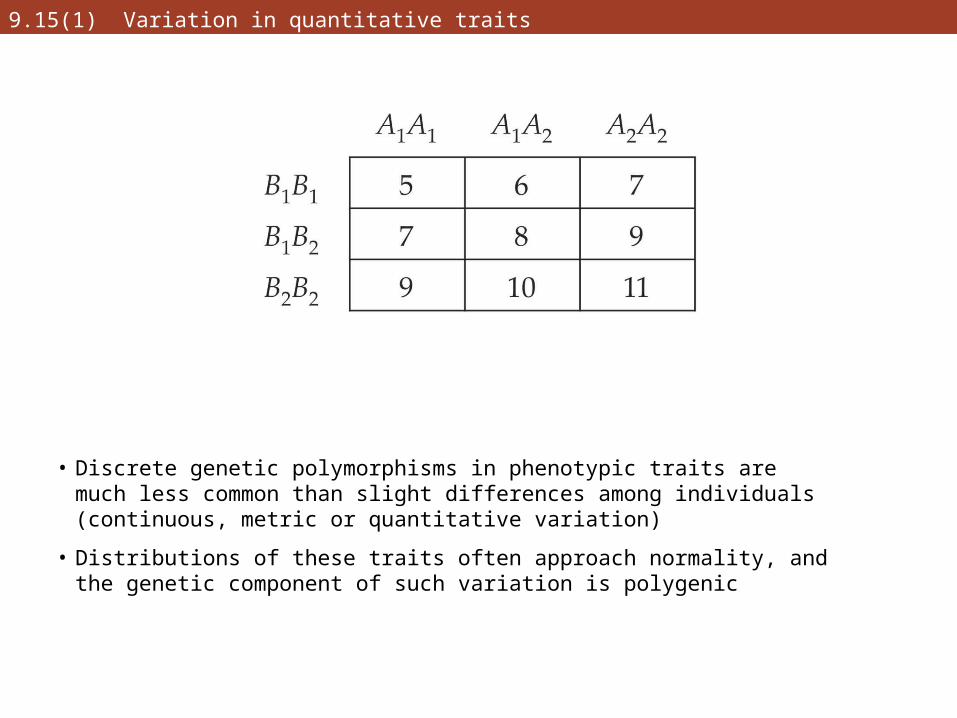
9.15(1) Variation in quantitative traits
• Discrete genetic polymorphisms in phenotypic traits are much less common than slight differences among individuals (continuous, metric or quantitative variation)
• Distributions of these traits often approach normality, and the genetic component of such variation is polygenic
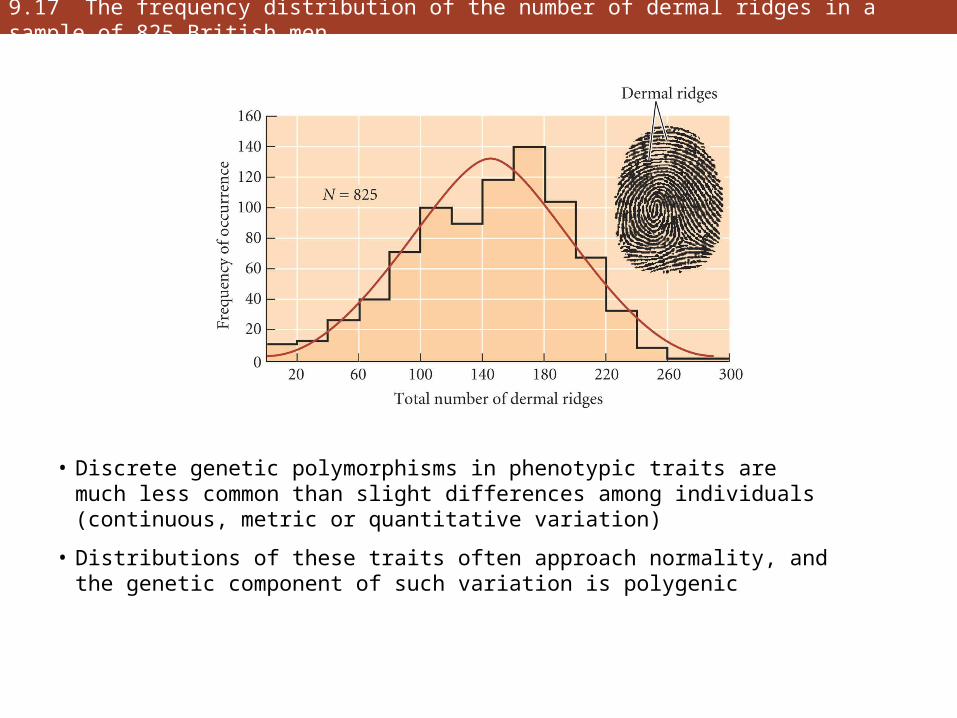
9.17 The frequency distribution of the number of dermal ridges in a sample of 825 British men
• Discrete genetic polymorphisms in phenotypic traits are much less common than slight differences among individuals (continuous, metric or quantitative variation)
• Distributions of these traits often approach normality, and the genetic component of such variation is polygenic
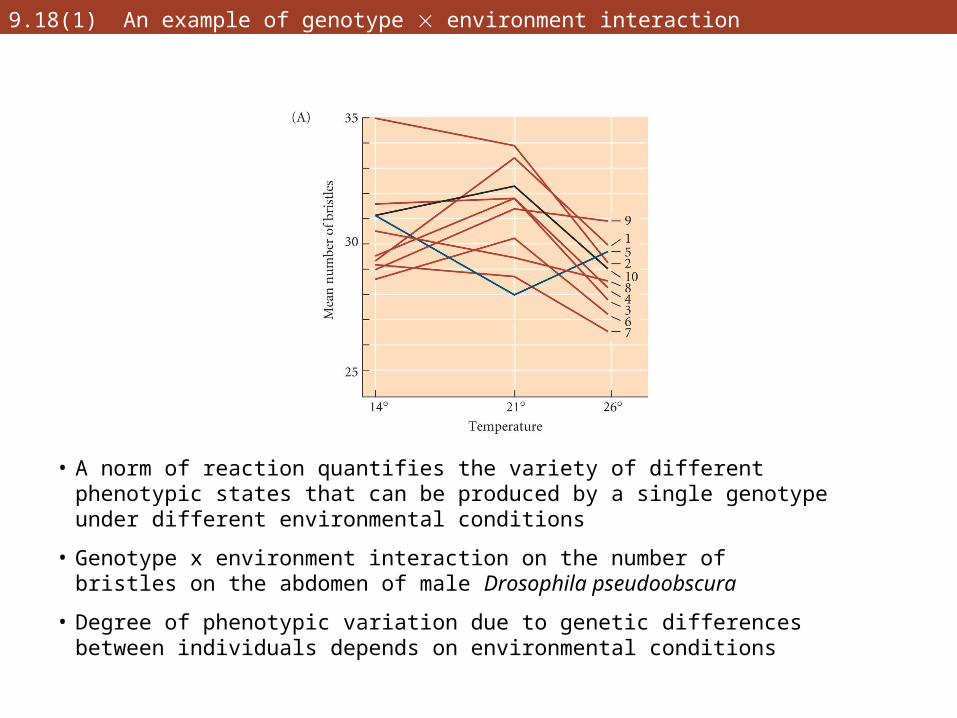
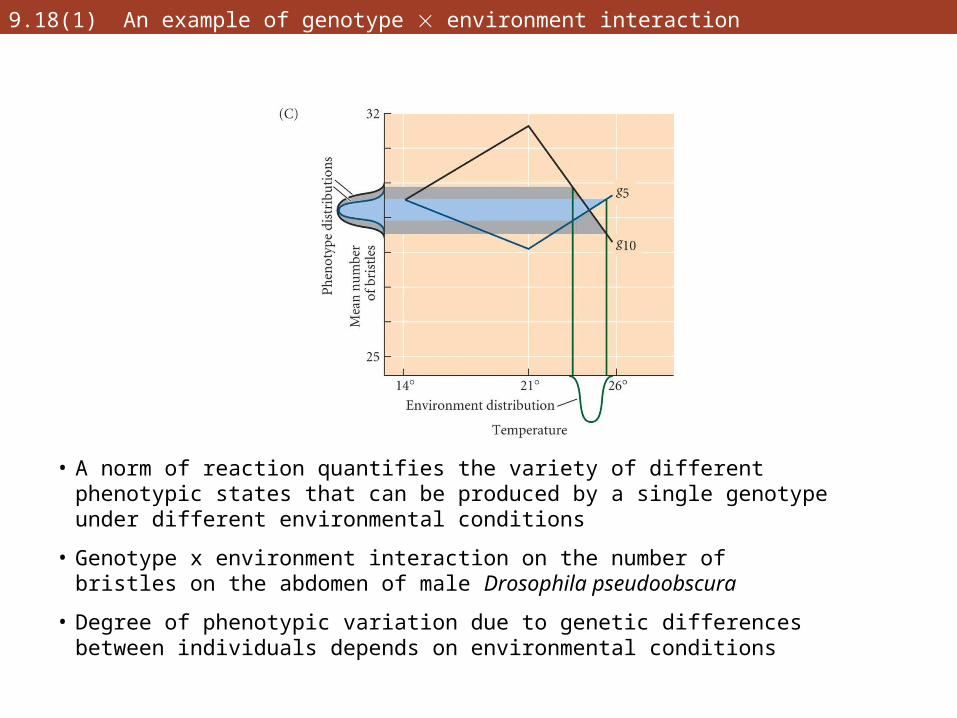
9.18(1) An example of genotype environment interaction
• A norm of reaction quantifies the variety of different phenotypic states that can be produced by a single genotype under different environmental conditions
• Genotype x environment interaction on the number of bristles on the abdomen of male Drosophila pseudoobscura
• Degree of phenotypic variation due to genetic differences between individuals depends on environmental conditions
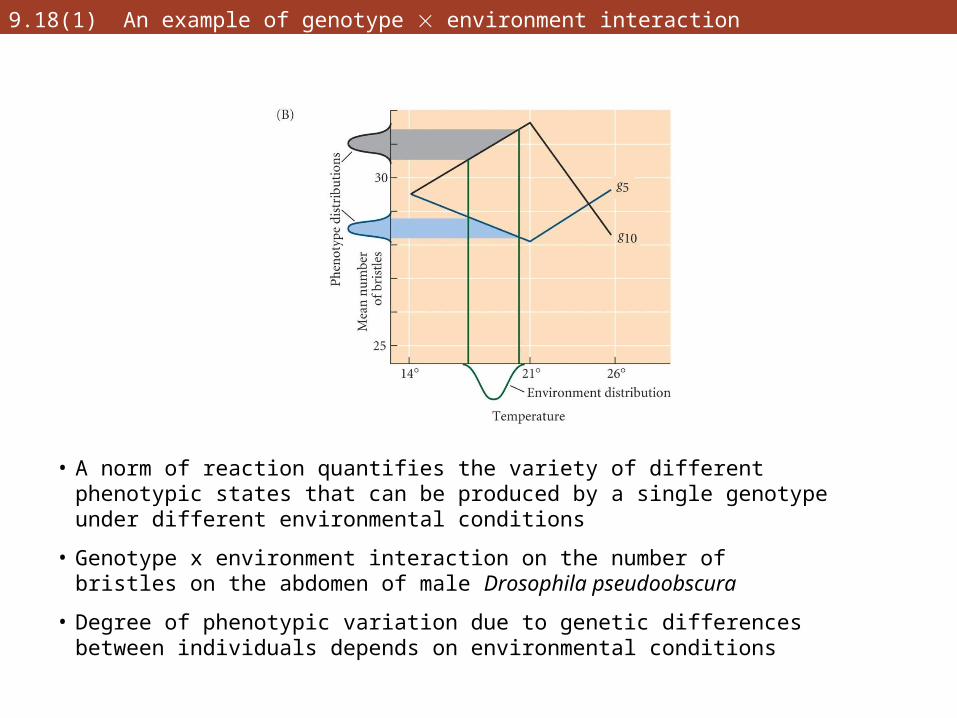
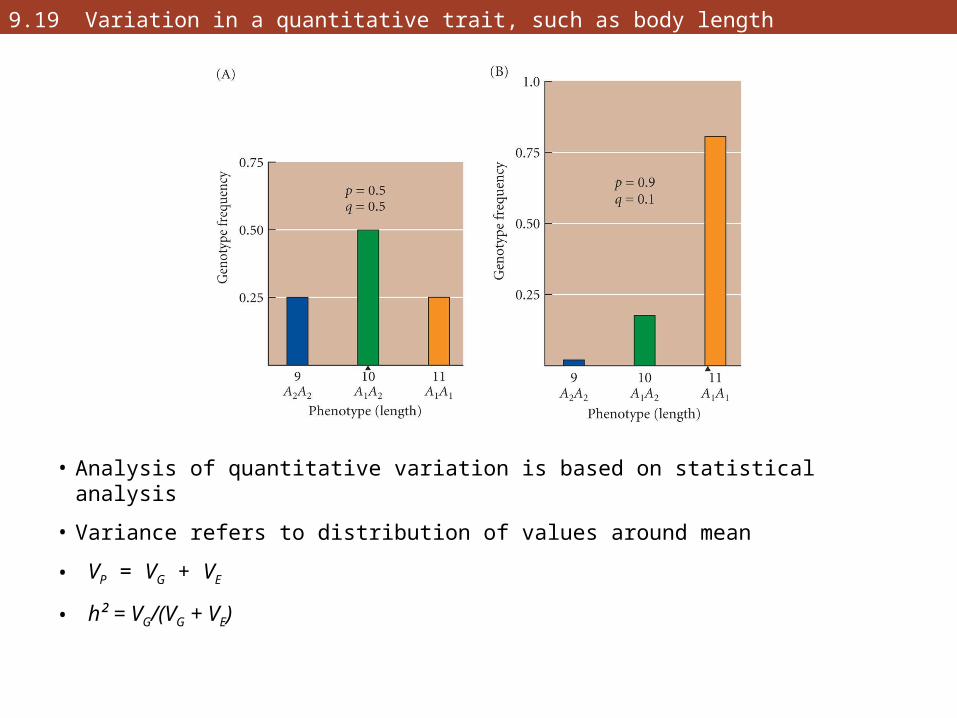
9.19 Variation in a quantitative trait, such as body length
• Analysis of quantitative variation is based on statistical analysis
• Variance refers to distribution of values around mean
• VP = VG + VE
• h² = VG/(VG + VE)
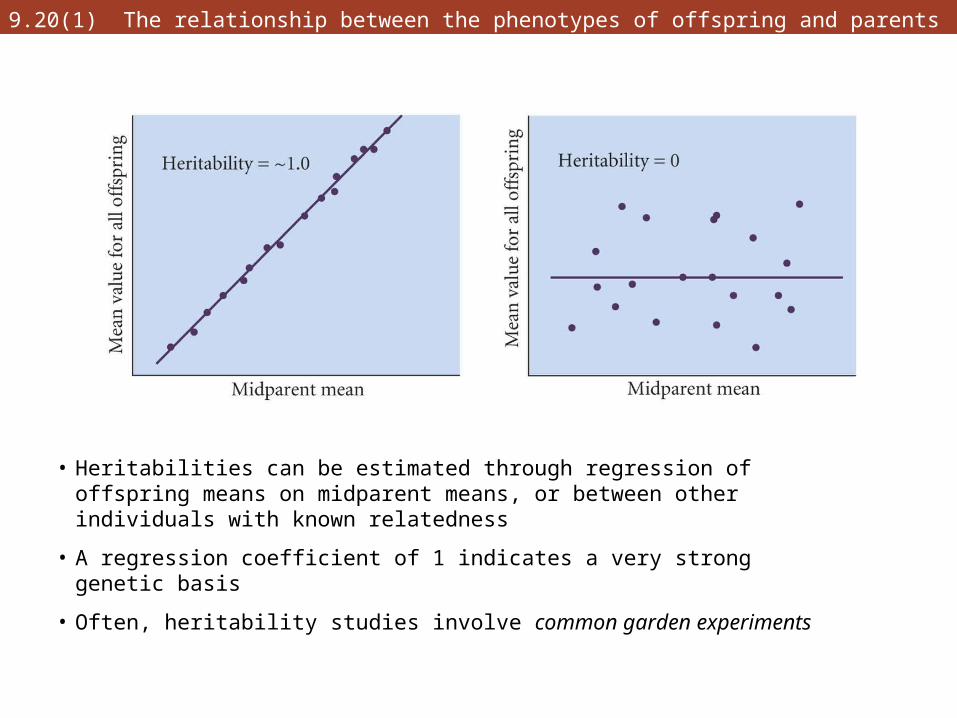
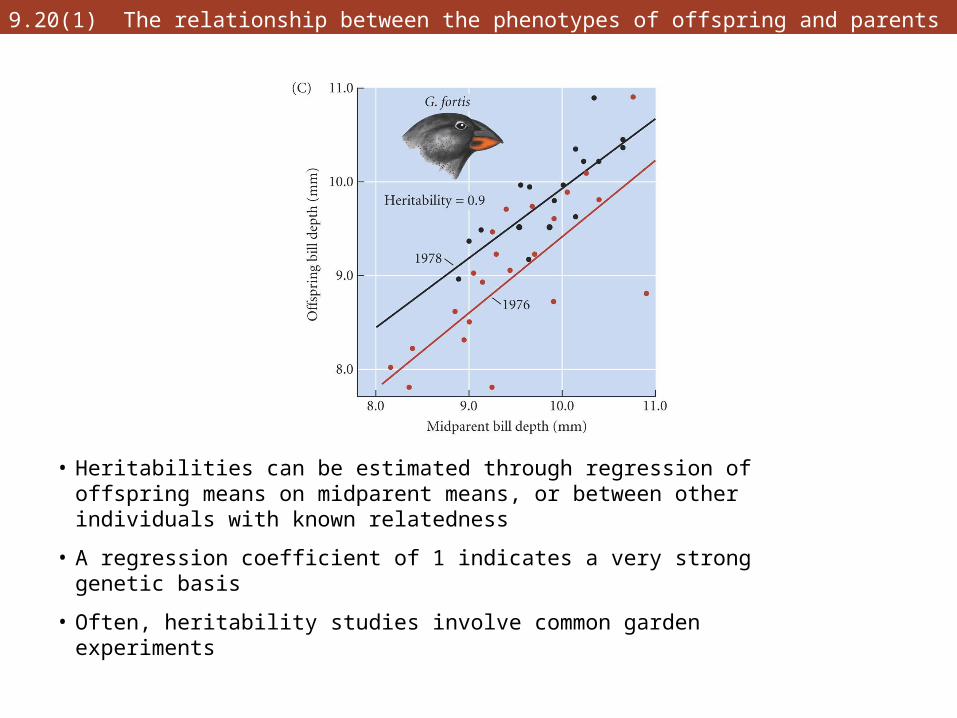
9.20(1) The relationship between the phenotypes of offspring and parents
• Heritabilities can be estimated through regression of offspring means on midparent means, or between other individuals with known relatedness
• A regression coefficient of 1 indicates a very strong genetic basis
• Often, heritability studies involve common garden experiments
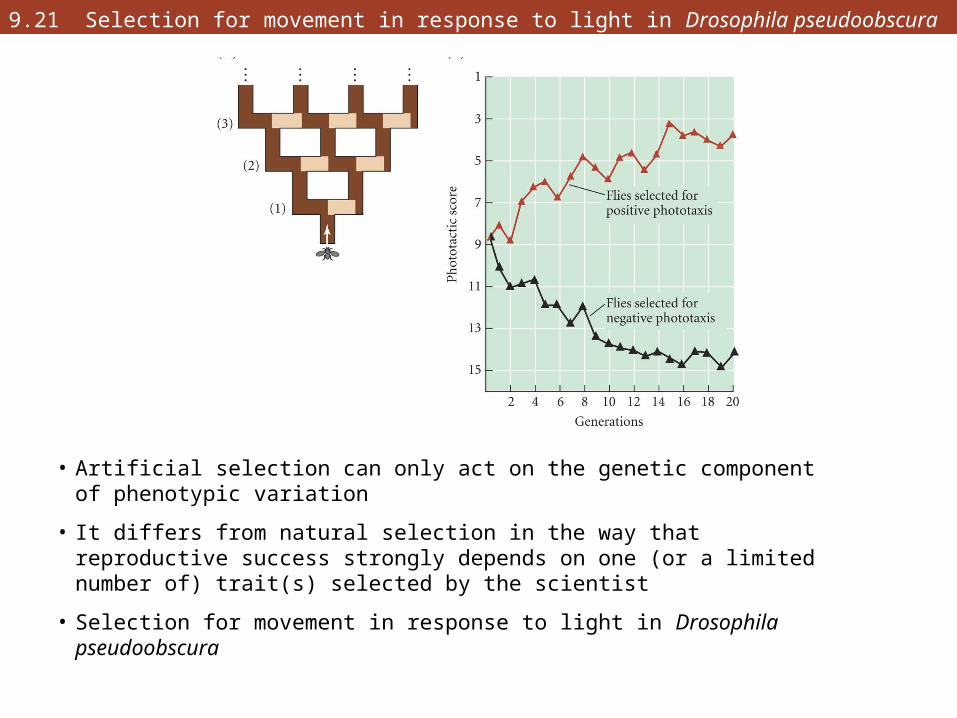
9.21 Selection for movement in response to light in Drosophila pseudoobscura
• Artificial selection can only act on the genetic component of phenotypic variation
• It differs from natural selection in the way that reproductive success strongly depends on one (or a limited number of) trait(s) selected by the scientist
• Selection for movement in response to light in Drosophila pseudoobscura
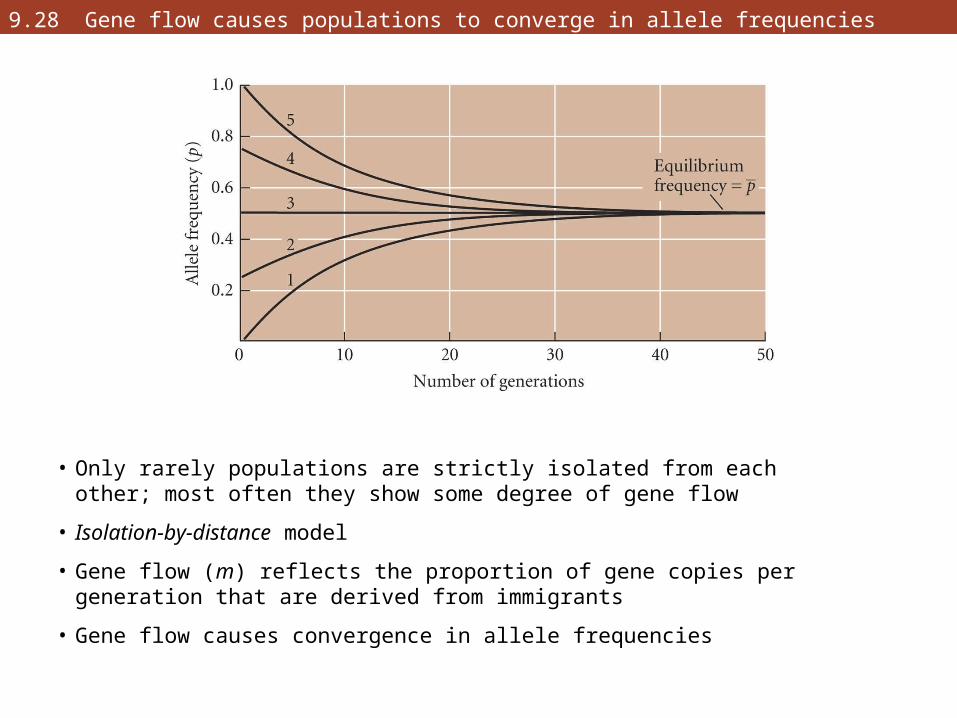
9.28 Gene flow causes populations to converge in allele frequencies
• Only rarely populations are strictly isolated from each other; most often they show some degree of gene flow
• Isolation-by-distance model
• Gene flow (m) reflects the proportion of gene copies per generation that are derived from immigrants
• Gene flow causes convergence in allele frequencies
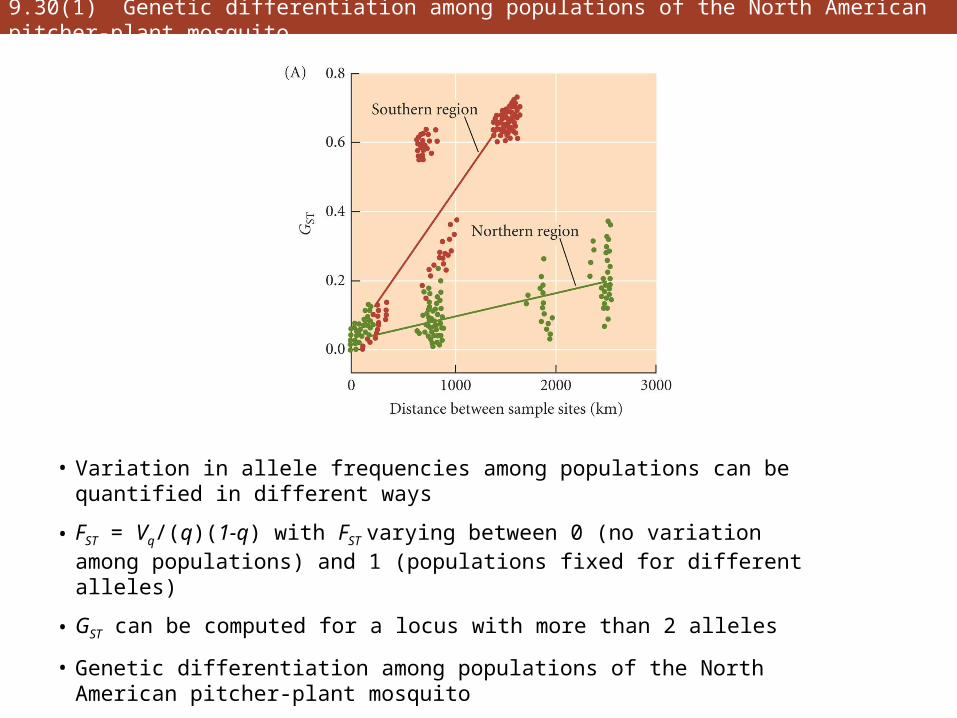
9.30(1) Genetic differentiation among populations of the North American pitcher-plant mosquito
• Variation in allele frequencies among populations can be quantified in different ways
• FST = Vq/(q)(1-q) with FST varying between 0 (no variation among populations) and 1 (populations fixed for different alleles)
• GST can be computed for a locus with more than 2 alleles
• Genetic differentiation among populations of the North American pitcher-plant mosquito
9.30(1) Genetic differentiation among populations of the North American pitcher-plant mosquito
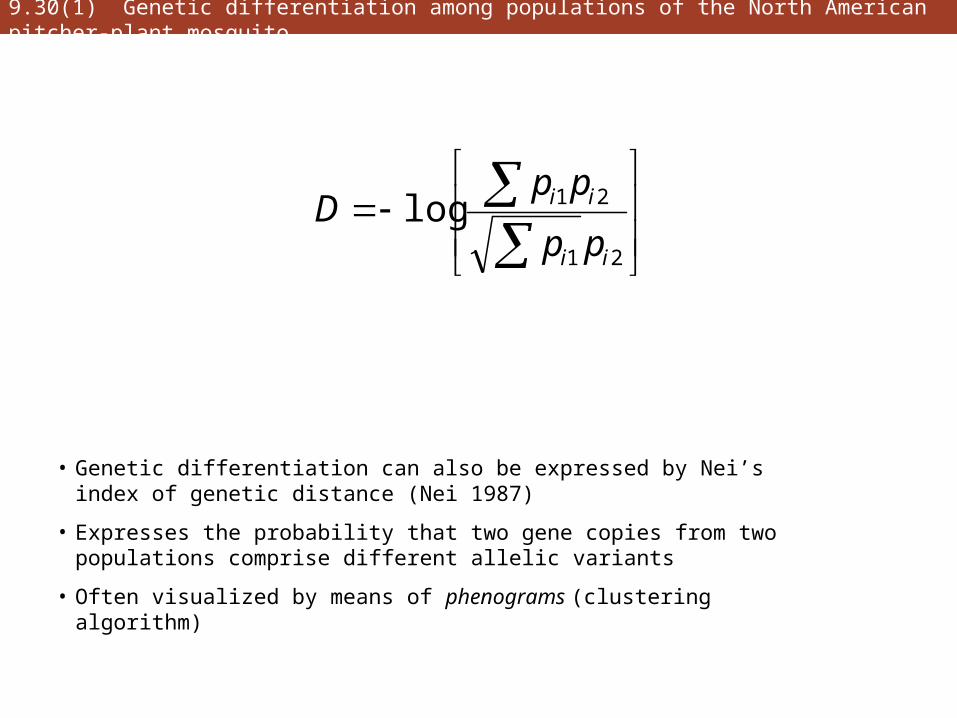
• Genetic differentiation can also be expressed by Nei’s index of genetic distance (Nei 1987)
• Expresses the probability that two gene copies from two populations comprise different allelic variants
• Often visualized by means of phenograms (clustering algorithm)
21
21logii
ii
pp
ppD
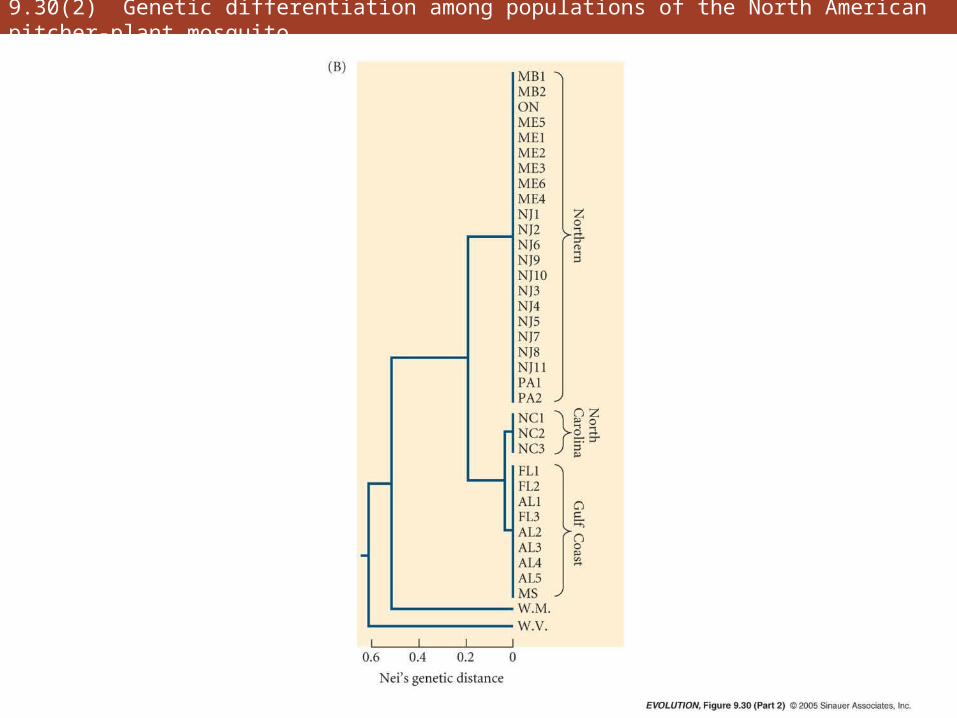
9.30(2) Genetic differentiation among populations of the North American pitcher-plant mosquito
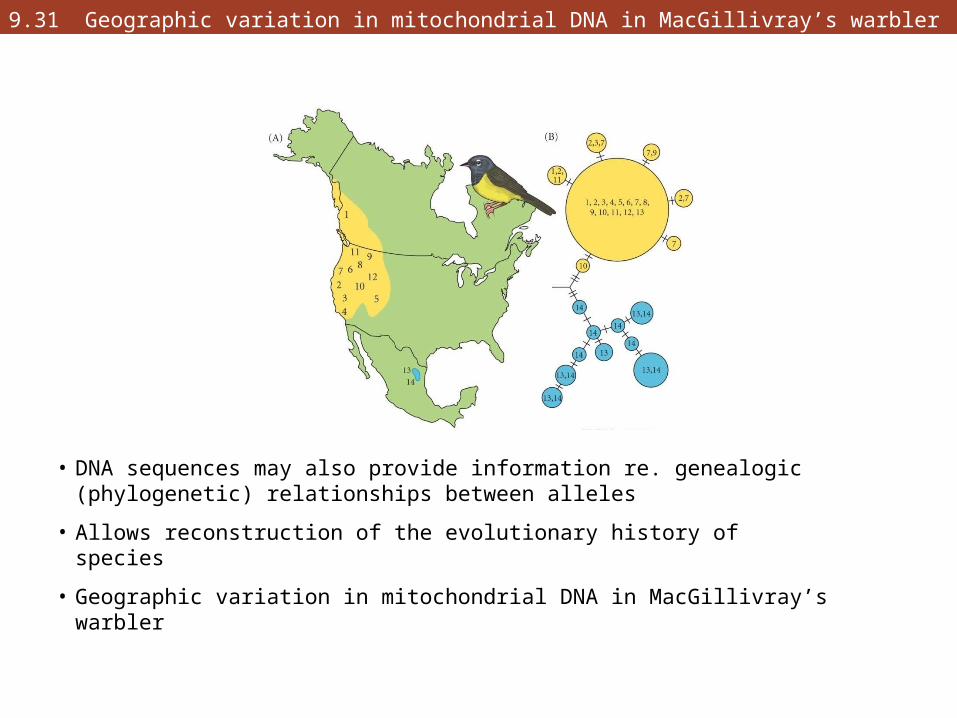
9.31 Geographic variation in mitochondrial DNA in MacGillivray’s warbler
• DNA sequences may also provide information re. genealogic (phylogenetic) relationships between alleles
• Allows reconstruction of the evolutionary history of species
• Geographic variation in mitochondrial DNA in MacGillivray’s warbler
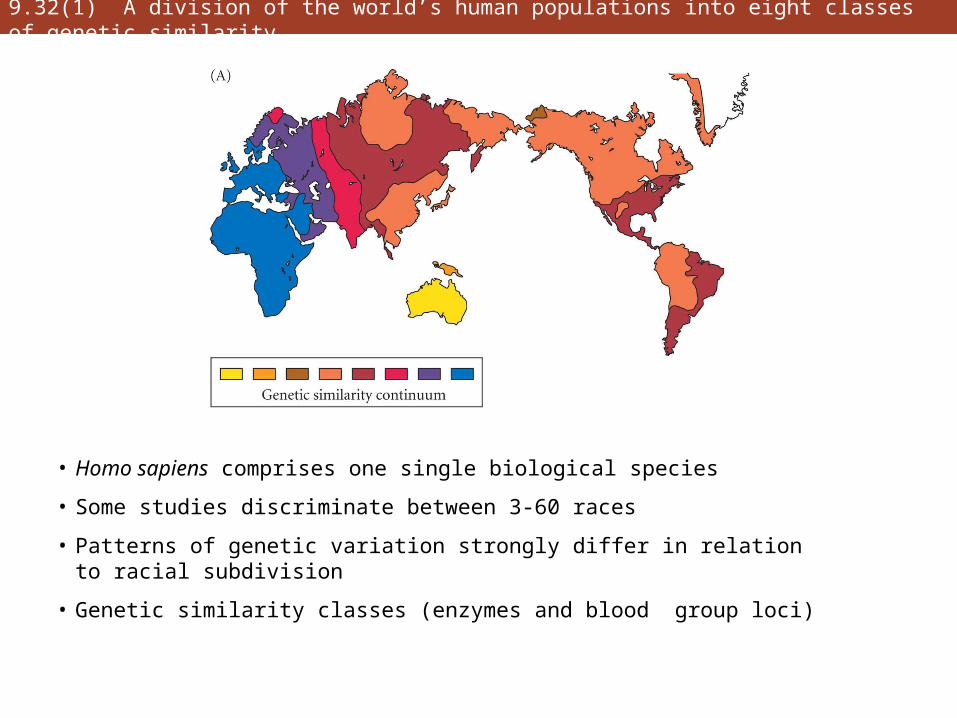
9.32(1) A division of the world’s human populations into eight classes of genetic similarity
• Homo sapiens comprises one single biological species
• Some studies discriminate between 3-60 races
• Patterns of genetic variation strongly differ in relation to racial subdivision
• Genetic similarity classes (enzymes and blood group loci)
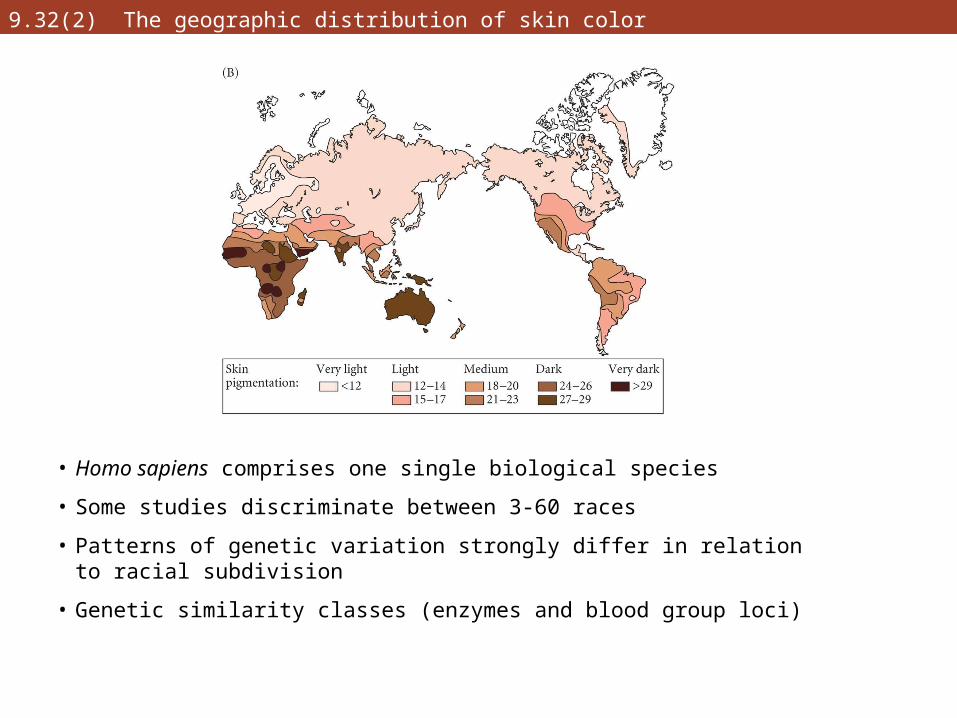
9.32(2) The geographic distribution of skin color
• Homo sapiens comprises one single biological species
• Some studies discriminate between 3-60 races
• Patterns of genetic variation strongly differ in relation to racial subdivision
• Genetic similarity classes (enzymes and blood group loci)