Embed Size (px)
Citation preview
ORIGINAL ARTICLE
doi:10.1111/j.1558-5646.2012.01736.x
CONSISTENCY AND VARIATION INPHENOTYPIC SELECTION EXERTEDBY A COMMUNITY OF SEED PREDATORSCraig W. Benkman,1,2,3 Julie W. Smith,4 Monika Maier,4 Leif Hansen,4 and Matt V. Talluto1,2
1Department of Zoology & Physiology, University of Wyoming, Laramie, Wyoming 820712Program in Ecology, University of Wyoming, Laramie, Wyoming 82071
3E-mail: [email protected] of Biology, Pacific Lutheran University, Tacoma, Washington 98447
Received March 29, 2012
Accepted June 28, 2012
Data Archived: Dryad doi:10.5061/dryad.7q341
Phenotypic selection that is sustained over time underlies both anagenesis and cladogenesis, but the conditions that lead to
such selection and what causes variation in selection are not well known. We measured the selection exerted by three species
of predispersal seed predators of lodgepole pine (Pinus contorta latifolia) in the South Hills, Idaho, and found that net selection
on different cone and seed traits exerted by red crossbills (Loxia curvirostra) and cone borer moths (Eucosma recissoriana) over
10 years of seed crops was similar to that measured in another mountain range. We also found that the strength of selection
increased as seed predation increased, which provides a mechanism for the correlation between the escalation of seed defenses
and the density of seed predators. Red crossbills consume the most seeds and selection they exert accounts for much of the
selection experienced by lodgepole pine, providing additional support for a coevolutionary arms race between crossbills and
lodgepole pine in the South Hills. The third seed predator, hairy woodpeckers (Picoides villosus), consumed less than one-sixth as
many seeds as crossbills. Across the northern Rocky Mountains, woodpecker abundance and therefore selective impact appears
limited by the elevated seed defenses of lodgepole pine.
KEY WORDS: Geographic mosaic of coevolution, lodgepole pine, seed predation, species interactions, trait-mediated indirect
effects.
One of the outstanding challenges for evolutionary biologists is to
understand what causes natural selection (Wade and Kalisz 1990;
MacColl 2011), because its variation in time and space is criti-
cal to both anagenesis and cladogenesis (Futuyma 2010; Uyeda
et al. 2011). Although species interactions are thought to be one
of the main factors causing selection (Schluter 2000; Thompson
2005), direct evidence of biotic or even abiotic factors causing
selection is surprisingly limited (MacColl 2011). In addition, un-
derstanding how species interactions influence selection can be
a complex and difficult task because species often interact with
an array of other species, and their interactions can vary from
direct interactions such as predation to indirect interactions that
can be either density- or trait-mediated (Werner and Peacor 2003;
Thompson 2005; Ohgushi et al. 2012). Furthermore, phenotypic
selection can be highly temporally variable (Siepielski et al. 2009;
Bell 2010) further challenging our efforts to determine whether
and when the selection we measure provides much insight into
longer term evolutionary trajectories.
Although we tend to focus on the frequent occurrence of
temporal variation in selection with some particularly notewor-
thy examples such as Darwin’s ground finches (Geospiza for-
tis: Grant and Grant 2008), selection may be more temporally
1 5 7C© 2012 The Author(s). Evolution C© 2012 The Society for the Study of Evolution.Evolution 67-1: 157–169
CRAIG W. BENKMAN ET AL.
consistent than generally perceived (Morrissey and Hadfield
2012; see also Kingsolver and Diamond 2011). Repeated and
striking patterns of phenotypic divergence indicate cases where
selection has been consistent. For example, Bolnick and Lau
(2008) found divergent selection presumably arising from in-
traspecific competition to be repeated among populations of
three-spine sticklebacks (Gasterosteus aculeatus). In combina-
tion with evidence for character displacement in sticklebacks
(Schluter 2000), this implies temporal consistency in terms of
the cumulative impact. This is not to deny that the strength of
competition and associated selection varies, but competition nev-
ertheless appears to be one interaction that often leads to re-
peated patterns of adaptive evolution (Schluter 2000; Losos 2009;
Pfennig and Pfennig 2009). The question is whether we can antici-
pate other situations or interactions in which selection is sustained
over time.
One interaction for which we have found consistent patterns
of selection and corresponding geographic variation in traits im-
plying that selection measured recently has been repeated well
into the past is that between predispersal seed predators and cone-
bearing conifers (Pinaceae: Benkman 1999; Benkman et al. 2001,
2010; Siepielski and Benkman 2007a,b). For example, the pres-
ence and abundance of different seed predators and the selection
they exert can account for some striking and replicated patterns of
geographic variation in cone structure. This is perhaps surprising
because predispersal seed predation represents a species interac-
tion for which temporal and spatial variation has been repeatedly
documented, and where our understanding of the evolutionary
consequences of these interactions remains generally poor (Kolb
et al. 2007). However, selection on cone-bearing conifers by pre-
dispersal seed predators may be more consistent because many
conifers are engaged in coevolutionary arms races where selection
on physical seed defenses has led to a relatively large allocation
of resources to the woody cones that prevent most seed predators
from feeding on seeds in the closed cones (Smith 1970; Hulme
and Benkman 2002; Leslie 2011). Indeed, small-seeded conifers
in particular allocate a relatively large fraction of their resources
to seed-support structures or defense relative to that allocated
by angiosperms (Greene and Johnson 1994; Lord and Westoby
2012). Presumably the escalation of seed defenses challenges the
abilities of most seed predators, favoring individuals that dis-
criminate among plants depending on their level of defense. In
addition, higher levels of defense will act to limit the diversity of
seed predators that can remove seeds from closed conifer cones,
restricting the number of strongly interacting species and per-
haps stabilizing their relative levels of impact. Finally, increasing
levels of physical or chemical seed defenses tend to be nega-
tively correlated with the extent of annual variation in seed crops
(Janzen 1971, 1974). Consequently, animals that can overcome
the defenses of these highly defended seeds may have more sta-
ble populations than, for example, those seed predators that rely
on plants using the alternative strategy of masting to satiate seed
predators.
Here we focus on the phenotypic selection exerted by predis-
persal seed predators on Rocky Mountain lodgepole pine (Pinus
contorta latifolia). Because of strong selection exerted by pine
squirrels (Tamiasciurus hudsonicus), lodgepole pine allocates a
large percent of its reproductive energies to physical seed de-
fense, as seeds comprise only about 1% of the cone mass (Smith
1970; Benkman et al. 2001, 2003, 2010). This extreme allocation
to defense eliminates seed predation from all but the most spe-
cialized of predispersal seed predators (Smith 1970; Siepielski
and Benkman 2004). For example, only one species of insect,
the lodgepole pine cone borer moth (Eucosma recissoriana;
Lepidoptera: Tortricidae), feeds on seeds in closed lodgepole pine
cones and it consumes <0.1% of the seeds (Miller 1986). How-
ever, pine squirrels did not colonize several mountain ranges east
and west of the Rocky Mountains following the glacial retreat
and expansion of lodgepole pine occurring around 12,000 years
ago (Benkman 1999). Here, because of relaxation of selection
from pine squirrels, lodgepole pine has increased its allocation of
seed mass relative to cone mass by 200–300% (Benkman 1999;
Benkman et al. 2001, 2003, 2010). Consequently, seed predation
by cone borer moths is over two times greater (Siepielski and
Benkman 2004), and, in the absence of competition from pine
squirrels, red crossbills (Loxia curvirostra complex), which are
cardueline finches specialized for foraging on seeds in conifer
cones, are up to 20 times more abundant than in ranges with pine
squirrels (Benkman 1999; Siepielski and Benkman 2005). In ad-
dition, the crossbill endemic to two isolated ranges without pine
squirrels, the South Hills and Albion Mountains, Idaho, appears to
be undergoing ecological speciation (Smith and Benkman 2007).
Its evolution of nearly complete reproductive isolation from other
crossbills within only the last several thousand years might be
attributable to strong and consistent divergent selection from that
experienced by crossbills in ranges with pine squirrels (Benkman
et al. 2003).
Because cone traits in these isolated ranges are conver-
gent east and west of the Rocky Mountains (Benkman 1999;
Parchman et al. 2011), and differ from those in the Rocky Moun-
tains in a manner consistent with both relaxation of selection
by pine squirrels and an increase in selection by especially cross-
bills, we have assumed selection exerted by crossbills is consistent
over time and similar in form among these squirrel-less ranges
(Benkman et al. 2003). However, we measured selection exerted
by crossbills in only one of the mountain ranges, the Little Rocky
Mountains, Montana. Our goal, therefore, was to measure selec-
tion over a nearly nonoverlapping interval (1997–2007 vs. 1990–
1999, for cohorts of cones for which we measured selection ex-
erted by crossbills) to further evaluate the temporal consistency of
1 5 8 EVOLUTION 2013
CONSISTENCY AND VARIATION IN SELECTION
selection. Because selection should be similar among similar
squirrel-less areas, we measured selection exerted by seed preda-
tors in the South Hills, which is 780 km away from the Little
Rocky Mountains and on the opposite (west) side of the Rocky
Mountains (maps of study areas are in earlier publications [e.g.,
Benkman 1999; Benkman et al. 2003]). Measuring selection in
the South Hills also addresses a criticism of our work on coevo-
lution between crossbills and lodgepole pine that we used data
on selection exerted by crossbills in the Little Rocky Mountains
whereas we used data on selection experienced by crossbills in
the South Hills (Gomulkiewicz et al. 2007). We use these data
to further evaluate our claim that selection by crossbills (plus re-
laxation of selection by pine squirrels) is the primary driver of
cone evolution in the South Hills. Finally, hairy woodpeckers (Pi-
coides villosus), the only other predator of seeds in closed Rocky
Mountain lodgepole pine cones, feeds much more commonly on
seeds in lodgepole pine cones in the South Hills than elsewhere
(C. W. Benkman, pers. obs.). Thus, we measured the form and
strength of selection exerted by hairy woodpeckers to account for
all predators of seeds in the closed cones. Because understand-
ing the causes of variation in the abundance of different selective
agents is critical for understanding both temporal and spatial vari-
ation in selection, we examine whether geographic variation in
the cone traits that are under selection by hairy woodpeckers (and
that presumably act to deter them) can account for geographic
variation in woodpecker abundance.
Methods and MaterialsLodgepole pine in mountain ranges without pine squirrels presents
an excellent opportunity to measure selection exerted by predis-
persal seed predators. First, nearly all the trees in such areas have
serotinous cones (Benkman and Siepielski 2004) that are held on
the branches for decades until a stand replacing fire causes the
cones to open and shed their seeds. Second, in these ranges, no
seed predator removes cones from the branches and seed preda-
tion by the different seed predators can be distinguished (Fig. 1).
Thus, seed predation can be quantified for multiple cohorts of
cones so that net selection over multiple years can be measured.
Nevertheless, our measures of selection are based on correlations
rather than experiments. Such correlations can lead to biased esti-
mates of selection if, for example, local environmental conditions
influence both fitness (the probability that seeds are not eaten)
and the phenotype of the cones and seeds (Rausher 1992). Such
biases, however, are unlikely to be substantial for crossbills based
on the similarity between the selection differentials measured in
the wild and those measured experimentally in aviaries for cross-
bills foraging on two other species of conifers (ponderosa pine [P.
ponderosa]: Parchman and Benkman 2008; black pine [P. nigra]:
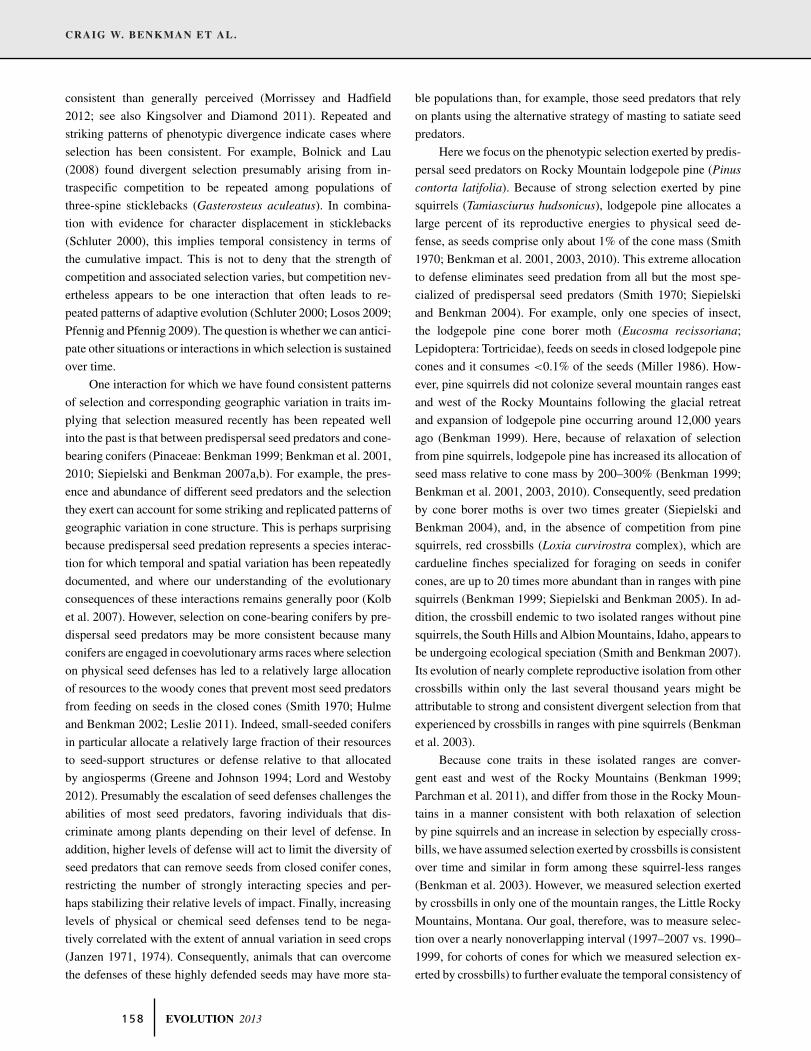
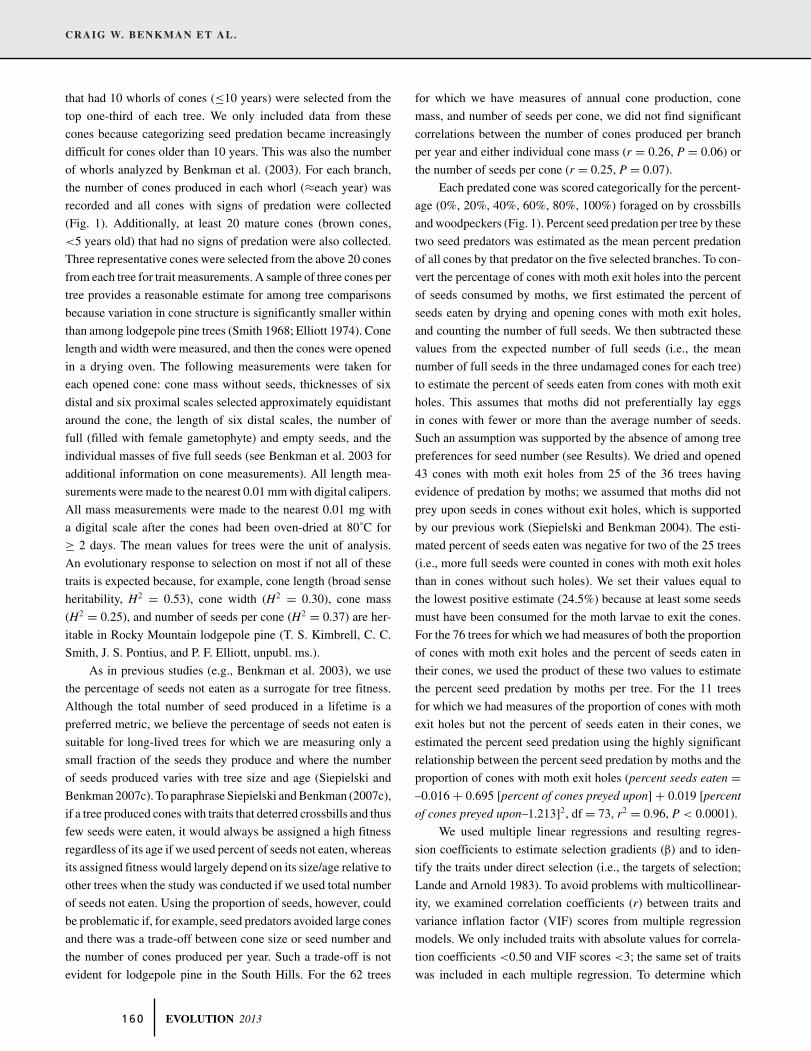
Figure 1. Photograph of cones foraged on by crossbills (left), by
woodpeckers (center), and one that was not foraged on (right).
Crossbills spread apart scales to retrieve the seeds from the base
of the scales, whereas woodpeckers hammer with their bills to
shred and remove the scales to create a cavity exposing the seeds.
Moths leave small exit holes (not shown).
Benkman and Parchman 2009). In addition, we have a mecha-
nistic understanding of the factors determining seed predation by
crossbills (see Benkman et al. 2010 for a review), which strength-
ens inferences on a causal link between phenotype and fitness
(MacColl 2011). We have discussed previously the causal basis
of phenotypic selection exerted by crossbills and moths on lodge-
pole pine (Benkman et al. 2003; Siepielski and Benkman 2004).
Finally, we note that although we measured selection over 10 years
of cone production, this represents but a tenth or less of the ex-
pected reproductive life span of lodgepole pine. Consequently, we
also consider whether and to what extent our measures of selec-
tion are consistent with the replicated patterns of cone evolution
among multiple ranges with and without pine squirrels (Benkman
1999; Benkman et al. 2001; Siepielski and Benkman 2004) to
evaluate whether our short-term measures of selection are likely
representative of selection over the long term.
To quantify seed predation in relation to cone traits (i.e.,
phenotypic selection), we collected cones from 87 recently fallen
lodgepole pine trees in various mature stands throughout the South
Hills in June 2007 and 2008. Fallen trees were chosen because
of the difficulty of sampling cones from standing canopy trees
in mature stands, and there is no reason to suspect that sampling
cones from fallen trees would bias our results. We assume that
sampling cones from these trees approximates a random sam-
ple. This assumption would be violated if trees with certain cone
traits were more likely to fall. We doubt that this is likely, as
susceptibility to windfall appears to have a large environmental
component (e.g., soil structure and moisture, exposure to wind)
and is likely related to features of the trees (e.g., canopy vol-
ume, root structure) unrelated to cone structure. Five branches
EVOLUTION 2013 1 5 9
CRAIG W. BENKMAN ET AL.
that had 10 whorls of cones (≤10 years) were selected from the
top one-third of each tree. We only included data from these
cones because categorizing seed predation became increasingly
difficult for cones older than 10 years. This was also the number
of whorls analyzed by Benkman et al. (2003). For each branch,
the number of cones produced in each whorl (≈each year) was
recorded and all cones with signs of predation were collected
(Fig. 1). Additionally, at least 20 mature cones (brown cones,
<5 years old) that had no signs of predation were also collected.
Three representative cones were selected from the above 20 cones
from each tree for trait measurements. A sample of three cones per
tree provides a reasonable estimate for among tree comparisons
because variation in cone structure is significantly smaller within
than among lodgepole pine trees (Smith 1968; Elliott 1974). Cone
length and width were measured, and then the cones were opened
in a drying oven. The following measurements were taken for
each opened cone: cone mass without seeds, thicknesses of six
distal and six proximal scales selected approximately equidistant
around the cone, the length of six distal scales, the number of
full (filled with female gametophyte) and empty seeds, and the
individual masses of five full seeds (see Benkman et al. 2003 for
additional information on cone measurements). All length mea-
surements were made to the nearest 0.01 mm with digital calipers.
All mass measurements were made to the nearest 0.01 mg with
a digital scale after the cones had been oven-dried at 80˚C for
≥ 2 days. The mean values for trees were the unit of analysis.
An evolutionary response to selection on most if not all of these
traits is expected because, for example, cone length (broad sense
heritability, H2 = 0.53), cone width (H2 = 0.30), cone mass
(H2 = 0.25), and number of seeds per cone (H2 = 0.37) are her-
itable in Rocky Mountain lodgepole pine (T. S. Kimbrell, C. C.
Smith, J. S. Pontius, and P. F. Elliott, unpubl. ms.).
As in previous studies (e.g., Benkman et al. 2003), we use
the percentage of seeds not eaten as a surrogate for tree fitness.
Although the total number of seed produced in a lifetime is a
preferred metric, we believe the percentage of seeds not eaten is
suitable for long-lived trees for which we are measuring only a
small fraction of the seeds they produce and where the number
of seeds produced varies with tree size and age (Siepielski and
Benkman 2007c). To paraphrase Siepielski and Benkman (2007c),
if a tree produced cones with traits that deterred crossbills and thus
few seeds were eaten, it would always be assigned a high fitness
regardless of its age if we used percent of seeds not eaten, whereas
its assigned fitness would largely depend on its size/age relative to
other trees when the study was conducted if we used total number
of seeds not eaten. Using the proportion of seeds, however, could
be problematic if, for example, seed predators avoided large cones
and there was a trade-off between cone size or seed number and
the number of cones produced per year. Such a trade-off is not
evident for lodgepole pine in the South Hills. For the 62 trees
for which we have measures of annual cone production, cone
mass, and number of seeds per cone, we did not find significant
correlations between the number of cones produced per branch
per year and either individual cone mass (r = 0.26, P = 0.06) or
the number of seeds per cone (r = 0.25, P = 0.07).
Each predated cone was scored categorically for the percent-
age (0%, 20%, 40%, 60%, 80%, 100%) foraged on by crossbills
and woodpeckers (Fig. 1). Percent seed predation per tree by these
two seed predators was estimated as the mean percent predation
of all cones by that predator on the five selected branches. To con-
vert the percentage of cones with moth exit holes into the percent
of seeds consumed by moths, we first estimated the percent of
seeds eaten by drying and opening cones with moth exit holes,
and counting the number of full seeds. We then subtracted these
values from the expected number of full seeds (i.e., the mean
number of full seeds in the three undamaged cones for each tree)
to estimate the percent of seeds eaten from cones with moth exit
holes. This assumes that moths did not preferentially lay eggs
in cones with fewer or more than the average number of seeds.
Such an assumption was supported by the absence of among tree
preferences for seed number (see Results). We dried and opened
43 cones with moth exit holes from 25 of the 36 trees having
evidence of predation by moths; we assumed that moths did not
prey upon seeds in cones without exit holes, which is supported
by our previous work (Siepielski and Benkman 2004). The esti-
mated percent of seeds eaten was negative for two of the 25 trees
(i.e., more full seeds were counted in cones with moth exit holes
than in cones without such holes). We set their values equal to
the lowest positive estimate (24.5%) because at least some seeds
must have been consumed for the moth larvae to exit the cones.
For the 76 trees for which we had measures of both the proportion
of cones with moth exit holes and the percent of seeds eaten in
their cones, we used the product of these two values to estimate
the percent seed predation by moths per tree. For the 11 trees
for which we had measures of the proportion of cones with moth
exit holes but not the percent of seeds eaten in their cones, we
estimated the percent seed predation using the highly significant
relationship between the percent seed predation by moths and the
proportion of cones with moth exit holes (percent seeds eaten =–0.016 + 0.695 [percent of cones preyed upon] + 0.019 [percent
of cones preyed upon–1.213]2, df = 73, r2 = 0.96, P < 0.0001).
We used multiple linear regressions and resulting regres-
sion coefficients to estimate selection gradients (β) and to iden-
tify the traits under direct selection (i.e., the targets of selection;
Lande and Arnold 1983). To avoid problems with multicollinear-
ity, we examined correlation coefficients (r) between traits and
variance inflation factor (VIF) scores from multiple regression
models. We only included traits with absolute values for correla-
tion coefficients <0.50 and VIF scores <3; the same set of traits
was included in each multiple regression. To determine which
1 6 0 EVOLUTION 2013
CONSISTENCY AND VARIATION IN SELECTION
traits were under selection (both direct and indirect selection),
we used least squares regression analyses to estimate standard-
ized selection differentials (s) and standardized quadratic selec-
tion gradients (γ) using regression coefficients (Lande and Arnold
1983); the quadratic term was doubled (Lande and Arnold 1983;
Stinchcombe et al. 2008). Relative tree fitness was estimated as
100 minus percent seed predation divided by the overall mean,
and cone traits were standardized to units of SD. Relative tree fit-
ness was estimated in relation to seed predation by each individual
predator species and to the total seed predation by all three species.
We used regression bootstrap to test for significance of the selec-
tion differentials and selection gradients, and to estimate standard
errors because the residuals in the regressions were strongly non-
normally distributed. Tests of significance were based on 1000
bootstrap replicates. We used cubic splines to further examine the
form of selection on cone traits for which the quadratic term was
significant (P < 0.05; only one quadratic regression was statis-
tically significant). We used two composite variables: the ratio
of seed mass to cone mass (a measure of the amount of energy
devoted to reproduction relative to seed defense) and the ratio of
cone width to cone length (a measure of cone shape). Seed mass is
the product of mean individual seed mass multiplied by the mean
number of full seeds per cone.
We used data from two earlier studies on seed predation
and selection exerted by crossbills and moths in the Little Rocky
Mountains (Benkman et al. 2003 and Siepielski and Benkman
2004, respectively) for comparative purposes and to determine the
consistency of selection on lodgepole pine between two ranges
lacking pine squirrels. To test for the consistency of selection by
crossbills and moths, we performed separate regressions com-
paring the selection differentials for crossbills and moths at the
two sites. A significant positive relationship would indicate con-
sistency in selection. Because the residual distributions of these
regressions were unknown, and to account for uncertainty in the
estimates of the selection differentials, we used nonparametric
bootstraps (n = 1000) to calculate confidence intervals for the re-
gression coefficients. For each bootstrap replicate, we resampled
the original data for both sites, calculated the selection differ-
entials for each trait in the resampled datasets (as above), and
then performed a linear regression on the bootstrap selection dif-
ferentials for the two sites. We also calculated P-values on the
hypothesis that the coefficient bi = 0 using the method described
in Davison and Hinkley (1997). Using the same methodology, we
also performed regressions to compare the selection differentials
due to crossbills, woodpeckers, and moths to the overall selection
differentials resulting from total seed predation (one regression
per species).
To examine the relationship between hairy woodpecker abun-
dance and cone traits under selection by woodpeckers and to help
infer a causal basis of selection exerted by woodpeckers, we use
0 20 40 60 800
10
20
30
Tree rank
Per
cent
of s
eeds
eat
en
0
10
20
30Woodpeckers
Crossbills
0 20 40 60 800
10
20
30Moths
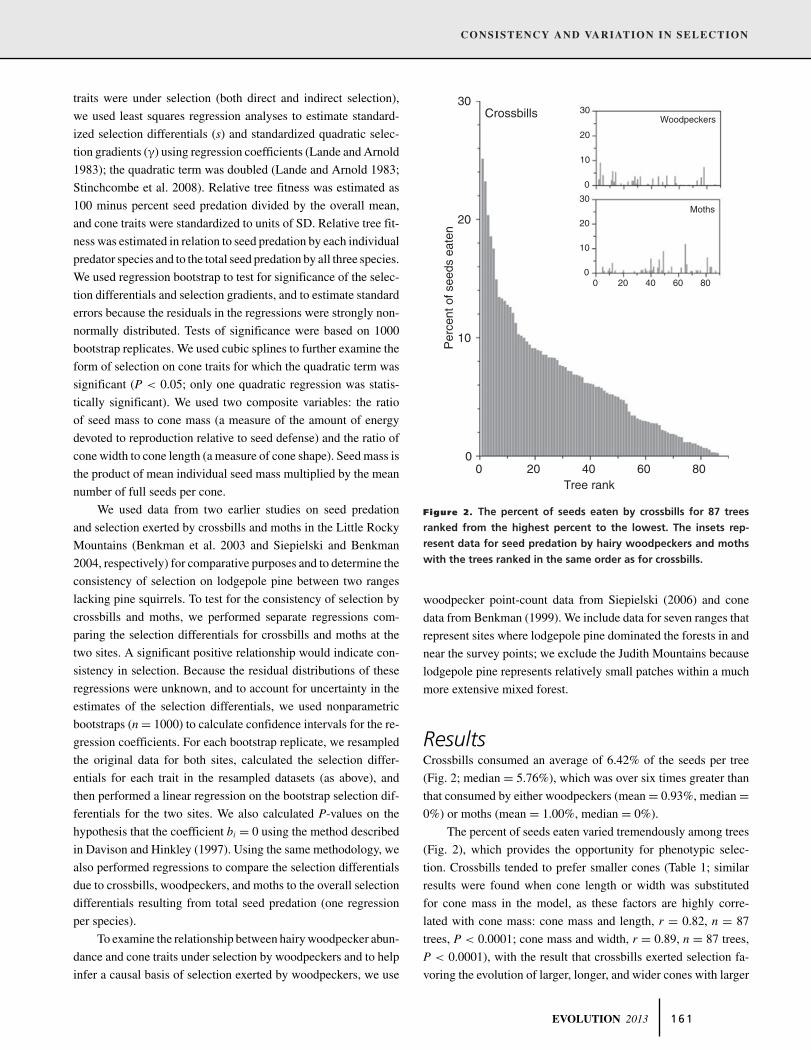
Figure 2. The percent of seeds eaten by crossbills for 87 trees
ranked from the highest percent to the lowest. The insets rep-
resent data for seed predation by hairy woodpeckers and moths
with the trees ranked in the same order as for crossbills.
woodpecker point-count data from Siepielski (2006) and cone
data from Benkman (1999). We include data for seven ranges that
represent sites where lodgepole pine dominated the forests in and
near the survey points; we exclude the Judith Mountains because
lodgepole pine represents relatively small patches within a much
more extensive mixed forest.
ResultsCrossbills consumed an average of 6.42% of the seeds per tree
(Fig. 2; median = 5.76%), which was over six times greater than
that consumed by either woodpeckers (mean = 0.93%, median =0%) or moths (mean = 1.00%, median = 0%).
The percent of seeds eaten varied tremendously among trees
(Fig. 2), which provides the opportunity for phenotypic selec-
tion. Crossbills tended to prefer smaller cones (Table 1; similar
results were found when cone length or width was substituted
for cone mass in the model, as these factors are highly corre-
lated with cone mass: cone mass and length, r = 0.82, n = 87
trees, P < 0.0001; cone mass and width, r = 0.89, n = 87 trees,
P < 0.0001), with the result that crossbills exerted selection fa-
voring the evolution of larger, longer, and wider cones with larger
EVOLUTION 2013 1 6 1
CRAIG W. BENKMAN ET AL.
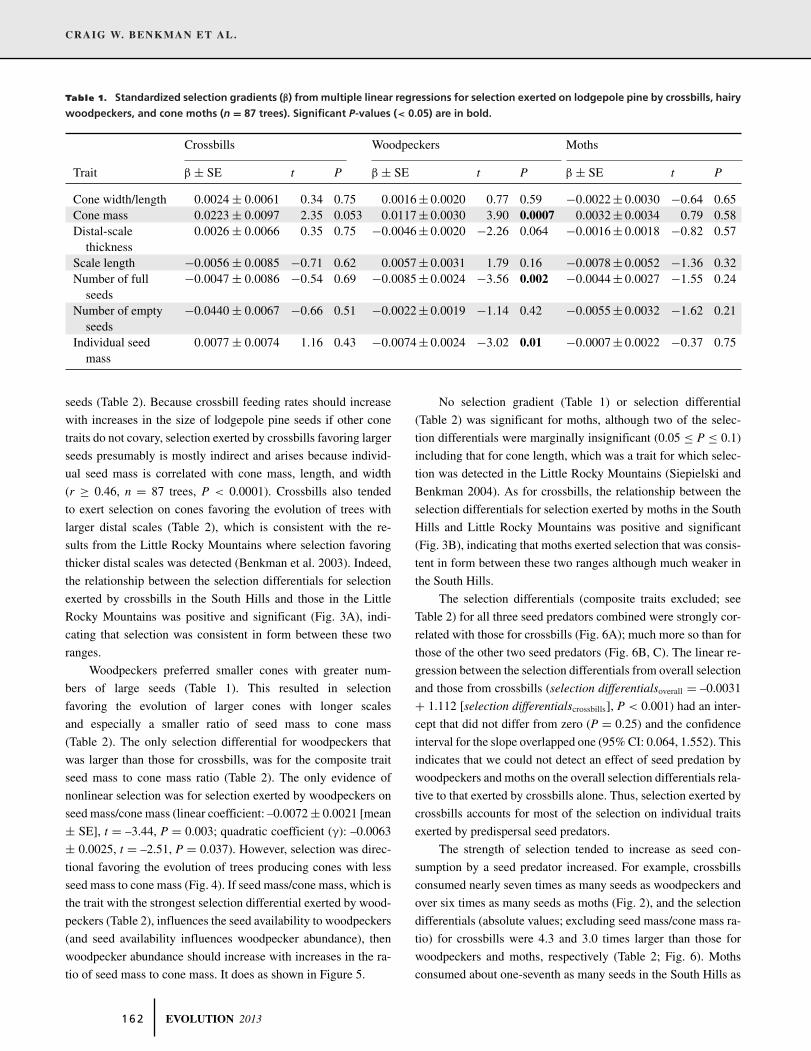
Table 1. Standardized selection gradients (β) from multiple linear regressions for selection exerted on lodgepole pine by crossbills, hairy
woodpeckers, and cone moths (n = 87 trees). Significant P-values (< 0.05) are in bold.
Crossbills Woodpeckers Moths
Trait β ± SE t P β ± SE t P β ± SE t P
Cone width/length 0.0024 ± 0.0061 0.34 0.75 0.0016 ± 0.0020 0.77 0.59 −0.0022 ± 0.0030 −0.64 0.65Cone mass 0.0223 ± 0.0097 2.35 0.053 0.0117 ± 0.0030 3.90 0.0007 0.0032 ± 0.0034 0.79 0.58Distal-scale
thickness0.0026 ± 0.0066 0.35 0.75 −0.0046 ± 0.0020 −2.26 0.064 −0.0016 ± 0.0018 −0.82 0.57
Scale length −0.0056 ± 0.0085 −0.71 0.62 0.0057 ± 0.0031 1.79 0.16 −0.0078 ± 0.0052 −1.36 0.32Number of full
seeds−0.0047 ± 0.0086 −0.54 0.69 −0.0085 ± 0.0024 −3.56 0.002 −0.0044 ± 0.0027 −1.55 0.24
Number of emptyseeds
−0.0440 ± 0.0067 −0.66 0.51 −0.0022 ± 0.0019 −1.14 0.42 −0.0055 ± 0.0032 −1.62 0.21
Individual seedmass
0.0077 ± 0.0074 1.16 0.43 −0.0074 ± 0.0024 −3.02 0.01 −0.0007 ± 0.0022 −0.37 0.75
seeds (Table 2). Because crossbill feeding rates should increase
with increases in the size of lodgepole pine seeds if other cone
traits do not covary, selection exerted by crossbills favoring larger
seeds presumably is mostly indirect and arises because individ-
ual seed mass is correlated with cone mass, length, and width
(r ≥ 0.46, n = 87 trees, P < 0.0001). Crossbills also tended
to exert selection on cones favoring the evolution of trees with
larger distal scales (Table 2), which is consistent with the re-
sults from the Little Rocky Mountains where selection favoring
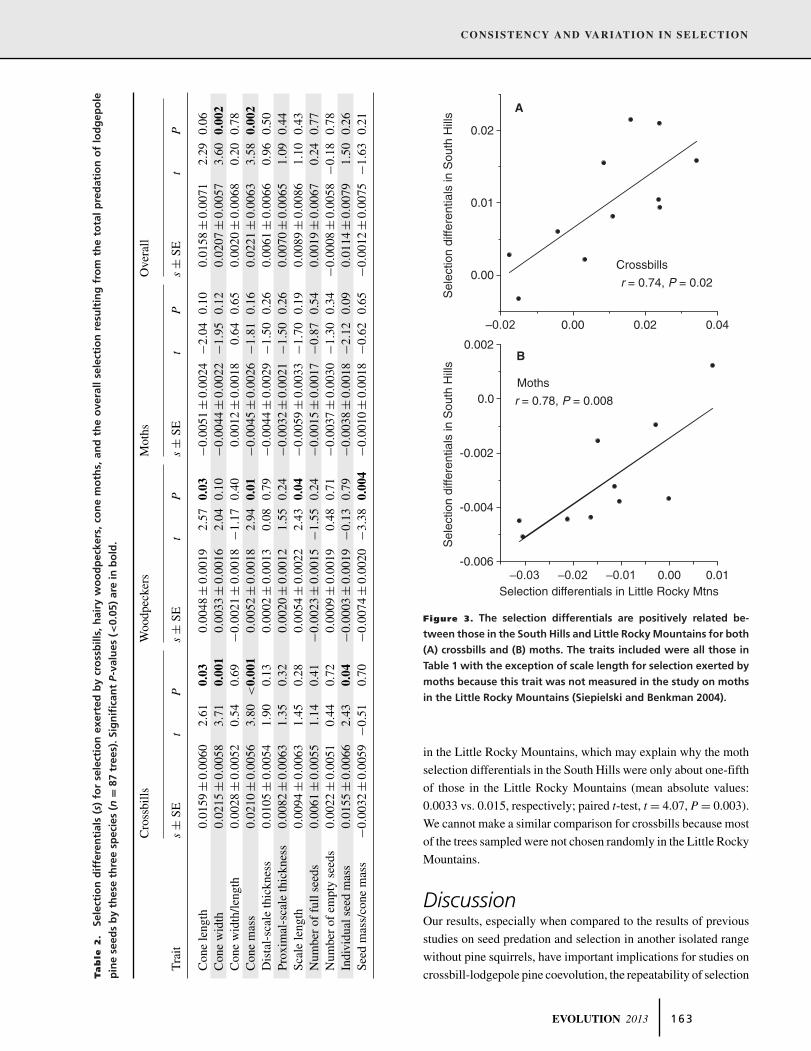
thicker distal scales was detected (Benkman et al. 2003). Indeed,
the relationship between the selection differentials for selection
exerted by crossbills in the South Hills and those in the Little
Rocky Mountains was positive and significant (Fig. 3A), indi-
cating that selection was consistent in form between these two
ranges.
Woodpeckers preferred smaller cones with greater num-
bers of large seeds (Table 1). This resulted in selection
favoring the evolution of larger cones with longer scales
and especially a smaller ratio of seed mass to cone mass
(Table 2). The only selection differential for woodpeckers that
was larger than those for crossbills, was for the composite trait
seed mass to cone mass ratio (Table 2). The only evidence of
nonlinear selection was for selection exerted by woodpeckers on
seed mass/cone mass (linear coefficient: –0.0072 ± 0.0021 [mean
± SE], t = –3.44, P = 0.003; quadratic coefficient (γ): –0.0063
± 0.0025, t = –2.51, P = 0.037). However, selection was direc-
tional favoring the evolution of trees producing cones with less
seed mass to cone mass (Fig. 4). If seed mass/cone mass, which is
the trait with the strongest selection differential exerted by wood-
peckers (Table 2), influences the seed availability to woodpeckers
(and seed availability influences woodpecker abundance), then
woodpecker abundance should increase with increases in the ra-
tio of seed mass to cone mass. It does as shown in Figure 5.
No selection gradient (Table 1) or selection differential
(Table 2) was significant for moths, although two of the selec-
tion differentials were marginally insignificant (0.05 ≤ P ≤ 0.1)
including that for cone length, which was a trait for which selec-
tion was detected in the Little Rocky Mountains (Siepielski and
Benkman 2004). As for crossbills, the relationship between the
selection differentials for selection exerted by moths in the South
Hills and Little Rocky Mountains was positive and significant
(Fig. 3B), indicating that moths exerted selection that was consis-
tent in form between these two ranges although much weaker in
the South Hills.
The selection differentials (composite traits excluded; see
Table 2) for all three seed predators combined were strongly cor-
related with those for crossbills (Fig. 6A); much more so than for
those of the other two seed predators (Fig. 6B, C). The linear re-
gression between the selection differentials from overall selection
and those from crossbills (selection differentialsoverall = –0.0031
+ 1.112 [selection differentialscrossbills], P < 0.001) had an inter-
cept that did not differ from zero (P = 0.25) and the confidence
interval for the slope overlapped one (95% CI: 0.064, 1.552). This
indicates that we could not detect an effect of seed predation by
woodpeckers and moths on the overall selection differentials rela-
tive to that exerted by crossbills alone. Thus, selection exerted by
crossbills accounts for most of the selection on individual traits
exerted by predispersal seed predators.
The strength of selection tended to increase as seed con-
sumption by a seed predator increased. For example, crossbills
consumed nearly seven times as many seeds as woodpeckers and
over six times as many seeds as moths (Fig. 2), and the selection
differentials (absolute values; excluding seed mass/cone mass ra-
tio) for crossbills were 4.3 and 3.0 times larger than those for
woodpeckers and moths, respectively (Table 2; Fig. 6). Moths
consumed about one-seventh as many seeds in the South Hills as
1 6 2 EVOLUTION 2013
CONSISTENCY AND VARIATION IN SELECTION
Ta
ble
2.
Sele
ctio
nd
iffe
ren
tial
s(s
)fo
rse
lect
ion
exer
ted
by
cro
ssb
ills,
hai
ryw
oo
dp
ecke
rs,
con
em
oth
s,an
dth
eo
vera
llse
lect
ion
resu
ltin
gfr
om
the
tota
lp
red
atio
no
flo
dg
epo
le
pin
ese
eds
by
thes
eth
ree
spec
ies
(n=
87tr
ees)
.Sig
nifi
can
tP
-val
ues
(<0.
05)
are
inb
old
.
Cro
ssbi
llsW
oodp
ecke
rsM
oths
Ove
rall
Tra
its±
SEt
Ps±
SEt
Ps±
SEt
Ps±
SEt
P
Con
ele
ngth
0.01
59±
0.00
602.
610.
030.
0048
±0.
0019
2.57
0.03
−0.0
051±
0.00
24−2
.04
0.10
0.01
58±
0.00
712.
290.
06C
one
wid
th0.
0215
±0.
0058
3.71
0.00
10.
0033
±0.
0016
2.04
0.10
−0.0
044±
0.00
22−1
.95
0.12
0.02
07±
0.00
573.
600.
002
Con
ew
idth
/leng
th0.
0028
±0.
0052
0.54
0.69
−0.0
021±
0.00
18−1
.17
0.40
0.00
12±
0.00
180.
640.
650.
0020
±0.
0068
0.20
0.78
Con
em
ass
0.02
10±
0.00
563.
80<
0.00
10.
0052
±0.
0018
2.94
0.01
−0.0
045±
0.00
26−1
.81
0.16
0.02
21±
0.00
633.
580.
002
Dis
tal-
scal
eth
ickn
ess
0.01
05±
0.00
541.
900.
130.
0002
±0.
0013
0.08
0.79
−0.0
044±
0.00
29−1
.50
0.26
0.00
61±
0.00
660.
960.
50Pr
oxim
al-s
cale
thic
knes
s0.
0082
±0.
0063
1.35
0.32
0.00
20±
0.00
121.
550.
24−0
.003
2±
0.00
21−1
.50
0.26
0.00
70±
0.00
651.
090.
44Sc
ale
leng
th0.
0094
±0.
0063
1.45
0.28
0.00
54±
0.00
222.
430.
04−0
.005
9±
0.00
33−1
.70
0.19
0.00
89±
0.00
861.
100.
43N
umbe
rof
full
seed
s0.
0061
±0.
0055
1.14
0.41
−0.0
023±
0.00
15−1
.55
0.24
−0.0
015±
0.00
17−0
.87
0.54
0.00
19±
0.00
670.
240.
77N
umbe
rof
empt
yse
eds
0.00
22±
0.00
510.
440.
720.
0009
±0.
0019
0.48
0.71
−0.0
037±
0.00
30−1
.30
0.34
−0.0
008
±0.
0058
−0.1
80.
78In
divi
dual
seed
mas
s0.
0155
±0.
0066
2.43
0.04
−0.0
003±
0.00
19−0
.13
0.79
−0.0
038±
0.00
18−2
.12
0.09
0.01
14±
0.00
791.
500.
26Se
edm
ass/
cone
mas
s−0
.003
2±
0.00
59−0
.51
0.70
−0.0
074±
0.00
20−3
.38
0.00
4−0
.001
0±
0.00
18−0
.62
0.65
−0.0
012
±0.
0075
−1.6
30.
21
0.00 0.01-0.006
-0.004
-0.002
0.0
0.002
0.00 0.02 0.04
0.00
0.01
0.02
Sel
ectio
n di
ffere
ntia
ls in
Sou
th H
ills
Sel
ectio
n di
ffere
ntia
ls in
Sou
th H
ills
Selection differentials in Little Rocky Mtns
Crossbills
Moths
A
B
r = 0.74, P = 0.02
r = 0.78, P = 0.008
Figure 3. The selection differentials are positively related be-
tween those in the South Hills and Little Rocky Mountains for both
(A) crossbills and (B) moths. The traits included were all those in
Table 1 with the exception of scale length for selection exerted by
moths because this trait was not measured in the study on moths
in the Little Rocky Mountains (Siepielski and Benkman 2004).
in the Little Rocky Mountains, which may explain why the moth
selection differentials in the South Hills were only about one-fifth
of those in the Little Rocky Mountains (mean absolute values:
0.0033 vs. 0.015, respectively; paired t-test, t = 4.07, P = 0.003).
We cannot make a similar comparison for crossbills because most
of the trees sampled were not chosen randomly in the Little Rocky
Mountains.
DiscussionOur results, especially when compared to the results of previous
studies on seed predation and selection in another isolated range
without pine squirrels, have important implications for studies on
crossbill-lodgepole pine coevolution, the repeatability of selection
EVOLUTION 2013 1 6 3
CRAIG W. BENKMAN ET AL.
0.00 0.01 0.02 0.03 0.04 0.05 0.06 0.07
0.92
0.94
0.96
0.98
1.00
1.02
Seed mass/cone mass
Rel
ativ
e fit
ness
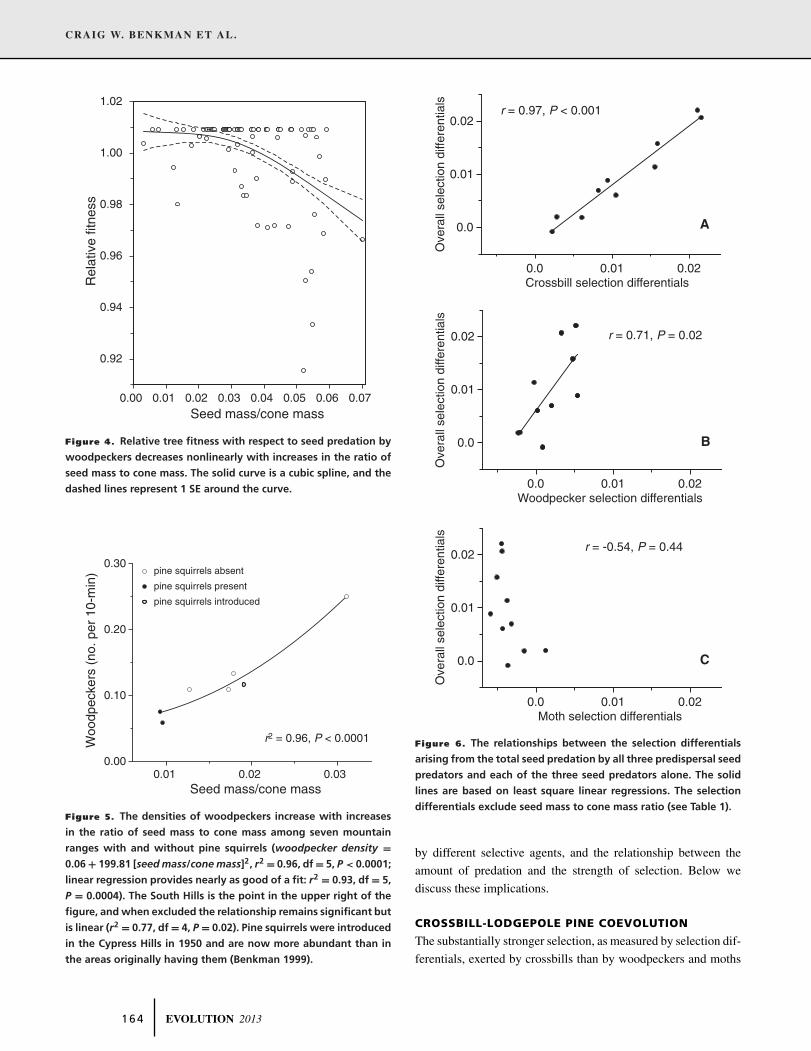
Figure 4. Relative tree fitness with respect to seed predation by
woodpeckers decreases nonlinearly with increases in the ratio of
seed mass to cone mass. The solid curve is a cubic spline, and the
dashed lines represent 1 SE around the curve.
0.01 0.02 0.030.00
0.10
0.20
0.30
Seed mass/cone mass
Woo
dpec
kers
(no
. per
10-
min
)
r2 = 0.96, P < 0.0001
pine squirrels absent
pine squirrels present
pine squirrels introduced
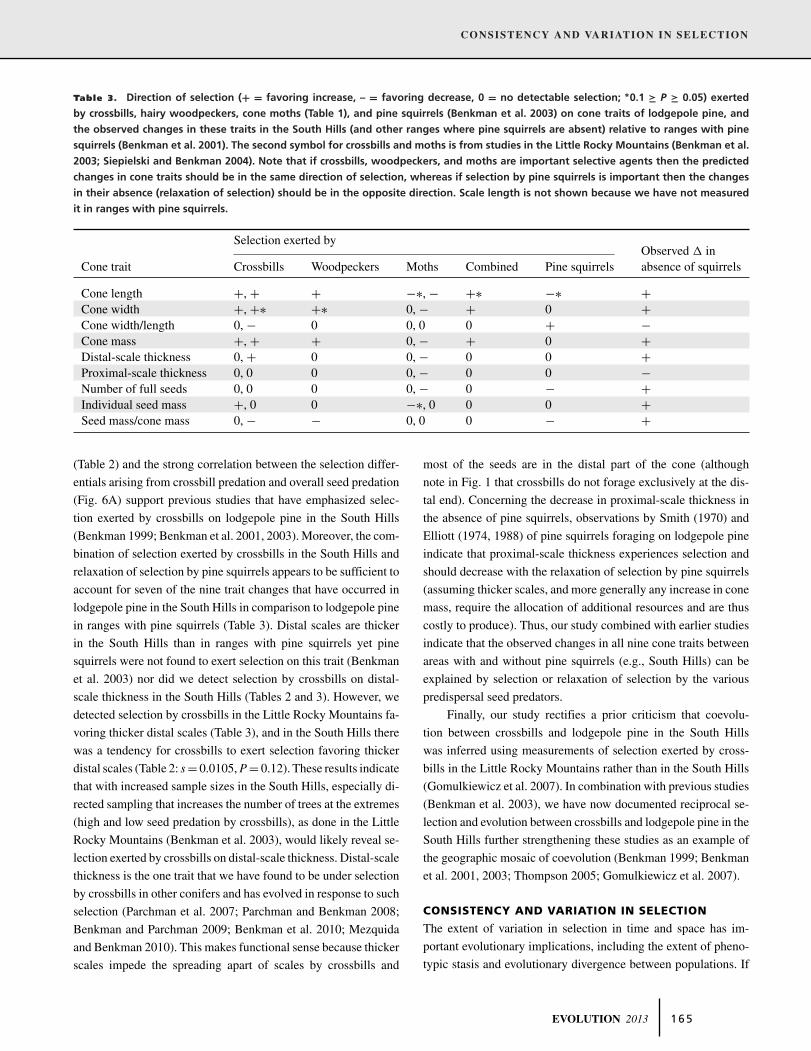
Figure 5. The densities of woodpeckers increase with increases
in the ratio of seed mass to cone mass among seven mountain
ranges with and without pine squirrels (woodpecker density =0.06 + 199.81 [seed mass/cone mass]2, r2 = 0.96, df = 5, P < 0.0001;
linear regression provides nearly as good of a fit: r2 = 0.93, df = 5,
P = 0.0004). The South Hills is the point in the upper right of the
figure, and when excluded the relationship remains significant but
is linear (r2 = 0.77, df = 4, P = 0.02). Pine squirrels were introduced
in the Cypress Hills in 1950 and are now more abundant than in
the areas originally having them (Benkman 1999).
0.0 0.01 0.02
0.0
0.01
0.02
0.0 0.01 0.02
0.0
0.01
0.02
0.0 0.01 0.02
0.0
0.01
0.02
Crossbill selection differentials
Ove
rall
sele
ctio
n di
ffere
ntia
lsO
vera
ll se
lect
ion
diffe
rent
ials
Ove
rall
sele
ctio
n di
ffere
ntia
ls
Moth selection differentials
Woodpecker selection differentials
A
C
B
r = 0.97, P < 0.001
r = 0.71, P = 0.02
r = -0.54, P = 0.44
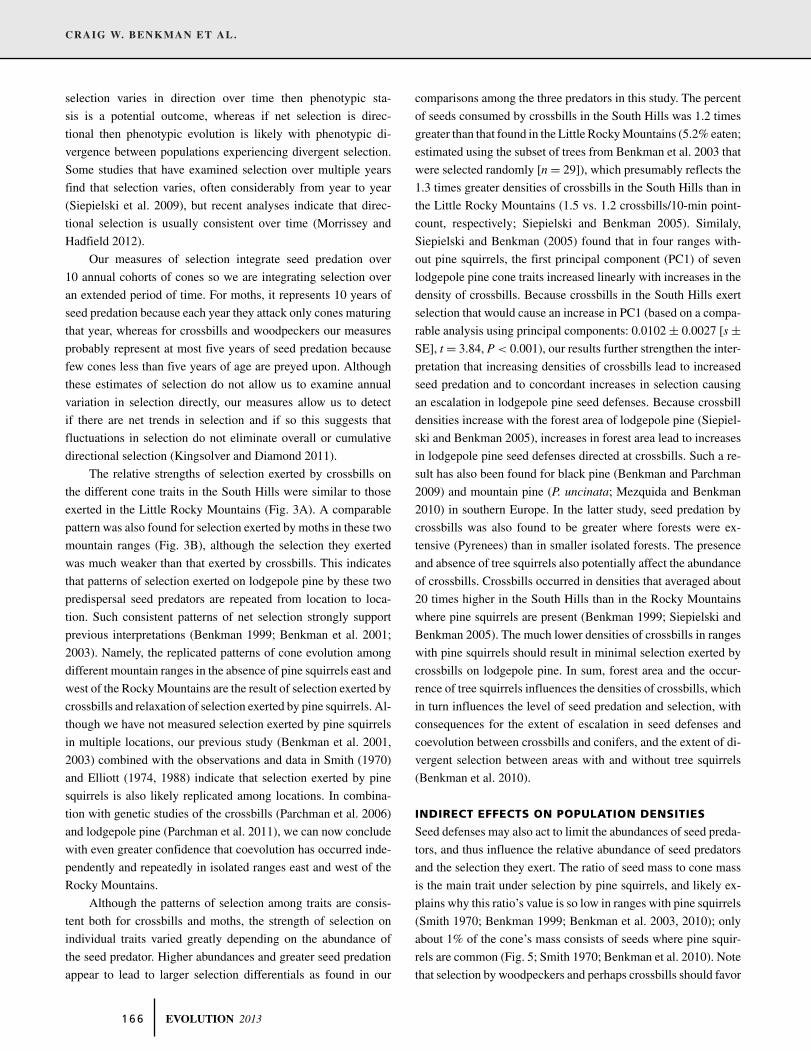
Figure 6. The relationships between the selection differentials
arising from the total seed predation by all three predispersal seed
predators and each of the three seed predators alone. The solid
lines are based on least square linear regressions. The selection
differentials exclude seed mass to cone mass ratio (see Table 1).
by different selective agents, and the relationship between the
amount of predation and the strength of selection. Below we
discuss these implications.
CROSSBILL-LODGEPOLE PINE COEVOLUTION
The substantially stronger selection, as measured by selection dif-
ferentials, exerted by crossbills than by woodpeckers and moths
1 6 4 EVOLUTION 2013
CONSISTENCY AND VARIATION IN SELECTION
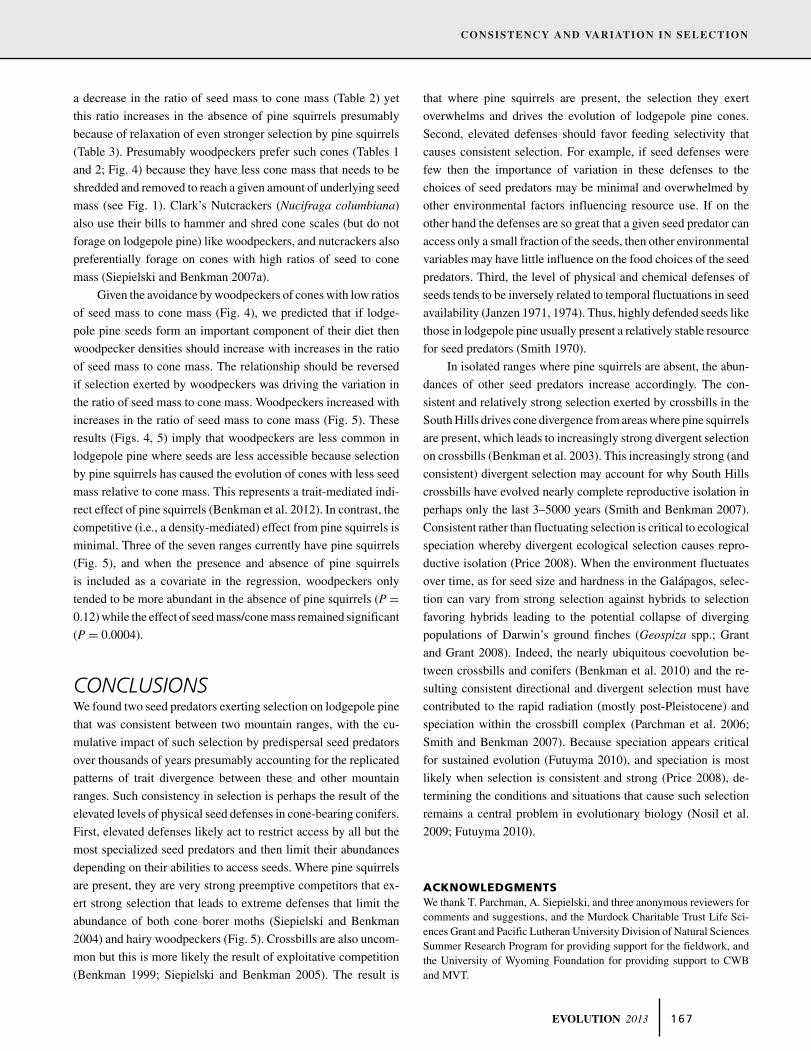
Table 3. Direction of selection (+ = favoring increase, – = favoring decrease, 0 = no detectable selection; ∗0.1 ≥ P ≥ 0.05) exerted
by crossbills, hairy woodpeckers, cone moths (Table 1), and pine squirrels (Benkman et al. 2003) on cone traits of lodgepole pine, and
the observed changes in these traits in the South Hills (and other ranges where pine squirrels are absent) relative to ranges with pine
squirrels (Benkman et al. 2001). The second symbol for crossbills and moths is from studies in the Little Rocky Mountains (Benkman et al.
2003; Siepielski and Benkman 2004). Note that if crossbills, woodpeckers, and moths are important selective agents then the predicted
changes in cone traits should be in the same direction of selection, whereas if selection by pine squirrels is important then the changes
in their absence (relaxation of selection) should be in the opposite direction. Scale length is not shown because we have not measured
it in ranges with pine squirrels.
Selection exerted byObserved � in
Cone trait Crossbills Woodpeckers Moths Combined Pine squirrels absence of squirrels
Cone length +, + + −∗, − +∗ −∗ +Cone width +, +∗ +∗ 0, − + 0 +Cone width/length 0, − 0 0, 0 0 + −Cone mass +, + + 0, − + 0 +Distal-scale thickness 0, + 0 0, − 0 0 +Proximal-scale thickness 0, 0 0 0, − 0 0 −Number of full seeds 0, 0 0 0, − 0 − +Individual seed mass +, 0 0 −∗, 0 0 0 +Seed mass/cone mass 0, − − 0, 0 0 − +
(Table 2) and the strong correlation between the selection differ-
entials arising from crossbill predation and overall seed predation
(Fig. 6A) support previous studies that have emphasized selec-
tion exerted by crossbills on lodgepole pine in the South Hills
(Benkman 1999; Benkman et al. 2001, 2003). Moreover, the com-
bination of selection exerted by crossbills in the South Hills and
relaxation of selection by pine squirrels appears to be sufficient to
account for seven of the nine trait changes that have occurred in
lodgepole pine in the South Hills in comparison to lodgepole pine
in ranges with pine squirrels (Table 3). Distal scales are thicker
in the South Hills than in ranges with pine squirrels yet pine
squirrels were not found to exert selection on this trait (Benkman
et al. 2003) nor did we detect selection by crossbills on distal-
scale thickness in the South Hills (Tables 2 and 3). However, we
detected selection by crossbills in the Little Rocky Mountains fa-
voring thicker distal scales (Table 3), and in the South Hills there
was a tendency for crossbills to exert selection favoring thicker
distal scales (Table 2: s = 0.0105, P = 0.12). These results indicate
that with increased sample sizes in the South Hills, especially di-
rected sampling that increases the number of trees at the extremes
(high and low seed predation by crossbills), as done in the Little
Rocky Mountains (Benkman et al. 2003), would likely reveal se-
lection exerted by crossbills on distal-scale thickness. Distal-scale
thickness is the one trait that we have found to be under selection
by crossbills in other conifers and has evolved in response to such
selection (Parchman et al. 2007; Parchman and Benkman 2008;
Benkman and Parchman 2009; Benkman et al. 2010; Mezquida
and Benkman 2010). This makes functional sense because thicker
scales impede the spreading apart of scales by crossbills and
most of the seeds are in the distal part of the cone (although
note in Fig. 1 that crossbills do not forage exclusively at the dis-
tal end). Concerning the decrease in proximal-scale thickness in
the absence of pine squirrels, observations by Smith (1970) and
Elliott (1974, 1988) of pine squirrels foraging on lodgepole pine
indicate that proximal-scale thickness experiences selection and
should decrease with the relaxation of selection by pine squirrels
(assuming thicker scales, and more generally any increase in cone
mass, require the allocation of additional resources and are thus
costly to produce). Thus, our study combined with earlier studies
indicate that the observed changes in all nine cone traits between
areas with and without pine squirrels (e.g., South Hills) can be
explained by selection or relaxation of selection by the various
predispersal seed predators.
Finally, our study rectifies a prior criticism that coevolu-
tion between crossbills and lodgepole pine in the South Hills
was inferred using measurements of selection exerted by cross-
bills in the Little Rocky Mountains rather than in the South Hills
(Gomulkiewicz et al. 2007). In combination with previous studies
(Benkman et al. 2003), we have now documented reciprocal se-
lection and evolution between crossbills and lodgepole pine in the
South Hills further strengthening these studies as an example of
the geographic mosaic of coevolution (Benkman 1999; Benkman
et al. 2001, 2003; Thompson 2005; Gomulkiewicz et al. 2007).
CONSISTENCY AND VARIATION IN SELECTION
The extent of variation in selection in time and space has im-
portant evolutionary implications, including the extent of pheno-
typic stasis and evolutionary divergence between populations. If
EVOLUTION 2013 1 6 5
CRAIG W. BENKMAN ET AL.
selection varies in direction over time then phenotypic sta-
sis is a potential outcome, whereas if net selection is direc-
tional then phenotypic evolution is likely with phenotypic di-
vergence between populations experiencing divergent selection.
Some studies that have examined selection over multiple years
find that selection varies, often considerably from year to year
(Siepielski et al. 2009), but recent analyses indicate that direc-
tional selection is usually consistent over time (Morrissey and
Hadfield 2012).
Our measures of selection integrate seed predation over
10 annual cohorts of cones so we are integrating selection over
an extended period of time. For moths, it represents 10 years of
seed predation because each year they attack only cones maturing
that year, whereas for crossbills and woodpeckers our measures
probably represent at most five years of seed predation because
few cones less than five years of age are preyed upon. Although
these estimates of selection do not allow us to examine annual
variation in selection directly, our measures allow us to detect
if there are net trends in selection and if so this suggests that
fluctuations in selection do not eliminate overall or cumulative
directional selection (Kingsolver and Diamond 2011).
The relative strengths of selection exerted by crossbills on
the different cone traits in the South Hills were similar to those
exerted in the Little Rocky Mountains (Fig. 3A). A comparable
pattern was also found for selection exerted by moths in these two
mountain ranges (Fig. 3B), although the selection they exerted
was much weaker than that exerted by crossbills. This indicates
that patterns of selection exerted on lodgepole pine by these two
predispersal seed predators are repeated from location to loca-
tion. Such consistent patterns of net selection strongly support
previous interpretations (Benkman 1999; Benkman et al. 2001;
2003). Namely, the replicated patterns of cone evolution among
different mountain ranges in the absence of pine squirrels east and
west of the Rocky Mountains are the result of selection exerted by
crossbills and relaxation of selection exerted by pine squirrels. Al-
though we have not measured selection exerted by pine squirrels
in multiple locations, our previous study (Benkman et al. 2001,
2003) combined with the observations and data in Smith (1970)
and Elliott (1974, 1988) indicate that selection exerted by pine
squirrels is also likely replicated among locations. In combina-
tion with genetic studies of the crossbills (Parchman et al. 2006)
and lodgepole pine (Parchman et al. 2011), we can now conclude
with even greater confidence that coevolution has occurred inde-
pendently and repeatedly in isolated ranges east and west of the
Rocky Mountains.
Although the patterns of selection among traits are consis-
tent both for crossbills and moths, the strength of selection on
individual traits varied greatly depending on the abundance of
the seed predator. Higher abundances and greater seed predation
appear to lead to larger selection differentials as found in our
comparisons among the three predators in this study. The percent
of seeds consumed by crossbills in the South Hills was 1.2 times
greater than that found in the Little Rocky Mountains (5.2% eaten;
estimated using the subset of trees from Benkman et al. 2003 that
were selected randomly [n = 29]), which presumably reflects the
1.3 times greater densities of crossbills in the South Hills than in
the Little Rocky Mountains (1.5 vs. 1.2 crossbills/10-min point-
count, respectively; Siepielski and Benkman 2005). Similaly,
Siepielski and Benkman (2005) found that in four ranges with-
out pine squirrels, the first principal component (PC1) of seven
lodgepole pine cone traits increased linearly with increases in the
density of crossbills. Because crossbills in the South Hills exert
selection that would cause an increase in PC1 (based on a compa-
rable analysis using principal components: 0.0102 ± 0.0027 [s ±SE], t = 3.84, P < 0.001), our results further strengthen the inter-
pretation that increasing densities of crossbills lead to increased
seed predation and to concordant increases in selection causing
an escalation in lodgepole pine seed defenses. Because crossbill
densities increase with the forest area of lodgepole pine (Siepiel-
ski and Benkman 2005), increases in forest area lead to increases
in lodgepole pine seed defenses directed at crossbills. Such a re-
sult has also been found for black pine (Benkman and Parchman
2009) and mountain pine (P. uncinata; Mezquida and Benkman
2010) in southern Europe. In the latter study, seed predation by
crossbills was also found to be greater where forests were ex-
tensive (Pyrenees) than in smaller isolated forests. The presence
and absence of tree squirrels also potentially affect the abundance
of crossbills. Crossbills occurred in densities that averaged about
20 times higher in the South Hills than in the Rocky Mountains
where pine squirrels are present (Benkman 1999; Siepielski and
Benkman 2005). The much lower densities of crossbills in ranges
with pine squirrels should result in minimal selection exerted by
crossbills on lodgepole pine. In sum, forest area and the occur-
rence of tree squirrels influences the densities of crossbills, which
in turn influences the level of seed predation and selection, with
consequences for the extent of escalation in seed defenses and
coevolution between crossbills and conifers, and the extent of di-
vergent selection between areas with and without tree squirrels
(Benkman et al. 2010).
INDIRECT EFFECTS ON POPULATION DENSITIES
Seed defenses may also act to limit the abundances of seed preda-
tors, and thus influence the relative abundance of seed predators
and the selection they exert. The ratio of seed mass to cone mass
is the main trait under selection by pine squirrels, and likely ex-
plains why this ratio’s value is so low in ranges with pine squirrels
(Smith 1970; Benkman 1999; Benkman et al. 2003, 2010); only
about 1% of the cone’s mass consists of seeds where pine squir-
rels are common (Fig. 5; Smith 1970; Benkman et al. 2010). Note
that selection by woodpeckers and perhaps crossbills should favor
1 6 6 EVOLUTION 2013
CONSISTENCY AND VARIATION IN SELECTION
a decrease in the ratio of seed mass to cone mass (Table 2) yet
this ratio increases in the absence of pine squirrels presumably
because of relaxation of even stronger selection by pine squirrels
(Table 3). Presumably woodpeckers prefer such cones (Tables 1
and 2; Fig. 4) because they have less cone mass that needs to be
shredded and removed to reach a given amount of underlying seed
mass (see Fig. 1). Clark’s Nutcrackers (Nucifraga columbiana)
also use their bills to hammer and shred cone scales (but do not
forage on lodgepole pine) like woodpeckers, and nutcrackers also
preferentially forage on cones with high ratios of seed to cone
mass (Siepielski and Benkman 2007a).
Given the avoidance by woodpeckers of cones with low ratios
of seed mass to cone mass (Fig. 4), we predicted that if lodge-
pole pine seeds form an important component of their diet then
woodpecker densities should increase with increases in the ratio
of seed mass to cone mass. The relationship should be reversed
if selection exerted by woodpeckers was driving the variation in
the ratio of seed mass to cone mass. Woodpeckers increased with
increases in the ratio of seed mass to cone mass (Fig. 5). These
results (Figs. 4, 5) imply that woodpeckers are less common in
lodgepole pine where seeds are less accessible because selection
by pine squirrels has caused the evolution of cones with less seed
mass relative to cone mass. This represents a trait-mediated indi-
rect effect of pine squirrels (Benkman et al. 2012). In contrast, the
competitive (i.e., a density-mediated) effect from pine squirrels is
minimal. Three of the seven ranges currently have pine squirrels
(Fig. 5), and when the presence and absence of pine squirrels
is included as a covariate in the regression, woodpeckers only
tended to be more abundant in the absence of pine squirrels (P =0.12) while the effect of seed mass/cone mass remained significant
(P = 0.0004).
CONCLUSIONSWe found two seed predators exerting selection on lodgepole pine
that was consistent between two mountain ranges, with the cu-
mulative impact of such selection by predispersal seed predators
over thousands of years presumably accounting for the replicated
patterns of trait divergence between these and other mountain
ranges. Such consistency in selection is perhaps the result of the
elevated levels of physical seed defenses in cone-bearing conifers.
First, elevated defenses likely act to restrict access by all but the
most specialized seed predators and then limit their abundances
depending on their abilities to access seeds. Where pine squirrels
are present, they are very strong preemptive competitors that ex-
ert strong selection that leads to extreme defenses that limit the
abundance of both cone borer moths (Siepielski and Benkman
2004) and hairy woodpeckers (Fig. 5). Crossbills are also uncom-
mon but this is more likely the result of exploitative competition
(Benkman 1999; Siepielski and Benkman 2005). The result is
that where pine squirrels are present, the selection they exert
overwhelms and drives the evolution of lodgepole pine cones.
Second, elevated defenses should favor feeding selectivity that
causes consistent selection. For example, if seed defenses were
few then the importance of variation in these defenses to the
choices of seed predators may be minimal and overwhelmed by
other environmental factors influencing resource use. If on the
other hand the defenses are so great that a given seed predator can
access only a small fraction of the seeds, then other environmental
variables may have little influence on the food choices of the seed
predators. Third, the level of physical and chemical defenses of
seeds tends to be inversely related to temporal fluctuations in seed
availability (Janzen 1971, 1974). Thus, highly defended seeds like
those in lodgepole pine usually present a relatively stable resource
for seed predators (Smith 1970).
In isolated ranges where pine squirrels are absent, the abun-
dances of other seed predators increase accordingly. The con-
sistent and relatively strong selection exerted by crossbills in the
South Hills drives cone divergence from areas where pine squirrels
are present, which leads to increasingly strong divergent selection
on crossbills (Benkman et al. 2003). This increasingly strong (and
consistent) divergent selection may account for why South Hills
crossbills have evolved nearly complete reproductive isolation in
perhaps only the last 3–5000 years (Smith and Benkman 2007).
Consistent rather than fluctuating selection is critical to ecological
speciation whereby divergent ecological selection causes repro-
ductive isolation (Price 2008). When the environment fluctuates
over time, as for seed size and hardness in the Galapagos, selec-
tion can vary from strong selection against hybrids to selection
favoring hybrids leading to the potential collapse of diverging
populations of Darwin’s ground finches (Geospiza spp.; Grant
and Grant 2008). Indeed, the nearly ubiquitous coevolution be-
tween crossbills and conifers (Benkman et al. 2010) and the re-
sulting consistent directional and divergent selection must have
contributed to the rapid radiation (mostly post-Pleistocene) and
speciation within the crossbill complex (Parchman et al. 2006;
Smith and Benkman 2007). Because speciation appears critical
for sustained evolution (Futuyma 2010), and speciation is most
likely when selection is consistent and strong (Price 2008), de-
termining the conditions and situations that cause such selection
remains a central problem in evolutionary biology (Nosil et al.
2009; Futuyma 2010).
ACKNOWLEDGMENTSWe thank T. Parchman, A. Siepielski, and three anonymous reviewers forcomments and suggestions, and the Murdock Charitable Trust Life Sci-ences Grant and Pacific Lutheran University Division of Natural SciencesSummer Research Program for providing support for the fieldwork, andthe University of Wyoming Foundation for providing support to CWBand MVT.
EVOLUTION 2013 1 6 7
CRAIG W. BENKMAN ET AL.
LITERATURE CITEDBell, G. 2010. Fluctuating selection: the perpetual renewal of adaptation in
variable environments. Phil. Trans. R. Soc. B 365:87–97.Benkman, C. W. 1999. The selection mosaic and diversifying coevolution
between crossbills and lodgepole pine. Am. Nat. 154:S75–S91.Benkman, C. W., and T. L. Parchman. 2009. Coevolution between crossbills
and black pine: the importance of competitors, forest area, and resourcestability. J. Evol. Biol. 22:942–953.
Benkman, C. W., and A. M. Siepielski. 2004. A keystone selective agent?Pine squirrels and the frequency of serotiny in lodgepole pine. Ecology85:2082–2087.
Benkman, C. W., W. C. Holimon, and J. W. Smith. 2001. The influence of acompetitor on the geographic mosaic of coevolution between crossbillsand lodgepole pine. Evolution 55:282–294.
Benkman, C. W., T. L. Parchman, A. Favis, and A. M. Siepielski. 2003. Re-ciprocal selection causes a coevolutionary arms race between crossbillsand lodgepole pine. Am. Nat. 162:182–194.
Benkman C. W., T. L. Parchman, and E. T. Mezquida. 2010. Patterns ofcoevolution in the adaptive radiation of crossbills. Ann. N.Y. Acad. Sci.1206:1–16.
Benkman, C. W., A. M. Siepielski, and J. W. Smith. 2012. Consequences oftrait evolution in a multi-species system. Pp. 278–292 in T. Ohgushi,O. Schmitz, and R. Holt, eds. Interaction richness and complexity: eco-logical and evolutionary aspects of trait-mediated indirect interactions.Cambridge Univ. Press, New York, NY.
Bolnick, D. I., and O. L. Lau. 2008. Predictable patterns of disruptive selectionin stickleback in postglacial lakes. Am. Nat. 172:1–11.
Davison, A. C., and D. V. Hinkley. 1997. Bootstrap methods and their appli-cation. Cambridge Univ. Press, Cambridge, U.K.
Elliott, P. F. 1974. Evolutionary responses of plants to seed-eaters: pine squirrelpredation on lodgepole pine. Evolution 28:221–231.
———. 1988. Foraging behavior of a central-place forager: field tests oftheoretical predictions. Am. Nat. 131:159–174.
Futuyma, D. J. 2010. Evolutionary constraint and ecological consequences.Evolution 64:1865–1884.
Gomulkiewicz, R., D. M. Drown, M. F. Dybdahl, W. Godsoe, S. L. Nuismer,K. M. Pepin, B. J. Ridenhour, C. I. Smith, and J. B. Yoder. 2007. Dos anddon’ts of testing the geographic mosaic theory of coevolution. Heredity98:249–258.
Grant, P. R., and B. R. Grant. 2008. How and why species multiply: theradiation of Darwin’s finches. Princeton Univ. Press, Princeton, NJ.
Greene, D. F., and E. A. Johnson. 1994. Estimating the mean annual seedproduction of trees. Ecology 75:642–647.
Hulme, P., and C. W. Benkman. 2002. Granivory. Pp. 132–154 in
C. Herrera and O. Pellmyr, eds. Plant-animal interactions: an evolu-tionary approach. Blackwell Scientific Publications, New York.
Janzen, D. H. 1971. Seed predation by animals. Ann. Rev. Ecol. Syst. 2:465–492.
———. 1974. Tropical blackwater rivers, animals, and mast fruiting by theDipterocarpaceae. Biotropica 6:69–103
Kingsolver, J. G., and S. E. Diamond. 2011. Phenotypic selection in naturalpopulations: what limits directional selection? Am. Nat. 177:346–357.
Kolb, A., J. Ehrlen, and O. Eriksson. 2007. Ecological and evolutionary conse-quences of spatial and temporal variation in pre-dispersal seed predation.Perspect. Plant Ecol. Evol. Syst. 9:79–100.
Lande, R., and S. J. Arnold. 1983. The measurement of selection on correlatedcharacters. Evolution 37:1210–1226.
Leslie, A. B. 2011. Predation and protection in the macroevolutionary historyof conifer cones. Proc. R. Soc. B 278:3003–3008.
Lord, J. M., and M. Westoby. 2012. Accessory costs of seed production andthe evolution of angiosperms. Evolution 66:200–210.
Losos, J. B. 2009. Lizards in an evolutionary tree: ecology and adaptiveradiation of anoles. Univ. Calif. Press, Berkeley, CA.
MacColl, A. D. C. 2011. The ecological causes of evolution. Trends Ecol.Evol. 26:519–527.
Mezquida, E. T., and C. W. Benkman. 2010. Habitat area and structure affectthe impact of seed predators and the potential for coevolutionary armsraces. Ecology 91:802–814.
Miller, G. E. 1986. Insects and conifer seed production in the Inland MountainWest: a review. Pp. 225–237 in R. C. Shearer (compiler). Proceedings ofthe conifer tree seed in the Inland Mountain West symposium. GeneralTechnical Report INT 203, U.S. Dept. of Agriculture, Forest Service,Ogden, UT.
Morrissey, M. B., and J. D. Hadfield. 2012. Directional selection in temporallyreplicated studies is remarkably consistent. Evolution 66:435–442.
Nosil, P., L. J. Harmon, and O. Seehausen. 2009. Ecological explanations for(incomplete) speciation. Trends Ecol. Evol. 24:145–156.
Ohgushi, T., O. Schmitz, and R. Holt. 2012. Interaction richness and com-plexity: ecological and evolutionary aspects of trait-mediated indirectinteractions. Cambridge Univ. Press, New York, NY.
Parchman, T. L., and C. W. Benkman. 2008. The geographic selection mosaicfor ponderosa pine and crossbills: a tale of two squirrels. Evolution.62:348–360.
Parchman, T. L., C. W. Benkman, and S. C. Britch. 2006. Patterns of geneticvariation in the adaptive radiation of New World crossbills (Aves: Loxia).Mol. Ecol. 15:1873–1887.
Parchman, T. L., C. W. Benkman, and E. T. Mezquida. 2007. Coevolution be-tween Hispaniolan crossbills and pine: does more time allow for greaterphenotypic escalation at lower latitude? Evolution 61:2142–2153.
Parchman, T. L., C. W. Benkman, B. Jenkins, and C. A. Buerkle. 2011.Low levels of population genetic structure in lodgepole pine across ageographic mosaic of coevolution. Am. J. Bot. 98:669–679.
Pfennig, K. S., and D. W. Pfennig. 2009. Character displacement: ecologicaland reproductive responses to a common evolutionary problem. Quart.Rev. Biol. 84:253–276.
Price, T. 2008. Speciation in birds. Roberts and Company, Greenwood Village,CO.
Rausher, M. D. 1992. The measurement of selection on quantitative traits:biases due to environmental covariance between traits and fitness. Evo-lution 46:616–626.
Schluter, D. 2000. The ecology of adaptive radiation. Oxford Univ. Press,Oxford, U.K.
Siepielski, A. M. 2006. A possible role for pine squirrels in structuring breed-ing bird communities in lodgepole pine forests. Condor 108:232–238.
Siepielski, A. M., and C. W. Benkman. 2004. Interactions among moths,crossbills, squirrels and lodgepole pine in a geographic selection mosaic.Evolution 58:95–101.
———. 2005. A role for habitat area in the geographic mosaic of coevolu-tion between red crossbills and lodgepole pine. J. Evol. Biol. 18:1042–1049.
———. 2007a. Convergent patterns in the selection mosaic for two NorthAmerican bird-dispersed pines. Ecol. Monogr. 77:203–220.
———. 2007b. Selection by a pre-dispersal seed predator constrains theevolution of avian seed dispersal in pines. Funct. Ecol. 21:611–618.
———. 2007c. Extreme environmental variation sharpens selection thatdrives the evolution of a mutualism. Proc. R. Soc. Lond. B 274:1799–1805.
Siepielski, A. M., J. D. Dibattista, and S. M. Carlson. 2009. It’s about time:the temporal dynamics of phenotypic selection in the wild. Ecol. Letters12:1261–1276
Smith, C. C. 1968. The adaptive nature of social organization in the genus oftree squirrels Tamiasciurus. Ecol. Monogr. 38:31–63.
1 6 8 EVOLUTION 2013
CONSISTENCY AND VARIATION IN SELECTION
———. 1970. The coevolution of pine squirrels (Tamiasciurus) and conifers.Ecol. Monogr. 40:349–371.
Smith, J. W., and C. W. Benkman. 2007. A coevolutionary arms race causesecological speciation in crossbills. Am. Nat. 169:455–465.
Stinchcombe, J. R., A. F. Agrawal, P. A. Hohenlohe, S. J. Arnold, and M. W.Blows. 2008. Estimating nonlinear selection gradients using quadraticregression coefficients: double or nothing? Evolution 62:2435–2440.
Thompson, J. N. 2005. The geographic mosaic of coevolution. Univ. ChicagoPress, Chicago, IL.
Uyeda, J. C., T. F. Hansen, S. J. Arnold, and J. Pienaar. 2011. The million-year wait for macroevolutionary bursts. Proc. Natl. Acad. Sci. USA108:15908–15913.
Wade, M. J., and S. Kalisz. 1990. The causes of natural selection. Evolution44:1947–1955.
Werner, E. E., and S. D. Peacor. 2003. A review of trait-mediated indirectinteractions in ecological communities. Ecology 84:1083–1100.
Associate Editor: A. Charmantier
EVOLUTION 2013 1 6 9