Embed Size (px)
Citation preview

Variable selection –a (p)review
Georg Heinze and Daniela Dunkler for TG2

Why a (p)review
• A review: what is the current practice of variable selection in medicalresearch?
• A preview: what should change?
Heinze & Dunkler for TG2, 08‐2016: 2
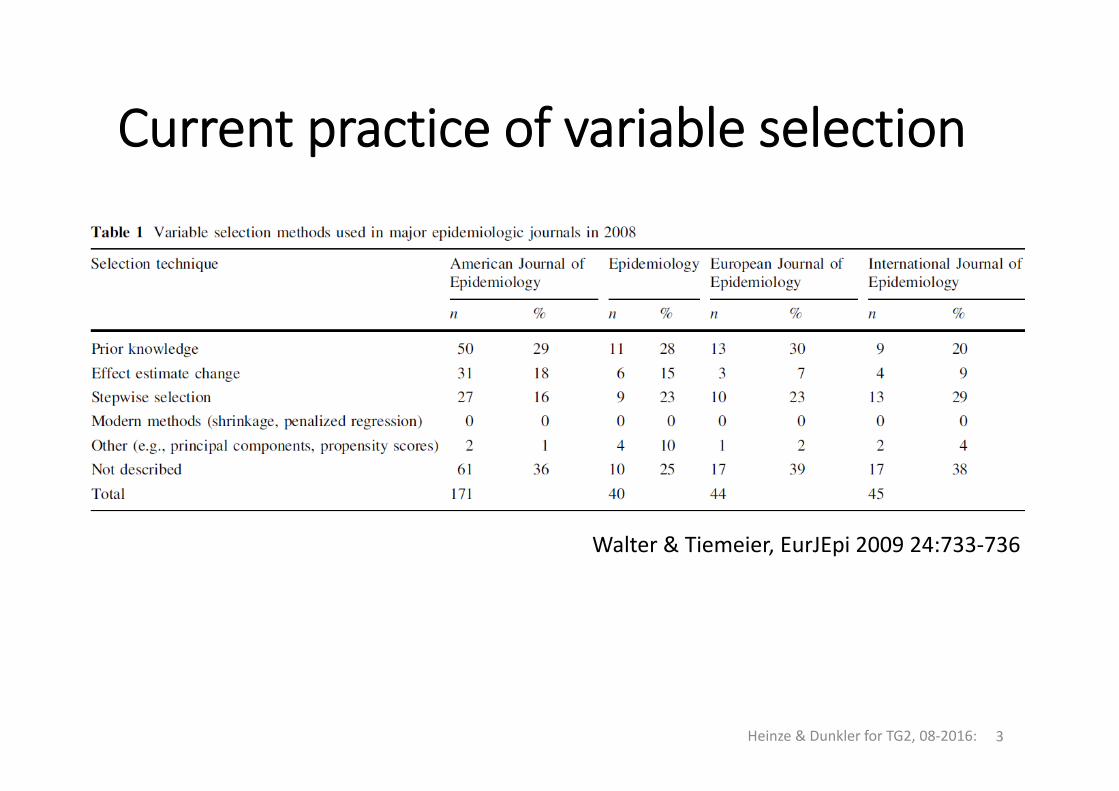
Current practice of variable selection
Heinze & Dunkler for TG2, 08‐2016: 3
Walter & Tiemeier, EurJEpi 2009 24:733‐736
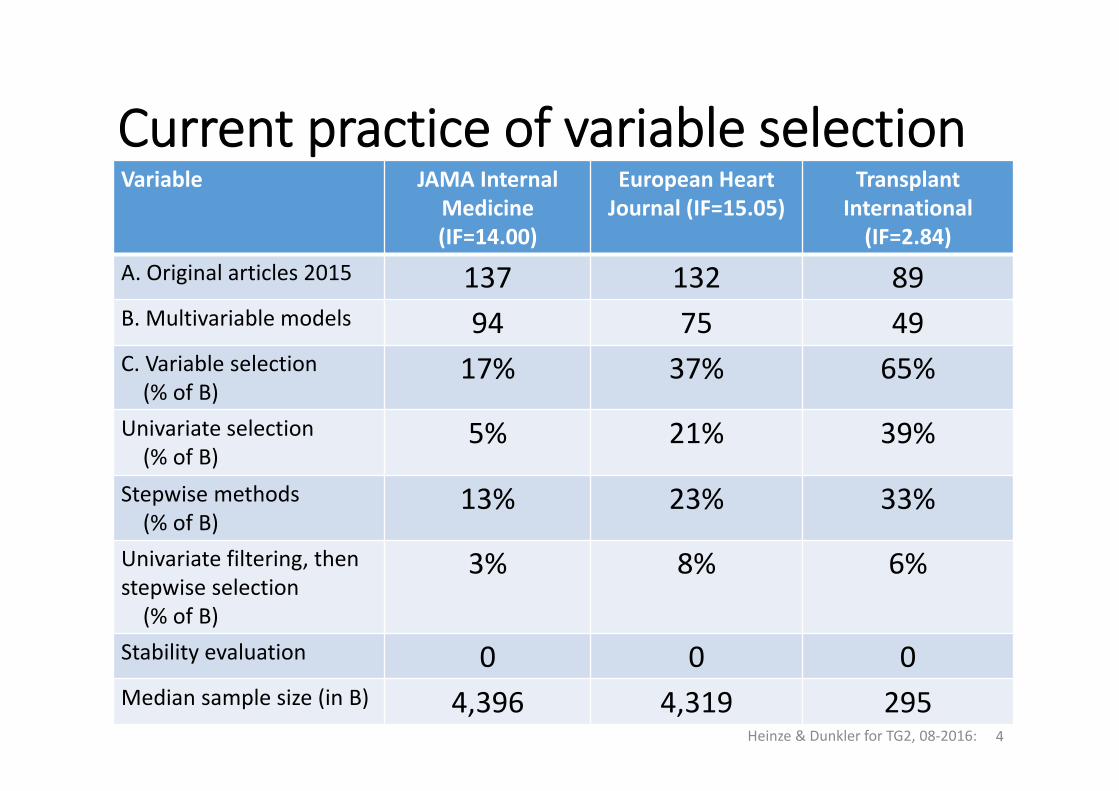
Current practice of variable selectionVariable JAMA Internal
Medicine(IF=14.00)
European Heart Journal (IF=15.05)
TransplantInternational (IF=2.84)
A. Original articles 2015 137 132 89B. Multivariable models 94 75 49C. Variable selection(% of B)
17% 37% 65%
Univariate selection(% of B)
5% 21% 39%
Stepwise methods(% of B)
13% 23% 33%
Univariate filtering, thenstepwise selection(% of B)
3% 8% 6%
Stability evaluation 0 0 0Median sample size (in B) 4,396 4,319 295
Heinze & Dunkler for TG2, 08‐2016: 4
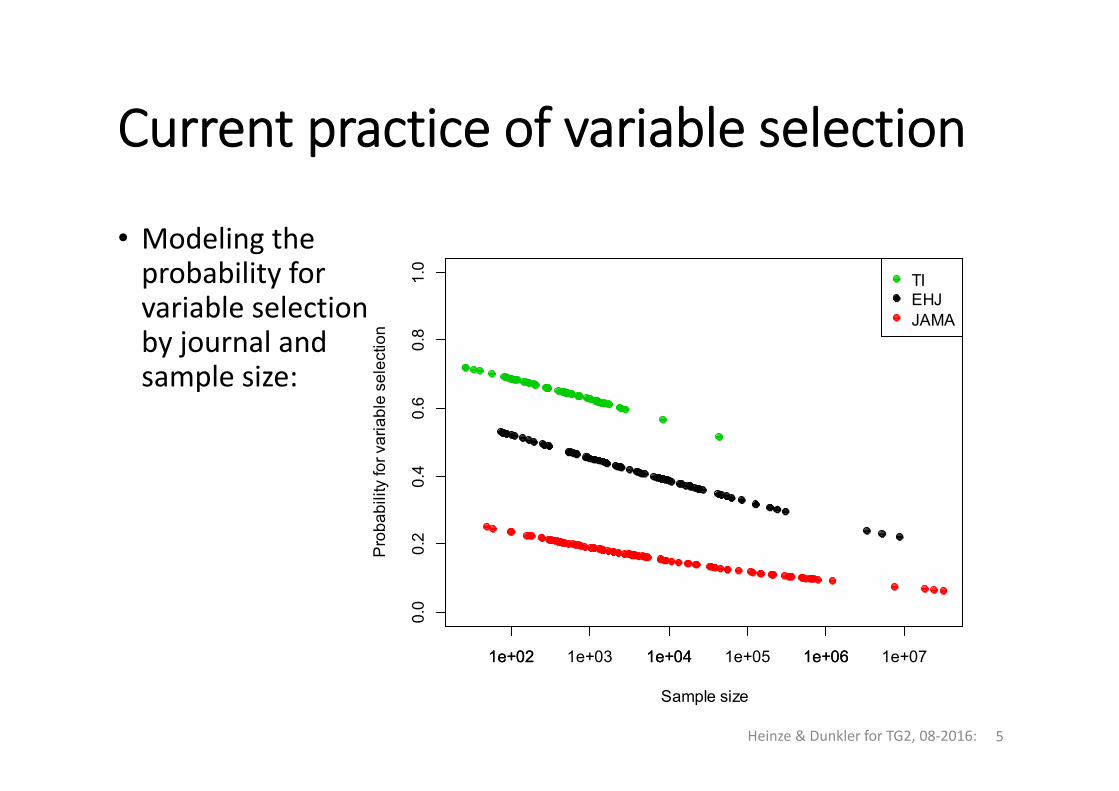
Current practice of variable selection
• Modeling theprobability forvariable selectionby journal andsample size:
Heinze & Dunkler for TG2, 08‐2016: 5
1e+02 1e+04 1e+06
0.0
0.2
0.4
0.6
0.8
1.0
Sample size
Pro
babi
lity
for v
aria
ble
sele
ctio
n
TIEHJJAMA
1e+02 1e+03 1e+04 1e+05 1e+06 1e+07
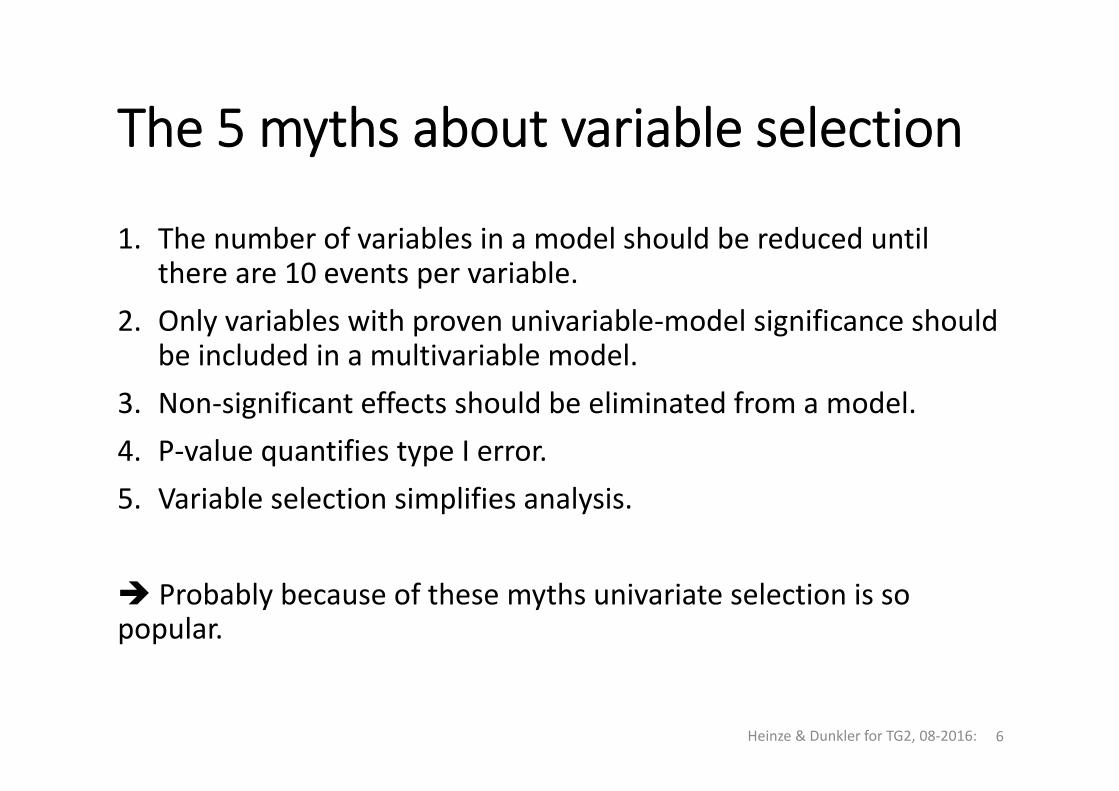
The 5 myths about variable selection
1. The number of variables in a model should be reduced untilthere are 10 events per variable.
2. Only variables with proven univariable‐model significance shouldbe included in a multivariable model.
3. Non‐significant effects should be eliminated from a model.4. P‐value quantifies type I error.5. Variable selection simplifies analysis.
Probably because of these myths univariate selection is so popular.
Heinze & Dunkler for TG2, 08‐2016: 6
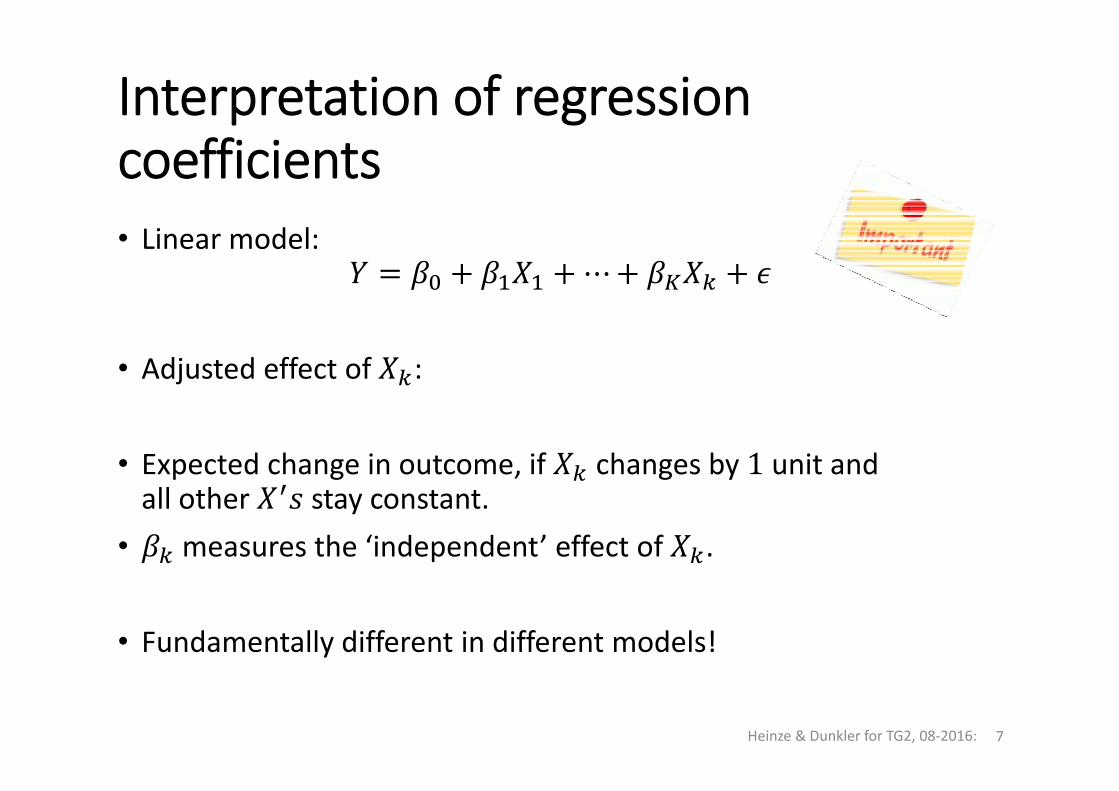
Interpretation of regressioncoefficients• Linear model:
⋯
• Adjusted effect of :
• Expected change in outcome, if changes by 1 unit and all other stay constant.
• measures the ‘independent’ effect of .
• Fundamentally different in different models!
Heinze & Dunkler for TG2, 08‐2016: 7
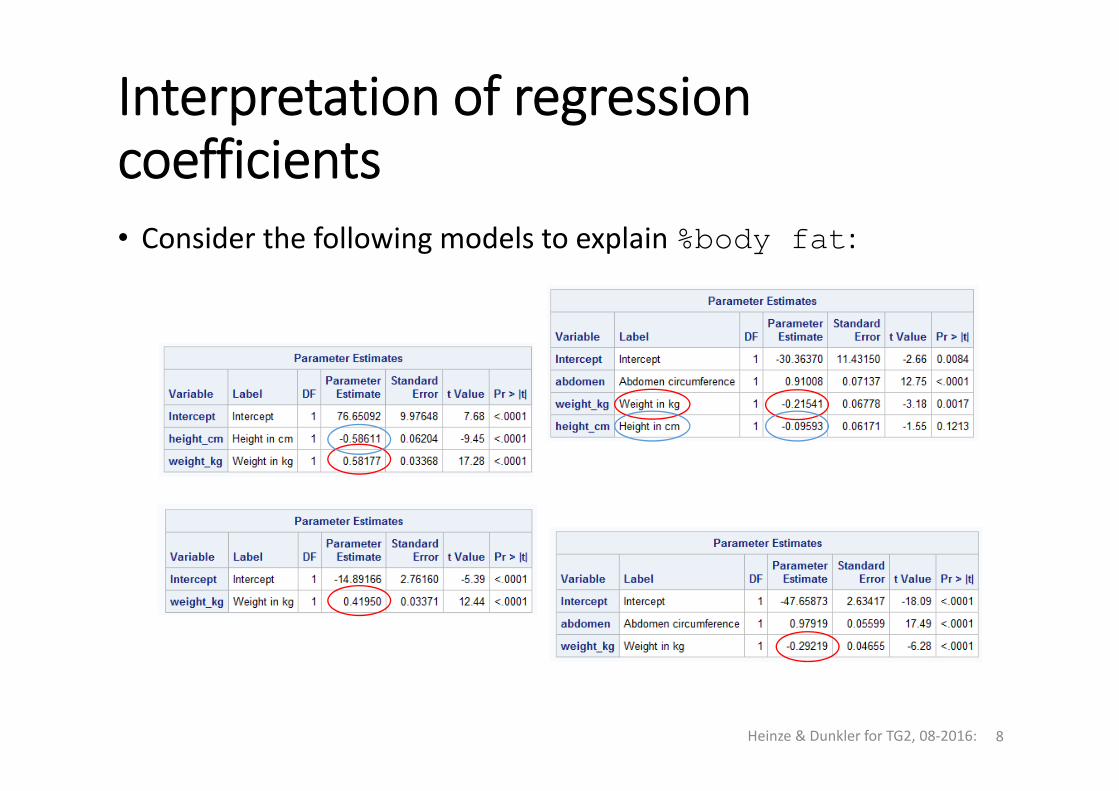
Interpretation of regressioncoefficients• Consider the following models to explain %body fat:
Heinze & Dunkler for TG2, 08‐2016: 8
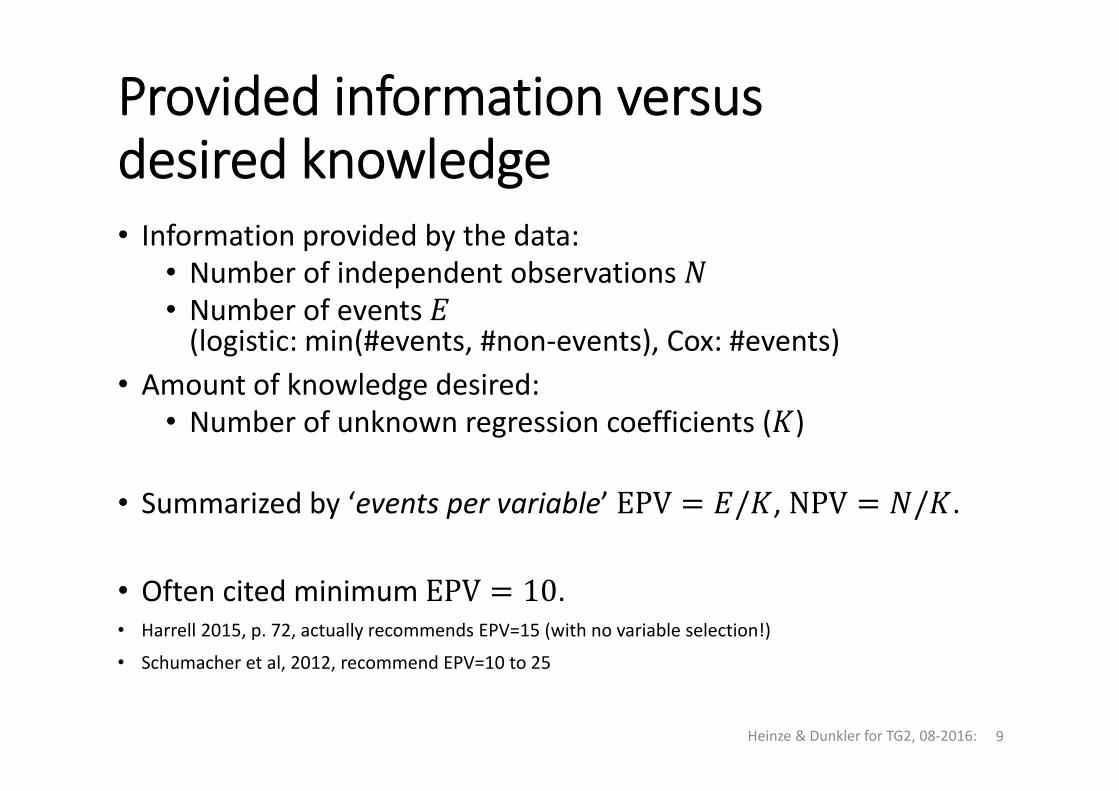
Provided information versus desired knowledge• Information provided by the data:
• Number of independent observations • Number of events (logistic: min(#events, #non‐events), Cox: #events)
• Amount of knowledge desired:• Number of unknown regression coefficients ( )
• Summarized by ‘events per variable’ EPV / , NPV / .
• Often cited minimum EPV 10. • Harrell 2015, p. 72, actually recommends EPV=15 (with no variable selection!)
• Schumacher et al, 2012, recommend EPV=10 to 25
Heinze & Dunkler for TG2, 08‐2016: 9
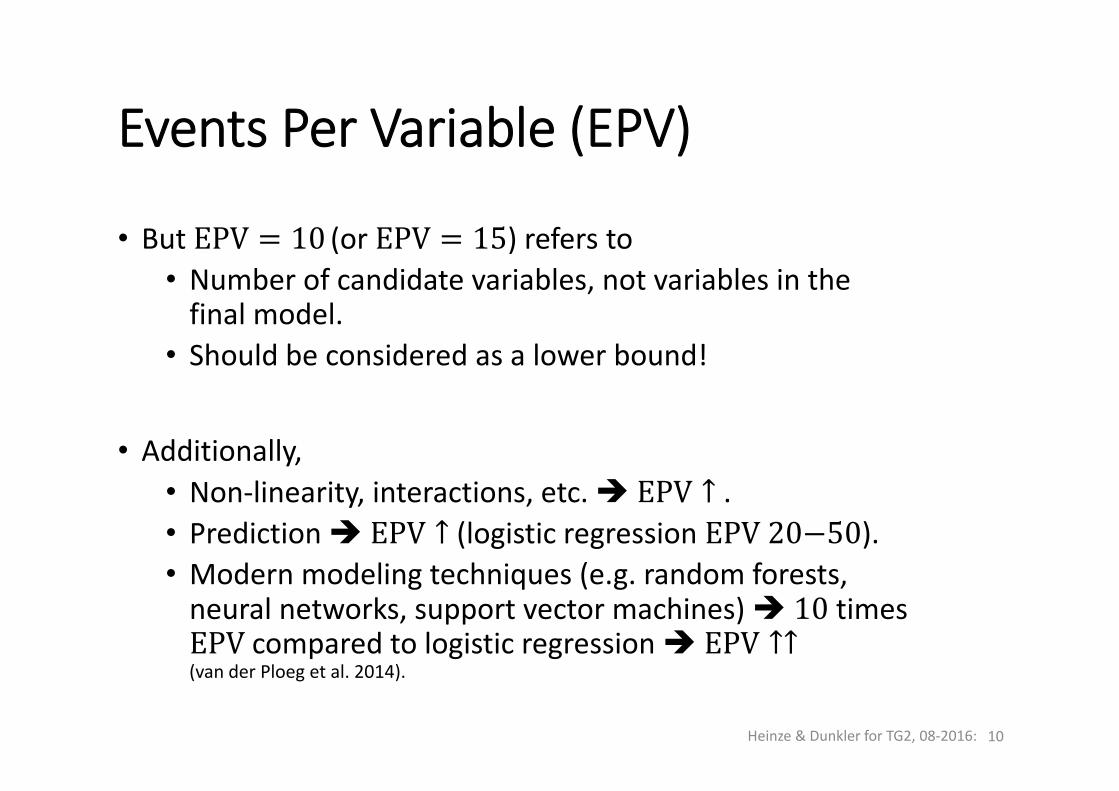
Events Per Variable (EPV)
• But EPV 10 (or EPV 15) refers to• Number of candidate variables, not variables in thefinal model.
• Should be considered as a lower bound!
• Additionally,• Non‐linearity, interactions, etc. EPV ↑ .• Prediction EPV ↑ (logistic regression EPV 20 50).• Modern modeling techniques (e.g. random forests, neural networks, support vector machines) 10 times EPVcompared to logistic regression EPV ↑↑(van der Ploeg et al. 2014).
Heinze & Dunkler for TG2, 08‐2016: 10
Basic variable selection algorithms
• ‘Full’ model
• Univariable filtering
• Best subset selection• Forward selection• Backward elimination
• Information‐theoretic approach• Directed acyclic graph (DAG)‐based selection
Heinze & Dunkler for TG2, 08‐2016: 11
The ‘full’ model
• Means: do not perform any data‐driven variable selection.
• Variables should be pre‐selected by ‘expertise’.
• Select, for each variable, a desired level of non‐linearity (including spline transformations).
• Select some biologically plausible interactions.
Heinze & Dunkler for TG2, 08‐2016: 12
Univariable filtering
• Still a popular variable selection method in medical literature!
• Select a significance level (e.g., =0.20 or =0.157)• Perform univariable models.• Use all variables in multivariable model withunivariable ‐value < .
• Sometimes accompanied by subsequent backward elimination.
Heinze & Dunkler for TG2, 08‐2016: 13
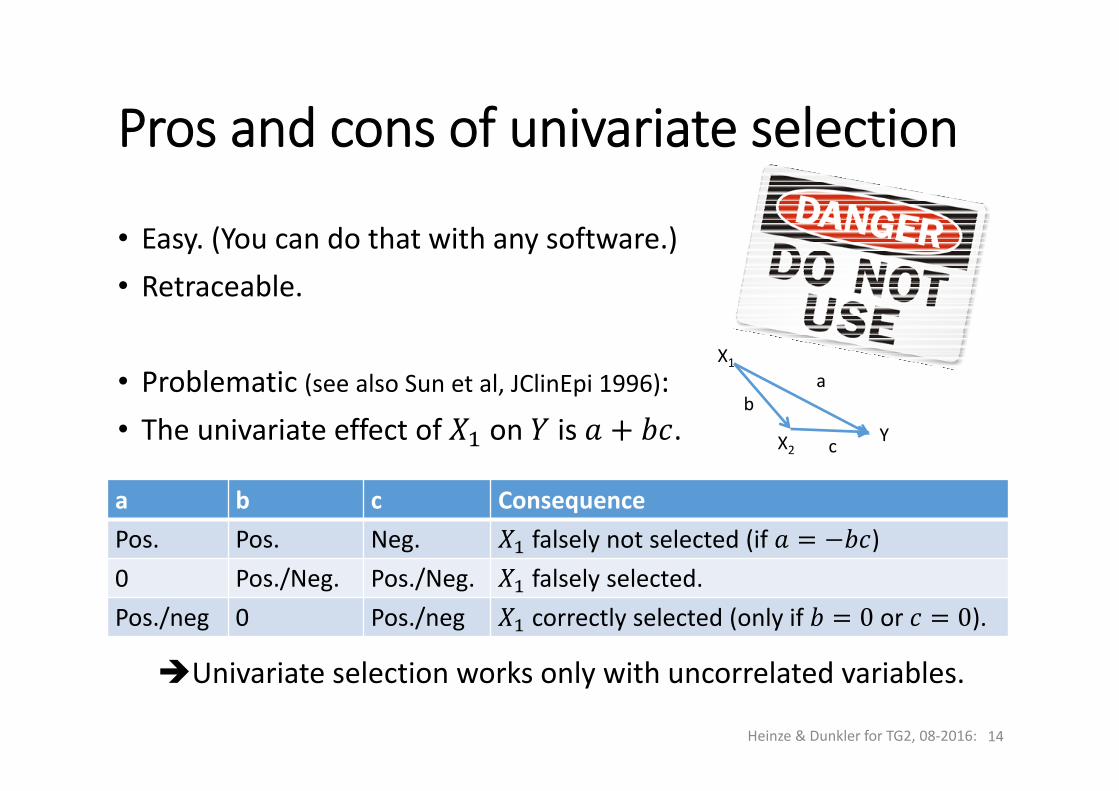
Pros and cons of univariate selection
• Easy. (You can do that with any software.)• Retraceable.
• Problematic (see also Sun et al, JClinEpi 1996):• The univariate effect of on is .
Heinze & Dunkler for TG2, 08‐2016: 14
a b c ConsequencePos. Pos. Neg. falsely not selected (if )0 Pos./Neg. Pos./Neg. falsely selected.Pos./neg 0 Pos./neg correctly selected (only if 0 or 0).
Univariate selection works only with uncorrelated variables.
b
c
aX1
X2Y
Best subset selection
• Perform all 2 regressions.• Select the model that has the lowest AIC.
Modification (information‐theoretic approach):• Pre‐specify a small number (4 20) of plausible models.• Select those that have AIC < AICmin+2.• Perform multi‐model inference on the selected models.
In practice:• Approximated by stepwise approaches!
Heinze & Dunkler for TG2, 08‐2016: 15
(Burnham & Anderson, 2002)
Backward elimination
• Select a significance level .• Estimate full model.• Repeat:
• While least significant term has , remove it and re‐estimate.
Variant: Stepwise backward• Select and .• Repeat:
• While least significant term has , remove it and re‐estimate.
• If most significant excluded term has , add it and re‐estimate.
Heinze & Dunkler for TG2, 08‐2016: 16
Software: R mfp:mfp()
Forward selection
• Select a significance level .• ‘Estimate’ a null model.• Repeat:
• While the most significant excluded term has , add it and re‐estimate.
Variant: Stepwise forward• Select and .• Repeat:
• While the most significant excluded term has , add it and re‐estimate.
• If least significant included term has , remove it and re‐estimate.
Heinze & Dunkler for TG2, 08‐2016: 17
Software: SAS/PROCGLMSELECTR step()
Consequences of variable selection
• Variable selection typically leads to:• Conditional bias away from 0‐ unconditional bias towards 0
• Biased conditional inference( ‐values too low – CI too narrow)
• These problems vanish asymptotically(but not yet with 10)
• Univariate selection: usually the worst of the algorithmicapproaches, and not consistent.
• A tool is needed to check for selection stability.
Heinze & Dunkler for TG2, 08‐2016: 18
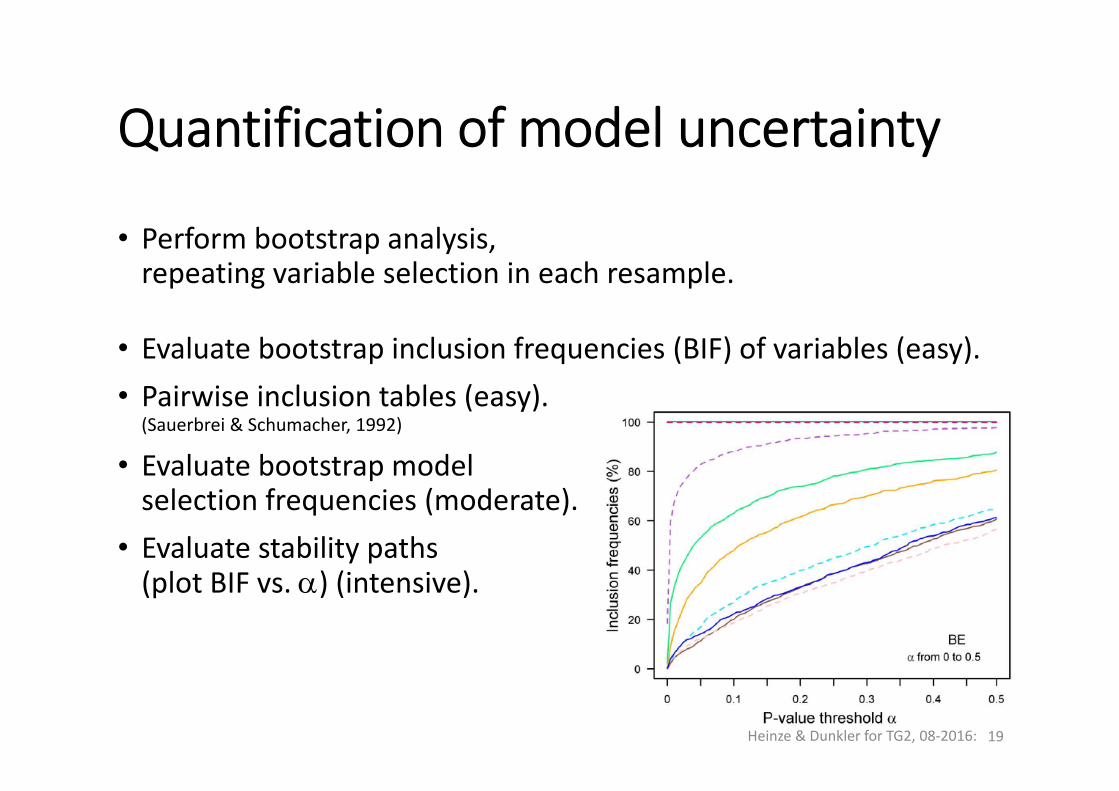
Quantification of model uncertainty
• Perform bootstrap analysis, repeating variable selection in each resample.
• Evaluate bootstrap inclusion frequencies (BIF) of variables (easy).• Pairwise inclusion tables (easy).
(Sauerbrei & Schumacher, 1992)
• Evaluate bootstrap modelselection frequencies (moderate).
• Evaluate stability paths(plot BIF vs. ) (intensive).
Heinze & Dunkler for TG2, 08‐2016: 19
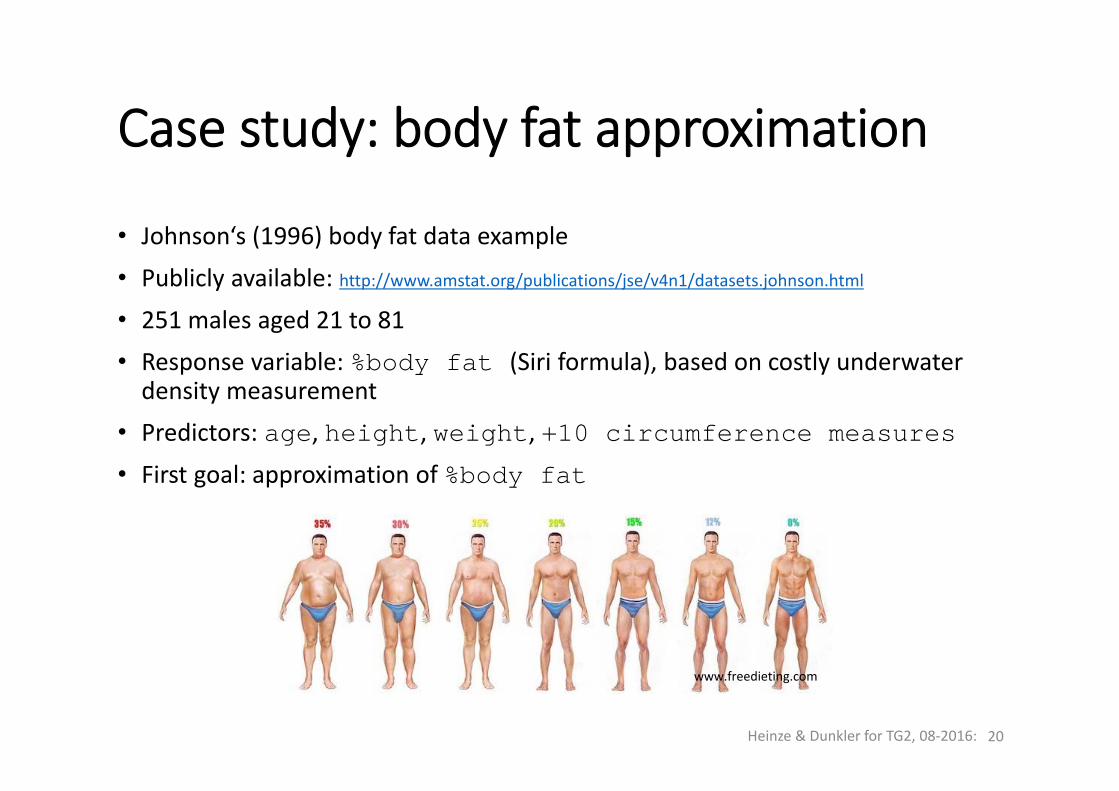
Case study: body fat approximation
• Johnson‘s (1996) body fat data example
• Publicly available: http://www.amstat.org/publications/jse/v4n1/datasets.johnson.html
• 251 males aged 21 to 81
• Response variable: %body fat (Siri formula), based on costly underwaterdensity measurement
• Predictors: age, height, weight, +10 circumference measures
• First goal: approximation of %body fat
Heinze & Dunkler for TG2, 08‐2016: 20
www.freedieting.com
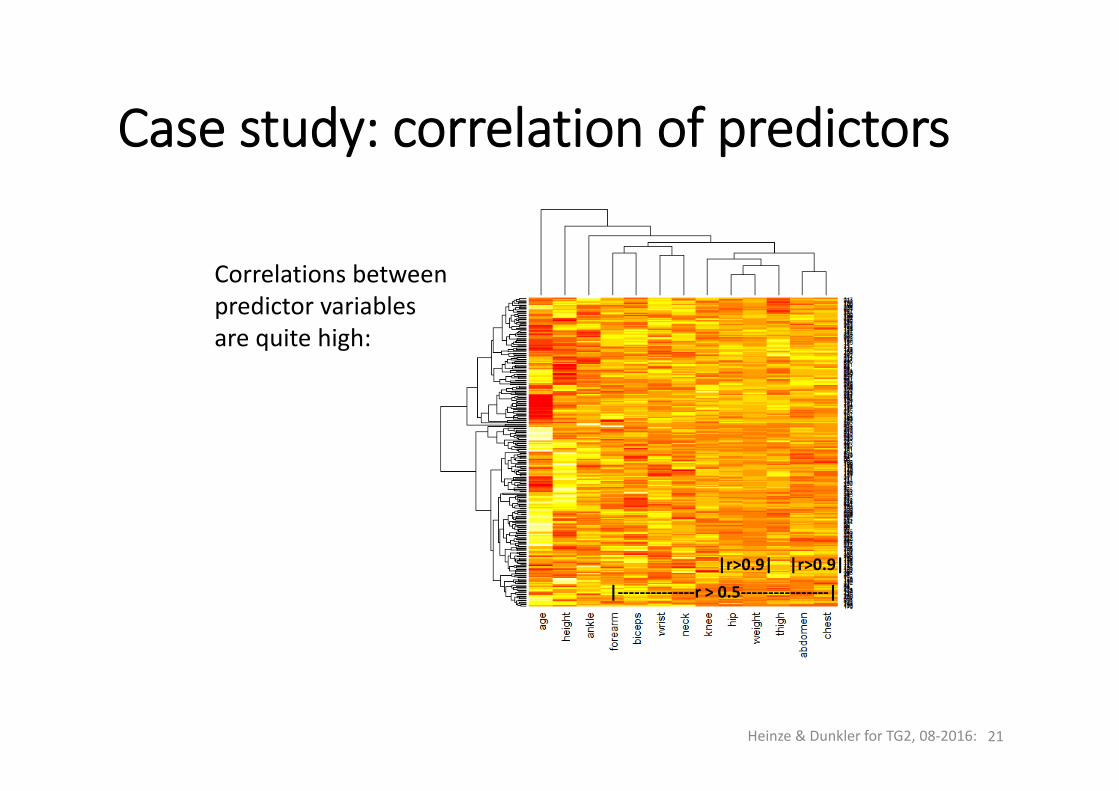
Case study: correlation of predictors
Heinze & Dunkler for TG2, 08‐2016: 21
Correlations betweenpredictor variablesare quite high:
|‐‐‐‐‐‐‐‐‐‐‐‐‐‐r > 0.5‐‐‐‐‐‐‐‐‐‐‐‐‐‐‐‐| |r>0.9| |r>0.9|
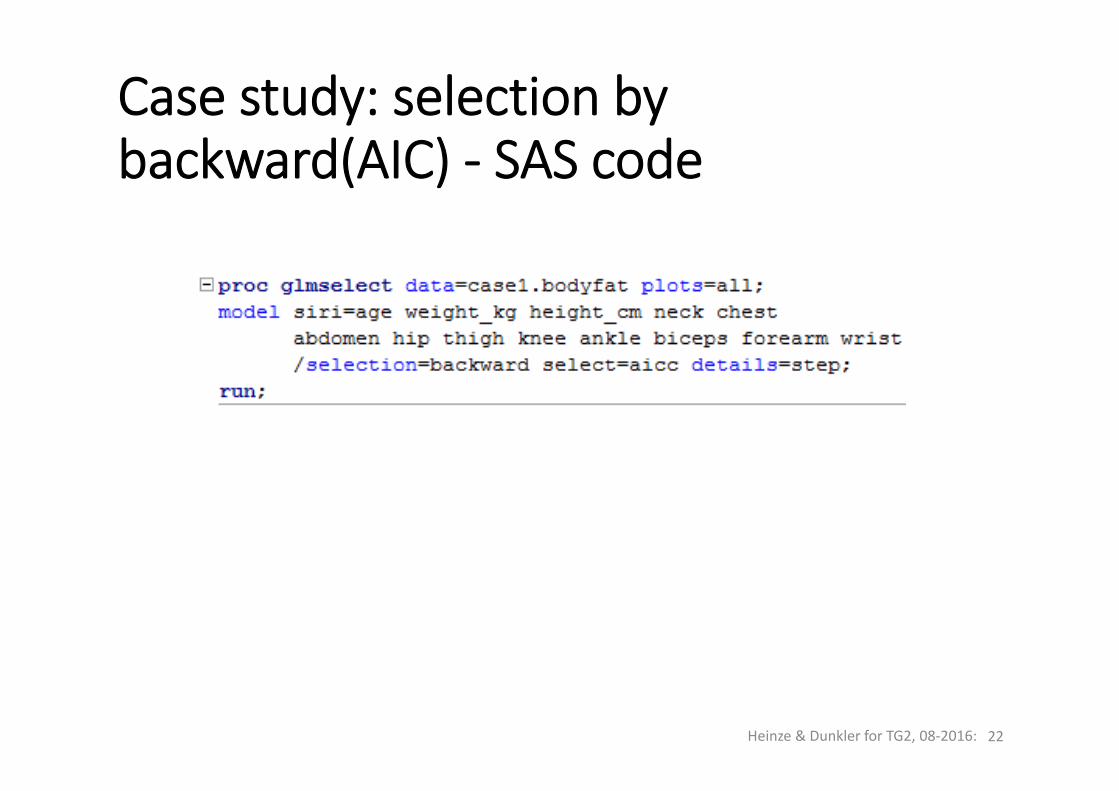
Case study: selection bybackward(AIC) ‐ SAS code
Heinze & Dunkler for TG2, 08‐2016: 22
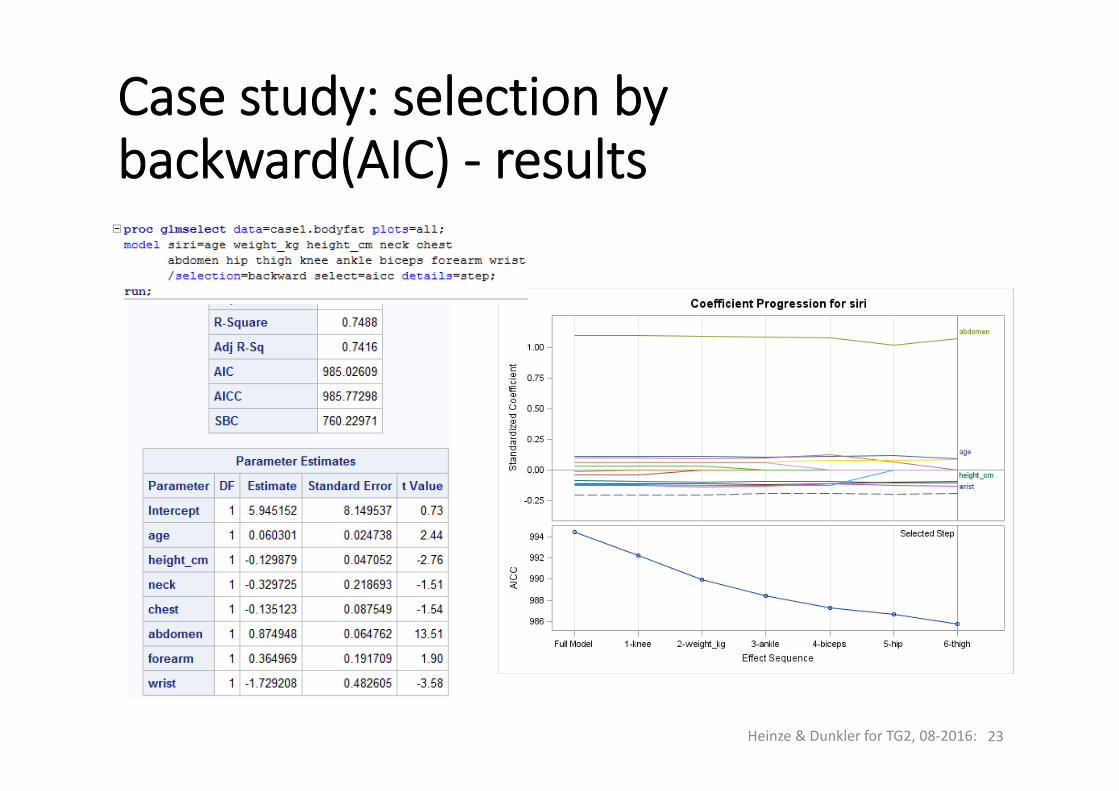
Case study: selection bybackward(AIC) ‐ results
Heinze & Dunkler for TG2, 08‐2016: 23
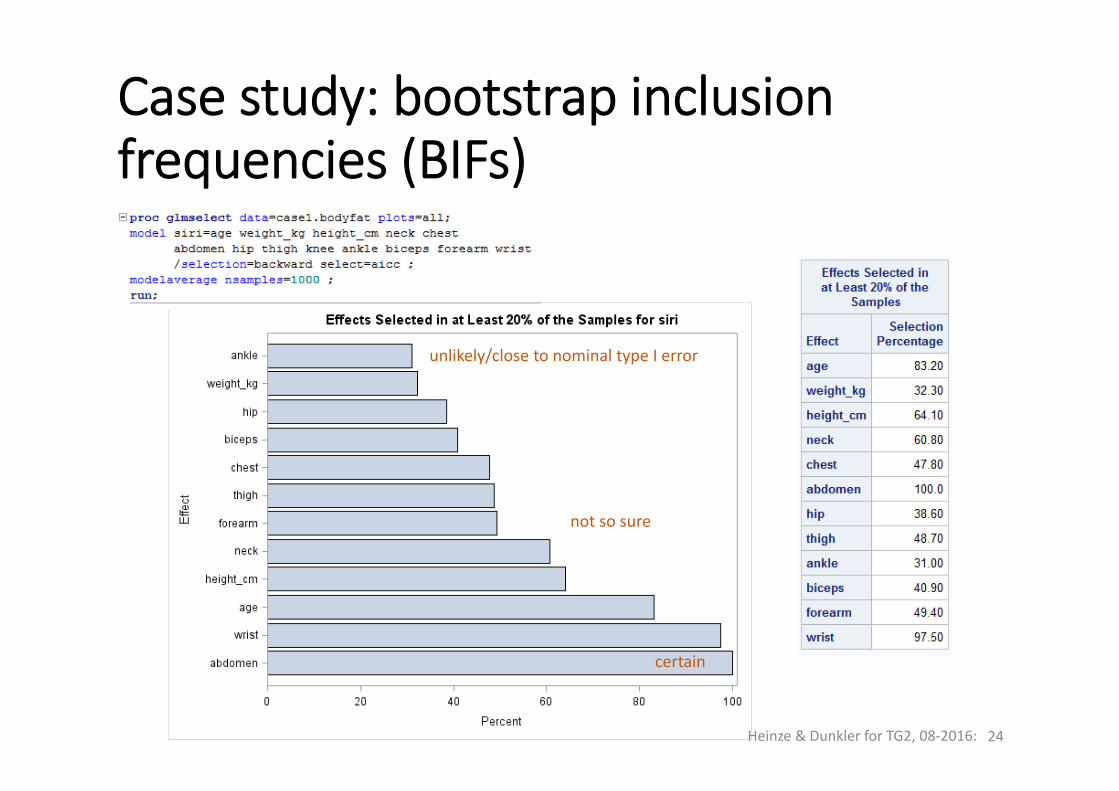
Case study: bootstrap inclusionfrequencies (BIFs)
Heinze & Dunkler for TG2, 08‐2016: 24
certain
not so sure
unlikely/close to nominal type I error
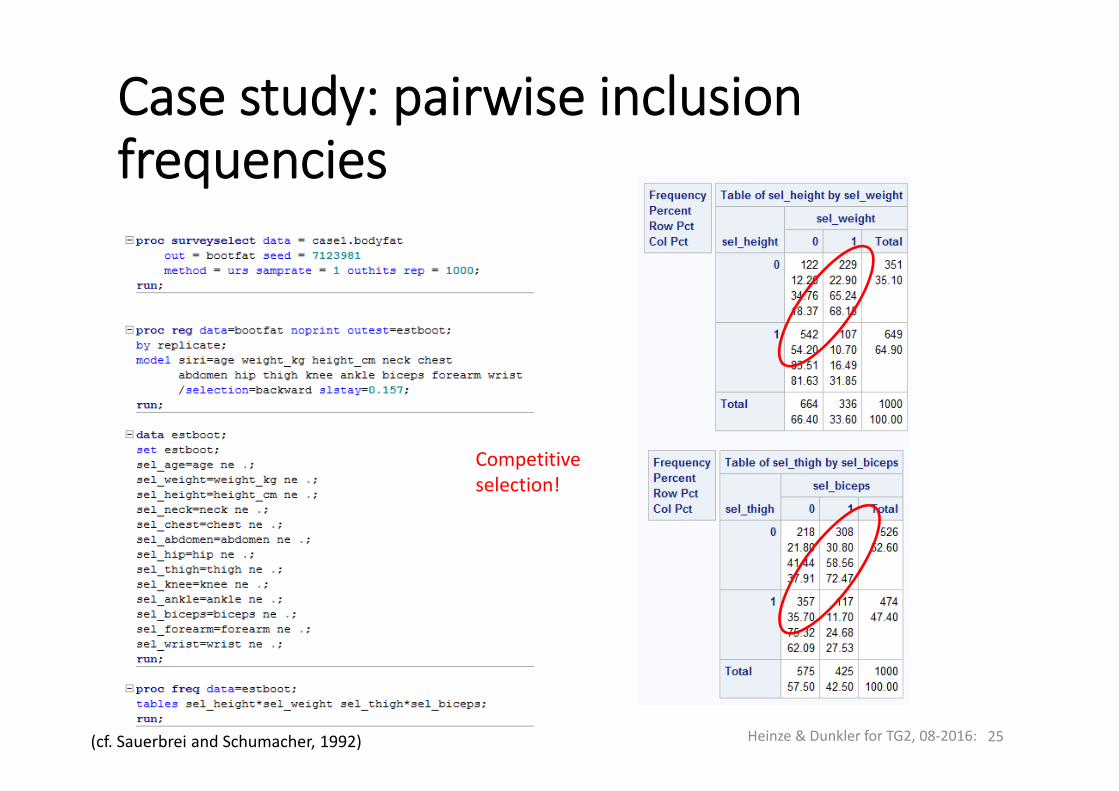
Case study: pairwise inclusionfrequencies
Heinze & Dunkler for TG2, 08‐2016: 25
Competitiveselection!
(cf. Sauerbrei and Schumacher, 1992)
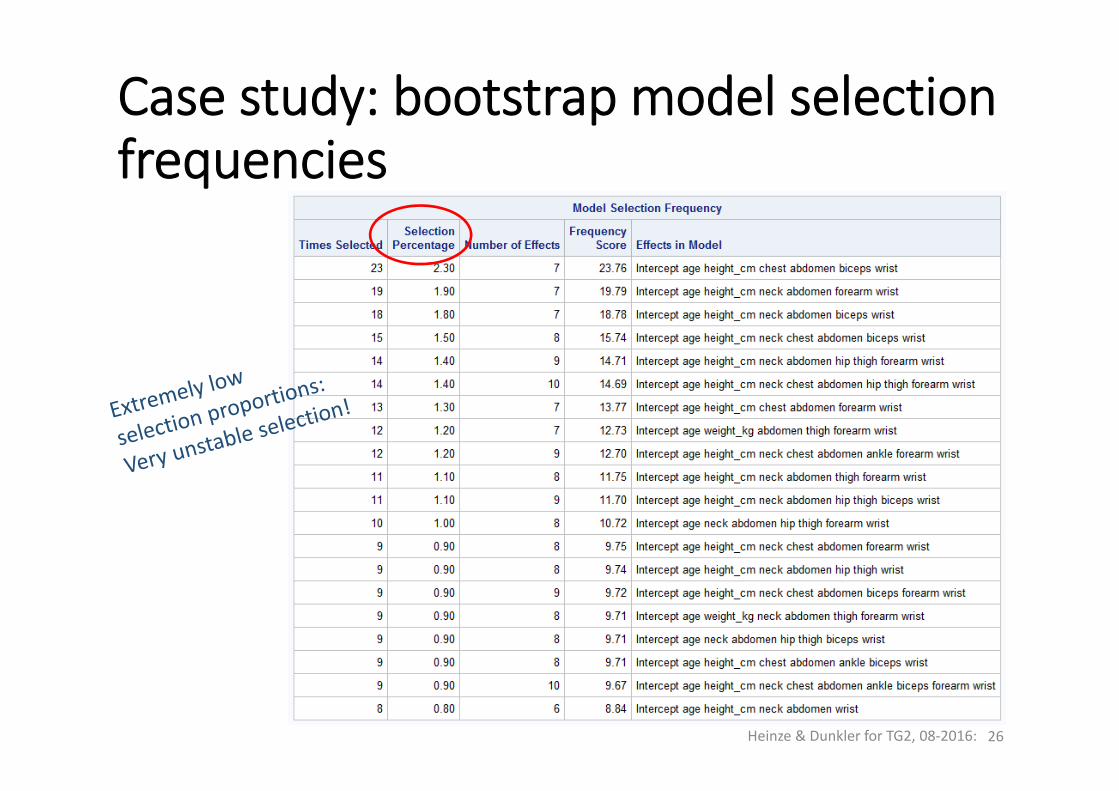
Case study: bootstrap model selectionfrequencies
Heinze & Dunkler for TG2, 08‐2016: 26
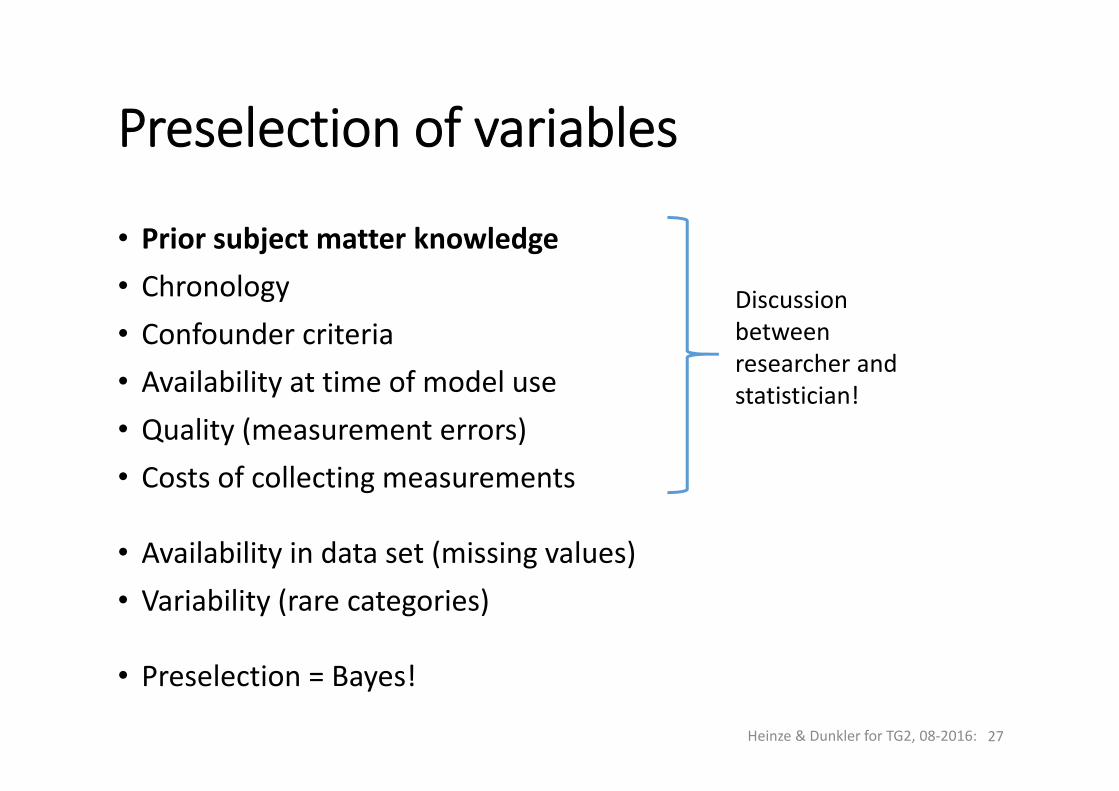
Preselection of variables
• Prior subject matter knowledge• Chronology• Confounder criteria• Availability at time of model use• Quality (measurement errors)• Costs of collecting measurements
• Availability in data set (missing values)• Variability (rare categories)
• Preselection = Bayes!
Heinze & Dunkler for TG2, 08‐2016: 27
Discussionbetweenresearcher andstatistician!
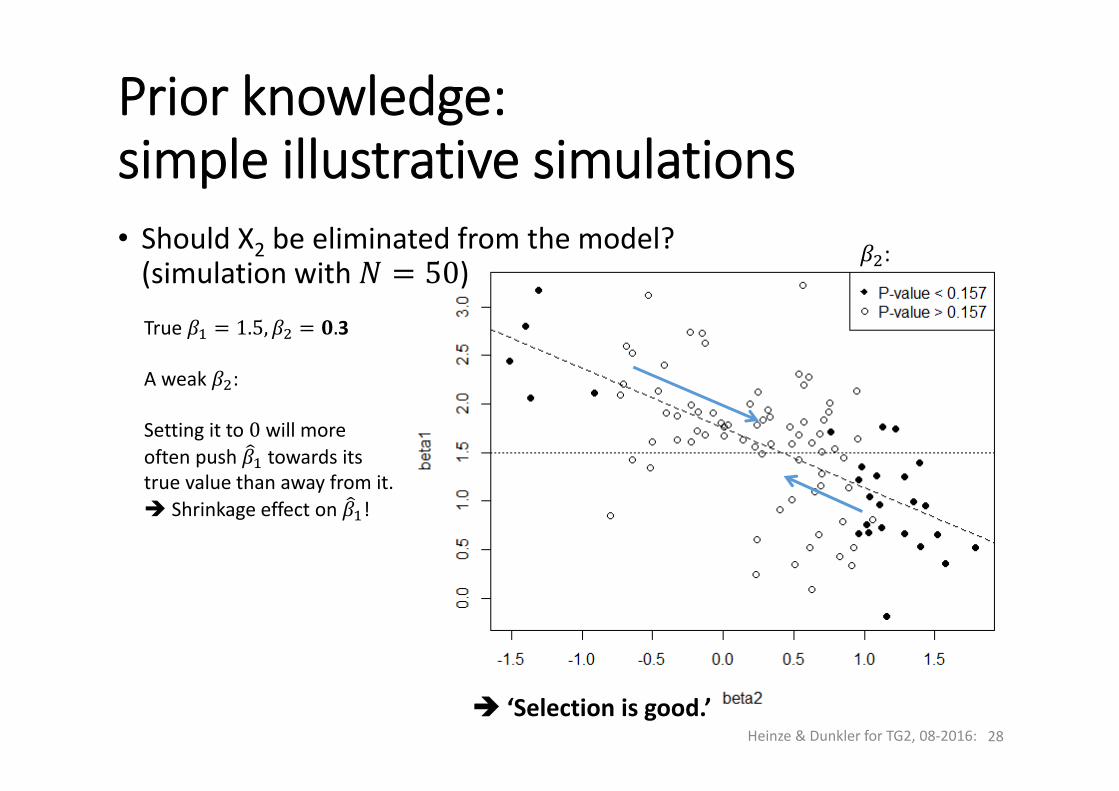
• Should X2 be eliminated from the model?(simulation with 50)
Prior knowledge: simple illustrative simulations
Heinze & Dunkler for TG2, 08‐2016: 28
True 1.5, .3
A weak :
Setting it to 0 will moreoften push towards itstrue value than away from it. Shrinkage effect on !
RMSE( , = 0.67RMSE( , = 0.65
Bias( , 0.03Bias , = +0.03
‘Selection is good.’
:
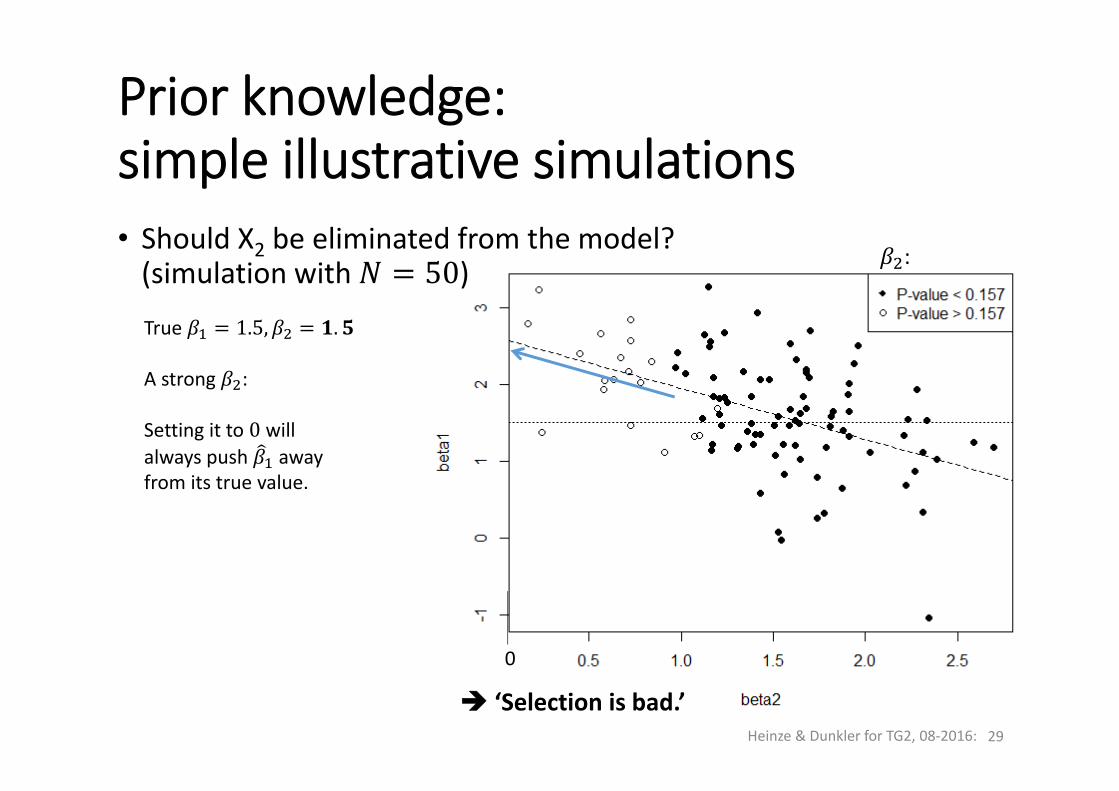
• Should X2 be eliminated from the model? (simulation with 50)True 1.5, .
A strong :
Setting it to 0 will always push awayfrom its true value.
RMSE( , = 0.68RMSE( , = 0.67
Bias( , 0.03Bias , = +0.33
Prior knowledge: simple illustrative simulations
Heinze & Dunkler for TG2, 08‐2016: 29
‘Selection is bad.’
0
:
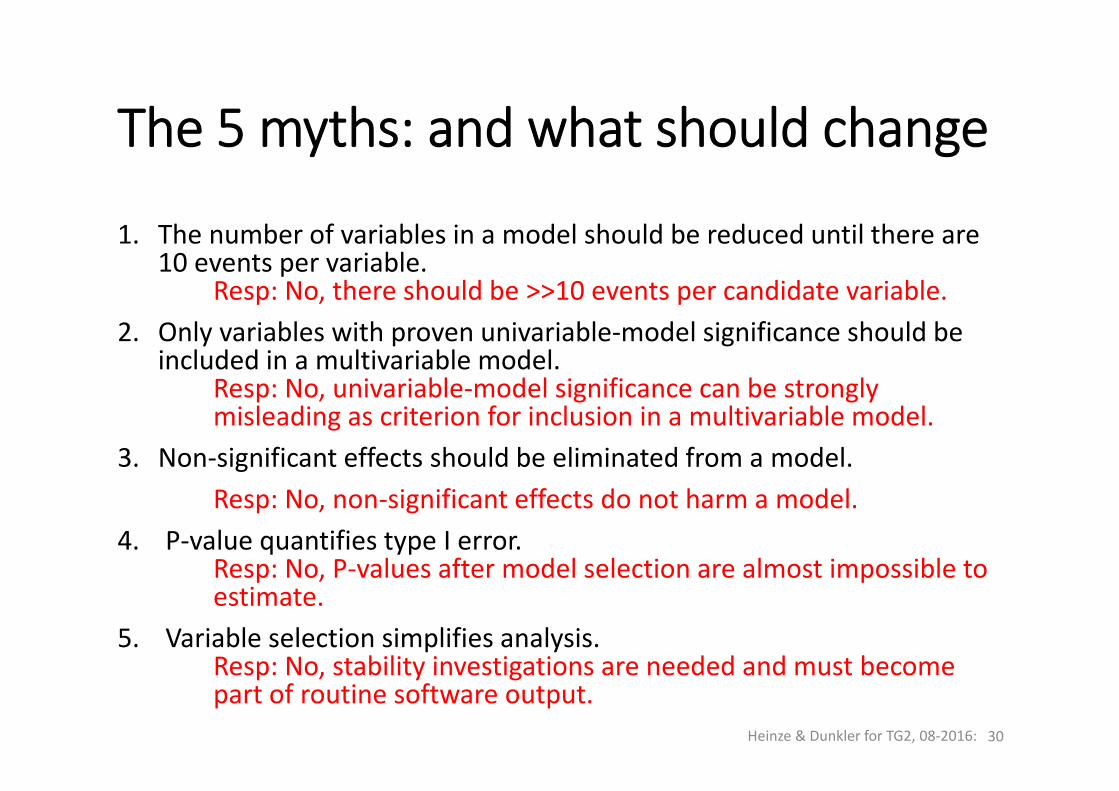
The 5 myths: and what should change
1. The number of variables in a model should be reduced until there are10 events per variable.
Resp: No, there should be >>10 events per candidate variable.2. Only variables with proven univariable‐model significance should be
included in a multivariable model.Resp: No, univariable‐model significance can be stronglymisleading as criterion for inclusion in a multivariable model.
3. Non‐significant effects should be eliminated from a model.Resp: No, non‐significant effects do not harm a model.
4. P‐value quantifies type I error.Resp: No, P‐values after model selection are almost impossible toestimate.
5. Variable selection simplifies analysis.Resp: No, stability investigations are needed and must becomepart of routine software output.
Heinze & Dunkler for TG2, 08‐2016: 30
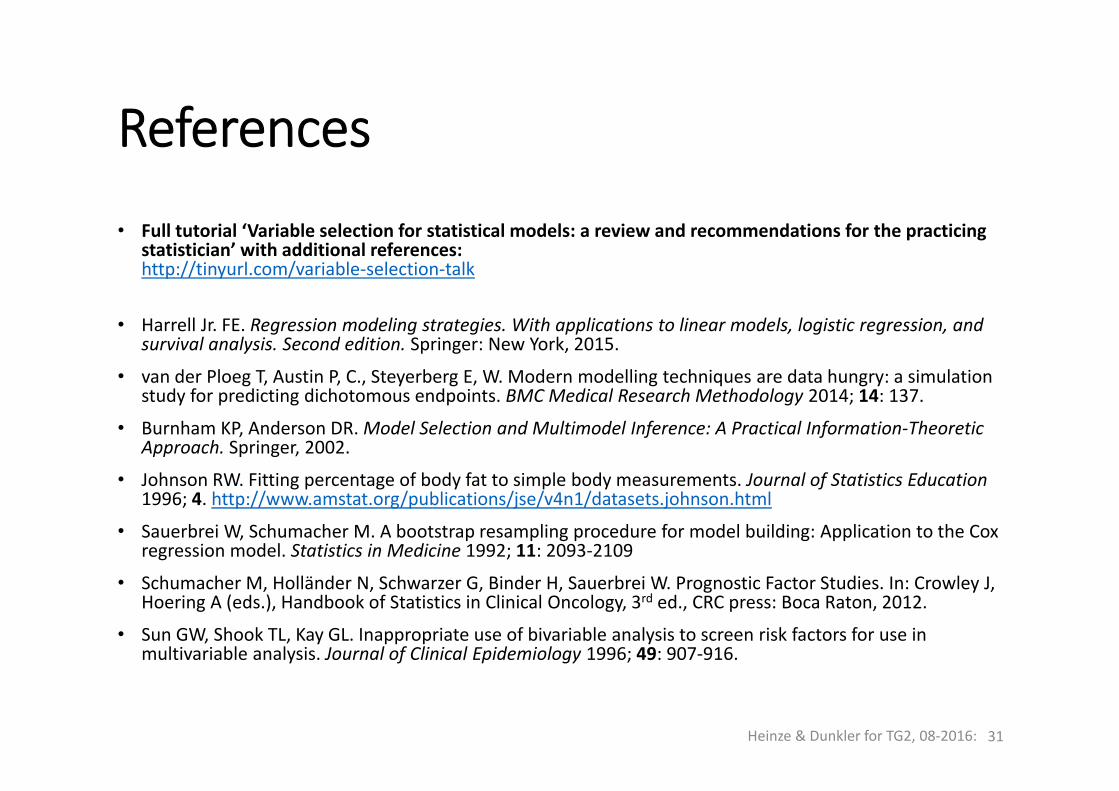
References
• Full tutorial ‘Variable selection for statistical models: a review and recommendations for the practicing statistician’ with additional references:http://tinyurl.com/variable‐selection‐talk
• Harrell Jr. FE. Regression modeling strategies. With applications to linear models, logistic regression, and survival analysis. Second edition. Springer: New York, 2015.
• van der Ploeg T, Austin P, C., Steyerberg E, W. Modern modelling techniques are data hungry: a simulation study for predicting dichotomous endpoints. BMC Medical Research Methodology 2014; 14: 137.
• Burnham KP, Anderson DR. Model Selection and Multimodel Inference: A Practical Information‐Theoretic Approach. Springer, 2002.
• Johnson RW. Fitting percentage of body fat to simple body measurements. Journal of Statistics Education 1996; 4. http://www.amstat.org/publications/jse/v4n1/datasets.johnson.html
• Sauerbrei W, Schumacher M. A bootstrap resampling procedure for model building: Application to the Cox regression model. Statistics in Medicine 1992; 11: 2093‐2109
• Schumacher M, Holländer N, Schwarzer G, Binder H, Sauerbrei W. Prognostic Factor Studies. In: Crowley J, Hoering A (eds.), Handbook of Statistics in Clinical Oncology, 3rd ed., CRC press: Boca Raton, 2012.
• Sun GW, Shook TL, Kay GL. Inappropriate use of bivariable analysis to screen risk factors for use in multivariable analysis. Journal of Clinical Epidemiology 1996; 49: 907‐916.
Heinze & Dunkler for TG2, 08‐2016: 31