Embed Size (px)
Citation preview
Variability of the value of Vehicle-to-grid across vehicle and
time in future California grid
By
Meiye Wang
A thesis submitted in partial fulfillment
of the requirements for the degree of
Master of Science (School for Environment and Sustainability)
in the University of Michigan
April 2021
Thesis Committee:
Michael Craig
Drew Gronewold

This page is intentionally left blank.
I
Abstract: Electric vehicles (EVs) are gaining momentum across the globe as a strategy
to combat climate change, however, uncontrolled charging of EVs can create pressure
on electricity grid. Along with smart charging (V1G), Vehicle-to-grid (V2G)
technology presents an opportunity for a new way of vehicle grid integration that
enables EVs to send electricity back to the grid, creating the potential for EVs to
provide grid services including electricity generation as well as regulation up and
regulation down capacity. This study aims to quantify the economic value of V2G in
the 2025 and 2030 California grid using an EV simulation model and a grid Unit
Commitment Economic Dispatch model. Scenarios on different renewable penetration
and battery cost are included to account for uncertainty in future energy and battery
development. Results show a V2G-enabled EVs can generate an average of $32-$48
more total annual net revenue than V1G, most profits come from EVs providing
electricity and a small amount from regulation down capacity. From 2020 to 2030, the
economic value of V1G and V2G increased, the result also shows a tradeoff exists
between renewable deployment and V2G value. V2G can generate a moderate amount
of economic benefit given access to electricity and ancillary service wholesale market,
which need further policy support and third-party business cases.

II
Acknowledgment:
Two years of stay in Ann Arbor is coming to an end. I would like to express my
deepest gratitude to my supervisor, Dr. Michael Craig, for guiding me through this
scholarly adventure. The passion and pursuit for excellence he demonstrated will be a
continuing motivation for me. In addition, a thank you to my thesis committee
member, Dr. Drew Gronewold. This research is not possible without their gracious
support.
I want to thank Cong Zhang, Jason MacDonald from Lawrence Berkeley National
Laboratory for their assistance with modeling. My gratitude extends to Alan Jenn
from UC Davis, who helped shape the research in an early stage.
I enjoyed spending my study with the SEAS community. My classmates and teachers
have diverse cultural and educational backgrounds, but together we create this
inclusive environment for everyone to learn and thrive. Their commitments to
advance sustainability for the future taught me to be bold and persistent. I want to say
thank you to my best friend at SEAS, Luyao, for her accompany throughout the ups
and downs of the last two years. Shout outs to my roommates, Crispy, Julia, Tasha,
Nisant (also Elwing the cat) for being amazing and always supportive.
Finally, words cannot express my gratitude for my parents and boyfriend. Their
unconditional love got me through many long nights.
III
Table of Contents
Introduction ............................................................................................................ 1
Literature review .................................................................................................... 2
Methods ................................................................................................................. 4
1. Co-Simulation Platform for V2G and Grid Operations ............................................ 4
2. V2G-Sim to optimize V2G operations ..................................................................... 6
3. UCED model to optimize power system operations ............................................... 8
4. Data and assumptions: .......................................................................................... 9
Results .................................................................................................................. 13
1. Value of V2G Versus V1G in the baseline Scenario ............................................... 13
2. Individual EV Results ........................................................................................... 16
3. Scenario Analysis ................................................................................................. 17
Conclusions ........................................................................................................... 19
Reference .............................................................................................................. 21
Supportive Information ......................................................................................... 28
SI.1: Unit Commitment and Economic Dispatch Model Formulation............................. 28
SI.1.1: Definition of Variables, Parameters, and Sets .................................................................... 28
SI.1.2: Objective Function ............................................................................................................. 30
SI.1.3: Logical Constraint ............................................................................................................... 31
SI.1.4: Demand Supply Constraint ................................................................................................ 31
SI. 1.5: Regulation Up Capacity Constraint ................................................................................... 31
SI. 1.6: Regulation Down Capacity Constraint ............................................................................... 32
SI 1.7: Maximum Capacity Constraint ........................................................................................... 32
SI.1.8: Minimum Capacity Constraint ........................................................................................... 33
SI.1.9: Vehicle Regulation Capacity Constraints: ........................................................................... 33
SI.1.10: Minimum Up Time Constraints: ....................................................................................... 33
SI.1.11: Ramp Rate Constraints: .................................................................................................... 33
SI.2: V2G-sim Formulation ........................................................................................... 34
SI.2.1 Definition of Variables, Parameters, and Sets ..................................................................... 34
SI.2.2 Objective Function .............................................................................................................. 35
SI.2.3 Maximum Power Constraints .............................................................................................. 35
SI.2.4 Energy Constraints .............................................................................................................. 36
SI.2.5 Cap Constraints ................................................................................................................... 37
SI.3: Data Summary ..................................................................................................... 37
SI.3.1: 2017 National Household Travel Survey driving pattern summary ................................... 37

IV
SI.4: Result ................................................................................................................... 37
SI.4.1: Fleet annual average net revenue for all scenarios ........................................................... 38
SI.4.2: Fleet annual average energy generation for all scenarios ................................................. 38
SI.4.3: Energy prices for all scenarios ............................................................................................ 39
SI.4.4: Individual Vehicle Result for 2020 and 2025 V2G baseline scenario ................................. 39
1
Introduction
The transportation and energy sectors are the biggest contributors to GHG emission in
the U.S., together responsible for more than 55% of annual GHG emissions (EPA,
2017). In the transportation sector, light-duty vehicles, mostly passenger vehicles,
accounts for most (59%) of carbon emissions (EPA, 2020). Systematic
decarbonization of passenger vehicles and energy sectors, therefore, is essential for
climate mitigation(Edenhofer and et., 2014). One decarbonization strategy is
combining vehicle electrification with renewable deployment. With higher renewable
energy penetration in the electricity grid, the electrified transportation market will
produce significantly less carbon footprint (National Renewable Energy Laboratory
(NREL), 2012; Garcia, Freire and Clift, 2018). Additionally, electric vehicles (EVs)
can add flexibility to the electricity grid with charging management techniques,
helping overcome integration challenges of high wind and solar penetrations.
To harness the various benefits of EVs, many governments in the U.S. and globally
have passed policies requiring or incentivizing EVs. In the United States, California is
a frontrunner in promoting EVs. In 2018, Executive Order B-48-18 set zero-emission
vehicle (ZEV) mandates, requiring 1.5 million ZEVs be on the road by 2025 and 5
million by 2030, with most of the ZEVs estimated to be Battery Electric Vehicles
(BEVs) and Plug-in Hybrid Electric Vehicles (PHEVs)(Governor Edmund G. Brown
Jr., 2018). In 2020, Executive Order N-79-20 set more aggressive mandates, requiring
all new cars and passenger trucks sold in California be ZEVs by 2035(Gavin
Newsom, 2020). This fast deployment of EVs creates a great opportunity for climate
mitigation and pollution control but also poses challenges for the electricity grid if
EVs' charging is unmanaged.
If uncontrolled, increasing energy demand from EVs could exacerbate peaks and
ramps in netload, requiring greater generation investment (Coignard, 2018). One way
to manage charging is by changing charging time, known as “smart charging” or
V1G. Alternatively, “Vehicle to Grid” (V2G) enables EVs to both receive energy and
send energy back to the grid, thereby providing more flexibility to the grid (Coignard
et al., 2018). While a single EV has limited grid-scale value, in the aggregate EV
storage can be large. For instance, 1 million Nissan Leaf model EVs – a fifth of
California’s 2030 ZEV mandate – can storage 40 GWh in total. A third-party
aggregator can coordinate operations across many EVs by bidding into the power
market for them as an intermediate agency, as shown in Figure 1.
Since its proposal in 2002 (Letendre and Kempton, 2002), V2G has attracted interest
from academic and industry. Intensive studies and pilot projects over the world are
testing V2G in real-world conditions (Steward, 2017; Trahand, 2017; Black et al.,
2018). V2G has been shown to be technologically and economically feasible to

2
provide various grid services to the grid (Kempton and Tomić, 2005; Coignard et al.,
2018; Liu and Zhong, 2019). These services include demand-response, storage, and
ancillary services in the wholesale market(Nunes and Brito, 2017; Coignard et al.,
2018; Gnann, Klingler and Kühnbach, 2018; Luo et al., 2020); renewable integration
and reliability enhancement in mini-grid or distributed generation system(Zhu, Xia
and Chiang, 2018; Carrión et al., 2019; Küfeoğlu and Pollitt, 2019; Chen et al., 2020);
distribution level service like transmission congestion reduction. For the customers,
BEVs and PHEVs that participate in V2G market would lower their electricity
charging bills or even generate net revenue from providing grid services (Agarwal,
Peng and Goel, 2014; Schuller et al., 2014; Luo et al., 2020).
While these studies demonstrate potential value in V2G, existing research suffers
from several shortcomings, including ignoring changes in future electricity prices,
ignoring electricity price impacts of V2G, and simulating limited numbers of EVs
with V2G. To begin to fill these gaps, we co-simulate electric grid and EV operations
to analyze the economic value of V2G through 2030 in California. Our co-simulation
captures future changes in the power system and EV market, as well as interactions
between V2G and power system operations. Using this co-simulation platform, we
quantify the future value of V2G, providing invaluable information to policymakers,
grid operators, and V2G aggregators.
Literature review
Since initial work by Kemptom and Tomic in 2005(Kempton and Tomić, 2005),
research on V2G has proceeded down many avenues, e.g. on technical aspects like
scheduling algorithms (Bashash et al., 2011; Ortega-Vazquez, Bouffard and Silva,
2013, 2013; Guo and Bashash, 2017; Xiong, Cao and Yu, 2018; Carrión et al., 2019;
Yang et al., 2020) and on renewable integration (Garcia, Freire and Clift, 2018;
Gnann, Klingler and Kühnbach, 2018; Das et al., 2020). A recent systematic review
on 197 papers on V2G between 2015 and 2017 points out that current studies
overemphasize technical topics, with only 3% looking at economic and social
dimensions (Sovacool et al., 2018).
Despite its potential value, V2G has not scaled up in the U.S. or most of the world due
to several challenges, including difficulty to quantify the battery degradation cost of
providing V2G, no established driver-centered business model, and inflexible energy
market policies preventing EV participation as distributed energy resources (Steward,
2017; Black et al., 2018). If V2G scales up, it’s likely to be at least partly driven by
market forces, i.e. by providing value to V2G adopters. This paper aims to better
understand the economics of V2G for light-duty passenger vehicles because they are
the main contributor of GHG in the transportation sector (for commercial fleets, see
e.g. (Gnann, Klingler and Kühnbach, 2018)).
3
Because V2G has not been widely commercialized, research on the potential value of
V2G should adopt a prospective lens to quantify its potential future value. This is
particularly important given rapid decarbonization of the power system and
consequent market consequences like more volatile electricity prices, particularly in
California(Seel et al., 2018; U.S. EIA, 2020). Furthermore, given rapidly growing EV
numbers and California’s mandate for 5 million ZEVs on the road by 2030, V2G
analyses should model large numbers of EVs(Argonne National Laboratory, 2021).
Finally, large numbers of V2G-enabled EVs will interact with and affect electricity
prices, which will in turn affect V2G value and revenues and drive changes in V2G
operations. Thus, economic analyses of V2G should capture four critical factors: (1)
future grid changes, (2) large EV numbers, (3) V2G interactions with electricity
prices, and (4) V2G operational responses to shifts in electricity prices.
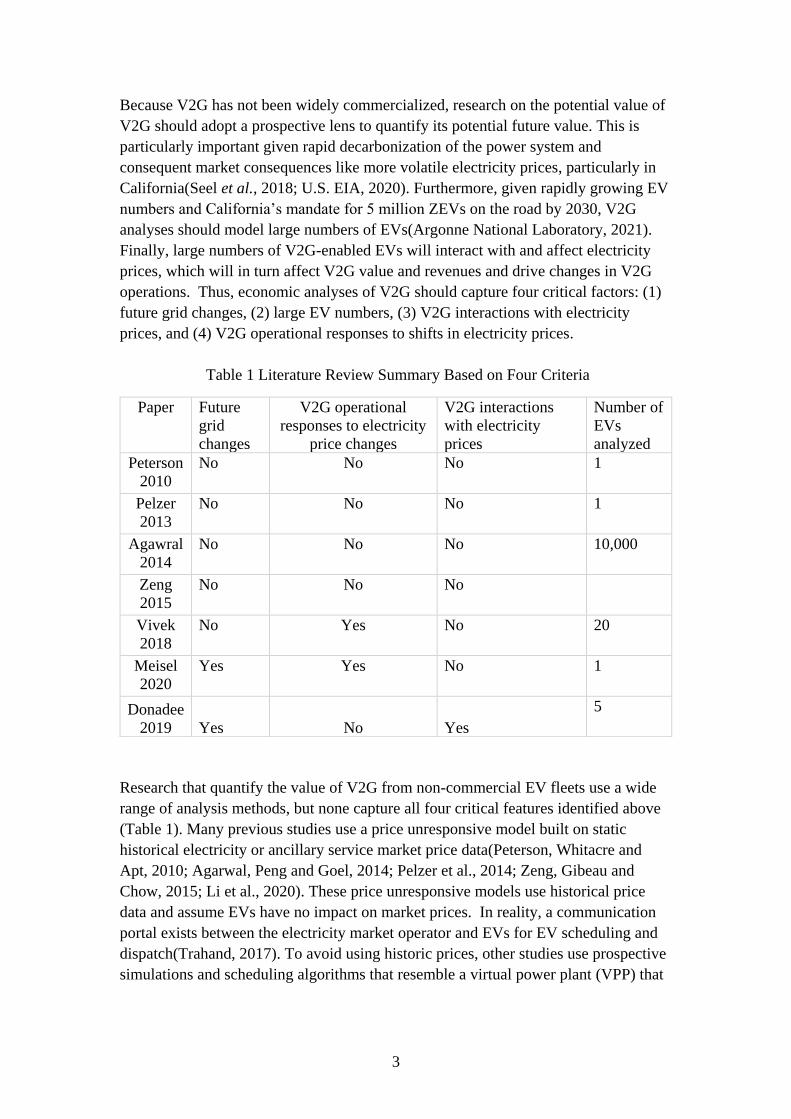
Table 1 Literature Review Summary Based on Four Criteria
Research that quantify the value of V2G from non-commercial EV fleets use a wide
range of analysis methods, but none capture all four critical features identified above
(Table 1). Many previous studies use a price unresponsive model built on static
historical electricity or ancillary service market price data(Peterson, Whitacre and
Apt, 2010; Agarwal, Peng and Goel, 2014; Pelzer et al., 2014; Zeng, Gibeau and
Chow, 2015; Li et al., 2020). These price unresponsive models use historical price
data and assume EVs have no impact on market prices. In reality, a communication
portal exists between the electricity market operator and EVs for EV scheduling and
dispatch(Trahand, 2017). To avoid using historic prices, other studies use prospective
simulations and scheduling algorithms that resemble a virtual power plant (VPP) that
Paper Future
grid
changes
V2G operational
responses to electricity
price changes
V2G interactions
with electricity
prices
Number of
EVs
analyzed
Peterson
2010
No No No 1
Pelzer
2013
No No No 1
Agawral
2014
No No No 10,000
Zeng
2015
No No No
Vivek
2018
No Yes No 20
Meisel
2020
Yes Yes No 1
Donadee
2019 Yes No Yes
5
4
optimize EV charging and discharging decision based on electricity market price
data(Bhandari, Sun and Homans, 2018; Meisel and Merfeld, 2020). Among the few
V2G analyses that consider future grid changes, Coignard looked at how much
renewable sources V2G can help integrate in a future grid, but the research didn’t
quantify the economic value of V2G(Coignard et al., 2018). Additionally, few studies
of V2G integrate V2G operations with power system models to explore the value of
V2G in future grids. Donadee used a co-optimization dispatch model to analyze the
value of V2G in 2030 California grid under different renewable scenarios(Donadee et
al., 2019). Yet, this study only modeled 5 EVs, so doesn’t capture the impact of large
numbers of EV on electricity load or prices.
Overall, no research to date has captured all four of the critical factors we identified
for estimating the economic value of V2G. Existing research either (1) uses a
retrospective instead of prospective lens , (2) ignore how V2G-enabled EVs would
respond to market prices, (3) ignore interactions between V2G and the power system,
including whether the grid will accept V2G bids and on how V2G affects electricity
prices, and (4) models a significantly lower number of EVs than expected by 2030.
To fill this gap, we co-simulate V2G and power system operations for a 2030
California grid and 4 million EVs. Through our co-simulation platform, we capture
interactions and price-responsive behavior between V2G and power system
operations. Our V2G-enabled EV simulation model is bottom-up and takes into
account EV characteristics including driving patterns, charging availability, and EV
manufacturing technology advancement. Our power system model optimizes (or
dispatches) generator operations to minimize system operational costs given generator
and system constraints and V2G operations. Given future uncertainty surrounding
EVs and the grid, we test the sensitivity of our results around future renewable
deployment and battery technology.
Methods
1. Co-Simulation Platform for V2G and Grid Operations
This study is composed of two optimization problems: 1) V2G-sim optimizes the net
revenue for individual EV. V2G-sim first simulates the driving pattern of vehicles and
then maximize individual vehicle net revenue by making charging and discharging
decision based on EV electricity demand, electricity prices, and regulation capacity
price; 2) Unit Commitment and Economic Dispatch (UCED) models optimizes
CAISO’s daily operation of the energy and ancillary services market. UCED dispatch
generators and vehicles based on their bids and energy demand. V2G-sim outputs the
bid from EVs fleet as well as extra electricity charge demand from the EVs, the
demand and bid from EVs would impact the energy prices, which would in return be

5
fed back to V2G-sim. These two optimization problems would be solved through
iterations.
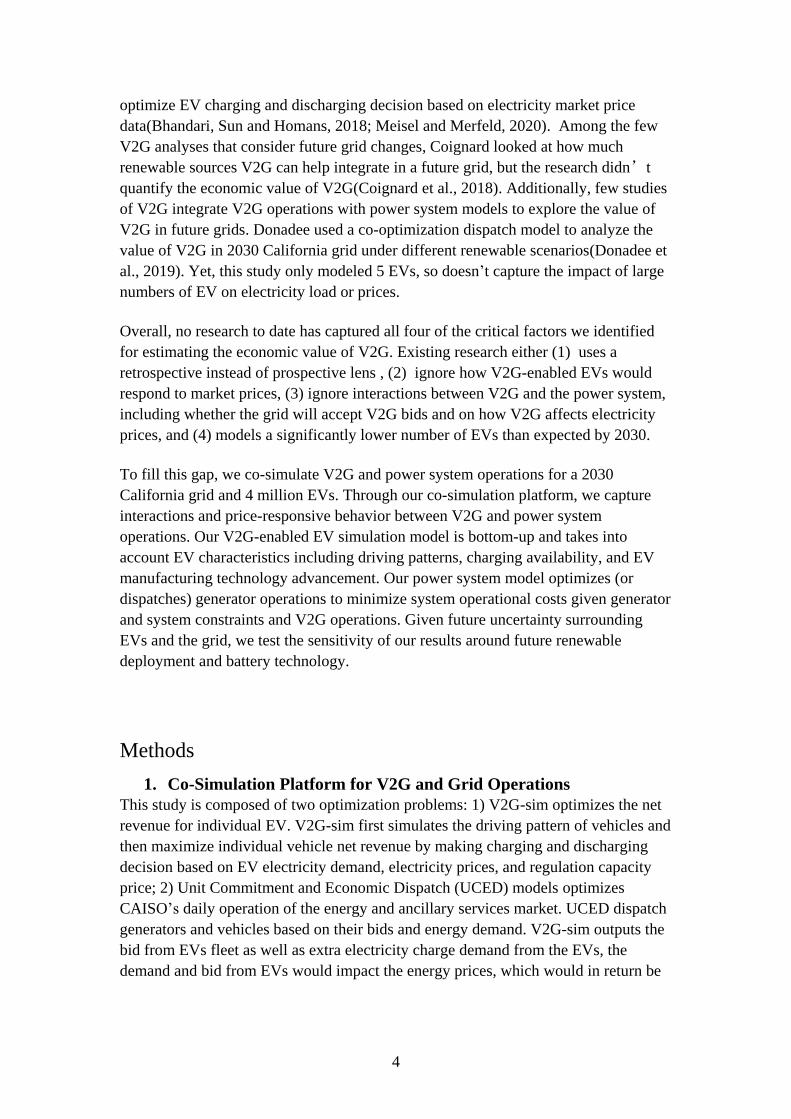
V2G-sim uses price outputs from UCED to update its input data and produce EV
charge and discharge data. Given EV charging and discharging, generator data, and
non-EV electricity demand, the UCED dispatches the generator fleet and produces
new prices. Our platform iterates between these two models, updating price and
vehicle charge and discharge decisions until the results converge, as shown by Figure
2. The study runs on a daily basis for a year and uses daily EV economic profit as the
convergence criteria. EV economic profit is calculated as revenues from electricity
and regulation services minus electricity charging cost and battery cost, as follows:
𝑝𝑟𝑜𝑓𝑖𝑡𝑖 = ∑ 𝑔𝑖,ℎ ∗ 𝑝𝑟𝑒,ℎ + 𝑟𝑒𝑔𝑢𝑝𝑖,ℎ ∗ prup,h + 𝑟𝑒𝑔𝑑𝑜𝑤𝑛𝑖,ℎ ∗ 𝑝𝑟𝑑𝑜𝑤𝑛,ℎ − 𝑑ℎ ∗24
ℎ=1
𝑝𝑟𝑒,ℎ − (𝑔𝑖,ℎ + 𝑟𝑒𝑔𝑢𝑝𝑖,ℎ + 𝑟𝑒𝑔𝑑𝑜𝑤𝑛𝑖,ℎ) ∗ 𝑝𝑟𝑏𝑎𝑡𝑡 (1)
𝑝𝑟𝑜𝑓𝑖𝑡𝑖i denotes EV, h denotes hours. 𝑝𝑟𝑜𝑓𝑖𝑡𝑖 denotes profit for EV i, 𝑔𝑖,ℎ denotes
generation, 𝑑ℎ denotes demand, 𝑟𝑒𝑔𝑢𝑝𝑖,ℎ denotes regulation up capacity and
𝑟𝑒𝑔𝑑𝑜𝑤𝑛𝑖,ℎ denotes regulation down capacity. 𝑝𝑟 denotes price, with e for electricity,
up for regulation up, down for regulation down, batt for battery cost.
We set the convergence threshold to the change between iterations in daily profit for
each EV dropping to less than $0.05. This convergence criteria balances
computational requirements with obtaining stable and accurate results.
6
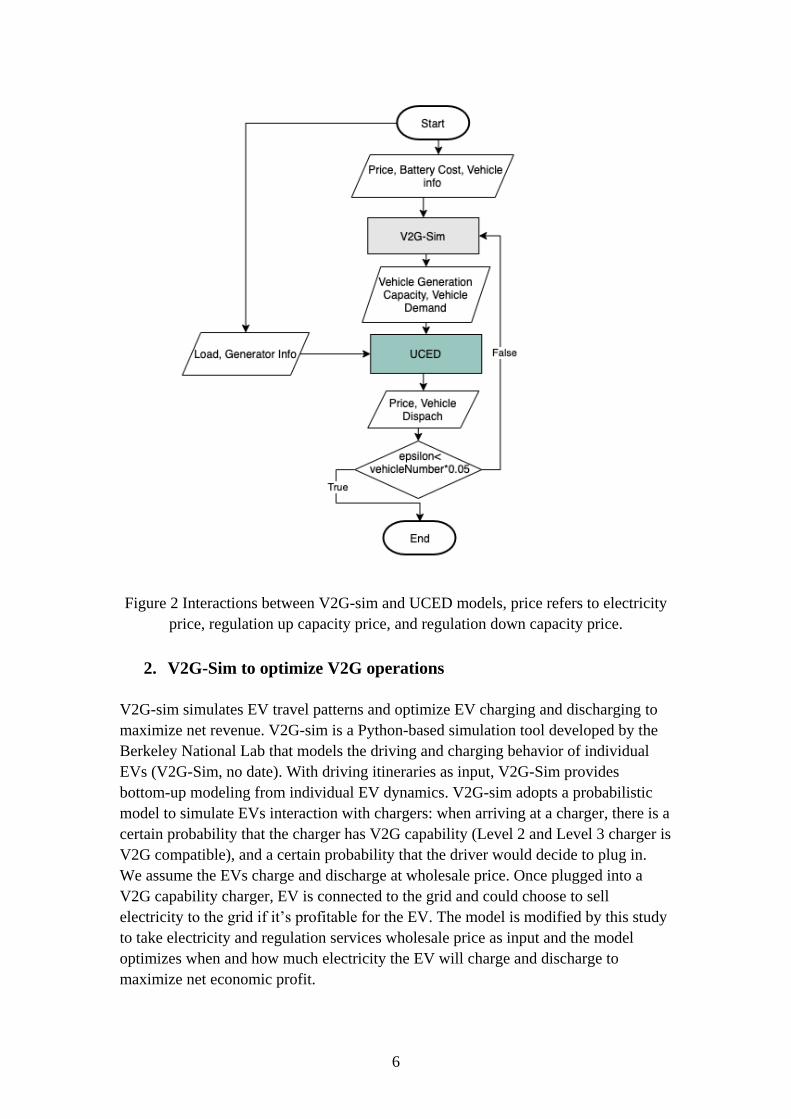
Figure 2 Interactions between V2G-sim and UCED models, price refers to electricity
price, regulation up capacity price, and regulation down capacity price.
2. V2G-Sim to optimize V2G operations
V2G-sim simulates EV travel patterns and optimize EV charging and discharging to
maximize net revenue. V2G-sim is a Python-based simulation tool developed by the
Berkeley National Lab that models the driving and charging behavior of individual
EVs (V2G-Sim, no date). With driving itineraries as input, V2G-Sim provides
bottom-up modeling from individual EV dynamics. V2G-sim adopts a probabilistic
model to simulate EVs interaction with chargers: when arriving at a charger, there is a
certain probability that the charger has V2G capability (Level 2 and Level 3 charger is
V2G compatible), and a certain probability that the driver would decide to plug in.
We assume the EVs charge and discharge at wholesale price. Once plugged into a
V2G capability charger, EV is connected to the grid and could choose to sell
electricity to the grid if it’s profitable for the EV. The model is modified by this study
to take electricity and regulation services wholesale price as input and the model
optimizes when and how much electricity the EV will charge and discharge to
maximize net economic profit.
7
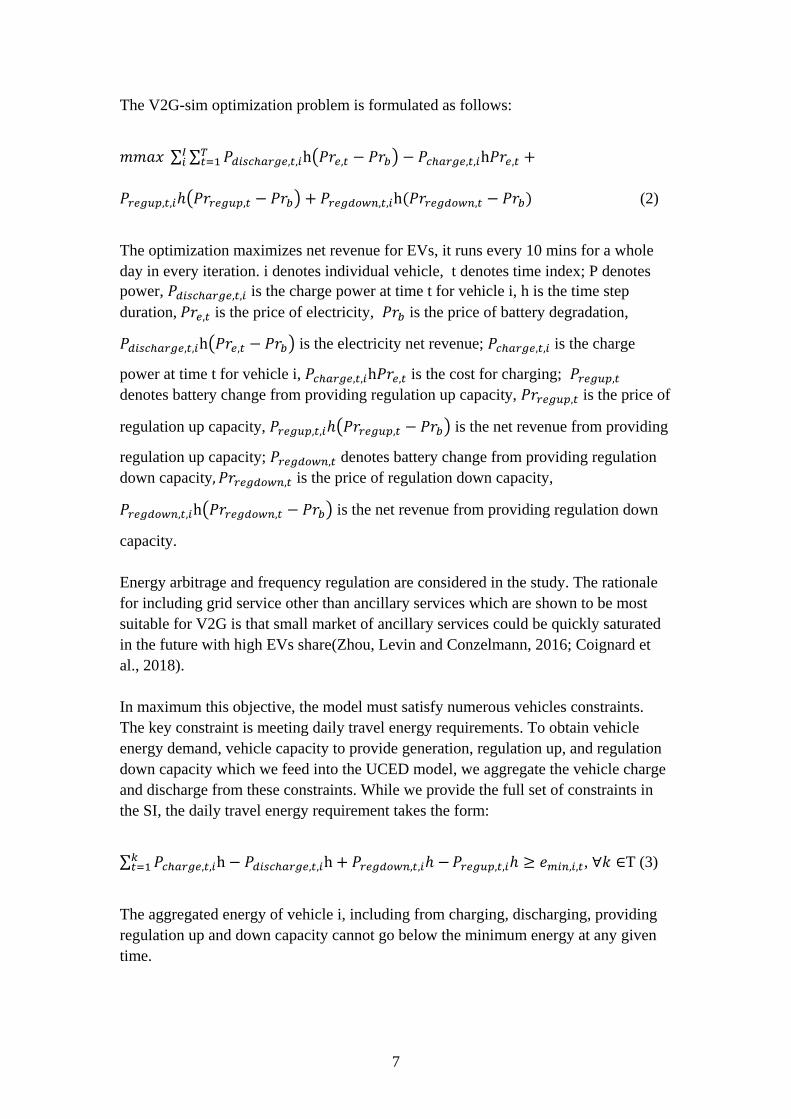
The V2G-sim optimization problem is formulated as follows:
𝑚𝑚𝑎𝑥 ∑ ∑ 𝑃𝑑𝑖𝑠𝑐ℎ𝑎𝑟𝑔𝑒,𝑡,𝑖h(𝑃𝑟𝑒,𝑡 − 𝑃𝑟𝑏) − 𝑃𝑐ℎ𝑎𝑟𝑔𝑒,𝑡,𝑖h𝑃𝑟𝑒,𝑡𝑇𝑡=1 +𝐼
𝑖
𝑃𝑟𝑒𝑔𝑢𝑝,𝑡,𝑖ℎ(𝑃𝑟𝑟𝑒𝑔𝑢𝑝,𝑡 − 𝑃𝑟𝑏) + 𝑃𝑟𝑒𝑔𝑑𝑜𝑤𝑛,𝑡,𝑖h(𝑃𝑟𝑟𝑒𝑔𝑑𝑜𝑤𝑛,𝑡 − 𝑃𝑟𝑏) (2)
The optimization maximizes net revenue for EVs, it runs every 10 mins for a whole
day in every iteration. i denotes individual vehicle, t denotes time index; P denotes
power, 𝑃𝑑𝑖𝑠𝑐ℎ𝑎𝑟𝑔𝑒,𝑡,𝑖 is the charge power at time t for vehicle i, h is the time step
duration, 𝑃𝑟𝑒,𝑡 is the price of electricity, 𝑃𝑟𝑏 is the price of battery degradation,
𝑃𝑑𝑖𝑠𝑐ℎ𝑎𝑟𝑔𝑒,𝑡,𝑖h(𝑃𝑟𝑒,𝑡 − 𝑃𝑟𝑏) is the electricity net revenue; 𝑃𝑐ℎ𝑎𝑟𝑔𝑒,𝑡,𝑖 is the charge
power at time t for vehicle i, 𝑃𝑐ℎ𝑎𝑟𝑔𝑒,𝑡,𝑖h𝑃𝑟𝑒,𝑡 is the cost for charging; 𝑃𝑟𝑒𝑔𝑢𝑝,𝑡
denotes battery change from providing regulation up capacity, 𝑃𝑟𝑟𝑒𝑔𝑢𝑝,𝑡 is the price of
regulation up capacity, 𝑃𝑟𝑒𝑔𝑢𝑝,𝑡,𝑖ℎ(𝑃𝑟𝑟𝑒𝑔𝑢𝑝,𝑡 − 𝑃𝑟𝑏) is the net revenue from providing
regulation up capacity; 𝑃𝑟𝑒𝑔𝑑𝑜𝑤𝑛,𝑡 denotes battery change from providing regulation
down capacity, 𝑃𝑟𝑟𝑒𝑔𝑑𝑜𝑤𝑛,𝑡 is the price of regulation down capacity,
𝑃𝑟𝑒𝑔𝑑𝑜𝑤𝑛,𝑡,𝑖h(𝑃𝑟𝑟𝑒𝑔𝑑𝑜𝑤𝑛,𝑡 − 𝑃𝑟𝑏) is the net revenue from providing regulation down
capacity.
Energy arbitrage and frequency regulation are considered in the study. The rationale
for including grid service other than ancillary services which are shown to be most
suitable for V2G is that small market of ancillary services could be quickly saturated
in the future with high EVs share(Zhou, Levin and Conzelmann, 2016; Coignard et
al., 2018).
In maximum this objective, the model must satisfy numerous vehicles constraints.
The key constraint is meeting daily travel energy requirements. To obtain vehicle
energy demand, vehicle capacity to provide generation, regulation up, and regulation
down capacity which we feed into the UCED model, we aggregate the vehicle charge
and discharge from these constraints. While we provide the full set of constraints in
the SI, the daily travel energy requirement takes the form:
∑ 𝑃𝑐ℎ𝑎𝑟𝑔𝑒,𝑡,𝑖h − 𝑃𝑑𝑖𝑠𝑐ℎ𝑎𝑟𝑔𝑒,𝑡,𝑖h + 𝑃𝑟𝑒𝑔𝑑𝑜𝑤𝑛,𝑡,𝑖ℎ −𝑘𝑡=1 𝑃𝑟𝑒𝑔𝑢𝑝,𝑡,𝑖ℎ ≥ 𝑒𝑚𝑖𝑛,𝑖,𝑡, ∀𝑘 ∈T (3)
The aggregated energy of vehicle i, including from charging, discharging, providing
regulation up and down capacity cannot go below the minimum energy at any given
time.
8
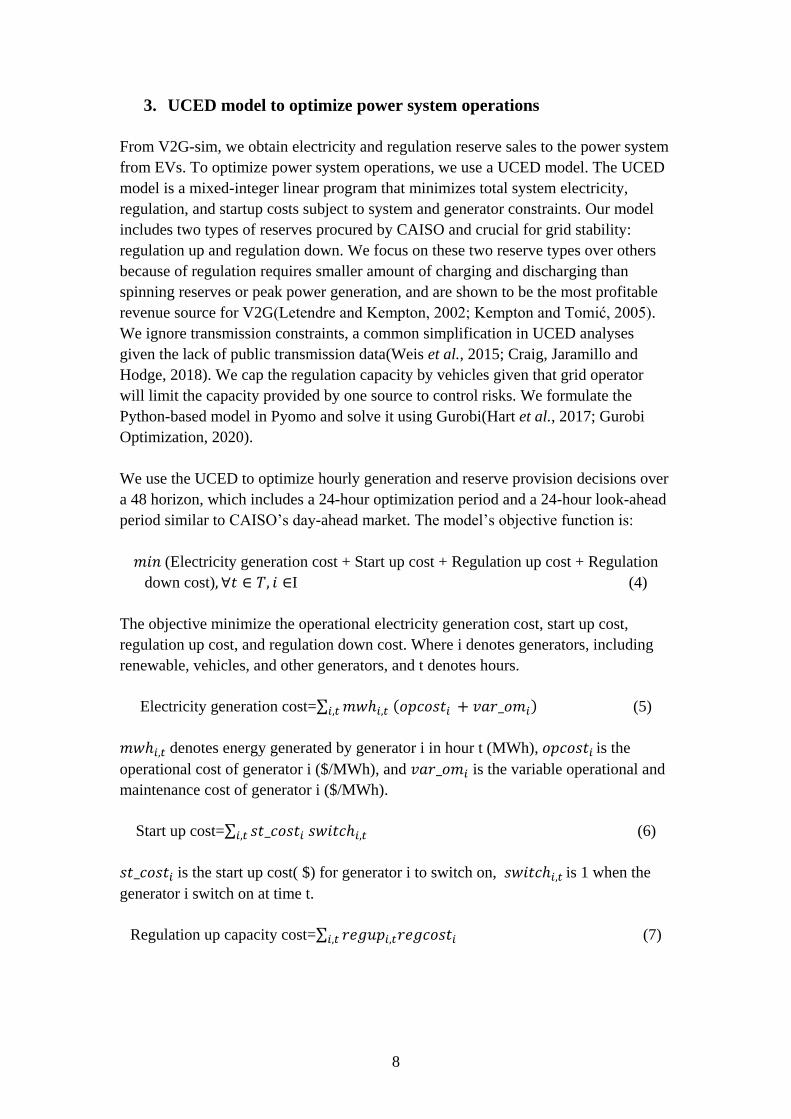
3. UCED model to optimize power system operations
From V2G-sim, we obtain electricity and regulation reserve sales to the power system
from EVs. To optimize power system operations, we use a UCED model. The UCED
model is a mixed-integer linear program that minimizes total system electricity,
regulation, and startup costs subject to system and generator constraints. Our model
includes two types of reserves procured by CAISO and crucial for grid stability:
regulation up and regulation down. We focus on these two reserve types over others
because of regulation requires smaller amount of charging and discharging than
spinning reserves or peak power generation, and are shown to be the most profitable
revenue source for V2G(Letendre and Kempton, 2002; Kempton and Tomić, 2005).
We ignore transmission constraints, a common simplification in UCED analyses
given the lack of public transmission data(Weis et al., 2015; Craig, Jaramillo and
Hodge, 2018). We cap the regulation capacity by vehicles given that grid operator
will limit the capacity provided by one source to control risks. We formulate the
Python-based model in Pyomo and solve it using Gurobi(Hart et al., 2017; Gurobi
Optimization, 2020).
We use the UCED to optimize hourly generation and reserve provision decisions over
a 48 horizon, which includes a 24-hour optimization period and a 24-hour look-ahead
period similar to CAISO’s day-ahead market. The model’s objective function is:
𝑚𝑖𝑛 (Electricity generation cost + Start up cost + Regulation up cost + Regulation
down cost), ∀𝑡 ∈ 𝑇, 𝑖 ∈I (4)
The objective minimize the operational electricity generation cost, start up cost,
regulation up cost, and regulation down cost. Where i denotes generators, including
renewable, vehicles, and other generators, and t denotes hours.
Electricity generation cost=∑ 𝑚𝑤ℎ𝑖,𝑡 (𝑜𝑝𝑐𝑜𝑠𝑡𝑖 + 𝑣𝑎𝑟_𝑜𝑚𝑖)𝑖,𝑡 (5)
𝑚𝑤ℎ𝑖,𝑡 denotes energy generated by generator i in hour t (MWh), 𝑜𝑝𝑐𝑜𝑠𝑡𝑖 is the
operational cost of generator i ($/MWh), and 𝑣𝑎𝑟_𝑜𝑚𝑖 is the variable operational and
maintenance cost of generator i ($/MWh).
Start up cost=∑ 𝑠𝑡_𝑐𝑜𝑠𝑡𝑖 𝑠𝑤𝑖𝑡𝑐ℎ𝑖,𝑡 𝑖,𝑡 (6)
𝑠𝑡_𝑐𝑜𝑠𝑡𝑖 is the start up cost( $) for generator i to switch on, 𝑠𝑤𝑖𝑡𝑐ℎ𝑖,𝑡 is 1 when the
generator i switch on at time t.
Regulation up capacity cost=∑ 𝑟𝑒𝑔𝑢𝑝𝑖,𝑡𝑟𝑒𝑔𝑐𝑜𝑠𝑡𝑖 𝑖,𝑡 (7)
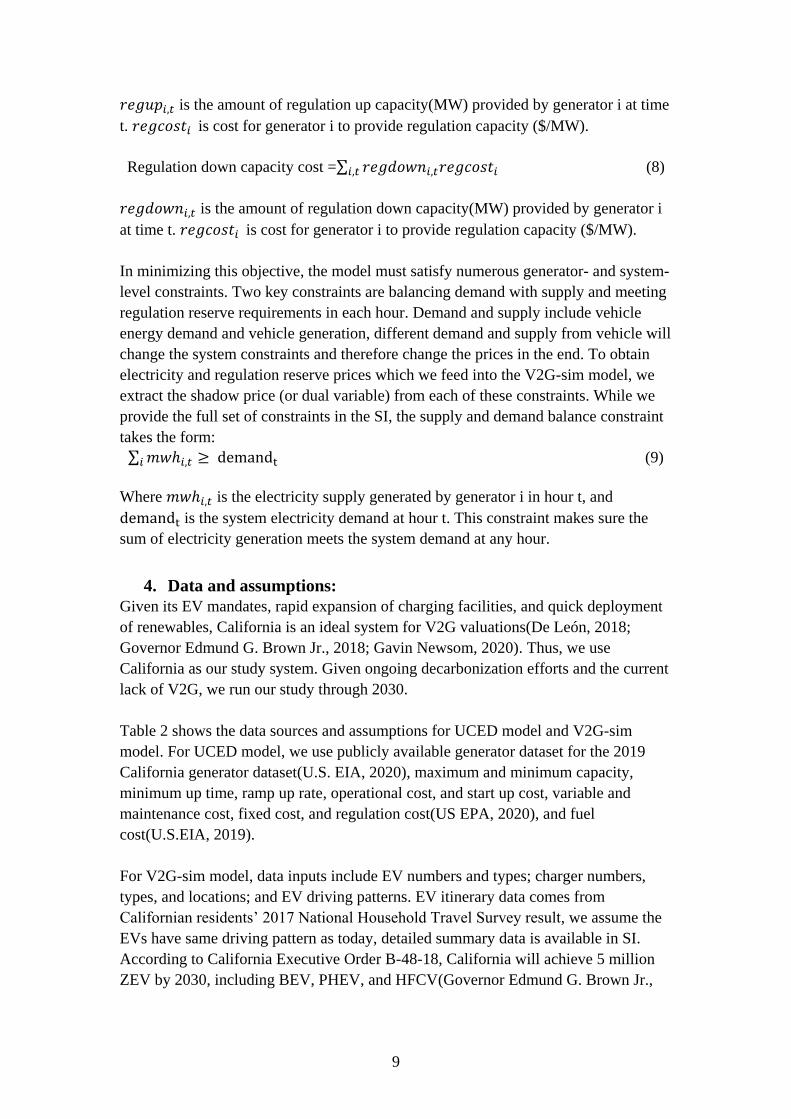
9
𝑟𝑒𝑔𝑢𝑝𝑖,𝑡 is the amount of regulation up capacity(MW) provided by generator i at time
t. 𝑟𝑒𝑔𝑐𝑜𝑠𝑡𝑖 is cost for generator i to provide regulation capacity ($/MW).
Regulation down capacity cost =∑ 𝑟𝑒𝑔𝑑𝑜𝑤𝑛𝑖,𝑡𝑟𝑒𝑔𝑐𝑜𝑠𝑡𝑖𝑖,𝑡 (8)
𝑟𝑒𝑔𝑑𝑜𝑤𝑛𝑖,𝑡 is the amount of regulation down capacity(MW) provided by generator i
at time t. 𝑟𝑒𝑔𝑐𝑜𝑠𝑡𝑖 is cost for generator i to provide regulation capacity ($/MW).
In minimizing this objective, the model must satisfy numerous generator- and system-
level constraints. Two key constraints are balancing demand with supply and meeting
regulation reserve requirements in each hour. Demand and supply include vehicle
energy demand and vehicle generation, different demand and supply from vehicle will
change the system constraints and therefore change the prices in the end. To obtain
electricity and regulation reserve prices which we feed into the V2G-sim model, we
extract the shadow price (or dual variable) from each of these constraints. While we
provide the full set of constraints in the SI, the supply and demand balance constraint
takes the form:
∑ 𝑚𝑤ℎ𝑖,𝑡𝑖 ≥ demandt (9)
Where 𝑚𝑤ℎ𝑖,𝑡 is the electricity supply generated by generator i in hour t, and
demandt is the system electricity demand at hour t. This constraint makes sure the
sum of electricity generation meets the system demand at any hour.
4. Data and assumptions:
Given its EV mandates, rapid expansion of charging facilities, and quick deployment
of renewables, California is an ideal system for V2G valuations(De León, 2018;
Governor Edmund G. Brown Jr., 2018; Gavin Newsom, 2020). Thus, we use
California as our study system. Given ongoing decarbonization efforts and the current
lack of V2G, we run our study through 2030.
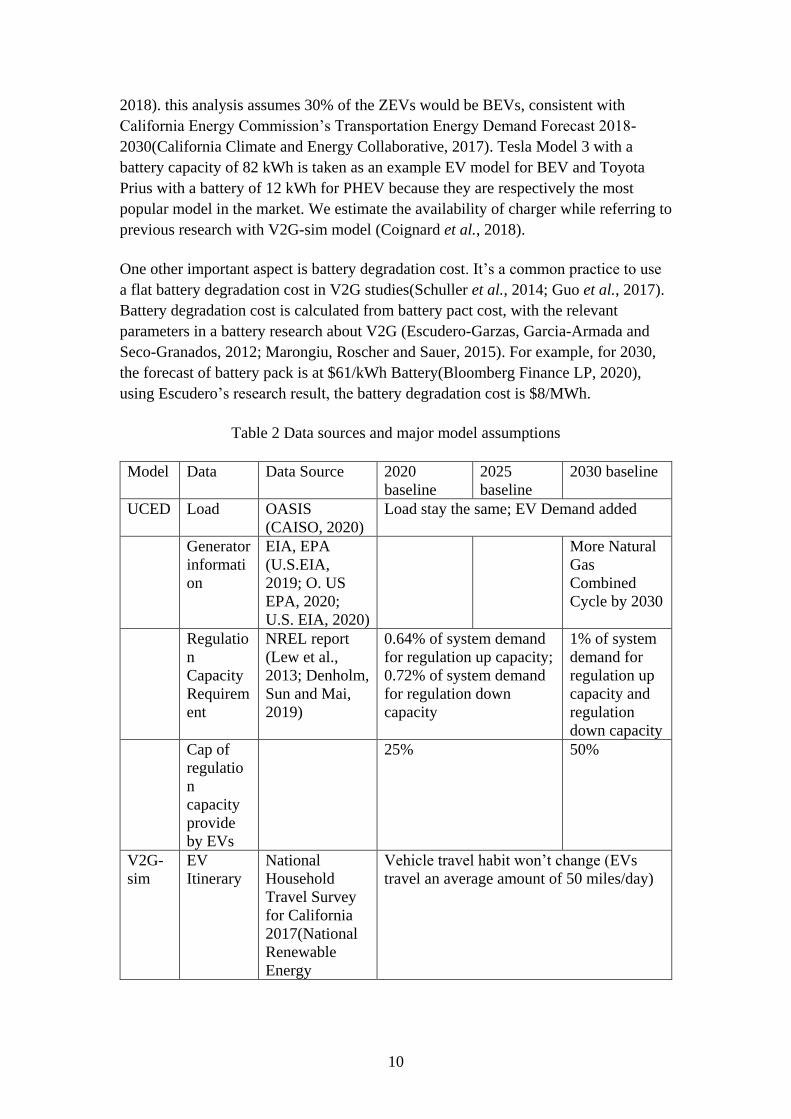
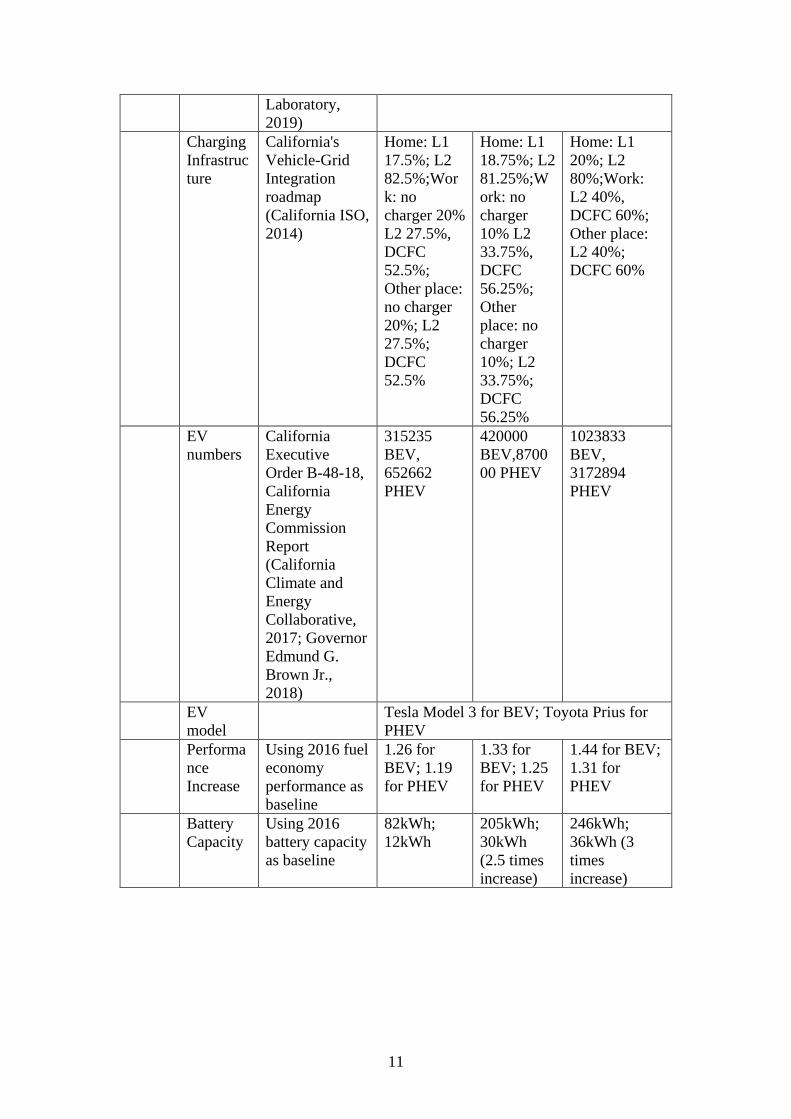
Table 2 shows the data sources and assumptions for UCED model and V2G-sim
model. For UCED model, we use publicly available generator dataset for the 2019
California generator dataset(U.S. EIA, 2020), maximum and minimum capacity,
minimum up time, ramp up rate, operational cost, and start up cost, variable and
maintenance cost, fixed cost, and regulation cost(US EPA, 2020), and fuel
cost(U.S.EIA, 2019).
For V2G-sim model, data inputs include EV numbers and types; charger numbers,
types, and locations; and EV driving patterns. EV itinerary data comes from
Californian residents’ 2017 National Household Travel Survey result, we assume the
EVs have same driving pattern as today, detailed summary data is available in SI.
According to California Executive Order B-48-18, California will achieve 5 million
ZEV by 2030, including BEV, PHEV, and HFCV(Governor Edmund G. Brown Jr.,
10
2018). this analysis assumes 30% of the ZEVs would be BEVs, consistent with
California Energy Commission’s Transportation Energy Demand Forecast 2018-
2030(California Climate and Energy Collaborative, 2017). Tesla Model 3 with a
battery capacity of 82 kWh is taken as an example EV model for BEV and Toyota
Prius with a battery of 12 kWh for PHEV because they are respectively the most
popular model in the market. We estimate the availability of charger while referring to
previous research with V2G-sim model (Coignard et al., 2018).
One other important aspect is battery degradation cost. It’s a common practice to use
a flat battery degradation cost in V2G studies(Schuller et al., 2014; Guo et al., 2017).
Battery degradation cost is calculated from battery pact cost, with the relevant
parameters in a battery research about V2G (Escudero-Garzas, Garcia-Armada and
Seco-Granados, 2012; Marongiu, Roscher and Sauer, 2015). For example, for 2030,
the forecast of battery pack is at $61/kWh Battery(Bloomberg Finance LP, 2020),
using Escudero’s research result, the battery degradation cost is $8/MWh.
Table 2 Data sources and major model assumptions
Model Data Data Source 2020
baseline
2025
baseline
2030 baseline
UCED Load OASIS
(CAISO, 2020)
Load stay the same; EV Demand added
Generator
informati
on
EIA, EPA
(U.S.EIA,
2019; O. US
EPA, 2020;
U.S. EIA, 2020)
More Natural
Gas
Combined
Cycle by 2030
Regulatio
n
Capacity
Requirem
ent
NREL report
(Lew et al.,
2013; Denholm,
Sun and Mai,
2019)
0.64% of system demand
for regulation up capacity;
0.72% of system demand
for regulation down
capacity
1% of system
demand for
regulation up
capacity and
regulation
down capacity
Cap of
regulatio
n
capacity
provide
by EVs
25%
50%
V2G-
sim
EV
Itinerary
National
Household
Travel Survey
for California
2017(National
Renewable
Energy
Vehicle travel habit won’t change (EVs
travel an average amount of 50 miles/day)
11
Laboratory,
2019)
Charging
Infrastruc
ture
California's
Vehicle-Grid
Integration
roadmap
(California ISO,
2014)
Home: L1
17.5%; L2
82.5%;Wor
k: no
charger 20%
L2 27.5%,
DCFC
52.5%;
Other place:
no charger
20%; L2
27.5%;
DCFC
52.5%
Home: L1
18.75%; L2
81.25%;W
ork: no
charger
10% L2
33.75%,
DCFC
56.25%;
Other
place: no
charger
10%; L2
33.75%;
DCFC
56.25%
Home: L1
20%; L2
80%;Work:
L2 40%,
DCFC 60%;
Other place:
L2 40%;
DCFC 60%
EV
numbers
California
Executive
Order B-48-18,
California
Energy
Commission
Report
(California
Climate and
Energy
Collaborative,
2017; Governor
Edmund G.
Brown Jr.,
2018)
315235
BEV,
652662
PHEV
420000
BEV,8700
00 PHEV
1023833
BEV,
3172894
PHEV
EV
model
Tesla Model 3 for BEV; Toyota Prius for
PHEV
Performa
nce
Increase
Using 2016 fuel
economy
performance as
baseline
1.26 for
BEV; 1.19
for PHEV
1.33 for
BEV; 1.25
for PHEV
1.44 for BEV;
1.31 for
PHEV
Battery
Capacity
Using 2016
battery capacity
as baseline
82kWh;
12kWh
205kWh;
30kWh
(2.5 times
increase)
246kWh;
36kWh (3
times
increase)
12
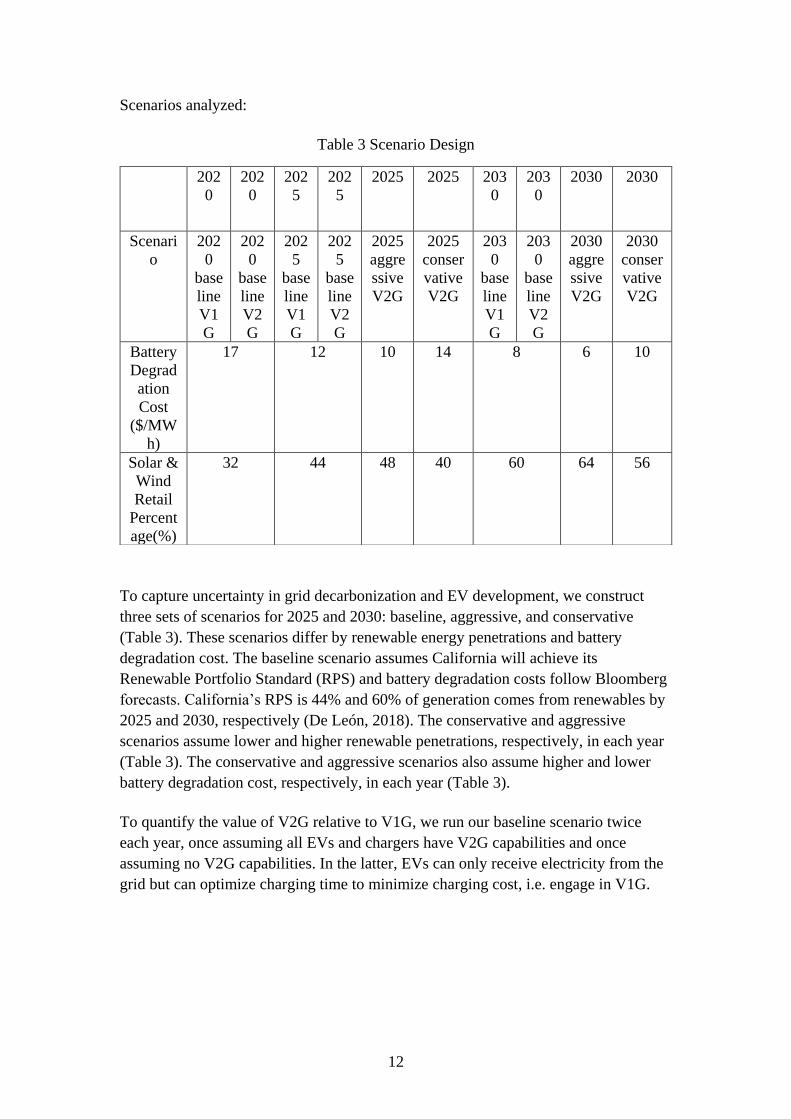
Scenarios analyzed:
Table 3 Scenario Design
To capture uncertainty in grid decarbonization and EV development, we construct
three sets of scenarios for 2025 and 2030: baseline, aggressive, and conservative
(Table 3). These scenarios differ by renewable energy penetrations and battery
degradation cost. The baseline scenario assumes California will achieve its
Renewable Portfolio Standard (RPS) and battery degradation costs follow Bloomberg
forecasts. California’s RPS is 44% and 60% of generation comes from renewables by
2025 and 2030, respectively (De León, 2018). The conservative and aggressive
scenarios assume lower and higher renewable penetrations, respectively, in each year
(Table 3). The conservative and aggressive scenarios also assume higher and lower
battery degradation cost, respectively, in each year (Table 3).
To quantify the value of V2G relative to V1G, we run our baseline scenario twice
each year, once assuming all EVs and chargers have V2G capabilities and once
assuming no V2G capabilities. In the latter, EVs can only receive electricity from the
grid but can optimize charging time to minimize charging cost, i.e. engage in V1G.
202
0
202
0
202
5
202
5
2025 2025 203
0
203
0
2030 2030
Scenari
o
202
0
base
line
V1
G
202
0
base
line
V2
G
202
5
base
line
V1
G
202
5
base
line
V2
G
2025
aggre
ssive
V2G
2025
conser
vative
V2G
203
0
base
line
V1
G
203
0
base
line
V2
G
2030
aggre
ssive
V2G
2030
conser
vative
V2G
Battery
Degrad
ation
Cost
($/MW
h)
17 12 10 14 8 6 10
Solar &
Wind
Retail
Percent
age(%)
32 44 48 40 60 64 56
13
Results
We first present EV and power system results for our baseline scenario, then test the
sensitivity of our results to our aggressive and conservative scenarios.
1. Value of V2G Versus V1G in the baseline Scenario
Fleet-Wide Results
This section compares V1G and V2G in the baseline scenario. Total annual net
revenues of V1G are negative in each year, but increase from 2020 to 2030. V1G total
annual net revenue in 2020, 2025, and 2030 are $ -63.2, $-57.3, and $-45.5,
respectively. Total annual net revenue of V2G first increased and then decreased from
2020 to 2030. V2G total annual net revenue in 2020, 2025, and 2030 are $-23.1, $ -
9.8, and $-13.8, respectively.
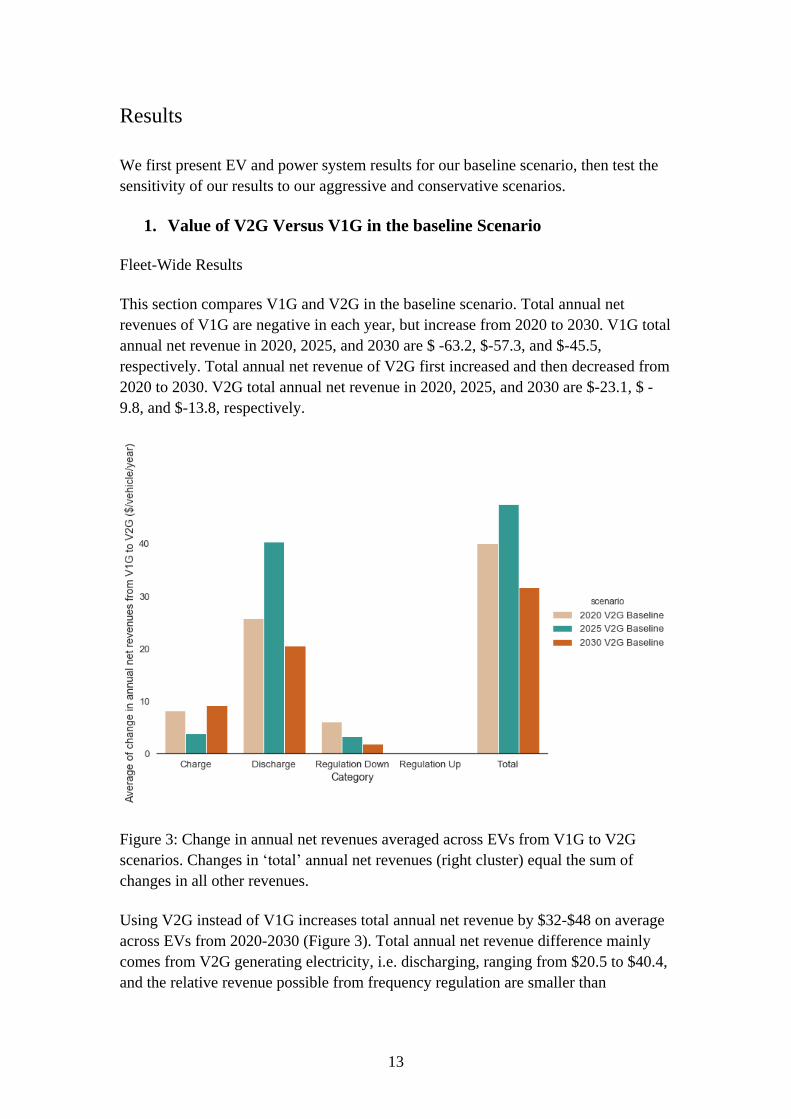
Figure 3: Change in annual net revenues averaged across EVs from V1G to V2G
scenarios. Changes in ‘total’ annual net revenues (right cluster) equal the sum of
changes in all other revenues.
Using V2G instead of V1G increases total annual net revenue by $32-$48 on average
across EVs from 2020-2030 (Figure 3). Total annual net revenue difference mainly
comes from V2G generating electricity, i.e. discharging, ranging from $20.5 to $40.4,
and the relative revenue possible from frequency regulation are smaller than
14
discharging. Total annual net revenue first increases and then drops from 2020 to
2030 due to a large increase in discharge revenue from 2020 to 2025, which we
further explore below. V2G net revenues from charging also increase, i.e. cost less,
than V1G on the order of $5-10 on average across vehicles (Figure 3), the reason is
discussed in Figure 4. V2G also enables net revenues from providing regulation
down, but these revenues decline from roughly $8-$2 on average across vehicles from
2020-2030.
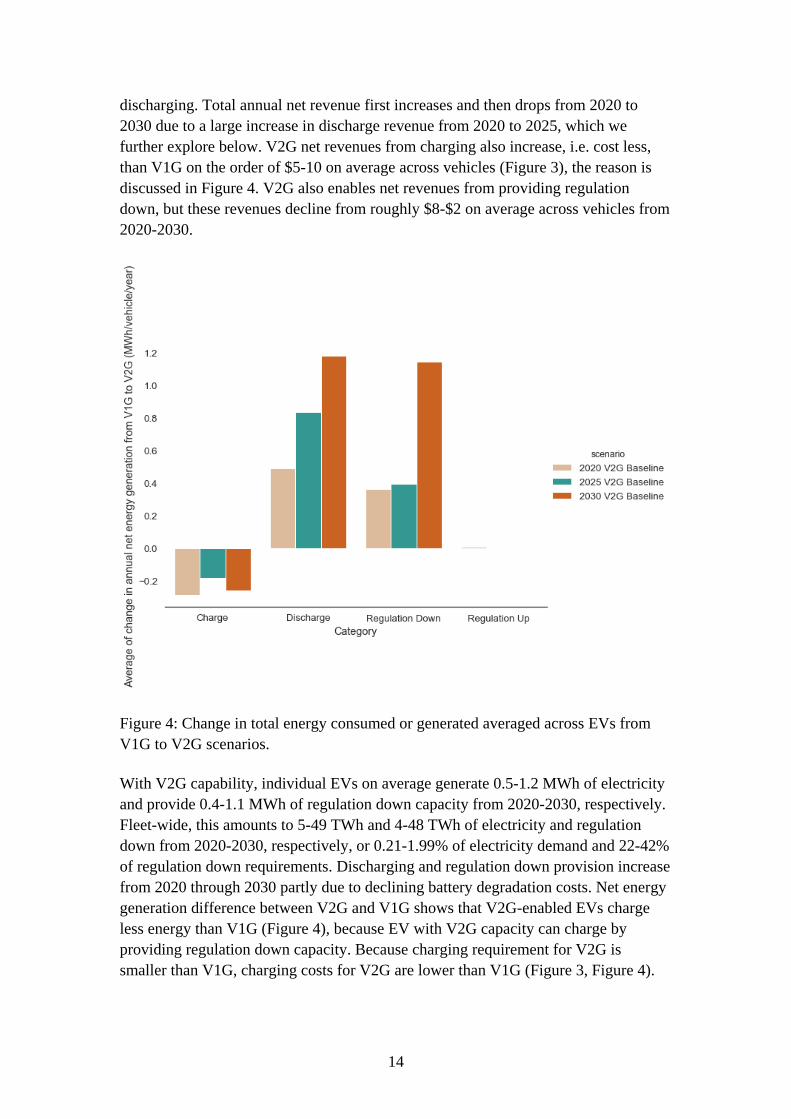
Figure 4: Change in total energy consumed or generated averaged across EVs from
V1G to V2G scenarios.
With V2G capability, individual EVs on average generate 0.5-1.2 MWh of electricity
and provide 0.4-1.1 MWh of regulation down capacity from 2020-2030, respectively.
Fleet-wide, this amounts to 5-49 TWh and 4-48 TWh of electricity and regulation
down from 2020-2030, respectively, or 0.21-1.99% of electricity demand and 22-42%
of regulation down requirements. Discharging and regulation down provision increase
from 2020 through 2030 partly due to declining battery degradation costs. Net energy
generation difference between V2G and V1G shows that V2G-enabled EVs charge
less energy than V1G (Figure 4), because EV with V2G capacity can charge by
providing regulation down capacity. Because charging requirement for V2G is
smaller than V1G, charging costs for V2G are lower than V1G (Figure 3, Figure 4).
15
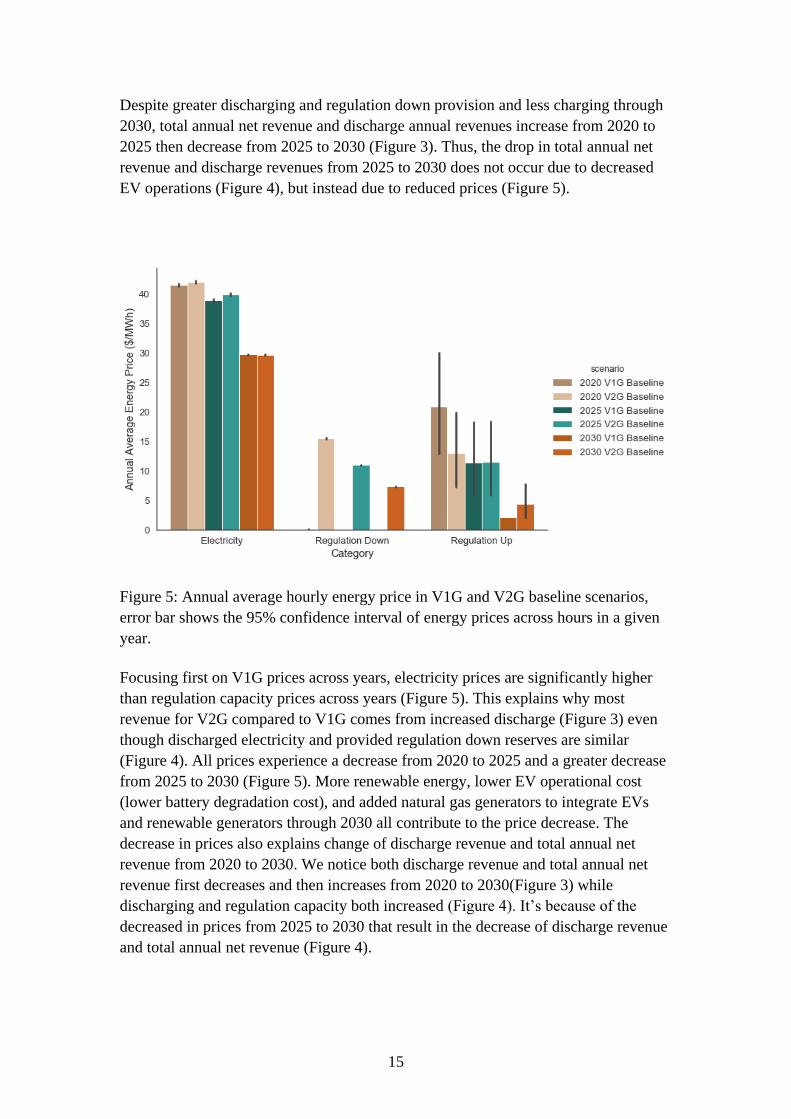
Despite greater discharging and regulation down provision and less charging through
2030, total annual net revenue and discharge annual revenues increase from 2020 to
2025 then decrease from 2025 to 2030 (Figure 3). Thus, the drop in total annual net
revenue and discharge revenues from 2025 to 2030 does not occur due to decreased
EV operations (Figure 4), but instead due to reduced prices (Figure 5).
Figure 5: Annual average hourly energy price in V1G and V2G baseline scenarios,
error bar shows the 95% confidence interval of energy prices across hours in a given
year.
Focusing first on V1G prices across years, electricity prices are significantly higher
than regulation capacity prices across years (Figure 5). This explains why most
revenue for V2G compared to V1G comes from increased discharge (Figure 3) even
though discharged electricity and provided regulation down reserves are similar
(Figure 4). All prices experience a decrease from 2020 to 2025 and a greater decrease
from 2025 to 2030 (Figure 5). More renewable energy, lower EV operational cost
(lower battery degradation cost), and added natural gas generators to integrate EVs
and renewable generators through 2030 all contribute to the price decrease. The
decrease in prices also explains change of discharge revenue and total annual net
revenue from 2020 to 2030. We notice both discharge revenue and total annual net
revenue first decreases and then increases from 2020 to 2030(Figure 3) while
discharging and regulation capacity both increased (Figure 4). It’s because of the
decreased in prices from 2025 to 2030 that result in the decrease of discharge revenue
and total annual net revenue (Figure 4).
16
Regulation down capacity prices with V2G are higher than prices with V1G (Figure
5). The operational cost for EV to provide regulation down capacity is the battery
degradation cost. EV’s battery degradation cost ($ 8-17/MW) is higher than most
other generators’ cost to provide regulation down capacity. For example, geothermal
generators have an average marginal cost to provide regulation capacity at
$0.003/MW. In all 3 years, V2G set the marginal cost for regulation down for 91%
hours, meaning the grid system would prefer to deploy V2G to provide regulation
down capacity and deploy other generator for regulation up capacity.
2. Individual EV Results
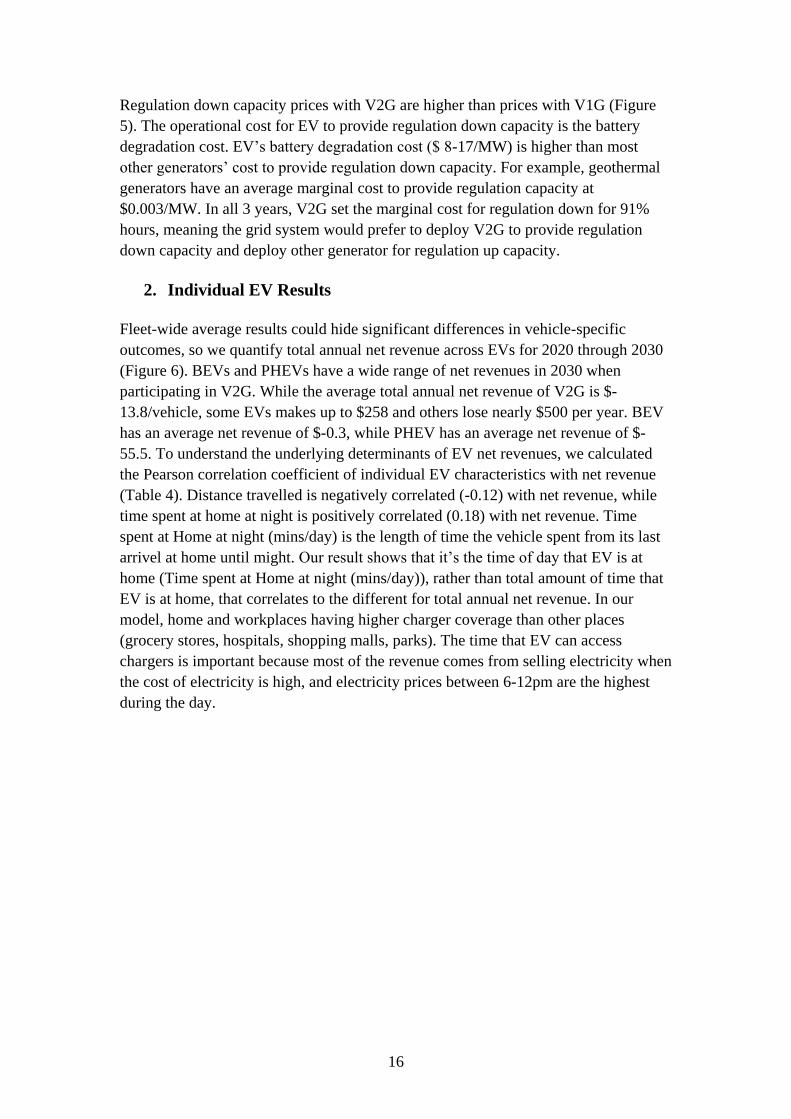
Fleet-wide average results could hide significant differences in vehicle-specific
outcomes, so we quantify total annual net revenue across EVs for 2020 through 2030
(Figure 6). BEVs and PHEVs have a wide range of net revenues in 2030 when
participating in V2G. While the average total annual net revenue of V2G is $-
13.8/vehicle, some EVs makes up to $258 and others lose nearly $500 per year. BEV
has an average net revenue of $-0.3, while PHEV has an average net revenue of $-
55.5. To understand the underlying determinants of EV net revenues, we calculated
the Pearson correlation coefficient of individual EV characteristics with net revenue
(Table 4). Distance travelled is negatively correlated (-0.12) with net revenue, while
time spent at home at night is positively correlated (0.18) with net revenue. Time
spent at Home at night (mins/day) is the length of time the vehicle spent from its last
arrivel at home until might. Our result shows that it’s the time of day that EV is at
home (Time spent at Home at night (mins/day)), rather than total amount of time that
EV is at home, that correlates to the different for total annual net revenue. In our
model, home and workplaces having higher charger coverage than other places
(grocery stores, hospitals, shopping malls, parks). The time that EV can access
chargers is important because most of the revenue comes from selling electricity when
the cost of electricity is high, and electricity prices between 6-12pm are the highest
during the day.
17
Figure 6: Total annual net revenue of individual EV in 2030 V2G baseline scenario
Table 4 Correlation between daily average EV travel characteristics and annual net
revenue in 2030 V2G baseline scenario. A correlation coefficient between 0.1 to 0.3 is
considered a small association, correlation coefficient smaller than 0.1 is considered
negligible (Schober, Boer and Schwarte, 2018).
Time
spent at
Home at
night
(mins/da
y)
Distance
Travelle
d
(miles/da
y)
Time spent at
Home(mins/d
ay)
Time Spent
on
Road(miles/d
ay)
Time Spent
at
Work(mins/d
ay)
Net
Revenue($/y
ear)
0.18 -0.12 0.01 -0.093 0.016
3. Scenario Analysis
To test the robustness of our results to uncertainty in future renewable penetrations
and EV development, we conduct a scenario analysis. The aggressive scenario for
each year means higher renewable and lower battery cost than baseline, while
conservative scenario means lower renewable and higher battery cost than baseline.
18
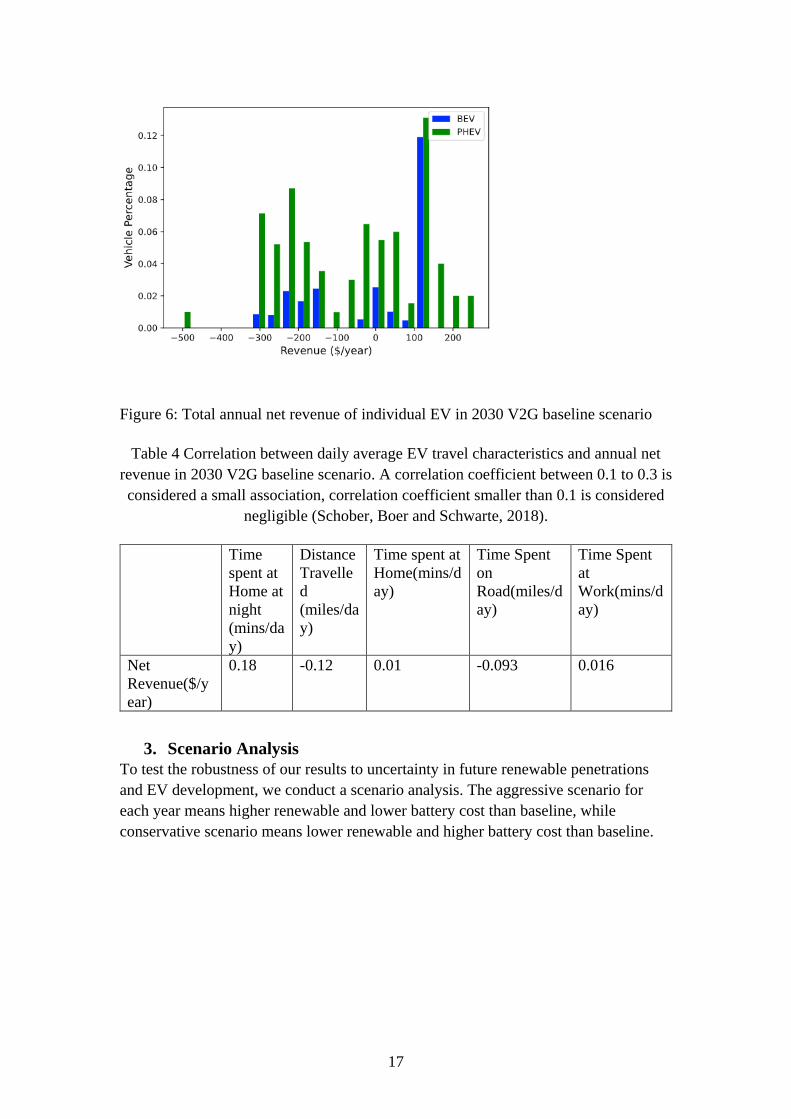
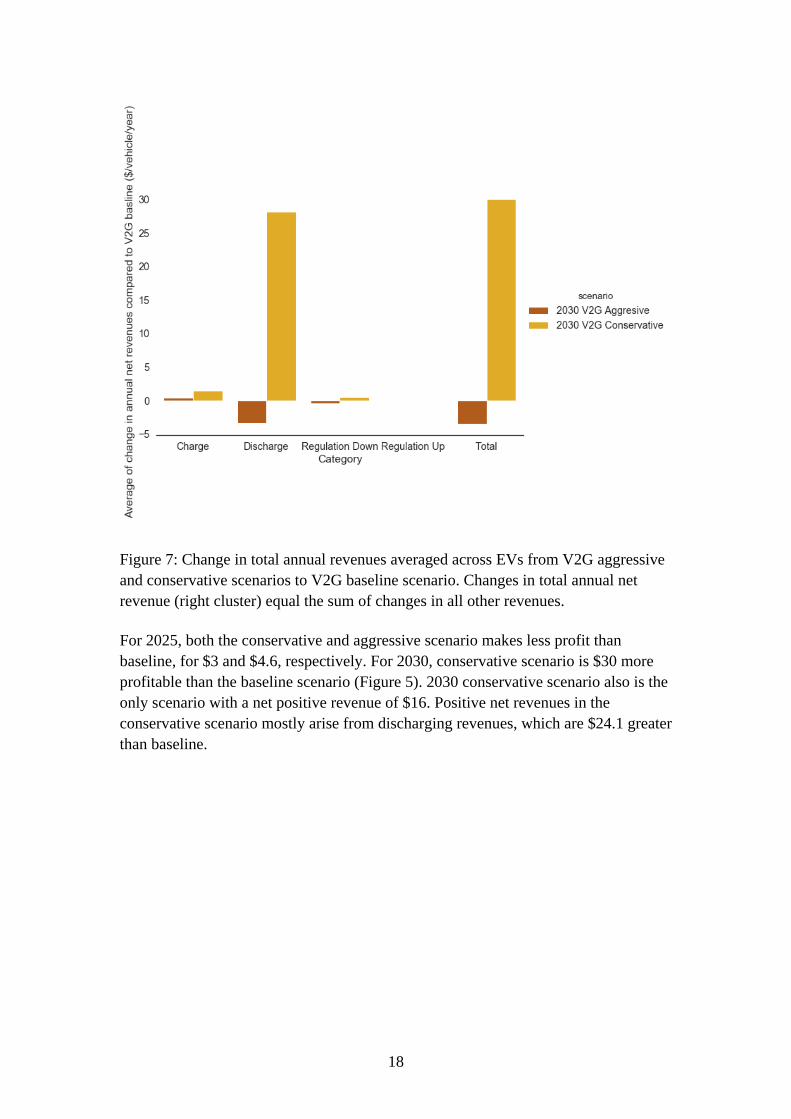
Figure 7: Change in total annual revenues averaged across EVs from V2G aggressive
and conservative scenarios to V2G baseline scenario. Changes in total annual net
revenue (right cluster) equal the sum of changes in all other revenues.
For 2025, both the conservative and aggressive scenario makes less profit than
baseline, for $3 and $4.6, respectively. For 2030, conservative scenario is $30 more
profitable than the baseline scenario (Figure 5). 2030 conservative scenario also is the
only scenario with a net positive revenue of $16. Positive net revenues in the
conservative scenario mostly arise from discharging revenues, which are $24.1 greater
than baseline.

19
Figure 8: Change in total energy consumed or generated averaged across EVs from
V2G aggressive and conservative scenarios to V2G baseline scenario.
2030 conservative scenario provide significantly more discharge and regulation down
capacity (Figure 8). We found that in three 2030 scenarios, the sum of wind, EVs, and
solar are roughly the same. From aggressive to baseline to conservative scenario, as
renewable decrease, EV’s percentage increase from 0.01% to 3% because EV’s
operational cost, which equally to its battery degradation cost from operation, is more
expensive than solar and wind but cheaper than others energy source. That explains
why in 2030 conservative scenario, V2G creates more energy than 2030 baseline or
2030 aggressive scenarios. In conclusion, lower renewable leaves more room for EV
to generate energy and produce revenue.
Conclusions
In order to understand the future value of charge management technology, we use a
co-simulation platform of EV and grid operations to analyze the value of V1G and
V2G. We found the annual economic value of V2G to be around several dozen
dollars. V2G are more profitable than V1G, but the value of V2G and V1G will
increase from 2020 to 2030. Most V2G revenue comes from selling electricity instead
of providing regulation capacity. V2G are valuable to the grid by providing
20
significant amount of generation capacity and regulation capacity, but higher
renewable in the grid does not necessarily mean higher value of V2G.
Most prior research find that the value of V2G range from hundreds to thousands of
dollars. This difference can be explained by two key differences in methods: (1) we
optimize future grid operations so we capture price changes (Figure 5) and (2) we
include millions of EVs so we capture their effect on prices. Conversely, previous
research does not consider whether the electricity or frequency regulation service
would actually be dispatched by grid operator, does not consider how EVs will affect
prices, and often only model 1-10 EVs(Peterson, Whitacre and Apt, 2010; Agarwal,
Peng and Goel, 2014; Pelzer et al., 2014; Zeng, Gibeau and Chow, 2015; Li et al.,
2020). To test the effect of ignoring interactions between power market prices and EV
operations, we run our baseline scenario for only one EV. We find the annual net
revenue of the vehicle to be $2,190, $1,850, and $1,360 in 2020, 2025, and 2030,
respectively, in the V2G baseline scenario. These values are in line with previously
reported values (Peterson, Whitacre and Apt, 2010; Agarwal, Peng and Goel, 2014;
Pelzer et al., 2014; Zeng, Gibeau and Chow, 2015; Li et al., 2020). However, these
values are significantly greater than our average annual V2G revenues of $-23
through $ -10 from our baseline scenario with millions of EVs. Thus, capturing
interactions between power market prices and EV operations are the main reasons our
economic value result is smaller than the other research. It’s essential to include
power market prices interations with EV operations to avoid overestimating the value
of V2G.
While we found V2G is more profitable than V1G in all scenarios, both would cost
less in regard to fuel consumption compared to their internal combustion engine (ICE)
counterparts. The average annual net revenue for V1G and V2G ranges from -$9.8 to
$63.2 from 2020 to 2030. In contrast, we estimate an ICE vehicle with the same
driving pattern and energy consumption in California will spend roughly $2,800 for
gas annually (AAA, 2018). This difference might be able to nudge vehicle purchase
behavior towards EVs. On the other hand, for people who already owns EVs, there is
a small economic incentive to participate in V2G revenue. Moreover, because V2G
revenues vary widely among EVs, EVs with certain travel patterns can expect to
exploit this opportunity more than the others. For example, we found EVs that arrive
at home early in the afternoon can generate greater revenues by exploiting high prices
in the early evening.
V2G are valuable to the grid. Previous studies show that V2G can provide more
flexibility to grid by providing ramping up and ramping down capacity (Coignard et
al., 2018). Our study shows that V2G can also provide a significant amount of
generation and regulation down capacity. However, we also found that grids with
higher renewable penetration do not necessarily create more economic value for V2G.
In particular, relative to the baseline scenario, V2G net revenues are higher in 2030 in
21
our conservative scenario, which has less renewables and higher battery costs than the
baseline scenario. This suggests a trade-off exists between developing renewables and
incentivizing EV to participate in grid operation through V2G. This poses a challenge
to policymakers to craft policies that benefit renewables and V2G.
This research shows the value of V2G and V1G and how the value would change in
the future with change renewable penetration and battery degradation costs. Our
research has several limitations. First, our co-simulation platform optimizes
operations of the grid and V2G-sim. Future research should expand this co-simulation
framework to endogenize generator investment decisions. Second, our research made
certain assumptions around charger availability in the future and found it to be
impactful in the value of V1G and V2G. Research on how accessibility of charging
stations at home, work, and other locations would change EVs charging behavior
would be helpful to fill in the gap. Third, our research targeted light duty passenger
EVs but does not include commercial EVs fleet. However, the development of V2G is
more prevalent and face less challenges for commercial EVs. Most pilot projects in
the US for V2G are for commercial medium and heavy duty EVs fleet. They usually
have pre-defined schedule and more certainty around when and where they will be
able to connect to the grid and provide energy services, they also tend to have bigger
battery pack capacity and can provide more energy with a relative small fleet (Gnann,
Klingler and Kühnbach, 2018). More studies into the value for commercial EVs can
be of particular interest for future research. These studies could leverage our co-
simulation platform to model EV and grid operations, thereby capturing key
interactions between the two and properly valuing V2G in commercial EVs.
Reference
AAA (2018) AAA Gas Prices, AAA Gas Prices. Available at:
https://gasprices.aaa.com/state-gas-price-averages/ (Accessed: 19 April 2021).
Agarwal, L., Peng, W. and Goel, L. (2014) ‘Using EV battery packs for vehicle-to-
grid applications: An economic analysis’, 2014 IEEE Innovative Smart Grid
Technologies - Asia, ISGT ASIA 2014, pp. 663–668. doi: 10.1109/ISGT-
Asia.2014.6873871.
Argonne National Laboratory (2021) Light Duty Electric Drive Vehicles Monthly
Sales Updates . Available at: https://www.anl.gov/es/light-duty-electric-drive-
vehicles-monthly-sales-updates (Accessed: 27 April 2021).
Bashash, S. et al. (2011) ‘Plug-in hybrid electric vehicle charge pattern optimization
for energy cost and battery longevity’, Journal of Power Sources. doi:
10.1016/j.jpowsour.2010.07.001.
22
Bhandari, V., Sun, K. and Homans, F. (2018) ‘The profitability of vehicle to grid for
system participants - A case study from the Electricity Reliability Council of Texas’,
Energy. doi: 10.1016/j.energy.2018.04.038.
Black, D. et al. (2018) Los Angeles Air Force Base Vehicle-to-Grid Demostration.
Bloomberg Finance LP, T. (2020) Electric vehicle outlook 2020. . Available at:
https://bnef.turtl.co/story/evo-2020/?teaser=yes (Accessed: 27 March 2021).
CAISO (2020) OASIS - OASIS Prod - PUBLIC - 0. Available at:
http://oasis.caiso.com/mrioasis/logon.do (Accessed: 23 April 2021).
California Climate and Energy Collaborative (2017) Report: Transportation Energy
Demand Forecast, 2018-2030 . Available at: https://eecoordinator.info/report-
transportation-energy-demand-forecast-2018-2030/ (Accessed: 28 April 2021).
California ISO (2014) California Vehicle-Grid integration (VGi) roadmap: Enabling
vehicle-based grid services February. Available at:
http://www.caiso.com/documents/vehicle-gridintegrationroadmap.pdf (Accessed: 27
March 2021).
Carrión, M. et al. (2019) ‘Scheduling isolated power systems considering electric
vehicles and primary frequency response’, Energy. doi:
10.1016/j.energy.2018.11.154.
Chen, J. et al. (2020) ‘Strategic integration of vehicle-to-home system with home
distributed photovoltaic power generation in Shanghai’, Applied Energy. doi:
10.1016/j.apenergy.2020.114603.
Coignard, J. et al. (2018) ‘Clean vehicles as an enabler for a clean electricity grid’,
Environmental Research Letters, 13(5). doi: 10.1088/1748-9326/aabe97.
Coignard, J. (2018) ‘Projected Electric Vehicle Hourly Loads for the 2017 California
Energy Demand Forecast’, (June).
Craig, M. T., Jaramillo, P. and Hodge, B. M. (2018) ‘Carbon dioxide emissions
effects of grid-scale electricity storage in a decarbonizing power system’,
Environmental Research Letters, 13(1), p. 014004. doi: 10.1088/1748-9326/aa9a78.
Das, R. et al. (2020) ‘Multi-objective techno-economic-environmental optimisation of
electric vehicle for energy services’, Applied Energy, 257(October 2019), p. 113965.
doi: 10.1016/j.apenergy.2019.113965.
23
Denholm, P., Sun, Y. and Mai, T. (2019) An Introduction to Grid Services: Concepts,
Technical Requirements, and Provision from Wind: Report Summary.
Donadee, J. et al. (2019) ‘Potential Benefits of Vehicle-to-Grid Technology in
California: High Value for Capabilities beyond One-Way Managed Charging’, IEEE
Electrification Magazine, 7(2), pp. 40–45. doi: 10.1109/MELE.2019.2908793.
Edenhofer, O. and et., al (2014) ‘Technical Summary In: Climate Change 2014:
Mitigation of Climate Change. Contribution of Working Group III to the Fifth
Assessment Report of the Intergovernmental Panel on Climate Change. Technical
Report’. Available at: http://www.ipcc.ch/pdf/assessment-
report/ar5/wg3/ipcc_wg3_ar5_technical-summary.pdf (Accessed: 22 April 2021).
EPA (2017) ‘Inventory of U.S. Greenhouse Gas Emissions and Sinks’, Journal of
Nursing Regulation.
EPA, U. (2020) Fast Facts on Transportation Greenhouse Gas Emissions. Available
at: https://www.epa.gov/greenvehicles/fast-facts-transportation-greenhouse-gas-
emissions (Accessed: 22 February 2021).
Escudero-Garzas, J. J., Garcia-Armada, A. and Seco-Granados, G. (2012) ‘Fair design
of plug-in electric vehicles aggregator for V2G regulation’, IEEE Transactions on
Vehicular Technology, 61(8), pp. 3406–3419. doi: 10.1109/TVT.2012.2212218.
Garcia, R., Freire, F. and Clift, R. (2018) ‘Effects on Greenhouse Gas Emissions of
Introducing Electric Vehicles into an Electricity System with Large Storage
Capacity’, Journal of Industrial Ecology. doi: 10.1111/jiec.12593.
Gavin Newsom (2020) EXECUTIVE ORDER N-79-20. Available at:
https://www.gov.ca.gov/wp-content/uploads/2020/09/9.23.20-EO-N-79-20-text.pdf
(Accessed: 28 April 2021).
Gnann, T., Klingler, A. L. and Kühnbach, M. (2018) ‘The load shift potential of plug-
in electric vehicles with different amounts of charging infrastructure’, Journal of
Power Sources. doi: 10.1016/j.jpowsour.2018.04.029.
Governor Edmund G. Brown Jr. (2018) Governor Brown Takes Action to Increase
Zero-Emission Vehicles, Fund New Climate Investments . Available at:
https://www.ca.gov/archive/gov39/2018/01/26/governor-brown-takes-action-to-
increase-zero-emission-vehicles-fund-new-climate-investments/index.html (Accessed:
28 April 2021).
Guo, Y. et al. (2017) ‘Bidding strategy for aggregators of electric vehicles in day-
24
ahead electricity markets’, Energies, 10(1). doi: 10.3390/en10010144.
Guo, Y. and Bashash, S. (2017) ‘Analyzing the impacts of Plug-in EVs on the
California power grid using quadratic programming and fixed-point iteration’,
Proceedings of the American Control Conference, pp. 2060–2065. doi:
10.23919/ACC.2017.7963256.
Gurobi Optimization, I. (2020) GUROBI OPTIMIZER REFERENCE MANUAL.
Hart, W. E. et al. (2017) Springer Optimization and Its Applications 67 Pyomo-
Optimization Modeling in Python Second Edition. Available at:
http://www.springer.com/series/7393 (Accessed: 27 April 2021).
Kempton, W. and Tomić, J. (2005) ‘Vehicle-to-grid power fundamentals: Calculating
capacity and net revenue’, Journal of Power Sources, 144(1), pp. 268–279. doi:
10.1016/j.jpowsour.2004.12.025.
Küfeoğlu, S. and Pollitt, M. G. (2019) ‘The impact of PVs and EVs on domestic
electricity network charges: A case study from Great Britain’, Energy Policy. doi:
10.1016/j.enpol.2018.12.012.
De León (2018) Bill Text - SB-100 California Renewables Portfolio Standard
Program: emissions of greenhouse gases. Available at:
https://leginfo.legislature.ca.gov/faces/billNavClient.xhtml?bill_id=201720180SB100
(Accessed: 28 April 2021).
Letendre, S. E. and Kempton, W. (2002) ‘The V2G concept: a new model for
power?’, Public Utilities Fornightly, 140(4), pp. 16–26. doi:
10.1177/003754979306000308.
Lew, D. et al. (2013) The Western Wind and Solar Integration Study Phase 2, NREL
(National Renewable Energy Laboratory). Available at: http://www.osti.gov/bridge
(Accessed: 27 March 2021).
Li, X. et al. (2020) ‘A cost-benefit analysis of V2G electric vehicles supporting peak
shaving in Shanghai’, Electric Power Systems Research. doi:
10.1016/j.epsr.2019.106058.
Liu, J. and Zhong, C. (2019) ‘An economic evaluation of the coordination between
electric vehicle storage and distributed renewable energy’, Energy. doi:
10.1016/j.energy.2019.07.151.
Luo, L. et al. (2020) ‘Coordinated allocation of distributed generation resources and
25
electric vehicle charging stations in distribution systems with vehicle-to-grid
interaction’, Energy. doi: 10.1016/j.energy.2019.116631.
Marongiu, A., Roscher, M. and Sauer, D. U. (2015) ‘Influence of the vehicle-to-grid
strategy on the aging behavior of lithium battery electric vehicles’, Applied Energy.
doi: 10.1016/j.apenergy.2014.06.063.
Meisel, S. and Merfeld, T. (2020) ‘Assessing the financial value of real-time energy
trading services for privately owned non-commercial electric vehicles’,
Transportation Research Part D: Transport and Environment. doi:
10.1016/j.trd.2020.102229.
National Renewable Energy Laboratory (2019) Transportation Secure Data Center.
Available at: www.nrel.gov/tsdc. (Accessed: 28 April 2021).
National Renewable Energy Laboratory (NREL) (2012) ‘Renewable Electricity
Futures Study’, U.S. Department of Energy. doi: NREL/TP-6A20-52409-1.
Nunes, P. and Brito, M. C. (2017) ‘Displacing natural gas with electric vehicles for
grid stabilization’, Energy. doi: 10.1016/j.energy.2017.09.064.
Ortega-Vazquez, M. A., Bouffard, F. and Silva, V. (2013) ‘Electric vehicle
aggregator/system operator coordination for charging scheduling and services
procurement’, IEEE Transactions on Power Systems, 28(2), pp. 1806–1815. doi:
10.1109/TPWRS.2012.2221750.
Pelzer, D. et al. (2014) ‘A price-responsive dispatching strategy for Vehicle-to-Grid:
An economic evaluation applied to the case of Singapore’, Journal of Power Sources,
256, pp. 345–353. doi: 10.1016/j.jpowsour.2014.01.076.
Peterson, S., Whitacre, J. and Apt, J. (2010) ‘The Economics of Using PHEV Battery
Packs for Grid Storage’, Journal of Power Sources, 195(8), pp. 2377–2384.
Schober, P., Boer, C. and Schwarte, L. A. (2018) ‘Correlation Coefficients’,
Anesthesia & Analgesia, 126(5), pp. 1763–1768. doi:
10.1213/ANE.0000000000002864.
Schuller, A. et al. (2014) ‘Charging strategies for battery electric vehicles: Economic
benchmark and V2G potential’, IEEE Transactions on Power Systems, 29(5), pp.
2014–2222. doi: 10.1109/TPWRS.2014.2301024.
Seel, J. et al. (2018) Impacts of High Variable Renewable Energy Futures on
Wholesale Electricity Prices, and on Electric-Sector Decision Making. Available at:
26
https://emp.lbl.gov/publications/impacts-high-variable-renewable (Accessed: 27 April
2021).
Sovacool, B. K. et al. (2018) ‘The neglected social dimensions to a vehicle-to-grid
(V2G) transition: A critical and systematic review’, Environmental Research Letters,
13(1). doi: 10.1088/1748-9326/aa9c6d.
Steward, D. (2017) ‘Critical Elements of Vehicle-to- Grid ( V2G ) Economics’, Nrel.
Trahand, M. (2017) ‘Nuvve V2G & deployments’, in. Presented at the 2nd Vehicle 2
Grid Conference, Electric Vehicles for the Renewable City, Amsterdam University of
Applied Sciences.
U.S. EIA (2020) Electricity Data. Available at:
https://www.eia.gov/electricity/data.php (Accessed: 23 April 2021).
U.S.EIA (2019) Annual Energy Outlook 2020. Available at:
https://www.eia.gov/outlooks/aeo/data/browser/#/?id=3-AEO2020®ion=1-
0&cases=ref2020~highogs~lowogs~hirencst~lorencst&start=2018&end=2050&f=A
&linechart=~~~~~ref2020-d112119a.36-3-AEO2020.1-0~highogs-d112619a.36-3-
AEO2020.1-0~lowogs-d112619a.36-3-AEO2020 (Accessed: 23 April 2021).
US EPA (2020) National Electric Energy Data System (NEEDS) v6. Available at:
https://www.epa.gov/airmarkets/national-electric-energy-data-system-needs-v6
(Accessed: 23 April 2021).
US EPA, O. (2020) ‘National Electric Energy Data System (NEEDS) v6’. Available
at: https://www.epa.gov/airmarkets/national-electric-energy-data-system-needs-v6
(Accessed: 23 April 2021).
V2G-Sim (no date). Available at: http://v2gsim.lbl.gov/home (Accessed: 22 February
2021).
Weis, A. et al. (2015) ‘Emissions and cost implications of controlled electric vehicle
charging in the U.S. PJM interconnection’, Environmental Science and Technology.
doi: 10.1021/es505822f.
Xiong, R., Cao, J. and Yu, Q. (2018) ‘Reinforcement learning-based real-time power
management for hybrid energy storage system in the plug-in hybrid electric vehicle’,
Applied Energy, 211(5), pp. 538–548. doi: 10.1016/j.apenergy.2017.11.072.
Yang, Q. et al. (2020) ‘An improved vehicle to the grid method with battery longevity
management in a microgrid application’, Energy, 198, p. 117374. doi:
27
10.1016/j.energy.2020.117374.
Zeng, W., Gibeau, J. and Chow, M. Y. (2015) ‘Economic benefits of plug-in electric
vehicles using V2G for grid performance-based regulation service’, IECON 2015 -
41st Annual Conference of the IEEE Industrial Electronics Society, pp. 4322–4327.
doi: 10.1109/IECON.2015.7392772.
Zhou, Z., Levin, T. and Conzelmann, G. (2016) ‘Survey of U.S. Ancillary Services
Markets’, p. 59.
Zhu, X., Xia, M. and Chiang, H. D. (2018) ‘Coordinated sectional droop charging
control for EV aggregator enhancing frequency stability of microgrid with high
penetration of renewable energy sources’, Applied Energy. doi:
10.1016/j.apenergy.2017.07.087.

28
Supportive Information
SI.1: Unit Commitment and Economic Dispatch Model Formulation
This section provides the formulation of the Unit Commitment and Economic
Dispatch Model that we used to determine vehicle dispatch and energy prices. The
optimization used “pyomo” to formulate optimization models and used “gurobi” as
the solver.
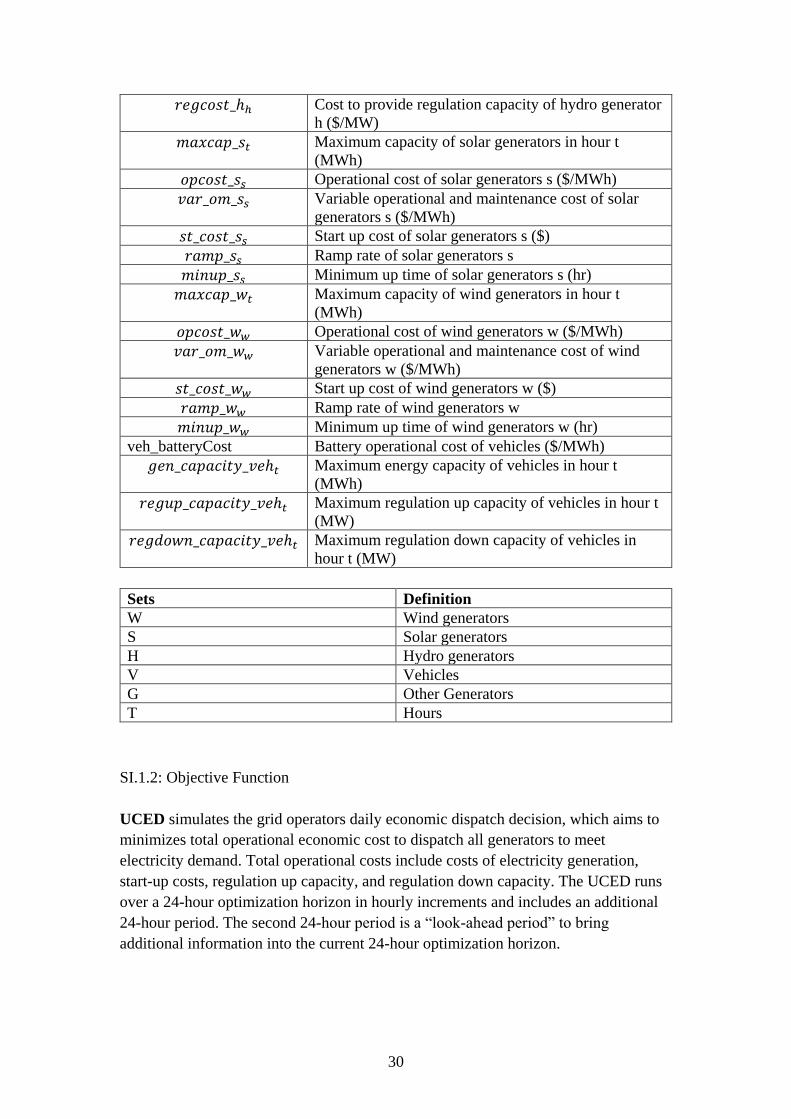
SI.1.1: Definition of Variables, Parameters, and Sets
Variables Definition
mwhg,t Energy generated by generator g in hour t (MWh)
𝑟𝑒𝑔𝑢𝑝g,t Amount of regulation up capacity provided by
generator g in hour t (MW)
𝑟𝑒𝑔𝑑𝑜𝑤𝑛g,t Amount of regulation down capacity provided by
generator g in hour t (MW)
𝑜𝑛g,t Condition of generator g in hour t, 1 means the unit is
on, 0 means the unit is off
𝑠𝑤𝑖𝑡𝑐ℎg,t If generator g is switching on in hour t, 1 means the
unit is switching on, 0 means otherwise
mwh_hℎ,t Energy generated by hydro generator h in hour t
(MWh)
𝑟𝑒𝑔𝑢𝑝_ℎh,t Amount of regulation up capacity provided by hydro
generator h in hour t (MW)
𝑟𝑒𝑔𝑑𝑜𝑤𝑛_ℎℎ,t Amount of regulation down capacity provided by
hydro generator h in hour t (MW)
𝑜𝑛_ℎℎ,t Condition of hydro generator h in hour t, 1 means the
unit is on, 0 means the unit is off
𝑠𝑤𝑖𝑡𝑐ℎ_ℎℎ,t If hydro generator h is switching on in hour t, 1 means
the unit is switching on, 0 means otherwise
mwh_s𝑠,t Energy generated by solar generators s in hour t
(MWh)
𝑟𝑒𝑔𝑢𝑝_𝑠𝑠,t Amount of regulation up capacity provided by solar
generators s in hour t (MW)
𝑟𝑒𝑔𝑑𝑜𝑤𝑛_𝑠𝑠,t Amount of regulation down capacity provided by solar
generators s in hour t (MW)
𝑜𝑛_𝑠𝑠,t Condition of solar generators s in hour t, 1 means the
unit is on, 0 means the unit is off
𝑠𝑤𝑖𝑡𝑐ℎ_𝑠𝑠,t If solar generators s is switching on in hour t, 1 means
the unit is switching on, 0 means otherwise
mwh_w𝑤,t Energy generated by wind generators w in hour t
(MWh)
𝑟𝑒𝑔𝑢𝑝_𝑤𝑤,t Amount of regulation up capacity provided by wind
generators w in hour t (MW)

29
𝑟𝑒𝑔𝑑𝑜𝑤𝑛_𝑤𝑤,t Amount of regulation down capacity provided by wind
generators w in hour t (MW)
𝑜𝑛_𝑤𝑤,t Condition of wind generators w in hour t, 1 means the
unit is on, 0 means the unit is off
𝑠𝑤𝑖𝑡𝑐ℎ_𝑤𝑤,t If wind generators w is switching on in hour t, 1 means
the unit is switching on, 0 means otherwise
mwh_veht Energy generated by vehicles in hour t (MWh)
𝑟𝑒𝑔𝑢𝑝_𝑣𝑒ℎt Amount of regulation up capacity provided by
vehicles in hour t (MW)
𝑟𝑒𝑔𝑑𝑜𝑤𝑛_𝑣𝑒ℎt Amount of regulation down capacity provided by
vehicles in hour t (MW)
Parameters Definition
t Horizon Hours Range
demand𝑡 Hourly demand during planning horizon hour range
regup_margin Percentage of regulation up capacity requirement to
demand
regdown_margin Percentage of regulation down capacity requirement
to demand
cap The cap of regulation capacity provided by vehicle
ini_on𝑔 Initial condition for generator g, 0 if generator is
offline, 1 if generator is online. Initial value is 0
ini_mwh𝑔 Initial energy provided by generator g. Initial value is
0
𝑚𝑎𝑥𝑐𝑎𝑝𝑔 Maximum capacity of generator g (MWh)
𝑚𝑖𝑛𝑐𝑎𝑝𝑔 Minimum capacity of generator g (MWh)
𝑜𝑝𝑐𝑜𝑠𝑡𝑔 Operational cost of generator g ($/MWh)
𝑣𝑎𝑟_𝑜𝑚𝑔 Variable operational and maintenance cost of
generator g ($/MWh)
𝑠𝑡_𝑐𝑜𝑠𝑡𝑔 Start up cost of generator g ($)
𝑟𝑎𝑚𝑝𝑔 Ramp rate of generator g
𝑚𝑖𝑛𝑢𝑝𝑔 Minimum up time of generator g (hr)
𝑟𝑒𝑔𝑐𝑜𝑠𝑡𝑔 Cost to provide regulation capacity of generator g
($/MW)
ini_on_hℎ Initial condition for hydro generator h, 0 if generator
is offline, 1 if generator is online. Initial value is 0
ini_mwh_hℎ Initial energy provided by hydro generator h. Initial
value is 0 (MWh)
𝑚𝑎𝑥𝑐𝑎𝑝_ℎℎ Maximum capacity of hydro generator h (MWh)
𝑚𝑖𝑛𝑐𝑎𝑝_ℎℎ Minimum capacity of hydro generator h (MWh)
𝑜𝑝𝑐𝑜𝑠𝑡_ℎℎ Operational cost of hydro generator h ($/MWh)
𝑣𝑎𝑟_𝑜𝑚_ℎℎ Variable operational and maintenance cost of hydro
generator h ($/MWh)
𝑠𝑡_𝑐𝑜𝑠𝑡_ℎℎ Start up cost of hydro generator h ($)
𝑟𝑎𝑚𝑝_ℎℎ Ramp rate of hydro generator h
𝑚𝑖𝑛𝑢𝑝_ℎℎ Minimum up time of hydro generator h (hr)
30
𝑟𝑒𝑔𝑐𝑜𝑠𝑡_ℎℎ Cost to provide regulation capacity of hydro generator
h ($/MW)
𝑚𝑎𝑥𝑐𝑎𝑝_𝑠𝑡 Maximum capacity of solar generators in hour t
(MWh)
𝑜𝑝𝑐𝑜𝑠𝑡_𝑠𝑠 Operational cost of solar generators s ($/MWh)
𝑣𝑎𝑟_𝑜𝑚_𝑠𝑠 Variable operational and maintenance cost of solar
generators s ($/MWh)
𝑠𝑡_𝑐𝑜𝑠𝑡_𝑠𝑠 Start up cost of solar generators s ($)
𝑟𝑎𝑚𝑝_𝑠𝑠 Ramp rate of solar generators s
𝑚𝑖𝑛𝑢𝑝_𝑠𝑠 Minimum up time of solar generators s (hr)
𝑚𝑎𝑥𝑐𝑎𝑝_𝑤𝑡 Maximum capacity of wind generators in hour t
(MWh)
𝑜𝑝𝑐𝑜𝑠𝑡_𝑤𝑤 Operational cost of wind generators w ($/MWh)
𝑣𝑎𝑟_𝑜𝑚_𝑤𝑤 Variable operational and maintenance cost of wind
generators w ($/MWh)
𝑠𝑡_𝑐𝑜𝑠𝑡_𝑤𝑤 Start up cost of wind generators w ($)
𝑟𝑎𝑚𝑝_𝑤𝑤 Ramp rate of wind generators w
𝑚𝑖𝑛𝑢𝑝_𝑤𝑤 Minimum up time of wind generators w (hr)
veh_batteryCost Battery operational cost of vehicles ($/MWh)
𝑔𝑒𝑛_𝑐𝑎𝑝𝑎𝑐𝑖𝑡𝑦_𝑣𝑒ℎ𝑡 Maximum energy capacity of vehicles in hour t
(MWh)
𝑟𝑒𝑔𝑢𝑝_𝑐𝑎𝑝𝑎𝑐𝑖𝑡𝑦_𝑣𝑒ℎ𝑡 Maximum regulation up capacity of vehicles in hour t
(MW)
𝑟𝑒𝑔𝑑𝑜𝑤𝑛_𝑐𝑎𝑝𝑎𝑐𝑖𝑡𝑦_𝑣𝑒ℎ𝑡 Maximum regulation down capacity of vehicles in
hour t (MW)
Sets Definition
W Wind generators
S Solar generators
H Hydro generators
V Vehicles
G Other Generators
T Hours
SI.1.2: Objective Function
UCED simulates the grid operators daily economic dispatch decision, which aims to
minimizes total operational economic cost to dispatch all generators to meet
electricity demand. Total operational costs include costs of electricity generation,
start-up costs, regulation up capacity, and regulation down capacity. The UCED runs
over a 24-hour optimization horizon in hourly increments and includes an additional
24-hour period. The second 24-hour period is a “look-ahead period” to bring
additional information into the current 24-hour optimization horizon.
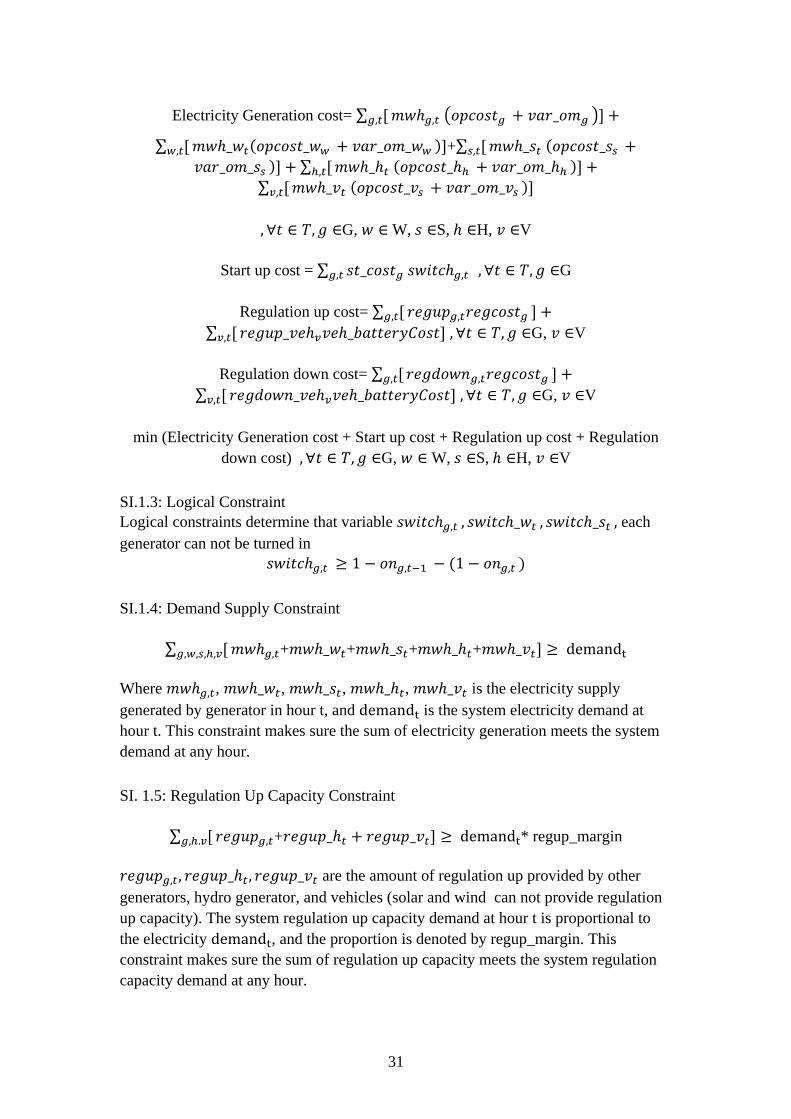
31
Electricity Generation cost= ∑ [𝑔,𝑡 𝑚𝑤ℎ𝑔,𝑡 (𝑜𝑝𝑐𝑜𝑠𝑡𝑔 + 𝑣𝑎𝑟_𝑜𝑚𝑔 )] +
∑ [𝑤,𝑡 𝑚𝑤ℎ_𝑤𝑡(𝑜𝑝𝑐𝑜𝑠𝑡_𝑤𝑤 + 𝑣𝑎𝑟_𝑜𝑚_𝑤𝑤 )]+∑ [𝑠,𝑡 𝑚𝑤ℎ_𝑠𝑡 (𝑜𝑝𝑐𝑜𝑠𝑡_𝑠𝑠 +
𝑣𝑎𝑟_𝑜𝑚_𝑠𝑠 )] + ∑ [ℎ,𝑡 𝑚𝑤ℎ_ℎ𝑡 (𝑜𝑝𝑐𝑜𝑠𝑡_ℎℎ + 𝑣𝑎𝑟_𝑜𝑚_ℎℎ )] +
∑ [𝑣,𝑡 𝑚𝑤ℎ_𝑣𝑡 (𝑜𝑝𝑐𝑜𝑠𝑡_𝑣𝑠 + 𝑣𝑎𝑟_𝑜𝑚_𝑣𝑠 )]
, ∀𝑡 ∈ 𝑇, 𝑔 ∈G, 𝑤 ∈ W, 𝑠 ∈S, ℎ ∈H, 𝑣 ∈V
Start up cost = ∑ 𝑠𝑡_𝑐𝑜𝑠𝑡𝑔 𝑠𝑤𝑖𝑡𝑐ℎ𝑔,𝑡 𝑔,𝑡 , ∀𝑡 ∈ 𝑇, 𝑔 ∈G
Regulation up cost= ∑ [𝑔,𝑡 𝑟𝑒𝑔𝑢𝑝𝑔,𝑡𝑟𝑒𝑔𝑐𝑜𝑠𝑡𝑔 ] +
∑ [𝑣,𝑡 𝑟𝑒𝑔𝑢𝑝_𝑣𝑒ℎ𝑣𝑣𝑒ℎ_𝑏𝑎𝑡𝑡𝑒𝑟𝑦𝐶𝑜𝑠𝑡] , ∀𝑡 ∈ 𝑇, 𝑔 ∈G, 𝑣 ∈V
Regulation down cost= ∑ [𝑔,𝑡 𝑟𝑒𝑔𝑑𝑜𝑤𝑛𝑔,𝑡𝑟𝑒𝑔𝑐𝑜𝑠𝑡𝑔 ] +
∑ [𝑣,𝑡 𝑟𝑒𝑔𝑑𝑜𝑤𝑛_𝑣𝑒ℎ𝑣𝑣𝑒ℎ_𝑏𝑎𝑡𝑡𝑒𝑟𝑦𝐶𝑜𝑠𝑡] , ∀𝑡 ∈ 𝑇, 𝑔 ∈G, 𝑣 ∈V
min (Electricity Generation cost + Start up cost + Regulation up cost + Regulation
down cost) , ∀𝑡 ∈ 𝑇, 𝑔 ∈G, 𝑤 ∈ W, 𝑠 ∈S, ℎ ∈H, 𝑣 ∈V
SI.1.3: Logical Constraint
Logical constraints determine that variable 𝑠𝑤𝑖𝑡𝑐ℎ𝑔,𝑡 , 𝑠𝑤𝑖𝑡𝑐ℎ_𝑤𝑡 , 𝑠𝑤𝑖𝑡𝑐ℎ_𝑠𝑡 , each
generator can not be turned in
𝑠𝑤𝑖𝑡𝑐ℎ𝑔,𝑡 ≥ 1 − 𝑜𝑛𝑔,𝑡−1 − (1 − 𝑜𝑛𝑔,𝑡 )
SI.1.4: Demand Supply Constraint
∑ [𝑔,𝑤,𝑠,ℎ,𝑣 𝑚𝑤ℎ𝑔,𝑡+𝑚𝑤ℎ_𝑤𝑡+𝑚𝑤ℎ_𝑠𝑡+𝑚𝑤ℎ_ℎ𝑡+𝑚𝑤ℎ_𝑣𝑡] ≥ demandt
Where 𝑚𝑤ℎ𝑔,𝑡, 𝑚𝑤ℎ_𝑤𝑡, 𝑚𝑤ℎ_𝑠𝑡, 𝑚𝑤ℎ_ℎ𝑡, 𝑚𝑤ℎ_𝑣𝑡 is the electricity supply
generated by generator in hour t, and demandt is the system electricity demand at
hour t. This constraint makes sure the sum of electricity generation meets the system
demand at any hour.
SI. 1.5: Regulation Up Capacity Constraint
∑ [𝑔,ℎ.𝑣 𝑟𝑒𝑔𝑢𝑝𝑔,𝑡+𝑟𝑒𝑔𝑢𝑝_ℎ𝑡 + 𝑟𝑒𝑔𝑢𝑝_𝑣𝑡] ≥ demandt* regup_margin
𝑟𝑒𝑔𝑢𝑝𝑔,𝑡 , 𝑟𝑒𝑔𝑢𝑝_ℎ𝑡 , 𝑟𝑒𝑔𝑢𝑝_𝑣𝑡 are the amount of regulation up provided by other
generators, hydro generator, and vehicles (solar and wind can not provide regulation
up capacity). The system regulation up capacity demand at hour t is proportional to
the electricity demandt, and the proportion is denoted by regup_margin. This
constraint makes sure the sum of regulation up capacity meets the system regulation
capacity demand at any hour.
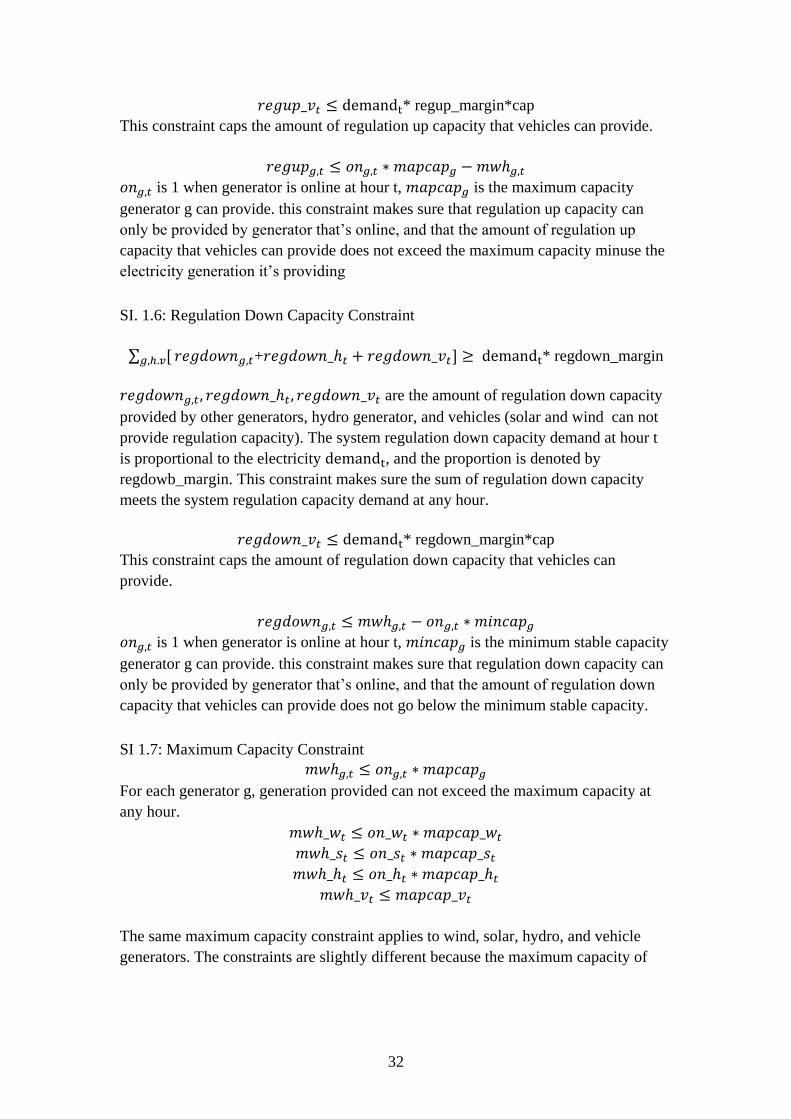
32
𝑟𝑒𝑔𝑢𝑝_𝑣𝑡 ≤ demandt* regup_margin*cap
This constraint caps the amount of regulation up capacity that vehicles can provide.
𝑟𝑒𝑔𝑢𝑝𝑔,𝑡 ≤ 𝑜𝑛𝑔,𝑡 ∗ 𝑚𝑎𝑝𝑐𝑎𝑝𝑔 − 𝑚𝑤ℎ𝑔,𝑡
𝑜𝑛𝑔,𝑡 is 1 when generator is online at hour t, 𝑚𝑎𝑝𝑐𝑎𝑝𝑔 is the maximum capacity
generator g can provide. this constraint makes sure that regulation up capacity can
only be provided by generator that’s online, and that the amount of regulation up
capacity that vehicles can provide does not exceed the maximum capacity minuse the
electricity generation it’s providing
SI. 1.6: Regulation Down Capacity Constraint
∑ [𝑔,ℎ.𝑣 𝑟𝑒𝑔𝑑𝑜𝑤𝑛𝑔,𝑡+𝑟𝑒𝑔𝑑𝑜𝑤𝑛_ℎ𝑡 + 𝑟𝑒𝑔𝑑𝑜𝑤𝑛_𝑣𝑡] ≥ demandt* regdown_margin
𝑟𝑒𝑔𝑑𝑜𝑤𝑛𝑔,𝑡 , 𝑟𝑒𝑔𝑑𝑜𝑤𝑛_ℎ𝑡 , 𝑟𝑒𝑔𝑑𝑜𝑤𝑛_𝑣𝑡 are the amount of regulation down capacity
provided by other generators, hydro generator, and vehicles (solar and wind can not
provide regulation capacity). The system regulation down capacity demand at hour t
is proportional to the electricity demandt, and the proportion is denoted by
regdowb_margin. This constraint makes sure the sum of regulation down capacity
meets the system regulation capacity demand at any hour.
𝑟𝑒𝑔𝑑𝑜𝑤𝑛_𝑣𝑡 ≤ demandt* regdown_margin*cap
This constraint caps the amount of regulation down capacity that vehicles can
provide.
𝑟𝑒𝑔𝑑𝑜𝑤𝑛𝑔,𝑡 ≤ 𝑚𝑤ℎ𝑔,𝑡 − 𝑜𝑛𝑔,𝑡 ∗ 𝑚𝑖𝑛𝑐𝑎𝑝𝑔
𝑜𝑛𝑔,𝑡 is 1 when generator is online at hour t, 𝑚𝑖𝑛𝑐𝑎𝑝𝑔 is the minimum stable capacity
generator g can provide. this constraint makes sure that regulation down capacity can
only be provided by generator that’s online, and that the amount of regulation down
capacity that vehicles can provide does not go below the minimum stable capacity.
SI 1.7: Maximum Capacity Constraint
𝑚𝑤ℎ𝑔,𝑡 ≤ 𝑜𝑛𝑔,𝑡 ∗ 𝑚𝑎𝑝𝑐𝑎𝑝𝑔
For each generator g, generation provided can not exceed the maximum capacity at
any hour.
𝑚𝑤ℎ_𝑤𝑡 ≤ 𝑜𝑛_𝑤𝑡 ∗ 𝑚𝑎𝑝𝑐𝑎𝑝_𝑤𝑡
𝑚𝑤ℎ_𝑠𝑡 ≤ 𝑜𝑛_𝑠𝑡 ∗ 𝑚𝑎𝑝𝑐𝑎𝑝_𝑠𝑡
𝑚𝑤ℎ_ℎ𝑡 ≤ 𝑜𝑛_ℎ𝑡 ∗ 𝑚𝑎𝑝𝑐𝑎𝑝_ℎ𝑡
𝑚𝑤ℎ_𝑣𝑡 ≤ 𝑚𝑎𝑝𝑐𝑎𝑝_𝑣𝑡
The same maximum capacity constraint applies to wind, solar, hydro, and vehicle
generators. The constraints are slightly different because the maximum capacity of
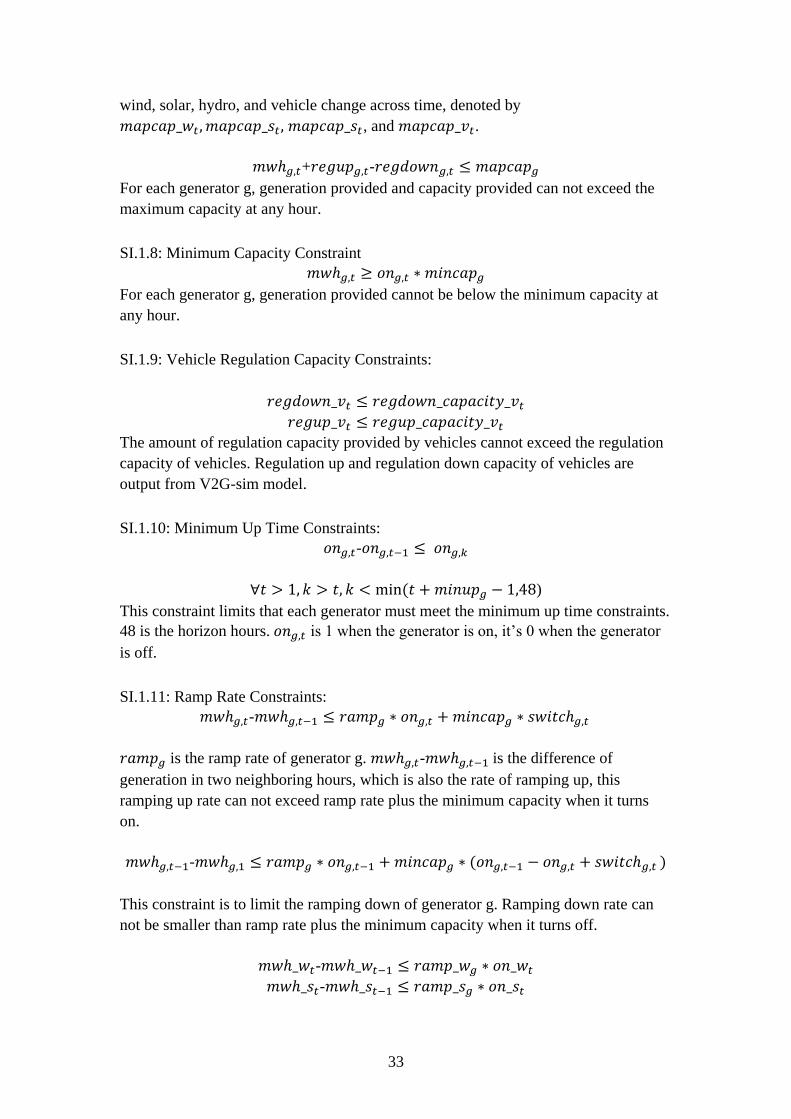
33
wind, solar, hydro, and vehicle change across time, denoted by
𝑚𝑎𝑝𝑐𝑎𝑝_𝑤𝑡 , 𝑚𝑎𝑝𝑐𝑎𝑝_𝑠𝑡 , 𝑚𝑎𝑝𝑐𝑎𝑝_𝑠𝑡, and 𝑚𝑎𝑝𝑐𝑎𝑝_𝑣𝑡.
𝑚𝑤ℎ𝑔,𝑡+𝑟𝑒𝑔𝑢𝑝𝑔,𝑡-𝑟𝑒𝑔𝑑𝑜𝑤𝑛𝑔,𝑡 ≤ 𝑚𝑎𝑝𝑐𝑎𝑝𝑔
For each generator g, generation provided and capacity provided can not exceed the
maximum capacity at any hour.
SI.1.8: Minimum Capacity Constraint
𝑚𝑤ℎ𝑔,𝑡 ≥ 𝑜𝑛𝑔,𝑡 ∗ 𝑚𝑖𝑛𝑐𝑎𝑝𝑔
For each generator g, generation provided cannot be below the minimum capacity at
any hour.
SI.1.9: Vehicle Regulation Capacity Constraints:
𝑟𝑒𝑔𝑑𝑜𝑤𝑛_𝑣𝑡 ≤ 𝑟𝑒𝑔𝑑𝑜𝑤𝑛_𝑐𝑎𝑝𝑎𝑐𝑖𝑡𝑦_𝑣𝑡
𝑟𝑒𝑔𝑢𝑝_𝑣𝑡 ≤ 𝑟𝑒𝑔𝑢𝑝_𝑐𝑎𝑝𝑎𝑐𝑖𝑡𝑦_𝑣𝑡
The amount of regulation capacity provided by vehicles cannot exceed the regulation
capacity of vehicles. Regulation up and regulation down capacity of vehicles are
output from V2G-sim model.
SI.1.10: Minimum Up Time Constraints:
𝑜𝑛𝑔,𝑡-𝑜𝑛𝑔,𝑡−1 ≤ 𝑜𝑛𝑔,𝑘
∀𝑡 > 1, 𝑘 > 𝑡, 𝑘 < min (𝑡 + 𝑚𝑖𝑛𝑢𝑝𝑔 − 1,48)
This constraint limits that each generator must meet the minimum up time constraints.
48 is the horizon hours. 𝑜𝑛𝑔,𝑡 is 1 when the generator is on, it’s 0 when the generator
is off.
SI.1.11: Ramp Rate Constraints:
𝑚𝑤ℎ𝑔,𝑡-𝑚𝑤ℎ𝑔,𝑡−1 ≤ 𝑟𝑎𝑚𝑝𝑔 ∗ 𝑜𝑛𝑔,𝑡 + 𝑚𝑖𝑛𝑐𝑎𝑝𝑔 ∗ 𝑠𝑤𝑖𝑡𝑐ℎ𝑔,𝑡
𝑟𝑎𝑚𝑝𝑔 is the ramp rate of generator g. 𝑚𝑤ℎ𝑔,𝑡-𝑚𝑤ℎ𝑔,𝑡−1 is the difference of
generation in two neighboring hours, which is also the rate of ramping up, this
ramping up rate can not exceed ramp rate plus the minimum capacity when it turns
on.
𝑚𝑤ℎ𝑔,𝑡−1-𝑚𝑤ℎ𝑔,1 ≤ 𝑟𝑎𝑚𝑝𝑔 ∗ 𝑜𝑛𝑔,𝑡−1 + 𝑚𝑖𝑛𝑐𝑎𝑝𝑔 ∗ (𝑜𝑛𝑔,𝑡−1 − 𝑜𝑛𝑔,𝑡 + 𝑠𝑤𝑖𝑡𝑐ℎ𝑔,𝑡 )
This constraint is to limit the ramping down of generator g. Ramping down rate can
not be smaller than ramp rate plus the minimum capacity when it turns off.
𝑚𝑤ℎ_𝑤𝑡-𝑚𝑤ℎ_𝑤𝑡−1 ≤ 𝑟𝑎𝑚𝑝_𝑤𝑔 ∗ 𝑜𝑛_𝑤𝑡
𝑚𝑤ℎ_𝑠𝑡-𝑚𝑤ℎ_𝑠𝑡−1 ≤ 𝑟𝑎𝑚𝑝_𝑠𝑔 ∗ 𝑜𝑛_𝑠𝑡
34
𝑚𝑤ℎ_ℎ𝑡-𝑚𝑤ℎ_ℎ𝑡−1 ≤ 𝑟𝑎𝑚𝑝_ℎ𝑔 ∗ 𝑜𝑛_ℎ𝑡
𝑚𝑤ℎ_𝑤𝑡−1-𝑚𝑤ℎ_𝑤𝑡 ≤ 𝑟𝑎𝑚𝑝_𝑤𝑔 ∗ 𝑜𝑛_𝑤𝑡−1
𝑚𝑤ℎ_𝑠𝑡−1-𝑚𝑤ℎ_𝑠𝑡 ≤ 𝑟𝑎𝑚𝑝_𝑠𝑔 ∗ 𝑜𝑛_𝑠𝑡−1
𝑚𝑤ℎ_ℎ𝑡−1-𝑚𝑤ℎ_ℎ𝑡 ≤ 𝑟𝑎𝑚𝑝_ℎ𝑔 ∗ 𝑜𝑛_ℎ𝑡−1
Similar ramping up and ramping down rate constraints also applied to wind, solar, and
hydro generators.
SI.2: V2G-sim Formulation
This section provides the formulation of V2G-sim Model that we used to determine
vehicle charge and discharge profiles. The optimization used “pyomo” to formulate
optimization models and used “gurobi” as the solver.
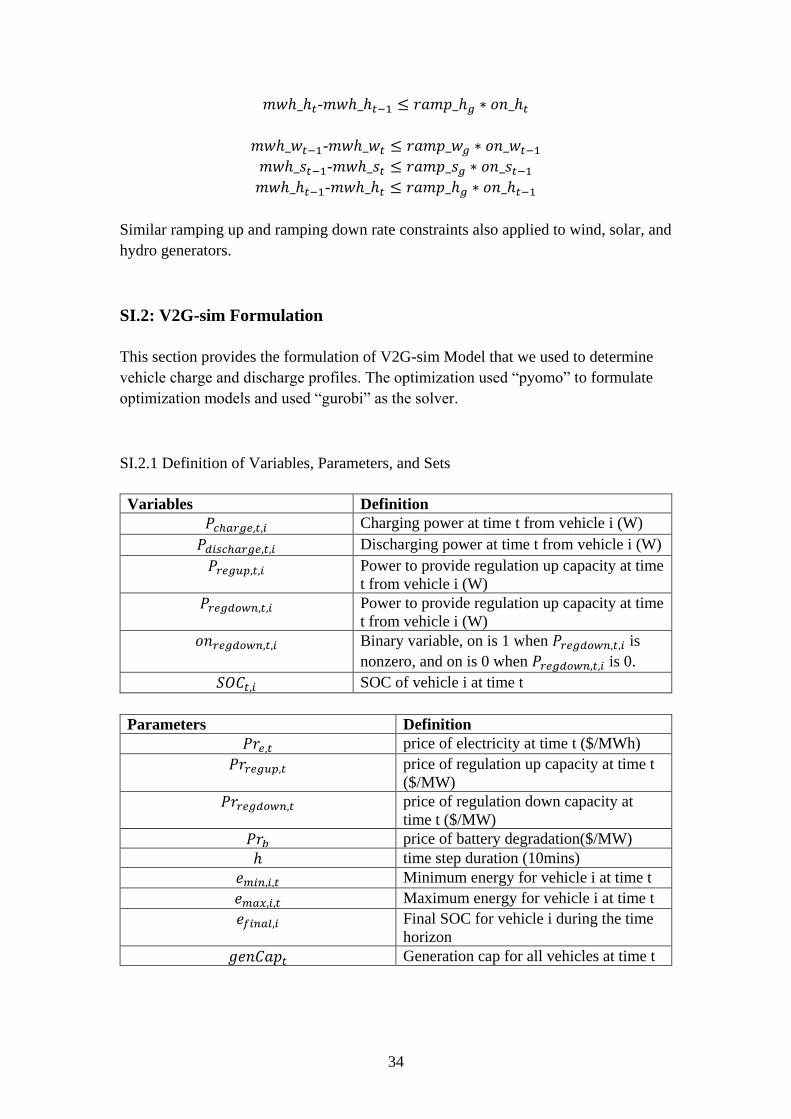
SI.2.1 Definition of Variables, Parameters, and Sets
Variables Definition
𝑃𝑐ℎ𝑎𝑟𝑔𝑒,𝑡,𝑖 Charging power at time t from vehicle i (W)
𝑃𝑑𝑖𝑠𝑐ℎ𝑎𝑟𝑔𝑒,𝑡,𝑖 Discharging power at time t from vehicle i (W)
𝑃𝑟𝑒𝑔𝑢𝑝,𝑡,𝑖 Power to provide regulation up capacity at time
t from vehicle i (W)
𝑃𝑟𝑒𝑔𝑑𝑜𝑤𝑛,𝑡,𝑖 Power to provide regulation up capacity at time
t from vehicle i (W)
𝑜𝑛𝑟𝑒𝑔𝑑𝑜𝑤𝑛,𝑡,𝑖 Binary variable, on is 1 when 𝑃𝑟𝑒𝑔𝑑𝑜𝑤𝑛,𝑡,𝑖 is
nonzero, and on is 0 when 𝑃𝑟𝑒𝑔𝑑𝑜𝑤𝑛,𝑡,𝑖 is 0.
𝑆𝑂𝐶𝑡,𝑖 SOC of vehicle i at time t
Parameters Definition
𝑃𝑟𝑒,𝑡 price of electricity at time t ($/MWh)
𝑃𝑟𝑟𝑒𝑔𝑢𝑝,𝑡 price of regulation up capacity at time t
($/MW)
𝑃𝑟𝑟𝑒𝑔𝑑𝑜𝑤𝑛,𝑡 price of regulation down capacity at
time t ($/MW)
𝑃𝑟𝑏 price of battery degradation($/MW)
ℎ time step duration (10mins)
𝑒𝑚𝑖𝑛,𝑖,𝑡 Minimum energy for vehicle i at time t
𝑒𝑚𝑎𝑥,𝑖,𝑡 Maximum energy for vehicle i at time t
𝑒𝑓𝑖𝑛𝑎𝑙,𝑖 Final SOC for vehicle i during the time
horizon
𝑔𝑒𝑛𝐶𝑎𝑝𝑡 Generation cap for all vehicles at time t
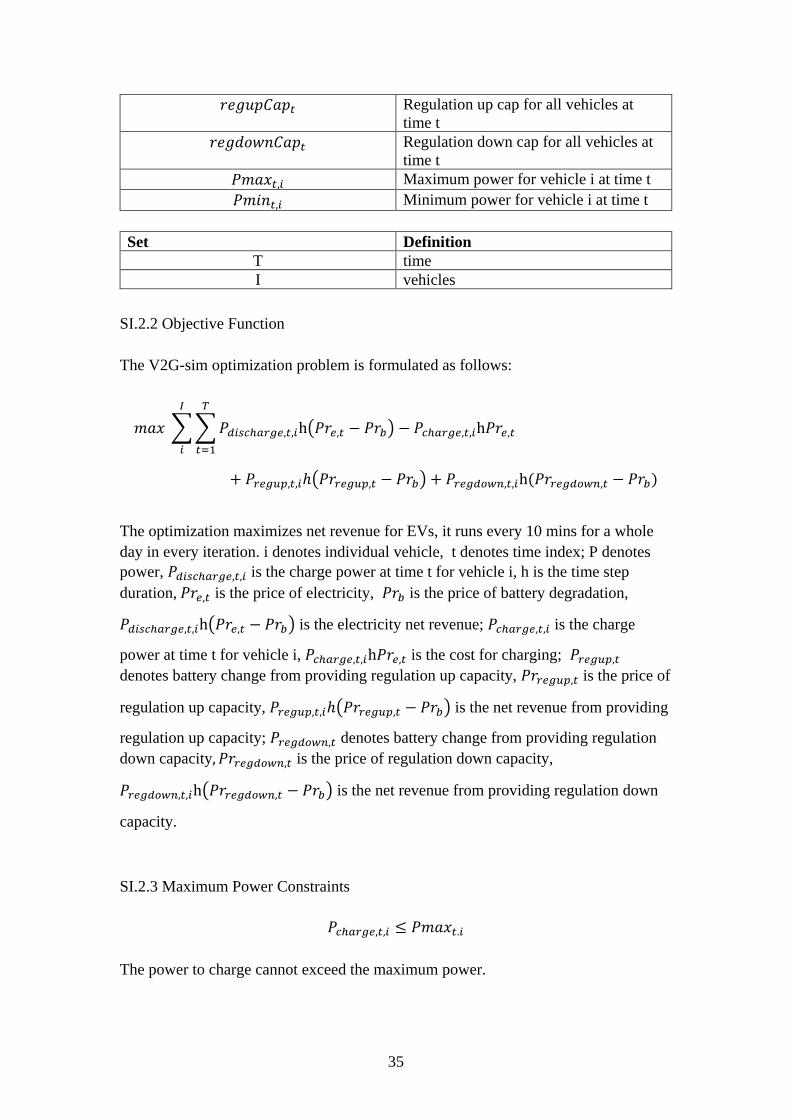
35
𝑟𝑒𝑔𝑢𝑝𝐶𝑎𝑝𝑡 Regulation up cap for all vehicles at
time t
𝑟𝑒𝑔𝑑𝑜𝑤𝑛𝐶𝑎𝑝𝑡 Regulation down cap for all vehicles at
time t
𝑃𝑚𝑎𝑥𝑡,𝑖 Maximum power for vehicle i at time t
𝑃𝑚𝑖𝑛𝑡,𝑖 Minimum power for vehicle i at time t
Set Definition
T time
I vehicles
SI.2.2 Objective Function
The V2G-sim optimization problem is formulated as follows:
𝑚𝑎𝑥 ∑ ∑ 𝑃𝑑𝑖𝑠𝑐ℎ𝑎𝑟𝑔𝑒,𝑡,𝑖h(𝑃𝑟𝑒,𝑡 − 𝑃𝑟𝑏) − 𝑃𝑐ℎ𝑎𝑟𝑔𝑒,𝑡,𝑖h𝑃𝑟𝑒,𝑡
𝑇
𝑡=1
𝐼
𝑖
+ 𝑃𝑟𝑒𝑔𝑢𝑝,𝑡,𝑖ℎ(𝑃𝑟𝑟𝑒𝑔𝑢𝑝,𝑡 − 𝑃𝑟𝑏) + 𝑃𝑟𝑒𝑔𝑑𝑜𝑤𝑛,𝑡,𝑖h(𝑃𝑟𝑟𝑒𝑔𝑑𝑜𝑤𝑛,𝑡 − 𝑃𝑟𝑏)
The optimization maximizes net revenue for EVs, it runs every 10 mins for a whole
day in every iteration. i denotes individual vehicle, t denotes time index; P denotes
power, 𝑃𝑑𝑖𝑠𝑐ℎ𝑎𝑟𝑔𝑒,𝑡,𝑖 is the charge power at time t for vehicle i, h is the time step
duration, 𝑃𝑟𝑒,𝑡 is the price of electricity, 𝑃𝑟𝑏 is the price of battery degradation,
𝑃𝑑𝑖𝑠𝑐ℎ𝑎𝑟𝑔𝑒,𝑡,𝑖h(𝑃𝑟𝑒,𝑡 − 𝑃𝑟𝑏) is the electricity net revenue; 𝑃𝑐ℎ𝑎𝑟𝑔𝑒,𝑡,𝑖 is the charge
power at time t for vehicle i, 𝑃𝑐ℎ𝑎𝑟𝑔𝑒,𝑡,𝑖h𝑃𝑟𝑒,𝑡 is the cost for charging; 𝑃𝑟𝑒𝑔𝑢𝑝,𝑡
denotes battery change from providing regulation up capacity, 𝑃𝑟𝑟𝑒𝑔𝑢𝑝,𝑡 is the price of
regulation up capacity, 𝑃𝑟𝑒𝑔𝑢𝑝,𝑡,𝑖ℎ(𝑃𝑟𝑟𝑒𝑔𝑢𝑝,𝑡 − 𝑃𝑟𝑏) is the net revenue from providing
regulation up capacity; 𝑃𝑟𝑒𝑔𝑑𝑜𝑤𝑛,𝑡 denotes battery change from providing regulation
down capacity, 𝑃𝑟𝑟𝑒𝑔𝑑𝑜𝑤𝑛,𝑡 is the price of regulation down capacity,
𝑃𝑟𝑒𝑔𝑑𝑜𝑤𝑛,𝑡,𝑖h(𝑃𝑟𝑟𝑒𝑔𝑑𝑜𝑤𝑛,𝑡 − 𝑃𝑟𝑏) is the net revenue from providing regulation down
capacity.
SI.2.3 Maximum Power Constraints
𝑃𝑐ℎ𝑎𝑟𝑔𝑒,𝑡,𝑖 ≤ 𝑃𝑚𝑎𝑥𝑡.𝑖
The power to charge cannot exceed the maximum power.
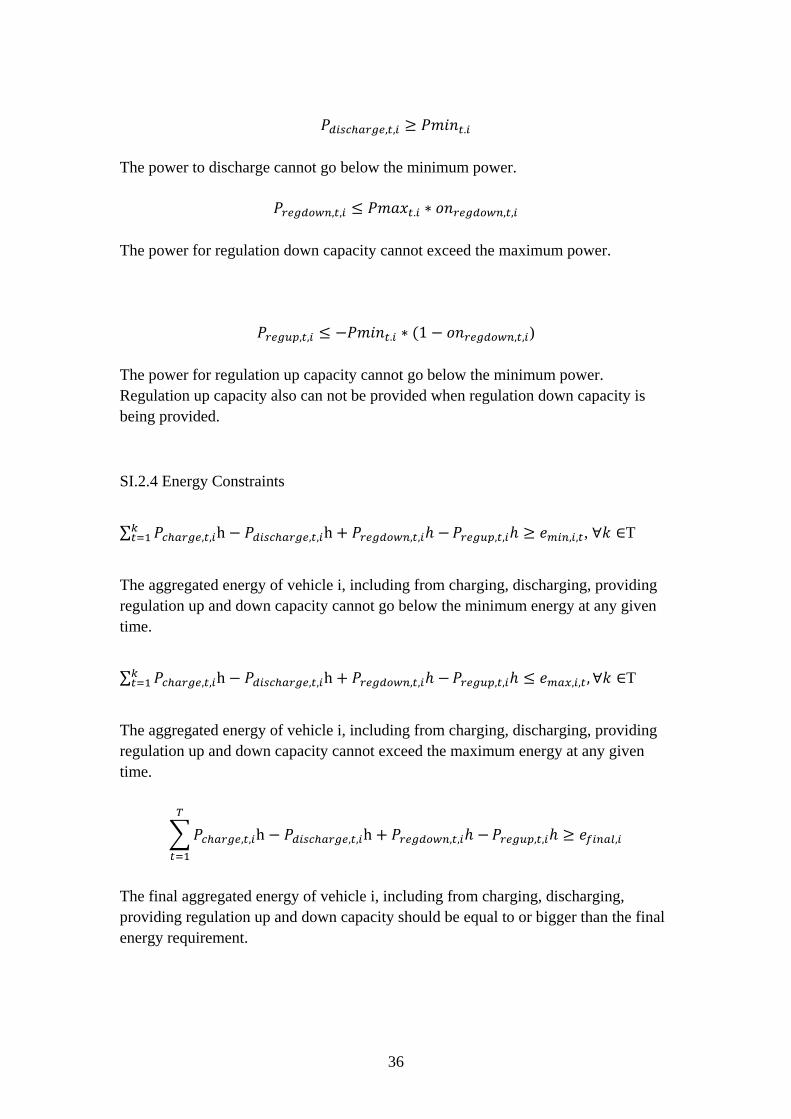
36
𝑃𝑑𝑖𝑠𝑐ℎ𝑎𝑟𝑔𝑒,𝑡,𝑖 ≥ 𝑃𝑚𝑖𝑛𝑡.𝑖
The power to discharge cannot go below the minimum power.
𝑃𝑟𝑒𝑔𝑑𝑜𝑤𝑛,𝑡,𝑖 ≤ 𝑃𝑚𝑎𝑥𝑡.𝑖 ∗ 𝑜𝑛𝑟𝑒𝑔𝑑𝑜𝑤𝑛,𝑡,𝑖
The power for regulation down capacity cannot exceed the maximum power.
𝑃𝑟𝑒𝑔𝑢𝑝,𝑡,𝑖 ≤ −𝑃𝑚𝑖𝑛𝑡.𝑖 ∗ (1 − 𝑜𝑛𝑟𝑒𝑔𝑑𝑜𝑤𝑛,𝑡,𝑖)
The power for regulation up capacity cannot go below the minimum power.
Regulation up capacity also can not be provided when regulation down capacity is
being provided.
SI.2.4 Energy Constraints
∑ 𝑃𝑐ℎ𝑎𝑟𝑔𝑒,𝑡,𝑖h − 𝑃𝑑𝑖𝑠𝑐ℎ𝑎𝑟𝑔𝑒,𝑡,𝑖h + 𝑃𝑟𝑒𝑔𝑑𝑜𝑤𝑛,𝑡,𝑖ℎ −𝑘𝑡=1 𝑃𝑟𝑒𝑔𝑢𝑝,𝑡,𝑖ℎ ≥ 𝑒𝑚𝑖𝑛,𝑖,𝑡, ∀𝑘 ∈T
The aggregated energy of vehicle i, including from charging, discharging, providing
regulation up and down capacity cannot go below the minimum energy at any given
time.
∑ 𝑃𝑐ℎ𝑎𝑟𝑔𝑒,𝑡,𝑖h − 𝑃𝑑𝑖𝑠𝑐ℎ𝑎𝑟𝑔𝑒,𝑡,𝑖h + 𝑃𝑟𝑒𝑔𝑑𝑜𝑤𝑛,𝑡,𝑖ℎ −𝑘𝑡=1 𝑃𝑟𝑒𝑔𝑢𝑝,𝑡,𝑖ℎ ≤ 𝑒𝑚𝑎𝑥,𝑖,𝑡 , ∀𝑘 ∈T
The aggregated energy of vehicle i, including from charging, discharging, providing
regulation up and down capacity cannot exceed the maximum energy at any given
time.
∑ 𝑃𝑐ℎ𝑎𝑟𝑔𝑒,𝑡,𝑖h − 𝑃𝑑𝑖𝑠𝑐ℎ𝑎𝑟𝑔𝑒,𝑡,𝑖h + 𝑃𝑟𝑒𝑔𝑑𝑜𝑤𝑛,𝑡,𝑖ℎ −
𝑇
𝑡=1
𝑃𝑟𝑒𝑔𝑢𝑝,𝑡,𝑖ℎ ≥ 𝑒𝑓𝑖𝑛𝑎𝑙,𝑖
The final aggregated energy of vehicle i, including from charging, discharging,
providing regulation up and down capacity should be equal to or bigger than the final
energy requirement.
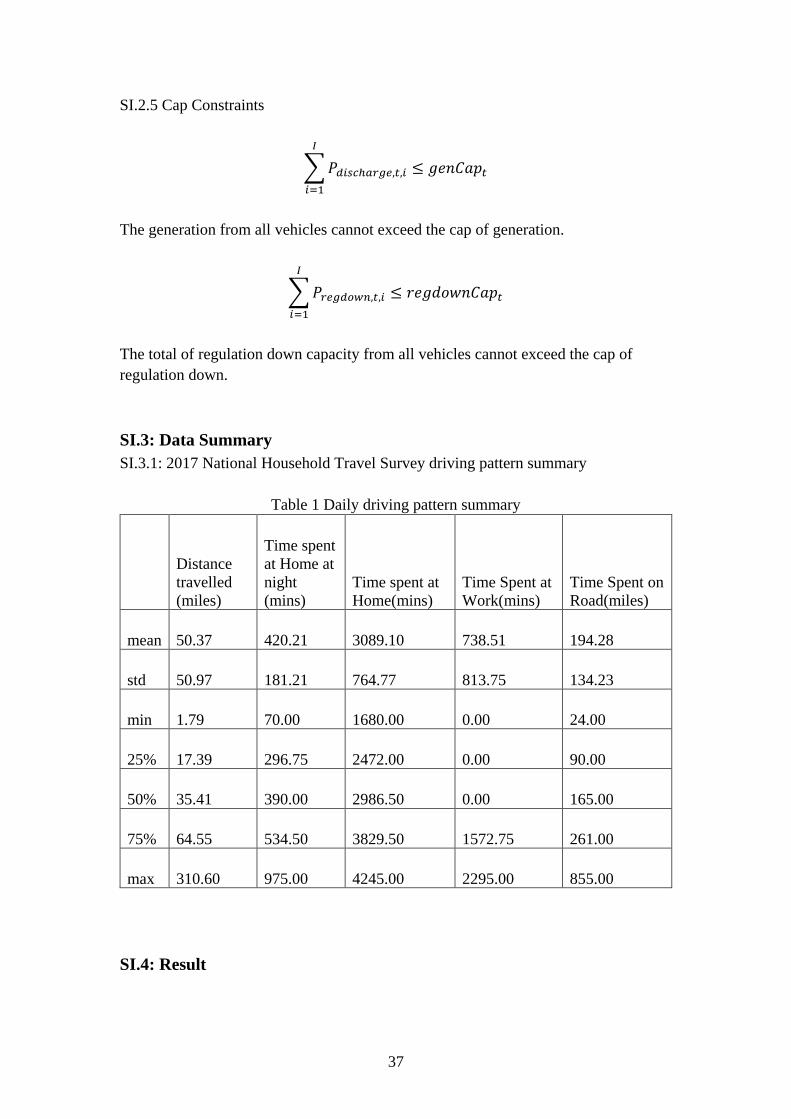
37
SI.2.5 Cap Constraints
∑ 𝑃𝑑𝑖𝑠𝑐ℎ𝑎𝑟𝑔𝑒,𝑡,𝑖
𝐼
𝑖=1
≤ 𝑔𝑒𝑛𝐶𝑎𝑝𝑡
The generation from all vehicles cannot exceed the cap of generation.
∑ 𝑃𝑟𝑒𝑔𝑑𝑜𝑤𝑛,𝑡,𝑖
𝐼
𝑖=1
≤ 𝑟𝑒𝑔𝑑𝑜𝑤𝑛𝐶𝑎𝑝𝑡
The total of regulation down capacity from all vehicles cannot exceed the cap of
regulation down.
SI.3: Data Summary
SI.3.1: 2017 National Household Travel Survey driving pattern summary
Table 1 Daily driving pattern summary
Distance
travelled
(miles)
Time spent
at Home at
night
(mins)
Time spent at
Home(mins)
Time Spent at
Work(mins)
Time Spent on
Road(miles)
mean 50.37 420.21 3089.10 738.51 194.28
std 50.97 181.21 764.77 813.75 134.23
min 1.79 70.00 1680.00 0.00 24.00
25% 17.39 296.75 2472.00 0.00 90.00
50% 35.41 390.00 2986.50 0.00 165.00
75% 64.55 534.50 3829.50 1572.75 261.00
max 310.60 975.00 4245.00 2295.00 855.00
SI.4: Result
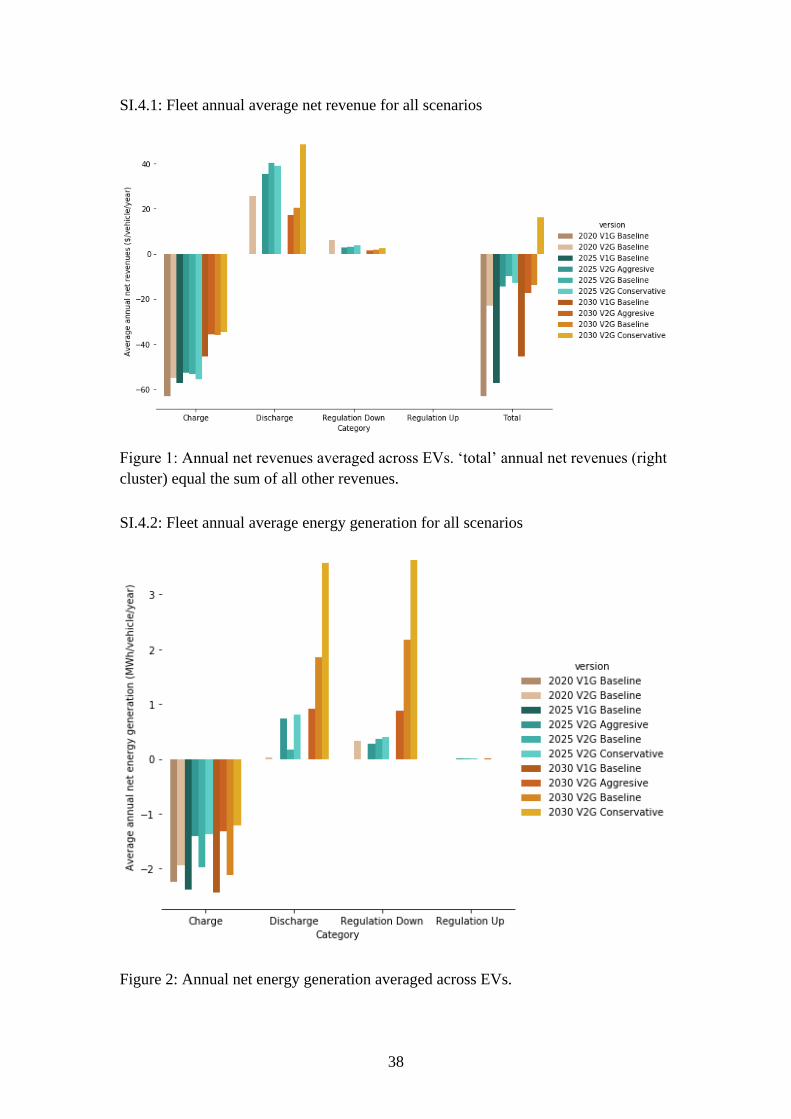
38
SI.4.1: Fleet annual average net revenue for all scenarios
Figure 1: Annual net revenues averaged across EVs. ‘total’ annual net revenues (right
cluster) equal the sum of all other revenues.
SI.4.2: Fleet annual average energy generation for all scenarios
Figure 2: Annual net energy generation averaged across EVs.
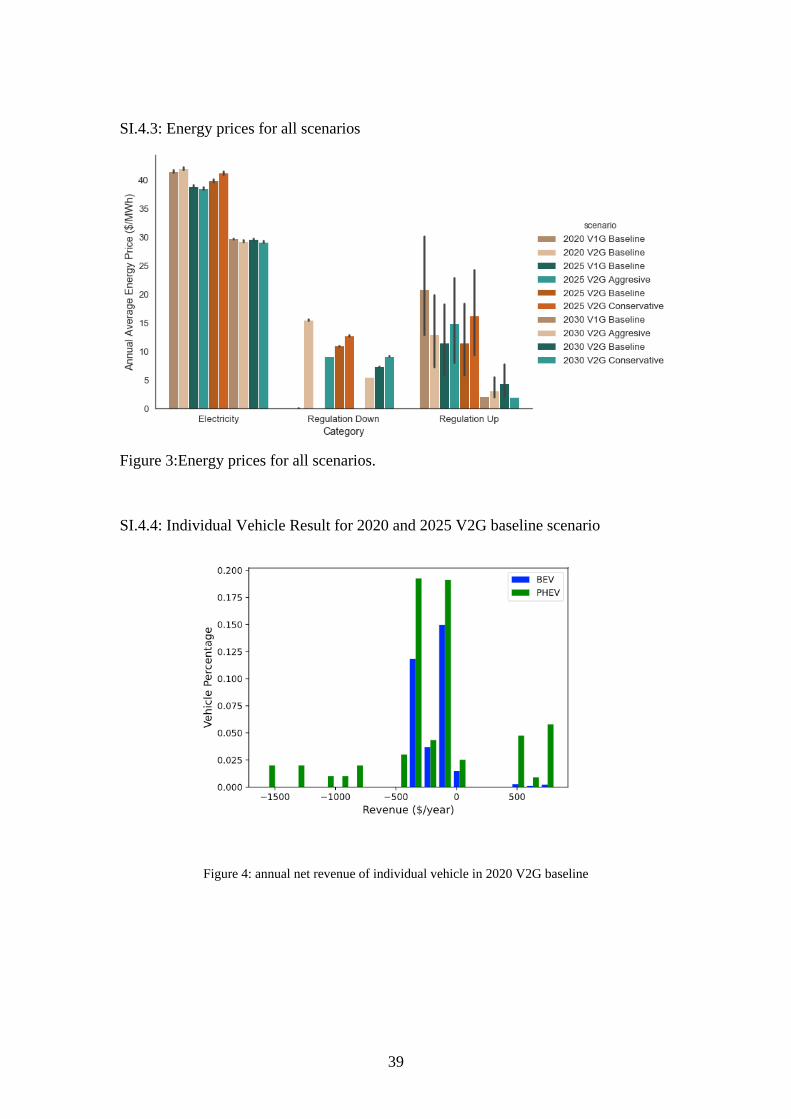
39
SI.4.3: Energy prices for all scenarios
Figure 3:Energy prices for all scenarios.
SI.4.4: Individual Vehicle Result for 2020 and 2025 V2G baseline scenario
Figure 4: annual net revenue of individual vehicle in 2020 V2G baseline

40
Figure 5: annual net revenue of individual vehicle in 2025 V2G baseline