Embed Size (px)
Citation preview
VARIABILITY IN THE SIMON EFFECT
By
JUDITH ANN NELSON SCHULTZ
A dissertation submitted in partial fulfillment of
the requirements for the degree of
DOCTOR OF PHILOSOPHY
WASHINGTON STATE UNIVERSITY
Graduate School
MAY 2009
© Copyright by JUDITH ANN NELSON SCHULTZ, 2009
All Rights Reserved

© Copyright by JUDITH ANN NELSON SCHULTZ, 2009
All Rights Reserved
ii
To the Faculty of Washington State University:
The members of the Committee appointed to examine the dissertation/thesis of
JUDITH ANN NELSON SCHULTZ find it satisfactory and recommend that it be
accepted.
___________________________________
Lisa Fournier, Ph.D., Chair
___________________________________
Maureen Schmitter-Edgecombe, Ph.D.
___________________________________
Nancy Potter, Ph.D.
___________________________________
Beth Kerr, Ph.D.

iii
ACKNOWLEDGMENT
Well-deserved thanks go to my committee members: Dr. Lisa Fournier, chair, for her
hard work and encouragement, Dr. Beth Kerr for being with me from the beginning, Dr.
Maureen Schmitter-Edgecombe for inspiration and patience, and Dr. Nancy Potter for support
and helpful comments. Thanks also to Carla Chandler and Marilyn Mowatt for their
encouragement. Bruce Nelson and Jean Nelson worked for many hours on data entry, and Emily
Schultz on data analysis and figure formatting. Student assistants Sara Thompson and Kellie
Greenhill collected Experiment 1 data. I could not have finished this project without the
assistance of students Katie Appleton, Alis Tortorelli, and Allison Gibson in grading and
supervising labs for my classes. And finally, I thank my past and current students for keeping
me relatively sane throughout the process.
iv
VARIABILITY IN THE SIMON EFFECT
by Judith Ann Nelson Schultz, Ph.D.
Washington State University
May 2009
Chair: Lisa Fournier
Abstract
The automatic-controlled distinction provides one way to explore movement disorders
such as apraxia. For such a population it would be useful to have a simple task and measure to
distinguish automatic from controlled movements. The Simon task, which compares
performance on congruent versus noncongruent tasks, is thought to have both automatic and
controlled components. As a measure, Segalowitz and colleagues (Gilbert & Shallice, 2002;
Norman, 1968, 1981; Norman & Shallice, 1986; Shallice, 1994) suggested the coefficient of
variation (CV); responses resulting from controlled processing are thought to have more
variability than those resulting from automatic processes. Two experiments evaluated the use of
the CV as an indicator of automatic versus controlled processing in right-handed WSU
kinesiology students, using a one-handed Simon task. It was predicted that noncongruent Simon
trials would require more controlled processing than congruent trials, and thus would be more
variable as measured by CVs. Experiment 1 (N=42) revealed the expected Simon effect of faster
reaction time for congruent trials as opposed to noncongruent trials occurred. However,
congruent trials were more variable than noncongruent trials when evaluated with distributional
analysis, and were more positively skewed, indicating that the congruent trials require more
v
processes than noncongruent trials. Experiment 2 (N = 58) used a dual task procedure to validate
conclusions based on CVs in Experiment 1. When a resource demanding counting task was
added to the Simon task, congruent trials slowed more than noncongruent trials, although
congruent trials remained faster than noncongruent trials. This result confirmed the CV results
and indicated that congruent trials require more resources and thus more controlled processing
than noncongruent trials.
vi
TABLE OF CONTENTS
Page
ACKNOWLEDGEMENTS .................................................................................................iii
ABSTRACT ......................................................................................................................... iv
LIST OF TABLES .............................................................................................................. vii
LIST OF FIGURES ...........................................................................................................viii
CHAPTERS
1. INTRODUCTION ................................................................................................. 1
2. EXPERIMENT 1 ................................................................................................. 16
3. EXPERIMENT 2 ................................................................................................. 27
4. GENERAL DISCUSSION .................................................................................. 35
REFERENCES ................................................................................................................... 45
APPENDICES
A. SIDE OF STIMULUS AND SIDE OF RESPONSE EFFECTS ......................... 53
B. DELTA PLOTS FROM EXPERIMENT 1.......................................................... 55
FOOTNOTES ..................................................................................................................... 56
TABLES .. ...................................................................................................................... 58
FIGURES ...................................................................................................................... 60

vii
List of Tables
Table 1 Experiment 2 RT analysis
Table 2 Experiment 2 CV analysis
viii
List of Figures
Figure 1. Experiment 1 RTs and percent error as a function of trial contingency (after congruent
versus after noncongruent) and trial type (congruent versus noncongruent). Error bars denote
standard error.
Figure 2. Experiment 1 CVs as a function of trial contingency (after congruent versus after
noncongruent) and trial type (congruent versus noncongruent). Error bars denote standard error.
Figure 3. Experiment 1 RTs from trials after congruent trials as a function of RT bin and trial
type (congruent versus noncongruent). Error bars denote standard error.
Figure 4. Experiment 1 CVs from trials after congruent trials as a function of RT bin and trial
type (congruent versus noncongruent). Error bars denote standard error.
Figure 5. Experiment 2 mean RTs and percent errors from trials after congruent trials as a
function of task condition (single versus dual) and trial type (congruent versus noncongruent).
Error bars denote standard error. Standard error for percent error is too small to be pictured.
Figure 6. Experiment 2 mean RTs from trials after congruent trials as a function of task
condition (single versus dual), trial type (congruent versus noncongruent), and RT bin. Error
bars, where visible, denote standard error.
ix
Figure 7. Experiment 2 mean CVs from trials after congruent trials as a function of task
condition (single versus dual), trial type (congruent versus noncongruent), and RT bin. Error
bars denote standard error.
Figure A1. Correct RTs in msec for congruent versus noncongruent trial types when stimuli
occur on the right versus left of the screen. Error bars denote standard error.
Figure A2. Experiment 2 mean reaction times for congruent and noncongruent trials in both
single and dual task conditions, for response finger in the top frame, and for side of stimulus in
the lower frame.

x
Dedication
This dissertation is dedicated to my parents, Bruce and Jean Nelson, who taught me to love
learning; to my husband Greg who is my best friend and chief cook and dog walker; and to my
three girls, Elizabeth, Nicole, and Emily, who turned out better than any dissertation ever could.
1
CHAPTER ONE: INTRODUCTION
Human performance is characterized by actions that result primarily from deliberate,
conscious processing of stimulus information, as well as actions that seem to be primarily
reflexive, automatic responses. Posner (1978) defined automatic processes as those which occur
without conscious awareness, apart from deliberate intention, and which do not interfere with
simultaneous processes or tasks. By contrast, controlled processing is that which is under
conscious control, is intentional, and requires attentional resources and thus may detract from the
performance of concurrent tasks. Recent research has demonstrated the importance of the
distinction between automatic and controlled processing in highlighting the processing
characteristics of persons with Attention Deficit Disorder (ADD), schizophrenia, Parkinson’s and
Huntington’s Diseases and people with disorders resulting from head injury or vascular trauma,
as compared with unaffected individuals (Cooper, 2002; Cooper & Shallice, 2000; Rumiati,
Zanini, Vorano, & Shallice, 2001; Saling & Phillips, 2007; Southwood & Dagenais, 2001; Vakil
& Tweedy, 1994) For example, persons with ADD, or who are otherwise characterized as
impulsive, are more inclined than normal individuals to produce reflexive responses even in
situations where these responses are inappropriate: they fail to inhibit word reading in the Stroop
task even when asked to ignore the word and name text color (Kirkeby & Robinson, 2005).
Persons with apraxia often exhibit what is termed an automatic-voluntary dissociation
(Gravenhorst & Walter, 2007): while they cannot produce movements on command during
testing, they are able to generate the same movements within a real-life context, in the presence
of appropriate environmental cues. Also, certain laboratory tasks can elicit an apparent
2
automatic-voluntary dissociation in normal participants. For example, when instructed to respond
to color or other stimulus attribute which is not related to stimulus location, people respond faster
when stimulus and response locations correspond (see Lu & Proctor, 1995, for a review). The
explanation is that the spatial stimulus-response correspondence may automatically trigger the
spatially compatible response and thus decrease response time. Clearly, the distinction between
automatic and controlled processing is practically significant and can potentially help to
understand disorders and/or provide rehabilitation options for various patient populations, as well
as contribute to our understanding of normal performance. The purpose of this research was to
explore and quantify performance variability as a potential measure of the degree of automatic
versus controlled processing in a task with a spatial compatibility component.
Automatic Versus Controlled Processing
Shiffrin and Schneider (Schneider & Shiffrin, 1977; 1977) provided seminal research
on automatic versus controlled methods of processing. Their work was based on studies of
consistent and varied mapping between stimulus and response sets in visual search tasks. In
Shiffrin and Schneider’s prototypical task, participants learned a memory set of targets, e.g.
consonants. Then, they viewed a series of stimuli that could include elements from the target set
or from a set of distracters (e.g., numbers), or both, and were asked to determine as quickly as
possible whether a stimulus included a target element. Consistent mapping involved direct and
exclusive mapping between stimuli and responses: targets were always from one set while
distracters were always from another set. By contrast, in varied mapping target and distracter
stimuli could be from the same set, i.e., a target in one trial could be a distracter in another trial..
3
Size of the target set was also varied; early in practice of both consistent and varied mapping
conditions, participants were slower to respond as set size increased. However, after extensive
practice in the consistent mapping condition, performance no longer depended on the size of the
memory set. Participants could respond as quickly when the set was large as when it contained
only a few elements, mapping conditions. Further, under consistent mapping conditions,
participants became faster and more accurate and reported less conscious control of their
processing. Response time decreased after thousands of practice trials until reaching asymptotic
performance levels, and this was interpreted as indicative of automaticity. By contrast, in varied
mapping situations, even after extended practice, participants never became automatic in their
processing. The set size effect did not diminish nor did performance reach asymptotes. As
originally conceived by Shiffrin and Schneider (Posner & Snyder, 1975; Schneider & Chein,
2003) these pattern differences relate to the diminished role of attention after sufficient practice
in the consistent mapping condition. Based on their results, Shiffrin and Schneider described
automatic processing as behavior that occurs “without the necessity of active control or attention
by the subject” (p. 155-156), while controlled processes demand a share of limited processing
capacity, and are intentional and modifiable.
Until recently, most views of the automatic versus controlled distinction were that tasks
are either automatic or controlled in nature. Compared with controlled processing, automatic
processing is considered to require few if any processing resources, and to be unintentional,
ballistic (in the sense that once started, it is difficult to stop), and even unconditional so that a
stimulus invariably produces some sort of automatic response (Saling & Phillips, 2007).
4
Another proposed characteristic of automaticity is that automatic performance is less variable
than controlled performance (Povel & Collard, 1982; Wascher, Schatz, Kuder, & Verleger, 2001;
Zhang & Kornblum, 1998). Also different types of automaticity may be possible (Saling &
Phillips, 2007). For example, Logan associates automaticity only with changes that occur as a
task is learned (2005); however, there is a possibility that there are natural stimulus-response
associations that may result in automatic processing, such as spatial stimulus response
compatibility (Hommel, 2000). Current, more nuanced views are that tasks are generally a
combination of processes which are more or less automatic versus controlled (Bargh, 1992;
Bargh & Chartrand, 2000; Bargh & Ferguson, 2000; Hommel, 2000). Task processing may be
comprised of a mixture of automatic and controlled processes or a variety of different controlled
processes.
While it is often inferred that speedier performance under automatic processing
conditions is due to more efficient processing, research suggests that automatic processing may
be qualitatively different than controlled processing (Saling & Phillips, 2007). For example,
Nakahara, Doya and Hikosaka (1977) reported neurological evidence that with practice, parallel
processing can replace serial processing. In Logan’s conceptualization (2001), early in learning
(i.e., during the “controlled” stage), performance is governed by rule systems, while later in
learning it switches to a more automatic memory search to match stimulus with response. Use of
the rule system is a slower, more effortful process than using memory search. Rogers and
Monsell (1985) differentiate behavior triggered automatically (e.g., by stimulus characteristics
such as spatial location) from behavior triggered internally, by intention. Automatically
5
triggered behavior requires few resources, while internally triggered behavior involves the
function of the resource demanding Supervisory Attentional System, according to Rogers and
Monsell. In spite of differences in the various explanations, accounts concur that controlled
processing operates more slowly and requires more cognitive resources than automatic
processing.
Research using brain scan and electroencephalography (EEG) techniques that monitor
brain activation during laboratory testing also supports the notion of qualitative differences
between controlled and automatic processing. Toni, Krams, Turner, and Passsingham (2005)
showed that automatic performances are correlated with activity primarily in posterior cortex,
while performances characterized as controlled use prefrontal brain areas. In evaluating changes
that occur with task learning, Jansma, Ramsey, Slagter, and Kahn (1998) found no shift of
activity with automatization but rather a reduction of prefrontal brain activity, which is
associated with reduced working memory task involvement. Other researchers report that brain
activity shifts from prefrontal cortical to mid level and subcortical regions as behavior becomes
more automatic. For example, the basal ganglia become particularly active in automatic
behavior (see Saling & Phillips, 2007 for a review). Further evidence confirming the importance
of prefrontal cortex in controlled processing comes from research on various disorders such as
schizophrenia and attention deficit disorder, which are known to affect prefrontal areas and result
in controlled processing deficits (Holroyd, Nieuwenhuis, Mars, & Coles, 2004; Ridderinkhof,
Scheres, Oosterlaan, & Sergeant, 2005; Ridderinkhof, van den Wildenberg, Wijnen, & Burle,
2004). Apraxia results from damage to a wide range of cortical and subcortical areas, but there is
6
agreement that most of these areas are components of the fronto-parietal loops that are involved
in controlled processing (Gravenhorst & Walter, 2007). Thus, there is evidence that both
behavioral and neurological changes signal a qualitative difference between controlled and
automatic processing.
Measurement of Automaticity
Several different task paradigms have been used to evaluate whether controlled or
automatic processing underlies performance (Saling & Phillips, 2007). One is Shiffrin and
Schneider’s method (Schneider & Shiffrin, 1977; Shiffrin & Schneider, 1977), as described
previously. Automatization of behavior is assumed, if performance reaches a plateau with
practice, and does not change in spite of increases in set size. If increasing set size does degrade
performance, then the task is considered to rely on controlled processing. Another method is to
analyze reaction times (RTs) for well learned versus novel keypress sequences. For example,
Sternberg, Monsell, Knoll & Wright (1978) compared production of well learned sequences,
such as the days of the week repeated in order, with novel sequences of the same length, such as
days of the week in random order. The well learned sequences were produced with a shorter RT
than novel sequences, suggesting that the familiar sequences have become a unit and can be
produced more automatically. If familiar sequences are not readily available this method would
require extensive practice, similar to the Shiffrin and Schneider paradigm. For a quick measure
of potential deficits in automatic versus controlled processing in a patient population, extensive
practice would be a drawback. Further, both of these methods analyze how response speed
changes in with practice, rather than evaluating already existing automatic versus controlled
7
processing. Also, asymptotic performance, which has been interpreted as a signal of automatic
performance, can also be interpreted as a floor or ceiling effect. Finally, the focus on speed of
response alone does not necessarily signal a qualitatively different type of processing and
therefore might not represent a change in processing style (Saling & Phillips, 2007; N.
Segalowitz, Poulsen, & Segalowitz, 1999; N. Segalowitz & Segalowitz, 1993).
A more complex, dual task methodology for assessment of automaticity involves
comparing a single task versus the same task paired with a resource demanding task. This dual
task methodology requires the assumption of an attention resource system with fixed limits
(Kahneman, 1973) and the assumption that controlled processing demands more resources than
automatic processing. An automatic task will deteriorate little when combined with a second,
resource demanding task or will not affect performance of the second task when compared with
performance of the second task alone. On the other hand, tasks which require controlled
processing will be slowed and/or more prone to error in the dual task condition or will similarly
disrupt the second task. A primary drawback of dual task methodology is the time-demanding
and complex design and difficulty for patients of performing the primary and secondary tasks at
the same time.
A less frequently used, but potentially simpler, method for determining whether
performance is characterized by automatic or controlled processing involves analysis of
variability. This methodology requires the assumption that automaticity is characterized by more
consistent performance, i.e., reduced variability. Typically the standard deviation of a system
parameter, for example, RT, is taken as the representation of variability for a sample of data. For
8
example, Jansma et al. (2001) evaluated the mean RTs and standard deviations of participants
performing a Sternberg task, and compared a practiced task with a novel task. Analysis showed
that the practiced task had both faster mean RTs and lower standard deviations than the novel
task, and the authors concluded that learning results in lower response variability. Povel and
Collard (1982) studied interresponse variability in keypress sequences, and found that variability
between keypresses within a subset, or chunk, of a sequence was smaller than that between
chunks. They concluded that subsets of movement sequences can become automatic and will be
produced as if they were one response, or motor program, with increased consistency between
sequence components. Kirkeby and Robinson (2005) used standard deviations to compare
performance of more impulsive versus less impulsive people on Stroop test responses.
Participants who scored higher on impulsivity performed the Stroop test with less variability
overall, although there was no effect of impulsivity on overall speed or errors. The researchers
attributed their results to the possibility that impulsive people are more reliant on automatic
routines rather than on effortful, and thus more variable, controlled stimulus-response mapping.
However, there are difficulties with the use of standard deviations in behavioral analysis
of RTs. Newell and Corcos (1993) remind us that the standard deviation is only a reasonable
descriptor of data with a normal distribution. Also, if there are trial to trial relationships that are
of interest, they can be masked by the standard deviation. For example, a sine wave and white
noise may have the same standard deviation, but the sine wave involves trial to trial
dependencies yielding complete predictability, while the white noise is random from trial to trial
(Slifkin & Newell, 1998). Further, for RT experiments, variability (as measured by standard
9
deviations) is correlated with mean RT, such that as the mean RT increases, standard deviations
increase (this is Weber's Law: see for reviews Gibbon, Malapani, Dale, & Gallistel, 1997;
Ratikin, 2005). As an alternative, the coefficient of variation (CV), computed as standard
deviation of the RTs divided by the mean of the RTs, has often been used to correct for the
correlation between mean and standard deviation, so that variability can be evaluated as a
separate dependent variable.
Segalowitz and colleagues (Poulsen & Segalowitz, 2000; N. Segalowitz, O'Brien, &
Poulsen, 1998; N. Segalowitz et al., 1999; N. Segalowitz & Segalowitz, 1993; N. Segalowitz,
Segalowitz, & Wood, 1998; S. J. Segalowitz, 2000) explored CV analysis as a way to identify
changes in variability that occur with increased automaticity. Basic to their approach is that
there are two ways to account for an increase in performance speed. One way is for the type of
processing to remain the same but simply to speed up, resulting in a decreased mean RT and a
proportional decrease in the standard deviation. Thus the decreased mean RT would not be
accompanied by a change in CV. For example, people simply get better at the controlled
processing required for a task, rather than changing to a new strategy (i.e. reducing the number
of controlled processes or changing completely to automatic processing). A second way to
improve performance speed is for a reorganization to occur, resulting in faster mean RTs. The
reorganization is presumed by Segalowitz and colleagues to be a reduction in the number of
controlled processes or a switch to automatic processing, yielding an increase in performance
stability. In such a situation the standard deviation would decrease more than proportionately
with the mean RT, resulting in reduced CV for the less controlled, or automatic, relative to the
10
more controlled processing task. Mathematically, since a reduction in mean RT with a
disproportionate reduction in standard deviation results in decreased CV, a positive correlation
between CVs and mean RTs would result. Thus, the general approach involves the following
predictions: the magnitude of the CV decreases when a task is speeded due to reorganization
(decreased number of controlled processes) but not when a decrease of mean RT is due to simply
“general speed-up” of existing processes. The correlation between CV and RT will be at or near
zero when performance remains controlled by qualitatively similar processes, while the
correlation between CV and the mean will be positive when task performance switches to a
qualitatively different process.
There is some evidence for the ability of CV to distinguish between performance changes
due to speed-up versus due to reorganization of the task. Segalowitz and colleagues (N.
Segalowitz & Segalowitz, 1993; N. Segalowitz, Segalowitz et al., 1998) compared RT variability
in first versus second language stimuli, presuming that the second language tasks would be less
automatic. As expected, CVs were smaller for first language tasks. Continuing in this vein,
Segalowitz, Segalowitz and Wood (1998) explored changes that occur with learning a second
language. Experienced language students had smaller CVs with a positive correlation between
RT and CV. In contrast, beginners started with higher CVs and with no correlation between RT
and CV; but after practice, CVs decreased and the positive RT-CV correlation became evident
(see also Rickard, 1997, for pseudoarithmetic task).
Extending this work from language acquisition to an attention switching task, Segalowitz,
Poulsen, and Segalowitz (1999) replicated Rogers and Monsell’s (1995) task set switching
11
paradigm, but analyzed CVs in addition to mean RTs. For this type of task, CV magnitude
predictions are relevant, but unlike in learning designs, the prediction of correlation is
inappropriate. Participants had to switch attention from digit to letter decisions on every second
trial of a reaction time task. Segalowitz et al. claimed that the repetition, or nonswitch, trials
could be performed in an automatic or less controlled basis, while the switch trials required a
controlled process for task reconfiguration. The processing mode manipulation thus contrasted
qualitatively different processes. A task difficulty manipulation was also included: changes in
task difficulty were not presumed to change processing qualitatively. Segalowitz et al. observed
a main effect of processing mode on both RT and CV, such that both were decreased for the
nonswitch trials compared with the switch trials. In addition, they found a main effect of task
difficulty for RT but not for CV such that easier tasks were faster but not less variable.
Segalowitz et al. concluded that the CV effects matched their designation of the switch trials as
controlled and the repetition trials as automatic. Thus there is evidence that variability changes
can dissociate types of processing. However, while some authors use variability to distinguish
controlled from automatic processing, as described, others simply claim that more variability
represents more processes (Wascher et al., 2001; Yap & Balota, 2007; Yap, Balota, Cortese, &
Watson, 2006; Zhang & Kornblum, 1997).
As previously stated, deficiencies in automatic or controlled processing have been
proposed to be related to deficits in a variety of patient populations ((Christensen et al., 2005;
Hart, Giovannetti, Montgomery, & Schwartz, 1998; Rumiati et al., 2001). To determine whether
automatic or controlled processing is compromised in such populations, it is important to use a
12
relatively simple and robust RT task that is thought to include trials which differ in the level of
automatic and controlled processing required (MacDonald, 2008). Such a task can then be
evaluated with a measure that can discriminate between automatic and controlled responses; the
CV is a candidate for this measure. Some tasks that are considered to have both automatic and
controlled components include Hayling’s A and B (Bouquet, Bonnaud, & Gil, 2003; Burgess &
Shallice, 1996), flanker tasks (Mattler, 2005) priming tasks, and tasks with spatial compatibility
components (e.g., Stroop and Simon tasks, see Lu & Proctor, 1995, for a review). In these tasks,
the automatic and controlled processing may result in conflicting response activation which
slows response time in noncongruent trials. In general conflict in a task entails competition
between a more or less automatically primed response to an irrelevant stimulus dimension and a
more controlled, intentional response to a stimulus dimension specified by instructions.
Resolving the conflict requires that responses to irrelevant stimulus dimensions are inhibited by a
top down, attention demanding process (Burle, van den Wildenberg, & Ridderinkhof, 2005).
Band and van Boxtel (1999) reported that this inhibitory control is executed by the prefrontal,
resource demanding system (see also Botvinick, Cohen, & Carter, 2004; MacLeod &
MacDonald, 2000). In contrast, trials in which the automatic and controlled processing results in
activation of the same response are faster, possibly because at least some of these trials escape
some of the controlled processes required to resolve conflict (Burle et al., 2005). I have chosen to
use the Simon task for this research because it is simple, does not require a linguistic response,
the size of the effect increases in aging participants, it is robust in a one-handed format, and
13
because spatial aspects of motor tasks are often disrupted in apraxia, so an automatic spatial-
response compatibility effect seems most appropriate.
Simon Task
The classic Simon task (Simon & Rudell, 1967) is a two-choice RT task in which
participants identify the color of a stimulus, e.g., red or green, presented on a computer screen,
and respond by pushing a corresponding response key, e.g., right key for red and left key for
green (for a review, see Lu & Proctor, 1995). The relevant color stimulus can occur on the
monitor to the right or left side of body center. In congruent trials, the stimulus occurs on the
same side of the CRT display as the response key and limb designated by the color cue, such that
the stimulus, correct response key, and correct response limb are all on the same side of the
body. Thus, the relevant and nonrelevant stimulus dimensions both prime the same response. In
noncongruent trials, the stimulus appears on the side of the display opposite the response key and
limb designated by the relevant color cue, such that the stimulus and correct response are on
opposite sides of the body. This results in a conflict between the relevant and irrelevant
dimensions. Research shows that participants consistently respond 20-30 msec slower (Lu &
Proctor, 1995) and less accurately for noncongruent trials than for congruent trials due to the
conflict between dimensions (Lu & Proctor, 1995). This pattern of response has become known
as the Simon effect, and is sensitive enough to be observed with as few as 48 trials in a block. It
is a robust effect, does not disappear with practice, and occurs in both visual and auditory tasks
(Simon, 1990) and with both unimanual and bimanual responses (Cho & Proctor, 2003; Heister,
Schroeder-Heister, & Ehrenstein, 1990; Katz, 1981).
14
Simon contended that people respond automatically first to the directional component of
a stimulus as opposed to its meaning (1990). Accordingly, Kornblum and colleagues
(Kornblum, Hasbroucq, & Osman, 1990; Kornblum & Lee, 1995; Zhang & Kornblum, 1997)
and De Jong and colleagues (De Jong, Liang, & Lauber, 1994) proposed dual route explanations
of the Simon effect, each incorporating the automatic spatial priming component, described by
Simon, in conjunction with additional controlled processes. For example, De Jong et al.’s model
consists of a direct route involving unconditional automatic priming by the irrelevant dimension
(stimulus location), and an indirect, conditional route, which processes the relevant dimension
(color). Both routes are “automatic” and are activated on all trials: the slower performance for
noncongruent trials arises from conflict between the direct route and the indirect route.
According to this model, the congruent trials would be comprised of the two automatic processes
while noncongruent trials add a conflict resolution process. However, Kornblum et al. (1990) and
other more recent characterizations of the dual route hypothesis consider the indirect route to be
a controlled process. Thus, in this view, congruent and noncongruent trials have both the
automatic and controlled activation components, and noncongruent trials add the conflict
resolution component. A component of the conflict resolution process, active suppression of the
automatic, spatially primed direct route response, may be involved in both congruent and
noncongruent trials (Ridderinkhof, 2002). Either way, the dual route hypotheses suggest that the
noncongruent trials have an additional controlled component, and thus should require more
processing resources.
15
It is relatively certain that the direct route spatial priming has at least an automatic
component. For example, Burle, Possamai, Vidal, Bonnet, and Hasbroucq (Burle, Possamai,
Vidal, Bonnet, & Hasbroucq, 2002) use electromyography to show that even in correctly
completed incongruent Simon trials, the irrelevant stimulus elicits a degree of activation in the
limb which would produce an incorrect response. Interspersing trials of a secondary task
between Simon trials has also provided evidence for automaticity of spatial priming (see
Caessens et al., 2005, for review). Thus there is debate over the types of automatic versus
controlled processes involved in the congruent and noncongruent components of the task
(Abrahamse & Van der Lubbe, 2008; Hommel & Milliken, 2007; Musseler, Koch, & Wuhr,
2005); however, relatively few studies have directly tested the contributions of automaticity
versus controlled processing in Simon task congruent and noncongruent trials (Musseler et al.,
2005).
The purpose of the present study was to determine whether the CV reflects differences in
the amount of controlled processing in congruent versus noncongruent trials in a one-handed
Simon task, since a one-handed task would be required to test apraxic participants. To achieve
this goal, two experiments were conducted. Experiment 1 examined whether there was a
difference in CVs between congruent and noncongruent trials as a potential means of detecting
qualitative differences in processing. Since variability has been interpreted either as an indicator
of the number of processes as well as differences between controlled and automatic processes,
the second experiment utilized the dual task method to validate qualitative processing differences
suggested by the CV results obtained in Experiment 1.
16
CHAPTER TWO: EXPERIMENT ONE
Experiment 1
The purpose of Experiment 1 was to explore consistency as a measure of the amount of
controlled processing in one-handed Simon task congruent versus noncongruent trials in normal
participants. If consistency is a sensitive measure of resource demands in the Simon task, and if
more resources are required to overcome the incorrect automatic activation of the spatially cued
response in noncongruent trials, then CVs should be larger for the noncongruent condition than
for the congruent condition.
Method
Participants
Forty-two right-handed undergraduate students from WSU kinesiology classes
participated in this experiment in exchange for optional extra credit in a kinesiology course.
Participants, by self-report, had no upper limb motor control deficits. They had normal reading
visual acuity and color vision, as tested by a standard Snellen chart and online screening test for
color vision ("Isahara Color Blind Test,").
Task and Procedure
Participants performed a classic Simon task on a laptop computer. DirectRT software
was used to control the experiments and collect data. Participants were seated with body center
positioned at screen center, with eyes approximately 60 cm from the screen. Stimuli consisted of
30 mm squares presented 10 cm to the left or right of screen center. Square color was the
17
relevant stimulus while location was the irrelevant stimulus. Participants were asked to respond,
as quickly and accurately as possible, based on the color of the square. Responses were made
with an index or middle finger of the right hand, responding with the index finger for a green
square and middle finger for a red square and ignoring the stimulus spatial location. Note that
when the green square occurred on the left and when the red square occurred on the right, the
condition was congruent, as the spatial location of finger matched the location of the square on
the screen. In each block of 48 trials congruent and noncongruent trials occurred in random
order. Red was chosen as the mapping for the right side finger (middle finger) while green
signaled a left response. While this mapping was the same for all participants, it resulted in
equal numbers of right and left responses, right versus left stimuli locations, and green versus red
stimulus colors for both congruent and noncongruent trials. Further this configuration was easier
for participants to learn, using “r” as the mnemonic device, i.e., “red is right”, than the reversed
(green for right and red for left).1
Instructions for each block were presented on the laptop screen and were read aloud to
the participant for the first trial block. Participants indicated readiness to begin by pressing either
response key. A white X, used as a warning stimulus and means of centering the participant’s
attention between trials, was presented at center screen for 1000 msec after which a red or green
square was presented to the right or left of center yielding an interstimulus interval (ISI) of 1000
msec. The stimulus remained on the screen until a response was made. In the event of an error,
participants received an error message stating “red is right and green is left”, after which they
18
pressed the correct key in order to continue with trials. Participants also received a message if
they responded slower than 1000 msec (“please try to respond faster”) or faster than 150 msec
(“please wait for the stimulus”). The white X ready signal was presented immediately after the
participant’s response to the previous trial. Feedback on average response time and number of
errors was given after each block and participants were encouraged to maintain error rates at or
below five percent for each block. Each participant completed 12 blocks of 48 trials with a rest
period of approximately one minute between blocks.
Results and Discussion
For all analyses, alpha levels were set at .05, and were controlled for familywise error
rate in post hoc testing, using the Holm’s sequential Bonferroni procedure. Error trials and trials
after errors were removed from analysis; however, since variability was a measure of interest, no
trials were eliminated because they exceeded an arbitrary cut-off point, either on the fast or the
slow end of the distribution. Trials from all blocks were included in analysis, since the Simon
effect appears without practice, and does not disappear with even extended practice (Lu &
Proctor, 1995; Simon, 1990). A 12 blocks by trial type (congruent versus noncongruent)
ANOVA confirmed the lack of block effect or interaction on correct RTs (p > .10); there were
not enough errors per block to analyze. Two-way within subjects ANOVAs were conducted
separately on percent errors and remaining correct RTs. Within subject factors were trial type
(congruent versus noncongruent) and trial contingency (trials following congruent trials versus
trials following noncongruent trials), and error trials and trials after errors were removed from
19
RT analysis. Trial contingency was included as a factor since many Simon effect studies have
demonstrated that the Simon effect is eliminated after noncongruent trials (Praamstra, Kleine, &
Schnitzler, 1999; Stürmer, Leuthold, Soetens, Schröter, & Sommer, 2002; Valle-Inclán, Hackley,
& de Labra, 2002).
Overall Simon Effect (RTs and Errors)
Mean correct RTs and percent errors for trial contingency and trial type are presented in
Figure 1 (p. 59). For RTs, there was a significant main effect for both trial type [F(1, 41) = 107,
p < .001, partial η2
= .723] and trial contingency [F(1, 41) = 21.4, p < .001, partial η2
= .343].
Also, the interaction between trial type and trial contingency was significant [F(1,41) = 83.3, p <
.001, partial η2
= .670]. Noncongruent trials were 56 msec slower than congruent trials when
they followed congruent trials [t(41) = -13.17, p < .001, d = 1.14], but following noncongruent
trials, there was an insignificant noncongruent-congruent difference of 3 msec [t(41) = .847, p =
.40]. Error results were consistent with RT results. Percent error analysis revealed a main effect
of trial type [F(1,41) = 23.34, p < .001, partial η2
= .363] and of trial contingency [F(1,41) =
5.411, p = .025, partial η2
= .117]. Also, the interaction between trial type and trial contingency
was significant [F(1,41) = 50.68, p < .001, partial η2
= .553]. For trials following congruent
trials, percent error was significantly less for congruent (1.36%) versus noncongruent (4.53%)
trials [t(41) = -7.17, p < .001, d = 1.42]. However, following noncongruent trials, percent error
was not significantly different between congruent (2.67%) and noncongruent trials (2.09%),
[t(41) = 1.98, p > .05]. Thus, statistical analysis confirmed a Simon effect consistent with
20
previous research: RT and errors were larger for noncongruent trials than for congruent trials,
but only for trials following congruent trials.
Consistency in the Simon Task
Having demonstrated a typical Simon effect, consistency of congruent versus
noncongruent trials was evaluated. CVs were calculated by dividing the standard deviations of
correct RTs for each condition for each participant by its corresponding mean. A two-way
within subjects ANOVA was conducted on CVs, with trial type (congruent versus noncongruent)
and trial contingency (trials following congruent trials versus trials following noncongruent
trials) as factors. Figure 2 (p. 60) shows CVs for correct trials by trial type and trial contingency.
There were no significant effects: trial type [F(1, 41) = 3.18, p = .082]; trial contingency [F(1,
41) = 1.94, p = .171]; interaction between trial type and trial contingency [F(1,41) = .907, p =
.347]. Thus noncongruent trials were not more variable than congruent trials, even when
considering trial contingencies. In fact, the trend toward main effect of trial type is in the reverse
of the predicted direction: congruent trials (CV = 0.2347) tended toward being more variable
than noncongruent trials (CV = 0.2164).
However, statistical differences between means, standard deviations or CVs of entire
congruent and noncongruent RT distributions may not reflect the qualitative differences in
processing between these trial types, whereas distributional analysis may be more useful. De
Jong et al. and others (Burle et al., 2002; Burle et al., 2005; De Jong et al., 1994; Ridderinkhof,
2002; Wascher et al., 2001) showed that, in the Simon task, congruent trial RTs may be
distributed over a wider range than noncongruent trials (see Zhang & Kornblum, 1998, who
21
attest that this is not true for all studies). If this is true for a set of data, the congruent trial
distribution will have larger variability than the noncongruent distribution simply by virtue of the
statistical properties of distributions, even though mean RT is smaller for the congruent trials. In
the present experiment, for trials after congruent trials, the range for congruent trial RTs (775
msec) was larger than the range for noncongruent trials (687 msec), consistent with other
research. While this was not a significant difference (t = 1.25, p = .219, d = .25), the lack of
power due to large between-participant variability is likely the cause of failure to reach
significance. Some researchers (e.g., Wascher et al., 2001) view increased range and
correspondingly increased variability for the congruent trials as evidence that more processes are
involved in these trials. Additionally, congruent distributions are generally more positively
skewed than noncongruent distributions: the Simon effect is usually strongest at the faster end of
the RT distributions (Burle et al., 2002; Burle et al., 2005; De Jong et al., 1994). Heathcote,
Popiel, and Mewhort (1991) used the ex-Gaussian three parameter distributional analysis model
to distinguish conflict from nonconflict trials in the Stroop task, claiming that the more positively
skewed distributions for the conflict trials signaled additional processing in these trials. Thus,
distributional differences may indicate changes in numbers of processes involved, or as
previously discussed, may distinguish controlled from automatic processing (N. Segalowitz et
al., 1999; N. Segalowitz & Segalowitz, 1993; N. Segalowitz, Segalowitz et al., 1998).
Vincentizing procedures, which divide distributions into quantiles, can elucidate
differences between congruent and noncongruent trials at specific points in the distribution, in
addition to distributional skew. For example, Ridderinkhof et al. (2002; 2005; 2004) used
22
distributional analysis to support an activation-suppression hypothesis: since suppression of the
direct, automatic spatial priming builds up over time, the difference between congruent and
noncongruent trials will be smaller at the slower end of the distributions. Also, when comparing
congruent and noncongruent trial RTs, analysis by bin allows comparisons between fast
congruent and fast noncongruent trials (Yap & Balota, 2007; Yap et al., 2006). Burle et al.
(2002) claim that fast correct congruent responses may escape controlled processing, as opposed
to slower correct congruent responses. Thus it is possible the distribution of congruent RTs may
represent some fast, mostly automatic trials, while the slower trials may utilize controlled
processing. This mix of trials may produce the observed variability.
The previous examples of distributional analysis compared RTs of corresponding bins in
order to evaluate differences between congruent and noncongruent trials. However, the CV of
each bin may provide additional information. Since there was a trend for congruent trials to be
more variable than noncongruent trials, distributional analysis may indicate why this trend was
nonsignificant. In addition, a comparison of the CVs for corresponding bins of congruent and
noncongruent trials may highlight differences in skew between the distributions. For example, if
the congruent distribution is more positively skewed than the noncongruent distribution, the
fastest bin of the congruent distribution will have smaller CVs than the fastest bin of the
noncongruent distribution. Thus both mean RTs and CVs were compared for congruent versus
noncongruent trials at the different quantiles of the RT distributions.
23
Distributional Analysis (RTs and CVs)
Because the Simon effect was only observed for trials following congruent trials, only
these correct trial RT distributions were analyzed. In order to evaluate differences between
correct congruent and noncongruent RTs at different quantiles of the RT distributions, correct
RTs for each participant were numerically ordered and 20% cutoff points calculated to create
five bins. Within each bin, for each participant, mean correct RTs and CVs were calculated.
Because of the extreme variability of the fifth bin across all conditions and participants, and
because the largest effects were more likely for the faster RTs bins, the slowest fifth bin was
removed from analysis (Wascher et al., 2001). A two way repeated measures ANOVA was
conducted to separately evaluate mean correct RTs and CVs. Within subject factors included
trial type (congruent versus noncongruent) and bin (1 through 4).
RTs. Figure 3 (p. 61) illustrates correct RT results for congruent and noncongruent trial
types following congruent trials at each of the four RT bins. The ANOVA revealed a significant
trial type main effect [F(1, 41) = 435.7, p < .001, partial η2
= .914] and a significant bin main
effect [F(3,39) = 369.5, p < .001, partial η2
= .966]. The interaction between trial type and bin
was also significant [F(3, 39) = 13.3, p < .001, partial η2 = .506]. To evaluate the interaction,
differences between congruent and noncongruent trials were calculated for each bin separately.
Post hoc comparisons indicated that the difference between congruent and noncongruent trials at
bin 1 (57 msec) was significantly smaller than the bin 2 difference [65 msec, t(41) = -3.89, p <
.001], but the bin 1 difference was not significantly different from the bin 3 (65 msec) and bin 4
(43 msec) differences (p values >.05). Also, the difference between bin 2 congruent and
24
noncongruent RTs was similar to bin 3 (65 msec) and 4 (43 msec) differences (p values >.05).
Finally, the difference between congruent and noncongruent RTs in bin 3 (65 msec) was larger
than the bin 4 difference (43 msec) [t(41) = 3.02, p = .004]. Thus, while previous research has
shown generally a larger difference between congruent and noncongruent trials at the fastest end
of the distribution, this was not found. RT results provided the foundation for the analysis of
variability within each bin.
CVs CVs were calculated, as previously described, for each of the bins for each
participant and condition, and entered into a two trial types by four bins repeated measures
ANOVA. Figure 4 (p. 62) illustrates the changes in congruent and noncongruent CVs across
four bins.
The trial type main effect [F(1, 41) = 4.56, p = .039, partial η2
= .100], bin main effect [F(1,41)
= 305.7, p < .001, partial η2
= .96] and interaction [F(3, 39) = 10.32, p < .001, partial η2
= .443]
were all significant. Post hoc testing for simple main effects revealed that in bin 1,
noncongruent trials had larger CVs (.0586) than congruent trials [.0519; t(41) = -2.91, p = .006].
However, in bins 2, 3 and 4, congruent trials had larger CVs than noncongruent trials. In bin 2
congruent trials CV averaged .0227 and noncongruent trials CV averaged .0201 [t(41) = 2.384, p
= .022]. Bin 3 congruent trials’ CV was .023 and noncongruent trials’ CV was .0181 [t(41) =
4.62, p < .001] and in bin 4 congruent trials’ CV was .0314 and noncongruent trials’ CV was
.024 [t(42) = 4.61, p < .001].2 The interaction explains the non-significance of the overall trial
type effect for CVs discussed previously (congruent trials were slightly more variable than
25
noncongruent trials): throughout most of the distribution the bin CVs were larger for congruent
trials than for noncongruent trials, with the exception of bin 1 which showed larger CVs for
noncongruent versus congruent trials.
Thus, the distributional CV analysis showed that for most of the bins, CVs were larger
for congruent trials than for noncongruent trials. This finding provides two important pieces of
information. First, although the overall mean CV for congruent trials was not significantly larger
than for the noncongruent trials, most of the congruent distribution is in fact more variable than
the noncongruent trials, confirming the trend in overall CV main effect. Second, the result
indicates a more positive skew for the congruent trials than for the noncongruent trials. Greater
skew combined with the larger range and overall larger variability for the congruent distribution
support the possibility that the congruent trials actually require more controlled processing than
the noncongruent trials. This result was unexpected given that congruent trials are performed
faster than noncongruent trials, since controlled processing is thought to require more time.
Also, as previously mentioned, research on Stroop conflict trials suggests that the noncongruent
Stroop RT distributions are actually skewed more than the congruent Stroop RT distributions,
and thus the noncongruent trials require more controlled processing. This result is in direct
conflict with our findings that CVs are higher and more skewed for the congruent trial
distribution. One possible explanation is that the overall trend for congruent trials to be more
variable than noncongruent trials is the result of trial contingency effects. As shown in Figure 1,
congruent trial performance after noncongruent trials is 38 msec slower than after congruent
trials. By contrast, noncongruent trial performance decreases by 18 msec after noncongruent
26
trials when compared with performance after congruent trials. This difference in trial
contingency effect is significant (t(41) = 10.2, p < .001, d = .96) and may result in the increased
variability observed for congruent trials. However, the CV distributional analysis was performed
only on trials after congruent trials, and the variability effect was stronger than in the combined
analysis. According to Segalowitz et al., this finding suggests that more controlled processing is
involved in the congruent trials. For the Simon task, therefore, it may be that the congruent trials
are performed faster because of the larger amount of controlled processing resources invested in
their performance, that simply more processes are involved in congruent trial performance than
in noncongruent trial performance, or that there are a mix of trials in the congruent distribution.
For example, fast congruent trials may be more automatic, while slower congruent trials may
involve the addition of one or more controlled processes to the automatic spatial priming
process. Experiment 2 used dual task methodology to determine whether congruent trials
actually require more resources than noncongruent trials and therefore that all or some of these
trials may require more controlled processing than noncongruent trials. If this is the case, it will
validate the use of the CV measure to compare the amount of controlled versus automatic
processing in two or more tasks.
27
CHAPTER THREE: EXPERIMENT TWO
Experiment 2 utilized a dual task methodology to compare the resource demands of
congruent and noncongruent Simon task trials: Simon task performance alone was compared
with Simon task performance combined with a continuous counting task. Experiment 1 results
showed that congruent Simon trials, except for the fastest ones, are more variable than
noncongruent trials. This suggests, according to Segalowitz et al., that congruent trials require
more controlled processing than noncongruent trials. If this is true, adding a resource demanding
secondary task should result in a larger increase in Simon task RTs and percent error for the
congruent trials than for the noncongruent trials.
Method
Participants
Sixty right-handed undergraduate students from the WSU kinesiology classes
participated in this experiment in exchange for optional course points; none had participated in
Experiment 1. Participants were screened as in Experiment 1. One participant was dropped
from the study because he did not complete the seventh block of dual task trials and a second
because of an extremely high error rate.
Task and Procedure
Simon Task. The Simon task used in Experiment 2 was the same as described in
Experiment 1. Also, the blocks of 48 trials were configured in the same way as in Experiment 1.
28
Secondary task: Backwards counting. In this experiment, backwards counting (Peterson,
Peterson, & Miller, 1961) was performed with along with the Simon task3. Counting back by
ones at a self-determined rate resulted in a combined task with a moderate (200-300 msec)
increase in RT, while errors and variability also increased. Analysis of counting performance
showed that counting rate for different participants ranged from an average of 51 to 178 numbers
counted per Simon task block. Blocks ranged from two to five minutes in duration; thus,
counting rate averaged approximately one number per two seconds. Although the counting rate
range was quite large there was no evidence that faster versus slower counters were putting more
or less effort into the tasks. 4
Procedure: All participants completed the Simon task alone first, then the Simon task
with the counting task. This order was necessary because of the difficulty that pilot participants
had combining the Simon task with other tasks; participants needed to first learn the Simon task
before adding a second task. Thus, all participants first completed seven blocks of 48 Simon
trials, as described in Experiment 1. Next, participants established a preferred backwards
counting rate, which they were encouraged to maintain throughout the dual task blocks. The
arithmetic difference between the first and last number spoken for each trial block was recorded
as the counting score, and served to confirm that the same counting rate was maintained for all
dual task blocks (no block effect, p > .05). Participants completed seven blocks of the Simon
task concurrently with the counting task. As participants started each block of 48 Simon trials,
29
they began counting backwards from a randomly generated three digit number between 300 and
1000. All participants were encouraged to focus on the counting task as the primary task, and to
maintain the steady counting rate throughout each block.
Results and Discussion
Because Experiment 1 confirmed that the Simon effect occurred only after congruent
trials, the trials following noncongruent trials were eliminated from data analysis. For all
analyses, alpha levels were set at .05, and were controlled for familywise error rate in post hoc
testing, using the Holm’s sequential Bonferroni procedure. Data were treated as in Experiment
1.
Initial Analysis of Simon Effect (RTs and Errors)
To determine whether drawing resources from the Simon task affects congruent versus
noncongruent trials differently, RTs and percent errors were compared for congruent versus
noncongruent trials in single versus dual tasks. Results are shown in Figure 5 (p. 63). Two-way
repeated measures ANOVAs for RTs and errors included task condition (single versus dual) and
trial type (congruent versus noncongruent) factors. For correct RTs, the main effects of task
condition [F(1,57) = 142.7, p < .001, partial η2
= .711] and trial type [F(1,57) = 129.7, p < .001,
partial η2
= .691] were significant. RTs were slower overall for noncongruent versus congruent
trials, and the addition of the secondary task increased RTs for both congruent and noncongruent
30
trials. Moreover, the interaction between task condition and trial type was also significant
[F(1,57) = 6.91, p = .011, partial η2
= .711].
As is shown in Figure 5, addition of the resource demanding counting task increased RTs
for both congruent trials and noncongruent trials, but the effect on congruent trials (254 msec)
was greater than the effect on noncongruent trials [228 msec; t(58) = 2.63, p = .011]. Thus,
drawing resources from the Simon task was overall more detrimental for congruent than for
noncongruent trials. This result is consistent with results from Experiment 1’s CV distributional
analysis, suggesting that congruent trials may actually require more controlled processing than
noncongruent trials.
Error results were consistent with RT interpretations. The lower panel of Figure 5
depicts the error data, showing errors for congruent and noncongruent trials in both single and
dual task conditions. Although the task condition main effect was not significant [F(57 = .733, p
= .395], there was a significant trial type main effect [F(57) = 80.73, p < .001, partial η2
= .578]
and the task condition by trial type interaction [F(57) = 5.41, p = .023, partial η2
= .084].
Overall more errors were committed for noncongruent trials than for congruent trials.
Furthermore, post hoc testing of the interaction indicated that for congruent trials, percent error
in the single task condition was 1.17 and increased to 2.36 in the dual task condition [t(57) = -
2.15, p = .016]. However, the addition of the secondary task had no effect on error for the
noncongruent trials [single noncongruent percent error was 8.33 while dual noncongruent
percent error was 7.92; t(57) = .646, p = .521].
31
Distributional Analysis
Evidence that noncongruent RTs increased significantly less than congruent RTs in the
dual task condition strengthens the inference that the noncongruent trials were in fact less
affected than congruent trials by combination with a resource demanding secondary task. To
determine whether these effects are consistent throughout the RT distributions, the congruent and
noncongruent RT distributions were Vincentized as in Experiment 1, for single and dual tasks
separately, and mean RTs and CVs for each bin were compared.
Figure 6 (p. 64) illustrates the RT distributional analysis, showing congruent and
noncongruent means for four bins in the single task and dual task conditions. A three way
repeated measures ANOVA (two task conditions by two trial types by four bins) evaluated the
relationships between factors for RTs and CVs. All main effects and interactions were
significant (see Table 1). An inspection of Figure 6 shows that the increase in correct congruent
RTs in the dual task relative to the single task condition was greater than that found for the
noncongruent trials in all but the first RT bin [bin 2, 33 msec greater: t = 5.51, p < .001; bin 3, 59
msec greater: t = 4.77, p < .001; bin 4, 55 msec greater: t = 4.29, p < .001]. In the first bin there
was no significant difference between the effects of the dual task on congruent versus
noncongruent trials [10 msec difference: t (58) = 1.76, p = .08]. The bin 1 RT trend, although not
significant, is consistent with the pattern above for RT bins 2 through 4. Thus, within
Experiment 2, results of the RT distributional analysis are consistent with overall RT results,
suggesting that congruent trials are actually more resource demanding than the noncongruent.
Further, these results are consistent with Experiment 1 CV analysis in which the overall CV was
32
larger for congruent trials throughout most of the distribution and positive skew was greater than
for noncongruent trials. It appears that, overall, congruent trials require more processing
resources than noncongruent trials and thus involve more controlled processing.
CVs. CVs were calculated as for Experiment 1 and were entered into a three way
repeated measures ANOVA with task condition (single and dual), trial type (congruent and
noncongruent) and bin (one through four) factors. Figure 7 (p. 65) shows CVs for congruent and
noncongruent trials in the single and dual task conditions for four bins, and Table 2 shows results
for CV bin analysis. The task condition and bin main effects were significant but the trial type
main effect was nonsignificant. The two way interaction between condition and bin and the
interaction between condition and type were significant However, the interaction between trial
type and bin was not significant, nor was the three way interaction.
Paired comparisons clarified these interactions. Replicating Experiment 1 results, for the
single task, at bin 1, congruent CVs (.0578) were smaller than noncongruent CVs [.07; t(58) = -
2.446]. At the second, third, and fourth bin this reversed so that noncongruent CVs were
smaller. In bin 2 noncongruent CVs averaged .0217 while congruent CVs averaged .0255 [t(58)
= 3.05, p = .005]. Similarly, in bin 3 noncongruent trials’ CVs (.0201) were less than congruent
[.2373; t(58) = 2.91, p = .0050] and in bin 4 noncongruent CV was .0296 while congruent CV
was .034 [ t(58) = 2.03, p = .047]. In the dual task condition, noncongruent CVs were always
less than congruent CVs. The respective differences for bins 1 through 4 were: 0 .0067; 0.0115;
0.0077; 0.0040 (all p values < .001).
33
Overall the results of Experiment 2 were in agreement with the results of Experiment 1.
The CV analysis in Experiment 1 revealed greater variability and larger positive skew for
congruent trials, suggesting that these trials utilize more resources and therefore more controlled
processing than noncongruent trials. The dual task manipulation confirmed that congruent trials
require more processing resources than noncongruent trials. Interestingly, the addition of the
resource demanding counting task reversed the consistency difference between congruent and
noncongruent trials at the fastest RT bin: in the dual task condition all congruent trial bins had
larger CVs than their corresponding noncongruent trial bins. This result confirms that congruent
trials are overall more variable than noncongruent trials but also that there was a change in
distributional skew: in the dual task condition, the congruent distribution was no longer more
positively skewed than the noncongruent bin. If positive skew indicates more controlled
processing, it appears that in the dual task condition skew no longer differentiates the congruent
and noncongruent trials in terms of their respective processing types. It is likely that the dual
task condition imposed an additional controlled process which had its strongest effect on
variability in the fastest congruent trial bin.
It should be noted that the experimental procedure used for the dual task in Experiment 2
may have some limitations. It was impossible to tell, for example, what kind of decrement
occurred in the counting task when combined with the Simon task. Counting backwards by ones
is an easy task when done on its own, and any measurement of this task alone would likely have
been subject to a ceiling effect. It was clear from observing the participants that the counting
task degraded in the dual task condition, although conditions did not allow measurement of

34
counting timing characteristics, such as pausing to allow a Simon task response. However,
participants were able to maintain consistent performance on the counting task across blocks,
indicating that they were conscious of the necessity to maintain some consistency in the counting
performance.
35
CHAPTER FOUR: GENERAL DISCUSSION
Two experiments were conducted to explore whether the coefficient of variation (CV)
can identify qualitative processing differences in congruent versus noncongruent Simon task
trials. Experiment 1 showed the expected Simon effect of an RT advantage for congruent trials
compared with noncongruent trials. More importantly, distributional analysis revealed that
variability as measured by CV was larger for congruent trials than for noncongruent trials for all
but the fastest RT bin, in opposition to the predicted direction of effect. In accordance with
Segalowitz et al. (Poulsen & Segalowitz, 2000; N. Segalowitz et al., 1999; N. Segalowitz,
Segalowitz et al., 1998), larger CVs for congruent trials indicate that these trials involve more
controlled processing than noncongruent trials. Distributional CV analysis revealed that the
congruent trial RT distribution was more positively skewed than the noncongruent distribution,
further evidence that more controlled processing is required for congruent trials. Results from
Experiment 2 validated this interpretation. In a dual task condition, congruent trials were
affected more by the addition of a secondary task than were noncongruent trials, compared with
a single task condition: RTs were increased more across the entire congruent distribution than in
the noncongruent distribution, although the difference between the increases for congruent and
noncongruent trials was not significant in the first bin. The CV results indicated that in the dual
task condition, all congruent bins were more variable than their corresponding noncongruent
bins. Overall, both CV analysis and dual task results identified the congruent trials as requiring
more controlled processing than the noncongruent trials. These results indicate that CV analysis
36
in a simple task like the Simon task identified differences in the degree of controlled processing
between the two trial types.
While the results of the distributional analyses in the two experiments are consistent in
suggesting that congruent trials require more controlled processing than noncongruent trials,
Experiment 1’s overall CV main effect was nonsignificant. The CV differences between
congruent and noncongruent trials were evident only in the distributional analysis; thus the
analysis of CVs must go beyond simple analysis of central tendency in order to be meaningful.
A variety of distributional analyses exist, some more complex than others. The Vincentizing
procedure used in these experiments is a method in which RT means for corresponding bins are
compared between conditions to determine differences between distributions which may be
masked by measures of central tendency. In the present research, the Vincentizing procedure
provided indication of RT differences between corresponding bins, and in addition, CVs were
calculated and compared for all bins. When bin RTs are combined with a measure of variability
for each bin, an estimation of the distribution’s skew results. For example, at the fast end of the
positively skewed distribution, where the slope of the distribution is steep, the variability of a bin
will be small, compared with the center or more spread out slower tail of the distribution.
Ex-Gaussian analysis is another statistical method which provides information about
distributional skew, but involves more complex statistical analysis and special software.
Heathcote, Popiel, and Mewhort (1991) piloted the use of ex-Gaussian analysis for Stroop task
RT distributions. Normally distributions are described by two parameters, the mean and
variance. The ex-Gaussian method uses a third parameter which identifies the degree of positive
37
skew in the distribution. Thus, computing the variability of each bin during a Vincentizing
procedure will produce roughly the same information as ex-Gaussian analysis but can be
completed without the necessity for specialized software or training (see also Rouder &
Speckman, 2004, for a description and analysis of using Vincentizing procedures with parameter
estimation). A computationally simple and easily understood method for evaluating skew is
useful since skew differences are critical when evaluating qualitative processing between
conditions (Heathcote et al., 1991; Zhang & Kornblum, 1997).
In the present experiments, the distributional CV analysis indicated more variability and a
greater skew for congruent than for noncongruent trials in single task conditions; this result,
combined with the dual task finding that congruent trials require more processing resources, can
be taken as evidence that comparing the skew of distributions does in fact provide information
about qualitative processing differences. It is generally accepted that the Simon task trials
represent a heterogeneous mixture of processing requirements rather than a clear automatic-
controlled distinction between congruent and noncongruent trials. The larger variability and
skew for correct congruent trials indicates that these trials may involve a more complex mix of
processes than noncongruent trials. Automatic processes may be primary for some congruent
trials and controlled processes may be primary for other congruent trials. For example,
distributional CV analysis in Experiment 1 suggested that only the fast correct congruent trials
may benefit primarily from the automatic spatial priming process (congruent CVs were
significantly less than noncongruent CVs for this bin only; in all other bins the result was
reversed). This interpretation is in accord with Burle et al.’s claim that fast congruent trials
38
escape controlled processing (Burle et al., 2002), and Ridderinkhof et al.’s suggestion that
controlled suppression takes longer to develop and thus will not affect correct fast congruent
trials (Ridderinkhof, 2002; Ridderinkhof et al., 2005). An analysis of congruent and
noncongruent error trials in the present experiments supports these contentions. Automatic
spatial priming will result in fast correct responses for congruent trials but in fast errors in
noncongruent trials. Thus, noncongruent error trials should be faster than congruent error trials.
Experiment 1 had low error rates; however, for the 24 out of 40 participants who had error values
in each cell, a two-way repeated measures ANOVA was conducted on error RTs, with trial type
and trial contingency as factors. The trial type main effect was the only significant effect:
noncongruent error RTs (496 msec) were faster than congruent error RTs (595 msec) [F(1,23) =
21.06, p < .001]. Noncongruent error RTs were 42 msec faster than correct congruent trials
overall, and 25 msec faster than the congruent trials that occur after congruent trials.5
Experiment 1’s distributional analysis showed that the fast congruent bin had less
variability than slower congruent and all noncongruent bins, and the previous discussion relates
this finding to the possibility that fast correct congruent trials are primarily automatic in nature.
The increased variability of the slower congruent bins and all of the noncongruent bins suggests,
in contrast, that these slower trials involve controlled processes in addition to the direct spatial
priming. This conclusion is compatible with Ridderinkhof’s activation-suppression hypothesis
(Ridderinkhof, 2002). In his model, direct route activation from automatic spatial priming is
thought to start immediately on stimulus presentation, as per Jong et al. (1994), and then decay
.
39
gradually, while indirect route activation related to the relevant stimulus characteristic starts
somewhat later, as does controlled suppression of the direct route activation. When the
suppression process is strong it may enter into the task earlier than when it is weaker; the
strength of suppression can be varied by changing task parameters such as the probability of a
congruent response, or by interference from a secondary task as in Experiment 2. It should also
be noted that suppression is expected to be stronger for noncongruent trials more than congruent
trials (Ridderinkhof, 2002). Specific predictions can be made based on the activation-
suppression hypothesis, for both RTs and errors under strong and weak suppression. For
noncongruent trials, with strong suppression to prevent the direct route spatial priming from
creating an overt response, differences between congruent and noncongruent trial RTs will
decrease from the fast to the slow end of the distributions, while in weak suppression (dual task)
the differences will increase. Also, for strong suppression, there should be fewer fast errors than
when suppression is weakened. At the slower end of the distribution there should be a smaller
difference between numbers of errors in single and dual task conditions than the fast end of the
distribution. The Experiment 2 data are in agreement with Ridderinkhof’s activation-suppression
model (see Appendix B) and also with the connection of increased variability and increased
processes in correct congruent Simon task performance.
The results of the present experiments are consistent with other Simon effect research
describing a mix of automatic and controlled processing in Simon trials which potentially result
in increased correct congruent variability. However, the finding in dual task conditions that even
the fast congruent trials require more controlled processing than noncongruent trials, as
40
confirmed by dual task results, was not expected based on many descriptions of behavior in the
Simon task. First, as described in the introduction, automatic processing is considered to be
faster than controlled processing; correct congruent trials are performed faster than correct
noncongruent trials. Brain activation studies of conflict tasks indicate increases in anterior
cingulate and prefrontal cortex activity during conflict trials (e.g., noncongruent trials) compared
with nonconflict trials. Activation is reduced after congruent trials and increased after
noncongruent (conflict) trials, and this activation difference is considered to be the basis for the
reduction or disappearance of the Simon effect after noncongruent trials (Kerns, 2006). The
distributional CV analyses in Experiment 1 and 2 included only trials after congruent trials, so
the influence of these controlled processing brain areas should be minimized. Despite this
manipulation, both variability measures and dual task procedures implicate more controlled
processing in the congruent trials. Why do even the fastest congruent trials appear to require
more controlled processing than fast noncongruent trials?
One possibility for this is that participants put more effort into congruent trial
performance. Increased effort would result in more fast correct trials and thus a more positive
skew. It is also possible that, while fast correct congruent trials are performed more
automatically in the single task condition, in a dual task condition a controlled process is added
which increases the variability of the fast congruent trials. Another explanation could be that
the verbal responses in the dual task conditions may delay the Simon task responses enough that
the direct route automatic spatial priming decays, usually after only several hundred msec (De
Jong et al., 1994; Roswarski & Proctor, 1996; Simon, Acosta, Mewaldt, & Spiedel, 1976; Zhang
41
& Johnson, 2004). In Experiment 2, with the addition of the secondary task congruent trial mean
RT increased almost 300 msec, supporting the possibility that decay of the spatial priming may
affect performance within a single trial.
Another possibility is that additional controlled processing operating in congruent trials
actually speeds performance. Wascher et al. (Wascher et al., 2001; Wiegand & Wascher, 2005).
compared anatomically mapped Simon tasks with crossed-hands Simon tasks, and proposed that
there are two spatial activation processes in the Simon task. One is based on anatomical
correspondence with the stimulus orientation (visuomotor facilitation) and results in activation of
the spatially corresponding response effector. This process occurs only with anatomical
positioning (does not occur in the crossed hands condition) and only in the visual Simon effect,
implicating the dorsal stream and visually linked grasping system as the source. The second
process is a more cognitive spatial correspondence effect, based on the more natural tendency to
respond with right limb to stimuli on the right. The authors claim that in the congruent trials the
added visuomotor activation process, while increasing the variability of the congruent
distribution, does not add time to the congruent task but rather speeds it (apparently the
anatomical activation process is not allowed to unfold in noncongruent trials). Wascher et al.
suggest that activation of succeeding stages such as response programming may result from this
visuospatial priming, which accelerates processing in those stages and facilitates the congruent
trial response. The present experiments utilized a body-centered, one-handed Simon task, so the
parallel with Wascher et al. is not direct. However, Experiment 1 showed the typical larger
Simon effect for stimuli on the right side compared with the effect when stimuli were on the left
42
side (see Appendix 1). Thus a visuomotor activation effect that is not necessarily restricted to
the body’s hemispace may contribute to the congruent trial variability in the present experiments.
Another possible facilitating process in the correct congruent trials is repetition effects as
a result of trial to trial similarities between stimuli and/or responses. Recall that the Simon effect
occurred only after congruent trials. When congruent trials followed congruent trials, for half of
these pairings the stimulus for the second congruent trial was the same color and in the same
location as the stimulus for the first trial and required the same side response. In the other half of
congruent trials the second stimulus did not share any characteristics with the first stimulus and
required the opposite side response. By contrast, for all noncongruent stimuli following
congruent stimuli, either the stimulus was a different color or in a different position. In these
noncongruent trials, depending on the stimulus characteristic configuration, the second required
response was either the same or opposite from that required by the first trial. Previous research
has shown that both complete alternations as well as complete repetitions benefit response times
(see Wuhr & Ansorge, 2005, for a discussion of arguments relating to trial contingencies in the
Simon effect). It is possible that the process underlying these repetition effects could be resource
demanding, and yet facilitate congruent trials. However, the trial to trial modulations cannot
explain increased congruent trial variability, since both types of repetition effects for congruent
trial-congruent trial pairings are facilitatory. Based on Wascher et al. and Wurh and Ansorge’s
research, adding a control process may not always be time consuming, and may actually reduce
response time if the process can prime, bias, or partially activate the correct response.
43
Ridderinkhof et al.’s delta plot analyses, Wascher et al.’s proposal of a controlled process
which speeds performance, and the anterior cingulate research shed light on possible responses
of patient populations in the Simon task, but also demonstrate the complexity of analysis
required to understand the contributions of various processes to Simon task performance.
Patients with controlled processing difficulty may have reduced controlled suppression, as
occurred with the addition of the secondary task in Experiment 2. They may also have slower
congruent trial responses combined with less variability of the congruent distribution, if Wascher
et al. are correct in their hypothesis of a facilitating controlled process. If the contribution of the
anterior cingulate is compromised in these patients, they should have more errors and slower
RTs in noncongruent trials, but also perhaps slower congruent RTs if MacLeod and MacDonald
are correct that congruent trials are faster because of more anterior cingulate activity. In any
event, analysis must go beyond simple measures of central tendency and variability to elucidate
controlled and automatic processing contributions to Simon task congruent and noncongruent
trials.
In conclusion, the coefficient of variation detected a processing difference between
congruent and noncongruent trials that was verified by dual task methodology. The increased
variability of congruent trial distributions, and the larger increase in RT for congruent trials
compared with noncongruent trials when adding a secondary task, suggests that the congruent
trials overall are more effortful and/or require a greater number of processes than noncongruent
trials. However, the difference between congruent and noncongruent trials is not simply that one
44
is more automatic than the other. Only the fastest congruent trials, which could be elicited by
direct spatial priming due to correspondence between stimulus and response location may be
primarily automatic in nature. Thus, for the Simon task, increased CVs appear to signal that the
correct congruent trials may have a more complex mix of automatic and controlled processes
than the noncongruent trials. Distributional analysis is required in order to separate the more
automatic faster congruent trials from the noncongruent and slower congruent trials. Despite the
complex analysis, Simon task performance is relatively simple for participants, and the CV
analysis yields identifiable differences in processing between congruent and noncongruent trials.
Therefore, the use of CV analysis combined with the Simon task is potentially a useful tool to
explore controlled versus automatic processing.
45
References
Abrahamse, E. L., & Van der Lubbe, R. H. J. (2008). Endogenous orienting modulates the Simon
effect: Critical factors in experimental design. Psychological Research, 72, 261-272.
Bargh, J. A. (1992). The ecology of automaticity: Toward establishing the conditions needed to
produce automatic processing effects. The American Journal of Psychology, 105(2), 181-
199.
Bargh, J. A., & Chartrand, T. L. (2000). The mind in the middle: A practical guide to priming
and automaticity research. In H. T. Reis & C. M. Judd (Eds.), Handbook of research
methods in social and personality psychology (pp. 253-285). New York: Cambridge
University.
Bargh, J. A., & Ferguson, M. J. (2000). Beyond behaviorism: On the automaticity of higher
mental processes. Psychological Bulletin, 126, 925-945
Botvinick, M., Cohen, J. D., & Carter, C. S. (2004). Conflict monitoring and anterior cingulate
cortex: An update. Trends in Cognitive Sciences, 8(12), 539-546.
Bouquet, C. A., Bonnaud, V., & Gil, R. (2003). Investigation of supervisory attentional system
functions in patients with Parkinson's Disease using the Hayling task/. Journal of Clinical
and Experimental Neuropsychology, 25(6), 751-760.
Burgess, P. W., & Shallice, T. (1996). Bizarre responses, rule detection and frontal lobe lesions.
Cortex, 32, 241-259.
Burle, B., Possamai, C.-A., Vidal, F., Bonnet, M., & Hasbroucq, T. (2002). Executive control in
the Simon effect: An electromyographic and distributional analysis. Psychological
Research, 66, 324-336.
Burle, B., van den Wildenberg, W. P. M., & Ridderinkhof, K. R. (2005). Dynamics of
facilitation and interference in cue-priming and Simon tasks. European Journal of
Cognitive Psychology, 17(5), 619-641.
46
Cho, Y. S., & Proctor, R. W. (2003). Stimulus and response representations underlying
orthogonal stimulus-response compatibility effects. Psychonomic Bulletin and Review,
10(1), 45-73.
Christensen, H., Dear, K. B. G., Anstey, K. J., Parslow, R. A., Perminder, S., & Jorm, A. F.
(2005). Within-occasion intraindividual variability and preclinical diagnostic status: Is
intraindividual variability an indicator of mild cognitive impairment? Neuropsychology,
19(3), 309-317.
Cooper, R. (2002). Order and disorder in everyday action: The roles of contention scheduling
and supervisory action. Neurocase, 8, 61-79.
Cooper, R., & Shallice, T. (2000). Contention scheduling and the control of routine activities.
Cognitive Neuropsychology, 17(4), 297-338.
De Jong, R., Liang, D.-C., & Lauber, E. (1994). Conditional and unconditional automaticity: A
dual-process model of effects of spatial stimulus-response correspondence. Journal of
Experimental Psychology: Human Perception and Performance, 20, 731-750.
Gibbon, J., Malapani, C., Dale, C. L., & Gallistel, C. R. (1997). Toward a neurobiology of
temporal cognition: Advances and challenges. Current Opinion in Neurobiology, 7, 170-
184.
Gilbert, S. J., & Shallice, T. (2002). Task switching: A PDP model. Cognitive Psychology, 44,
297-337.
Gravenhorst, R. M., & Walter, C. B. (2007). Cognitive models of apraxia and motor control:
Linking theories and methods across two complementary research domains. Motor
Control, 11, 374-405.
Hart, T., Giovannetti, T., Montgomery, M. W., & Schwartz, M. F. (1998). Awareness of errors in
naturalistic action after traumatic brain injury. Journal of Head Trauma Rehabilitation,
13(5), 16-28.
Heathcote, A., Popiel, S. J., & Mewhort, D. J. K. (1991). Analysis of response time distributions:
An example using the Stroop task. Psychological Bulletin, 109, 340-347.
47
Heister, G., Schroeder-Heister, P., & Ehrenstein, W. H. (1990). Spatial coding and spatio-
anatomical mapping: Evidence for a hierarchical model of spatial stimulus-response
compatibility. In R. W. Proctor & T. G. Reeve (Eds.), Stimulus-Response Compatibility:
An Integrated Perspective (65 ed.). Amsterdam: Elsevier (North Holland).
Holroyd, C. B., Nieuwenhuis, S., Mars, R. B., & Coles, M. G. H. (2004). Anterior cingulate
cortext, selection for action, and error processing. In M. I. Posner (Ed.), Cognitive
neuroscience of attention (pp. 219-231). New York: Guilford.
Hommel, B. (2000). The prepared reflex: Automaticity and control in stimulus-response
translation. In S. Monsell & J. Driver (Eds.), Attention and Performance XVIII: Control
of Cognitive Processes (pp. 247-273). Cambridge, MA: MIT Press.
Hommel, B., & Milliken, B. (2007). Taking the brain serious: Introduction to the special issue
on integration in and across perception and action. [Editorial]. Psychological Research,
71, 1-3.
Isahara Color Blind Test. Retrieved July 20, 2006, 2006, from http://www.toledo-
bend.com/colorblind/ishihara.html
Katz, A. N. (1981). Spatial compatibility effects with hemifield presentation in a unimanual two-
finger task. Canadian Journal of Psychology, 35, 63-68.
Kerns, J. G. (2006). Anterior cingulate and prefrontal cortex activity in an FMRI study of trial-
to-trial adjustments on the Simon task. Neuroimage, 33, 399-405.
Kirkeby, B. S., & Robinson, M. D. (2005). Impulse behavior and stimulus-response variability in
choice reaction time. Journal of Research in Personality, 39, 263-277.
Logan, G. D. (2005). Attention, automaticity, and executive control. In A. F. Healy (Ed.),
Experimental Cognitive Psychology and Its Applications (pp. 129-139). Washington DC:
APA.
Lu, H.-H., & Proctor, R. W. (1995). The influence of irrelevant information on performance: A
review of the Simon and spatial Stroop effects. Psychonomic Bulletin and Review, 2, 174-
207.
48
MacDonald, A. W., III (2008). Building a clinically relevant cognitive task: Case study of the
AX paradigm. Schizophrenia Bulletin, 34(4), 619-628.
MacLeod, C. M., & MacDonald, P. A. (2000). Interdimensional interference in the Stroop effect:
Uncovering the cognitive and neural anatomy of attention. Trends in Cognitive Sciences,
4(10), 383-391.
Mattler, U. (2005). Flanker effects on motor output and the late-level response activation
hypothesis. The Quarterly Journal of Experimental Psychology A: Human Experimental
Psychology, 58(4), 577-601.
Musseler, J., Koch, I., & Wuhr, P. (2005). Testing the boundary conditions for processing
irrelevant location information: The cross-task Simon effect. European Journal of
Cognitive Psychology, 17(5), 708-726.
Nakahara, H., Doya, K., & Hikosaka, O. (2001). Parallel cortico-basal ganglia mechanisms for
acquisition and execution of visuomotor sequences - A computational approach. Journal
of Cognitive Neuroscience, 13(5), 626-647.
Norman, D. A. (1968). Toward a theory of memory and attention. Psychological Review, 72,
522-536.
Norman, D. A. (1981). Categorisation of action slips. Psychological Review, 88(1), 1-15.
Norman, D. A., & Shallice, T. (1986). Attention to action: Willed and automatic control of
behavior. In R. Davidson, G. Schwartz & D. Shapiro (Eds.), Consciousness and self
regulation: Advances in research and theory (Vol. 4, pp. 1-18). New York: Plenum.
Peterson, L. R., Peterson, M. J., & Miller, A. (1961). Short-term retention and meaningfulness.
Canadian Journal of Psychology, 15(3), 143-147.
Posner, M. I., & Snyder, C. R. R. (1975). Attention and cognitive control. In R. L. Solso (Ed.),
Information processing and cognition: The Loyola symposium (pp. 55-85). Hillsdale, N.
J.: Erlbaum.
49
Poulsen, C., & Segalowitz, N. (2000). Selective effects of prior motivational experience on
current on-line control of attention. Brain and Cognition, 43, 365-370.
Povel, D.-J., & Collard, R. (1982). Structural factors in patterned finger tapping. Acta
Psychologica, 52(1-2), 107-123.
Praamstra, P., Kleine, B.-U., & Schnitzler, A. (1999). Magnetic stimulation of the dorsal
premotor cortex modulates the Simon effect. Cognitive Neuroscience and
Neuropsychology, 10(3671-3674).
Ratikin, B. C. (2005). The effects of spatial stimulus-response compatibility on choice time
production accuracy and variability. Journal of Experimental Psychology: Human
Perception and Performance, 31(4), 685-702.
Ridderinkhof, K. R. (2002). Activation and suppression in conflict tasks: Empirical clarification
through distributional analyses. In W. Prinz & B. Hommel (Eds.), Common mechanisms
in perception and action. Attention and Performance XIX (Vol. XIX, pp. 494-519).
Oxford: Oxford University Press.
Ridderinkhof, K. R., Scheres, A., Oosterlaan, J., & Sergeant, J. A. (2005). Delta plots in the
study of individual differences: New tools reveal response inhibition deficits in AD/HD
that are eliminated by methylphenidate treatment. [ ]. Journal of Abnormal Psychology,
114(2), 197-215.
Ridderinkhof, K. R., van den Wildenberg, W. P. M., Wijnen, J., & Burle, B. (2004). Response
inhibition in conflict tasks is revealed in delta plots. In M. I. Posner (Ed.), Cognitive
neuroscience of attention (pp. 369-377). New York: Guilford.
Roswarski, T. E., & Proctor, R. W. (1996). Multiple spatial codes and temporal coding in choice
reaction-time tasks Psychological Research, 59, 196-211.
Rouder, J. N., & Speckman, P. L. (2004). An evaluation of the Vincentizing method of forming
group-level response time distributions. Psychonomic Bulletin and Review, 11(3), 419-
427.
Rumiati, R. I., Zanini, S., Vorano, L., & Shallice, T. (2001). A form of ideational apraxia as a
selective deficit of contention scheduling. Cognitive Neuropsychology, 18(7), 617-642.
50
Saling, L. L., & Phillips, L. G. (2007). Automatic behaviour: Efficient, not mindless. Brain
Research Bulletin, 73, 1-20.
Schneider, W., & Chein, J. M. (2003). Controlled and automatic processing: behavior, theory,
and biological mechanisms. Cognitive Science, 27, 525-559.
Schneider, W., & Shiffrin, R. M. (1977). Controlled and automatic human information
processing: I. Detection, search, and attention. Psychological Review, 84(1), 1-66.
Segalowitz, N., O'Brien, I., & Poulsen, C. (1998). Evidence for a domain specific component of
attentional control in skilled performance. Brain and Cognition, 37, 139-142.
Segalowitz, N., Poulsen, C., & Segalowitz, S. (1999). RT coefficient of variation is differentially
sensitive to executive control involvement in an attention switching task. Brain and
Cognition, 40(1), 255-258.
Segalowitz, N., & Segalowitz, S. (1993). Skilled performance, practice, and the differentiation of
speed-up from automatization effects: Evidence from second language word recognition.
Applied Psycholinguistics, 14, 369-385.
Segalowitz, N., Segalowitz, S., & Wood, A. (1998). Assessing the development of automaticity
in second language word recognition. Applied Psycholinguistics, 19, 53-67.
Segalowitz, S. J. (2000). Dynamics and variability of brain activation: Searching for neural
correlates of skill acquisition. Brain and Cognition, 42, 163-165.
Shallice, T. (1994). Multiple levels of control processes. In C. Umila & M. Moscovitch (Eds.),
Attention and Performance XV: Conscious and Nonconscious Information Processing
(pp. 395-420). Cambridge, MA: Bradford.
Shiffrin, R. M., & Schneider, W. (1977). Controlled and automatic human information
processing: II. Percpetual learning, automatic attending, and a general theory.
Psychological Review, 84, 127-190.
51
Simon, J. R. (1990). The effects of an irrelevant directional cue on human information
processing. In R. W. Proctor & T. G. Reeve (Eds.), Stimulus-Response Compatibility: An
Integrated Perspective (pp. 31-86). Amsterdam: Elsevier (North-Holland).
Simon, J. R., Acosta, E., Mewaldt, S. P., & Spiedel, C. R. (1976). The effect of an irrelevant
directional cue on choice reaction time: Duration of the phenomenon and its relation to
stages of processing. Perception and Psychophysics, 19, 16-22.
Simon, J. R., & Rudell, A. P. (1967). Auditory SR compatibility: The effect of an irrelevant cue
on information processing. Journal of Applied Psychology, 51, 300-304.
Slifkin, A. B., & Newell, K. M. (1998). Is variability in human performance a reflection of
system noise? Current Directions in Psychological Science, 7, 170-177.
Southwood, M. H., & Dagenais, P. (2001). The role of attention in apraxic errors. Clinical
Linguistics and Phonetics, 15(1&2), 113-116.
Stürmer, B., Leuthold, H., Soetens, E., Schröter, H., & Sommer, W. (2002). Control over
location-based response activation in the Simon task: Behavioral and electrophysiological
evidence. Journal of Experimental Psychology: Human Perception and Performance, 28,
1345-1363.
Toni, I., Krams, M., Turner, R., & Passingham, R. E. (1998). The time course of changes during
motor sequence learning: A whole brain fMRI study. Neuroimage, 8, 50-61.
Vakil, E., & Tweedy, J. R. (1994). Memory for temporal order and spatial position information:
Tests of the automatic^effortful distinction. Neuropsychiatry, neuropsychology, and
behavioral neurology, 7(4), 281-288.
Valle-Inclán, F., Hackley, S. A., & de Labra, C. (2002). Does stimulus-driven response
activation underlie the Simon effect? In W. Prinz & B. Hommel (Eds.), Common
mechanisms in perception and action: Attention and Performance XIX (pp. 474-493).
Oxford: Oxford University Press.
Wascher, E., Schatz, U., Kuder, T., & Verleger, R. (2001). Validity and boundary conditions of
automatic response activation in the Simon task. Journal of Experimental Psychology:
Human Perception and Performance, 27, 731-751.
52
Wiegand, K., & Wascher, E. (2005). Dynamic aspects of stimulus-response correspondence:
Evidence for two mechanisms involved in the Simon effect. Journal of Experimental
Psychology: Human Perception and Performance, 31(3), 453-464.
Wuhr, P., & Ansorge, U. (2005). Exploring trial-by-trial modulations of the Simon effect. The
Quarterly Journal of Experimental Psychology, 58A(4), 703-731.
Yap, M. J., & Balota, D. A. (2007). Additive and interactive effects on response time
distributions in visual word recognition. Journal of Experimental Psychology: Learning,
Memory, and Cognition, 33(2), 274-296.
Yap, M. J., Balota, D. A., Cortese, M. J., & Watson, J. M. (2006). Single- versus dual-process
models of lexical decision performance insights from response time distribution analysis.
Journal of Experimental Psychology: Human Perception and Performance, 32(6), 1324-
1344.
Zhang, J. X., & Johnson, M. K. (2004). A memory-based, Simon-like, spatial congruence effect:
Evidence for persisting spatial codes. Quarterly Journal of Experimental Psychology,
57A(3), 419-436.
Zhang, J. X., & Kornblum, S. (1997). Distributional analysis and De Jong, Liang, and Lauber's
(1994) dual-process model of the Simon effect. Journal of Experimental Psychology:
Human Perception and Performance, 23, 1543-1551.
53
Appendix A
Side of Stimulus and Side of Response Effects
Experiment 1
Figure A1 (p. 66) shows RTs for congruent and noncongruent trial types when stimuli
appear on the right versus left of the screen. When the stimulus is on the right and the trial is
congruent, the response side is also on the right. Left sided stimulus values can be interpreted in
the same way; thus these results can be interpreted both for stimulus side and response side. A
trial type by stimulus side repeated measures ANOVA indicated a main effect of trial type [F(1,
41) = 111.14, p < .001, partial η2
= .726] and a significant trial type by stimulus side interaction
[F(1, 41) = 11.09, p = .001, partial η2
= .221]. Post hoc testing indicated that the Simon effect
was larger for right sided stimuli (36 msec advantage for congruent trials) than for left (16 msec
advantage for congruent trials, t (41) = 3.45, p = .001, d = .79). Although there was a difference
in Simon effect size, effects for right and left stimuli were strong and in the same direction.
Experiment 2
Figure A2 (p. 67) shows correct RT results for stimulus and response sides for both trial
types in single and dual task conditions. Again, data for stimulus side can be reinterpreted for
response side; hence only stimulus side data was analyzed. Repeated measures ANOVA
indicated a significant trial type main effect such that congruent trials were faster [F(1, 57) =
153.58, p < .001, partial η2
= .722]. There was also a significant task condition main effect:
single task was faster [F(1, 57) = 163.7, p < .001, partial η2
= .735], and a significant trial type
by task condition interaction [F(1, 57) = 19.17, p = .001, partial η2
= .245]. . The important

54
information for the purposes of this analysis is that there was no significant effect of stimulus
side, nor any interaction involving stimulus side (p values > .10).
55
Appendix B
Delta Plot From Experiment 1
Figure B1 (p. 68) depicts delta plots comparing congruent and noncongruent RTs and
percent errors for four RT bins.
56
Footnotes
1 Tagliabue et al. (2007) suggest that response and stimulus side should be considered as separate
factors in Simon task experiments, since a typical finding is that for stimuli and responses on the
right side, the Simon effect is greater than on the left side, and the left side effect may even be
reversed. However, they argued that where the Simon effect is in the same direction, and
significant, for both right and left sides, data may be collapsed over side. This was true for both
Experiment 1 and 2. In Experiment 1, while there was an interaction of response side and trial
type (congruent versus noncongruent), the Simon effect was strong and in the same direction for
both right and left responses. In Experiment 2 there was no interaction of stimulus side or
response side with trial type or condition (single or dual task). Using right hand only and one
color-response mapping simplified a potentially complex design necessitated by distributional
analysis. See Appendix A for analysis of mapping effect results. The critical factors (trial type
and trial contingency) are mapped equally to right and left finger responses (Wascher et al.,
2001)
2 It should be noted that the U-shape of the CV quantile plots is to be expected for RT
distributions: the range of RT values included in the fastest and slowest bins will be larger than
the range in the center of the distribution, because of the generally normal (although skewed)
shape of the distribution.
57
3 Experiment 2 was first attempted using random number generation in time with a metronome
as the secondary task. Participants found this combination difficult and it resulted in an increase
in Simon task RTs of over 2000 msec, with individual trial RTs ranging up to 4000 msec.
Counting tasks were chosen next (Peterson et al., 1961). Pilot work using this task started with
counting back by threes, which was also shown to be too difficult when combined with the
Simon task: pilot participants’ RTs increased by more than 800 msec from single to dual task,
and errors and variability increased dramatically. Further, any counting task with a metronome
was determined to be too difficult for participants.
4 There was a significant negative correlation between counting score and RT for dual task
noncongruent trials (r = -.452, p = .02, N = 58) while a negative correlation was marginally
significant for dual task congruent trials and CS (r = -.35 p = .08, N = 58). It appears that faster
counters were also faster at responding to Simon task trials. Similarly, CS’s were significantly
negatively correlated with the difference between single and dual congruent mean RTs (r = -
.397, p = .045, N = 58) and with the difference between single and dual noncongruent RTs (r = -
.479, p = .013, N = 58). The effects of the dual task were thus reduced for the faster counting
participants compared with the slower counting participants.
5 Because of the difference in numbers of trials between correct responses and error responses,
statistical analysis is inappropriate.
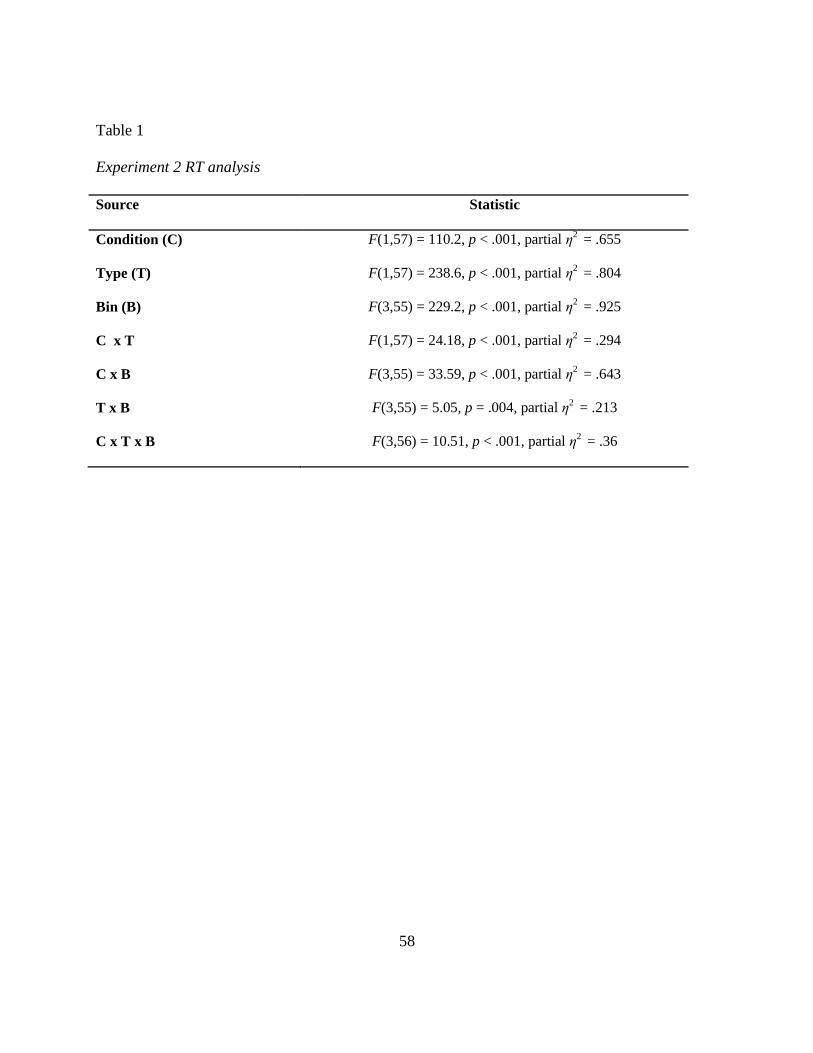
58
Table 1
Experiment 2 RT analysis
Source Statistic
Condition (C) F(1,57) = 110.2, p < .001, partial η2 = .655
Type (T) F(1,57) = 238.6, p < .001, partial η2 = .804
Bin (B) F(3,55) = 229.2, p < .001, partial η2 = .925
C x T F(1,57) = 24.18, p < .001, partial η2 = .294
C x B F(3,55) = 33.59, p < .001, partial η2 = .643
T x B F(3,55) = 5.05, p = .004, partial η2 = .213
C x T x B F(3,56) = 10.51, p < .001, partial η2 = .36
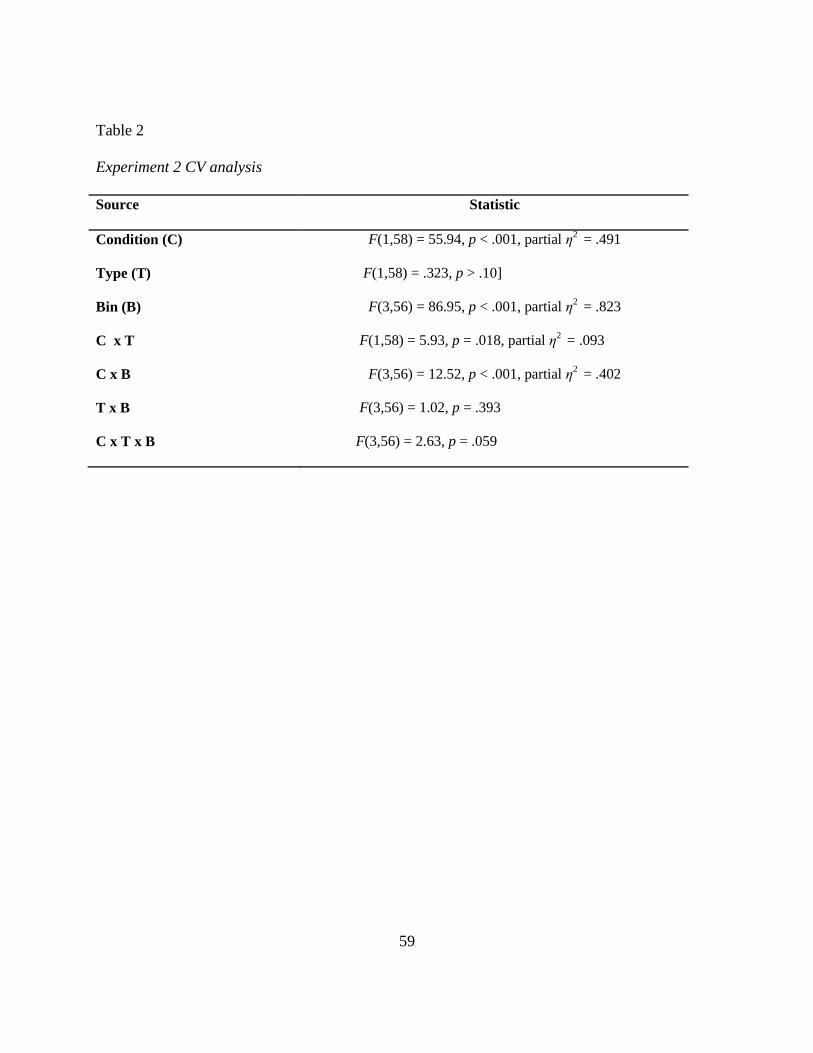
59
Table 2
Experiment 2 CV analysis
Source Statistic
Condition (C) F(1,58) = 55.94, p < .001, partial η2 = .491
Type (T) F(1,58) = .323, p > .10]
Bin (B) F(3,56) = 86.95, p < .001, partial η2 = .823
C x T F(1,58) = 5.93, p = .018, partial η2 = .093
C x B F(3,56) = 12.52, p < .001, partial η2 = .402
T x B F(3,56) = 1.02, p = .393
C x T x B F(3,56) = 2.63, p = .059
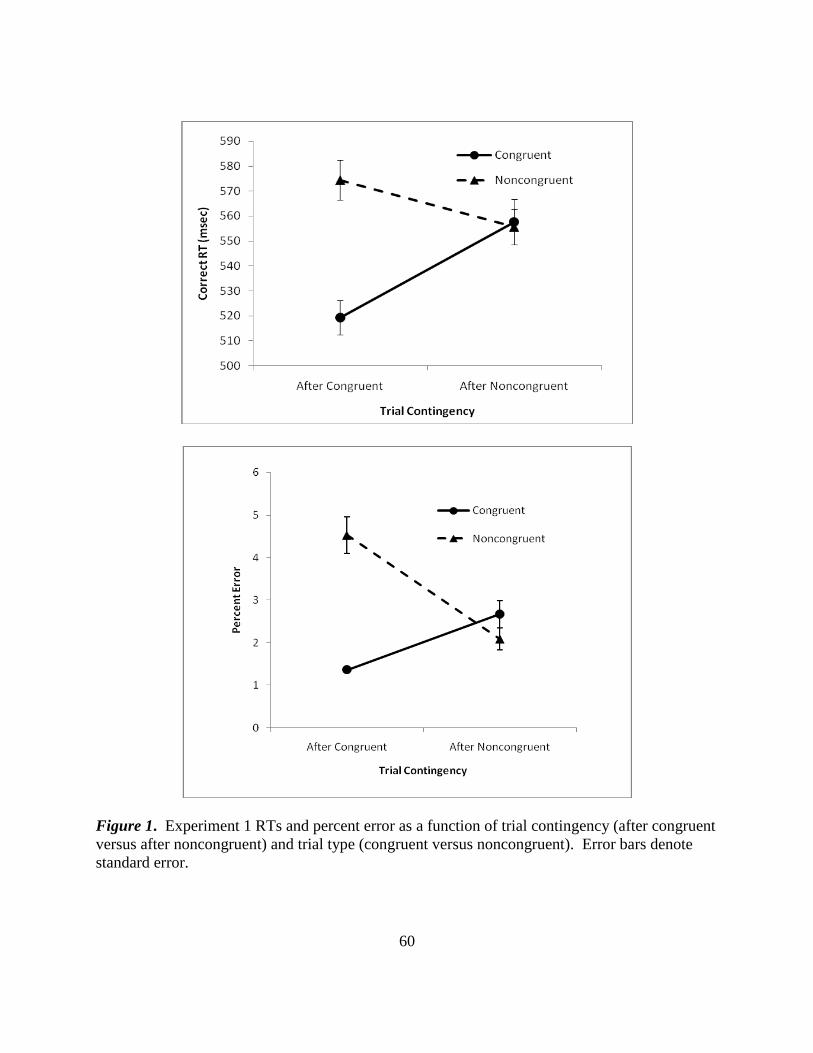
60
Figure 1. Experiment 1 RTs and percent error as a function of trial contingency (after congruent
versus after noncongruent) and trial type (congruent versus noncongruent). Error bars denote
standard error.
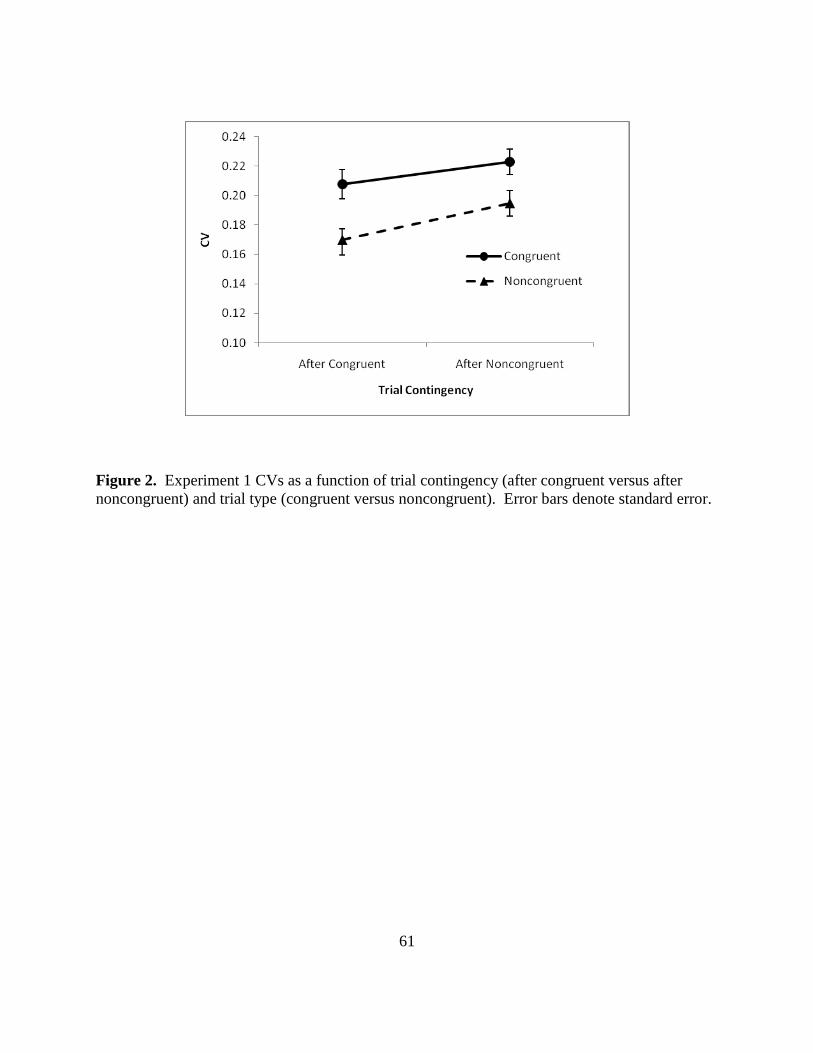
61
Figure 2. Experiment 1 CVs as a function of trial contingency (after congruent versus after
noncongruent) and trial type (congruent versus noncongruent). Error bars denote standard error.
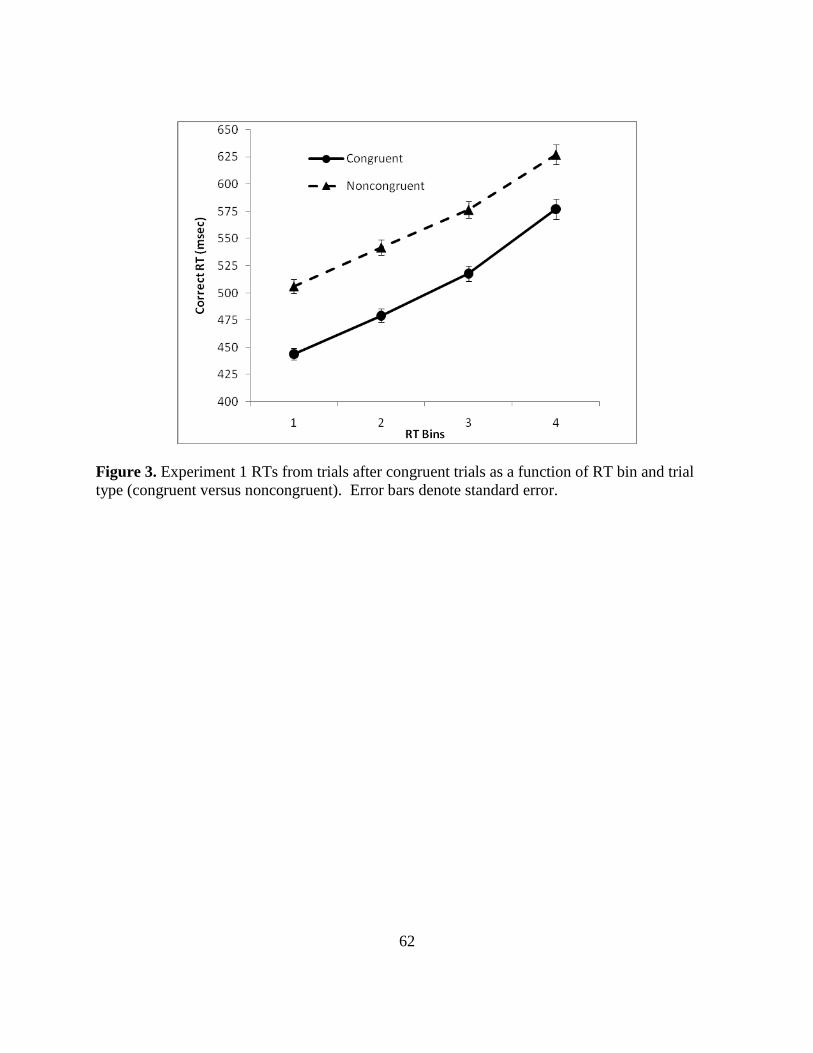
62
Figure 3. Experiment 1 RTs from trials after congruent trials as a function of RT bin and trial
type (congruent versus noncongruent). Error bars denote standard error.
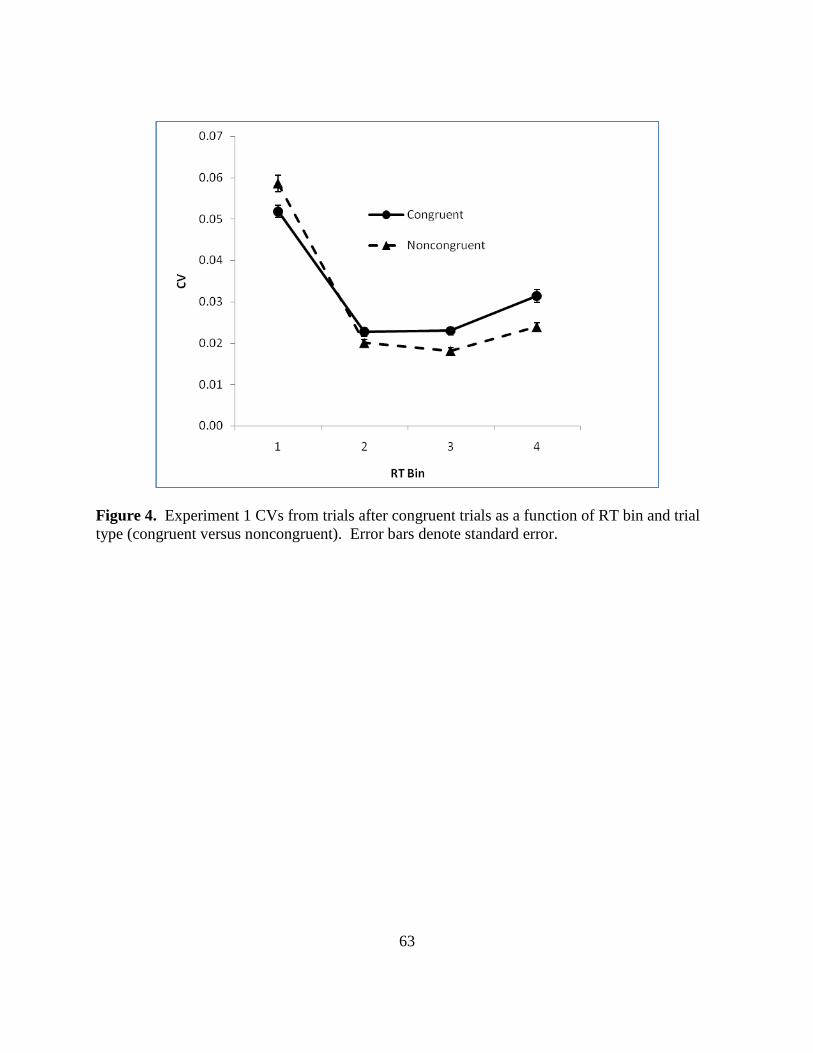
63
Figure 4. Experiment 1 CVs from trials after congruent trials as a function of RT bin and trial
type (congruent versus noncongruent). Error bars denote standard error.
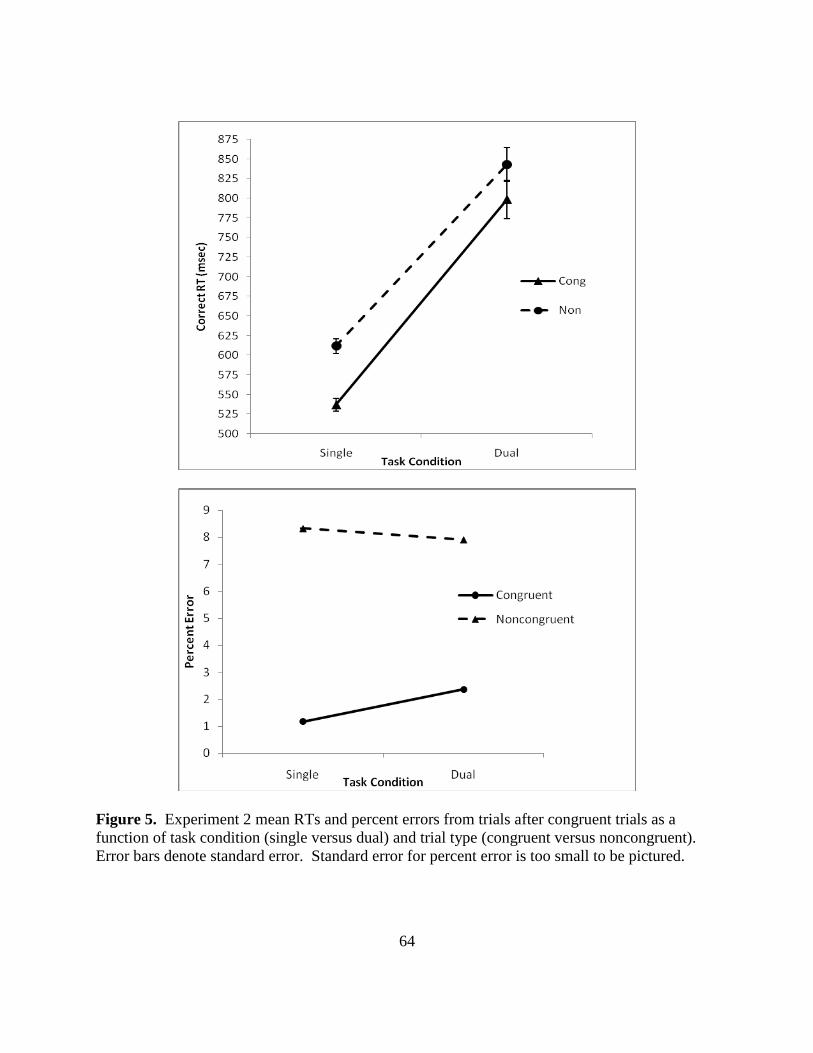
64
Figure 5. Experiment 2 mean RTs and percent errors from trials after congruent trials as a
function of task condition (single versus dual) and trial type (congruent versus noncongruent).
Error bars denote standard error. Standard error for percent error is too small to be pictured.
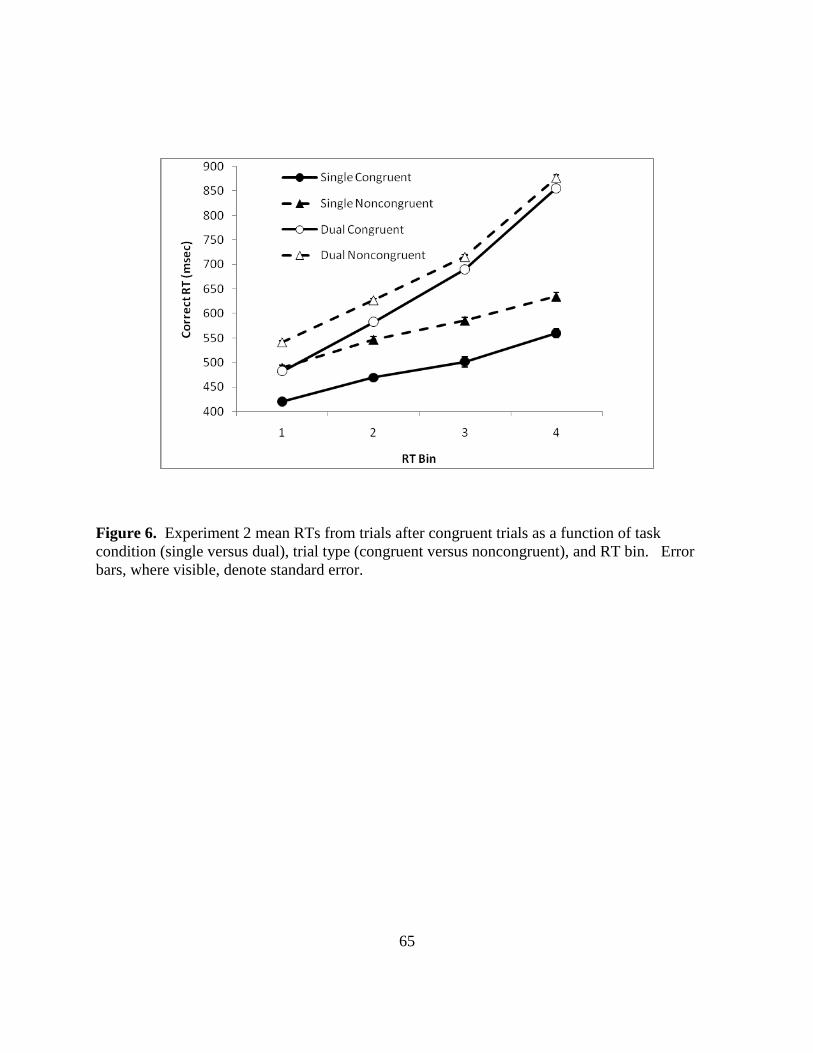
65
Figure 6. Experiment 2 mean RTs from trials after congruent trials as a function of task
condition (single versus dual), trial type (congruent versus noncongruent), and RT bin. Error
bars, where visible, denote standard error.
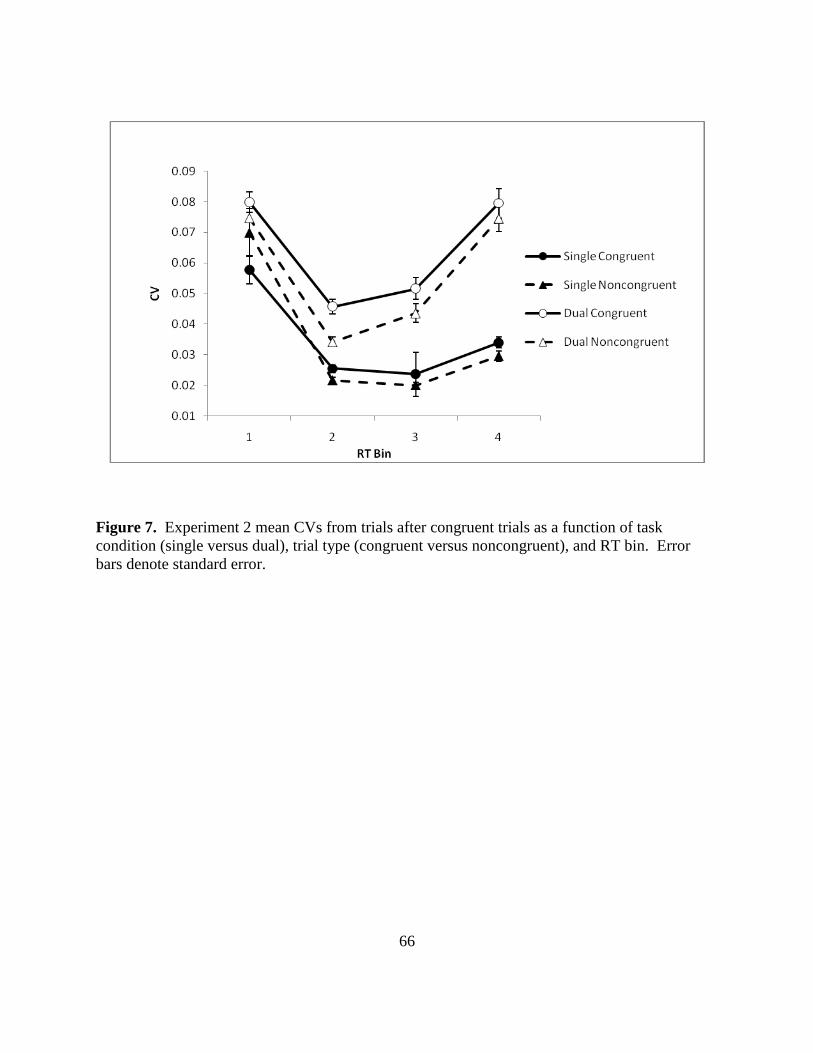
66
Figure 7. Experiment 2 mean CVs from trials after congruent trials as a function of task
condition (single versus dual), trial type (congruent versus noncongruent), and RT bin. Error
bars denote standard error.
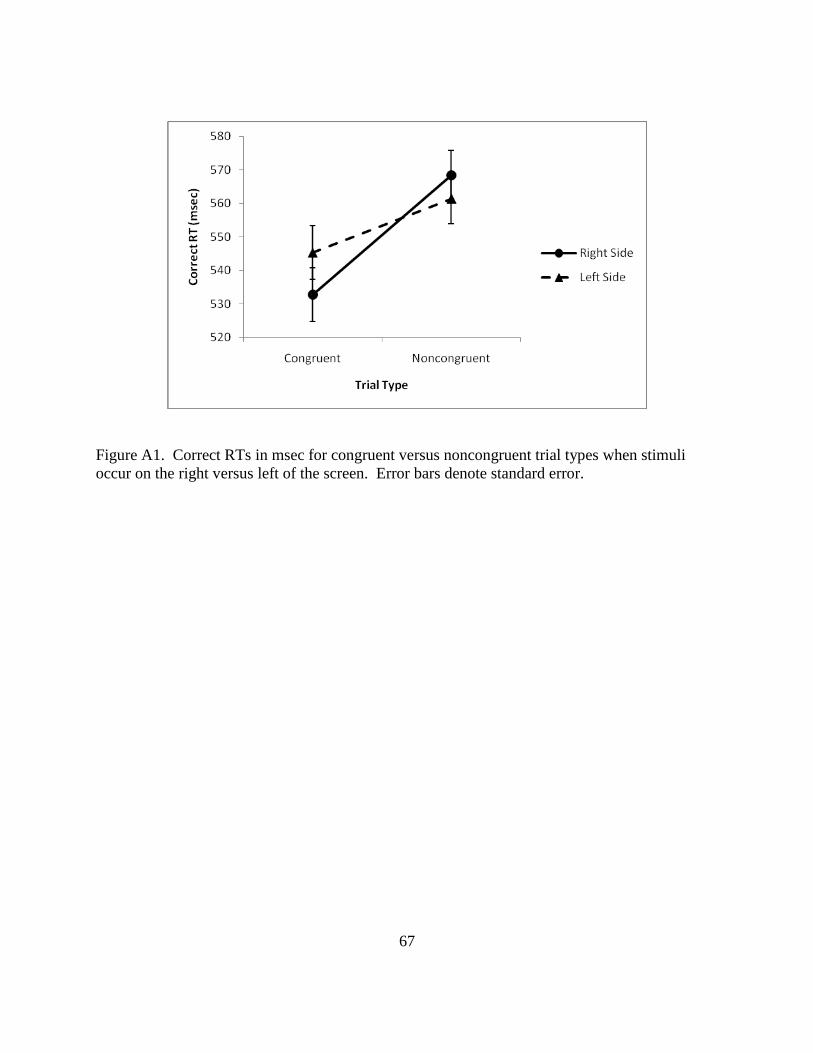
67
Figure A1. Correct RTs in msec for congruent versus noncongruent trial types when stimuli
occur on the right versus left of the screen. Error bars denote standard error.
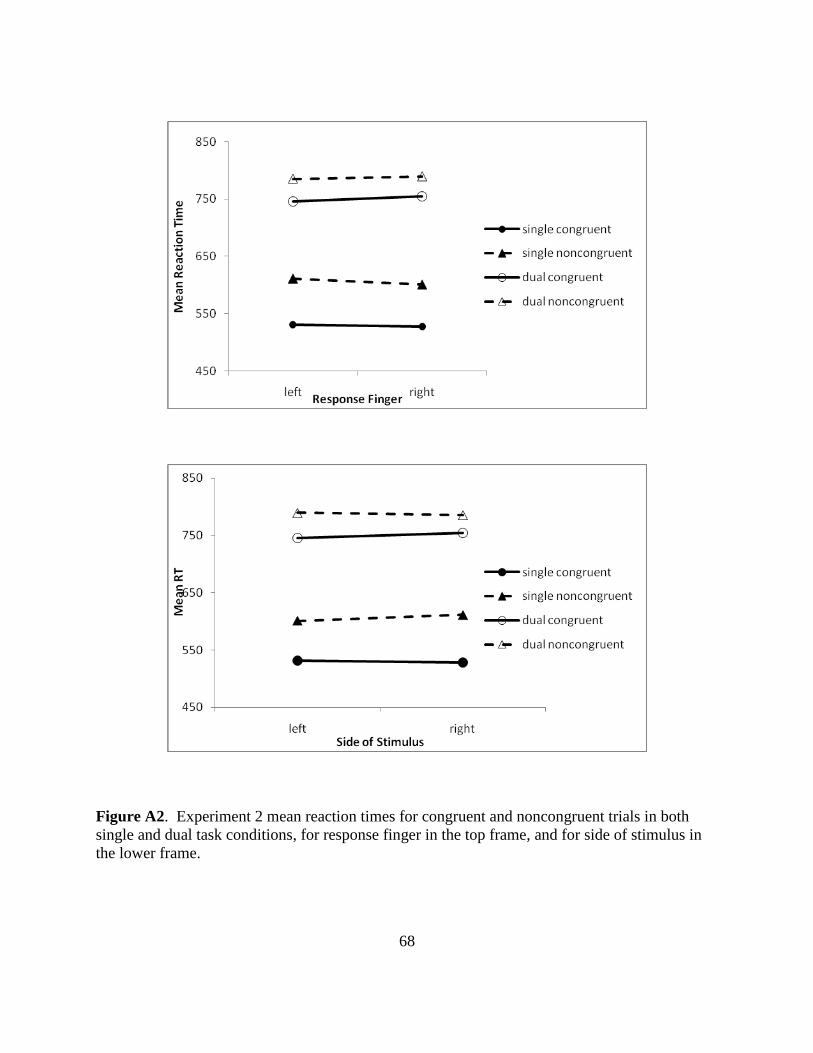
68
Figure A2. Experiment 2 mean reaction times for congruent and noncongruent trials in both
single and dual task conditions, for response finger in the top frame, and for side of stimulus in
the lower frame.
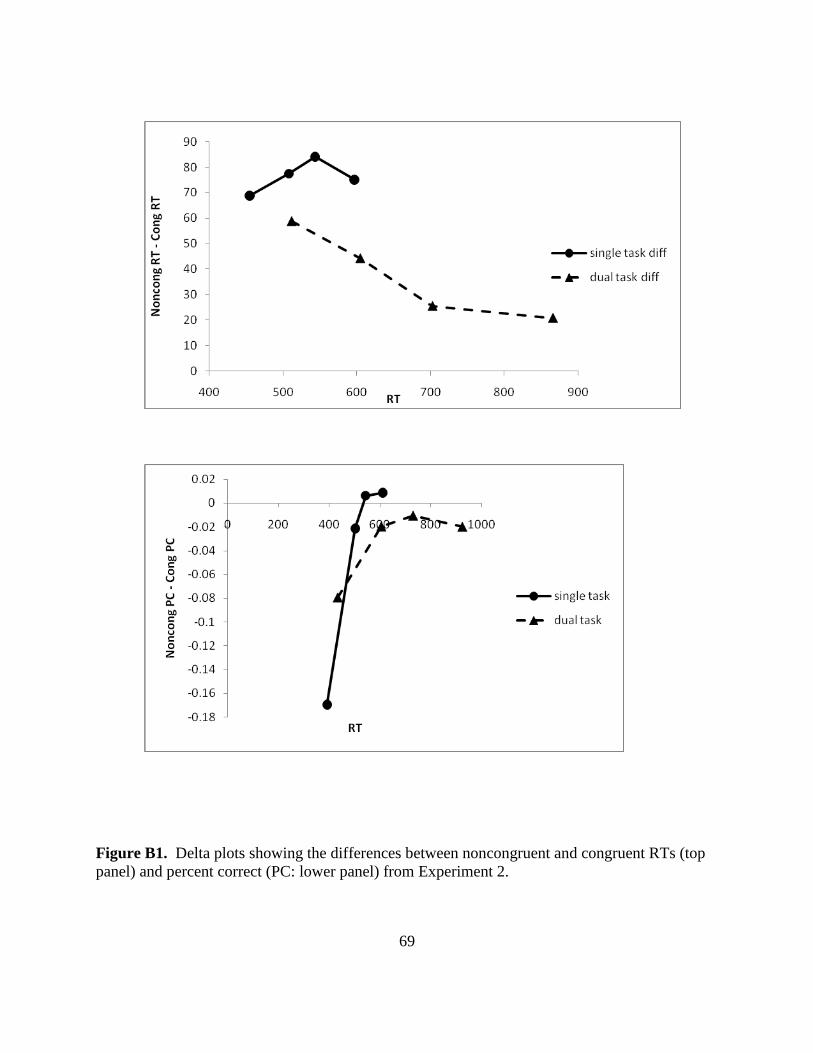
69
Figure B1. Delta plots showing the differences between noncongruent and congruent RTs (top
panel) and percent correct (PC: lower panel) from Experiment 2.