Embed Size (px)
Citation preview
Vanguard Global Minimum Volatility Fund
Annual Report | October 31, 2017
Contents
Please note: The opinions expressed in this report are just that—informed opinions. They should not be considered promisesor advice. Also, please keep in mind that the information and opinions cover the period through the date on the front of thisreport. Of course, the risks of investing in your fund are spelled out in the prospectus.
See the Glossary for definitions of investment terms used in this report.About the cover: Nautical images have been part of Vanguard’s rich heritage since its start in 1975. For anincoming ship, a lighthouse offers a beacon and safe path to shore. You can similarly depend on Vanguard to putyou first––and light the way––as you strive to meet your financial goals. Our client focus and low costs,stemming from our unique ownership structure, assure that your interests are paramount.
Vanguard’s Principles for Investing Success
We want to give you the best chance of investment success. Theseprinciples, grounded in Vanguard’s research and experience, can put you onthe right path.
Goals. Create clear, appropriate investment goals.
Balance. Develop a suitable asset allocation using broadly diversified funds.
Cost. Minimize cost.
Discipline. Maintain perspective and long-term discipline.
A single theme unites these principles: Focus on the things you can control.We believe there is no wiser course for any investor.
Your Fund’s Performance at a Glance. . . . . . . . . . . . . . . . . . 1
Chairman’s Perspective. . . . . . . . . . . . . . . . . . . . . . . . . . . . . 3
Advisor’s Report. . . . . . . . . . . . . . . . . . . . . . . . . . . . . . . . . . . 6
Fund Profile. . . . . . . . . . . . . . . . . . . . . . . . . . . . . . . . . . . . . . .9
Performance Summary. . . . . . . . . . . . . . . . . . . . . . . . . . . . .11
Financial Statements. . . . . . . . . . . . . . . . . . . . . . . . . . . . . . 13
Your Fund’s After-Tax Returns. . . . . . . . . . . . . . . . . . . . . . . 33
About Your Fund’s Expenses. . . . . . . . . . . . . . . . . . . . . . . . 34
Glossary. . . . . . . . . . . . . . . . . . . . . . . . . . . . . . . . . . . . . . . . 36
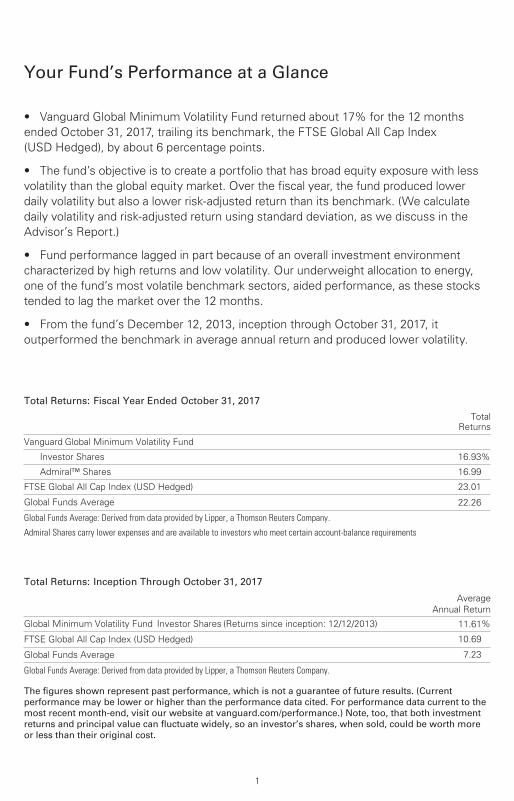
Your Fund’s Performance at a Glance
1
Total Returns: Fiscal Year Ended October 31, 2017
TotalReturns
Vanguard Global Minimum Volatility Fund
Investor Shares 16.93%
Admiral™ Shares 16.99
FTSE Global All Cap Index (USD Hedged) 23.01
Global Funds Average 22.26
Global Funds Average: Derived from data provided by Lipper, a Thomson Reuters Company.
Admiral Shares carry lower expenses and are available to investors who meet certain account-balance requirements
Total Returns: Inception Through October 31, 2017
Average
Annual Return
Global Minimum Volatility Fund Investor Shares (Returns since inception: 12/12/2013) 11.61%
FTSE Global All Cap Index (USD Hedged) 10.69
Global Funds Average 7.23
Global Funds Average: Derived from data provided by Lipper, a Thomson Reuters Company.
The figures shown represent past performance, which is not a guarantee of future results. (Current performance may be lower or higher than the performance data cited. For performance data current to the most recent month-end, visit our website at vanguard.com/performance.) Note, too, that both investment returns and principal value can fluctuate widely, so an investor’s shares, when sold, could be worth more or less than their original cost.
• Vanguard Global Minimum Volatility Fund returned about 17% for the 12 months
ended October 31, 2017, trailing its benchmark, the FTSE Global All Cap Index
(USD Hedged), by about 6 percentage points.
• The fund’s objective is to create a portfolio that has broad equity exposure with less
volatility than the global equity market. Over the fiscal year, the fund produced lower
daily volatility but also a lower risk-adjusted return than its benchmark. (We calculate
daily volatility and risk-adjusted return using standard deviation, as we discuss in the
Advisor’s Report.)
• Fund performance lagged in part because of an overall investment environment
characterized by high returns and low volatility. Our underweight allocation to energy,
one of the fund’s most volatile benchmark sectors, aided performance, as these stocks
tended to lag the market over the 12 months.
• From the fund’s December 12, 2013, inception through October 31, 2017, it
outperformed the benchmark in average annual return and produced lower volatility.
2
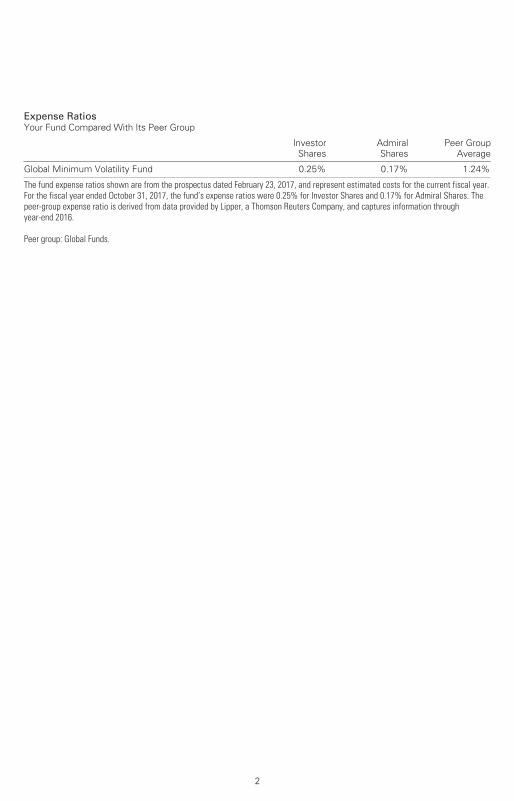
Expense RatiosYour Fund Compared With Its Peer Group
Investor
Shares
Admiral
Shares
Peer Group
Average
Global Minimum Volatility Fund 0.25% 0.17% 1.24%
The fund expense ratios shown are from the prospectus dated February 23, 2017, and represent estimated costs for the current fiscal year.For the fiscal year ended October 31, 2017, the fund’s expense ratios were 0.25% for Investor Shares and 0.17% for Admiral Shares. Thepeer-group expense ratio is derived from data provided by Lipper, a Thomson Reuters Company, and captures information throughyear-end 2016.
Peer group: Global Funds.
Dear Shareholder,
When I find outstanding products or
services, I’m likely to be loyal to them.
And my loyalty usually gets rewarded as
I experience consistently high quality––
whether it’s from a favorite restaurant
or a favorite author. What’s past, in
most cases, is prologue.
As tempting as it is to apply this rationale
to investing—for example, if technology
stocks have done well this year, they’re
bound to do well the next—it’s not all
that helpful and can actually be counter-
productive. You’ve heard it many times:
Past performance cannot be used to
predict future returns.
Taking a new approach
The caution about past performance is
so familiar that investors are apt to treat
it as mere background noise. That’s why
past-performance bias merited a fresh
look from Vanguard’s Investment Strategy
Group, which tackled the issue last year
in a research paper. (I encourage you to
read the full paper, Reframing Investor Choices: Right Mindset, Wrong Market, at vanguard.com/research.)
Our strategists were hardly the first to
delve into the topic, but they approached
it in a new way. They started with the
premise that it’s perfectly understandable
for investors to lean heavily on past
performance, because that works well in
many areas of life. After all, as the paper
describes, in lots of other industries and
realms, performance from one time period
Chairman’s Perspective
Bill McNabb
Chairman and Chief Executive Officer
3
to another is extremely consistent.
The researchers looked at everything
from cars to fine restaurants to heart
surgeons, and in all these examples,
past performance was a good predictor
of later outcomes.
It’s different with investing
In a nutshell, our brains typically are
rewarded and our satisfaction is boosted
when we use past performance as a guide
for navigating decisions, big and small. But
when applied to investing, this method
breaks down.
Why? Among other reasons, top-
performing asset classes one year
tend not to repeat as leaders the next.
Strong past performance leads to higher
valuations, making an investment, all else
being equal, less attractive in the future.
The data are quite overwhelming in
this regard.
By allowing past performance to inform
their decisions, individual and institutional
investors inadvertently end up as momen-
tum investors, putting them on a treadmill
of buying high and selling low.
A path to better decision-making
Of course, many investors are already
aware of the pitfalls of projecting past
performance into the future. The real
question is, what can we all do about it?
What does it take to go from having a
general awareness to actually changing
our behavior?
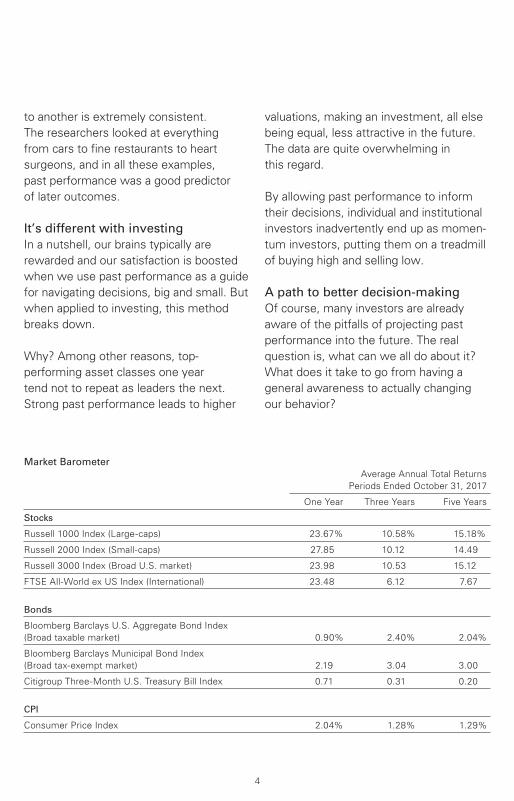
Market Barometer
Average Annual Total Returns
Periods Ended October 31, 2017
One Year Three Years Five Years
Stocks
Russell 1000 Index (Large-caps) 23.67% 10.58% 15.18%
Russell 2000 Index (Small-caps) 27.85 10.12 14.49
Russell 3000 Index (Broad U.S. market) 23.98 10.53 15.12
FTSE All-World ex US Index (International) 23.48 6.12 7.67
Bonds
Bloomberg Barclays U.S. Aggregate Bond Index
(Broad taxable market) 0.90% 2.40% 2.04%
Bloomberg Barclays Municipal Bond Index
(Broad tax-exempt market) 2.19 3.04 3.00
Citigroup Three-Month U.S. Treasury Bill Index 0.71 0.31 0.20
CPI
Consumer Price Index 2.04% 1.28% 1.29%
4
Acknowledging that such change isn’t
easy, our strategists offered a few ideas
for reframing how investors approach their
decisions. These recommendations were
targeted at advisors working with clients,
but they apply equally to individuals and
institutions:
• Educate yourself. The more investors
understand why a method that works so
well in other areas of life—relying on past
performance to drive decisions—doesn’t
carry over to investing, the better off
they’ll be.
• Be disciplined. The bias toward past
performance is ingrained in everybody,
professionals included, and shifting away
from it can be difficult. But the long-term
benefits make the effort worthwhile.
• Focus on what you can control. It’s
always most constructive for investors to
concentrate on what’s actually within their
control, such as setting goals, following
long-term portfolio construction principles,
selecting low-cost investments, and
rebalancing periodically.
Here’s to keeping the past in the rearview
mirror. And, as always, thank you for
investing with Vanguard.
Sincerely,
F. William McNabb III
Chairman and Chief Executive Officer
November 14, 2017
5
Advisor’s Report
6
For the 12 months ended October 31,
2017, Vanguard Global Minimum Volatility
Fund returned 16.93% for Investor Shares
and 16.99% for Admiral Shares, with an
annualized daily volatility of 5.96%. Its
benchmark, the FTSE Global All Cap Index
(USD Hedged), returned 23.01%, with
an annualized daily volatility of 6.18%.
(To get the annualized daily volatility, we
calculate the standard deviation of daily
returns and multiply it by the square root
of 252, generally the number of trading
days in a year.)
Investment objective Our objective is to create a portfolio
that has broad equity exposure with less
volatility than the global equity market.
We achieved this over the performance
period, as the fund’s daily volatility
averaged about 3.6% less than that
of its benchmark.
It is important to mention, as we have in
the past, that we do not target a specific
volatility level. Rather, we seek to provide
an equity fund that has lower absolute
risk than the broad global market. Thus,
when the broad global equity market is
experiencing periods of low volatility,
you should expect this fund’s volatility
to be much closer to the volatility level
of its benchmark.
We recognize that equity-like returns
are also an important outcome of an
investment in this fund, but achieving a
total return higher than the benchmark’s
is not our objective. Although our research
leads us to expect that, on average, a
minimum volatility fund may outperform
the overall global market in sharp down-
turns (while still experiencing losses), the
fund should be expected to trail in strong
bull markets like the one we experienced
over the 12 months. With that in mind,
because the fund is expected to have a
lower level of risk than the global equity
market, you should not expect it to
outperform the market over the long run.
We think an acceptable comparative
performance measure for the fund over
the long term is its risk-adjusted return.
This can be calculated by dividing the
portfolio’s total return for the period by
the annualized standard deviation of
daily returns. We view 12 months to be
a relatively short time, but for the annual
period, the risk-adjusted return was
about 2.84, compared with 3.74 for the
benchmark. Over a longer period—since
the fund’s inception on December 12,
2013—its risk-adjusted return was 1.32,
compared with 1.03 for the benchmark.
Investment strategyIn building our portfolio, we use quantitative
models that evaluate a variety of factors
that drive a stock’s volatility. These
fundamental drivers include risk factors
such as growth, value, dividend yields,
size, volatility, and liquidity. In addition,
our portfolio construction process includes
estimates of each stock’s correlation—or
how its factors move in relation to one
another. This approach allows us to make
appropriate risk/diversification trade-offs,
while not relying solely on volatility
estimates.
7
Our process also approaches currency
exposure and its impact on a portfolio
in a specific manner. We recognize that
owning companies in foreign markets
involves the risk of movements in
foreign currency exchange rates relative
to the U.S. dollar. Because of this, an
optimization process that focuses solely
on volatilities tied to an investor’s home
currency will tend to overweight
exposures to that currency. We aim to
avoid such currency-specific exposures
by focusing on equity volatilities and
correlations measured in local currency
terms. Then we use currency forward
contracts to hedge the resulting exposure
for U.S. investors. We believe this process
can further reduce the volatility of the
portfolio overall in the long run.
Finally, when constructing the portfolio,
we apply constraints to reduce stock,
sector, and country concentration risk.
We find that these constraints, which
allow for broader diversification and
liquidity, reduce unnecessarily high
risk exposures without significantly
affecting our ability to reduce overall
volatility. Drawing from the universe
of about 7,700 stocks in the FTSE index,
we construct a portfolio of about
400–450 stocks.
The investment environmentOverall global economic growth, though
uncertain and mixed at times, combined
with rising corporate earnings to support
a strong performance by the U.S. stock
market. Stock valuations also climbed as
investors embraced risk. U.S. economic
fundamentals remained firm amid
favorable consumer confidence,
unemployment, and GDP data. The
Federal Reserve acknowledged the
economy’s strength, pushing its federal
funds target rate to 1%–1.25% with
increases in March and June.
At its September meeting, the Fed
announced it would begin unwinding
its $4.5 trillion portfolio of government
securities in October. While keeping
interest rates unchanged in November,
the Fed reinforced the market’s view
that a December increase was likely,
and it reiterated that rates would probably
rise at a gradual pace given the economy’s
resilience.
Overseas, major central banks kept their
monetary policies accommodative. Political
uncertainty eased somewhat as voters in
the Netherlands and France turned back
nationalist candidates who were focused
on dismantling the European Union.
Stocks rose across Europe and Asia.
The fund’s successes and shortfallsWe have cautioned that during periods
of low volatility, expectations for the size
of the portfolio’s volatility discount relative
to the market should be tempered. During
the 12 months, we saw quite low volatility
levels for the fund’s benchmark.
It is important to recognize that there
will be periods such as this; however,
we maintain confidence in our process to
deliver lower volatility over the long term.
Even with this challenging environment,
8
the fund met its objective of lower
volatility than the broader equity market,
as measured by daily volatility for the
annual period. And we have achieved
this goal since the fund’s inception.
In addition, the benefits of our strategy
become even clearer when you seek
to remove some of the noise caused
by short-term reversals in daily returns,
which can increase volatility levels, and
focus on a longer return horizon such
as monthly returns. For example, since
inception, the fund has delivered about
a 31% reduction in the annualized
volatility of monthly returns relative
to its benchmark.
Despite a challenging environment over
the 12 months, our strategy of holding
stocks that have lower correlations with
one another provided diversification
benefits. On average, we were over-
weighted in less volatile sectors, such
as consumer staples, telecommunication
services, and utilities, and underweighted
in two of the benchmark’s more volatile
industry groups, energy and financials.
Our decision to underweight energy,
the fund’s most volatile sector, aided
performance as these stocks tended
to lag the overall market.
As for regional allocations, our overweight
allocation to North America and selection
in the Pacific region helped lower volatility,
while our positions in emerging markets
modestly increased volatility for the fund
compared with its benchmark.
We expect our approach to portfolio
construction to pay off in reduced
volatility over the long run. With this
in mind, we find that focusing on the
long-term risk-adjusted returns of the
portfolio relative to the benchmark
realigns expectations with the fund’s
objective. We thank you for your
investment and look forward to
serving our investors in the future.
Portfolio Managers:
Anatoly Shtekhman, CFA
Fei Xu, CFA
Vanguard Quantitative Equity Group
November 14, 2017
Global Minimum Volatility Fund
Fund ProfileAs of October 31, 2017
1 The expense ratios shown are from the prospectus dated February 23, 2017, and represent estimated costs for the current fiscal year. For the fiscal year ended October 31, 2017, the expense ratios were 0.25% for Investor Shares and 0.17% for Admiral Shares.
9
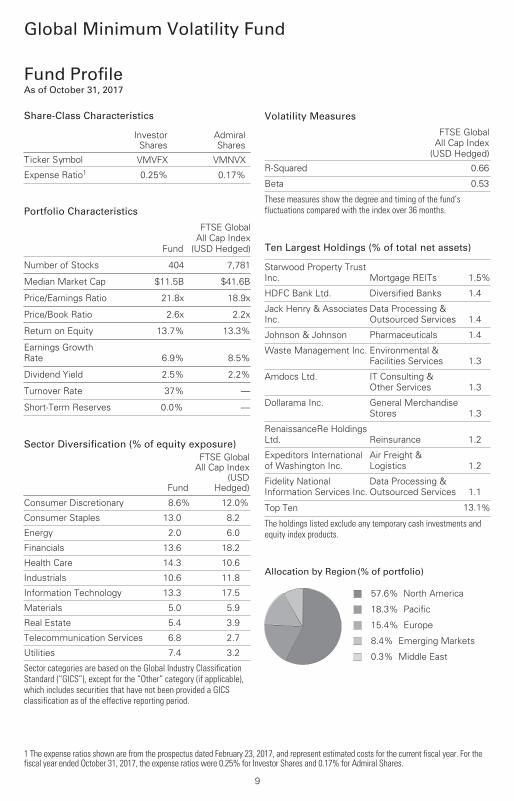
Volatility Measures
FTSE Global
All Cap Index
(USD Hedged)
R-Squared 0.66
Beta 0.53
These measures show the degree and timing of the fund’s fluctuations compared with the index over 36 months.Portfolio Characteristics
Fund
FTSE Global
All Cap Index
(USD Hedged)
Number of Stocks 404 7,781
Median Market Cap $11.5B $41.6B
Price/Earnings Ratio 21.8x 18.9x
Price/Book Ratio 2.6x 2.2x
Return on Equity 13.7% 13.3%
Earnings Growth
Rate 6.9% 8.5%
Dividend Yield 2.5% 2.2%
Turnover Rate 37% —
Short-Term Reserves 0.0% —
Share-Class Characteristics
InvestorShares
AdmiralShares
Ticker Symbol VMVFX VMNVX
Expense Ratio1 0.25% 0.17%
Sector Diversification (% of equity exposure)
Fund
FTSE GlobalAll Cap Index
(USDHedged)
Consumer Discretionary 8.6% 12.0%
Consumer Staples 13.0 8.2
Energy 2.0 6.0
Financials 13.6 18.2
Health Care 14.3 10.6
Industrials 10.6 11.8
Information Technology 13.3 17.5
Materials 5.0 5.9
Real Estate 5.4 3.9
Telecommunication Services 6.8 2.7
Utilities 7.4 3.2
Sector categories are based on the Global Industry ClassificationStandard (“GICS”), except for the “Other” category (if applicable),which includes securities that have not been provided a GICSclassification as of the effective reporting period.
Ten Largest Holdings (% of total net assets)
Starwood Property Trust
Inc. Mortgage REITs 1.5%
HDFC Bank Ltd. Diversified Banks 1.4
Jack Henry & Associates
Inc.
Data Processing &
Outsourced Services 1.4
Johnson & Johnson Pharmaceuticals 1.4
Waste Management Inc. Environmental &
Facilities Services 1.3
Amdocs Ltd. IT Consulting &
Other Services 1.3
Dollarama Inc. General Merchandise
Stores 1.3
RenaissanceRe Holdings
Ltd. Reinsurance 1.2
Expeditors International
of Washington Inc.
Air Freight &
Logistics 1.2
Fidelity National
Information Services Inc.
Data Processing &
Outsourced Services 1.1
Top Ten 13.1%
The holdings listed exclude any temporary cash investments andequity index products.
Allocation by Region (% of portfolio)
57.6% North America
18.3% Pacific
15.4% Europe
8.4% Emerging Markets
0.3% Middle East
Global Minimum Volatility Fund
10
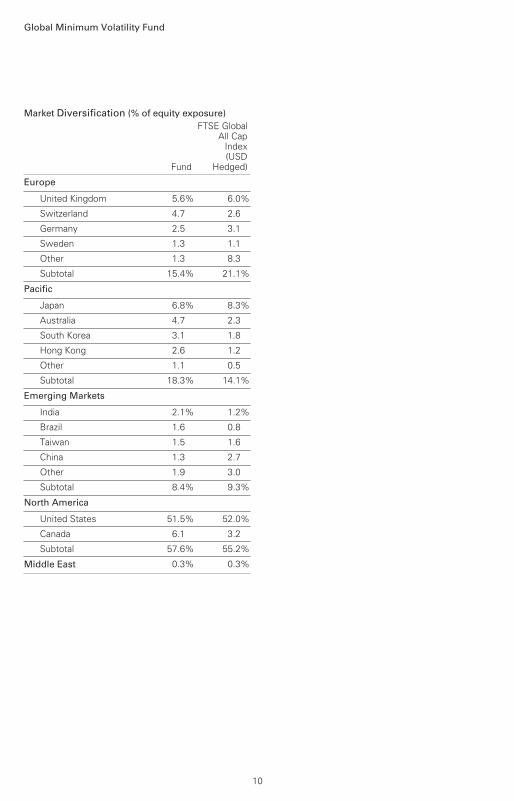
Market Diversification (% of equity exposure)
Fund
FTSE GlobalAll Cap
Index(USD
Hedged)
Europe
United Kingdom 5.6% 6.0%
Switzerland 4.7 2.6
Germany 2.5 3.1
Sweden 1.3 1.1
Other 1.3 8.3
Subtotal 15.4% 21.1%
Pacific
Japan 6.8% 8.3%
Australia 4.7 2.3
South Korea 3.1 1.8
Hong Kong 2.6 1.2
Other 1.1 0.5
Subtotal 18.3% 14.1%
Emerging Markets
India 2.1% 1.2%
Brazil 1.6 0.8
Taiwan 1.5 1.6
China 1.3 2.7
Other 1.9 3.0
Subtotal 8.4% 9.3%
North America
United States 51.5% 52.0%
Canada 6.1 3.2
Subtotal 57.6% 55.2%
Middle East 0.3% 0.3%
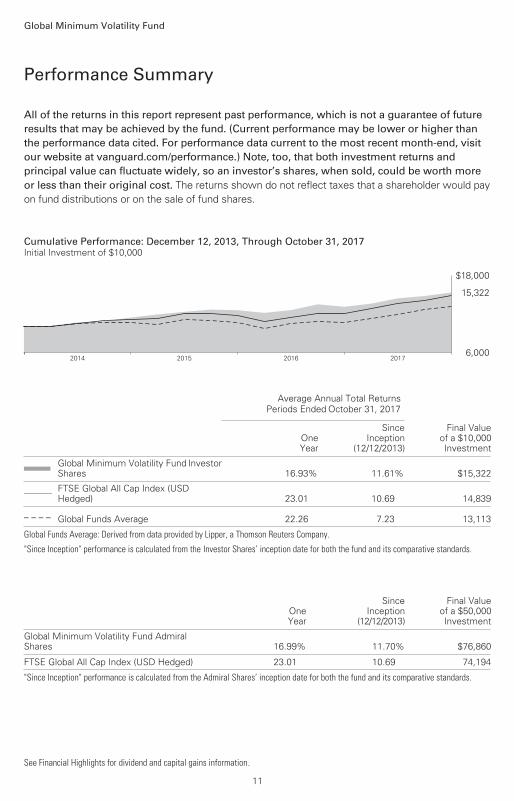
All of the returns in this report represent past performance, which is not a guarantee of future results that may be achieved by the fund. (Current performance may be lower or higher thanthe performance data cited. For performance data current to the most recent month-end, visitour website at vanguard.com/performance.) Note, too, that both investment returns and principal value can fluctuate widely, so an investor’s shares, when sold, could be worth more or less than their original cost. The returns shown do not reflect taxes that a shareholder would pay
on fund distributions or on the sale of fund shares.
Global Minimum Volatility Fund
Performance Summary
See Financial Highlights for dividend and capital gains information.
11
Cumulative Performance: December 12, 2013, Through October 31, 2017Initial Investment of $10,000
2017201620152014
$18,000
6,000
15,322
Average Annual Total Returns
Periods Ended October 31, 2017
OneYear
SinceInception
(12/12/2013)
Final Valueof a $10,000Investment
Global Minimum Volatility Fund InvestorShares 16.93% 11.61% $15,322
________ FTSE Global All Cap Index (USDHedged) 23.01 10.69 14,839
– – – – Global Funds Average 22.26 7.23 13,113
Global Funds Average: Derived from data provided by Lipper, a Thomson Reuters Company.
"Since Inception" performance is calculated from the Investor Shares’ inception date for both the fund and its comparative standards.
OneYear
SinceInception
(12/12/2013)
Final Valueof a $50,000Investment
Global Minimum Volatility Fund Admiral Shares 16.99% 11.70% $76,860
FTSE Global All Cap Index (USD Hedged) 23.01 10.69 74,194
"Since Inception" performance is calculated from the Admiral Shares’ inception date for both the fund and its comparative standards.
Global Minimum Volatility Fund
12
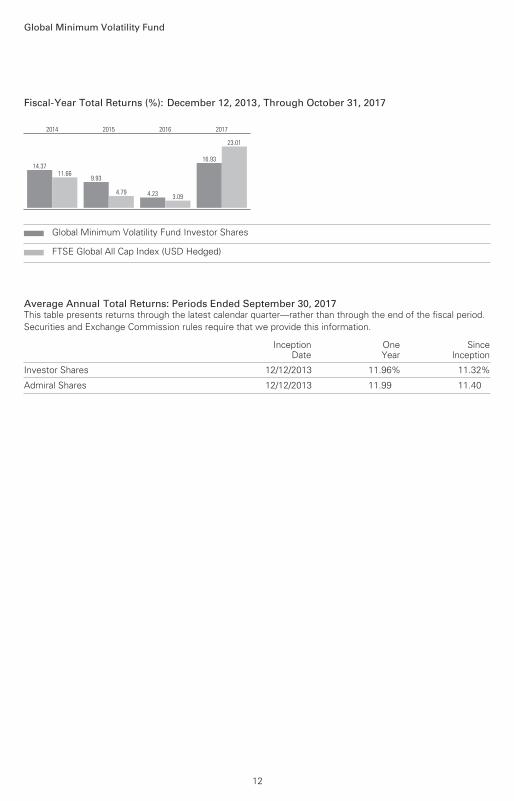
Fiscal-Year Total Returns (%): December 12, 2013, Through October 31, 2017
14.3711.66
2014
9.93
4.79
2015
4.23 3.09
2016
16.93
23.01
2017
Global Minimum Volatility Fund Investor Shares
FTSE Global All Cap Index (USD Hedged)
Average Annual Total Returns: Periods Ended September 30, 2017This table presents returns through the latest calendar quarter—rather than through the end of the fiscal period.Securities and Exchange Commission rules require that we provide this information.
InceptionDate
OneYear
SinceInception
Investor Shares 12/12/2013 11.96% 11.32%
Admiral Shares 12/12/2013 11.99 11.40
Market
Value•
Shares ($000)
Market
Value•
Shares ($000)
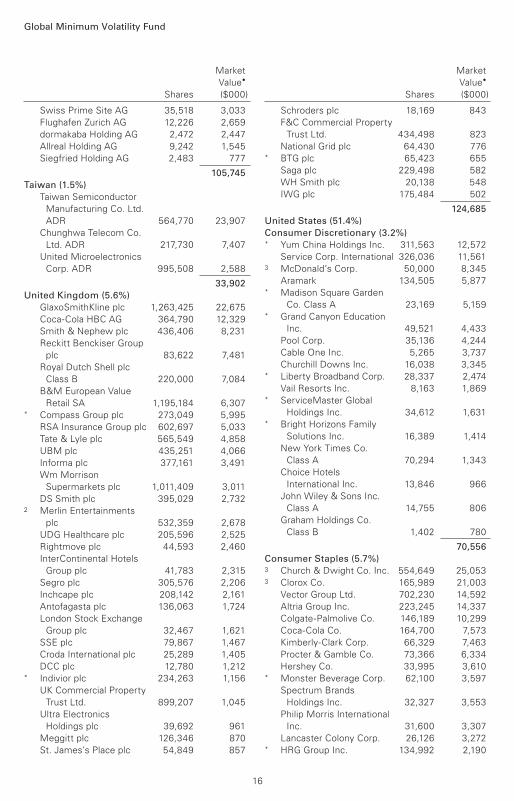
Common Stocks (99.4%)1
Australia (4.6%)
AGL Energy Ltd. 983,833 19,048
Wesfarmers Ltd. 367,202 11,762
Cochlear Ltd. 70,913 9,552
Stockland 2,204,185 7,640
Sonic Healthcare Ltd. 411,694 6,876
Transurban Group 728,039 6,768
ASX Ltd. 141,615 5,859
Woolworths Ltd. 273,950 5,431
Caltex Australia Ltd. 206,011 5,409
BHP Billiton Ltd. 148,262 3,053^ JB Hi-Fi Ltd. 150,037 2,634
Woodside Petroleum Ltd. 101,948 2,403
Amcor Ltd. 176,247 2,139
AMP Ltd. 553,612 2,110
GPT Group 514,397 2,009
Coca-Cola Amatil Ltd. 195,045 1,218
Challenger Ltd. 115,999 1,183
Treasury Wine Estates
Ltd. 98,390 1,181
Computershare Ltd. 97,458 1,165
Crown Resorts Ltd. 120,123 1,068
BWP Trust 383,701 908
Goodman Group 119,454 766
Aristocrat Leisure Ltd. 39,167 708
Ramsay Health Care Ltd. 12,064 619
Charter Hall Retail REIT 191,055 594
IOOF Holdings Ltd. 62,914 519
102,622
Austria (0.1%)
voestalpine AG 31,541 1,734
Belgium (0.4%)
Colruyt SA 126,301 6,460
Elia System Operator
SA/NV 23,212 1,346
Sofina SA 6,290 946
Cofinimmo SA 5,474 694
Ackermans & van
Haaren NV 2,298 394
9,840
Brazil (1.6%)
Telefonica Brasil SA
ADR 966,926 14,891
Ambev SA ADR 1,870,822 11,842
Ultrapar Participacoes
SA ADR 283,674 6,777
TIM Participacoes
SA ADR 117,950 2,175
35,685
Canada (6.1%) ^ Dollarama Inc. 253,752 28,247
Emera Inc. 608,272 22,914
BCE Inc. 464,284 21,438
TELUS Corp. 519,828 18,825
Shaw Communications
Inc. Class B 454,952 10,389^ Canadian Tire Corp. Ltd.
Class A 81,280 9,973
Intact Financial Corp. 95,668 7,820
Pembina Pipeline Corp. 108,535 3,588
Bank of Montreal 44,878 3,438
National Bank of Canada 60,737 2,948
TransCanada Corp. 30,225 1,435
Fortis Inc. 34,129 1,257
Metro Inc. 38,536 1,213^ Cineplex Inc. 32,635 9872 Hydro One Ltd. 53,573 947* CGI Group Inc. Class A 15,863 843
Power Corp. of Canada 17,850 458
136,720
Chile (0.2%)
Sociedad Quimica y
Minera de Chile SA ADR 33,815 2,020
Enel Americas SA ADR 157,624 1,671
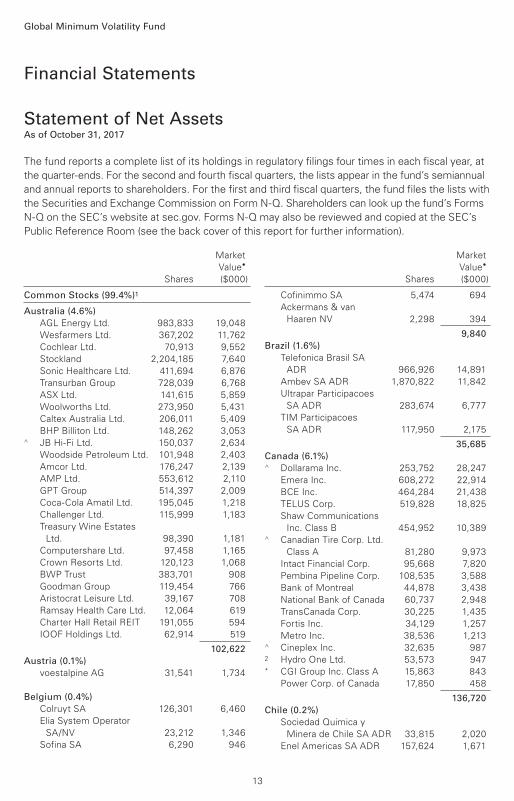
Financial Statements
Statement of Net AssetsAs of October 31, 2017
The fund reports a complete list of its holdings in regulatory filings four times in each fiscal year, at
the quarter-ends. For the second and fourth fiscal quarters, the lists appear in the fund’s semiannual
and annual reports to shareholders. For the first and third fiscal quarters, the fund files the lists with
the Securities and Exchange Commission on Form N-Q. Shareholders can look up the fund’s Forms
N-Q on the SEC’s website at sec.gov. Forms N-Q may also be reviewed and copied at the SEC’s
Public Reference Room (see the back cover of this report for further information).
Global Minimum Volatility Fund
13
Global Minimum Volatility Fund
Market
Value•
Shares ($000)
Market
Value•
Shares ($000)
Cia Cervecerias Unidas
SA ADR 30,786 877
Banco Santander Chile
ADR 20,561 643
5,211
China (1.3%)
China Mobile Ltd. ADR 443,347 22,367* SINA Corp. 61,377 6,607* Weibo Corp. ADR 6,137 569
29,543
Denmark (0.0%) * William Demant Holding
A/S 30,782 889
Finland (0.0%)
Orion Oyj Class B 11,087 455
France (0.1%)
Thales SA 10,911 1,137
Germany (2.4%)
Deutsche Post AG 356,181 16,328
Wirecard AG 143,070 14,214
Merck KGaA 50,401 5,408
MTU Aero Engines AG 27,951 4,730
Fielmann AG 39,184 3,443
Henkel AG & Co. KGaA
Preference Shares 24,216 3,400
Beiersdorf AG 13,977 1,572
RHOEN-KLINIKUM AG 44,814 1,565
adidas AG 5,021 1,118
Rheinmetall AG 6,494 771
Aurubis AG 8,146 668
Axel Springer SE 8,828 594
Freenet AG 16,718 560
54,371
Hong Kong (2.6%)
CLP Holdings Ltd. 2,269,350 23,097
Power Assets Holdings
Ltd. 1,206,000 10,455
Hang Seng Bank Ltd. 424,500 10,062
Yuexiu REIT 5,326,000 3,359
China Mengniu Dairy
Co. Ltd. 1,183,000 3,278
Want Want China
Holdings Ltd. 3,487,000 2,855
Chow Tai Fook
Jewellery Group Ltd. 1,969,600 2,059
CK Infrastructure
Holdings Ltd. 217,500 1,894
MTR Corp. Ltd. 104,500 606
57,665
India (2.1%)
HDFC Bank Ltd. ADR 349,409 32,250
Infosys Ltd. ADR 566,638 8,415
Dr Reddy’s Laboratories
Ltd. ADR 160,635 5,8422 Reliance Industries Ltd.
GDR 26,708 767
ICICI Bank Ltd. ADR 68,302 625
47,899
Indonesia (0.4%)
Telekomunikasi Indonesia
Persero Tbk PT ADR 286,923 8,619
Israel (0.3%)
Bank Hapoalim BM 679,226 4,809
Paz Oil Co. Ltd. 5,690 929
5,738
Italy (0.0%)
Recordati SPA 23,219 1,079
Japan (6.7%)
Daiichi Sankyo Co. Ltd. 553,600 12,715
Takeda Pharmaceutical
Co. Ltd. 205,600 11,593
Canon Inc. 286,700 10,770
Mitsubishi Tanabe
Pharma Corp. 477,100 10,501
Eisai Co. Ltd. 156,900 8,733
Otsuka Holdings Co. Ltd. 208,000 8,689
Japan Tobacco Inc. 251,500 8,325
Sawai Pharmaceutical
Co. Ltd. 136,000 7,714
Kagome Co. Ltd. 230,700 7,683
Hitachi Kokusai Electric
Inc. 176,300 4,884
Yamada Denki Co. Ltd. 843,400 4,486
Chugai Pharmaceutical
Co. Ltd. 92,300 4,401
Toho Co. Ltd. 107,900 3,575
Toyo Suisan Kaisha Ltd. 86,800 3,339
Skylark Co. Ltd. 209,500 3,134
Taisho Pharmaceutical
Holdings Co. Ltd. 37,700 2,871
Nitori Holdings Co. Ltd. 19,100 2,776
Sumitomo Dainippon
Pharma Co. Ltd. 185,900 2,653
ABC-Mart Inc. 46,700 2,356
Unicharm Corp. 93,400 2,125
K’s Holdings Corp. 90,200 2,070
MOS Food Services Inc. 60,500 1,850
COMSYS Holdings Corp. 72,500 1,836
NEC Corp. 65,000 1,784
NH Foods Ltd. 58,000 1,668
14
Global Minimum Volatility Fund
Market
Value•
Shares ($000)
Market
Value•
Shares ($000)
Shimamura Co. Ltd. 12,700 1,415
Pigeon Corp. 37,600 1,334
Sankyo Co. Ltd. 40,300 1,301
Takashimaya Co. Ltd. 137,000 1,261
Rohto Pharmaceutical
Co. Ltd. 51,000 1,177
Nissin Foods Holdings
Co. Ltd. 17,800 1,121
Tsumura & Co. 27,900 1,037
Hisamitsu Pharmaceutical
Co. Inc. 17,100 941
Nisshin Seifun Group Inc. 49,400 868
Kamigumi Co. Ltd. 36,000 862
Ryohin Keikaku Co. Ltd. 2,600 767
Kura Corp. 15,800 707
Nichirei Corp. 26,800 690
Studio Alice Co. Ltd. 28,500 659
Hitachi Metals Ltd. 50,100 649
Earth Chemical Co. Ltd. 13,200 620
UACJ Corp. 20,900 616
Benesse Holdings Inc. 17,500 593
Bic Camera Inc. 45,200 557
149,706
Mexico (0.7%)
Fomento Economico
Mexicano SAB de CV
ADR 151,059 13,255
Grupo Televisa SAB ADR 92,350 2,022
15,277
New Zealand (0.2%)
Spark New Zealand Ltd. 1,236,367 3,115* a2 Milk Co. Ltd. 173,690 1,031
4,146
Norway (0.5%)
Orkla ASA 925,762 9,068^ Telenor ASA 53,574 1,138
10,206
Russia (0.6%)
MMC Norilsk Nickel
PJSC ADR 333,583 6,139
Novatek PJSC GDR 50,176 5,727
Novolipetsk Steel PJSC
GDR 74,135 1,709
Severstal PJSC GDR 36,969 564
14,139
Singapore (0.9%)
Oversea-Chinese
Banking Corp. Ltd. 1,241,848 10,846
United Overseas Bank
Ltd. 306,300 5,533
Singapore Airlines Ltd. 211,800 1,596
Singapore
Telecommunications
Ltd. 369,400 1,017
Singapore Exchange Ltd. 121,900 686
19,678
South Korea (3.1%)
Korea Zinc Co. Ltd. 34,802 15,919
KT Corp. 510,114 13,388
SK Telecom Co. Ltd. 29,049 6,858
S-Oil Corp. 43,154 4,961
KT&G Corp. 45,107 4,271
POSCO 12,301 3,586
Woori Bank 238,188 3,486
GS Holdings Corp. 51,116 3,027
SK Innovation Co. Ltd. 11,966 2,195* Maeil Dairies Co. Ltd. 33,866 2,121
Samsung Fire & Marine
Insurance Co. Ltd. 8,447 2,061
Samsung Electronics Co.
Ltd. Preference Shares 975 1,953
Kangwon Land Inc. 42,410 1,300* Orion Corp. 12,139 1,151
Yuhan Corp. 5,601 1,021
Macquarie Korea
Infrastructure Fund 106,880 813
Hyundai Department
Store Co. Ltd. 6,499 531
Lotte Chilsung Beverage
Co. Ltd. 260 321
Lotte Confectionery
Co. Ltd. 3,308 220
69,183
Spain (0.0%)
Viscofan SA 9,941 602
Ebro Foods SA 17,809 428
1,030
Sweden (1.3%)
Swedish Match AB 418,420 15,762* Essity AB Class B 174,354 5,211
Tele2 AB 225,278 2,866
ICA Gruppen AB 61,545 2,270
Telia Co. AB 450,547 2,085
28,194
Switzerland (4.7%)
Swisscom AG 49,515 25,016
Sonova Holding AG 113,003 20,401
Kuehne & Nagel
International AG 108,640 18,981
Logitech International SA 301,217 10,771
Baloise Holding AG 54,703 8,624
Straumann Holding AG 8,978 6,268
Partners Group Holding
AG 7,766 5,223
15
Global Minimum Volatility Fund
Market
Value•
Shares ($000)
Market
Value•
Shares ($000)
Swiss Prime Site AG 35,518 3,033
Flughafen Zurich AG 12,226 2,659
dormakaba Holding AG 2,472 2,447
Allreal Holding AG 9,242 1,545
Siegfried Holding AG 2,483 777
105,745
Taiwan (1.5%)
Taiwan Semiconductor
Manufacturing Co. Ltd.
ADR 564,770 23,907
Chunghwa Telecom Co.
Ltd. ADR 217,730 7,407
United Microelectronics
Corp. ADR 995,508 2,588
33,902
United Kingdom (5.6%)
GlaxoSmithKline plc 1,263,425 22,675
Coca-Cola HBC AG 364,790 12,329
Smith & Nephew plc 436,406 8,231
Reckitt Benckiser Group
plc 83,622 7,481
Royal Dutch Shell plc
Class B 220,000 7,084
B&M European Value
Retail SA 1,195,184 6,307* Compass Group plc 273,049 5,995
RSA Insurance Group plc 602,697 5,033
Tate & Lyle plc 565,549 4,858
UBM plc 435,251 4,066
Informa plc 377,161 3,491
Wm Morrison
Supermarkets plc 1,011,409 3,011
DS Smith plc 395,029 2,7322 Merlin Entertainments
plc 532,359 2,678
UDG Healthcare plc 205,596 2,525
Rightmove plc 44,593 2,460
InterContinental Hotels
Group plc 41,783 2,315
Segro plc 305,576 2,206
Inchcape plc 208,142 2,161
Antofagasta plc 136,063 1,724
London Stock Exchange
Group plc 32,467 1,621
SSE plc 79,867 1,467
Croda International plc 25,289 1,405
DCC plc 12,780 1,212* Indivior plc 234,263 1,156
UK Commercial Property
Trust Ltd. 899,207 1,045
Ultra Electronics
Holdings plc 39,692 961
Meggitt plc 126,346 870
St. James’s Place plc 54,849 857
Schroders plc 18,169 843
F&C Commercial Property
Trust Ltd. 434,498 823
National Grid plc 64,430 776* BTG plc 65,423 655
Saga plc 229,498 582
WH Smith plc 20,138 548
IWG plc 175,484 502
124,685
United States (51.4%)
Consumer Discretionary (3.2%) * Yum China Holdings Inc. 311,563 12,572
Service Corp. International 326,036 11,5613 McDonald’s Corp. 50,000 8,345
Aramark 134,505 5,877* Madison Square Garden
Co. Class A 23,169 5,159* Grand Canyon Education
Inc. 49,521 4,433
Pool Corp. 35,136 4,244
Cable One Inc. 5,265 3,737
Churchill Downs Inc. 16,038 3,345* Liberty Broadband Corp. 28,337 2,474
Vail Resorts Inc. 8,163 1,869* ServiceMaster Global
Holdings Inc. 34,612 1,631* Bright Horizons Family
Solutions Inc. 16,389 1,414
New York Times Co.
Class A 70,294 1,343
Choice Hotels
International Inc. 13,846 966
John Wiley & Sons Inc.
Class A 14,755 806
Graham Holdings Co.
Class B 1,402 780
70,556
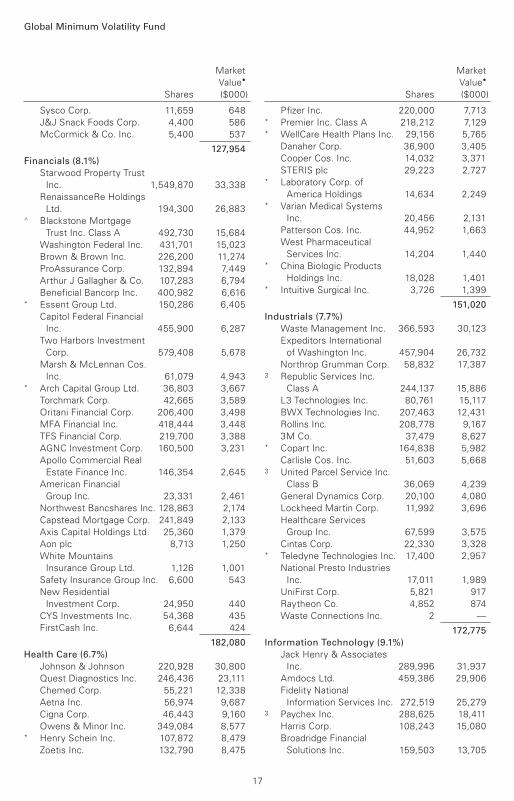
Consumer Staples (5.7%) 3 Church & Dwight Co. Inc. 554,649 25,0533 Clorox Co. 165,989 21,003
Vector Group Ltd. 702,230 14,592
Altria Group Inc. 223,245 14,337
Colgate-Palmolive Co. 146,189 10,299
Coca-Cola Co. 164,700 7,573
Kimberly-Clark Corp. 66,329 7,463
Procter & Gamble Co. 73,366 6,334
Hershey Co. 33,995 3,610* Monster Beverage Corp. 62,100 3,597
Spectrum Brands
Holdings Inc. 32,327 3,553
Philip Morris International
Inc. 31,600 3,307
Lancaster Colony Corp. 26,126 3,272* HRG Group Inc. 134,992 2,190
16
Global Minimum Volatility Fund
Market
Value•
Shares ($000)
Market
Value•
Shares ($000)
Sysco Corp. 11,659 648
J&J Snack Foods Corp. 4,400 586
McCormick & Co. Inc. 5,400 537
127,954
Financials (8.1%)
Starwood Property Trust
Inc. 1,549,870 33,338
RenaissanceRe Holdings
Ltd. 194,300 26,883^ Blackstone Mortgage
Trust Inc. Class A 492,730 15,684
Washington Federal Inc. 431,701 15,023
Brown & Brown Inc. 226,200 11,274
ProAssurance Corp. 132,894 7,449
Arthur J Gallagher & Co. 107,283 6,794
Beneficial Bancorp Inc. 400,982 6,616* Essent Group Ltd. 150,286 6,405
Capitol Federal Financial
Inc. 455,900 6,287
Two Harbors Investment
Corp. 579,408 5,678
Marsh & McLennan Cos.
Inc. 61,079 4,943* Arch Capital Group Ltd. 36,803 3,667
Torchmark Corp. 42,665 3,589
Oritani Financial Corp. 206,400 3,498
MFA Financial Inc. 418,444 3,448
TFS Financial Corp. 219,700 3,388
AGNC Investment Corp. 160,500 3,231
Apollo Commercial Real
Estate Finance Inc. 146,354 2,645
American Financial
Group Inc. 23,331 2,461
Northwest Bancshares Inc. 128,863 2,174
Capstead Mortgage Corp. 241,849 2,133
Axis Capital Holdings Ltd. 25,360 1,379
Aon plc 8,713 1,250
White Mountains
Insurance Group Ltd. 1,126 1,001
Safety Insurance Group Inc. 6,600 543
New Residential
Investment Corp. 24,950 440
CYS Investments Inc. 54,368 435
FirstCash Inc. 6,644 424
182,080
Health Care (6.7%)
Johnson & Johnson 220,928 30,800
Quest Diagnostics Inc. 246,436 23,111
Chemed Corp. 55,221 12,338
Aetna Inc. 56,974 9,687
Cigna Corp. 46,443 9,160
Owens & Minor Inc. 349,084 8,577* Henry Schein Inc. 107,872 8,479
Zoetis Inc. 132,790 8,475
Pfizer Inc. 220,000 7,713* Premier Inc. Class A 218,212 7,129* WellCare Health Plans Inc. 29,156 5,765
Danaher Corp. 36,900 3,405
Cooper Cos. Inc. 14,032 3,371
STERIS plc 29,223 2,727* Laboratory Corp. of
America Holdings 14,634 2,249* Varian Medical Systems
Inc. 20,456 2,131
Patterson Cos. Inc. 44,952 1,663
West Pharmaceutical
Services Inc. 14,204 1,440* China Biologic Products
Holdings Inc. 18,028 1,401* Intuitive Surgical Inc. 3,726 1,399
151,020
Industrials (7.7%)
Waste Management Inc. 366,593 30,123
Expeditors International
of Washington Inc. 457,904 26,732
Northrop Grumman Corp. 58,832 17,3873 Republic Services Inc.
Class A 244,137 15,886
L3 Technologies Inc. 80,761 15,117
BWX Technologies Inc. 207,463 12,431
Rollins Inc. 208,778 9,167
3M Co. 37,479 8,627* Copart Inc. 164,838 5,982
Carlisle Cos. Inc. 51,603 5,6683 United Parcel Service Inc.
Class B 36,069 4,239
General Dynamics Corp. 20,100 4,080
Lockheed Martin Corp. 11,992 3,696
Healthcare Services
Group Inc. 67,599 3,575
Cintas Corp. 22,330 3,328* Teledyne Technologies Inc. 17,400 2,957
National Presto Industries
Inc. 17,011 1,989
UniFirst Corp. 5,821 917
Raytheon Co. 4,852 874
Waste Connections Inc. 2 —
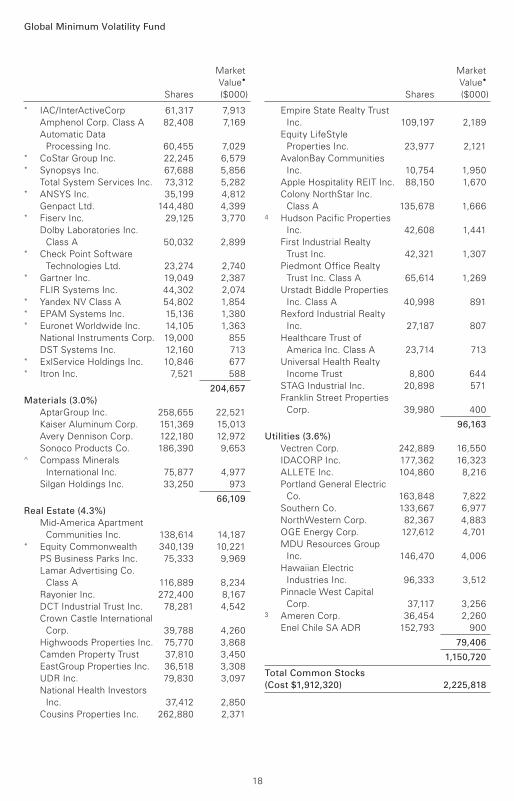
172,775
Information Technology (9.1%)
Jack Henry & Associates
Inc. 289,996 31,937
Amdocs Ltd. 459,386 29,906
Fidelity National
Information Services Inc. 272,519 25,2793 Paychex Inc. 288,625 18,411
Harris Corp. 108,243 15,080
Broadridge Financial
Solutions Inc. 159,503 13,705
17
Global Minimum Volatility Fund
Market
Value•
Shares ($000)
Market
Value•
Shares ($000)
* IAC/InterActiveCorp 61,317 7,913
Amphenol Corp. Class A 82,408 7,169
Automatic Data
Processing Inc. 60,455 7,029* CoStar Group Inc. 22,245 6,579* Synopsys Inc. 67,688 5,856
Total System Services Inc. 73,312 5,282* ANSYS Inc. 35,199 4,812
Genpact Ltd. 144,480 4,399* Fiserv Inc. 29,125 3,770
Dolby Laboratories Inc.
Class A 50,032 2,899* Check Point Software
Technologies Ltd. 23,274 2,740* Gartner Inc. 19,049 2,387
FLIR Systems Inc. 44,302 2,074* Yandex NV Class A 54,802 1,854* EPAM Systems Inc. 15,136 1,380* Euronet Worldwide Inc. 14,105 1,363
National Instruments Corp. 19,000 855
DST Systems Inc. 12,160 713* ExlService Holdings Inc. 10,846 677* Itron Inc. 7,521 588
204,657
Materials (3.0%)
AptarGroup Inc. 258,655 22,521
Kaiser Aluminum Corp. 151,369 15,013
Avery Dennison Corp. 122,180 12,972
Sonoco Products Co. 186,390 9,653^ Compass Minerals
International Inc. 75,877 4,977
Silgan Holdings Inc. 33,250 973
66,109
Real Estate (4.3%)
Mid-America Apartment
Communities Inc. 138,614 14,187* Equity Commonwealth 340,139 10,221
PS Business Parks Inc. 75,333 9,969
Lamar Advertising Co.
Class A 116,889 8,234
Rayonier Inc. 272,400 8,167
DCT Industrial Trust Inc. 78,281 4,542
Crown Castle International
Corp. 39,788 4,260
Highwoods Properties Inc. 75,770 3,868
Camden Property Trust 37,810 3,450
EastGroup Properties Inc. 36,518 3,308
UDR Inc. 79,830 3,097
National Health Investors
Inc. 37,412 2,850
Cousins Properties Inc. 262,880 2,371
Empire State Realty Trust
Inc. 109,197 2,189
Equity LifeStyle
Properties Inc. 23,977 2,121
AvalonBay Communities
Inc. 10,754 1,950
Apple Hospitality REIT Inc. 88,150 1,670
Colony NorthStar Inc.
Class A 135,678 1,6664 Hudson Pacific Properties
Inc. 42,608 1,441
First Industrial Realty
Trust Inc. 42,321 1,307
Piedmont Office Realty
Trust Inc. Class A 65,614 1,269
Urstadt Biddle Properties
Inc. Class A 40,998 891
Rexford Industrial Realty
Inc. 27,187 807
Healthcare Trust of
America Inc. Class A 23,714 713
Universal Health Realty
Income Trust 8,800 644
STAG Industrial Inc. 20,898 571
Franklin Street Properties
Corp. 39,980 400
96,163
Utilities (3.6%)
Vectren Corp. 242,889 16,550
IDACORP Inc. 177,362 16,323
ALLETE Inc. 104,860 8,216
Portland General Electric
Co. 163,848 7,822
Southern Co. 133,667 6,977
NorthWestern Corp. 82,367 4,883
OGE Energy Corp. 127,612 4,701
MDU Resources Group
Inc. 146,470 4,006
Hawaiian Electric
Industries Inc. 96,333 3,512
Pinnacle West Capital
Corp. 37,117 3,2563 Ameren Corp. 36,454 2,260
Enel Chile SA ADR 152,793 900
79,406
1,150,720
Total Common Stocks
(Cost $1,912,320) 2,225,818
18
19
Global Minimum Volatility Fund
Market
Value•
Shares ($000)
At October 31, 2017, net assets consisted of:
Amount
($000)
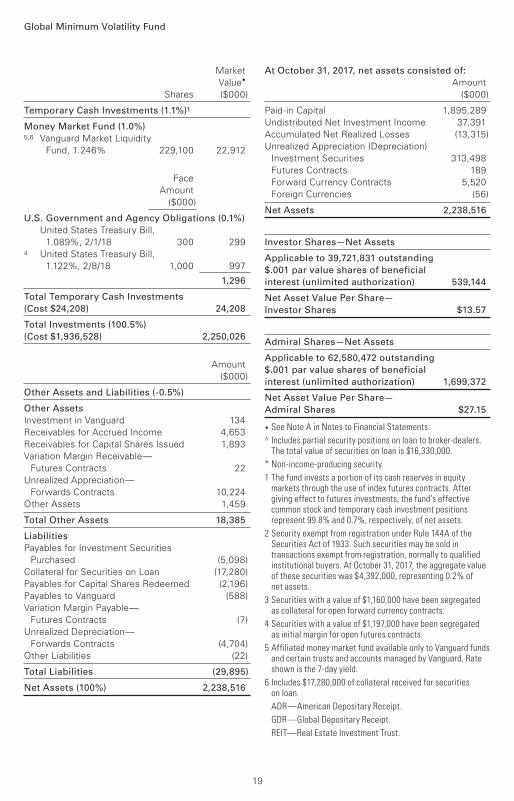
Temporary Cash Investments (1.1%)1
Money Market Fund (1.0%) 5,6 Vanguard Market Liquidity
Fund, 1.246% 229,100 22,912
Face
Amount
($000)
U.S. Government and Agency Obligations (0.1%)
United States Treasury Bill,
1.089%, 2/1/18 300 2994 United States Treasury Bill,
1.122%, 2/8/18 1,000 997
1,296
Total Temporary Cash Investments
(Cost $24,208) 24,208
Total Investments (100.5%)
(Cost $1,936,528) 2,250,026
Amount
($000)
Other Assets and Liabilities (-0.5%)
Other Assets
Investment in Vanguard 134
Receivables for Accrued Income 4,653
Receivables for Capital Shares Issued 1,893
Variation Margin Receivable—
Futures Contracts 22
Unrealized Appreciation—
Forwards Contracts 10,224
Other Assets 1,459
Total Other Assets 18,385
Liabilities
Payables for Investment Securities
Purchased (5,098)
Collateral for Securities on Loan (17,280)
Payables for Capital Shares Redeemed (2,196)
Payables to Vanguard (588)
Variation Margin Payable—
Futures Contracts (7)
Unrealized Depreciation—
Forwards Contracts (4,704)
Other Liabilities (22)
Total Liabilities (29,895)
Net Assets (100%) 2,238,516
Paid-in Capital 1,895,289
Undistributed Net Investment Income 37,391
Accumulated Net Realized Losses (13,315)
Unrealized Appreciation (Depreciation)
Investment Securities 313,498
Futures Contracts 189
Forward Currency Contracts 5,520
Foreign Currencies (56)
Net Assets 2,238,516
Investor Shares—Net Assets
Applicable to 39,721,831 outstanding
$.001 par value shares of beneficial
interest (unlimited authorization) 539,144
Net Asset Value Per Share—
Investor Shares $13.57
Admiral Shares—Net Assets
Applicable to 62,580,472 outstanding
$.001 par value shares of beneficial
interest (unlimited authorization) 1,699,372
Net Asset Value Per Share—
Admiral Shares $27.15
• See Note A in Notes to Financial Statements.
^ Includes partial security positions on loan to broker-dealers. The total value of securities on loan is $16,330,000.
* Non-income-producing security.
1 The fund invests a portion of its cash reserves in equity markets through the use of index futures contracts. After giving effect to futures investments, the fund’s effective common stock and temporary cash investment positions represent 99.8% and 0.7%, respectively, of net assets.
2 Security exempt from registration under Rule 144A of the Securities Act of 1933. Such securities may be sold in transactions exempt from registration, normally to qualified institutional buyers. At October 31, 2017, the aggregate value of these securities was $4,392,000, representing 0.2% of net assets.
3 Securities with a value of $1,160,000 have been segregated as collateral for open forward currency contracts.
4 Securities with a value of $1,197,000 have been segregated as initial margin for open futures contracts.
5 Affiliated money market fund available only to Vanguard funds and certain trusts and accounts managed by Vanguard. Rate shown is the 7-day yield.
6 Includes $17,280,000 of collateral received for securities on loan.
ADR—American Depositary Receipt.
GDR—Global Depositary Receipt.
REIT—Real Estate Investment Trust.
Global Minimum Volatility Fund
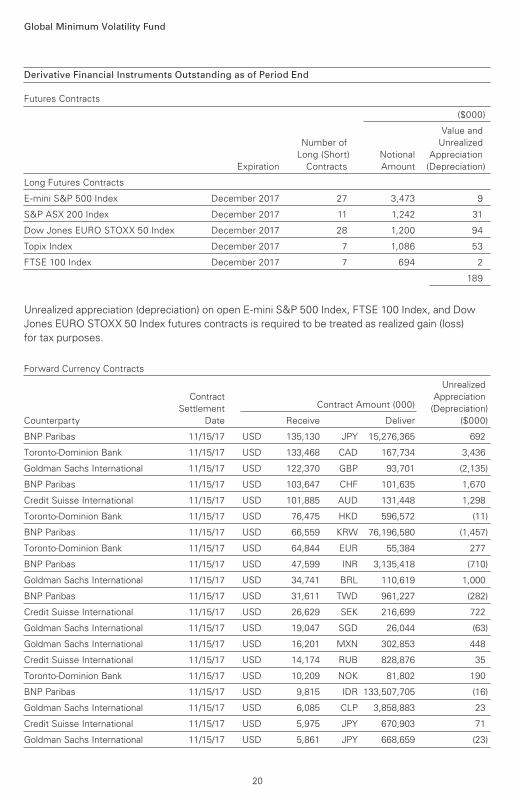
Derivative Financial Instruments Outstanding as of Period End
Futures Contracts
($000)
Value and
Number of Unrealized
Long (Short) Notional Appreciation
Expiration Contracts Amount (Depreciation)
Long Futures Contracts
E-mini S&P 500 Index December 2017 27 3,473 9
S&P ASX 200 Index December 2017 11 1,242 31
Dow Jones EURO STOXX 50 Index December 2017 28 1,200 94
Topix Index December 2017 7 1,086 53
FTSE 100 Index December 2017 7 694 2
189
Unrealized appreciation (depreciation) on open E-mini S&P 500 Index, FTSE 100 Index, and Dow
Jones EURO STOXX 50 Index futures contracts is required to be treated as realized gain (loss)
for tax purposes.
Forward Currency Contracts
Unrealized
Contract Appreciation
Settlement Contract Amount (000) (Depreciation)
Counterparty Date Receive Deliver ($000)
BNP Paribas 11/15/17 USD 135,130 JPY 15,276,365 692
Toronto-Dominion Bank 11/15/17 USD 133,468 CAD 167,734 3,436
Goldman Sachs International 11/15/17 USD 122,370 GBP 93,701 (2,135)
BNP Paribas 11/15/17 USD 103,647 CHF 101,635 1,670
Credit Suisse International 11/15/17 USD 101,885 AUD 131,448 1,298
Toronto-Dominion Bank 11/15/17 USD 76,475 HKD 596,572 (11)
BNP Paribas 11/15/17 USD 66,559 KRW 76,196,580 (1,457)
Toronto-Dominion Bank 11/15/17 USD 64,844 EUR 55,384 277
BNP Paribas 11/15/17 USD 47,599 INR 3,135,418 (710)
Goldman Sachs International 11/15/17 USD 34,741 BRL 110,619 1,000
BNP Paribas 11/15/17 USD 31,611 TWD 961,227 (282)
Credit Suisse International 11/15/17 USD 26,629 SEK 216,699 722
Goldman Sachs International 11/15/17 USD 19,047 SGD 26,044 (63)
Goldman Sachs International 11/15/17 USD 16,201 MXN 302,853 448
Credit Suisse International 11/15/17 USD 14,174 RUB 828,876 35
Toronto-Dominion Bank 11/15/17 USD 10,209 NOK 81,802 190
BNP Paribas 11/15/17 USD 9,815 IDR 133,507,705 (16)
Goldman Sachs International 11/15/17 USD 6,085 CLP 3,858,883 23
Credit Suisse International 11/15/17 USD 5,975 JPY 670,903 71
Goldman Sachs International 11/15/17 USD 5,861 JPY 668,659 (23)
20
Global Minimum Volatility Fund
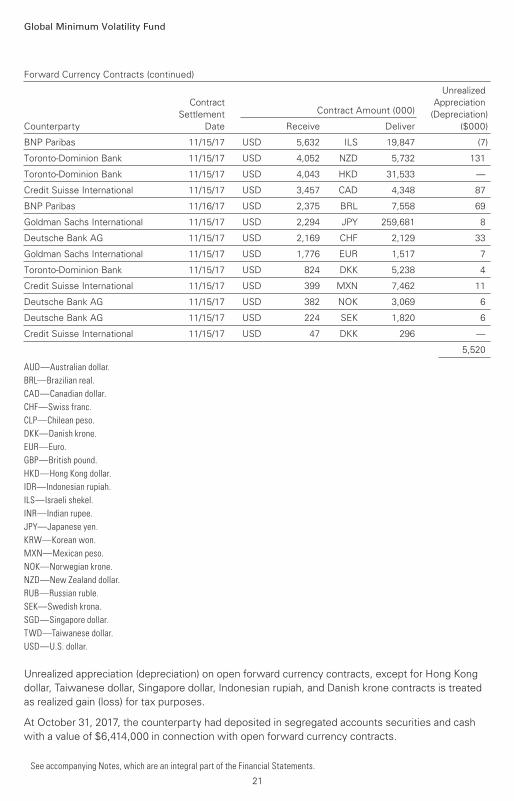
Forward Currency Contracts (continued)
Unrealized
Contract Appreciation
Settlement Contract Amount (000) (Depreciation)
Counterparty Date Receive Deliver ($000)
BNP Paribas 11/15/17 USD 5,632 ILS 19,847 (7)
Toronto-Dominion Bank 11/15/17 USD 4,052 NZD 5,732 131
Toronto-Dominion Bank 11/15/17 USD 4,043 HKD 31,533 —
Credit Suisse International 11/15/17 USD 3,457 CAD 4,348 87
BNP Paribas 11/16/17 USD 2,375 BRL 7,558 69
Goldman Sachs International 11/15/17 USD 2,294 JPY 259,681 8
Deutsche Bank AG 11/15/17 USD 2,169 CHF 2,129 33
Goldman Sachs International 11/15/17 USD 1,776 EUR 1,517 7
Toronto-Dominion Bank 11/15/17 USD 824 DKK 5,238 4
Credit Suisse International 11/15/17 USD 399 MXN 7,462 11
Deutsche Bank AG 11/15/17 USD 382 NOK 3,069 6
Deutsche Bank AG 11/15/17 USD 224 SEK 1,820 6
Credit Suisse International 11/15/17 USD 47 DKK 296 —
5,520
AUD—Australian dollar.
BRL—Brazilian real.
CAD—Canadian dollar.
CHF—Swiss franc.
CLP—Chilean peso.
DKK—Danish krone.
EUR—Euro.
GBP—British pound.
HKD—Hong Kong dollar.
IDR—Indonesian rupiah.
ILS—Israeli shekel.
INR—Indian rupee.
JPY—Japanese yen.
KRW—Korean won.
MXN—Mexican peso.
NOK—Norwegian krone.
NZD—New Zealand dollar.
RUB—Russian ruble.
SEK—Swedish krona.
SGD—Singapore dollar.
TWD—Taiwanese dollar.
USD—U.S. dollar.
Unrealized appreciation (depreciation) on open forward currency contracts, except for Hong Kong
dollar, Taiwanese dollar, Singapore dollar, Indonesian rupiah, and Danish krone contracts is treated
as realized gain (loss) for tax purposes.
At October 31, 2017, the counterparty had deposited in segregated accounts securities and cash
with a value of $6,414,000 in connection with open forward currency contracts.
See accompanying Notes, which are an integral part of the Financial Statements.
21
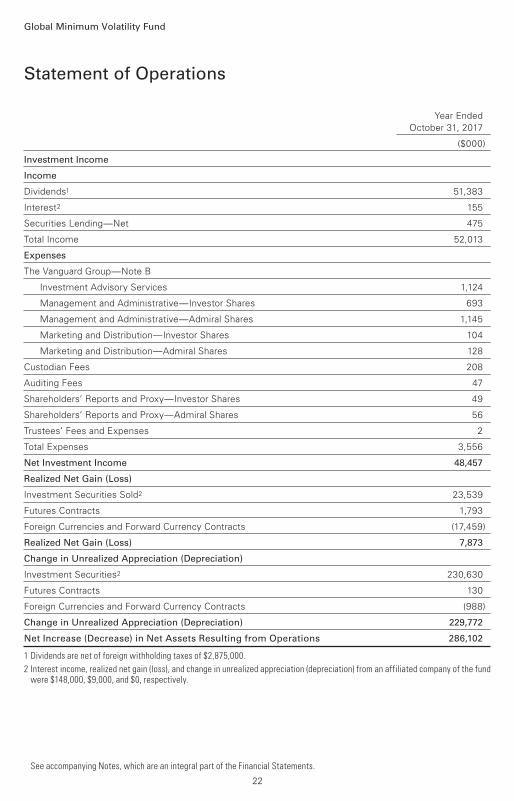
Year Ended
October 31, 2017
($000)
Investment Income
Income
Dividends1 51,383
Interest2 155
Securities Lending—Net 475
Total Income 52,013
Expenses
The Vanguard Group—Note B
Investment Advisory Services 1,124
Management and Administrative—Investor Shares 693
Management and Administrative—Admiral Shares 1,145
Marketing and Distribution—Investor Shares 104
Marketing and Distribution—Admiral Shares 128
Custodian Fees 208
Auditing Fees 47
Shareholders’ Reports and Proxy—Investor Shares 49
Shareholders’ Reports and Proxy—Admiral Shares 56
Trustees’ Fees and Expenses 2
Total Expenses 3,556
Net Investment Income 48,457
Realized Net Gain (Loss)
Investment Securities Sold2 23,539
Futures Contracts 1,793
Foreign Currencies and Forward Currency Contracts (17,459)
Realized Net Gain (Loss) 7,873
Change in Unrealized Appreciation (Depreciation)
Investment Securities2 230,630
Futures Contracts 130
Foreign Currencies and Forward Currency Contracts (988)
Change in Unrealized Appreciation (Depreciation) 229,772
Net Increase (Decrease) in Net Assets Resulting from Operations 286,102
1 Dividends are net of foreign withholding taxes of $2,875,000.
2 Interest income, realized net gain (loss), and change in unrealized appreciation (depreciation) from an affiliated company of the fund were $148,000, $9,000, and $0, respectively.
Statement of Operations
Global Minimum Volatility Fund
See accompanying Notes, which are an integral part of the Financial Statements.
22
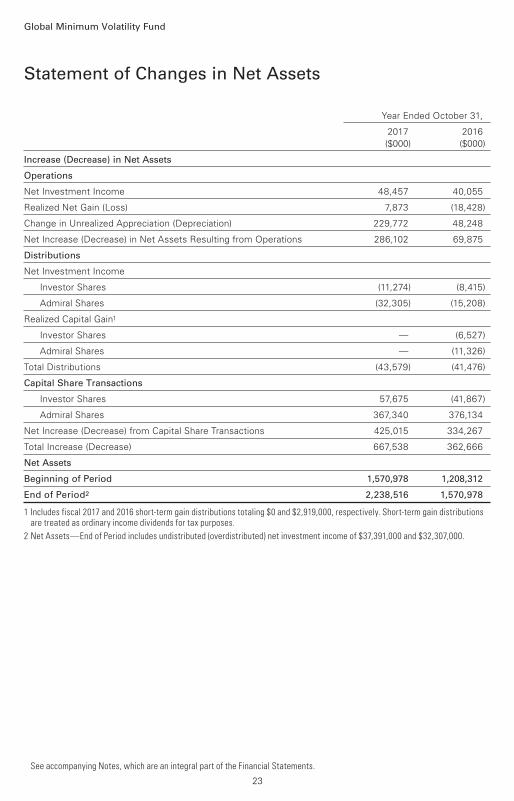
Statement of Changes in Net Assets
Global Minimum Volatility Fund
See accompanying Notes, which are an integral part of the Financial Statements.
Year Ended October 31,
2017 2016
($000) ($000)
Increase (Decrease) in Net Assets
Operations
Net Investment Income 48,457 40,055
Realized Net Gain (Loss) 7,873 (18,428)
Change in Unrealized Appreciation (Depreciation) 229,772 48,248
Net Increase (Decrease) in Net Assets Resulting from Operations 286,102 69,875
Distributions
Net Investment Income
Investor Shares (11,274) (8,415)
Admiral Shares (32,305) (15,208)
Realized Capital Gain1
Investor Shares — (6,527)
Admiral Shares — (11,326)
Total Distributions (43,579) (41,476)
Capital Share Transactions
Investor Shares 57,675 (41,867)
Admiral Shares 367,340 376,134
Net Increase (Decrease) from Capital Share Transactions 425,015 334,267
Total Increase (Decrease) 667,538 362,666
Net Assets
Beginning of Period 1,570,978 1,208,312
End of Period2 2,238,516 1,570,978
1 Includes fiscal 2017 and 2016 short-term gain distributions totaling $0 and $2,919,000, respectively. Short-term gain distributions are treated as ordinary income dividends for tax purposes.
2 Net Assets—End of Period includes undistributed (overdistributed) net investment income of $37,391,000 and $32,307,000.
23
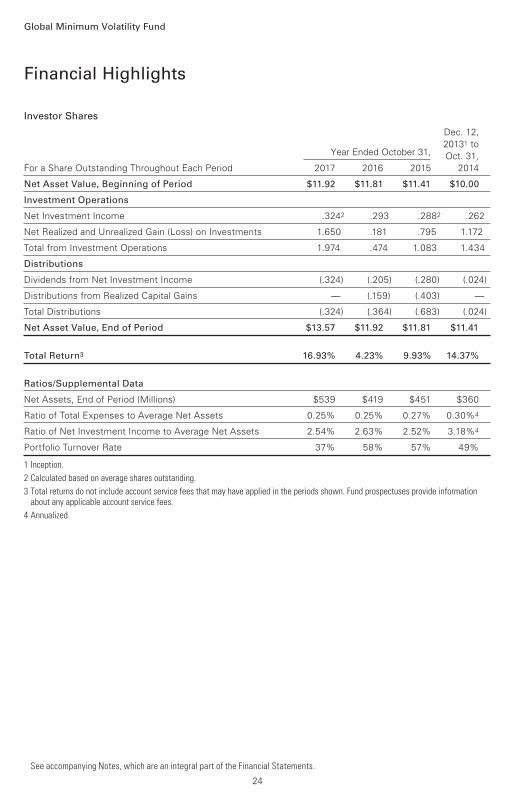
Investor Shares
Dec. 12,
20131 to
Year Ended October 31, Oct. 31,
For a Share Outstanding Throughout Each Period 2017 2016 2015 2014
Net Asset Value, Beginning of Period $11.92 $11.81 $11.41 $10.00
Investment Operations
Net Investment Income .3242 .293 .2882 .262
Net Realized and Unrealized Gain (Loss) on Investments 1.650 .181 .795 1.172
Total from Investment Operations 1.974 .474 1.083 1.434
Distributions
Dividends from Net Investment Income (.324) (.205) (.280) (.024)
Distributions from Realized Capital Gains — (.159) (.403) —
Total Distributions (.324) (.364) (.683) (.024)
Net Asset Value, End of Period $13.57 $11.92 $11.81 $11.41
Total Return3 16.93% 4.23% 9.93% 14.37%
Ratios/Supplemental Data
Net Assets, End of Period (Millions) $539 $419 $451 $360
Ratio of Total Expenses to Average Net Assets 0.25% 0.25% 0.27% 0.30%4
Ratio of Net Investment Income to Average Net Assets 2.54% 2.63% 2.52% 3.18%4
Portfolio Turnover Rate 37% 58% 57% 49%
1 Inception.
2 Calculated based on average shares outstanding.
3 Total returns do not include account service fees that may have applied in the periods shown. Fund prospectuses provide information about any applicable account service fees.
4 Annualized.
Financial Highlights
See accompanying Notes, which are an integral part of the Financial Statements.
Global Minimum Volatility Fund
24

Admiral Shares
Dec. 12,
20131 to
Year Ended October 31, Oct. 31,
For a Share Outstanding Throughout Each Period 2017 2016 2015 2014
Net Asset Value, Beginning of Period $23.86 $23.62 $22.83 $20.00
Investment Operations
Net Investment Income .6682 .608 .6052 .546
Net Realized and Unrealized Gain (Loss) on Investments 3.295 .377 1.576 2.332
Total from Investment Operations 3.963 .985 2.181 2.878
Distributions
Dividends from Net Investment Income (.673) (.427) (.585) (.048)
Distributions from Realized Capital Gains — (.318) (.806) —
Total Distributions (.673) (.745) (1.391) (.048)
Net Asset Value, End of Period $27.15 $23.86 $23.62 $22.83
Total Return3 16.99% 4.39% 10.00% 14.42%
Ratios/Supplemental Data
Net Assets, End of Period (Millions) $1,699 $1,152 $757 $115
Ratio of Total Expenses to Average Net Assets 0.17% 0.17% 0.21% 0.20%4
Ratio of Net Investment Income to Average Net Assets 2.62% 2.71% 2.58% 3.28%4
Portfolio Turnover Rate 37% 58% 57% 49%
1 Inception.
2 Calculated based on average shares outstanding.
3 Total returns do not include account service fees that may have applied in the periods shown. Fund prospectuses provide information about any applicable account service fees.
4 Annualized.
Financial Highlights
See accompanying Notes, which are an integral part of the Financial Statements.
Global Minimum Volatility Fund
25
Notes to Financial Statements
Global Minimum Volatility Fund
Vanguard Global Minimum Volatility Fund is registered under the Investment Company Act
of 1940 as an open-end investment company, or mutual fund. The fund invests in securities of
foreign issuers, which may subject it to investment risks not normally associated with investing
in securities of U.S. corporations. To minimize the currency risk and volatility associated with
investment in securities denominated in currencies other than the U.S. dollar, the fund attempts
to hedge its currency exposure. The fund offers two classes of shares: Investor Shares and Admiral
Shares. Investor Shares are available to any investor who meets the fund’s minimum purchase
requirements. Admiral Shares are designed for investors who meet certain administrative, service,
and account-size criteria.
A. The following significant accounting policies conform to generally accepted accounting principles
for U.S. investment companies. The fund consistently follows such policies in preparing its financial
statements.
1. Security Valuation: Securities are valued as of the close of trading on the New York Stock
Exchange (generally 4 p.m., Eastern time) on the valuation date. Equity securities are valued at
the latest quoted sales prices or official closing prices taken from the primary market in which each
security trades; such securities not traded on the valuation date are valued at the mean of the latest
quoted bid and asked prices. Securities for which market quotations are not readily available, or
whose values have been affected by events occurring before the fund’s pricing time but after the
close of the securities’ primary markets, are valued at their fair values calculated according to
procedures adopted by the board of trustees. These procedures include obtaining quotations from
an independent pricing service, monitoring news to identify significant market- or security-specific
events, and evaluating changes in the values of foreign market proxies (for example, ADRs, futures
contracts, or exchange-traded funds), between the time the foreign markets close and the fund’s
pricing time. When fair-value pricing is employed, the prices of securities used by a fund to calculate
its net asset value may differ from quoted or published prices for the same securities. Investments
in Vanguard Market Liquidity Fund are valued at that fund’s net asset value. Temporary cash
investments are valued using the latest bid prices or using valuations based on a matrix system
(which considers such factors as security prices, yields, maturities, and ratings), both as furnished
by independent pricing services.
2. Foreign Currency: Securities and other assets and liabilities denominated in foreign currencies
are translated into U.S. dollars using exchange rates obtained from an independent third party as
of the fund’s pricing time on the valuation date. Realized gains (losses) and unrealized appreciation
(depreciation) on investment securities include the effects of changes in exchange rates since the
securities were purchased, combined with the effects of changes in security prices. Fluctuations
in the value of other assets and liabilities resulting from changes in exchange rates are recorded as
unrealized foreign currency gains (losses) until the assets or liabilities are settled in cash, at which
time they are recorded as realized foreign currency gains (losses).
3. Futures and Forward Currency Contracts: The fund uses index futures contracts to a limited
extent, with the objective of maintaining full exposure to the stock market while maintaining
liquidity. The fund may purchase or sell futures contracts to achieve a desired level of investment,
whether to accommodate portfolio turnover or cash flows from capital share transactions. The
primary risks associated with the use of futures contracts are imperfect correlation between
changes in market values of stocks held by the fund and the prices of futures contracts, and the
possibility of an illiquid market. Counterparty risk involving futures is mitigated because a regulated
26
Global Minimum Volatility Fund
clearinghouse is the counterparty instead of the clearing broker. To further mitigate counterparty
risk, the fund trades futures contracts on an exchange, monitors the financial strength of its clearing
brokers and clearinghouse, and has entered into clearing agreements with its clearing brokers. The
clearinghouse imposes initial margin requirements to secure the fund’s performance and requires
daily settlement of variation margin representing changes in the market value of each contract.
The fund enters into forward currency contracts to protect the value of securities and related
receivables and payables against changes in future foreign exchange rates. The fund’s risks in
using these contracts include movement in the values of the foreign currencies relative to the
U.S. dollar and the ability of the counterparties to fulfill their obligations under the contracts.
The fund mitigates its counterparty risk by entering into forward currency contracts only with
a diverse group of prequalified counterparties, monitoring their financial strength, entering into
master netting arrangements with its counterparties, and requiring its counterparties to transfer
collateral as security for their performance. In the absence of a default, the collateral pledged
or received by the fund cannot be repledged, resold, or rehypothecated. The master netting
arrangements provide that, in the event of a counterparty’s default (including bankruptcy), the
fund may terminate the forward currency contracts, determine the net amount owed by either
party in accordance with its master netting arrangements, and sell or retain any collateral held up
to the net amount owed to the fund under the master netting arrangements. The forward currency
contracts contain provisions whereby a counterparty may terminate open contracts if the fund’s net
assets decline below a certain level, triggering a payment by the fund if the fund is in a net liability
position at the time of the termination. The payment amount would be reduced by any collateral the
fund has pledged. Any assets pledged as collateral for open contracts are noted in the Statement
of Net Assets. The value of collateral received or pledged is compared daily to the value of the
forward currency contracts exposure with each counterparty, and any difference, if in excess
of a specified minimum transfer amount, is adjusted and settled within two business days.
Futures contracts are valued at their quoted daily settlement prices. Forward currency contracts are
valued at their quoted daily prices obtained from an independent third party, adjusted for currency
risk based on the expiration date of each contract. The notional amounts of the contracts are not
recorded in the Statement of Net Assets. Fluctuations in the value of the contracts are recorded in
the Statement of Net Assets as an asset (liability) and in the Statement of Operations as unrealized
appreciation (depreciation) until the contracts are closed, when they are recorded as realized gains
(losses) on futures or forward currency contracts.
During the year ended October 31, 2017, the fund’s average investments in long and short futures
contracts represented less than 1% and 0% of net assets, respectively, based on the average of
the notional amounts at each quarter-end during the period. The fund’s average investment in
forward currency contracts represented 47% of net assets, based on the average of the notional
amounts at each quarter-end during the period.
4. Federal Income Taxes: The fund intends to continue to qualify as a regulated investment company
and distribute all of its taxable income. Management has analyzed the fund’s tax positions taken for
all open federal income tax years (October 31, 2014–2017), and has concluded that no provision
for federal income tax is required in the fund’s financial statements.
5. Distributions: Distributions to shareholders are recorded on the ex-dividend date.
27
Global Minimum Volatility Fund
6. Securities Lending: To earn additional income, the fund lends its securities to qualified
institutional borrowers. Security loans are subject to termination by the fund at any time, and
are required to be secured at all times by collateral in an amount at least equal to the market
value of securities loaned. Daily market fluctuations could cause the value of loaned securities
to be more or less than the value of the collateral received. When this occurs, the collateral
is adjusted and settled on the next business day. The fund further mitigates its counterparty
risk by entering into securities lending transactions only with a diverse group of prequalified
counterparties, monitoring their financial strength, and entering into master securities lending
agreements with its counterparties. The master securities lending agreements provide that,
in the event of a counterparty’s default (including bankruptcy), the fund may terminate any loans
with that borrower, determine the net amount owed, and sell or retain the collateral up to the net
amount owed to the fund; however, such actions may be subject to legal proceedings. While
collateral mitigates counterparty risk, in the event of a default, the fund may experience delays
and costs in recovering the securities loaned. The fund invests cash collateral received in Vanguard
Market Liquidity Fund, and records a liability in the Statement of Net Assets for the return of the
collateral, during the period the securities are on loan. Securities lending income represents fees
charged to borrowers plus income earned on invested cash collateral, less expenses associated
with the loan. During the term of the loan, the fund is entitled to all distributions made on or in
respect of the loaned securities.
7. Credit Facility: The fund and certain other funds managed by The Vanguard Group (“Vanguard”)
participate in a $3.1 billion committed credit facility provided by a syndicate of lenders pursuant to
a credit agreement that may be renewed annually; each fund is individually liable for its borrowings,
if any, under the credit facility. Borrowings may be utilized for temporary and emergency purposes,
and are subject to the fund’s regulatory and contractual borrowing restrictions. The participating
funds are charged administrative fees and an annual commitment fee of 0.10% of the undrawn
amount of the facility; these fees are allocated to the funds based on a method approved by the
fund’s board of trustees and included in Management and Administrative expenses on the fund’s
Statement of Operations. Any borrowings under this facility bear interest at a rate based upon the
higher of the one-month London Interbank Offered Rate, federal funds effective rate, or overnight
bank funding rate plus an agreed-upon spread.
The fund had no borrowings outstanding at October 31, 2017, or at any time during the period
then ended.
8. Other: Dividend income is recorded on the ex-dividend date. Interest income includes income
distributions received from Vanguard Market Liquidity Fund and is accrued daily. Premiums and
discounts on debt securities purchased are amortized and accreted, respectively, to interest income
over the lives of the respective securities. Security transactions are accounted for on the date
securities are bought or sold. Costs used to determine realized gains (losses) on the sale of
investment securities are those of the specific securities sold.
Each class of shares has equal rights as to assets and earnings, except that each class separately
bears certain class-specific expenses related to maintenance of shareholder accounts (included
in Management and Administrative expenses), shareholder reporting, and the proxy. Marketing
and distribution expenses are allocated to each class of shares based on a method approved by the
board of trustees. Income, other non-class-specific expenses, and gains and losses on investments
are allocated to each class of shares based on its relative net assets.
28
Global Minimum Volatility Fund
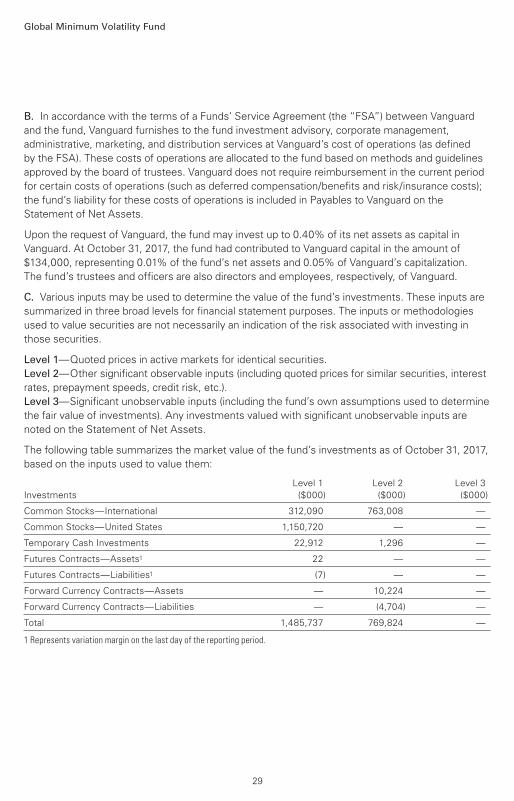
B. In accordance with the terms of a Funds’ Service Agreement (the “FSA”) between Vanguard
and the fund, Vanguard furnishes to the fund investment advisory, corporate management,
administrative, marketing, and distribution services at Vanguard’s cost of operations (as defined
by the FSA). These costs of operations are allocated to the fund based on methods and guidelines
approved by the board of trustees. Vanguard does not require reimbursement in the current period
for certain costs of operations (such as deferred compensation/benefits and risk/insurance costs);
the fund’s liability for these costs of operations is included in Payables to Vanguard on the
Statement of Net Assets.
Upon the request of Vanguard, the fund may invest up to 0.40% of its net assets as capital in
Vanguard. At October 31, 2017, the fund had contributed to Vanguard capital in the amount of
$134,000, representing 0.01% of the fund’s net assets and 0.05% of Vanguard’s capitalization.
The fund’s trustees and officers are also directors and employees, respectively, of Vanguard.
C. Various inputs may be used to determine the value of the fund’s investments. These inputs are
summarized in three broad levels for financial statement purposes. The inputs or methodologies
used to value securities are not necessarily an indication of the risk associated with investing in
those securities.
Level 1—Quoted prices in active markets for identical securities.
Level 2—Other significant observable inputs (including quoted prices for similar securities, interest
rates, prepayment speeds, credit risk, etc.).
Level 3—Significant unobservable inputs (including the fund’s own assumptions used to determine
the fair value of investments). Any investments valued with significant unobservable inputs are
noted on the Statement of Net Assets.
The following table summarizes the market value of the fund’s investments as of October 31, 2017,
based on the inputs used to value them:
Level 1 Level 2 Level 3
Investments ($000) ($000) ($000)
Common Stocks—International 312,090 763,008 —
Common Stocks—United States 1,150,720 — —
Temporary Cash Investments 22,912 1,296 —
Futures Contracts—Assets1 22 — —
Futures Contracts—Liabilities1 (7) — —
Forward Currency Contracts—Assets — 10,224 —
Forward Currency Contracts—Liabilities — (4,704) —
Total 1,485,737 769,824 —
1 Represents variation margin on the last day of the reporting period.
29
Global Minimum Volatility Fund
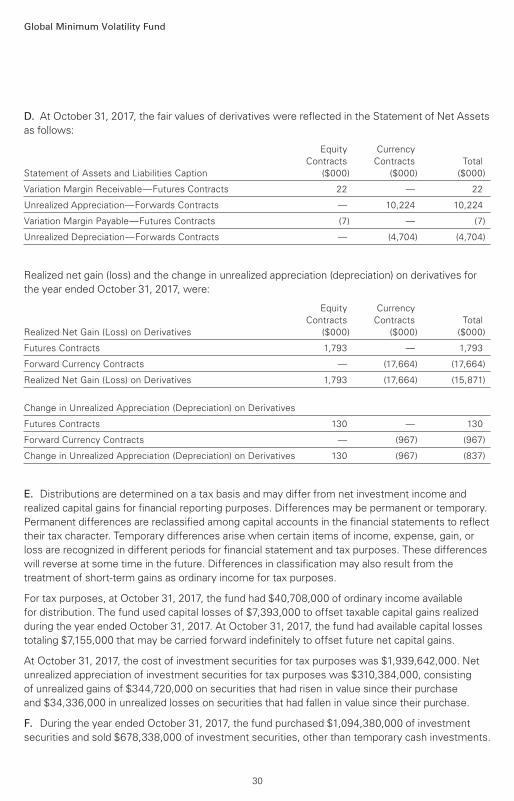
D. At October 31, 2017, the fair values of derivatives were reflected in the Statement of Net Assets
as follows:
Equity Currency
Contracts Contracts Total
Statement of Assets and Liabilities Caption ($000) ($000) ($000)
Variation Margin Receivable—Futures Contracts 22 — 22
Unrealized Appreciation—Forwards Contracts — 10,224 10,224
Variation Margin Payable—Futures Contracts (7) — (7)
Unrealized Depreciation—Forwards Contracts — (4,704) (4,704)
Realized net gain (loss) and the change in unrealized appreciation (depreciation) on derivatives for
the year ended October 31, 2017, were:
Equity Currency
Contracts Contracts Total
Realized Net Gain (Loss) on Derivatives ($000) ($000) ($000)
Futures Contracts 1,793 — 1,793
Forward Currency Contracts — (17,664) (17,664)
Realized Net Gain (Loss) on Derivatives 1,793 (17,664) (15,871)
Change in Unrealized Appreciation (Depreciation) on Derivatives
Futures Contracts 130 — 130
Forward Currency Contracts — (967) (967)
Change in Unrealized Appreciation (Depreciation) on Derivatives 130 (967) (837)
E. Distributions are determined on a tax basis and may differ from net investment income and
realized capital gains for financial reporting purposes. Differences may be permanent or temporary.
Permanent differences are reclassified among capital accounts in the financial statements to reflect
their tax character. Temporary differences arise when certain items of income, expense, gain, or
loss are recognized in different periods for financial statement and tax purposes. These differences
will reverse at some time in the future. Differences in classification may also result from the
treatment of short-term gains as ordinary income for tax purposes.
For tax purposes, at October 31, 2017, the fund had $40,708,000 of ordinary income available
for distribution. The fund used capital losses of $7,393,000 to offset taxable capital gains realized
during the year ended October 31, 2017. At October 31, 2017, the fund had available capital losses
totaling $7,155,000 that may be carried forward indefinitely to offset future net capital gains.
At October 31, 2017, the cost of investment securities for tax purposes was $1,939,642,000. Net
unrealized appreciation of investment securities for tax purposes was $310,384,000, consisting
of unrealized gains of $344,720,000 on securities that had risen in value since their purchase
and $34,336,000 in unrealized losses on securities that had fallen in value since their purchase.
F. During the year ended October 31, 2017, the fund purchased $1,094,380,000 of investment
securities and sold $678,338,000 of investment securities, other than temporary cash investments.
30
Global Minimum Volatility Fund
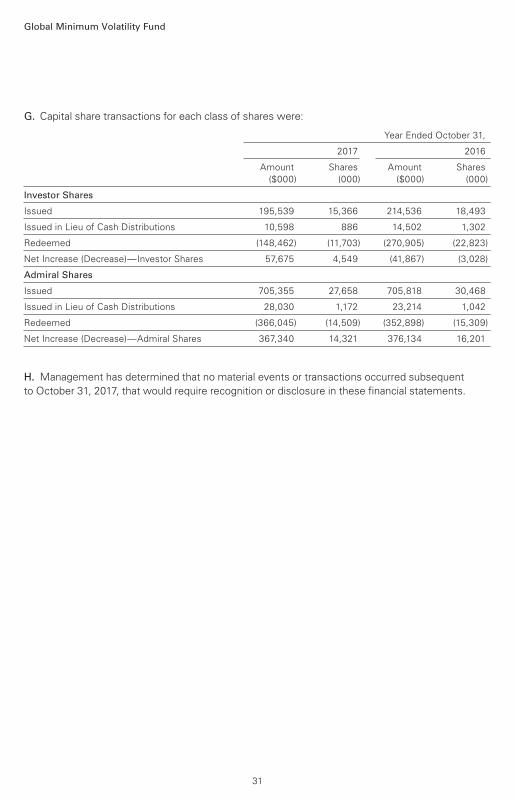
G. Capital share transactions for each class of shares were:
Year Ended October 31,
2017 2016
Amount Shares Amount Shares
($000) (000) ($000) (000)
Investor Shares
Issued 195,539 15,366 214,536 18,493
Issued in Lieu of Cash Distributions 10,598 886 14,502 1,302
Redeemed (148,462) (11,703) (270,905) (22,823)
Net Increase (Decrease)—Investor Shares 57,675 4,549 (41,867) (3,028)
Admiral Shares
Issued 705,355 27,658 705,818 30,468
Issued in Lieu of Cash Distributions 28,030 1,172 23,214 1,042
Redeemed (366,045) (14,509) (352,898) (15,309)
Net Increase (Decrease)—Admiral Shares 367,340 14,321 376,134 16,201
H. Management has determined that no material events or transactions occurred subsequent
to October 31, 2017, that would require recognition or disclosure in these financial statements.
31
To the Board of Trustees of Vanguard Whitehall Funds and the Shareholders of Vanguard Global
Minimum Volatility Fund
In our opinion, the accompanying statement of net assets and the related statements of operations
and of changes in net assets and the financial highlights present fairly, in all material respects, the
financial position of Vanguard Global Minimum Volatility Fund (constituting a separate portfolio of
Vanguard Whitehall Funds, hereafter referred to as the “Fund”) as of October 31, 2017, the results
of its operations for the year then ended, the changes in its net assets for each of the two years in
the period then ended and the financial highlights for each of the periods indicated, in conformity
with accounting principles generally accepted in the United States of America. These financial
statements and financial highlights (hereafter referred to as “financial statements”) are the
responsibility of the Fund’s management. Our responsibility is to express an opinion on these
financial statements based on our audits. We conducted our audits of these financial statements
in accordance with the standards of the Public Company Accounting Oversight Board (United
States). Those standards require that we plan and perform the audit to obtain reasonable
assurance about whether the financial statements are free of material misstatement. An audit
includes examining, on a test basis, evidence supporting the amounts and disclosures in the
financial statements, assessing the accounting principles used and significant estimates made
by management, and evaluating the overall financial statement presentation. We believe that our
audits, which included confirmation of securities as of October 31, 2017 by correspondence with
the custodian and brokers and by agreement to the underlying ownership records of the transfer
agent, provide a reasonable basis for our opinion.
/s/PricewaterhouseCoopers LLP
Philadelphia, Pennsylvania
December 19, 2017
Report of Independent Registered Public Accounting Firm
Special 2017 tax information (unaudited) for Vanguard Global Minimum Volatility Fund
This information for the fiscal year ended October 31, 2017, is included pursuant to provisions
of the Internal Revenue Code.
The fund distributed $34,183,000 of qualified dividend income to shareholders during the
fiscal year.
For corporate shareholders, 34.2% of investment income (dividend income plus short-term gains,
if any) qualifies for the dividends-received deduction.
32
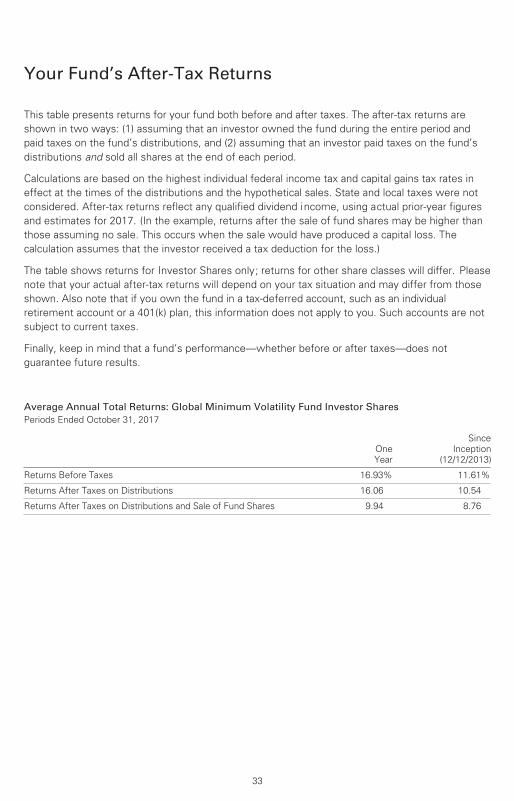
Your Fund’s After-Tax Returns
33
This table presents returns for your fund both before and after taxes. The after-tax returns are
shown in two ways: (1) assuming that an investor owned the fund during the entire period and
paid taxes on the fund’s distributions, and (2) assuming that an investor paid taxes on the fund’s
distributions and sold all shares at the end of each period.
Calculations are based on the highest individual federal income tax and capital gains tax rates in
effect at the times of the distributions and the hypothetical sales. State and local taxes were not
considered. After-tax returns reflect any qualified dividend income, using actual prior-year figures
and estimates for 2017. (In the example, returns after the sale of fund shares may be higher than
those assuming no sale. This occurs when the sale would have produced a capital loss. The
calculation assumes that the investor received a tax deduction for the loss.)
The table shows returns for Investor Shares only; returns for other share classes will differ. Please
note that your actual after-tax returns will depend on your tax situation and may differ from those
shown. Also note that if you own the fund in a tax-deferred account, such as an individual
retirement account or a 401(k) plan, this information does not apply to you. Such accounts are not
subject to current taxes.
Finally, keep in mind that a fund’s performance—whether before or after taxes—does not
guarantee future results.
Average Annual Total Returns: Global Minimum Volatility Fund Investor Shares Periods Ended October 31, 2017
One
Year
Since
Inception
(12/12/2013)
Returns Before Taxes 16.93% 11.61%
Returns After Taxes on Distributions 16.06 10.54
Returns After Taxes on Distributions and Sale of Fund Shares 9.94 8.76
About Your Fund’s Expenses
34
As a shareholder of the fund, you incur ongoing costs, which include costs for portfolio management,
administrative services, and shareholder reports (like this one), among others. Operating expenses,
which are deducted from a fund’s gross income, directly reduce the investment return of the fund.
A fund’s expenses are expressed as a percentage of its average net assets. This figure is known as
the expense ratio. The following examples are intended to help you understand the ongoing costs (in
dollars) of investing in your fund and to compare these costs with those of other mutual funds. The
examples are based on an investment of $1,000 made at the beginning of the period shown and held
for the entire period.
The accompanying table illustrates your fund’s costs in two ways:
• Based on actual fund return. This section helps you to estimate the actual expenses that you
paid over the period. The ”Ending Account Value“ shown is derived from the fund‘s actual return,
and the third column shows the dollar amount that would have been paid by an investor who started
with $1,000 in the fund. You may use the information here, together with the amount you invested,
to estimate the expenses that you paid over the period.
To do so, simply divide your account value by $1,000 (for example, an $8,600 account value divided
by $1,000 = 8.6), then multiply the result by the number given for your fund under the heading
”Expenses Paid During Period.“
• Based on hypothetical 5% yearly return. This section is intended to help you compare your
fund‘s costs with those of other mutual funds. It assumes that the fund had a yearly return of 5%
before expenses, but that the expense ratio is unchanged. In this case—because the return used is
not the fund’s actual return—the results do not apply to your investment. The example is useful in
making comparisons because the Securities and Exchange Commission requires all mutual funds to
calculate expenses based on a 5% return. You can assess your fund’s costs by comparing this
hypothetical example with the hypothetical examples that appear in shareholder reports of other
funds.
Note that the expenses shown in the table are meant to highlight and help you compare ongoingcosts only and do not reflect transaction costs incurred by the fund for buying and sellingsecurities. Further, the expenses do not include any purchase, redemption, or account servicefees described in the fund prospectus. If such fees were applied to your account, your costswould be higher. Your fund does not carry a “sales load.”
The calculations assume no shares were bought or sold during the period. Your actual costs may
have been higher or lower, depending on the amount of your investment and the timing of any
purchases or redemptions.
You can find more information about the fund’s expenses, including annual expense ratios, in the
Financial Statements section of this report. For additional information on operating expenses and
other shareholder costs, please refer to your fund’s current prospectus.
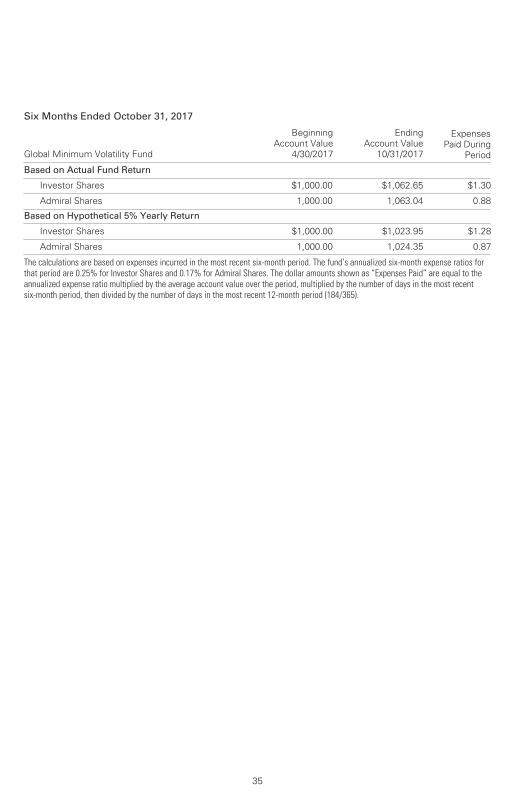
35
Six Months Ended October 31, 2017
Global Minimum Volatility Fund
Beginning
Account Value
4/30/2017
Ending
Account Value
10/31/2017
Expenses
Paid During
Period
Based on Actual Fund Return
Investor Shares $1,000.00 $1,062.65 $1.30
Admiral Shares 1,000.00 1,063.04 0.88
Based on Hypothetical 5% Yearly Return
Investor Shares $1,000.00 $1,023.95 $1.28
Admiral Shares 1,000.00 1,024.35 0.87
The calculations are based on expenses incurred in the most recent six-month period. The fund’s annualized six-month expense ratios forthat period are 0.25% for Investor Shares and 0.17% for Admiral Shares. The dollar amounts shown as “Expenses Paid” are equal to theannualized expense ratio multiplied by the average account value over the period, multiplied by the number of days in the most recentsix-month period, then divided by the number of days in the most recent 12-month period (184/365).
Glossary
36
Dividend Yield. Dividend income earned by stocks, expressed as a percentage of the aggregate
market value (or of net asset value, for a fund). The yield is determined by dividing the amount of
the annual dividends by the aggregate value (or net asset value) at the end of the period. For a
fund, the dividend yield is based solely on stock holdings and does not include any income
produced by other investments.
Earnings Growth Rate. The average annual rate of growth in earnings over the past five years for
the stocks now in a fund.
Equity Exposure. A measure that reflects a fund’s investments in stocks and stock futures. Any
holdings in short-term reserves are excluded.
Expense Ratio. A fund’s total annual operating expenses expressed as a percentage of the fund’s
average net assets. The expense ratio includes management and administrative expenses, but
does not include the transaction costs of buying and selling portfolio securities.
Inception Date. The date on which the assets of a fund (or one of its share classes) are first
invested in accordance with the fund’s investment objective. For funds with a subscription period,
the inception date is the day after that period ends. Investment performance is measured from
the inception date.
Median Market Cap. An indicator of the size of companies in which a fund invests; the midpoint
of market capitalization (market price x shares outstanding) of a fund’s stocks, weighted by the
proportion of the fund’s assets invested in each stock. Stocks representing half of the fund’s
assets have market capitalizations above the median, and the rest are below it.
Price/Book Ratio. The share price of a stock divided by its net worth, or book value, per share.
For a fund, the weighted average price/book ratio of the stocks it holds.
Price/Earnings Ratio. The ratio of a stock’s current price to its per-share earnings over the past
year. For a fund, the weighted average P/E of the stocks it holds. P/E is an indicator of market
expectations about corporate prospects; the higher the P/E, the greater the expectations for a
company’s future growth.
Return on Equity. The annual average rate of return generated by a company during the past five
years for each dollar of shareholder’s equity (net income divided by shareholder’s equity). For a
fund, the weighted average return on equity for the companies whose stocks it holds.
Short-Term Reserves. The percentage of a fund invested in highly liquid, short-term securities
that can be readily converted to cash.
Turnover Rate. An indication of the fund’s trading activity. Funds with high turnover rates incur
higher transaction costs and may be more likely to distribute capital gains (which may be taxable
to investors). The turnover rate excludes in-kind transactions, which have minimal impact on
costs.

The Global Industry Classification Standard (“GICS”) was developed by and is the exclusive property and a service mark
of MSCI Inc. (“MSCI”) and Standard and Poor’s, a division of McGraw-Hill Companies, Inc. (“S&P”), and is licensed for use
by Vanguard. Neither MSCI, S&P nor any third party involved in making or compiling the GICS or any GICS classification
makes any express or implied warranties or representations with respect to such standard or classification (or the results
to be obtained by the use thereof), and all such parties hereby expressly disclaim all warranties of originality, accuracy,
completeness, merchantability or fitness for a particular purpose with respect to any such standard or classification.
Without limiting any of the foregoing, in no event shall MSCI, S&P, any of its affiliates or any third party involved in
making or compiling the GICS or any GICS classification have any liability for any direct, indirect, special, punitive,
consequential or any other damages (including lost profits) even if notified of the possibility of such damages.
37
The People Who Govern Your Fund
The trustees of your mutual fund are there to see that the fund is operated and managed in your
best interests since, as a shareholder, you are a part owner of the fund. Your fund’s trustees also
serve on the board of directors of The Vanguard Group, Inc., which is owned by the Vanguard
funds and provides services to them on an at-cost basis.
A majority of Vanguard’s board members are independent, meaning that they have no affiliation
with Vanguard or the funds they oversee, apart from the sizable personal investments they have
made as private individuals. The independent board members have distinguished backgrounds
in business, academia, and public service. Each of the trustees and executive officers oversees
200 Vanguard funds.
Information for each trustee and executive officer of the fund appears below. The mailing address
of the trustees and officers is P.O. Box 876, Valley Forge, PA 19482. More information about the
trustees is in the Statement of Additional Information, which can be obtained, without charge,
by contacting Vanguard at 800-662-7447, or online at vanguard.com.
Interested Trustee1
F. William McNabb III
Born 1957. Trustee Since July 2009. Chairman
of the Board. Principal Occupation(s) During the
Past Five Years and Other Experience: Chairman
of the Board of The Vanguard Group, Inc., and
of each of the investment companies served by
The Vanguard Group, since January 2010; Chief
Executive Officer and Director of The Vanguard
Group and President and Chief Executive Officer
of each of the investment companies served by
The Vanguard Group, since 2008; Director of
Vanguard Marketing Corporation; President of
The Vanguard Group (2008–2017); Managing
Director of The Vanguard Group (1995–2008).
Independent Trustees
Emerson U. Fullwood
Born 1948. Trustee Since January 2008. Principal
Occupation(s) During the Past Five Years and Other
Experience: Executive Chief Staff and Marketing
Officer for North America and Corporate Vice
President (retired 2008) of Xerox Corporation
(document manage ment products and services);
Executive in Residence and 2009–2010
Distinguished Minett Professor at the Rochester
Institute of Technology; Lead Director of SPX
FLOW, Inc. (multi-industry manufacturing);
Director of the United Way of Rochester, the
University of Rochester Medical Center, Monroe
Community College Foundation, North Carolina
A&T University, and Roberts Wesleyan College;
Trustee of the University of Rochester.
Rajiv L. Gupta
Born 1945. Trustee Since December 2001.2
Principal Occupation(s) During the Past Five
Years and Other Experience: Chairman and
Chief Executive Officer (retired 2009) and
President (2006–2008) of Rohm and Haas Co.
(chemicals); Director of Arconic Inc. (diversified
manufacturer), HP Inc. (printer and personal
computer manufacturing), and Delphi Automotive
plc (automotive components); Senior Advisor at
New Mountain Capital.
Amy Gutmann
Born 1949. Trustee Since June 2006. Principal
Occupation(s) During the Past Five Years and
Other Experience: President of the University
of Pennsylvania; Christopher H. Browne
1 Mr. McNabb is considered an “interested person,” as defined in the Investment Company Act of 1940, because he is an officer of the Vanguard funds.
2 December 2002 for Vanguard Equity Income Fund, the Vanguard Municipal Bond Funds, and the Vanguard State Tax-Exempt Funds.
Distinguished Professor of Political Science,
School of Arts and Sciences, and Professor
of Communication, Annenberg School for
Communication, with secondary faculty appoint-
ments in the Department of Philosophy, School
of Arts and Sciences, and at the Graduate School
of Education, University of Pennsylvania; Trustee
of the National Constitution Center.
JoAnn Heffernan Heisen
Born 1950. Trustee Since July 1998. Principal
Occupation(s) During the Past Five Years and
Other Experience: Corporate Vice President
and Member of the Executive Committee
(1997–2008), Chief Global Diversity Officer
(retired 2008), Vice President and Chief
Information Officer (1997–2006), Controller
(1995–1997), Treasurer (1991–1995), and
Assistant Treasurer (1989–1991) of Johnson
& Johnson (pharmaceuticals/medical devices/
consumer products); Director of Skytop Lodge
Corporation (hotels) and the Robert Wood
Johnson Foundation; Member of the Advisory
Board of the Institute for Women’s Leadership
at Rutgers University.
F. Joseph Loughrey
Born 1949. Trustee Since October 2009.
Principal Occupation(s) During the Past Five
Years and Other Experience: President and Chief
Operating Officer (retired 2009) of Cummins Inc.
(industrial machinery); Chairman of the Board of
Hillenbrand, Inc. (specialized consumer services),
Oxfam America, and the Lumina Foundation for
Education; Director of the V Foundation for
Cancer Research; Member of the Advisory
Council for the College of Arts and Letters
and Chair of the Advisory Board to the Kellogg
Institute for International Studies, both at the
University of Notre Dame.
Mark Loughridge
Born 1953. Trustee Since March 2012. Principal
Occupation(s) During the Past Five Years and
Other Experience: Senior Vice President and
Chief Financial Officer (retired 2013) at IBM
(information technology services); Fiduciary
Member of IBM’s Retirement Plan Committee
(2004–2013); Member of the Council on
Chicago Booth.
Scott C. Malpass
Born 1962. Trustee Since March 2012. Principal
Occupation(s) During the Past Five Years and
Other Experience: Chief Investment Officer and
Vice President at the University of Notre Dame;
Assistant Professor of Finance at the Mendoza
College of Business at Notre Dame; Member of
the Notre Dame 403(b) Investment Committee,
the Board of Advisors for Spruceview Capital
Partners, the Board of Catholic Investment
Services, Inc. (investment advisor), and the
Board of Superintendence of the Institute for
the Works of Religion; Chairman of the Board of
TIFF Advisory Services, Inc. (investment advisor).
André F. Perold
Born 1952. Trustee Since December 2004.
Principal Occupation(s) During the Past Five Years
and Other Experience: George Gund Professor of
Finance and Banking, Emeritus at the Harvard
Business School (retired 2011); Chief Investment
Officer and Co-Managing Partner of HighVista
Strategies LLC (private investment firm);
Overseer of the Museum of Fine Arts Boston.
Peter F. Volanakis
Born 1955. Trustee Since July 2009. Principal
Occupation(s) During the Past Five Years and
Other Experience: President and Chief Operating
Officer (retired 2010) of Corning Incorporated
(communications equipment); Chairman of the
Board of Trustees of Colby-Sawyer College;
Member of the Board of Hypertherm, Inc.
(industrial cutting systems, software, and
consumables).
Executive Officers
Glenn Booraem
Born 1967. Investment Stewardship Officer Since
February 2017. Principal Occupation(s) During the
Past Five Years and Other Experience: Principal of
The Vanguard Group, Inc.; Treasurer (2015–2017),
Controller (2010–2015), and Assistant Controller
(2001–2010) of each of the investment companies
served by The Vanguard Group.
Thomas J. Higgins
Born 1957. Chief Financial Officer Since
September 2008. Principal Occupation(s) During
the Past Five Years and Other Experience: Principal
of The Vanguard Group, Inc.; Chief Financial Officer
of each of the investment companies served by
The Vanguard Group; Treasurer of each of the
investment companies served by The Vanguard
Group (1998–2008).
Peter Mahoney
Born 1974. Controller Since May 2015. Principal
Occupation(s) During the Past Five Years and
Other Experience: Principal of The Vanguard
Group, Inc.; Controller of each of the investment
companies served by The Vanguard Group; Head
of International Fund Services at The Vanguard
Group (2008–2014).
Anne E. Robinson
Born 1970. Secretary Since September 2016.
Principal Occupation(s) During the Past Five Years
and Other Experience: Managing Director of The
Vanguard Group, Inc.; General Counsel of The
Vanguard Group; Secretary of The Vanguard Group
and of each of the investment companies served
by The Vanguard Group; Director and Senior Vice
President of Vanguard Marketing Corporation;
Managing Director and General Counsel of Global
Cards and Consumer Services at Citigroup
(2014–2016); Counsel at American Express
(2003–2014).
Michael Rollings
Born 1963. Treasurer Since February 2017.
Principal Occupation(s) During the Past Five
Years and Other Experience: Managing Director
of The Vanguard Group, Inc.; Treasurer of each
of the investment companies served by The
Vanguard Group; Director of Vanguard Marketing
Corporation; Executive Vice President and Chief
Financial Officer of MassMutual Financial Group
(2006–2016).
Vanguard Senior Management Team
Mortimer J. Buckley Chris D. McIsaac
Gregory Davis James M. Norris
John James Thomas M. Rampulla
Martha G. King Karin A. Risi
John T. Marcante
Chairman Emeritus and Senior Advisor
John J. Brennan
Chairman, 1996–2009
Chief Executive Officer and President, 1996–2008
Founder
John C. Bogle
Chairman and Chief Executive Officer, 1974–1996
P.O. Box 2600
Valley Forge, PA 19482-2600
Connect with Vanguard® > vanguard.com
Fund Information > 800-662-7447
Direct Investor Account Services > 800-662-2739
Institutional Investor Services > 800-523-1036
Text Telephone for PeopleWho Are Deaf or Hard of Hearing > 800-749-7273
This material may be used in conjunctionwith the offering of shares of any Vanguardfund only if preceded or accompanied bythe fund’s current prospectus.
All comparative mutual fund data are from Lipper, aThomson Reuters Company, or Morningstar, Inc., unlessotherwise noted.
You can obtain a free copy of Vanguard’s proxy votingguidelines by visiting vanguard.com/proxyreporting or bycalling Vanguard at 800-662-2739. The guidelines arealso available from the SEC’s website, sec.gov. Inaddition, you may obtain a free report on how your fundvoted the proxies for securities it owned during the 12months ended June 30. To get the report, visit eithervanguard.com/proxyreporting or sec.gov.
You can review and copy information about your fund atthe SEC’s Public Reference Room in Washington, D.C. Tofind out more about this public service, call the SEC at202-551-8090. Information about your fund is alsoavailable on the SEC’s website, and you can receivecopies of this information, for a fee, by sending arequest in either of two ways: via email addressed [email protected] or via regular mail addressed to thePublic Reference Section, Securities and ExchangeCommission, Washington, DC 20549-1520.
CFA® is a registered trademark owned by CFA Institute.
© 2017 The Vanguard Group, Inc.All rights reserved.Vanguard Marketing Corporation, Distributor.
Q11940 122017