Embed Size (px)
Citation preview
United States Office of Pollution Prevention EPA742-R-96-003Environmental Protection and Toxics (MC7409) December 1996Agency Washington, DC 20460
Valuing Potential EnvironmentalLiabilities for ManagerialDecision-Making:
A Review of Available Techniques

EPA 742-R-96-003December 1996
Valuing Potential Environmental Liabilities for ManagerialDecision-Making: A Review of Available Techniques
Prepared Under:
Contract No. 68-D2-0064 Susan McLaughlin, Work Assignment Manager
and
Contract No. 68-W2-0008Holly Elwood and Martin A. Spitzer, Work Assignment Managers
Pollution Prevention Division (MC-7409)Office of Pollution Prevention and Toxics
Office of Pollution Prevention and Toxic SubstancesU.S. Environmental Protection Agency
401 M Street, SWWashington, D.C. 20460
Prepared by:
ICF Incorporated9300 Lee HighwayFairfax, VA 22031
Paul E. Bailey, Project Manager
This document is a product of EPA's Environmental Accounting Project. Copies of thisdocument and other Environmental Accounting Project products can be obtained free-of-chargethrough EPA's Pollution Prevention Information Clearinghouse (telephone 202-260-1023, fax202-260-0178, or e-mail [email protected]) or through the Project's website(http:\\es.inel.gov\partners\acctg). This document may be reproduced and distributed withoutpermission from the EPA.
-ii-
Disclaimer
Descriptions of environmental liability valuation techniques and mention of trade names,products, or services do not convey, and should not be interpreted as conveying, officialapproval, endorsement, or recommendation by the U.S. Environmental Protection Agency.
-iii-
Acknowledgements
This document benefited immeasurably from the reviews, comments, and assistance ofpeople from a wide variety of organizations. The United States Environmental ProtectionAgency (EPA) sincerely appreciates the efforts of the numerous individuals who helped todevelop the report.
EPA would like to thank the following individuals for providing extensive comments to draftversions of this report:
Ali Alavi U.S. Environmental Protection AgencyHorsehead Resource Development Co, Inc.,& Zinc Corporation of America
Rob AnexUniversity of Miami
Karl C. AyersMead Corporation
David S. BakerPowell, Goldstein, Frazer & Murphy
Beth BeloffUniversity of Houston
Bert BlackWeinberg & Green
Laura BulataoU.S. Environmental Protection Agency
Ellen CayaFlorida Power & Light Company
John CrossU.S. Environmental Protection Agency
James D. EnglehardtUniversity of Miami
Julian FreedmanInstitute of Management Accountants Donald Salmond
Suwanna B. Gauntlett The Gauntlett Group, Inc.Karen Harrison
Miriam HellerUniversity of Houston
Jon HorinMitretek Systems
Richard B. JohnsMotorola
Alfred M. KingValuation Research Corporation
John MincyCiba-Geigy Corporation
George J. Muhlebach Ciba-Geigy Corporation
Greg NorrisDecision Dynamics
Larry OnistoOntario Hydro
Amy A. RipepiArthur Andersen
Nancy H. Roen Florida Power & Light Company
Arthur D. Little
James H. SchaarsmithFoster Wheeler
-iv-
Monali Shah Allen WhiteAvery Dennison Tellus Institute for Resource and
Robert J. Sonnelitter, Jr.Financial Accounting Standards Board Mark A. White
Edward W. TrottKPMG Peat Marwick, LLP Diana Zinkl
David W. VogelThe Gauntlett Group, Inc.
Edward Weiler Mitretek SystemsU.S. Environmental Protection Agency
Environmental Strategies
University of Virginia
Tellus Institute for Resource and Environmental Strategies
Melissa Zoepfl
Prior to the completion of this document, EPA asked individuals involved in thedevelopment of the profiled valuation tools to review their respective profiles for accuracy. EPA extends its thanks to the following individuals for providing information for, and feedbackon, the profiles: James Aldrich, Air Force Institute of Technology; Amy Bouska, Tillinghast;Linda Burlington, National Oceanic and Atmospheric Administration; Joel S. Chansky,Milliman & Robertson, Inc.; James D. Englehardt, University of Miami; Sidney Feld, U.S.Nuclear Regulatory Commission; Steven E. James, Woodward-Clyde Group; Jonathan Libber,U.S. EPA; Paul Merges, New York Department of Environmental Conservation; Joseph A.Miakisz, Niagara Mohawk Power Corporation; Tuula Moilanen, Paras; Mary Morton, U.S.Department of the Interior; Paul and Joyce Schoemaker, Decision Strategies International; BettyS. West, U.S. Air Force; Lester Wittenberg, American Institute of Chemical Engineers; and JohnZeh, New York Department of Environmental Conservation.
EPA is also grateful for the assistance and input provided by the following individuals: LouisBisgay, Institute of Management Accountants; Corinne Boone, Ontario Hydro; Alan Ehrlich, USEPA; Marc J. Epstein, Stanford University; Frederick Gill, American Institute of CertifiedPublic Accountants; Mike Harbordt, Temple-Inland Forest Products, Inc.; Cord Jones,Organization Resource Counselors; James Lawrence, Chevron; Louise Little, U.S. EPA; AndrewMangan, Business Council for Sustainable Development; Michael Northridge, US EPA; L. HalRogero, Jr., Mead Corporation; Kathy Seikel, US EPA; and Jeannie Wood, Arthur Andersen.
This document was completed under Contract No. 68-D2-0064 with ICF Incorporated(Susan McLaughlin, EPA Work Assignment Manager, and Carol Rawie, EPA Project Officer). It was begun under Contract No. 68-W2-0008 with ICF Incorporated (Holly Elwood and MartinSpitzer, EPA Work Assignment Managers and Carlos Lago, EPA Project Officer). The ICFteam members were Paul E. Bailey (Project Manager), Mary D. Clark, Matthew S. Borick, PaulJ. Raskin, Annie M. Ho, and Margo D. Brown.
Table of Contents
-v-
Page
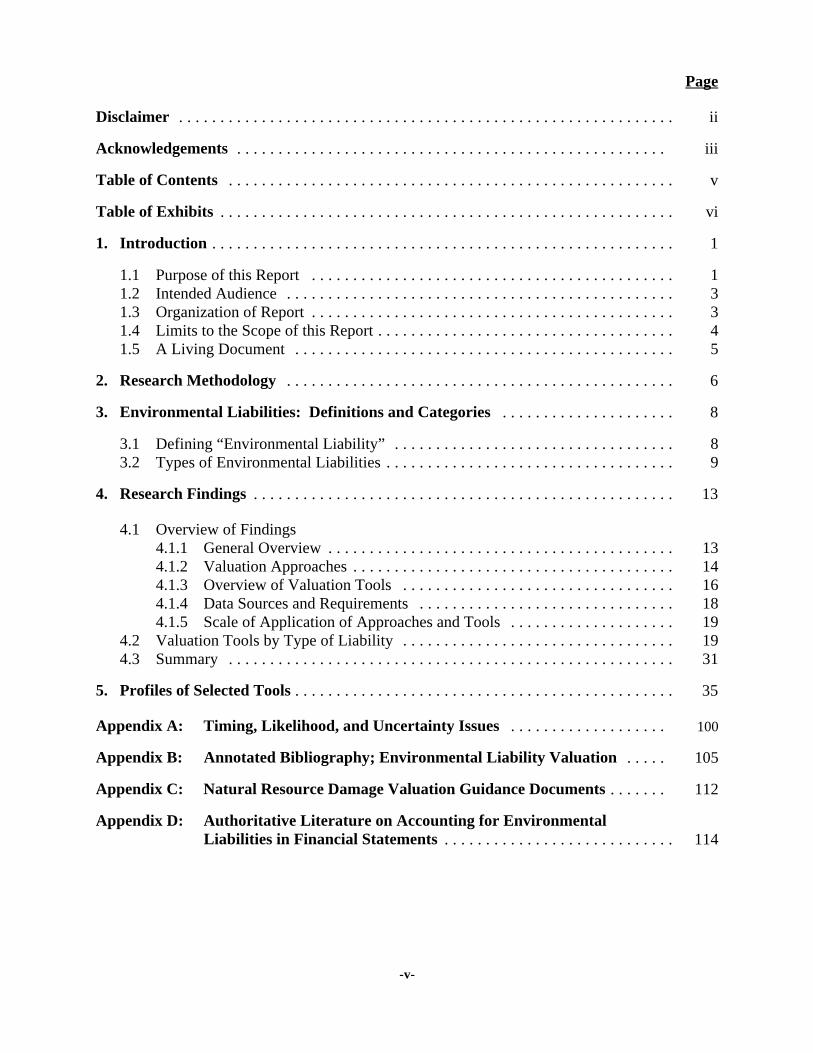
Disclaimer . . . . . . . . . . . . . . . . . . . . . . . . . . . . . . . . . . . . . . . . . . . . . . . . . . . . . . . . . . . . ii
Acknowledgements . . . . . . . . . . . . . . . . . . . . . . . . . . . . . . . . . . . . . . . . . . . . . . . . . . . . iii
Table of Contents . . . . . . . . . . . . . . . . . . . . . . . . . . . . . . . . . . . . . . . . . . . . . . . . . . . . . . v
Table of Exhibits . . . . . . . . . . . . . . . . . . . . . . . . . . . . . . . . . . . . . . . . . . . . . . . . . . . . . . . vi
1. Introduction . . . . . . . . . . . . . . . . . . . . . . . . . . . . . . . . . . . . . . . . . . . . . . . . . . . . . . . . 1
1.1 Purpose of this Report. . . . . . . . . . . . . . . . . . . . . . . . . . . . . . . . . . . . . . . . . . . . 11.2 Intended Audience. . . . . . . . . . . . . . . . . . . . . . . . . . . . . . . . . . . . . . . . . . . . . . . 31.3 Organization of Report. . . . . . . . . . . . . . . . . . . . . . . . . . . . . . . . . . . . . . . . . . . . 31.4 Limits to the Scope of this Report. . . . . . . . . . . . . . . . . . . . . . . . . . . . . . . . . . . . 41.5 A Living Document . . . . . . . . . . . . . . . . . . . . . . . . . . . . . . . . . . . . . . . . . . . . . . 5
2. Research Methodology . . . . . . . . . . . . . . . . . . . . . . . . . . . . . . . . . . . . . . . . . . . . . . . 6
3. Environmental Liabilities: Definitions and Categories . . . . . . . . . . . . . . . . . . . . . 8
3.1 Defining “Environmental Liability” . . . . . . . . . . . . . . . . . . . . . . . . . . . . . . . . . . 83.2 Types of Environmental Liabilities. . . . . . . . . . . . . . . . . . . . . . . . . . . . . . . . . . . 9
4. Research Findings. . . . . . . . . . . . . . . . . . . . . . . . . . . . . . . . . . . . . . . . . . . . . . . . . . . 13
4.1 Overview of Findings4.1.1 General Overview. . . . . . . . . . . . . . . . . . . . . . . . . . . . . . . . . . . . . . . . . . 134.1.2 Valuation Approaches. . . . . . . . . . . . . . . . . . . . . . . . . . . . . . . . . . . . . . . 144.1.3 Overview of Valuation Tools. . . . . . . . . . . . . . . . . . . . . . . . . . . . . . . . . 164.1.4 Data Sources and Requirements. . . . . . . . . . . . . . . . . . . . . . . . . . . . . . . 184.1.5 Scale of Application of Approaches and Tools. . . . . . . . . . . . . . . . . . . . 19
4.2 Valuation Tools by Type of Liability. . . . . . . . . . . . . . . . . . . . . . . . . . . . . . . . . 194.3 Summary . . . . . . . . . . . . . . . . . . . . . . . . . . . . . . . . . . . . . . . . . . . . . . . . . . . . . . 31
5. Profiles of Selected Tools. . . . . . . . . . . . . . . . . . . . . . . . . . . . . . . . . . . . . . . . . . . . . . 35
Appendix A: Timing, Likelihood, and Uncertainty Issues . . . . . . . . . . . . . . . . . . . 100
Appendix B: Annotated Bibliography; Environmental Liability Valuation . . . . . 105
Appendix C: Natural Resource Damage Valuation Guidance Documents. . . . . . . 112
Appendix D: Authoritative Literature on Accounting for EnvironmentalLiabilities in Financial Statements . . . . . . . . . . . . . . . . . . . . . . . . . . . . 114
-vi-
Table of Exhibits
Exhibit Page
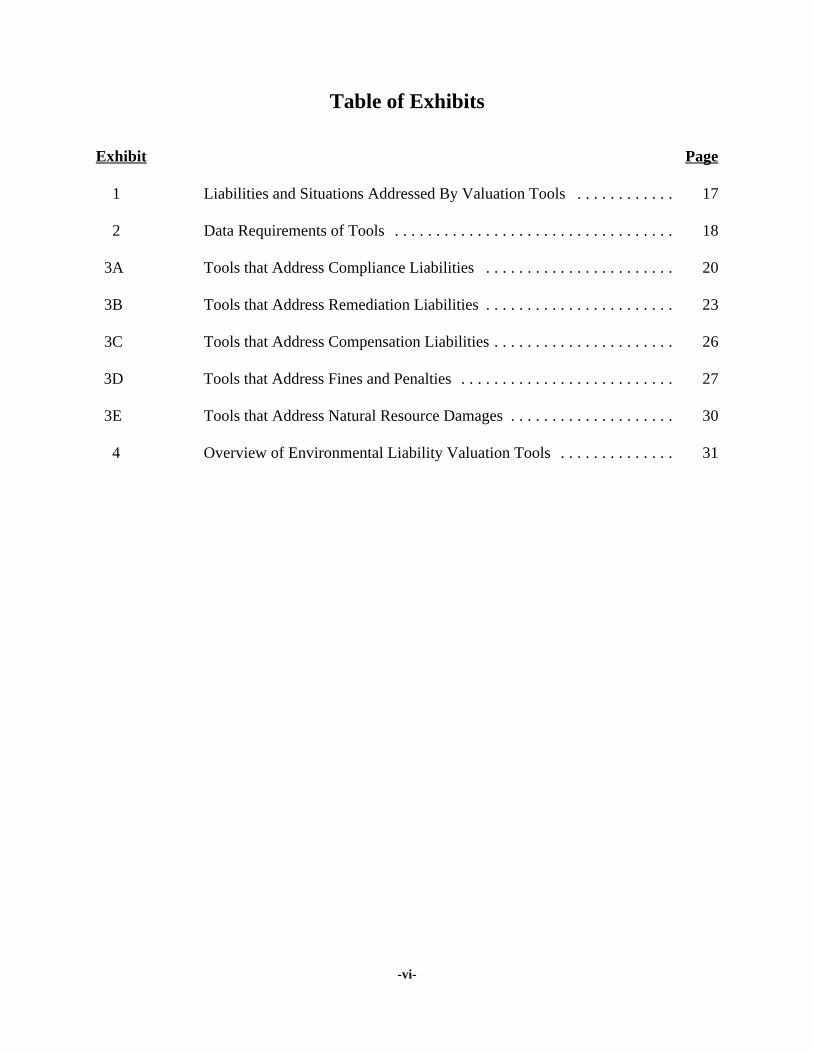
1 Liabilities and Situations Addressed By Valuation Tools . . . . . . . . . . . . 17
2 Data Requirements of Tools. . . . . . . . . . . . . . . . . . . . . . . . . . . . . . . . . . 18
3A Tools that Address Compliance Liabilities. . . . . . . . . . . . . . . . . . . . . . . 20
3B Tools that Address Remediation Liabilities. . . . . . . . . . . . . . . . . . . . . . . 23
3C Tools that Address Compensation Liabilities. . . . . . . . . . . . . . . . . . . . . . 26
3D Tools that Address Fines and Penalties. . . . . . . . . . . . . . . . . . . . . . . . . . 27
3E Tools that Address Natural Resource Damages. . . . . . . . . . . . . . . . . . . . 30
4 Overview of Environmental Liability Valuation Tools. . . . . . . . . . . . . . 31
In a survey of U.S. manufacturing firms conducted by the Tellus Institute and commissioned by EPA’s1
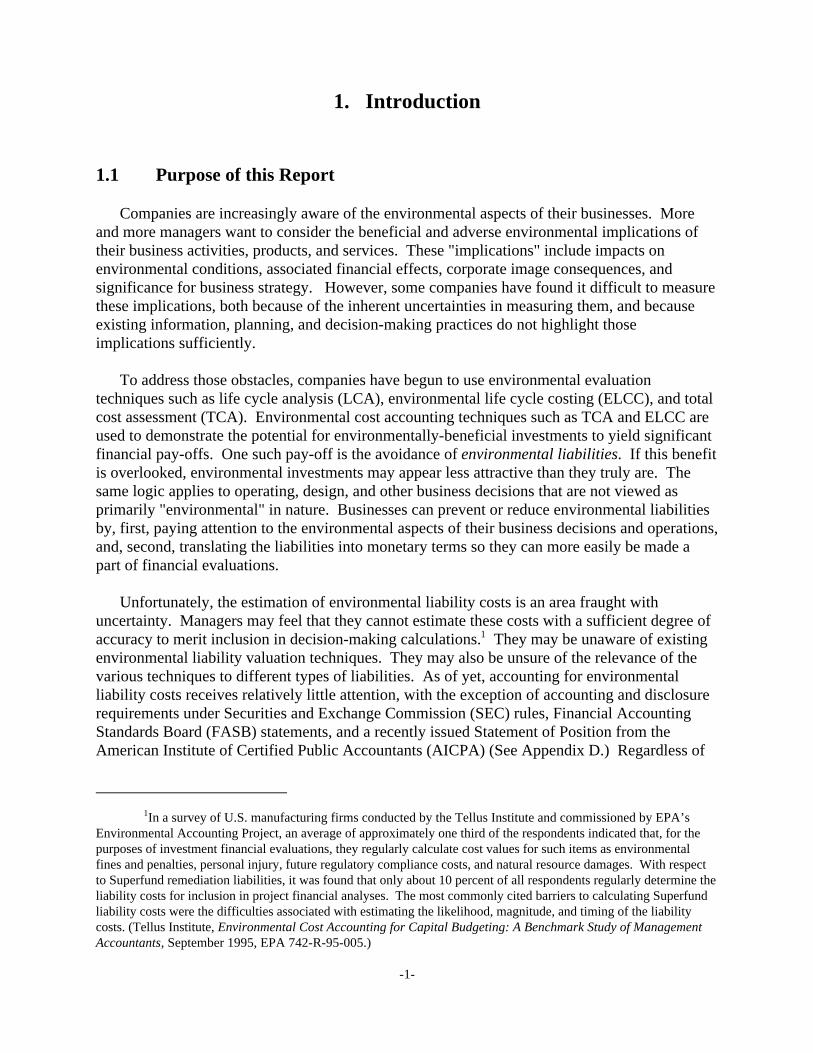
Environmental Accounting Project, an average of approximately one third of the respondents indicated that, for thepurposes of investment financial evaluations, they regularly calculate cost values for such items as environmentalfines and penalties, personal injury, future regulatory compliance costs, and natural resource damages. With respectto Superfund remediation liabilities, it was found that only about 10 percent of all respondents regularly determine theliability costs for inclusion in project financial analyses. The most commonly cited barriers to calculating Superfundliability costs were the difficulties associated with estimating the likelihood, magnitude, and timing of the liabilitycosts. (Tellus Institute, Environmental Cost Accounting for Capital Budgeting: A Benchmark Study of ManagementAccountants, September 1995, EPA 742-R-95-005.)
-1-
1. Introduction
1.1 Purpose of this Report
Companies are increasingly aware of the environmental aspects of their businesses. Moreand more managers want to consider the beneficial and adverse environmental implications oftheir business activities, products, and services. These "implications" include impacts onenvironmental conditions, associated financial effects, corporate image consequences, andsignificance for business strategy. However, some companies have found it difficult to measurethese implications, both because of the inherent uncertainties in measuring them, and becauseexisting information, planning, and decision-making practices do not highlight thoseimplications sufficiently.
To address those obstacles, companies have begun to use environmental evaluationtechniques such as life cycle analysis (LCA), environmental life cycle costing (ELCC), and totalcost assessment (TCA). Environmental cost accounting techniques such as TCA and ELCC areused to demonstrate the potential for environmentally-beneficial investments to yield significantfinancial pay-offs. One such pay-off is the avoidance of environmental liabilities. If this benefitis overlooked, environmental investments may appear less attractive than they truly are. Thesame logic applies to operating, design, and other business decisions that are not viewed asprimarily "environmental" in nature. Businesses can prevent or reduce environmental liabilitiesby, first, paying attention to the environmental aspects of their business decisions and operations,and, second, translating the liabilities into monetary terms so they can more easily be made apart of financial evaluations.
Unfortunately, the estimation of environmental liability costs is an area fraught withuncertainty. Managers may feel that they cannot estimate these costs with a sufficient degree ofaccuracy to merit inclusion in decision-making calculations. They may be unaware of existing1
environmental liability valuation techniques. They may also be unsure of the relevance of thevarious techniques to different types of liabilities. As of yet, accounting for environmentalliability costs receives relatively little attention, with the exception of accounting and disclosurerequirements under Securities and Exchange Commission (SEC) rules, Financial AccountingStandards Board (FASB) statements, and a recently issued Statement of Position from theAmerican Institute of Certified Public Accountants (AICPA) (See Appendix D.) Regardless of
The U.S. Chamber of Commerce, the Business Roundtable, the American Institute of Certified Public 2
Accountants, the Institute of Management Accountants, AACE International (the Society of Total Cost Management),and the U.S. EPA co-sponsored the Workshop. For more information on the workshop, see Stakeholders' ActionAgenda: A Report of the Workshop on Accounting and Capital Budgeting for Environmental Costs, December 5-7,1993; EPA 742-R-94-003 (May 1994).
-2-
financial accounting requirements, however, managers naturally are concerned about minimizingthe costs associated with environmental liabilities, just as they are concerned about minimizingother business expenses. Thus, as the costs of environmental liabilities mount, due both toexpansion in the nature and types of environmental liabilities and to increased costs for each typeof liability, business managers have greater incentives to carefully consider the extent to whichexisting and proposed activities give rise to environmental liability costs.
The Environmental Protection Agency (EPA) is issuing this report as a step toward helpingcompanies assess and manage their environmental liability costs. The report describesvaluation approaches and tools that have been specifically developed or adapted forestimating environmental liability costs for consideration in business managementdecisions such as capital investments, process/input substitutions, product retention andmix, facility siting, and waste management. The emphasis in this report is on techniquesfor placing a monetary value on potential, preventable environmental liabilities. Sourcesof information on estimating environmental liability costs are somewhat obscure; EPA thusoffers this summary of documented valuation techniques to managers who are interested inestimating potential environmental liability costs, but are unaware of techniques to do so. Whileestimation techniques are still under development, and possibly controversial, this report isintended to assist organizations to estimate future and/or potential environmental liability costswithin reasonable limits of accuracy such that a manager is comfortable using the estimationswhen making decisions.
This report was developed under the auspices of EPA's Environmental Accounting Project,which has been working with stakeholders for the past three years to encourage and motivatebusinesses to understand the full spectrum of environmental costs and incorporate these costsinto decision-making. In December 1993, a national workshop of experts drawn frombusinesses, professional groups, government, consulting firms, nonprofits, and academiaproduced an Action Agenda which identifies four overarching issue areas that require attention toadvance environmental accounting: (1) better definition of terms and concepts, (2) creation ofmanagement incentives to upgrade managerial accounting practices, (3) education, guidance, andoutreach, and (4) development and dissemination of analytical tools, methods, and systems. 2
The purpose of this document is to help address the fourth recommendation. At the workshop,opinion was split over whether or not techniques for valuing environmental liabilities wereavailable. This report is intended to follow up on that discussion.
The activities and products of the Environmental Accounting Project are part of EPA'scommitment to fostering pollution prevention solutions to environmental problems. For EPA,pollution prevention means eliminating or minimizing the pollution at the source, includingpractices that minimize the creation of pollution through increased efficiency in the use of rawmaterials, energy, water, or other resources. EPA supports pollution prevention approaches
EPA recognizes that many terms in this report have specific meanings to the accounting community, and, in3
that community’s eyes, some of the terms may be used overly loosely. “Liability” and “costs” constitute twoexamples. In the case of “costs”, nuances of the term are expressed -- where clearly appropriate -- with such words as“expenditures”, “expenses”, and “payments”. However, “costs” is often applied as the default term, and is used tomean “future cash flows”.
-3-
because they are potentially the most environmentally effective and economically efficientmethods of environmental protection.
The identification of environmental costs, including potential environmental liabilities, is animportant step towards reducing those costs. Many types of management decisions may benefitfrom environmental cost information, including product pricing and mix decisions, choices onapproaches for compliance with regulations, and decisions on design modifications to eliminateprocess waste or releases. More information on the consideration of these costs in managementdecision-making can be found in EPA's An Introduction to Environmental Accounting as aBusiness Management Tool: Key Concepts and Terms (EPA 742-R-95-001, June 1995).
1.2 Intended Audience
The discussion and terminology used in this report focus on environmental managementissues faced and addressed by managers in industry. It is hoped that the report will be used bymanagers representing a variety of professions: e.g., environmental, health and safety personnel;managerial accountants; engineering staff; legal staff; and so on. EPA has therefore attempted tochoose vocabulary that is as clear as possible to a broad audience. The techniques described in3
this report may be very useful to other audiences, such as the insurance, banking, and financialaccounting communities.
1.3 Organization of Report
This report consists of five major sections and four appendices, organized as follows:
� Section 1 is this Introduction.
� Section 2 describes the research methodology used to develop this report.
� Section 3 provides a definition of “environmental liability” and discusses thedifferent types of environmental liabilities that firms may face.
� Section 4 describes the results of the research to identify techniques for estimationof environmental liability costs.
� Section 5 profiles twenty-four specific tools.
� Appendices:
For a description of the difference between private costs and societal costs, see An Introduction to4
Environmental Accounting as a Business Management Tool: Key Concepts and Terms (EPA 742-R-95-001, June1995).
-4-
& Appendix A describes timing, likelihood, and uncertainty issues associated withthe different types of liabilities.
& Appendix B presents an annotated bibliography of sources of furtherinformation.
& Appendix C presents a list of other documents that provide guidance on valuingnatural resource damages.
& Appendix D provides a list of authoritative literature on accounting forenvironmental liabilities in financial statements.
1.4 Limits to the Scope of this Report
� This report is not intended to address the recognition or reporting of environmental liabilitiesin financial statements or disclosures subject to the jurisdiction of the Securities andExchange Commission (SEC) or in accordance with Generally Accepted AccountingPrinciples (GAAP). However, EPA acknowledges that the valuation techniques described inthis report may have implications for such reporting.
� This report focuses on the valuation of environmental impacts that constitute businessliabilities, i.e. “private” or “internal” costs. It is not intended to address those impactstermed "societal costs" or "externalities" for which a company is not financially liable orlegally accountable. However, in a changing legal environment, the line between private4
and societal costs is not static, and it may be worthwhile to consider the possible enactmentor modification of environmental laws when deciding what constitutes a potential businessenvironmental liability.
� This report does not present a legal analysis of environmental liability issues.
� This report does not describe how to identify the types of potential environmental liabilitiesfaced by a given company nor does it provide specific guidance on applying valuationtechniques to those liabilities.
� This report does not address the potential jail terms that individuals can incur as a result ofviolating environmental laws.
1.5 A Living Document
EPA views this document only as a step towards assisting organizations in valuing the costsof potential and avoidable environmental liabilities. Because the valuing of environmental
-5-
liabilities is an emerging and rapidly developing issue, the Environmental Accounting Projectintends that this report be a “living document”. Accordingly, if readers are aware of other, as-of-yet unmentioned, techniques in use or that are described in literature, they are encouraged tosubmit information on those techniques to the Project for possible inclusion in future editions ofthis document. The Project also welcomes suggestions on the report’s format and content. Please send valuation techniques, comments, and suggestions to:
The Environmental Accounting ProjectPollution Prevention Division (MC-7409)Office of Pollution Prevention and Toxics
U.S. Environmental Protection Agency401 M Street, SW
Washington, D.C. 20460Fax: (202) 260-0178
Phone: (202) 260-4164
-6-
2. Research Methodology
This report is based on extensive research and review of literature to identify techniques forvaluing environmental liabilities. Techniques were also obtained by contacting individuals inindustry, government, academia, and consulting organizations.
EPA's Environmental Accounting Project continually seeks, receives, and reviewsenvironmental accounting materials for inclusion in its literature file and its regularly updatedResource Listing. The literature file contained a limited number of documents addressing thevaluation of environmental liabilities. To locate additional materials, EPA secured the assistanceof ICF Incorporated (ICF), a government contractor that has been active in developingenvironmental liability valuation models, maintains a file of related materials, and previouslyhad performed similar literature searches for government agencies. ICF, assisted by the EPAlibrary, conducted stack and on-line searches for relevant documents. In addition, hard copysearches were conducted at the American Chemical Society library.
ICF and professional librarians searched journals and reports contained in computerizeddatabases and services, including DIALOG and NEXIS. On-line and hard-copy catalogs oftrade and professional associations’ publications, including conference papers, also weresearched. In addition, references and footnotes were reviewed in all materials retrieved in orderto identify other potential sources. Ph.D. dissertations were not systematically searched.
The search strategy focused on key words of "environmental liability(ies)," "pollutionliability(ies)" and combinations with "measurement," "quantification," "evaluation," "valuation,""monetization," or "assessment." Due to the limited number of pertinent references located, theliterature on environmental cost accounting, activity-based accounting, life cycle costing, andrisk management identifiable through on-line databases also was reviewed. The documentscreening process and selection criteria included the following:
& Focus on documents prepared in the United States to reflect environmentalliabilities under U.S. law.
& Identify documents that address the topic of environmental liability valuation withsome specificity and provide illustrations of valuing environmental liabilities.
& Identify documents that are not exclusively focused on financial accounting/reportingin the context of GAAP and SEC requirements.
& Exclude cost-benefit and risk assessment methodologies developed for and applied togovernmental regulatory decisions. These were not viewed as central to this researchand, with few exceptions, are not included in this report.
To supplement the literature search, individuals were contacted who were listed in theBusiness/Industry and Consulting categories of EPA's Environmental Accounting Network

EPA 742-B-96-006 (April 1996). 5
-7-
Directory and who had noted experience potentially relevant to this project. These people were5
asked to identify any tools or approaches used to express potential liabilities in financial termsfor inclusion in this report. Additionally, in the draft review process, EPA sought input from across-section of interested and knowledgeable parties and queried them to identify furtherrelevant documents and/or software tools.
Financial Accounting Standards Board Concept Statement No. 6, Paragraph 35 (1985); Institute of Management 6
Accountants Statement No. 2A Management Accounting Glossary (1990).
-8-
3. Environmental Liabilities: Definitions and Categories
The term "environmental liabilities" crops up in many discussions of environmental issues. Yet there is much confusion about the term. Often, "environmental liabilities" is used to refer tothe potential for fines, penalties, and jail terms for violations of environmental laws. "Environmental liabilities" also frequently serves as short-hand to refer to the clean-upobligations under the federal Superfund and state counterpart laws for contaminated sites. Another common usage is to label the costs involved in complying with regulations as"environmental liabilities." In contrast, when companies perform or commission "environmentalliability" assessments, they want to know their exposure to potential environmental liabilitieseven when they are in complete compliance with regulatory standards.
Clearly, "environmental liability" is an umbrella term. The following pages present a briefdefinition of the term and describe the major types of environmental liabilities in order toestablish a framework for reviewing approaches and tools identified for expressing theseliabilities in monetary terms. For readers who would like more information about the timing,likelihood, and uncertainty characteristics of the various forms of environmental liabilities, moreinformation on these subjects is provided in Appendix A.
3.1 Defining “Environmental Liability”
The term liability has important accounting and legal dimensions. Accounting institutionsdefine liability as a “probable future sacrifice of economic benefits arising from presentobligations to transfer assets or provide services in the future as a result of past transactions orevents." More simply, a liability is a present obligation to make an expenditure or to provide a6
product or service in the future.
Liability has an important legal dimension as well. A liability is a legally enforceableobligation, whether it is voluntarily entered into as a contractual obligation, or is imposedunilaterally, such as the liability to pay taxes. The law both establishes liabilities and determineswho is responsible for discharging them.
For the purposes of this document, an environmental liability is a legal obligation to make afuture expenditure due to the past or ongoing manufacture, use, release, or threatened release ofa particular substance, or other activities that adversely affect the environment. A potentialenvironmental liability is a potential legal obligation to make a future expenditure due to theongoing or future manufacture, use, release, or threatened release of a particular substance, orother activities that adversely affect the environment. An obligation is potential when it dependson future events or when a law or regulation creating the liability is not yet in effect. A"potential environmental liability" differs from an "environmental liability" because anorganization has an opportunity to prevent the liability from occurring by altering its ownpractices or adopting new practices in order to avoid or reduce adverse environmental impact.
-9-
3.2 Types of Environmental Liabilities
Environmental liabilities arise from a variety of sources. Federal, state, and localenvironmental statutes, regulations, and ordinances, whether enforced by public agencies orthrough private citizens' suits, give rise to many types of environmental liabilities. Another legalsource of these liabilities is "common law" (i.e., judge-made law) that can vary from state tostate. A detailed list of environmental liabilities would be very lengthy. Thus, this reportdistinguishes the following broad categories of environmental liabilities:
� compliance obligations related to laws and regulations that apply to themanufacture, use, disposal, and release of chemical substances and to otheractivities that adversely affect the environment
� remediation obligations (existing and future) related to contaminated real property
� obligations to pay civil and criminal fines and penalties for statutory or regulatorynon-compliance
� obligations to compensate private parties for personal injury, property damage, andeconomic loss
� obligations to pay "punitive damages" for grossly negligent conduct
� obligations to pay for natural resource damages
The following paragraphs elaborate on each of these types of environmental liabilities. (Readers who are well-versed in the types of environmental liabilities may want to skip thefollowing few pages and move on to Section 4.)
Compliance obligations. As laws and regulations are enacted that apply to the manufacture,use, or release of regulated substances, companies find themselves facing future compliancecosts. In evaluating business plans, some companies may also consider the possibility that newlaws and regulations will be enacted. Additionally, a company may discover that it is not incompliance with existing laws and regulations. The costs of coming into compliance can rangefrom modest outlays required to conform to administrative requirements (e.g., recordkeeping,reporting, labeling, training) to more substantial outlays, including capital costs (e.g., to pretreatwastes prior to land disposal or release to surface waters, to contain spills, to "scrub" airemissions). Laws and regulations also impose "exit costs" (e.g., to properly close waste disposalsites and provide for post-closure care, and to decommission nuclear power reactors at the end oftheir useful lives).
Remediation obligations are sometimes subsumed under "compliance" because someproperty clean-up requirements have been enacted as part of regulatory programs applicable tooperating facilities under, for example, the Resource Conservation and Recovery Act (RCRA)and the Safe Drinking Water Act's Underground Injection Control program. Also, it is easy to
-10-
blur the distinction between the compliance obligation of routine closure of facilities at the endof their useful lives and the remediation obligation for cleaning up pollution posing a risk tohuman health and the environment. And meeting current compliance obligations may helpminimize future remediation obligations. Nevertheless, remediation obligations are considered aseparate category in this document because of some distinguishing characteristics of the liabilityand the attention that has been paid to this category of environmental liability. Remediationtends to be expensive, ranging up to many millions of dollars, and can include excavation,drilling, construction, pumping, soil and water treatment, and monitoring, and can include theresponse costs incurred by regulatory agencies. Remediation costs also can include the provisionof alternate drinking water supplies for affected community residents, and, in somecircumstances, purchase of properties and relocation expenses. Technical studies and theexpenditure of management, professional, and legal resources add to the cost of remediation.
The remediation obligation is distinctive because a company may face remediationobligations due to contamination at inactive sites that are otherwise unregulated; at propertyformerly but not currently owned or used; at property it never owned or used, but to which itswastes were sent; and, at property it acquired but did not contaminate (e.g., in "Superfundliability" scenarios). Because many dollars will be needed in the near-term to remediate existingenvironmental contamination, particularly at inactive and abandoned sites, these liabilities oftendominate (and can distort) a firm's assessment of its environmental liabilities. Therefore, it ishelpful to distinguish between remediation obligations for existing contamination and potentialremediation obligations for future contamination because managers can have more impact onongoing and future activities and releases -- whether accidental or not -- that may trigger futureremediation obligations.
Fines and penalties. Companies that are not in compliance with applicable requirements maybe subject to civil or criminal fines or penalties for noncompliance and/or expenses for projectsagreed to as part of a settlement for noncompliance. Such payments fulfill punitive anddeterrent functions and are in addition to the costs of coming into compliance. Fines andpenalties (and related outlays for supplemental environmental projects) can range from modestamounts to a few million dollars per violation. Generally, a civil penalty is assessed that is atleast equal to the costs a company saved through noncompliance, thus removing any financialincentive to ignore a law. Other factors may add to or reduce the penalty amount assessed for aviolation.
This is also known as "toxic tort" liability where the word "tort" is a legal term meaning "a wrong" under 7
common law. Most "toxic tort" cases do not relate to environmental liabilities but fall under the realm of "productliability" where the issues are the danger posed by a "product," such as a pharmaceutical, pesticide, householdchemical, or industrial product (e.g., asbestos insulation), and whether there was adequate warning or disclosure of therisk. In contrast, "environmental torts" are most often associated with emissions from a facility, waste disposal sites,and accidental releases.
-11-
Compensation obligations. Under common law and some state and federal statutes,companies may be obligated to pay for compensation of "damages" suffered by individuals, theirproperty, and businesses due to use or release of toxic substances or other pollutants. These7
liabilities may occur even if a company is in compliance with all applicable environmentalstandards.
Distinct subcategories of compensation liability include personal injury (e.g., "wrongfuldeath," bodily injury, medical monitoring, pain and suffering), property damage (e.g.,diminished value of real estate, buildings, or automobiles; loss of crops), and economic loss(e.g., lost profits, cost of renting substitute premises or equipment). Compensation costs can befairly minor or quite substantial, depending on the number of claimants and the nature of theirclaims. Oftentimes, legal defense costs (potentially including technical, scientific, economic,and medical studies) can be substantial in handling such claims, even when the claims areultimately determined to be without merit. Moreover, responding to compensation claims canconsume management time and require expenditures in order to control damage to corporateimage. Compensation liabilities may involve costs for remediation of contaminated property aswell as provision of alternate water supplies, thus somewhat overlapping the remediationcategory.
Because of workers' compensation and employer liability laws, payments to compensateemployees for occupational exposure and injury from hazardous or toxic substances are notgenerally determined through litigation against the employer or considered environmentalliabilities. However, occupational claims sometimes may be brought against another party whois not the employer; for example, workers responding to a train wreck have sued the shipper ofhazardous wastes released at the scene of the wreck; for the shipper, these claims can be viewedas environmental liabilities. Managers will want to understand the potential costs ofoccupational exposure and injuries, because actions taken to prevent or reduce environmentalliabilities may also eliminate or reduce occupational liabilities.
Punitive Damages. To supplement compensatory payments to those harmed by the actionsof others, the law allows the imposition of what are called "punitive damages" to punish anddeter conduct viewed as showing a callous disregard for others. Unlike compensatory liability,the measure of punitive damages is not directly tied to the actual injuries sustained. Punitivedamages are often many times larger than the costs of compensation; although rarely assessed,punitive damages in environmental litigation usually exceed $1 million. Punitive damages tendto be more common in product liability than environmental liability cases; the most notablerecent imposition of punitive damages in the environmental context arose from the ExxonValdez spill.
See General Accounting Office, Superfund: Outlook for and Experience with Natural Resource Damage 8
Settlements (RCED-96-71) (4/16/96). In June, 1995, the General Accounting Office (GAO) testified before Congressthat natural resource damage claims had been settled for relatively small amounts: of 98 cases settled by federaltrustees, 48 cases were settled for zero dollars; 36 cases for less than $500,000 each; 9 cases for between $500,000and $5 million; and 5 cases for greater than or equal to $12 million. GAO also identified 4 states where 17 claims hadbeen settled by non-federal trustees for an aggregate of $23.4 million.
-12-
Natural resource damages. A relatively new category of environmental liability is besttermed "natural resource damages." Established by state and federal statutes, notably Section311 of the Clean Water Act, Section 107 of the Comprehensive Environmental Response,Compensation and Liability Act (CERCLA or "Superfund"), and Section 1006 of the OilPollution Act (OPA), this liability generally relates to injury, destruction, loss, or loss of use ofnatural resources that do not constitute private property. Rather, the resources must belong to orbe controlled by federal, state, local, foreign, or tribal governments. Such resources includeflora, fauna, land, air, and water resources. The liability can arise from accidental releases (e.g.,during transport) as well as lawful releases to air, water, and soil. To date, most natural resourcedamage payments have been relatively small.8
A parallel body of literature addresses tax treatment of environmental remediation expenditures. 9
See reference *28 in Appendix B and the associated profile in Section 5. 10
-13-
4. Research Findings
4.1 Overview of Findings
4.1.1 General Overview
Discussions of environmental accounting and accounting for environmental liabilities can befound in a variety of accounting, managerial, environmental, and legal publications. Much ofthe available literature focuses on SEC requirements and generally accepted accountingprinciples (GAAP) in connection with the reporting of environmental remediation liabilities inexternal financial statements. It is clear from this literature that rules and practices for9
measuring (as well as recognizing and reporting) environmental liabilities for a company'sfinancial statements are still evolving (See Appendix D). Some of the tools and approachesdeveloped to measure environmental liabilities for these purposes may also be useful foraddressing potential environmental liabilities outside of the external reporting context. However, in general, the requirements and limitations (e.g., focus on expenditures andmateriality at the level of the firm as a whole) of this branch of environmental accounting resultin data that do not meet the needs of most managers for disaggregated, forward-lookinginformation for planning, decision-making, and operations.
Environmental accounting literature oriented towards managerial decision-making focuseson (1) methods for evaluating pollution prevention investments, (2) examples of financially andenvironmentally attractive actions taken by companies, and (3) internal recognition and properallocation of environmentally-driven expenditures. This literature often refers to the value orimportance of considering the dollar magnitude of environmental liabilities, but tends to stopthere. Or, the literature describes elements to be considered in valuing environmental liabilitieswithout providing numerical illustrations, detailed methodologies, databases, or default values. Some of the literature claims that environmental liabilities cannot be estimated, and someprovides qualitative scoring approaches only. But more of the authors make the point that evenan uncertain monetary estimate may be better than ignoring a potential environmental liability,which implicitly equates to a monetary value of zero. In failing to place a value onenvironmental liabilities, managers may reject pollution prevention actions that would be seen asfinancially attractive if the potential reduction in liability costs were valued. EPA's PollutionPrevention Benefits Manual recognizes that accounting for conventional costs (e.g., labor,10
materials, and utilities) and potentially hidden environmental costs in project financial analysesalone will often suffice to identify financially attractive pollution prevention actions, andsuggests a middle course: value environmental liabilities only when they might make adifference in the cost-benefit calculus or assess what the value of avoided liability costs wouldhave to be for the pollution prevention action to make financial sense.
See, for example, Cooke, R.M. Experts in Uncertainty: Opinion and Subjective Probability in Science (Oxford 11
University Press, New York, 1991).
See, for example, Humphreys, K. (ed.), Project and Cost Engineers Handbook, American Association of Cost 12
Engineers (Marcel Dekker, Inc., New York, 1984).
See, for example, Ross, S.M. Introduction to Probability Models, 3rd Ed. (Harcourt Brace Jovanovich 13
Publishers, 1985) and Schaeffer, Richard and James McClave, Probability and Statistics for Engineers, 3rd Ed.(PWG-Kent Publishing Co., Boston, 1990).
-14-
4.1.2 Valuation Approaches
There are a variety of general approaches to valuing environmental liabilities, such asactuarial techniques, professional judgment, engineering cost estimation, decision analysis/statistical techniques, modeling, scenario techniques, and valuation methods. These approacheshave been developed and applied, usually in combination, in specific tools for valuing particulartypes of environmental liabilities that can arise from certain situations, as discussed starting onpage 19. Although full explanations of these general approaches go beyond the scope of thisdocument, they can be described as follows:
Actuarial techniques involve the statistical analysis of historical data on the costs and/oroccurrence of environmental liabilities or events (such as accidents) or consequences (such asadverse health outcomes) that can lead to environmental liabilities.
Professional judgment includes the expert judgment of engineers, scientists, lawyers,environmental specialists, and other professionals. Specifically, engineering judgment can be11
used to identify appropriate compliance and remediation activities and estimate the likelihood ofaccidental releases; scientific judgment can be used to assess hazards, the transport and fate ofsubstances released to the environment, and the potential responses of exposed plants, animals,human beings, their property, and ecosystems; and legal judgment can be used to assess legalbases for liability and potentially recoverable damages.
Engineering cost estimation develops costs (e.g., for remediation, restoration, compliance,provision of replacement water supplies) by systematically identifying required implementationactivities (termed activity-based estimating) and corresponding units, unit costs (e.g., labor,materials, utilities), and contingency factors or through parametric cost estimation which usescost equations, either individually or grouped into more complex models, developed byanalyzing the correlation between cost drivers and costs. A life cycle cost estimate12
encompasses all costs, including design, development, operation, maintenance, and finaldisposition over the anticipated lifespan of a process, product, facility, or system.
Decision analysis techniques (e.g., event trees, probability distributions, level of confidencecalculations) are used in structuring expert judgment, reflecting (and quantifying) uncertaintiesin liability valuation, and in characterizing and presenting the results of environmental liabilityvaluation. Uncertainties regarding the magnitude, likelihood, and timing of potential13
environmental liabilities can be explicitly addressed, producing a set of liability values and theirassociated likelihoods.
See, for example, Schoemaker, P.J.H. "When and How to Use Scenario Planning: A Heuristic Approach with 14
Illustration," Journal of Forecasting, v. 10, 1991, pp. 549-564, and "Scenario Planning: A Tool for StrategicThinking," Sloan Management Review, v. 36, Winter 1995, pp. 25-40.
-15-
Modeling is used as an alternative or supplement to professional judgment when historic dataare limited or not available, and cost or occurrence values must be simulated due to manyuncertain variables or complex interactions. (A model is a set of equations and associated rulesfor their applicability and interaction.) Modeling typically draws upon available data;professional judgment; quantitative expressions of pollutant release, transport, fate, exposure,and consequences; and statistical analysis techniques.
Scenario techniques are used to describe and address future situations that can affectenvironmental liabilities, such as changes in regulatory requirements, remediation policy, legalstandards for compensation and natural resource damages, and enforcement policy. A fewscenarios can bracket a wide range of possibilities, represent diverse views, and challengemanagerial thinking. The scenario development process involves the formal elicitation of expertjudgments about future environmental scenarios.14
Valuation methods include a variety of legal rules and economic techniques for puttingmonetary values on environmental consequences for compensation and natural resource damageliabilities, respectively. Legal approaches to valuation of injuries to people, their property, andtheir businesses comprise the accepted practices that have been developed and used to putmonetary values on compensation claims in litigation. Different types of claims (e.g., fear ofcancer, increased risk, clinical impairment, morbidity, pain and suffering, mortality, diminishedmarket value, lost profits) will each have their own valuation approaches, which can vary acrosslegal jurisdictions. Economic approaches to valuing the services provided by natural resourcesthat are not privately-owned constitute a set of techniques intended to value, directly orindirectly, the various use and non-use services injured or lost due to releases of pollutants.
This report does not present a side-by-side comparison of values, assumptions, or approaches used to15
address different environmental liabilities.
-16-
4.1.3 Overview of Valuation Tools
This research has documented a diverse set of specific tools that employ one or moreapproaches to value environmental liabilities. Some of the tools can help the user calculatepotential liability costs and/or provide monetary values, while other tools describe either amore general process for developing, or a framework for using, such monetary estimates;this latter group may or may not provide clear illustrations or examples. The level andclarity of documentation vary considerably, both within and across tools. For some of the tools,the source(s) of key information (e.g., liability costs per unit, probability of accident) are notprovided; other tools may require the user to estimate such variables, but provide little in theway of guidance or benchmarks to help that process. The diversity of features, approaches, andorientations in the tools makes them very difficult to classify.
For the most part, the tools have been developed to address specific situations or answerspecific questions. Often, the results or methods may be applied to other situations or questions. Linking the results or approaches of different tools may be feasible for some situations but notfor others. The tools uncovered in this research do not address all potentially relevant situations;and the research uncovered no comprehensive, up-to-date compilations of data that could beused in assessing magnitude, likelihood, and timing of all potential liabilities.
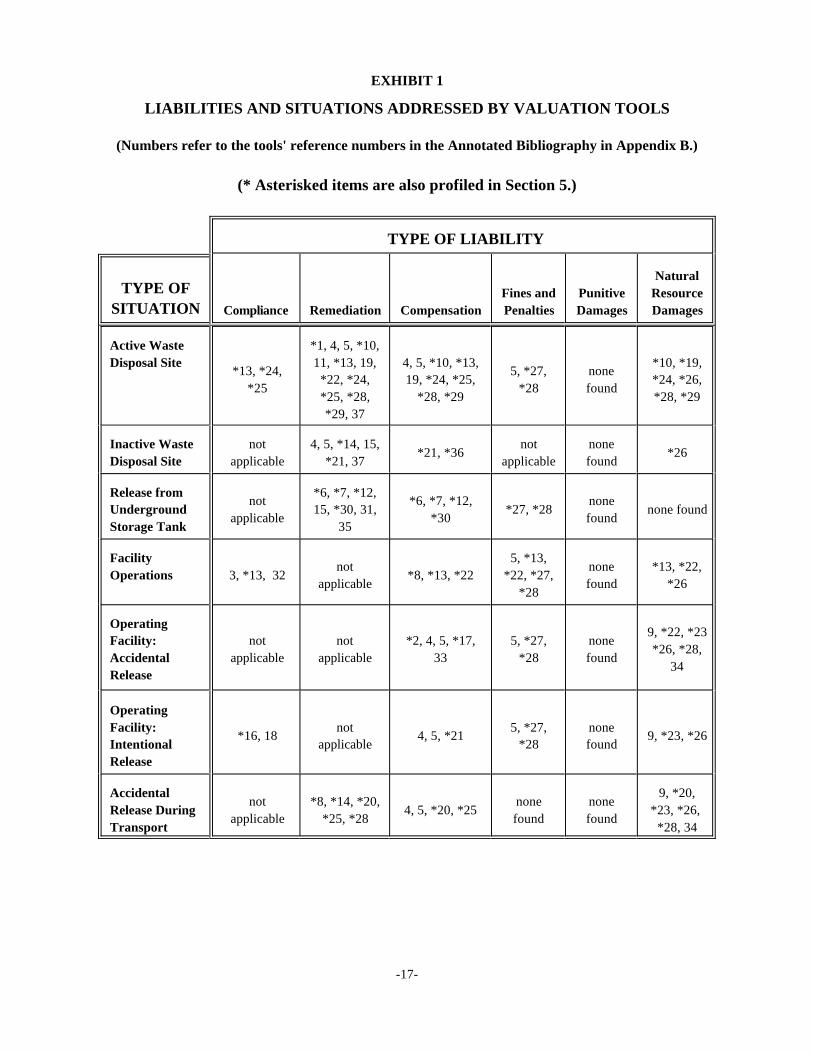
Currently, the most common applications of environmental liability valuation tools relate towaste management and disposal, and releases from underground storage tanks of petroleum,with fewer tools applied to releases from fixed facilities. Exhibit 1 is an attempt to show howthe reported tools identified in this study map across various situations and the types of liabilitiesdescribed in the preceding section of this report. Important note: Throughout the exhibits andthe text of this section, identified tools are referred to by their reference numbers from theannotated bibliography in Appendix B (starting on page 105). Tool reference numbersmarked with an asterisk (*) are also profiled in Section 5 (starting on page 35).
It is not always clear in the literature which liabilities or situations are being or can beaddressed by a tool. Thus, assigning valuation tools to the pigeonholes in Exhibit 1 is sometimesproblematic. Although liability valuation tools appear to have been developed and applied tomost of the applicable cells of the Exhibit 1 matrix, there is not an abundance of tools available. In addition, with a few exceptions, the documented tools are generally not stand-alonecommercially available software packages or workbooks.15
-17-
EXHIBIT 1
LIABILITIES AND SITUATIONS ADDRESSED BY VALUATION TOOLS
(Numbers refer to the tools' reference numbers in the Annotated Bibliography in Appendix B.)
(* Asterisked items are also profiled in Section 5.)
TYPE OF LIABILITY
TYPE OFSITUATION Compliance Remediation Compensation Penalties Damages Damages
Fines and Punitive ResourceNatural
Active Waste *1, 4, 5, *10,Disposal Site 11, *13, 19, 4, 5, *10, *13, *10, *19,
*13, *24, 5, *27, none*25 *28 found
*22, *24, 19, *24, *25, *24, *26,*25, *28, *28, *29 *28, *29*29, 37
Inactive Waste not 4, 5, *14, 15, not noneDisposal Site applicable *21, 37 applicable found
*21, *36 *26
Release from *6, *7, *12,Underground 15, *30, 31, *27, *28 none foundStorage Tank 35
not *6, *7, *12, noneapplicable *30 found
Facility 5, *13,Operations 3, *13, 32 *8, *13, *22 *22, *27,
not none *13, *22,applicable found *26
*28
OperatingFacility: not not *2, 4, 5, *17, 5, *27, noneAccidental applicable applicable 33 *28 foundRelease
9, *22, *23*26, *28,
34
OperatingFacility: not 5, *27, noneIntentional applicable *28 foundRelease
*16, 18 4, 5, *21 9, *23, *26
Accidental 9, *20,Release During 4, 5, *20, *25 *23, *26, Transport *28, 34
not *8, *14, *20, none noneapplicable *25, *28 found found
-18-
4.1.4 Data Sources and Requirements
The tools draw upon different sources and types of data relating to the potential magnitude,likelihood, and timing of environmental liabilities. Some of the tools require more or less dataas inputs, while others provide answers or default values. Some of the tools take the form ofstand-alone models/databases, others represent the results of models, while some are primarilyjudgment driven. Many of the more complex or data-driven tools were developed with fundingfrom state and federal government agencies; a smaller number are the products of industry orconsultants/academics. Liability valuation techniques may be embedded in larger decision-support tools or may be independent.
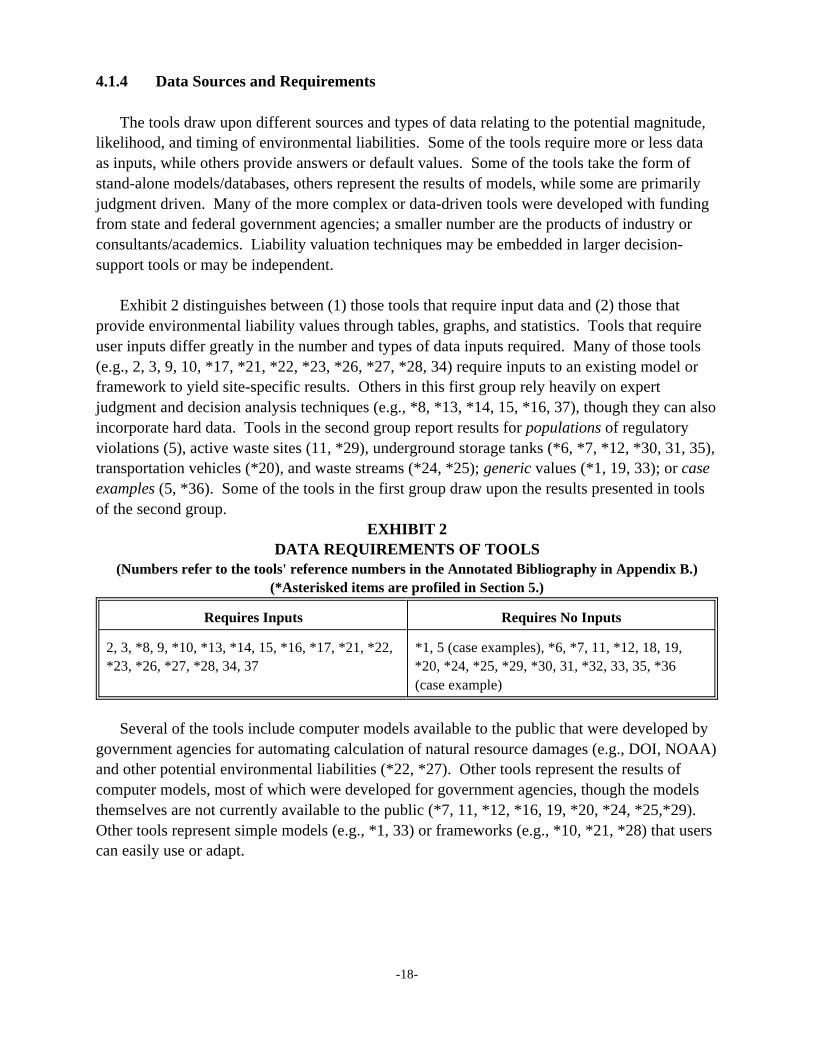
Exhibit 2 distinguishes between (1) those tools that require input data and (2) those thatprovide environmental liability values through tables, graphs, and statistics. Tools that requireuser inputs differ greatly in the number and types of data inputs required. Many of those tools(e.g., 2, 3, 9, 10, *17, *21, *22, *23, *26, *27, *28, 34) require inputs to an existing model orframework to yield site-specific results. Others in this first group rely heavily on expertjudgment and decision analysis techniques (e.g., *8, *13, *14, 15, *16, 37), though they can alsoincorporate hard data. Tools in the second group report results for populations of regulatoryviolations (5), active waste sites (11, *29), underground storage tanks (*6, *7, *12, *30, 31, 35),transportation vehicles (*20), and waste streams (*24, *25); generic values (*1, 19, 33); or caseexamples (5, *36). Some of the tools in the first group draw upon the results presented in toolsof the second group.
EXHIBIT 2DATA REQUIREMENTS OF TOOLS
(Numbers refer to the tools' reference numbers in the Annotated Bibliography in Appendix B.)(*Asterisked items are profiled in Section 5.)
Requires Inputs Requires No Inputs
2, 3, *8, 9, *10, *13, *14, 15, *16, *17, *21, *22, *1, 5 (case examples), *6, *7, 11, *12, 18, 19,*23, *26, *27, *28, 34, 37 *20, *24, *25, *29, *30, 31, *32, 33, 35, *36
(case example)
Several of the tools include computer models available to the public that were developed bygovernment agencies for automating calculation of natural resource damages (e.g., DOI, NOAA)and other potential environmental liabilities (*22, *27). Other tools represent the results ofcomputer models, most of which were developed for government agencies, though the modelsthemselves are not currently available to the public (*7, 11, *12, *16, 19, *20, *24, *25,*29). Other tools represent simple models (e.g., *1, 33) or frameworks (e.g., *10, *21, *28) that userscan easily use or adapt.
This parenthetical note also applies to the other types of environmental liabilities addressed in this report. For 16
more information on the hidden nature of environmental costs in managerial accounting systems, see An Introductionto Environmental Accounting as a Business Management Tool: Key Concepts and Terms (EPA 742-R-95-001, June1995).
-19-
4.1.5 Scale of Application of Approaches and Tools
Environmental liability valuation approaches and, hence, tools that use those approaches,differ in the scale of their application -- a single process (e.g., waste disposal) or unit (e.g.,underground storage tank), an entire facility, a population of units, or an entire company. Liabilities can be valued through bottom-up or top-down approaches. The former focuses onthe liabilities of individual units of a firm or classes of liabilities and can serve as stepping stonesto estimate firm-wide aggregate environmental liability. The latter approach starts with anaggregate liability estimate and apportions that liability to industries and firms (and, byextension, subdivisions and operations within firms).
Most of the identified tools appear to take a bottom-up approach, some characterize apopulation's environmental liabilities (see Section 4.1.4), and examples of the top-downapproach are few. Some of the tools focus on waste management approaches (e.g., *1, *10, *24,*25), others focus on the industrial process level (e.g., *2, *13, *16, *28), while others deal withincidents (e.g., *8, 9, 19, *20, *23, *26, 34), and a small number of tools relate to specificchemical substances (e.g., 18, *22).
4.2 Valuation Tools by Type of Liability
This section reviews the tools identified by EPA that address the potential environmentalliabilities defined in Section 3. The text discusses the tools in general terms, rather thanindividually, by each liability category.
Compliance Liabilities
Although some companies disclose material future compliance costs in conformance withSEC requirements, EPA found no references that describe the tools or approaches used todevelop these overall, company-wide projections. With respect to future compliance costs forongoing or future operations, most of the literature focuses on explaining coming regulatoryrequirements and describing technical compliance options. What little is published to helpcompanies estimate the future costs of compliance focuses primarily on "end-of-pipe" abatementtechnologies and employs engineering cost estimation (see ref. 18). Historical data oncompliance costs are rarely publicly available in any useful detail and may not be particularlyhelpful in developing cost estimates for new regulatory requirements, with some exceptions suchas the costs of certain standard administrative requirements (e.g., recordkeeping), sampling andanalysis, and common pollution treatment technologies. (A company's ability to project futurecompliance costs additionally may be hindered by the lack of accounting visibility for currentcompliance costs, which are frequently embedded with a variety of other costs. )16
These future "exit costs" have received increased attention for financial reporting. See references listed in 17
Appendix D, such as the Financial Accounting Standards Board (FASB) Exposure Draft, Accounting for CertainLiabilities Related to Closure or Removal of Long-Lived Assets and the Governmental Accounting Standards Board(GASB) Statement No. 18 Accounting for Municipal Solid Waste Landfill Closure and Post Closure Care Costs(August, 1993).
-20-
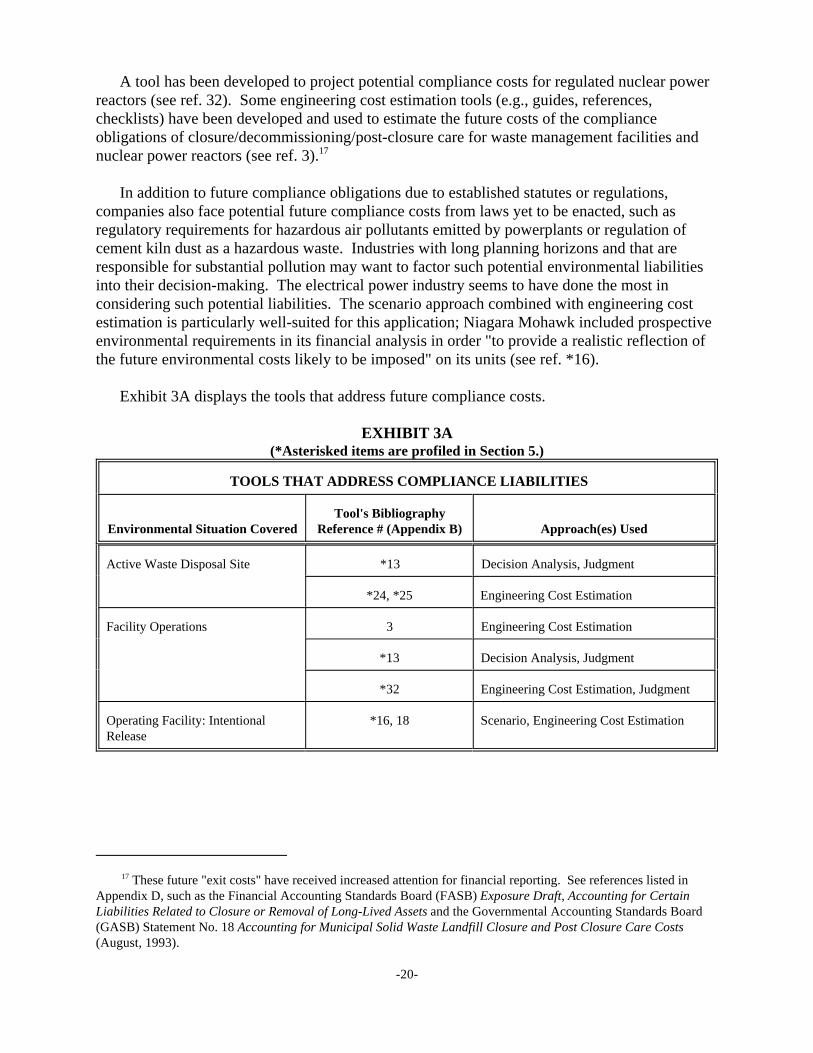
A tool has been developed to project potential compliance costs for regulated nuclear powerreactors (see ref. 32). Some engineering cost estimation tools (e.g., guides, references,checklists) have been developed and used to estimate the future costs of the complianceobligations of closure/decommissioning/post-closure care for waste management facilities andnuclear power reactors (see ref. 3).17
In addition to future compliance obligations due to established statutes or regulations,companies also face potential future compliance costs from laws yet to be enacted, such asregulatory requirements for hazardous air pollutants emitted by powerplants or regulation ofcement kiln dust as a hazardous waste. Industries with long planning horizons and that areresponsible for substantial pollution may want to factor such potential environmental liabilitiesinto their decision-making. The electrical power industry seems to have done the most inconsidering such potential liabilities. The scenario approach combined with engineering costestimation is particularly well-suited for this application; Niagara Mohawk included prospectiveenvironmental requirements in its financial analysis in order "to provide a realistic reflection ofthe future environmental costs likely to be imposed" on its units (see ref. *16).
Exhibit 3A displays the tools that address future compliance costs.
EXHIBIT 3A(*Asterisked items are profiled in Section 5.)
TOOLS THAT ADDRESS COMPLIANCE LIABILITIES
Environmental Situation Covered Reference # (Appendix B) Approach(es) UsedTool's Bibliography
Active Waste Disposal Site *13 Decision Analysis, Judgment
*24, *25 Engineering Cost Estimation
Facility Operations 3 Engineering Cost Estimation
*13 Decision Analysis, Judgment
*32 Engineering Cost Estimation, Judgment
Operating Facility: Intentional *16, 18 Scenario, Engineering Cost EstimationRelease
Risk managers, insurers, and reinsurers often refer to these unknown liabilities as Incurred But Not Reported 18
(IBNR) Losses.
-21-
Remediation Costs
As discussed in Appendix A of this report, remediation liabilities may arise as future costsresulting from (1) past activities that have since ceased, (2) continuing activities, and (3) futureactivities that have not yet started. Due to both timing and contingency issues (also discussed inAppendix A), organizations may not yet know the full extent of remediation liabilities that willresult from past activities that have ceased (e.g., unidentified releases or spills) and even pastactivities that are still ongoing. Although managers may be able to mitigate these liabilities,18
they cannot prevent them. On the other hand, changes to ongoing activities and plans for thefuture can affect the remediation liabilities that companies will incur by reducing the numberand size of required remediations.
Inactive Waste Sites. Much attention in developing tools for valuing environmentalliabilities has focused on the remediation liabilities of existing, inactive waste sites (e.g.,Superfund liability), as opposed to currently active or future waste sites. This attention toremediation liabilities relates both to financial reporting issues (e.g., disclosure, recognition,measurement) (see Appendix D) and to management needs to understand the costs of alternativeremediation strategies for existing, inactive waste sites. This is an area characterized both by (1)a growing body of public data on the costs of remediation as well as (2) uncertainties about thecost and success of alternative remediation strategies. Use of decision analysis techniques andmodels (see refs. 5, *13, *14, 15, 37) has been illustrated as a means of addressing theseliabilities.
Because companies may not be aware of all of their remediation liabilities for existing,inactive waste disposal sites (e.g., due to lack of records, prior sale of properties/businesses),some approaches drawing upon actuarial and scenario techniques have been developed toestimate those potential liabilities. Here the goal is to estimate the costs of remediating inactivesites that an organization has not identified but for which it may be responsible. Both "top-down" and "bottom-up" approaches (as described on page 19) have been addressed in theliterature (see refs. 4, *21).
Active Waste Sites and Future Remediation. Because there is much less historical data onthe costs of remediating active and future waste management facilities, non-actuarial approaches,such as use of scenarios, engineering judgment and cost estimation, and modeling have beenemployed. In response to past Congressional interest in the future liabilities of active waste sitesregulated under RCRA, EPA conducted a major study of the magnitude, timing, and likelihoodof future remediation costs (see ref. *29) and has performed related studies since. Some of thiswork has been converted into more user-friendly tools requiring a limited number of inputparameters to develop ballpark cost estimates (see refs. 1, *10, 11, *13, 19, *22, *24, *25, 28).
Valuation of remediation liabilities resulting from accidental releases during transport hasbuilt on actuarial data concerning accident frequencies, consequence modeling, and engineeringcost estimation for developing corresponding monetary values (see, especially, ref. *20; see also
-22-
refs. *8, *25, *28). Valuation of remediation liabilities due to future spills at fixed facilities washandled in a similar fashion (see ref. *28).
Much work has been reported in estimating the costs, timing, and likelihood of remediationliabilities for existing and future leaks from underground (and, to some extent, aboveground)storage tanks (USTs) of petroleum (see refs. *6, *7, *12, *13, *30, 31, 35). Valuation tools forremediation liabilities for petroleum USTs have had the advantage of extensive remediationclaims history data made available by insurance entities; although the documented applicationshave been prepared for state-level UST funds or agencies, the techniques are also applicable tocompanies responsible for large numbers of USTs.
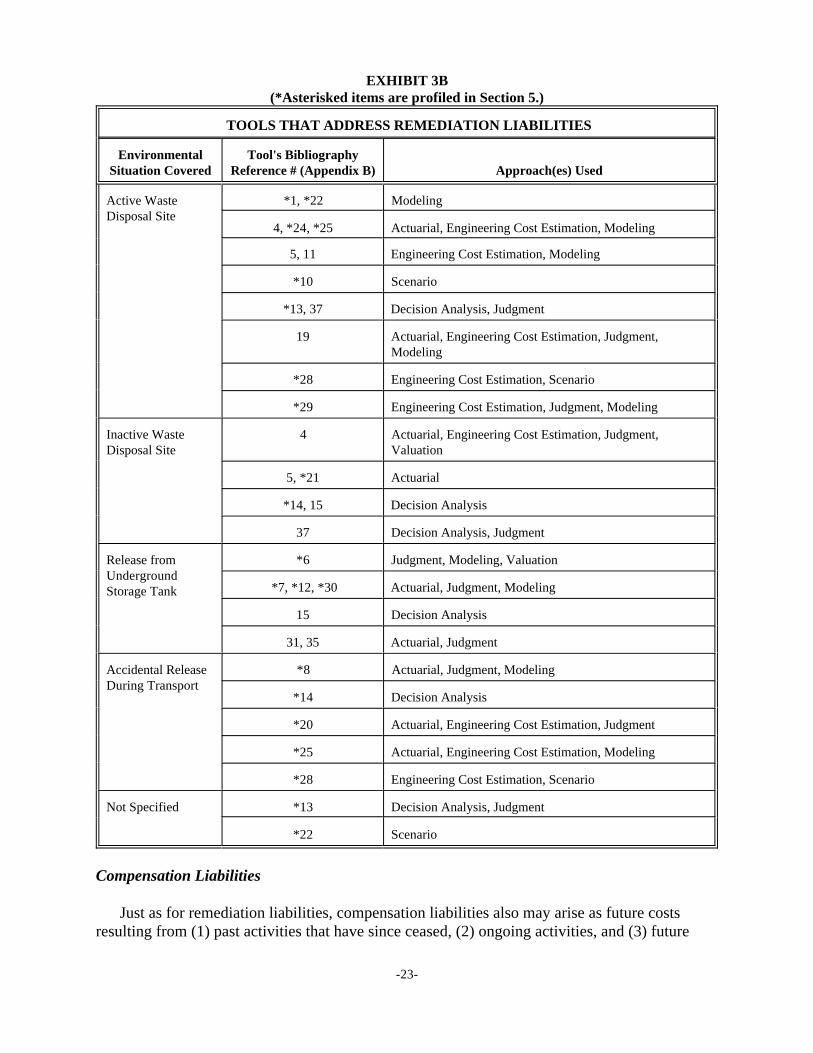
Exhibit 3B lists the tools that address remediation liabilities.
-23-
EXHIBIT 3B(*Asterisked items are profiled in Section 5.)
TOOLS THAT ADDRESS REMEDIATION LIABILITIES
Environmental Tool's BibliographySituation Covered Reference # (Appendix B) Approach(es) Used
Active Waste *1, *22 ModelingDisposal Site
4, *24, *25 Actuarial, Engineering Cost Estimation, Modeling
5, 11 Engineering Cost Estimation, Modeling
*10 Scenario
*13, 37 Decision Analysis, Judgment
19 Actuarial, Engineering Cost Estimation, Judgment,Modeling
*28 Engineering Cost Estimation, Scenario
*29 Engineering Cost Estimation, Judgment, Modeling
Inactive Waste 4 Actuarial, Engineering Cost Estimation, Judgment,Disposal Site Valuation
5, *21 Actuarial
*14, 15 Decision Analysis
37 Decision Analysis, Judgment
Release from *6 Judgment, Modeling, ValuationUndergroundStorage Tank *7, *12, *30 Actuarial, Judgment, Modeling
15 Decision Analysis
31, 35 Actuarial, Judgment
Accidental Release *8 Actuarial, Judgment, ModelingDuring Transport
*14 Decision Analysis
*20 Actuarial, Engineering Cost Estimation, Judgment
*25 Actuarial, Engineering Cost Estimation, Modeling
*28 Engineering Cost Estimation, Scenario
Not Specified *13 Decision Analysis, Judgment
*22 Scenario
Compensation Liabilities
Just as for remediation liabilities, compensation liabilities also may arise as future costsresulting from (1) past activities that have since ceased, (2) ongoing activities, and (3) future
In the 1980s, the EPA collected data on reported environmental compensation awards and settlements to assess 19
the adequacy of liability coverage limits established for regulated waste management facilities and undergroundstorage tanks of petroleum.
-24-
activities that have not yet started. Due to timing and contingency issues discussed in AppendixA, organizations may not yet know the full extent of compensation liabilities that will resultfrom the exposure of property and persons to pollutants from past activities that have ceased andactivities that are still ongoing. There may be little that managers can do about these liabilities. On the other hand, changes to ongoing activities and plans for the future can affect thecompensation liabilities that companies will incur. Valuing the likely costs and benefits of suchchanges is challenging, and only a limited amount of work to do so has been reported.
For compensation liabilities, an actuarial approach has proved feasible primarily for USTs --to assess the magnitude, timing, and likelihood of compensation liabilities due to existingcontamination as well as to releases yet to happen (see refs. *6, *7, *12, and *30). PetroleumUSTs comprise a large population of relatively homogeneous facilities for which several yearsof compensation claims data had been pooled and made available by two insurance entities thatprovided the bulk of coverage for the industry. Moreover, most of the compensation liabilitiesfrom petroleum USTs have related to property damage, not personal injury; there is likely to beless uncertainty in measuring property damage liabilities than in valuing personal injuryliabilities. Actuarial approaches have been used as a basis for other environmental compensationliabilities, although the available data (e.g., court awards and settlements) are sparse (see ref.*28); in other instances, the available data have been used as a "reality check" of insurancerequirements, modeling, and valuation approaches (see refs. *17, *25). Because of limited19
reported data on environmental compensation liabilities, surrogate data has been used drawnfrom other toxic tort litigation (e.g., asbestos) or more general sources (e.g., personal injuryawards and settlements).
Other approaches have been applied to the compensation liabilities that arise from accidentalreleases from the transport of hazardous materials (specifically, low-level radioactive materials)and land disposal of hazardous waste. Environmental liabilities associated with hazardousmaterial transportation and waste disposal can be readily factored into management decisionsabout routing or waste management practices, respectively, particularly when expressed inmonetary terms (see refs. *10, 19, *20, *24, *25, *28, *29). Compensation liabilities due totransport of hazardous materials have been valued using actuarial data for transportationaccidents, modeling consequence (e.g., exposure) scenarios, and applying "legal approaches" tovaluation. (See ref. *20.) For the Report to Congress on the potential dollar liabilities of activeRCRA land disposal facilities noted on page 20 above (see ref. *29), EPA's study modeledevents and applicable legal regimes to assess the occurrence and timing of compensation claims,which were valued using legal valuation approaches.
Valuation techniques for compensation liabilities due to continuing, accidental, orcatastrophic releases to air and water from operating facilities, have not been reported inliterature. Work to develop "unit liability factors" for industrial facilities releasing pollutants tothe air, land, and water was commissioned by the American Institute of Chemical Engineers
The AIChE Center for Chemical Process Safety has published Guidelines for Hazard Evaluation Procedures 20
(1992), which describes methodologies to identify hazards and qualitatively assess the associated risk; Guidelines forChemical Process Quantitative Risk Analysis (1989), which describes techniques for quantifying risk in a chemicalstorage or processing facility and introduces a risk management framework; and Tools for Making Acute RiskDecisions (1995), which expands upon the previous books but does not address valuation of environmental liabilities.
-25-
(AIChE) but not published. A scenario-based scaling approach has been used to develop order20
of magnitude estimates of compensation liability for an entire corporation (see ref. *21). Compensation for injuries to property or employees has been valued using diverse techniques(see refs. *2, *8, *17, 33, and *36).
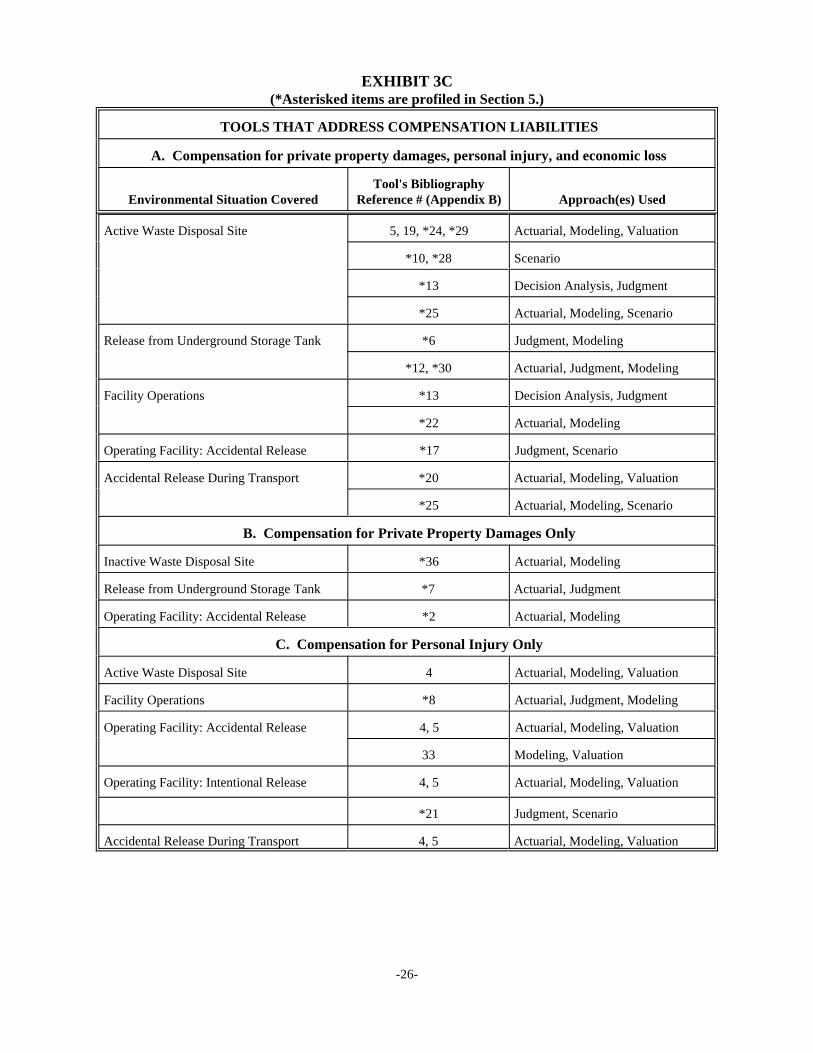
Exhibit 3C lists the tools that address compensation liabilities.
-26-
EXHIBIT 3C(*Asterisked items are profiled in Section 5.)
TOOLS THAT ADDRESS COMPENSATION LIABILITIES
A. Compensation for private property damages, personal injury, and economic loss
Environmental Situation Covered Reference # (Appendix B) Approach(es) UsedTool's Bibliography
Active Waste Disposal Site 5, 19, *24, *29 Actuarial, Modeling, Valuation
*10, *28 Scenario
*13 Decision Analysis, Judgment
*25 Actuarial, Modeling, Scenario
Release from Underground Storage Tank *6 Judgment, Modeling
*12, *30 Actuarial, Judgment, Modeling
Facility Operations *13 Decision Analysis, Judgment
*22 Actuarial, Modeling
Operating Facility: Accidental Release *17 Judgment, Scenario
Accidental Release During Transport *20 Actuarial, Modeling, Valuation
*25 Actuarial, Modeling, Scenario
B. Compensation for Private Property Damages Only
Inactive Waste Disposal Site *36 Actuarial, Modeling
Release from Underground Storage Tank *7 Actuarial, Judgment
Operating Facility: Accidental Release *2 Actuarial, Modeling
C. Compensation for Personal Injury Only
Active Waste Disposal Site 4 Actuarial, Modeling, Valuation
Facility Operations *8 Actuarial, Judgment, Modeling
Operating Facility: Accidental Release 4, 5 Actuarial, Modeling, Valuation
33 Modeling, Valuation
Operating Facility: Intentional Release 4, 5 Actuarial, Modeling, Valuation
*21 Judgment, Scenario
Accidental Release During Transport 4, 5 Actuarial, Modeling, Valuation
For example, see Cohen, Mark A., Scott A. Fenn, and Jonathan S. Naimon. Environmental and Financial21
Performance: Are They Related?, Investor Responsibility Research Center (IRRC), Washington, D.C., 1995.
-27-
Fines and Penalties
In published literature, this category of environmental liability is frequently mentioned asimportant, and EPA and others have published extensive data on assessed fines and penalties. 21
Although fines and penalties are amenable to actuarial treatment, there is little in the literature,with few exceptions, on how to use or apply this information in making forward-lookingdecisions (see refs. 5, *22, and *28). EPA has developed a framework for identifying andconverting to net present values the financial savings from non-compliance (see ref. *27), whichcan be used as a baseline measure of potential fines and penalties.
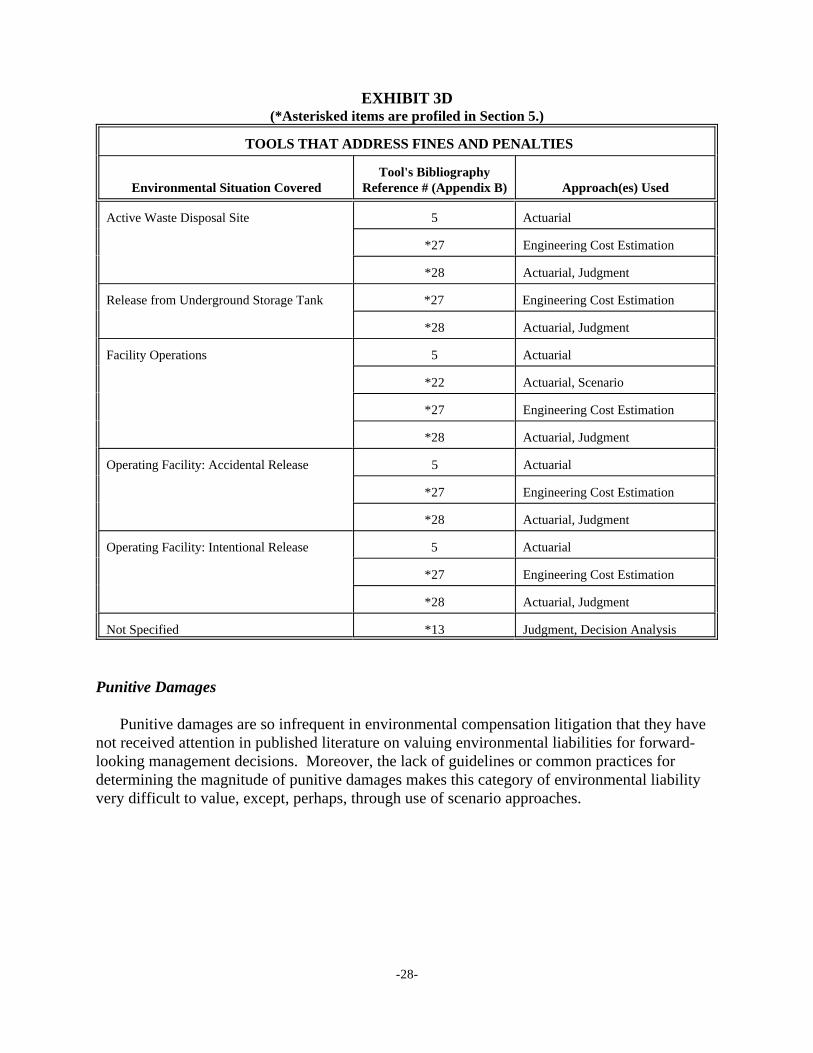
Exhibit 3D shows the tools that address potential fines and penalties.
-28-
EXHIBIT 3D
(*Asterisked items are profiled in Section 5.)
TOOLS THAT ADDRESS FINES AND PENALTIES
Environmental Situation Covered Reference # (Appendix B) Approach(es) UsedTool's Bibliography
Active Waste Disposal Site 5 Actuarial
*27 Engineering Cost Estimation
*28 Actuarial, Judgment
Release from Underground Storage Tank *27 Engineering Cost Estimation
*28 Actuarial, Judgment
Facility Operations 5 Actuarial
*22 Actuarial, Scenario
*27 Engineering Cost Estimation
*28 Actuarial, Judgment
Operating Facility: Accidental Release 5 Actuarial
*27 Engineering Cost Estimation
*28 Actuarial, Judgment
Operating Facility: Intentional Release 5 Actuarial
*27 Engineering Cost Estimation
*28 Actuarial, Judgment
Not Specified *13 Judgment, Decision Analysis
Punitive Damages
Punitive damages are so infrequent in environmental compensation litigation that they havenot received attention in published literature on valuing environmental liabilities for forward-looking management decisions. Moreover, the lack of guidelines or common practices fordetermining the magnitude of punitive damages makes this category of environmental liabilityvery difficult to value, except, perhaps, through use of scenario approaches.
-29-
Natural Resource Damages
Typically, natural resource damages are quantified in terms of lost services, due to the injuryor death of fish and/or wildlife or closure of recreational areas, and the cost of restorationactions. This is the approach historically or currently recommended by the key agencies of theFederal government responsible for issuing guidance on the calculation of damages to naturalresources (see refs. *23, *26). Some states have also developed schedules or models for valuingnatural resource damages due to discharges into water (see refs. 9, 34).
Natural resource damage assessment regulations promulgated by the Department of theInterior (DOI) under CERCLA and by the National Oceanic and Atmospheric Administration(NOAA) under the Oil Pollution Act establish procedures to measure injury to natural resources. DOI has developed two types of procedures to correspond to the requirements under CERCLA,the Type A and Type B procedures. The Type A procedures consist of two computerizedmodels, one for coastal and marine environments and one for Great Lakes environments, forcalculating damages from minor releases of hazardous substances. The Type B proceduresconsist of site-specific procedures for conducting detailed damage assessments in other cases(see ref. *26).
The Type A models, the Natural Resource Damage Assessment Model for Coastal andMarine Environments (NRDAM/CME) and the Natural Resource Damage Assessment Modelfor the Great Lakes Environments (NRDAM/GLE) capture a limited range of injuries and values(e.g., restoration costs and lost use values). The Type B procedures may be used to estimate thelost economic value from damages not covered by the Type A models. (See also Appendix C.)
NOAA has developed regulations that apply to oil discharges into water habitats (seeref. *23). The regulations allow for the recovery of damages to natural resources for therestoration, rehabilitation, or replacement of the resource, or the acquisition of equivalentresources and services (generally referred to as restoration). The NOAA approach emphasizesrestoration of injured resources, not valuation (e.g., compensation formulas for small incidentshave been dropped).
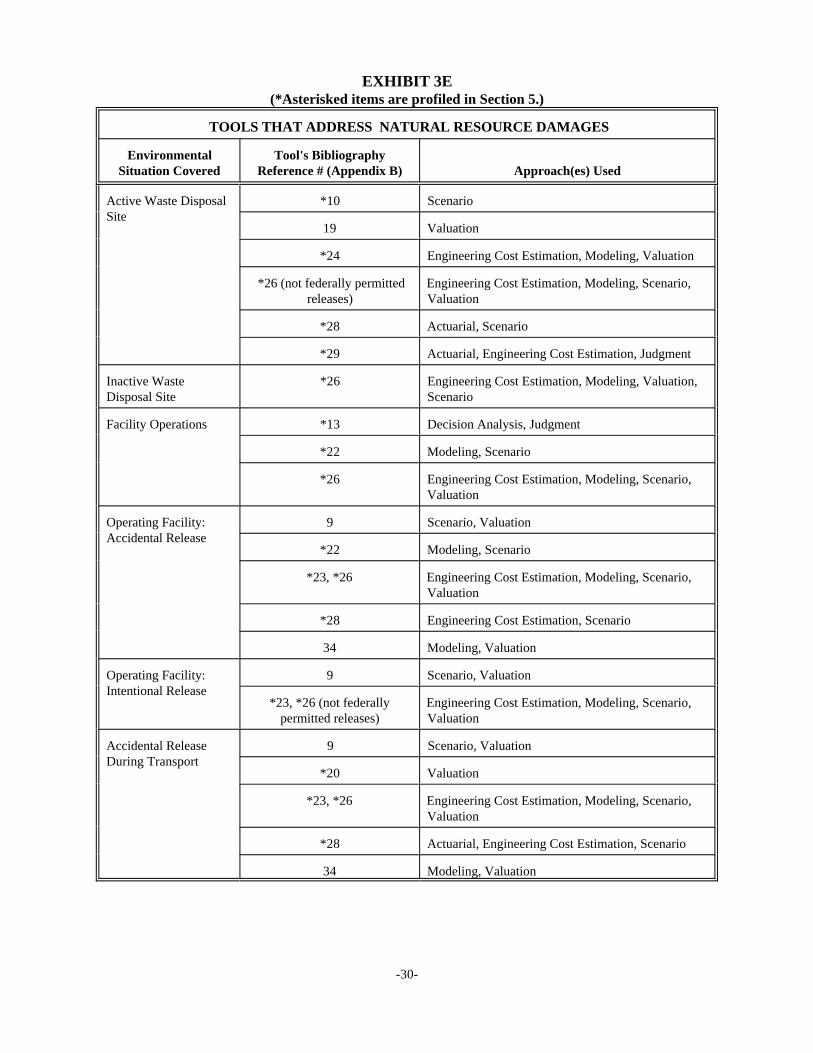
Exhibit 3E presents the tools that address natural resource damages.
-30-
EXHIBIT 3E(*Asterisked items are profiled in Section 5.)
TOOLS THAT ADDRESS NATURAL RESOURCE DAMAGES
Environmental Tool's BibliographySituation Covered Reference # (Appendix B) Approach(es) Used
Active Waste Disposal *10 ScenarioSite
19 Valuation
*24 Engineering Cost Estimation, Modeling, Valuation
*26 (not federally permitted Engineering Cost Estimation, Modeling, Scenario,releases) Valuation
*28 Actuarial, Scenario
*29 Actuarial, Engineering Cost Estimation, Judgment
Inactive Waste *26 Engineering Cost Estimation, Modeling, Valuation,Disposal Site Scenario
Facility Operations *13 Decision Analysis, Judgment
*22 Modeling, Scenario
*26 Engineering Cost Estimation, Modeling, Scenario,Valuation
Operating Facility: 9 Scenario, ValuationAccidental Release
*22 Modeling, Scenario
*23, *26 Engineering Cost Estimation, Modeling, Scenario,Valuation
*28 Engineering Cost Estimation, Scenario
34 Modeling, Valuation
Operating Facility: 9 Scenario, ValuationIntentional Release
*23, *26 (not federally Engineering Cost Estimation, Modeling, Scenario,permitted releases) Valuation
Accidental Release 9 Scenario, ValuationDuring Transport
*20 Valuation
*23, *26 Engineering Cost Estimation, Modeling, Scenario,Valuation
*28 Actuarial, Engineering Cost Estimation, Scenario
34 Modeling, Valuation
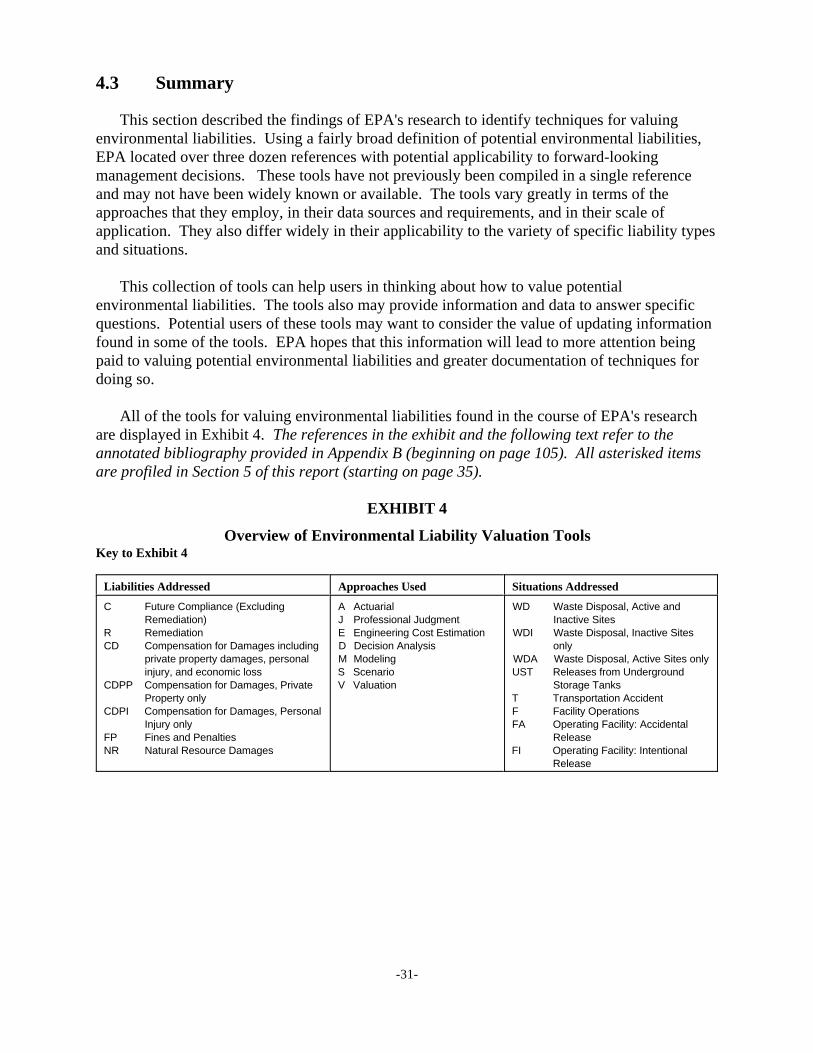
-31-
4.3 Summary
This section described the findings of EPA's research to identify techniques for valuingenvironmental liabilities. Using a fairly broad definition of potential environmental liabilities,EPA located over three dozen references with potential applicability to forward-lookingmanagement decisions. These tools have not previously been compiled in a single referenceand may not have been widely known or available. The tools vary greatly in terms of theapproaches that they employ, in their data sources and requirements, and in their scale ofapplication. They also differ widely in their applicability to the variety of specific liability typesand situations.
This collection of tools can help users in thinking about how to value potentialenvironmental liabilities. The tools also may provide information and data to answer specificquestions. Potential users of these tools may want to consider the value of updating informationfound in some of the tools. EPA hopes that this information will lead to more attention beingpaid to valuing potential environmental liabilities and greater documentation of techniques fordoing so.
All of the tools for valuing environmental liabilities found in the course of EPA's researchare displayed in Exhibit 4. The references in the exhibit and the following text refer to theannotated bibliography provided in Appendix B (beginning on page 105). All asterisked itemsare profiled in Section 5 of this report (starting on page 35).
EXHIBIT 4
Overview of Environmental Liability Valuation ToolsKey to Exhibit 4
Liabilities Addressed Approaches Used Situations Addressed
C Future Compliance (Excluding A Actuarial WD Waste Disposal, Active andRemediation) J Professional Judgment Inactive Sites
R Remediation E Engineering Cost Estimation WDI Waste Disposal, Inactive SitesCD Compensation for Damages including D Decision Analysis only
private property damages, personal M Modeling WDA Waste Disposal, Active Sites onlyinjury, and economic loss S Scenario UST Releases from Underground
CDPP Compensation for Damages, Private V Valuation Storage TanksProperty only T Transportation Accident
CDPI Compensation for Damages, Personal F Facility OperationsInjury only FA Operating Facility: Accidental
FP Fines and Penalties ReleaseNR Natural Resource Damages FI Operating Facility: Intentional
Release
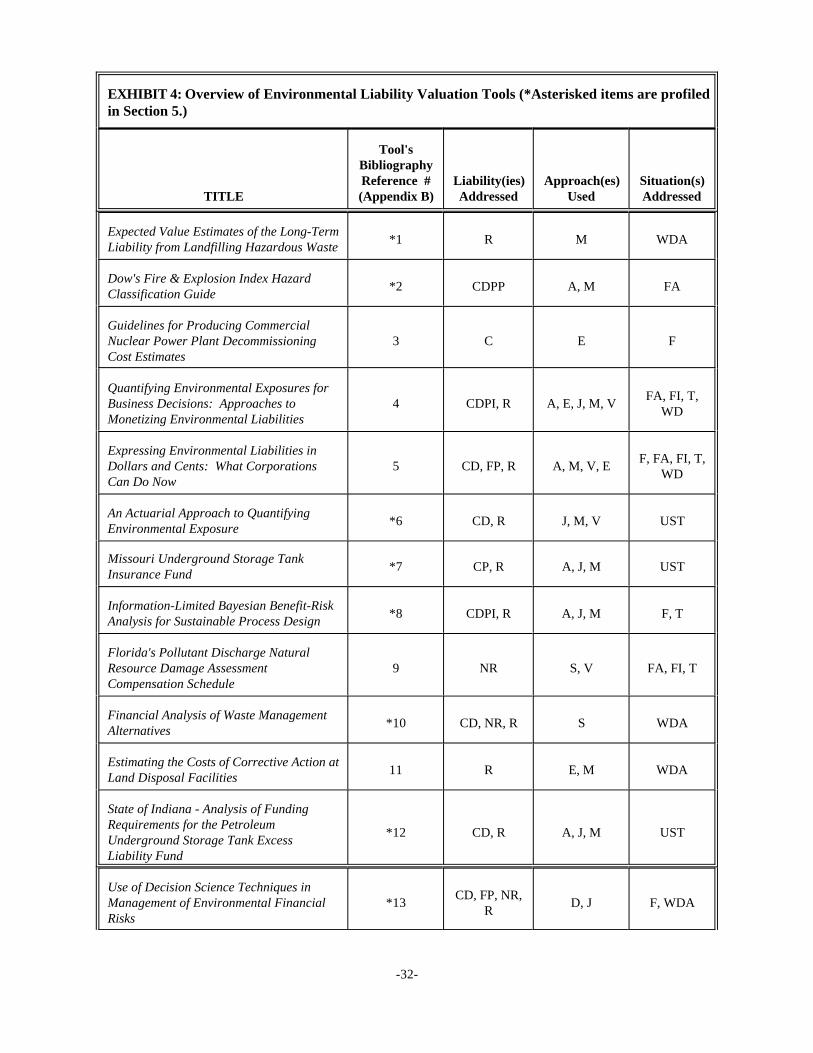
-32-
EXHIBIT 4: Overview of Environmental Liability Valuation Tools (*Asterisked items are profiledin Section 5.)
TITLE (Appendix B) Addressed Used Addressed
Tool'sBibliographyReference # Liability(ies) Approach(es) Situation(s)
Expected Value Estimates of the Long-TermLiability from Landfilling Hazardous Waste
*1 R M WDA
Dow's Fire & Explosion Index HazardClassification Guide
*2 CDPP A, M FA
Guidelines for Producing CommercialNuclear Power Plant Decommissioning 3 C E FCost Estimates
Quantifying Environmental Exposures forBusiness Decisions: Approaches to 4 CDPI, R A, E, J, M, VMonetizing Environmental Liabilities
FA, FI, T,WD
Expressing Environmental Liabilities inDollars and Cents: What Corporations 5 CD, FP, R A, M, V, ECan Do Now
F, FA, FI, T,WD
An Actuarial Approach to QuantifyingEnvironmental Exposure
*6 CD, R J, M, V UST
Missouri Underground Storage TankInsurance Fund
*7 CP, R A, J, M UST
Information-Limited Bayesian Benefit-RiskAnalysis for Sustainable Process Design
*8 CDPI, R A, J, M F, T
Florida's Pollutant Discharge NaturalResource Damage Assessment 9 NR S, V FA, FI, TCompensation Schedule
Financial Analysis of Waste ManagementAlternatives
*10 CD, NR, R S WDA
Estimating the Costs of Corrective Action atLand Disposal Facilities
11 R E, M WDA
State of Indiana - Analysis of FundingRequirements for the PetroleumUnderground Storage Tank ExcessLiability Fund
*12 CD, R A, J, M UST
Use of Decision Science Techniques inManagement of Environmental Financial *13 D, J F, WDARisks
CD, FP, NR,R
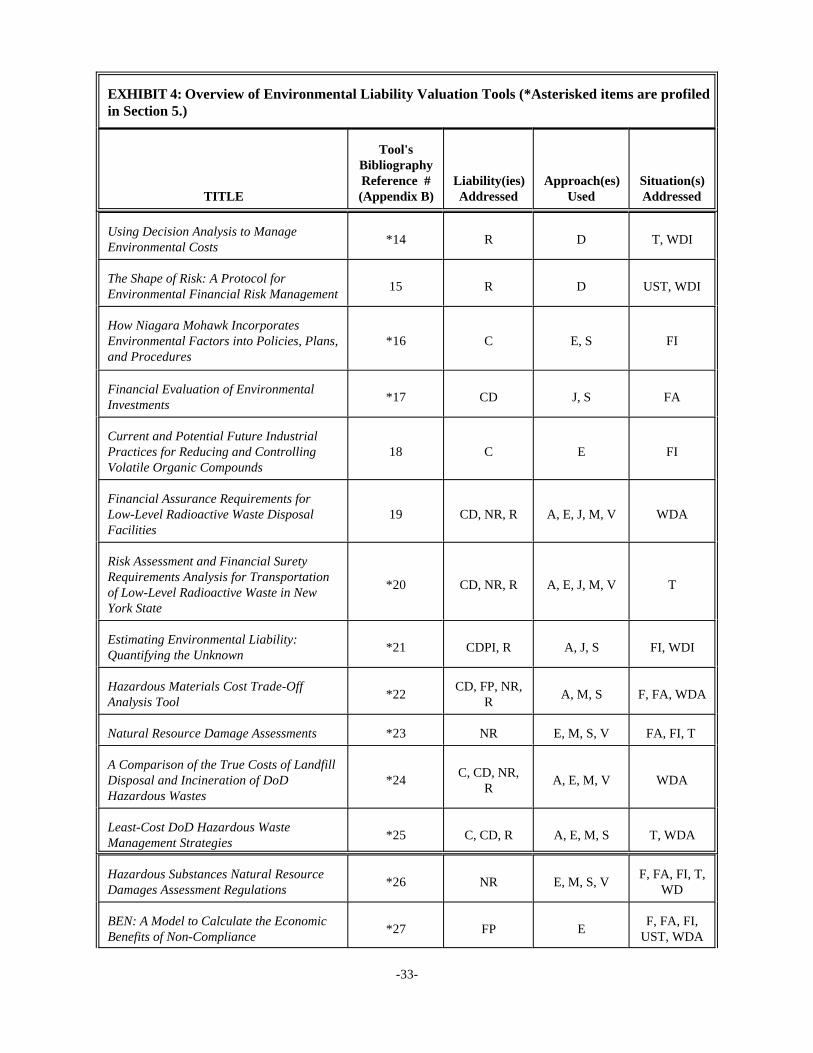
EXHIBIT 4: Overview of Environmental Liability Valuation Tools (*Asterisked items are profiledin Section 5.)
TITLE (Appendix B) Addressed Used Addressed
Tool'sBibliographyReference # Liability(ies) Approach(es) Situation(s)
-33-
Using Decision Analysis to ManageEnvironmental Costs
*14 R D T, WDI
The Shape of Risk: A Protocol forEnvironmental Financial Risk Management
15 R D UST, WDI
How Niagara Mohawk IncorporatesEnvironmental Factors into Policies, Plans, *16 C E, S FIand Procedures
Financial Evaluation of EnvironmentalInvestments
*17 CD J, S FA
Current and Potential Future IndustrialPractices for Reducing and Controlling 18 C E FIVolatile Organic Compounds
Financial Assurance Requirements forLow-Level Radioactive Waste Disposal 19 CD, NR, R A, E, J, M, V WDAFacilities
Risk Assessment and Financial SuretyRequirements Analysis for Transportationof Low-Level Radioactive Waste in NewYork State
*20 CD, NR, R A, E, J, M, V T
Estimating Environmental Liability: Quantifying the Unknown
*21 CDPI, R A, J, S FI, WDI
Hazardous Materials Cost Trade-Off CD, FP, NR,Analysis Tool R
*22 A, M, S F, FA, WDA
Natural Resource Damage Assessments *23 NR E, M, S, V FA, FI, T
A Comparison of the True Costs of LandfillDisposal and Incineration of DoD *24 A, E, M, V WDAHazardous Wastes
C, CD, NR,R
Least-Cost DoD Hazardous WasteManagement Strategies
*25 C, CD, R A, E, M, S T, WDA
Hazardous Substances Natural Resource F, FA, FI, T,Damages Assessment Regulations WD
*26 NR E, M, S, V
BEN: A Model to Calculate the Economic F, FA, FI,Benefits of Non-Compliance UST, WDA
*27 FP E
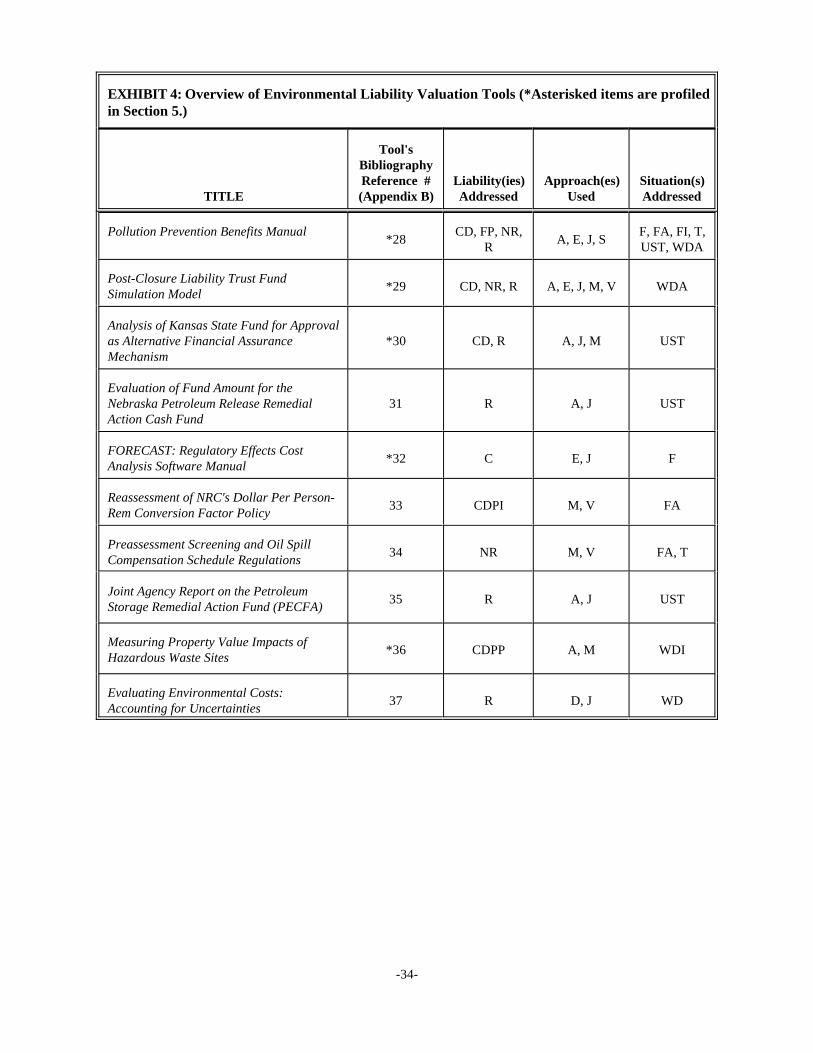
EXHIBIT 4: Overview of Environmental Liability Valuation Tools (*Asterisked items are profiledin Section 5.)
TITLE (Appendix B) Addressed Used Addressed
Tool'sBibliographyReference # Liability(ies) Approach(es) Situation(s)
-34-
Pollution Prevention Benefits Manual CD, FP, NR, F, FA, FI, T,*28 A, E, J, S
R UST, WDA
Post-Closure Liability Trust FundSimulation Model
*29 CD, NR, R A, E, J, M, V WDA
Analysis of Kansas State Fund for Approvalas Alternative Financial Assurance *30 CD, R A, J, M USTMechanism
Evaluation of Fund Amount for theNebraska Petroleum Release Remedial 31 R A, J USTAction Cash Fund
FORECAST: Regulatory Effects CostAnalysis Software Manual
*32 C E, J F
Reassessment of NRC's Dollar Per Person-Rem Conversion Factor Policy
33 CDPI M, V FA
Preassessment Screening and Oil SpillCompensation Schedule Regulations
34 NR M, V FA, T
Joint Agency Report on the PetroleumStorage Remedial Action Fund (PECFA)
35 R A, J UST
Measuring Property Value Impacts ofHazardous Waste Sites
*36 CDPP A, M WDI
Evaluating Environmental Costs: Accounting for Uncertainties
37 R D, J WD
-35-
5. Profiles of Selected Tools
The following pages contain profiles of most of the liability valuation tools found in thecourse of preparing this report. In deciding which tools to profile, EPA attempted to select toolsthat covered a wide array of liabilities, situations, and approaches. The profiles are based on adirect review of the cited references, and summarize how the tools derive monetary values forenvironmental liabilities. The profiles were intended to be descriptive, rather than to evaluaterigorously the strengths or weaknesses of a tool or to assess how a tool might be used in differentsituations. The information in a profile may not always be sufficient to allow readers to applythe tool; for example, the profiles do not contain all the data used in a particular tool. For thisreason, the profiles include availability information to assist readers in obtaining the tools.
The following tools are profiled:
Tool'sBibliography ProfileReference # Title of Tool Page #
1 Expected Value Estimates of Long-Term Liability from Landfilling 37Hazardous Waste
2 Dow's Fire & Explosion Index Hazard Classification Guide 39
6 An Actuarial Approach to Quantifying Environmental Exposure 42
7 Missouri Underground Storage Tank Insurance Fund 45
8 Information-Limited Bayesian Benefit-Risk Analysis for Sustainable Process 47Design
10 Financial Analysis of Waste Management Alternatives 48
12 State of Indiana - Analysis of Funding Requirements for the Petroleum 51Underground Storage Tank Excess Liability Fund
13 Use of Decision Science Techniques in Management of Environmental 54Financial Risks
14 Using Decision Analysis to Manage Environmental Costs 57
16 How Niagara Mohawk Incorporates Environmental Factors into Policies, 59Plans, and Procedures
17 Financial Evaluation of Environmental Investments 61
20 Risk Assessment and Financial Surety Requirements Analysis for 62Transportation of Low-Level Radioactive Waste in New York State
21 Estimating Environmental Liability: Quantifying the Unknown 66
22 Hazardous Materials Cost Trade-Off Analysis Tool (HMCTAT) 69
23 Natural Resource Damage Assessments 72
Tool'sBibliography ProfileReference # Title of Tool Page #
-36-
24 A Comparison of the True Costs of Landfill Disposal and Incineration of 75DoD Hazardous Wastes
25 Least-Cost DoD Hazardous Waste Management Strategies 78
26 Hazardous Substances Natural Resource Damages Assessment Regulations 82
27 BEN: A Model to Calculate the Economic Benefits of Non-Compliance 85
28 Pollution Prevention Benefits Manual 87
29 Post-Closure Liability Trust Fund Simulation Model 91
30 Analysis of Kansas State Fund for Approval as Alternative Financial 94Assurance Mechanism
32 FORECAST: Regulatory Effects Cost Analysis Software Manual 96
36 Measuring Property Value Impacts of Hazardous Waste Sites 98
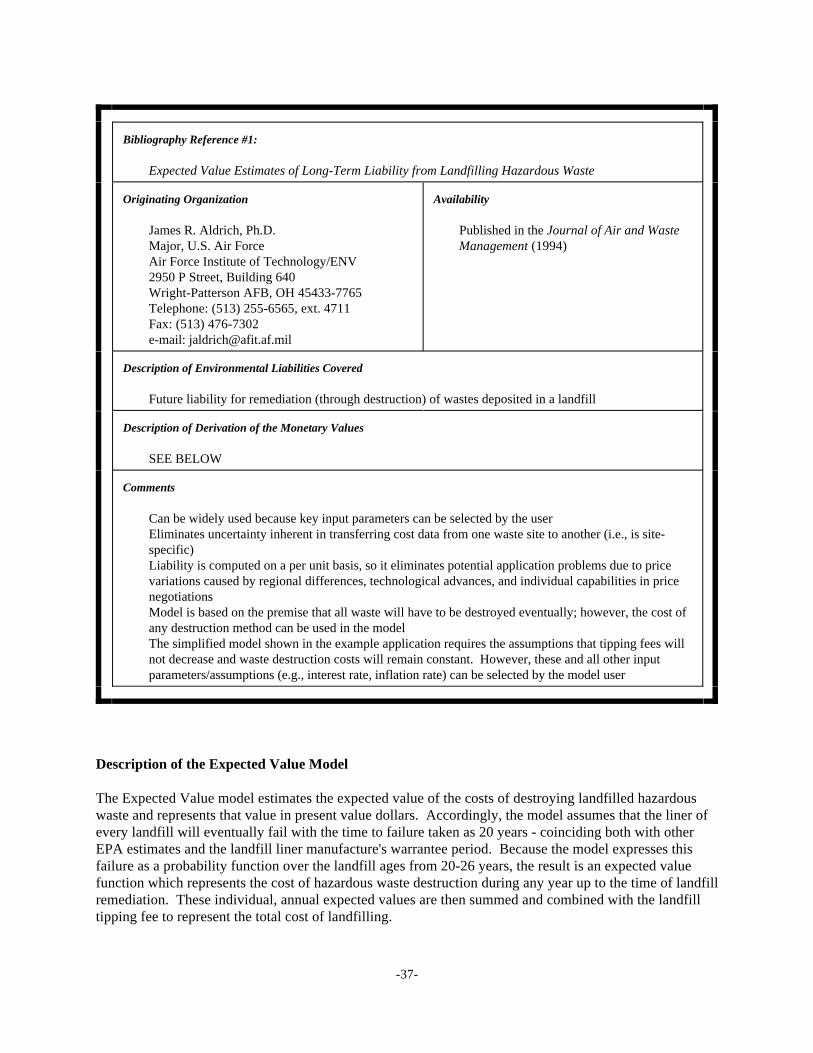
-37-
Bibliography Reference #1:
Expected Value Estimates of Long-Term Liability from Landfilling Hazardous Waste
Originating Organization Availability
James R. Aldrich, Ph.D. Published in the Journal of Air and WasteMajor, U.S. Air Force Management (1994)Air Force Institute of Technology/ENV2950 P Street, Building 640 Wright-Patterson AFB, OH 45433-7765Telephone: (513) 255-6565, ext. 4711Fax: (513) 476-7302e-mail: [email protected]
Description of Environmental Liabilities Covered
Future liability for remediation (through destruction) of wastes deposited in a landfill
Description of Derivation of the Monetary Values
SEE BELOW
Comments
Can be widely used because key input parameters can be selected by the userEliminates uncertainty inherent in transferring cost data from one waste site to another (i.e., is site-specific)Liability is computed on a per unit basis, so it eliminates potential application problems due to pricevariations caused by regional differences, technological advances, and individual capabilities in pricenegotiationsModel is based on the premise that all waste will have to be destroyed eventually; however, the cost ofany destruction method can be used in the modelThe simplified model shown in the example application requires the assumptions that tipping fees willnot decrease and waste destruction costs will remain constant. However, these and all other inputparameters/assumptions (e.g., interest rate, inflation rate) can be selected by the model user
Description of the Expected Value Model
The Expected Value model estimates the expected value of the costs of destroying landfilled hazardouswaste and represents that value in present value dollars. Accordingly, the model assumes that the liner ofevery landfill will eventually fail with the time to failure taken as 20 years - coinciding both with otherEPA estimates and the landfill liner manufacture's warrantee period. Because the model expresses thisfailure as a probability function over the landfill ages from 20-26 years, the result is an expected valuefunction which represents the cost of hazardous waste destruction during any year up to the time of landfillremediation. These individual, annual expected values are then summed and combined with the landfilltipping fee to represent the total cost of landfilling.
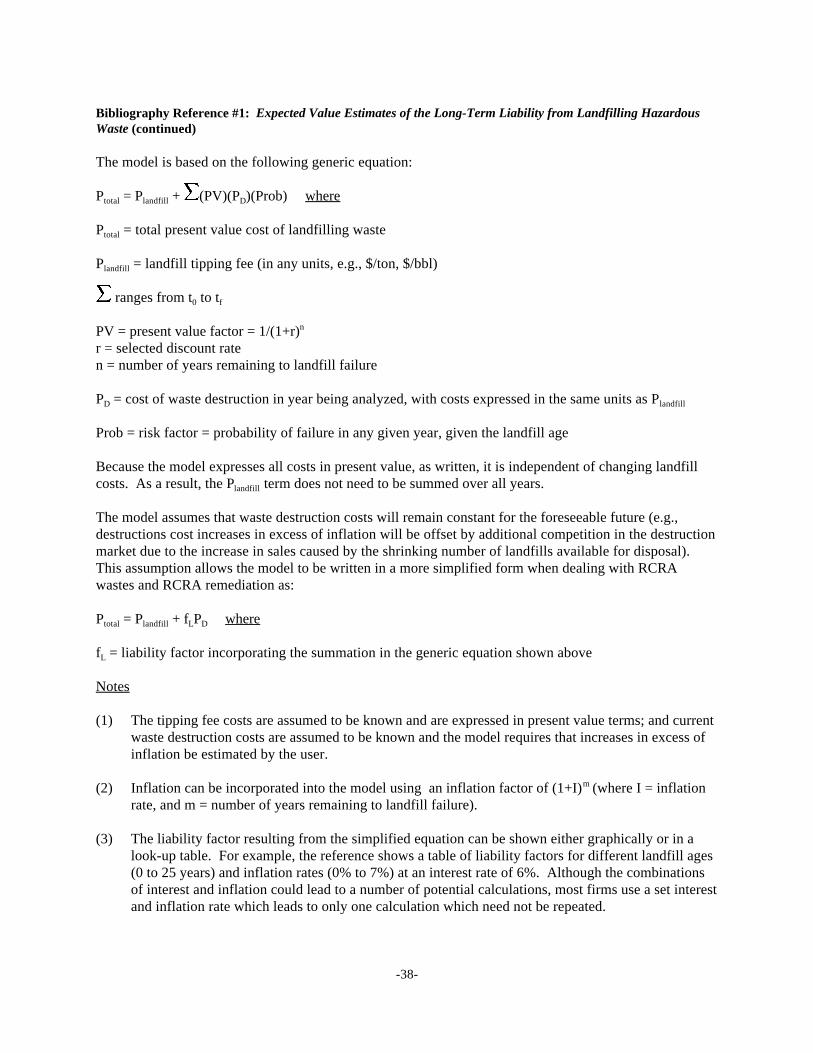
-38-
Bibliography Reference #1: Expected Value Estimates of the Long-Term Liability from Landfilling HazardousWaste (continued)
The model is based on the following generic equation:
P = P + M(PV)(P )(Prob) wheretotal landfill D
P = total present value cost of landfilling wastetotal
P = landfill tipping fee (in any units, e.g., $/ton, $/bbl)landfill
M ranges from t to t0 f
PV = present value factor = 1/(1+r)n
r = selected discount raten = number of years remaining to landfill failure
P = cost of waste destruction in year being analyzed, with costs expressed in the same units as PD landfill
Prob = risk factor = probability of failure in any given year, given the landfill age
Because the model expresses all costs in present value, as written, it is independent of changing landfillcosts. As a result, the P term does not need to be summed over all years.landfill
The model assumes that waste destruction costs will remain constant for the foreseeable future (e.g.,destructions cost increases in excess of inflation will be offset by additional competition in the destructionmarket due to the increase in sales caused by the shrinking number of landfills available for disposal). This assumption allows the model to be written in a more simplified form when dealing with RCRAwastes and RCRA remediation as:
P = P + f P wheretotal landfill L D
f = liability factor incorporating the summation in the generic equation shown aboveL
Notes
(1) The tipping fee costs are assumed to be known and are expressed in present value terms; and currentwaste destruction costs are assumed to be known and the model requires that increases in excess ofinflation be estimated by the user.
(2) Inflation can be incorporated into the model using an inflation factor of (1+I) (where I = inflationm
rate, and m = number of years remaining to landfill failure).
(3) The liability factor resulting from the simplified equation can be shown either graphically or in alook-up table. For example, the reference shows a table of liability factors for different landfill ages(0 to 25 years) and inflation rates (0% to 7%) at an interest rate of 6%. Although the combinationsof interest and inflation could lead to a number of potential calculations, most firms use a set interestand inflation rate which leads to only one calculation which need not be repeated.
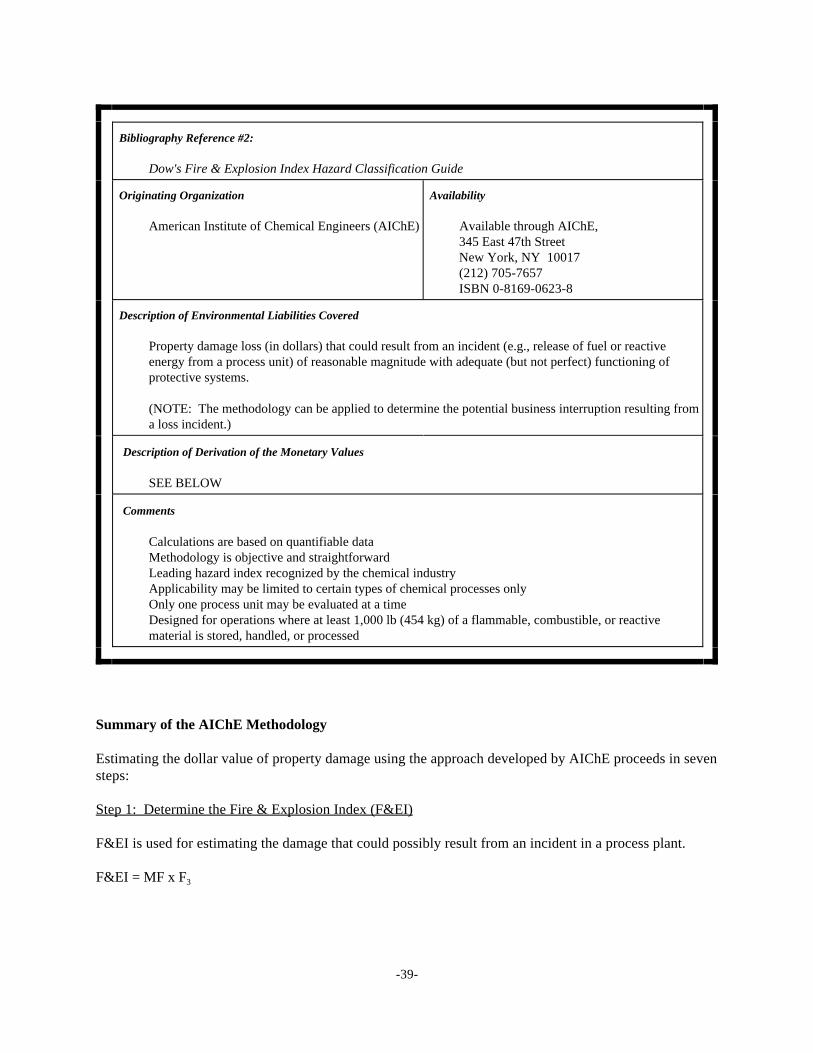
-39-
Bibliography Reference #2:
Dow's Fire & Explosion Index Hazard Classification Guide
Originating Organization Availability
American Institute of Chemical Engineers (AIChE) Available through AIChE,345 East 47th StreetNew York, NY 10017(212) 705-7657ISBN 0-8169-0623-8
Description of Environmental Liabilities Covered
Property damage loss (in dollars) that could result from an incident (e.g., release of fuel or reactiveenergy from a process unit) of reasonable magnitude with adequate (but not perfect) functioning ofprotective systems.
(NOTE: The methodology can be applied to determine the potential business interruption resulting froma loss incident.)
Description of Derivation of the Monetary Values
SEE BELOW
Comments
Calculations are based on quantifiable dataMethodology is objective and straightforwardLeading hazard index recognized by the chemical industryApplicability may be limited to certain types of chemical processes onlyOnly one process unit may be evaluated at a timeDesigned for operations where at least 1,000 lb (454 kg) of a flammable, combustible, or reactivematerial is stored, handled, or processed
Summary of the AIChE Methodology
Estimating the dollar value of property damage using the approach developed by AIChE proceeds in sevensteps:
Step 1: Determine the Fire & Explosion Index (F&EI)
F&EI is used for estimating the damage that could possibly result from an incident in a process plant.
F&EI = MF x F3
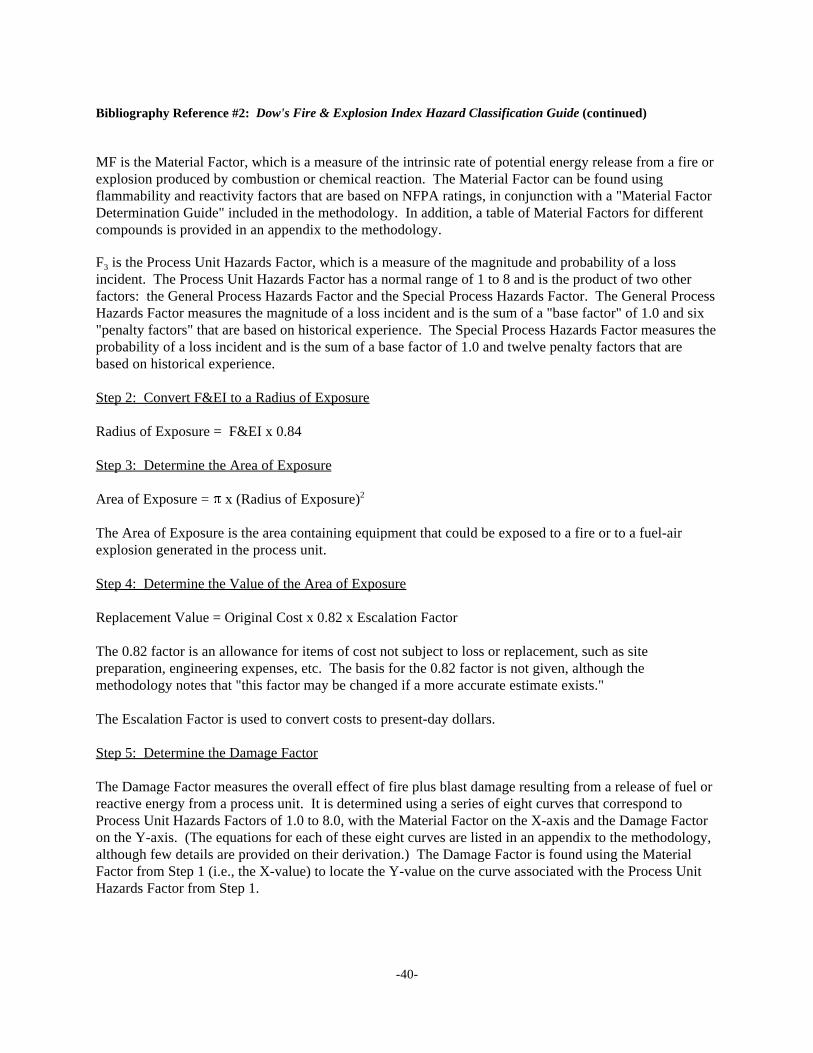
-40-
Bibliography Reference #2: Dow's Fire & Explosion Index Hazard Classification Guide (continued)
MF is the Material Factor, which is a measure of the intrinsic rate of potential energy release from a fire orexplosion produced by combustion or chemical reaction. The Material Factor can be found usingflammability and reactivity factors that are based on NFPA ratings, in conjunction with a "Material FactorDetermination Guide" included in the methodology. In addition, a table of Material Factors for differentcompounds is provided in an appendix to the methodology.
F is the Process Unit Hazards Factor, which is a measure of the magnitude and probability of a loss3
incident. The Process Unit Hazards Factor has a normal range of 1 to 8 and is the product of two otherfactors: the General Process Hazards Factor and the Special Process Hazards Factor. The General ProcessHazards Factor measures the magnitude of a loss incident and is the sum of a "base factor" of 1.0 and six"penalty factors" that are based on historical experience. The Special Process Hazards Factor measures theprobability of a loss incident and is the sum of a base factor of 1.0 and twelve penalty factors that arebased on historical experience.
Step 2: Convert F&EI to a Radius of Exposure
Radius of Exposure = F&EI x 0.84
Step 3: Determine the Area of Exposure
Area of Exposure = % x (Radius of Exposure)2
The Area of Exposure is the area containing equipment that could be exposed to a fire or to a fuel-airexplosion generated in the process unit.
Step 4: Determine the Value of the Area of Exposure
Replacement Value = Original Cost x 0.82 x Escalation Factor
The 0.82 factor is an allowance for items of cost not subject to loss or replacement, such as sitepreparation, engineering expenses, etc. The basis for the 0.82 factor is not given, although themethodology notes that "this factor may be changed if a more accurate estimate exists."
The Escalation Factor is used to convert costs to present-day dollars.
Step 5: Determine the Damage Factor
The Damage Factor measures the overall effect of fire plus blast damage resulting from a release of fuel orreactive energy from a process unit. It is determined using a series of eight curves that correspond toProcess Unit Hazards Factors of 1.0 to 8.0, with the Material Factor on the X-axis and the Damage Factoron the Y-axis. (The equations for each of these eight curves are listed in an appendix to the methodology,although few details are provided on their derivation.) The Damage Factor is found using the MaterialFactor from Step 1 (i.e., the X-value) to locate the Y-value on the curve associated with the Process UnitHazards Factor from Step 1.
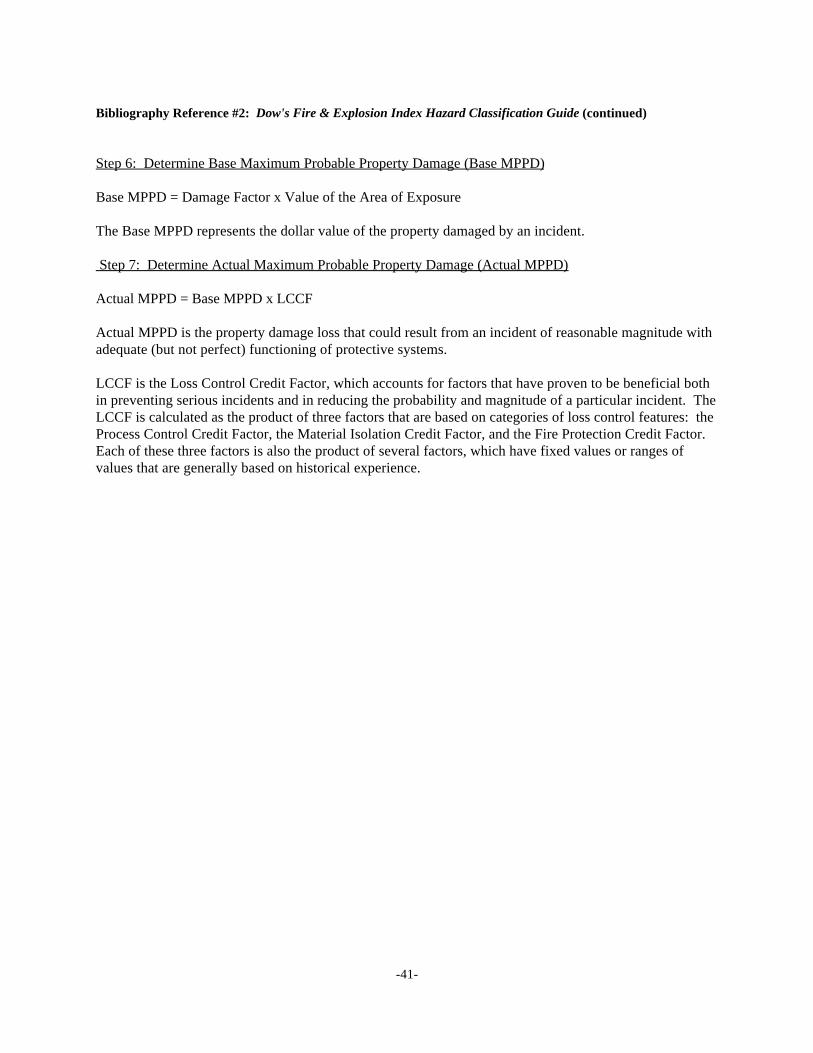
-41-
Bibliography Reference #2: Dow's Fire & Explosion Index Hazard Classification Guide (continued)
Step 6: Determine Base Maximum Probable Property Damage (Base MPPD)
Base MPPD = Damage Factor x Value of the Area of Exposure
The Base MPPD represents the dollar value of the property damaged by an incident.
Step 7: Determine Actual Maximum Probable Property Damage (Actual MPPD)
Actual MPPD = Base MPPD x LCCF
Actual MPPD is the property damage loss that could result from an incident of reasonable magnitude withadequate (but not perfect) functioning of protective systems.
LCCF is the Loss Control Credit Factor, which accounts for factors that have proven to be beneficial bothin preventing serious incidents and in reducing the probability and magnitude of a particular incident. TheLCCF is calculated as the product of three factors that are based on categories of loss control features: theProcess Control Credit Factor, the Material Isolation Credit Factor, and the Fire Protection Credit Factor. Each of these three factors is also the product of several factors, which have fixed values or ranges ofvalues that are generally based on historical experience.
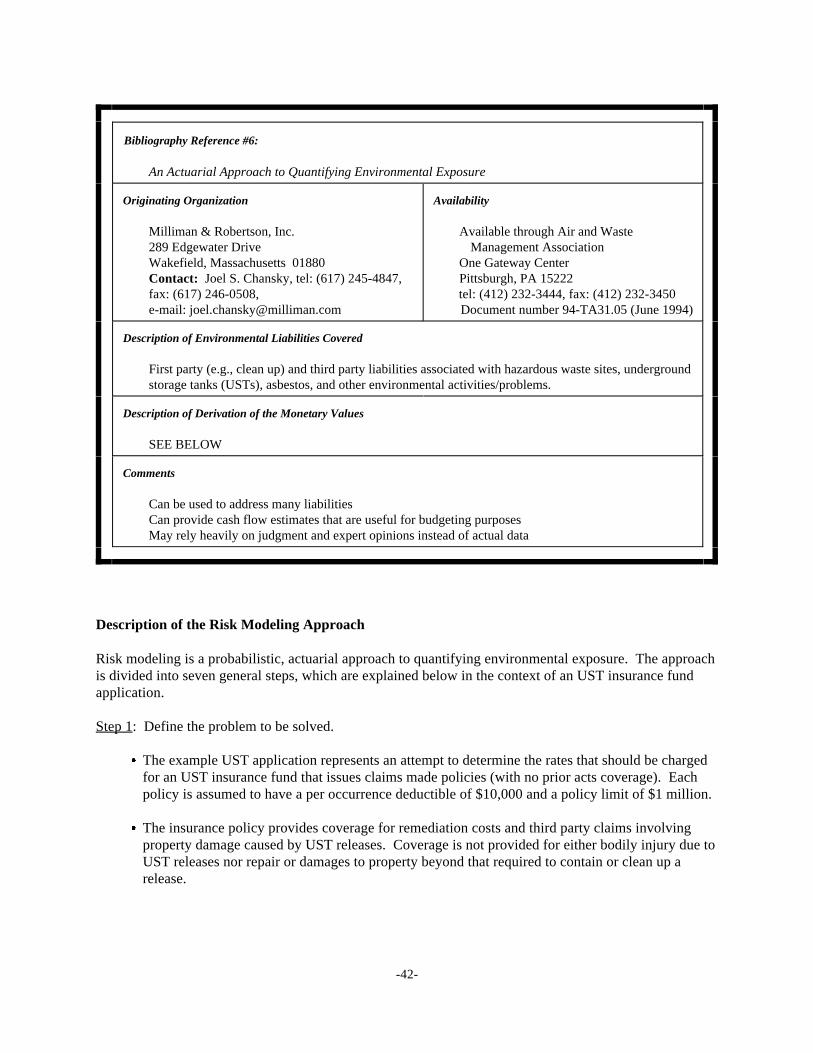
-42-
Bibliography Reference #6:
An Actuarial Approach to Quantifying Environmental Exposure
Originating Organization Availability
Milliman & Robertson, Inc. Available through Air and Waste 289 Edgewater Drive Management Association
Wakefield, Massachusetts 01880 One Gateway CenterContact: Joel S. Chansky, tel: (617) 245-4847, Pittsburgh, PA 15222 fax: (617) 246-0508, tel: (412) 232-3444, fax: (412) 232-3450e-mail: [email protected] Document number 94-TA31.05 (June 1994)
Description of Environmental Liabilities Covered
First party (e.g., clean up) and third party liabilities associated with hazardous waste sites, undergroundstorage tanks (USTs), asbestos, and other environmental activities/problems.
Description of Derivation of the Monetary Values
SEE BELOW
Comments
Can be used to address many liabilitiesCan provide cash flow estimates that are useful for budgeting purposesMay rely heavily on judgment and expert opinions instead of actual data
Description of the Risk Modeling Approach
Risk modeling is a probabilistic, actuarial approach to quantifying environmental exposure. The approachis divided into seven general steps, which are explained below in the context of an UST insurance fundapplication.
Step 1: Define the problem to be solved.
& The example UST application represents an attempt to determine the rates that should be chargedfor an UST insurance fund that issues claims made policies (with no prior acts coverage). Eachpolicy is assumed to have a per occurrence deductible of $10,000 and a policy limit of $1 million.
& The insurance policy provides coverage for remediation costs and third party claims involvingproperty damage caused by UST releases. Coverage is not provided for either bodily injury due toUST releases nor repair or damages to property beyond that required to contain or clean up arelease.
-43-
Bibliography Reference #6: An Actuarial Approach to Quantifying Environmental Exposure (continued)
Step 2: Identify the universe of environmental exposures.
& In the example UST application, this step requires gathering data on the number of tanks in thearea covered by the UST insurance policy, as well as tank age, tank construction, protectivefeatures, and monitoring systems.
& Based on the tank data and on discussions with technical experts, a tank risk classification systemis developed using the numbers 1 through 4 (which pertain to tank age and construction) and theletters A through D (which pertain to protective features and monitoring systems). Tanksclassified as 1A have the lowest risk of failure or spills, while tanks classified as 4D have thehighest risk.
Step 3: Estimate the expected value of the cost of all events.
& In the example UST application, the first component of this step is to define a claim as any insuredevent resulting in at least $10,000 of clean up costs. Based on discussions with technical experts,the methodology then identifies the potential causes of loss (i.e., leak) as tank failure, pipingfailure, and spills/overfills, and assigns probabilities of occurrence to each.
& The next component is to determine the expected number of leaks in year 1 by multiplying thenumber of tanks in a particular risk class by the probability of a leak and summing these productsover all risk classes.
& The third component is to estimate the percentage of tanks insured in year 1, based on discussionswith state officials. This percentage is then multiplied by the expected number of leaks in year 1to estimate the expected number of leaks that could potentially be covered by the UST insurancefund. Based on engineering assumptions, the expected number of claims (i.e., insured leaks thatwill be reported) in year 1 is then estimated.
& The fourth component is to estimate the average cost of a claim. The example applicationestimates an average claim cost of $61,360 (net of a $10,000 deductible), based on discussionswith experts. The costs included here include clean up (remedial action), monitoring, screening,investigation, third party liability, and costs of technical experts.
& The final component in this step is to estimate the total expected value of losses and associatedclaim costs by multiplying the expected number of claims by the average claim cost. Dividing thisproduct by the number of tanks covered by the insurance fund yields the average cost per tank.
Step 4: Estimate a range of possible cost results (i.e., distribution about the mean).
& This step requires conducting a "confidence level" analysis, which involves estimating thepossible range of outcomes and the probability of each. The example UST application conducts aconfidence level analysis using a computer model that simulates 1,000 years of first year claimsmade experience (i.e., losses). The model assumes a Poisson distribution for claim frequency anda lognormal distribution for clean up costs but allows the means of these
-44-
Bibliography Reference #6: An Actuarial Approach to Quantifying Environmental Exposure (continued)
distributions to vary. The cost results from the model are ranked from low to high in order todevelop confidence levels.
Step 5: Select a value to achieve management objectives.
& In the example UST application, this step requires insurance fund managers to select a confidencelevel (i.e., total expected loss value) on which insurance rates will be based.
Step 6: Estimate the pattern of cash flow.
& In the example UST application, the duration of a clean up and the associated cash flow isestimated based on discussions with experts. The cash flow pattern for third party claims isderived by reviewing data from the insurance industry.
Step 7: If necessary, convert to an equitable unit cost basis.
& In the example UST application, the first component of this step is to estimate the average unitloss cost by dividing the selected confidence level for costs by the number of tanks covered by theinsurance fund.
& The next component is to establish a rating plan based on the UST risk classes defined in Step 2. Administrative and overhead charges (which typically are fixed) can be added to these rates ifdesired.
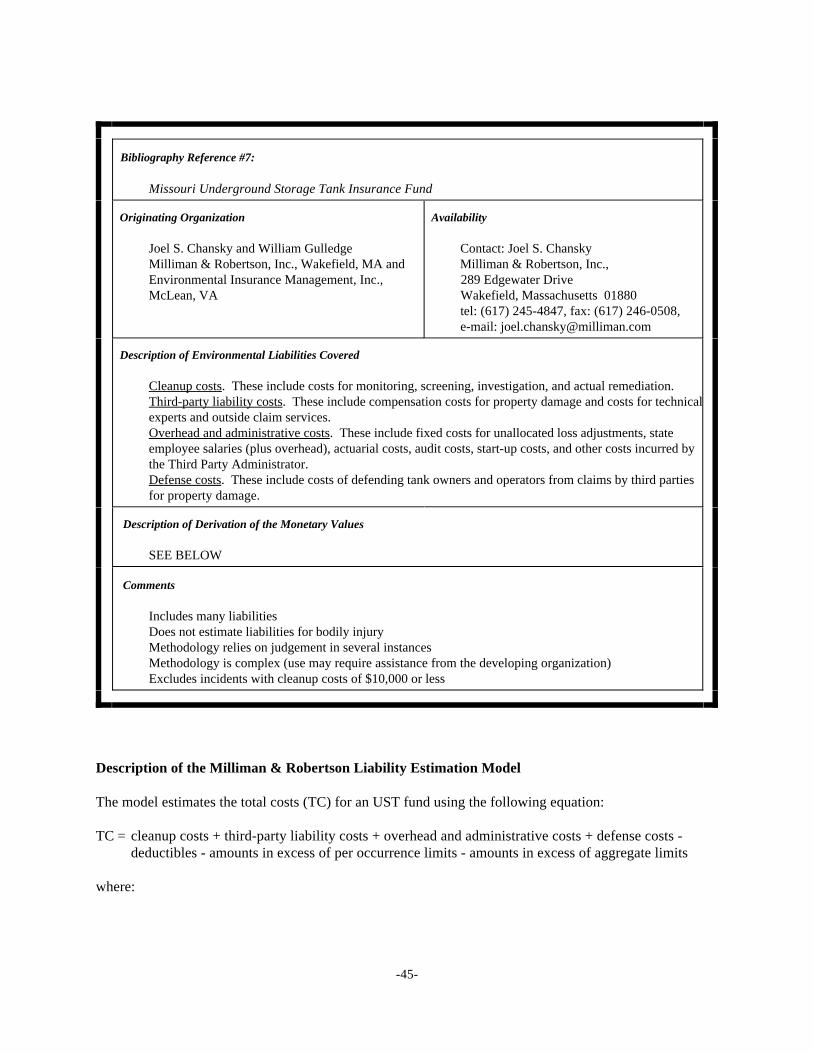
-45-
Bibliography Reference #7:
Missouri Underground Storage Tank Insurance Fund
Originating Organization Availability
Joel S. Chansky and William Gulledge Contact: Joel S. ChanskyMilliman & Robertson, Inc., Wakefield, MA and Milliman & Robertson, Inc., Environmental Insurance Management, Inc., 289 Edgewater DriveMcLean, VA Wakefield, Massachusetts 01880
tel: (617) 245-4847, fax: (617) 246-0508, e-mail: [email protected]
Description of Environmental Liabilities Covered
Cleanup costs. These include costs for monitoring, screening, investigation, and actual remediation.Third-party liability costs. These include compensation costs for property damage and costs for technicalexperts and outside claim services.Overhead and administrative costs. These include fixed costs for unallocated loss adjustments, stateemployee salaries (plus overhead), actuarial costs, audit costs, start-up costs, and other costs incurred bythe Third Party Administrator.Defense costs. These include costs of defending tank owners and operators from claims by third partiesfor property damage.
Description of Derivation of the Monetary Values
SEE BELOW
Comments
Includes many liabilitiesDoes not estimate liabilities for bodily injuryMethodology relies on judgement in several instancesMethodology is complex (use may require assistance from the developing organization)Excludes incidents with cleanup costs of $10,000 or less
Description of the Milliman & Robertson Liability Estimation Model
The model estimates the total costs (TC) for an UST fund using the following equation:
TC = cleanup costs + third-party liability costs + overhead and administrative costs + defense costs -deductibles - amounts in excess of per occurrence limits - amounts in excess of aggregate limits
where:
-46-
Bibliography Reference #7: Missouri Underground Storage Tank Insurance Fund (continued)
(1) Cleanup costs = (number of claims) x (cleanup cost per claim)
& The number of claims is determined using data on the classifications and ages of tanks located inthe state being examined, along with assumed release probabilities and reporting patterns.
& The cleanup cost per claim includes costs for remediation, monitoring, screening, andinvestigation.
& Three probability distributions of remediation costs ("Low," "Middle," and "High") are derivedusing historical data from various states (compiled by EPA), as well as judgement. The averagecleanup costs derived from the "Low," "Middle," and "High" distributions are $47,867; $57,161;and $68,737, respectively.
& Monitoring ($4,500 per claim), screening ($5,600 per claim), and investigation ($2,100 per claim)cost estimates are based on engineering assumptions.
(2) Third-party liability costs = (number of claims) x (3%) x (cost per claim)
& The 3% factor reflects the assumption that third-party liability costs are incurred with 3%probability given a cleanup claim. No basis for this estimate is provided. (Third-party claims areassumed to occur only in the presence of a cleanup claim.)
& The cost per claim is derived from a distribution of third-party property/damage costs with a meanof $40,050 per claim. Additional third-party liability costs include costs for technical experts($1,200 per claim) and outside claim services ($1,125 per claim). Due to a lack of historical dataon third-party claims, all third-party costs (including the distribution) are based entirely onjudgement.
(3) Overhead and administrative costs = $5,775 per claim x (number of claims) + yearly overhead
& The $5,775 per claim is for unallocated loss adjustment expenses (ULAE). This cost estimate isbased on judgement.
& Yearly overhead costs are derived by taking the sum of state employee salaries, actuarial costs,audit costs, start-up costs, and other costs incurred by the Third Party Administrator. Thisinformation is to be provided by the administrative offices of the state being examined.
(4) Defense costs = $2,700 per claim
& This estimate is based on a $15,000 figure for defense costs associated with a cleanup claim, and a$30,000 figure for defense costs associated with both a cleanup and third-party claim. Both costfigures are based on judgement. The methodology assumes that for a cleanup there is a 15%chance of incurring the $15,000 defense cost. Furthermore, the analysis assumes that there is a.45% chance of incurring the $30,000 defense cost, since third-party claims are already assumed tooccur with 3% probability given a cleanup claim (i.e., .15 x .03 = .0045).
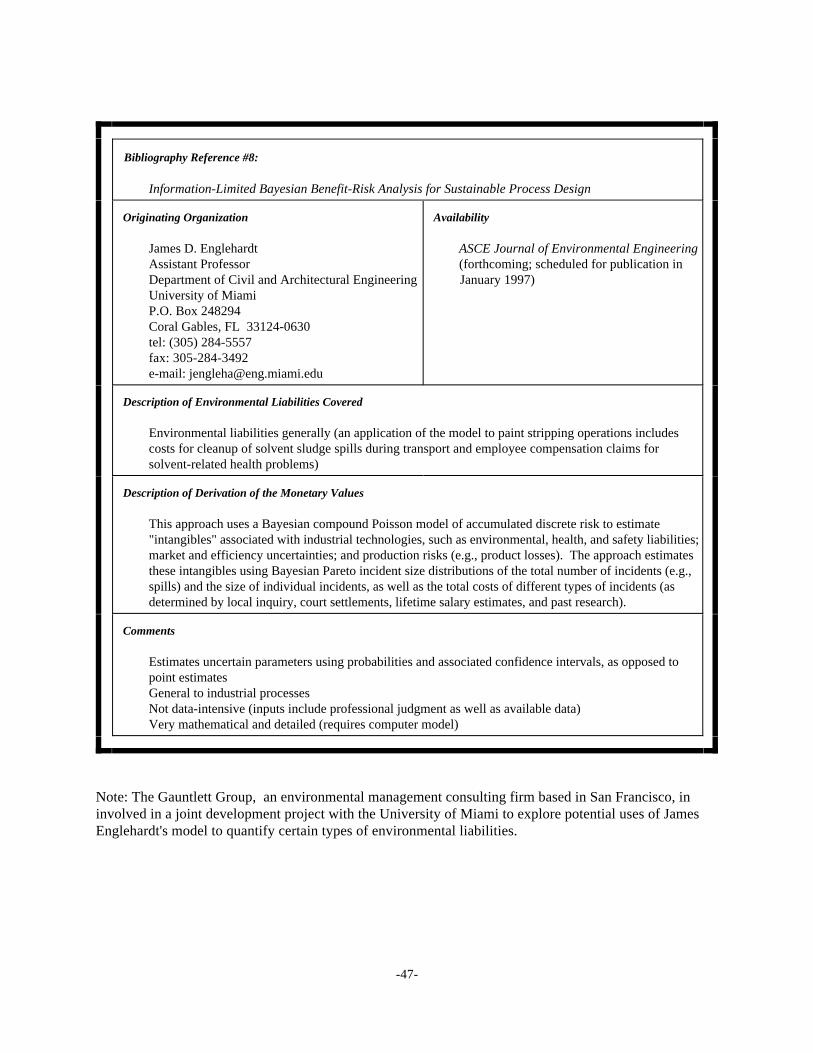
-47-
Bibliography Reference #8:
Information-Limited Bayesian Benefit-Risk Analysis for Sustainable Process Design
Originating Organization Availability
James D. Englehardt ASCE Journal of Environmental EngineeringAssistant Professor (forthcoming; scheduled for publication inDepartment of Civil and Architectural Engineering January 1997)University of MiamiP.O. Box 248294Coral Gables, FL 33124-0630tel: (305) 284-5557fax: 305-284-3492e-mail: [email protected]
Description of Environmental Liabilities Covered
Environmental liabilities generally (an application of the model to paint stripping operations includescosts for cleanup of solvent sludge spills during transport and employee compensation claims forsolvent-related health problems)
Description of Derivation of the Monetary Values
This approach uses a Bayesian compound Poisson model of accumulated discrete risk to estimate"intangibles" associated with industrial technologies, such as environmental, health, and safety liabilities;market and efficiency uncertainties; and production risks (e.g., product losses). The approach estimatesthese intangibles using Bayesian Pareto incident size distributions of the total number of incidents (e.g.,spills) and the size of individual incidents, as well as the total costs of different types of incidents (asdetermined by local inquiry, court settlements, lifetime salary estimates, and past research).
Comments
Estimates uncertain parameters using probabilities and associated confidence intervals, as opposed topoint estimatesGeneral to industrial processesNot data-intensive (inputs include professional judgment as well as available data)Very mathematical and detailed (requires computer model)
Note: The Gauntlett Group, an environmental management consulting firm based in San Francisco, ininvolved in a joint development project with the University of Miami to explore potential uses of JamesEnglehardt's model to quantify certain types of environmental liabilities.
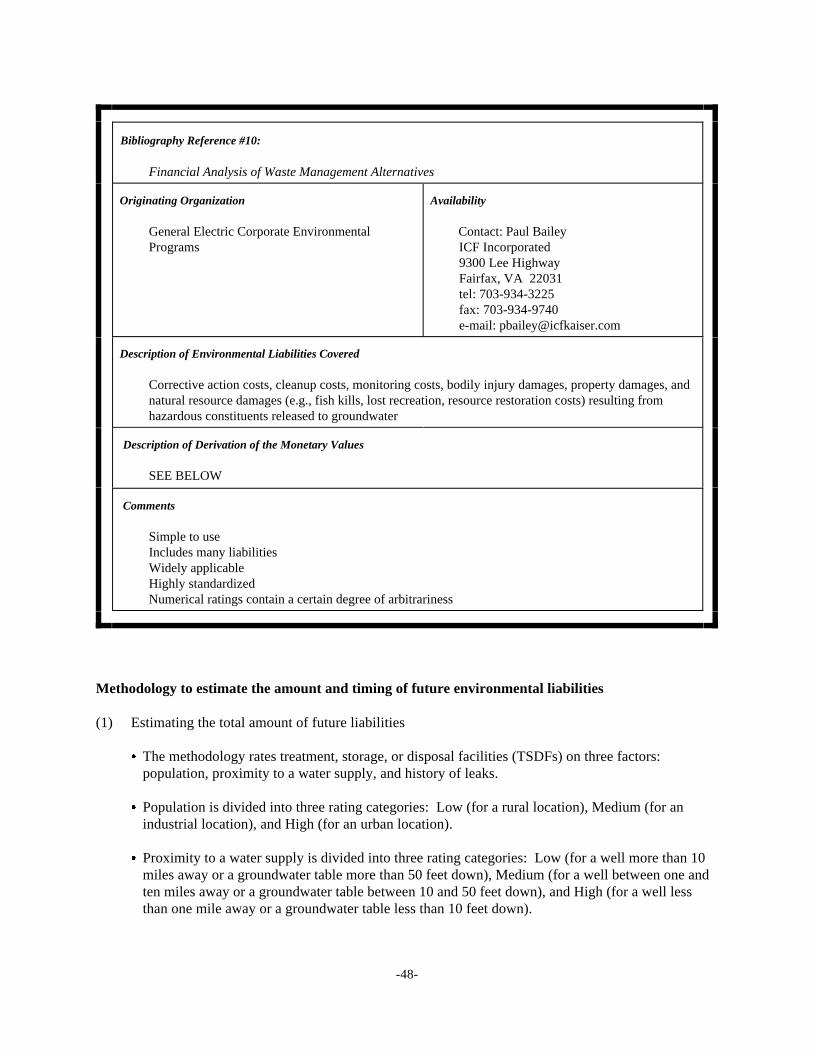
-48-
Bibliography Reference #10:
Financial Analysis of Waste Management Alternatives
Originating Organization Availability
General Electric Corporate Environmental Contact: Paul Bailey Programs ICF Incorporated
9300 Lee HighwayFairfax, VA 22031tel: 703-934-3225 fax: 703-934-9740 e-mail: [email protected]
Description of Environmental Liabilities Covered
Corrective action costs, cleanup costs, monitoring costs, bodily injury damages, property damages, andnatural resource damages (e.g., fish kills, lost recreation, resource restoration costs) resulting fromhazardous constituents released to groundwater
Description of Derivation of the Monetary Values
SEE BELOW
Comments
Simple to useIncludes many liabilitiesWidely applicableHighly standardizedNumerical ratings contain a certain degree of arbitrariness
Methodology to estimate the amount and timing of future environmental liabilities
(1) Estimating the total amount of future liabilities
& The methodology rates treatment, storage, or disposal facilities (TSDFs) on three factors: population, proximity to a water supply, and history of leaks.
& Population is divided into three rating categories: Low (for a rural location), Medium (for anindustrial location), and High (for an urban location).
& Proximity to a water supply is divided into three rating categories: Low (for a well more than 10miles away or a groundwater table more than 50 feet down), Medium (for a well between one andten miles away or a groundwater table between 10 and 50 feet down), and High (for a well lessthan one mile away or a groundwater table less than 10 feet down).
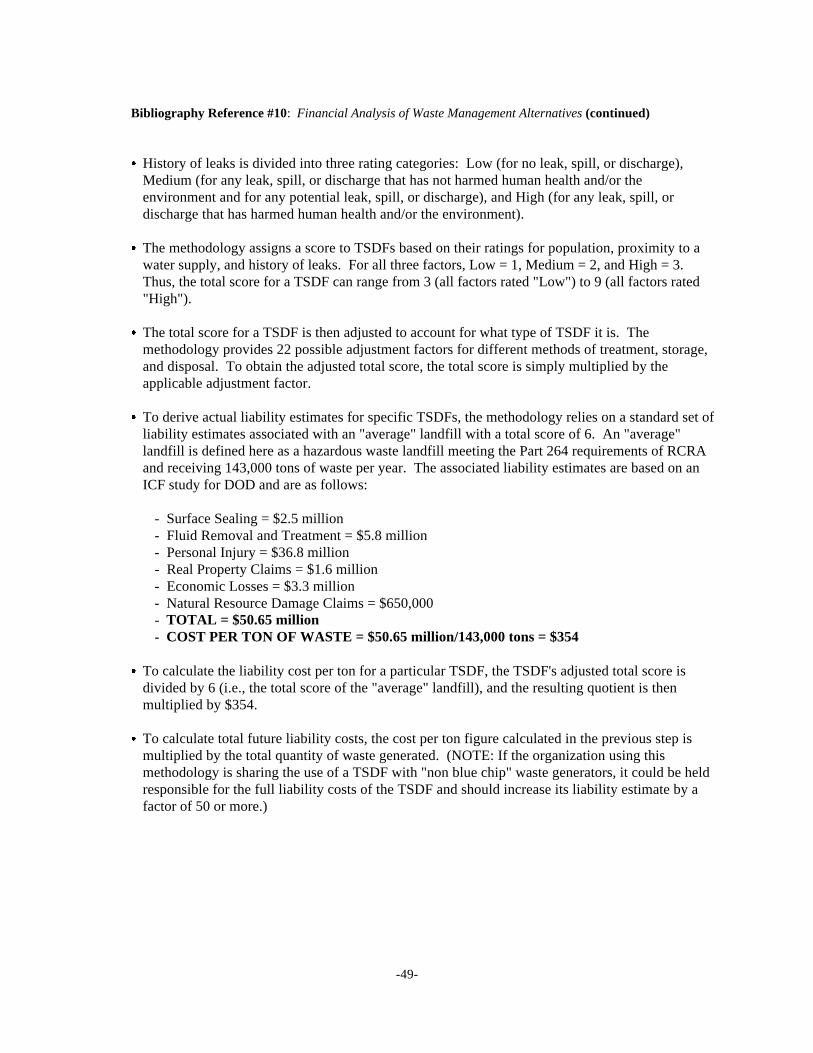
-49-
Bibliography Reference #10: Financial Analysis of Waste Management Alternatives (continued)
& History of leaks is divided into three rating categories: Low (for no leak, spill, or discharge),Medium (for any leak, spill, or discharge that has not harmed human health and/or theenvironment and for any potential leak, spill, or discharge), and High (for any leak, spill, ordischarge that has harmed human health and/or the environment).
& The methodology assigns a score to TSDFs based on their ratings for population, proximity to awater supply, and history of leaks. For all three factors, Low = 1, Medium = 2, and High = 3. Thus, the total score for a TSDF can range from 3 (all factors rated "Low") to 9 (all factors rated"High").
& The total score for a TSDF is then adjusted to account for what type of TSDF it is. Themethodology provides 22 possible adjustment factors for different methods of treatment, storage,and disposal. To obtain the adjusted total score, the total score is simply multiplied by theapplicable adjustment factor.
& To derive actual liability estimates for specific TSDFs, the methodology relies on a standard set ofliability estimates associated with an "average" landfill with a total score of 6. An "average"landfill is defined here as a hazardous waste landfill meeting the Part 264 requirements of RCRAand receiving 143,000 tons of waste per year. The associated liability estimates are based on anICF study for DOD and are as follows:
- Surface Sealing = $2.5 million- Fluid Removal and Treatment = $5.8 million- Personal Injury = $36.8 million- Real Property Claims = $1.6 million- Economic Losses = $3.3 million- Natural Resource Damage Claims = $650,000- TOTAL = $50.65 million- COST PER TON OF WASTE = $50.65 million/143,000 tons = $354
& To calculate the liability cost per ton for a particular TSDF, the TSDF's adjusted total score isdivided by 6 (i.e., the total score of the "average" landfill), and the resulting quotient is thenmultiplied by $354.
& To calculate total future liability costs, the cost per ton figure calculated in the previous step ismultiplied by the total quantity of waste generated. (NOTE: If the organization using thismethodology is sharing the use of a TSDF with "non blue chip" waste generators, it could be heldresponsible for the full liability costs of the TSDF and should increase its liability estimate by afactor of 50 or more.)
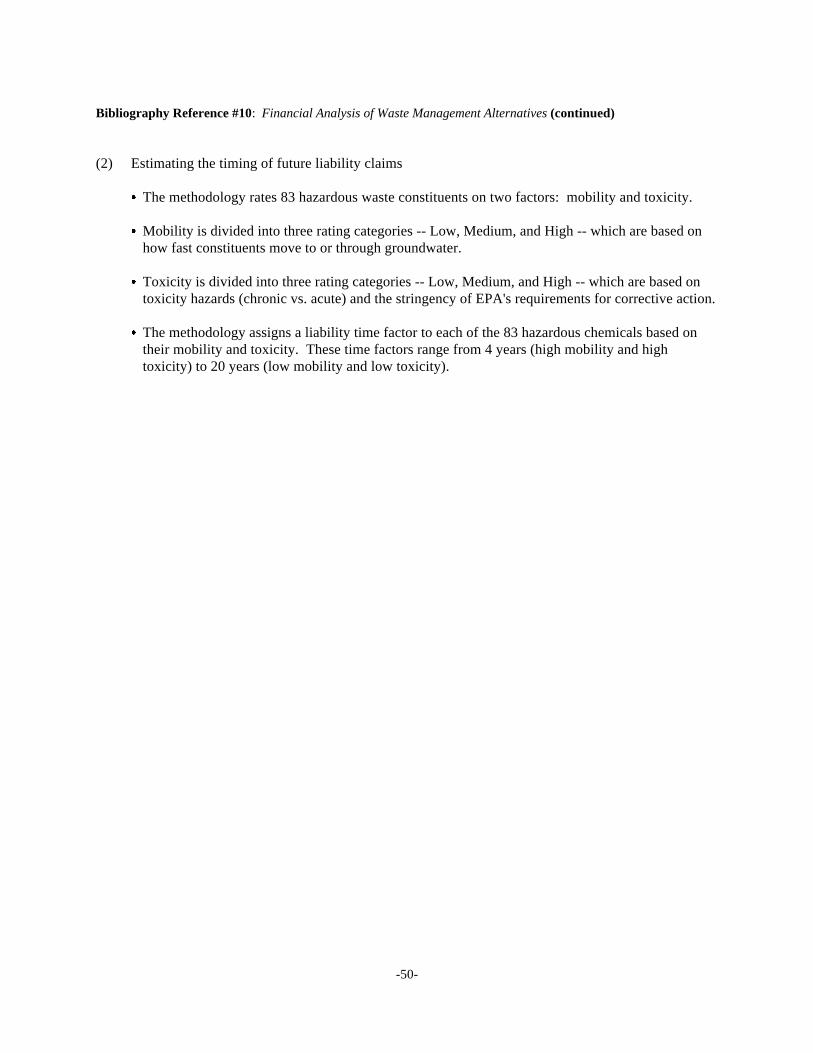
-50-
Bibliography Reference #10: Financial Analysis of Waste Management Alternatives (continued)
(2) Estimating the timing of future liability claims
& The methodology rates 83 hazardous waste constituents on two factors: mobility and toxicity.
& Mobility is divided into three rating categories -- Low, Medium, and High -- which are based onhow fast constituents move to or through groundwater.
& Toxicity is divided into three rating categories -- Low, Medium, and High -- which are based ontoxicity hazards (chronic vs. acute) and the stringency of EPA's requirements for corrective action.
& The methodology assigns a liability time factor to each of the 83 hazardous chemicals based ontheir mobility and toxicity. These time factors range from 4 years (high mobility and hightoxicity) to 20 years (low mobility and low toxicity).
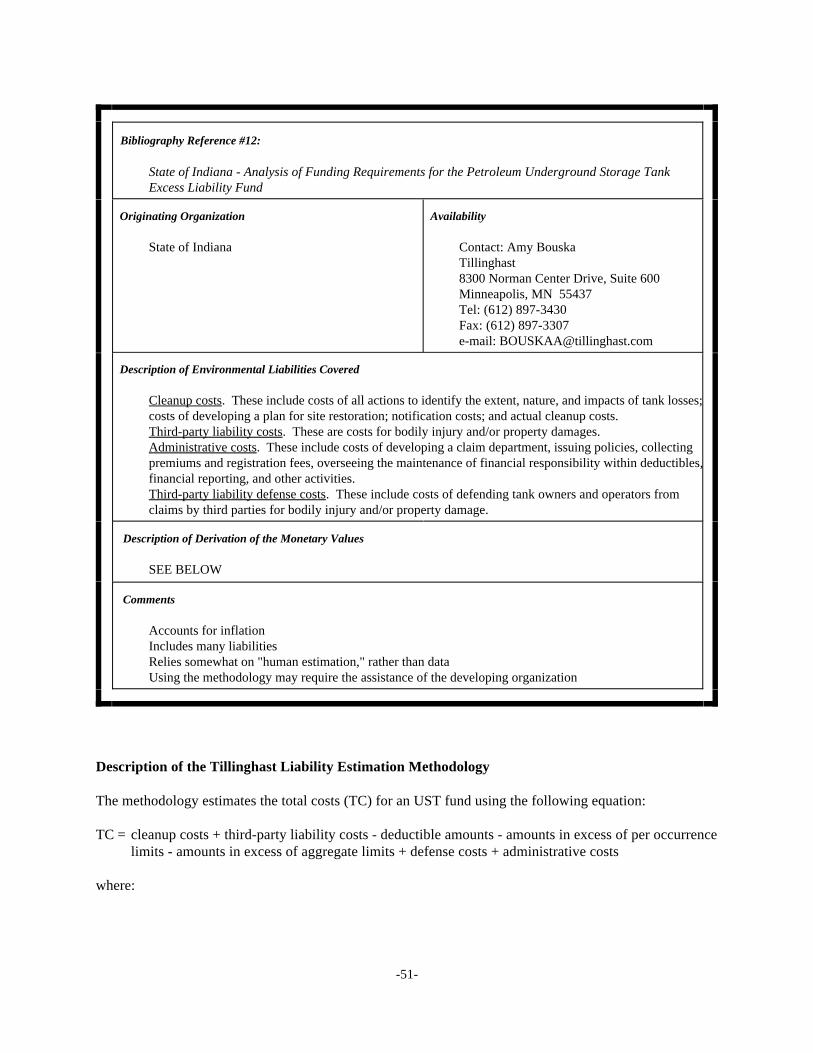
-51-
Bibliography Reference #12:
State of Indiana - Analysis of Funding Requirements for the Petroleum Underground Storage TankExcess Liability Fund
Originating Organization Availability
State of Indiana Contact: Amy BouskaTillinghast8300 Norman Center Drive, Suite 600 Minneapolis, MN 55437Tel: (612) 897-3430Fax: (612) 897-3307e-mail: [email protected]
Description of Environmental Liabilities Covered
Cleanup costs. These include costs of all actions to identify the extent, nature, and impacts of tank losses;costs of developing a plan for site restoration; notification costs; and actual cleanup costs.Third-party liability costs. These are costs for bodily injury and/or property damages.Administrative costs. These include costs of developing a claim department, issuing policies, collectingpremiums and registration fees, overseeing the maintenance of financial responsibility within deductibles,financial reporting, and other activities.Third-party liability defense costs. These include costs of defending tank owners and operators fromclaims by third parties for bodily injury and/or property damage.
Description of Derivation of the Monetary Values
SEE BELOW
Comments
Accounts for inflationIncludes many liabilitiesRelies somewhat on "human estimation," rather than dataUsing the methodology may require the assistance of the developing organization
Description of the Tillinghast Liability Estimation Methodology
The methodology estimates the total costs (TC) for an UST fund using the following equation:
TC = cleanup costs + third-party liability costs - deductible amounts - amounts in excess of per occurrencelimits - amounts in excess of aggregate limits + defense costs + administrative costs
where:
-52-
Bibliography Reference #12: State of Indiana - Analysis of Funding Requirements for the Petroleum UndergroundStorage Tank Excess Liability Fund (continued)
(1) Cleanup costs = (cleanup cost per occurrence) x (number of occurrences)
& Cleanup costs per occurrence are based on a distribution of third-party cleanups reported toTillinghast in 1987 by an industry source. Tillinghast updates these 1987 estimates withinformation on more recent first-party cleanups and increased cleanup severity to obtain a morerecent distribution. Also, based on discussions with state officials, consultants, and other USTexperts, Tillinghast tailors these costs to the individual state being examined.&The number ofoccurrences (i.e., "discovered" occurrences) is derived using leak frequency rates (by tank age andtype) based on state data, extrapolations of data from other studies, state monitoring programs, andother estimates and adjusted for each state being examined. The number of occurrences alsodepends on leak discovery rates, which are based on historical rates, regulatory coverage andcompliance, different types of monitoring, review of leak reports, and discussions withenvironmental engineering firms.
(2) Third-party liabilities = (cost per claim) x (state factor) x (number of occurrences) x (2%)
& A distribution of costs per claim is derived from a mean value of $350,000 per claim, which isbased on Tillinghast experience and an ICF study on tort losses. The "state factor" adjusts the$350,000 mean estimate to reflect legal conditions in the particular state being examined, which inturn adjusts the distribution of costs per claim. Furthermore, based on other studies andexperience, the methodology assumes that two percent of the discovered leak occurrences lead tothird-party claims.
(3) Defense costs = (third-party liabilities) x (15%)
& This calculation is based on discussions with an attorney whose firm defends environmentalclaims.
(4) Administrative costs = (cleanup costs and third-party liabilities) x (10%)
& This calculation is based on discussions with a former executive of an insurer of undergroundtanks.
Notes
& Tillinghast bases all of its assumptions on the tank demographics for the individual states beingconsidered. These demographics (which include number, condition, age, and constructionmaterial of tanks; substances contained, size of tank owner, tank usage, and tank accessibility) arebased on actual data.
& Cost payout timing is based on discussions with various state environmental departments.
& Other factors such as compliance with EPA Leak Detection Requirements, temporarily out of usetanks, and tanks taken out of service are based on actual data or assumptions derived from dataand discussions with state officials.
-53-
Bibliography Reference #12: State of Indiana - Analysis of Funding Requirements for the Petroleum UndergroundStorage Tank Excess Liability Fund (continued)
& Inflation is assumed to follow a 10-year pattern: 15%, 10%, 10%, 5%, 5%, 5%, 5%, 5%, 5%, and5%.
& Deductible amounts, per occurrence limits, and aggregate limits are based on those specified bythe individual state being examined.
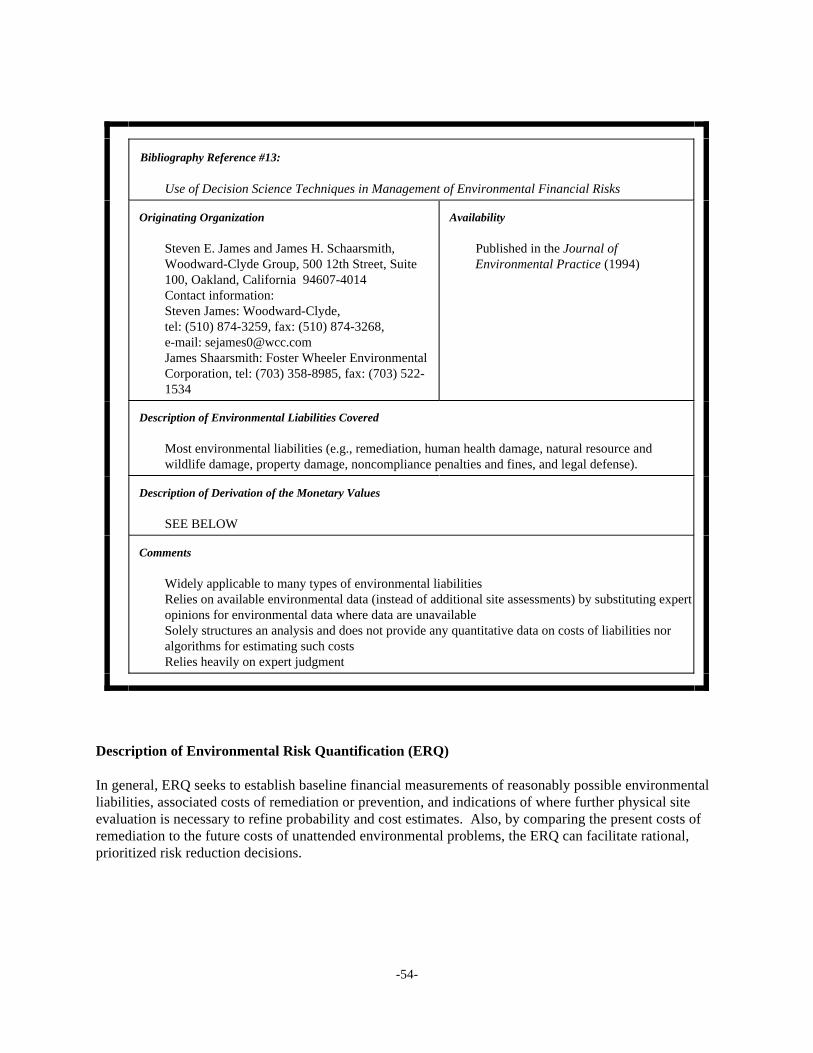
-54-
Bibliography Reference #13:
Use of Decision Science Techniques in Management of Environmental Financial Risks
Originating Organization Availability
Steven E. James and James H. Schaarsmith, Published in the Journal ofWoodward-Clyde Group, 500 12th Street, Suite Environmental Practice (1994)100, Oakland, California 94607-4014Contact information: Steven James: Woodward-Clyde, tel: (510) 874-3259, fax: (510) 874-3268, e-mail: [email protected] Shaarsmith: Foster Wheeler EnvironmentalCorporation, tel: (703) 358-8985, fax: (703) 522-1534
Description of Environmental Liabilities Covered
Most environmental liabilities (e.g., remediation, human health damage, natural resource andwildlife damage, property damage, noncompliance penalties and fines, and legal defense).
Description of Derivation of the Monetary Values
SEE BELOW
Comments
Widely applicable to many types of environmental liabilitiesRelies on available environmental data (instead of additional site assessments) by substituting expertopinions for environmental data where data are unavailableSolely structures an analysis and does not provide any quantitative data on costs of liabilities noralgorithms for estimating such costsRelies heavily on expert judgment
Description of Environmental Risk Quantification (ERQ)
In general, ERQ seeks to establish baseline financial measurements of reasonably possible environmentalliabilities, associated costs of remediation or prevention, and indications of where further physical siteevaluation is necessary to refine probability and cost estimates. Also, by comparing the present costs ofremediation to the future costs of unattended environmental problems, the ERQ can facilitate rational,prioritized risk reduction decisions.
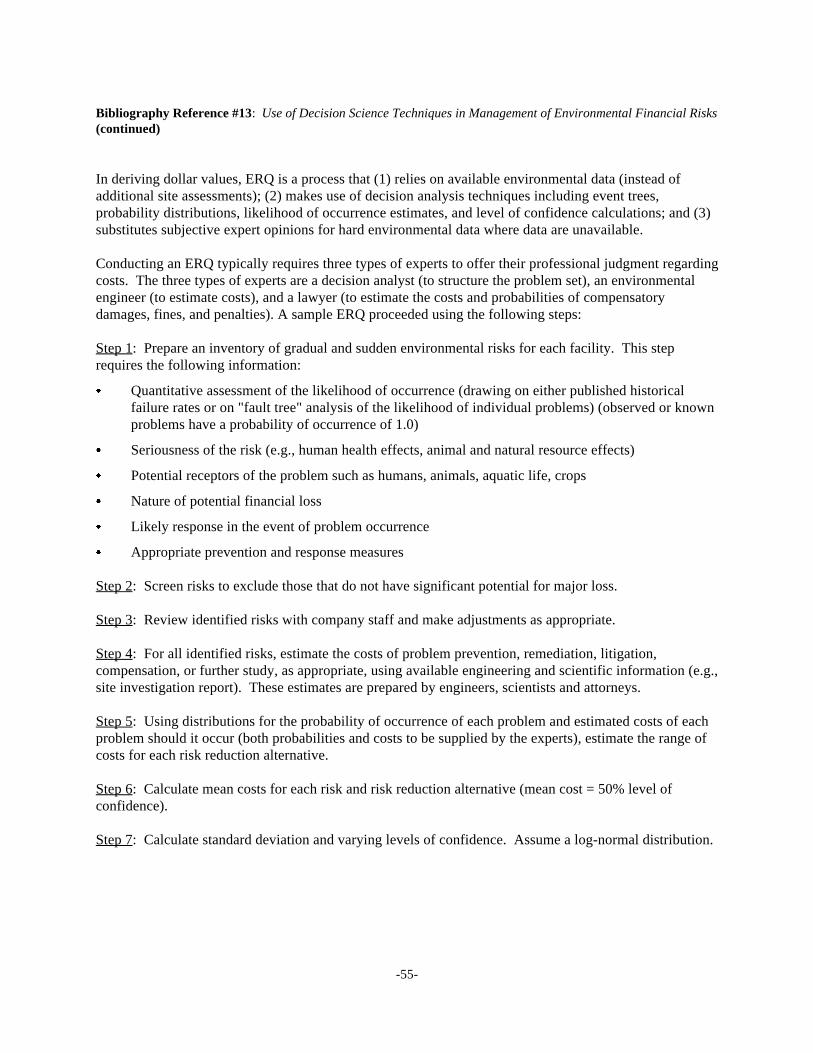
-55-
Bibliography Reference #13: Use of Decision Science Techniques in Management of Environmental Financial Risks(continued)
In deriving dollar values, ERQ is a process that (1) relies on available environmental data (instead ofadditional site assessments); (2) makes use of decision analysis techniques including event trees,probability distributions, likelihood of occurrence estimates, and level of confidence calculations; and (3)substitutes subjective expert opinions for hard environmental data where data are unavailable.
Conducting an ERQ typically requires three types of experts to offer their professional judgment regardingcosts. The three types of experts are a decision analyst (to structure the problem set), an environmentalengineer (to estimate costs), and a lawyer (to estimate the costs and probabilities of compensatorydamages, fines, and penalties). A sample ERQ proceeded using the following steps:
Step 1: Prepare an inventory of gradual and sudden environmental risks for each facility. This steprequires the following information:
& Quantitative assessment of the likelihood of occurrence (drawing on either published historicalfailure rates or on "fault tree" analysis of the likelihood of individual problems) (observed or knownproblems have a probability of occurrence of 1.0)
& Seriousness of the risk (e.g., human health effects, animal and natural resource effects)
& Potential receptors of the problem such as humans, animals, aquatic life, crops
& Nature of potential financial loss
& Likely response in the event of problem occurrence
& Appropriate prevention and response measures
Step 2: Screen risks to exclude those that do not have significant potential for major loss.
Step 3: Review identified risks with company staff and make adjustments as appropriate.
Step 4: For all identified risks, estimate the costs of problem prevention, remediation, litigation,compensation, or further study, as appropriate, using available engineering and scientific information (e.g.,site investigation report). These estimates are prepared by engineers, scientists and attorneys.
Step 5: Using distributions for the probability of occurrence of each problem and estimated costs of eachproblem should it occur (both probabilities and costs to be supplied by the experts), estimate the range ofcosts for each risk reduction alternative.
Step 6: Calculate mean costs for each risk and risk reduction alternative (mean cost = 50% level ofconfidence).
Step 7: Calculate standard deviation and varying levels of confidence. Assume a log-normal distribution.
-56-
Bibliography Reference #13: Use of Decision Science Techniques in Management of Environmental Financial Risks(continued)
NOTE: The following information is not described in the article cited in the bibliography.
Woodward Clyde uses its Environmental Risk Management Information System (ERMIS), a relationaldatabase incorporating risk calculating algorithms, to describe and rank individual and aggregate risks;summarize data by site, medium, and type of problem; and calculate present costs of correction and futureliability using varying timeframes and levels of confidence.
ERMIS is an auditing database that contains records on problems and conditions at a site. For eachproblem observed, ERMIS contains cost estimates for present costs of prevention and/or correction, andfor future costs of prevention, correction, legal liability, governmental sanctions, and compensatory costs. "Future costs" are defined to be costs that would be incurred if the problem or condition is not correctednow. All costs are stored in the form of probability distributions, developed by engineers, scientists andattorneys involved in the audit.
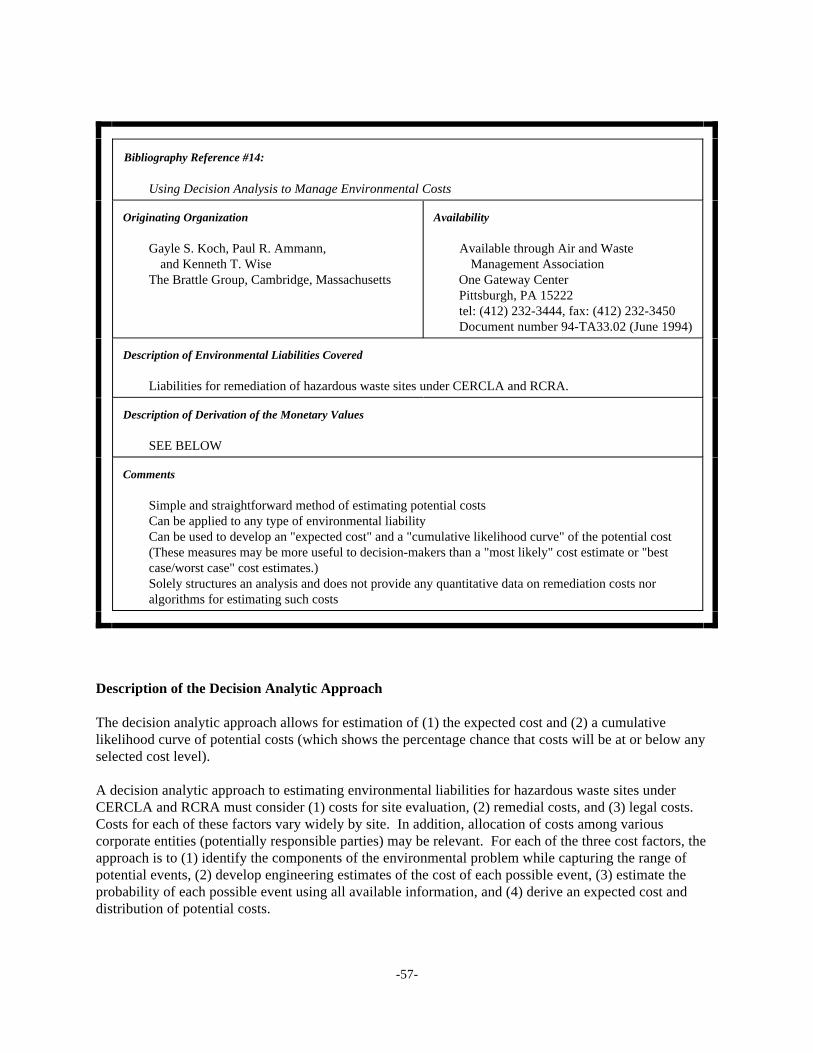
-57-
Bibliography Reference #14:
Using Decision Analysis to Manage Environmental Costs
Originating Organization Availability
Gayle S. Koch, Paul R. Ammann, Available through Air and Waste and Kenneth T. Wise Management Association
The Brattle Group, Cambridge, Massachusetts One Gateway CenterPittsburgh, PA 15222 tel: (412) 232-3444, fax: (412) 232-3450 Document number 94-TA33.02 (June 1994)
Description of Environmental Liabilities Covered
Liabilities for remediation of hazardous waste sites under CERCLA and RCRA.
Description of Derivation of the Monetary Values
SEE BELOW
Comments
Simple and straightforward method of estimating potential costsCan be applied to any type of environmental liabilityCan be used to develop an "expected cost" and a "cumulative likelihood curve" of the potential cost(These measures may be more useful to decision-makers than a "most likely" cost estimate or "bestcase/worst case" cost estimates.)Solely structures an analysis and does not provide any quantitative data on remediation costs noralgorithms for estimating such costs
Description of the Decision Analytic Approach
The decision analytic approach allows for estimation of (1) the expected cost and (2) a cumulativelikelihood curve of potential costs (which shows the percentage chance that costs will be at or below anyselected cost level).
A decision analytic approach to estimating environmental liabilities for hazardous waste sites underCERCLA and RCRA must consider (1) costs for site evaluation, (2) remedial costs, and (3) legal costs. Costs for each of these factors vary widely by site. In addition, allocation of costs among variouscorporate entities (potentially responsible parties) may be relevant. For each of the three cost factors, theapproach is to (1) identify the components of the environmental problem while capturing the range ofpotential events, (2) develop engineering estimates of the cost of each possible event, (3) estimate theprobability of each possible event using all available information, and (4) derive an expected cost anddistribution of potential costs.
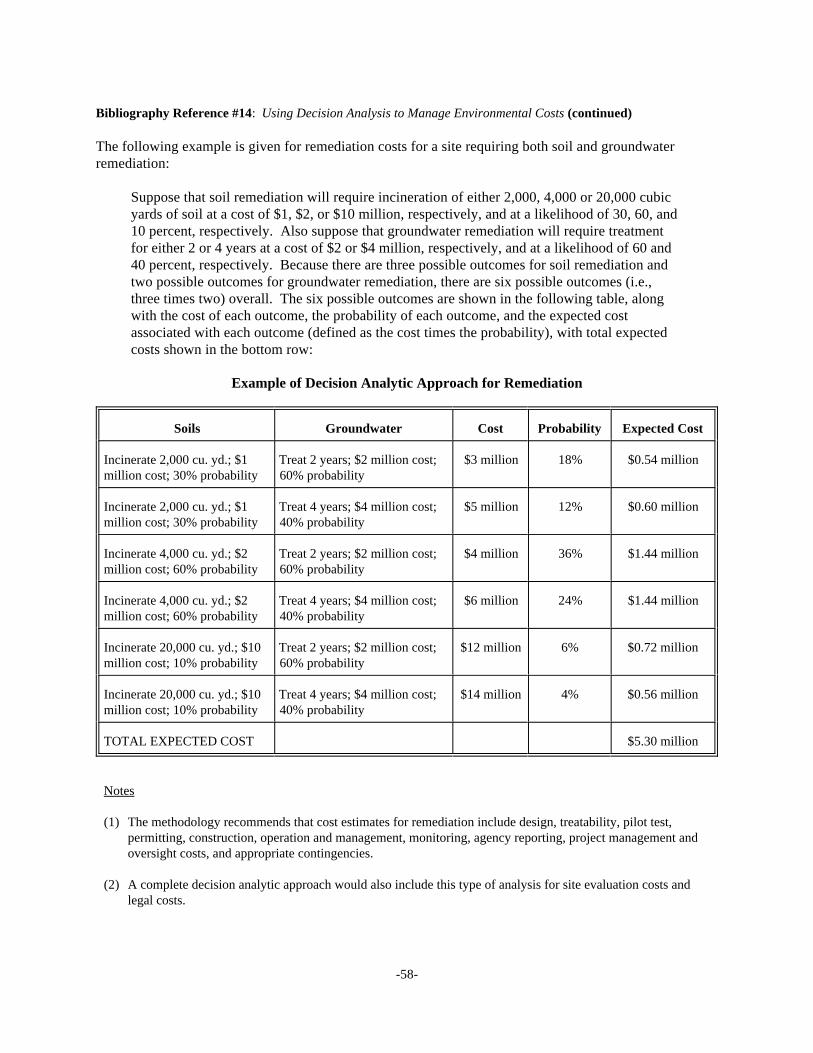
-58-
Bibliography Reference #14: Using Decision Analysis to Manage Environmental Costs (continued)
The following example is given for remediation costs for a site requiring both soil and groundwaterremediation:
Suppose that soil remediation will require incineration of either 2,000, 4,000 or 20,000 cubicyards of soil at a cost of $1, $2, or $10 million, respectively, and at a likelihood of 30, 60, and10 percent, respectively. Also suppose that groundwater remediation will require treatmentfor either 2 or 4 years at a cost of $2 or $4 million, respectively, and at a likelihood of 60 and40 percent, respectively. Because there are three possible outcomes for soil remediation andtwo possible outcomes for groundwater remediation, there are six possible outcomes (i.e.,three times two) overall. The six possible outcomes are shown in the following table, alongwith the cost of each outcome, the probability of each outcome, and the expected costassociated with each outcome (defined as the cost times the probability), with total expectedcosts shown in the bottom row:
Example of Decision Analytic Approach for Remediation
Soils Groundwater Cost Probability Expected Cost
Incinerate 2,000 cu. yd.; $1 Treat 2 years; $2 million cost; $3 million 18% $0.54 millionmillion cost; 30% probability 60% probability
Incinerate 2,000 cu. yd.; $1 Treat 4 years; $4 million cost; $5 million 12% $0.60 millionmillion cost; 30% probability 40% probability
Incinerate 4,000 cu. yd.; $2 Treat 2 years; $2 million cost; $4 million 36% $1.44 millionmillion cost; 60% probability 60% probability
Incinerate 4,000 cu. yd.; $2 Treat 4 years; $4 million cost; $6 million 24% $1.44 millionmillion cost; 60% probability 40% probability
Incinerate 20,000 cu. yd.; $10 Treat 2 years; $2 million cost; $12 million 6% $0.72 millionmillion cost; 10% probability 60% probability
Incinerate 20,000 cu. yd.; $10 Treat 4 years; $4 million cost; $14 million 4% $0.56 millionmillion cost; 10% probability 40% probability
TOTAL EXPECTED COST $5.30 million
Notes
(1) The methodology recommends that cost estimates for remediation include design, treatability, pilot test,permitting, construction, operation and management, monitoring, agency reporting, project management andoversight costs, and appropriate contingencies.
(2) A complete decision analytic approach would also include this type of analysis for site evaluation costs andlegal costs.
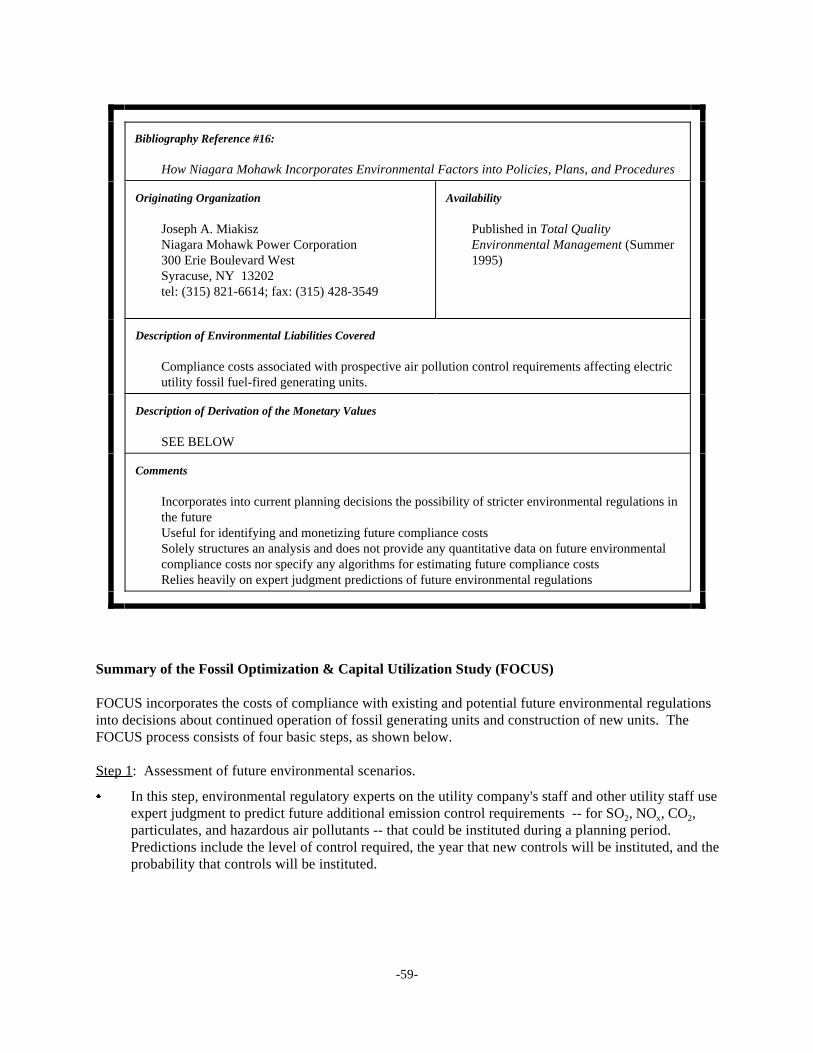
-59-
Bibliography Reference #16:
How Niagara Mohawk Incorporates Environmental Factors into Policies, Plans, and Procedures
Originating Organization Availability
Joseph A. Miakisz Published in Total QualityNiagara Mohawk Power Corporation Environmental Management (Summer300 Erie Boulevard West 1995)Syracuse, NY 13202 tel: (315) 821-6614; fax: (315) 428-3549
Description of Environmental Liabilities Covered
Compliance costs associated with prospective air pollution control requirements affecting electricutility fossil fuel-fired generating units.
Description of Derivation of the Monetary Values
SEE BELOW
Comments
Incorporates into current planning decisions the possibility of stricter environmental regulations inthe futureUseful for identifying and monetizing future compliance costsSolely structures an analysis and does not provide any quantitative data on future environmentalcompliance costs nor specify any algorithms for estimating future compliance costsRelies heavily on expert judgment predictions of future environmental regulations
Summary of the Fossil Optimization & Capital Utilization Study (FOCUS)
FOCUS incorporates the costs of compliance with existing and potential future environmental regulationsinto decisions about continued operation of fossil generating units and construction of new units. TheFOCUS process consists of four basic steps, as shown below.
Step 1: Assessment of future environmental scenarios.
& In this step, environmental regulatory experts on the utility company's staff and other utility staff useexpert judgment to predict future additional emission control requirements -- for SO , NO , CO ,2 x 2
particulates, and hazardous air pollutants -- that could be instituted during a planning period. Predictions include the level of control required, the year that new controls will be instituted, and theprobability that controls will be instituted.
-60-
Bibliography Reference #16: How Niagara Mohawk Incorporates Environmental Factors into Policies, Plans, andProcedures (continued)
& The predictions of future requirements are based on several factors, including (1) a review of recentlegislative/regulatory proposals, (2) communication with legislators and regulators, (3) participationin industry and regulatory advisory committees, and (4) monitoring of governmental trade journals. Using this information, a number of future regulatory scenarios are identified.
Step 2: Identification of least-cost options for compliance.
& This step involves a substantial amount of data collection, including financial data, system load andcapacity data, capital and expense data for fossil generating units, and environmental control costdata. Compliance costs for the future regulatory scenarios are based on information on alternativecontrol technologies from the Electric Power Research Institute, equipment vendors, and othersources, as well as on forecasts of fuel prices and emission allowances.
Step 3: Analysis of production costs and regulatory scenarios.
& This step involves using the costs associated with the selected control option, along withload/capacity data and capital and expense data, as inputs to a production cost model (PROMOD®). The model is used to determine the system production costs, marginal energy costs, and emissionsassociated with each future regulatory scenario.
& The PROMOD® results are downloaded to a spreadsheet that calculates the following informationfor each fossil generating unit: (1) production cost savings/energy value, (2) capacity value, (3)capital and expense savings associated with shutdown, (4) NO , air toxics, and SO technologyx 2
costs, (5) SO emissions reductions with shutdown, (6) revenue requirements associated with capital2
expenditures, and (7) net benefits.
& The probabilities assigned to each of the future regulatory scenarios are then used to derive"expected values" for each fossil generating unit.
Step 4: Budget review.
& For a particular generating unit that does not add value (i.e., the unit's incremental O&M costsexceed the economic benefits received by customers), fossil plant managers can explore options forreducing costs (e.g., alternative emission control strategies) and can re-run the analysis until allpotential cost reductions for the unit are exhausted. (Units projected to detract value even after costreductions become candidates for retirement on an economic basis.)
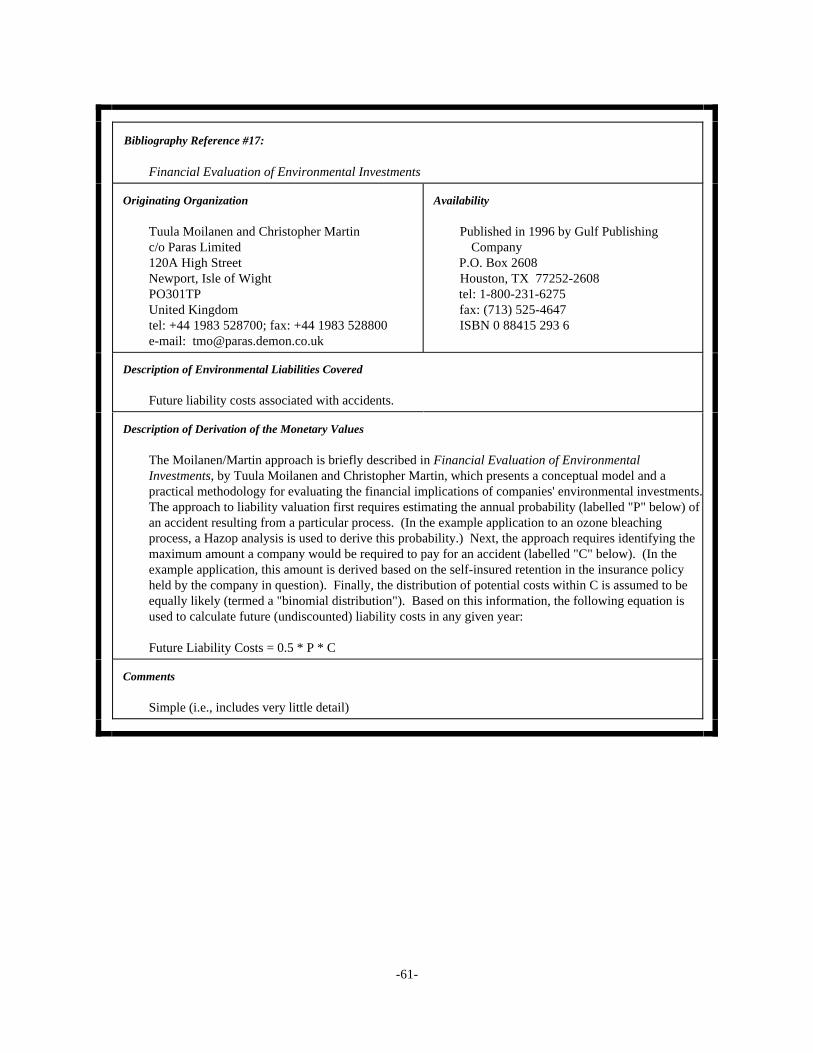
-61-
Bibliography Reference #17:
Financial Evaluation of Environmental Investments
Originating Organization Availability
Tuula Moilanen and Christopher Martin Published in 1996 by Gulf Publishing c/o Paras Limited Company120A High Street P.O. Box 2608Newport, Isle of Wight Houston, TX 77252-2608PO301TP tel: 1-800-231-6275United Kingdom fax: (713) 525-4647tel: +44 1983 528700; fax: +44 1983 528800 ISBN 0 88415 293 6e-mail: [email protected]
Description of Environmental Liabilities Covered
Future liability costs associated with accidents.
Description of Derivation of the Monetary Values
The Moilanen/Martin approach is briefly described in Financial Evaluation of EnvironmentalInvestments, by Tuula Moilanen and Christopher Martin, which presents a conceptual model and apractical methodology for evaluating the financial implications of companies' environmental investments. The approach to liability valuation first requires estimating the annual probability (labelled "P" below) ofan accident resulting from a particular process. (In the example application to an ozone bleachingprocess, a Hazop analysis is used to derive this probability.) Next, the approach requires identifying themaximum amount a company would be required to pay for an accident (labelled "C" below). (In theexample application, this amount is derived based on the self-insured retention in the insurance policyheld by the company in question). Finally, the distribution of potential costs within C is assumed to beequally likely (termed a "binomial distribution"). Based on this information, the following equation isused to calculate future (undiscounted) liability costs in any given year:
Future Liability Costs = 0.5 * P * C
Comments
Simple (i.e., includes very little detail)
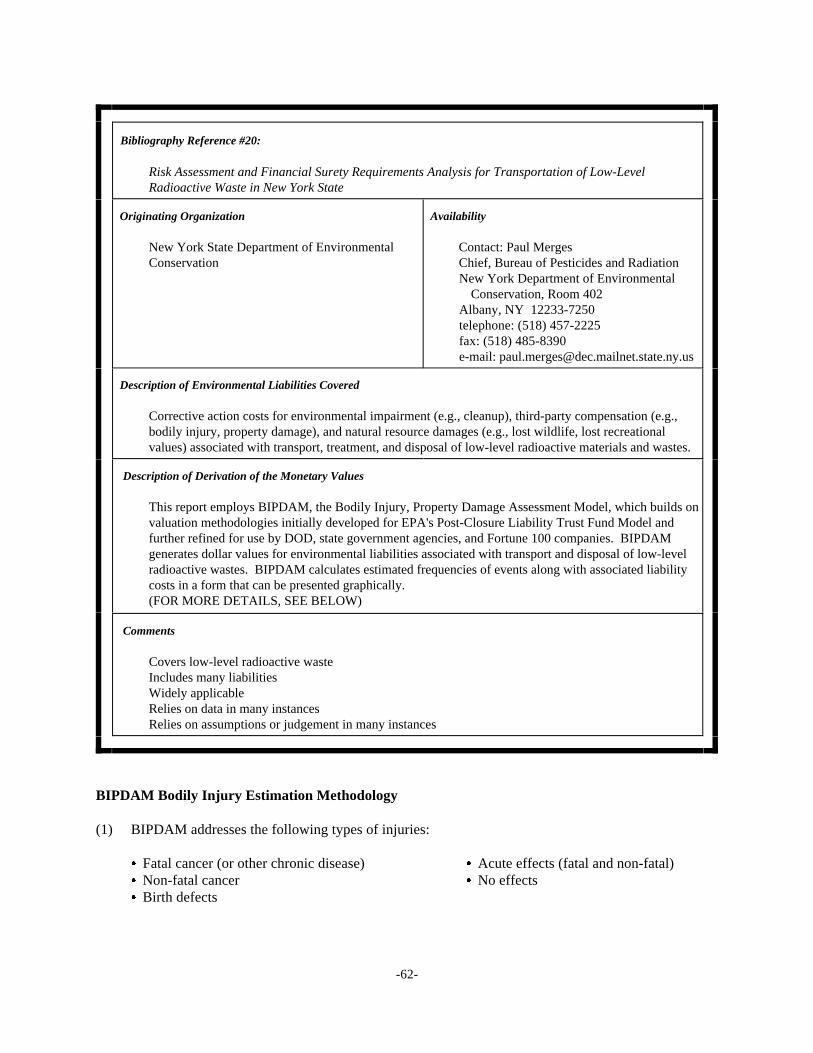
-62-
Bibliography Reference #20:
Risk Assessment and Financial Surety Requirements Analysis for Transportation of Low-LevelRadioactive Waste in New York State
Originating Organization Availability
New York State Department of Environmental Contact: Paul MergesConservation Chief, Bureau of Pesticides and Radiation
New York Department of Environmental Conservation, Room 402
Albany, NY 12233-7250telephone: (518) 457-2225fax: (518) 485-8390e-mail: [email protected]
Description of Environmental Liabilities Covered
Corrective action costs for environmental impairment (e.g., cleanup), third-party compensation (e.g.,bodily injury, property damage), and natural resource damages (e.g., lost wildlife, lost recreationalvalues) associated with transport, treatment, and disposal of low-level radioactive materials and wastes.
Description of Derivation of the Monetary Values
This report employs BIPDAM, the Bodily Injury, Property Damage Assessment Model, which builds onvaluation methodologies initially developed for EPA's Post-Closure Liability Trust Fund Model andfurther refined for use by DOD, state government agencies, and Fortune 100 companies. BIPDAMgenerates dollar values for environmental liabilities associated with transport and disposal of low-levelradioactive wastes. BIPDAM calculates estimated frequencies of events along with associated liabilitycosts in a form that can be presented graphically.(FOR MORE DETAILS, SEE BELOW)
Comments
Covers low-level radioactive wasteIncludes many liabilitiesWidely applicableRelies on data in many instancesRelies on assumptions or judgement in many instances
BIPDAM Bodily Injury Estimation Methodology
(1) BIPDAM addresses the following types of injuries:
& Fatal cancer (or other chronic disease) & Acute effects (fatal and non-fatal)& Non-fatal cancer & No effects& Birth defects
-63-
Bibliography Reference #20: Risk Assessment and Financial Surety Requirements Analysis for Transportation ofLow-Level Radioactive Waste in New York State (continued)
(2) For each type of bodily injury, BIPDAM estimates seven types of costs:
& Lost earnings due to premature death & Physical pain and emotional suffering& Loss of consortium & Emergency medical treatment& Cost of medical treatment & Medical monitoring costs& Lost earnings due to illness
(3) Estimating the unit (i.e., per person affected) costs for each type of injury
& Unit costs are incurred with some probability, which is a function of the dose level. This is equalto the probability that the exposed individual will suffer the bodily injury in question, given his orher level of exposure to low-level radioactive waste.
& Lost earnings due to premature death are based on income, which is modeled for ten age groups asa fraction of the average wages earned by an individual in each age group (from BLS data) and thenumber of years remaining in life for an individual in each age group.
& Costs for loss of consortium apply to fatal cancers and acute deaths, and are estimated as the costsincurred by the spouse of the victim for psychological counseling. Counseling is assumed to cost$100 per week. The number of years of counseling required depends on the age group of thevictim.
& Medical treatment costs apply to cancer (fatal and non-fatal) and birth defects. Costs for fatal andnon-fatal cancers are based on studies by Bloom, Knorr, and Evans (1985) and Lansky, Black, andCarns (1983). Costs for birth defects are based on the costs of special care or education ($300 perweek) over the first 20 years of life.
& Lost earnings due to illness are calculated as the product of wages that could be earned per day(dependent on the victim's age; from BLS data), the number of lost workdays per year (based on a260 yearly workdays), and the number of years of earnings lost due to illness. For cancers, thenumber of lost years of earnings is based on Bloom, Knorr, and Evans (1985) and Lansky, Black,and Carns (1983). For birth defects, the number of lost years is assumed to be the individual'sentire life (although an average birth defect is assumed to cause an individual to earn 10% lessthan an average individual over his or her lifetime). Finally, for acute illnesses, victims areassumed to lose from 6 months to one year of earnings.
& Costs for physical pain and emotional suffering are based on the costs for psychotherapy ortreatment (assumed to be $100 per week). For each injury, therapy and treatment is assumed tolast the same amount of time as is assumed for lost earnings (see above).
-64-
Bibliography Reference #20: Risk Assessment and Financial Surety Requirements Analysis for Transportation ofLow-Level Radioactive Waste in New York State (continued)
& Emergency medical treatment costs apply to individuals suffering from acute, non-fatal effects andare based on hospital treatment and rehabilitation costs for burn victims. These costs are takenfrom an ICF study and are supplemented with estimates of hospital charges (67% of treatmentcosts) from the National Cancer Institute.
& Medical monitoring costs are equal to the average annual cost of a medical examination ($175)times the number of years of examinations. The number of years of examinations depends on theparticular type of injury: 10 to 20 years for cancer (based on Klaasen, Amdur, and Doull, 1986);entire lifetime (70 years) for birth defects; and 44 to 70 years for acute effects and no effects.
BIPDAM Property Damage Estimation Methodology
(1) BIPDAM assumes that property damage can occur in four environmental "settings":
& Urban & Farmland& Suburban & Vehicles
(2) For each property setting, BIPDAM estimates three types of cost:
& Cleanup & Economic loss& Property devaluation
(3) Estimating the costs for each setting
& Cleanup costs include several components. Decontamination costs are based on an NRC report. Transport costs are based on a transportation distance of 250 miles, and disposal costs are basedon the cost of soil disposal at the Hanford disposal site in Washington State (taken from reports byICF and EPRI).
& Property devaluation is based on the lost resale value of exterior property and the lost rental ofinterior property. Property devaluation is not assumed to apply to vehicles. BIPDAM calculatesthat, for radioactive contamination, property devaluation is equal to the original value of theproperty (i.e., its resale value) times a devaluation factor (.05 in the average case and .5 in theworst case).
& Economic loss is measured as lost revenue capacity. For exterior properties (i.e., urban, suburban,and farmland settings), lost revenue capacity is equal to net revenue earned per square meter. Forvehicles, it is equal to the cost of temporarily renting a replacement vehicle ($33,300 for a smalltruck, $66,600 for a large truck, and $333,000 for a rail car). BIPDAM calculates that economicloss is equal to revenue capacity per year times a loss factor (.083 in the average case and .5 in theworst case).
-65-
Bibliography Reference #20: Risk Assessment and Financial Surety Requirements Analysis for Transportation ofLow-Level Radioactive Waste in New York State (continued)
BIPDAM Environmental Impairment Cost Estimation Methodology
(1) BIPDAM assumes that environmental impairment occurs in three environmental settings:
& Woodland & Rivers and lakes& Parks
(2) For each setting, BIPDAM estimates two types of costs:
& Cleanup & Lost recreational value
(3) Estimating the costs for each setting
& Cleanup costs for woodlands and parks are based on costs for cleaning/washing, covering, andremoval and replacement. These costs are derived from the cleanup costs used for propertydamage (see above). Cleanup costs for rivers and lakes include the cost ofdecontamination/treatment (i.e., dredging and disposal at $300 per cubic meter) and the cost ofrestoring aquatic life (estimated using the costs of restocking fish, which are based on dataindicating that hazardous waste kills approximately 3,000 fish per acre--at a cost of $.25 to $3 perfish according to the American Fisheries Society).
& Economic loss is measured as the potential lost revenue from logging of publicly-ownedwoodlands and the lost recreational value of land and water resources. The lost revenue fromlogging is computed using the formulas for lost revenue from property damage (see above). Recreational values of land and water are based on communication with the Army Corps ofEngineers. The median value of general recreation is estimated to be $4 per day per person, whilethe median value of specialized recreation is estimated to be $15.90 per day per person. Recreational loss per acre is computed as the value of recreation per day per person times thenumber of persons using a recreation area per year per acre.
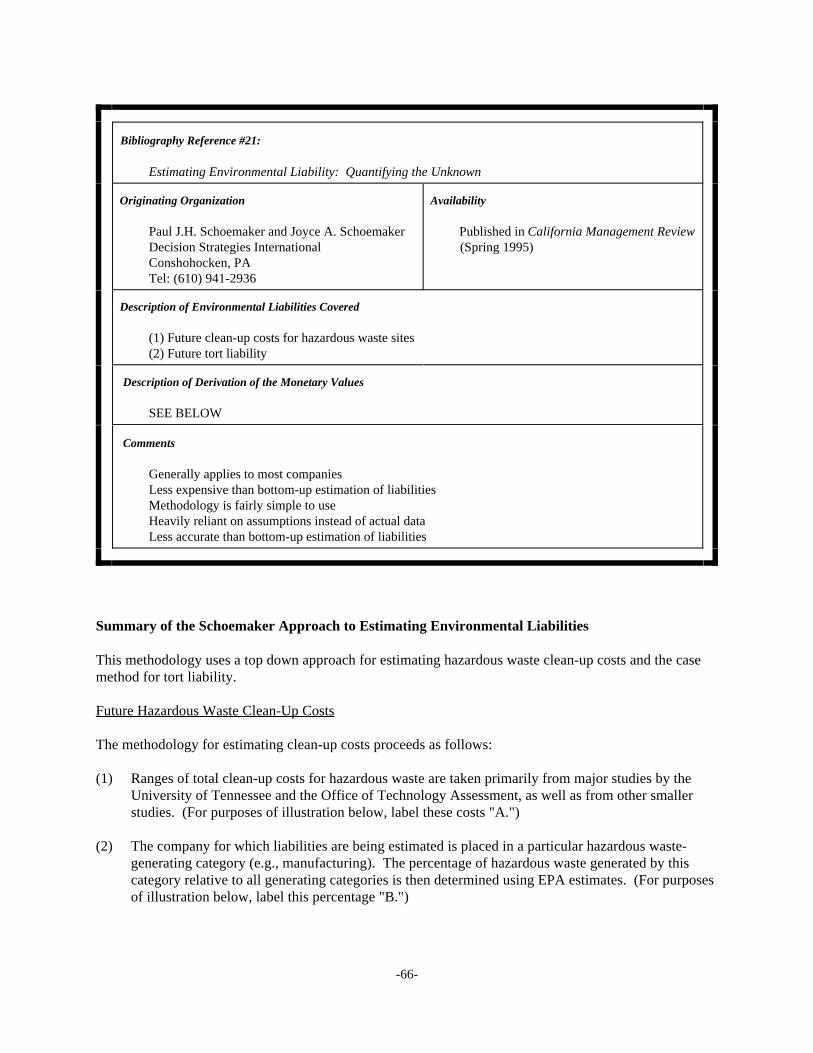
-66-
Bibliography Reference #21:
Estimating Environmental Liability: Quantifying the Unknown
Originating Organization Availability
Paul J.H. Schoemaker and Joyce A. Schoemaker Published in California Management ReviewDecision Strategies International (Spring 1995)Conshohocken, PA Tel: (610) 941-2936
Description of Environmental Liabilities Covered
(1) Future clean-up costs for hazardous waste sites(2) Future tort liability
Description of Derivation of the Monetary Values
SEE BELOW
Comments
Generally applies to most companiesLess expensive than bottom-up estimation of liabilitiesMethodology is fairly simple to useHeavily reliant on assumptions instead of actual dataLess accurate than bottom-up estimation of liabilities
Summary of the Schoemaker Approach to Estimating Environmental Liabilities
This methodology uses a top down approach for estimating hazardous waste clean-up costs and the casemethod for tort liability.
Future Hazardous Waste Clean-Up Costs
The methodology for estimating clean-up costs proceeds as follows:
(1) Ranges of total clean-up costs for hazardous waste are taken primarily from major studies by theUniversity of Tennessee and the Office of Technology Assessment, as well as from other smallerstudies. (For purposes of illustration below, label these costs "A.")
(2) The company for which liabilities are being estimated is placed in a particular hazardous waste-generating category (e.g., manufacturing). The percentage of hazardous waste generated by thiscategory relative to all generating categories is then determined using EPA estimates. (For purposesof illustration below, label this percentage "B.")
-67-
Bibliography Reference #21: Estimating Environmental Liability: Quantifying the Unknown (continued)
(3) Costs from (1) are apportioned to the company in question. This is done by first sizing up thecompany's particular industry "by the total dollar value of its activities in the U.S. manufacturingsector and percent contribution of its toxic chemicals released (into air or water) and transferred off-site for treatment and disposal." (For purposes of illustration below, label this percentage "C.") Next, the company's share of its particular industry is determined using historical trends. (Forpurposes of illustration below, label this percentage "D.")
(4) Total costs from (1) are multiplied by the weighting factors in (2) and (3) to produce a top-downestimate of the company's potential future hazardous waste clean-up liabilities:
Future clean-up costs = A x B x C x D
(5) Costs are discounted. A discount rate of 5% is used if the cost data obtained in (1) do not includeinflation. A discount rate of 10% is used if the cost data obtained in (1) already include inflationfactors.
Future Tort Liability
The methodology for estimating tort liability proceeds as follows:
(1) The company's potential hazards are identified, along with who is affected by these hazards (e.g.,consumers, employees, or the community).
(2) Chemicals having the greatest potential for bringing on "mega-lawsuits" or "mass toxic tort" areidentified, based on (a) company use of the chemical, (b) scientific knowledge of the chemical'seffects on human health, and (c) community awareness of the chemical.
(3) Two different methodologies are presented for estimating tort liability:
Method 1
For chemicals identified in (2), past and present lawsuits are examined to obtain estimates ofpotential dollar amounts for tort liability. These estimates are then weighted by an "industryfraction" (which reflects the likelihood that the company's industry will incur a lawsuit) and a"company fraction" (which reflects the company's share of the chemicals within its industry). Finally, costs are discounted at 5%.
Company Liability (discounted) = Lawsuit Amount x Industry Fraction x Company Fraction
Method 2
Each chemical identified in (2) is compared to a "benchmark" chemical -- one that has producedlarge numbers of product liability and tort cases to date (such as asbestos) -- in order to estimate thepercentage chance that each chemical identified in (2) will turn into a similar type of problem.
-68-
Bibliography Reference #21: Estimating Environmental Liability: Quantifying the Unknown (continued)
These comparisons are used to assess the risks of major tort liability concerning the identifiedchemicals, and to apportion a percentage of those risks to the company.
Several probabilities are estimated using various studies and tests,:
(a) The probability that, within the next 30 years, a cancer or other serious health outcome will bespecifically linked to exposure to a given chemical (for purposes of illustration below, label thisprobability "E");
(b) The probability of a conclusive causal link being established within 30 years between a givenchemical and human disease, assuming that (a) is met (for purposes of illustration below, labelthis probability "F");
(c) The probability that the condition of long latency will be met in the case of a given chemical,assuming that (a) and (b) are met (for purposes of illustration below, label this probability "G");
(d) The probability that large numbers of identifiable individuals, such as workers, have beenexposed to the chemical (for purposes of illustration below, label this probability "H"); and
(e) The probability that there will be significant and systematic suppression of evidence by industryconcerning the chemical's ill-effects, relative to the "benchmark" chemical (for purposes ofillustration below, label this probability "I").
These five probabilities are then multiplied together to determine the chance that the chemical willturn into a "liability nightmare":
Probability of liability = E x F x G x H x I
Finally, tort liability for the company is determined by multiplying lawsuit amounts associated withthe "benchmark" chemical by the probability of liability and by the company share described inMethod 1:
Company Liability = Benchmark Lawsuit Amount x Probability of Liability x Company Share
Total Liabilities
Using the methodologies described above produces two ranges of costs, one for clean-up costs and one fortort liability. These ranges are then combined using statistical methods to yield a range for total liabilities.
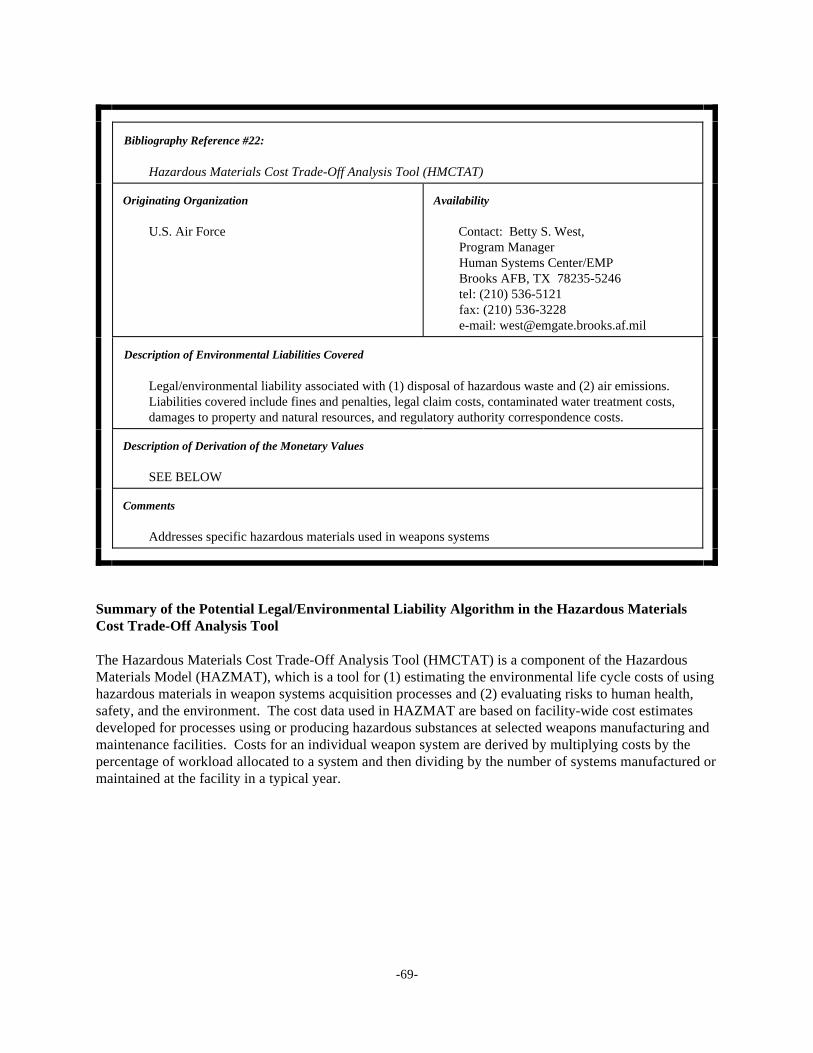
-69-
Bibliography Reference #22:
Hazardous Materials Cost Trade-Off Analysis Tool (HMCTAT)
Originating Organization Availability
U.S. Air Force Contact: Betty S. West, Program ManagerHuman Systems Center/EMP Brooks AFB, TX 78235-5246tel: (210) 536-5121 fax: (210) 536-3228e-mail: [email protected]
Description of Environmental Liabilities Covered
Legal/environmental liability associated with (1) disposal of hazardous waste and (2) air emissions. Liabilities covered include fines and penalties, legal claim costs, contaminated water treatment costs,damages to property and natural resources, and regulatory authority correspondence costs.
Description of Derivation of the Monetary Values
SEE BELOW
Comments
Addresses specific hazardous materials used in weapons systems
Summary of the Potential Legal/Environmental Liability Algorithm in the Hazardous MaterialsCost Trade-Off Analysis Tool
The Hazardous Materials Cost Trade-Off Analysis Tool (HMCTAT) is a component of the HazardousMaterials Model (HAZMAT), which is a tool for (1) estimating the environmental life cycle costs of usinghazardous materials in weapon systems acquisition processes and (2) evaluating risks to human health,safety, and the environment. The cost data used in HAZMAT are based on facility-wide cost estimatesdeveloped for processes using or producing hazardous substances at selected weapons manufacturing andmaintenance facilities. Costs for an individual weapon system are derived by multiplying costs by thepercentage of workload allocated to a system and then dividing by the number of systems manufactured ormaintained at the facility in a typical year.
-70-
Bibliography Reference #22: Hazardous Materials Cost Trade-Off Analysis Tool (HMCTAT) (continued)
The HMCTAT component of HAZMAT considers the following cost elements relating to use orproduction of hazardous materials:
& Procurement & Potential Legal/Environmental Liability& Transportation & Medical& Handling & Facilities& Management & Support Equipment& Training & Emergency Response& Personal Protection & Disposal
The Potential Legal/Environmental Liability algorithm in HMCTAT covers potential liability forviolations of Federal environmental acts or laws (with a special provision for violations of the Clean AirAct). The algorithm consists of two sub-elements, one addressing liability associated with contractordisposal of hazardous waste and one addressing airborne contaminants regulated under the Clean Air Act. Potential legal/environmental liability is estimated using the following general equation:
Potential Legal Cost = Contractor + AirEnv where
Contractor = cost of potential legal/environmental liability due to contractor disposalAirEnv = cost of potential legal/environmental liability due to air emissions
The "Contractor" variable in the general equation is a function of the following elements:
& Surface area of the subsystem of interest& Surface area of the reference subsystem in HMCTAT& Quantity of the hazardous substance used per year in the selected process& Percentage of hazardous materials disposed through a contractor& Factor reflecting dilution or concentration of the hazardous substance in the selected process& Cost per pound for potential legal/environmental liability for hazardous waste disposed of through
a contractor (see Notes below)& Probability of groundwater contamination due to disposal of hazardous materials& Water treatment cost (constant value of $108.4 per pound of hazardous materials; see Notes
below)
The "AirEnv" variable in the general equation is a function of the following elements:
& Surface area of the subsystem of interest& Surface area of the reference subsystem in HMCTAT& Quantity of the hazardous substance used per year in the selected process& Percentage of hazardous materials/waste released to the air& Cost per pound for potential legal/environmental liability for hazardous material/waste released
into the air (see Notes below)
-71-
Bibliography Reference #22: Hazardous Materials Cost Trade-Off Analysis Tool (HMCTAT) (continued)
Notes
(1) The liability cost per pound in the Potential Legal/Environmental Liability algorithm is derivedusing information obtained from Westlaw on court cases and settlements, information from the AirForce Center for Environmental Excellence, and a 1989 EPA study. The liability cost per pound forhazardous materials released into the air includes fines and penalties only. The liability cost perpound for hazardous waste disposed of through a contractor includes the following liabilities:
& Fines and penalties;& Settlement of tort claims (including lawyer preparation time, witness time, and court costs);& Real property damage;& Natural resource damages;& Contaminated water treatment costs; and& Regulatory authority correspondence costs (including environmental assessment fees, permits, and
licenses).
(2) The $108.4 value used for water treatment (i.e., water contaminated by a leaking landfill) costs isderived using the following equation:
Water Treatment Cost = Factor * (Cost + (Maint * Length)) where
Factor = 1/500,000 = ratio of 1 pound of hazardous material mixed with 500,000 pounds of waterCost = $10,200,000 = cost of water treatment equipmentMaint = $2,200,000 = annual maintenance cost to operate waste treatment equipmentLength = 20 years = length of contaminated water treatment operations
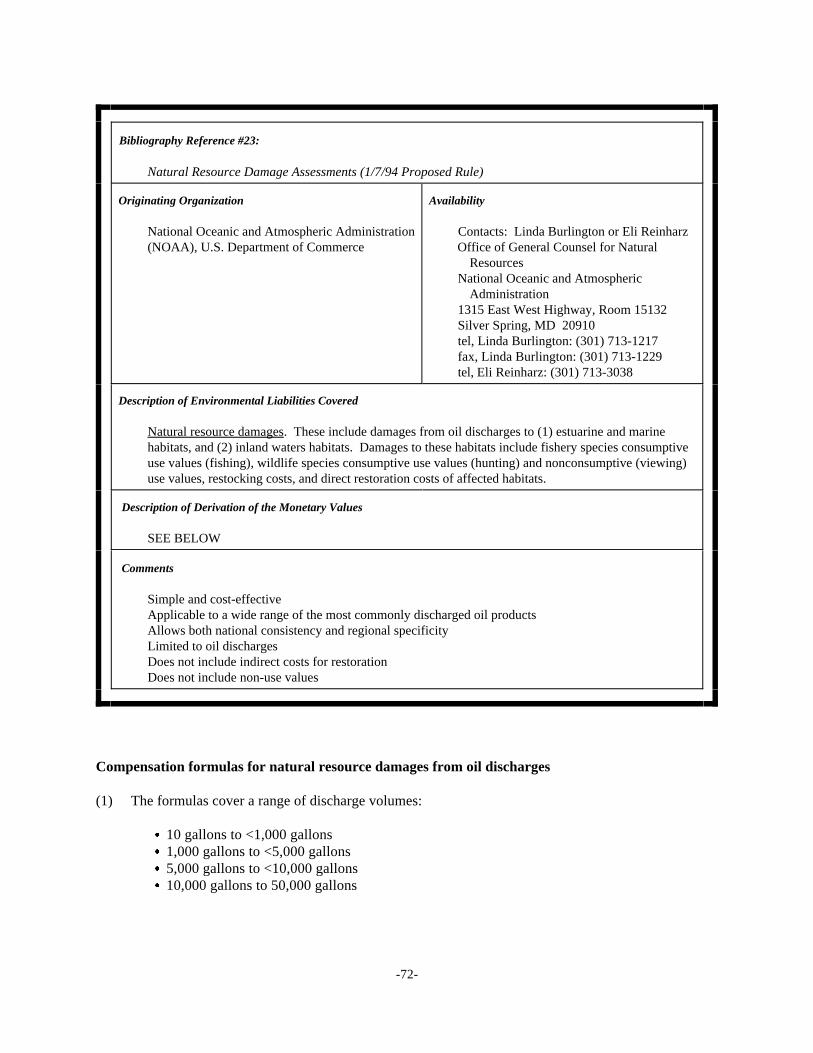
-72-
Bibliography Reference #23:
Natural Resource Damage Assessments (1/7/94 Proposed Rule)
Originating Organization Availability
National Oceanic and Atmospheric Administration Contacts: Linda Burlington or Eli Reinharz(NOAA), U.S. Department of Commerce Office of General Counsel for Natural
ResourcesNational Oceanic and Atmospheric
Administration 1315 East West Highway, Room 15132Silver Spring, MD 20910tel, Linda Burlington: (301) 713-1217fax, Linda Burlington: (301) 713-1229tel, Eli Reinharz: (301) 713-3038
Description of Environmental Liabilities Covered
Natural resource damages. These include damages from oil discharges to (1) estuarine and marinehabitats, and (2) inland waters habitats. Damages to these habitats include fishery species consumptiveuse values (fishing), wildlife species consumptive use values (hunting) and nonconsumptive (viewing)use values, restocking costs, and direct restoration costs of affected habitats.
Description of Derivation of the Monetary Values
SEE BELOW
Comments
Simple and cost-effectiveApplicable to a wide range of the most commonly discharged oil productsAllows both national consistency and regional specificityLimited to oil dischargesDoes not include indirect costs for restorationDoes not include non-use values
Compensation formulas for natural resource damages from oil discharges
(1) The formulas cover a range of discharge volumes:
& 10 gallons to <1,000 gallons& 1,000 gallons to <5,000 gallons& 5,000 gallons to <10,000 gallons& 10,000 gallons to 50,000 gallons
-73-
Bibliography Reference #23: Natural Resource Damage Assessments (continued)
& The 10-gallon lower bound was statistically determined by NOAA based on evaluations ofthousands of scenarios involving very small spills. For discharges above 50,000 gallons,experience indicates that the resulting injuries would be more appropriately addressed by adifferent methodology (e.g., Type A computer model, Expedited Damage Assessment, orComprehensive Damage Assessment).
(2) The generic damage formula used in this approach is:
Damages (in $) = (m x VOL) + b, where
& m is a multiplier& VOL is the amount of oil discharged (see Notes below)& b is an additional dollar figure
& The generic damage formula represents a linear interpolation of the damage curve shown by theresults of simulated discharge scenarios. These scenario results were derived from modelsdeveloped by the Department of the Interior (DOI). The linear interpolation was developed bybreaking down the scenarios into the four discharge volume categories listed above.
& The specific damage formula for estuarine and marine habitats was developed using a DOI modelfor coastal and marine environments. The formula is based upon various coastal provinces, eachwith a representative habitat type, providing a total of 55 province/habitat combinations. Each ofthese combinations has an associated set of damage estimates based on the four seasons (Winter =January 1 to March 31, Spring = April 1 to June 30, Summer = July 1 to September 30, Fall =October 1 to December 31), five representative oils (heavy crude oil, light crude oil, No. 2 fuel oil,diesel, gasoline), and five possible discharge sizes, for a total of 5,500 damage estimate ranges(i.e., 55 province/habitat combinations x 100 combinations of season, type of oil, and dischargesize). Each of the 5,500 damage scenarios includes certain predetermined environmental and otherconditions. The results of these scenarios form the basis for a set of "compensation tables," whichspecify the values of "m" and "b" to be used in a given application of the formula. The parameters"m" and "b" are used to compute the dollar figure for damages based on linear interpolation fromthe range of discharge volumes listed in the compensation tables.
& The specific damage formula for inland waters habitats was developed using a DOI model for theGreat Lakes Environment. The formula addresses Great Lakes habitats, fast and slow flowingrivers, streams, brooks, lakes, ponds, and wetlands. In this case, there are a total of 100province/habitat combinations. Each of these combinations has an associated set of damageestimates based on the four seasons (see above), five representative oils (see above), and fivepossible discharge sizes, for a total of 10,000 damage estimate ranges (i.e., 100 province/habitatcombinations x 100 combinations of season, type of oil, and discharge size). Each of the 10,000damage scenarios includes certain predetermined environmental and other conditions. The resultsof these scenarios form the basis for a set of "compensation tables," which specify the values of"m" and "b" to be used in a given application of the formula. The parameters "m" and
-74-
Bibliography Reference #23: Natural Resource Damage Assessments (continued)
"b" are used to compute the dollar figure for damages based on linear interpolation from the range ofdischarge volumes listed in the compensation tables.
Notes
& In calculating damages to estuarine and marine habitats, the volume of oil discharged (VOL) isequal to the actual amount discharged minus the volume of oil cleaned up from the water within24 hours of the onset of the discharge. Oil cleaned up from shorelines is not subtracted since themajority of shore impacts are immediate.
& In calculating damages to inland waters habitats, the volume of oil discharged (VOL) is equal tothe actual amount discharged minus the volume of oil cleaned up from the water (in specifiedlarge rivers and lakes) within 24 hours of the onset of the discharge. Oil cleaned up fromshorelines and other inland waters is not subtracted since the majority of impacts in these areas areimmediate.
& While not calculated in the formulas, damages from beach and/or shoreline closure, as well asboating closure and lost recreational boating opportunities, can be determined using externalNOAA guidance materials.
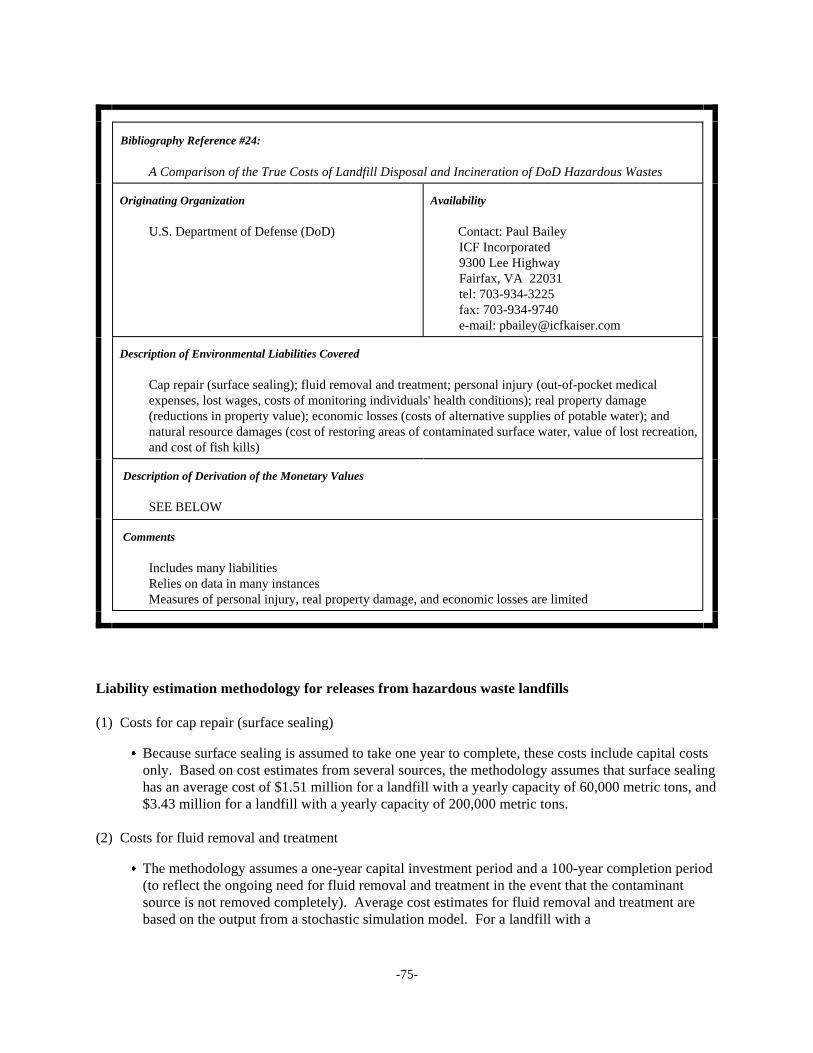
-75-
Bibliography Reference #24:
A Comparison of the True Costs of Landfill Disposal and Incineration of DoD Hazardous Wastes
Originating Organization Availability
U.S. Department of Defense (DoD) Contact: Paul Bailey ICF Incorporated9300 Lee HighwayFairfax, VA 22031tel: 703-934-3225 fax: 703-934-9740 e-mail: [email protected]
Description of Environmental Liabilities Covered
Cap repair (surface sealing); fluid removal and treatment; personal injury (out-of-pocket medicalexpenses, lost wages, costs of monitoring individuals' health conditions); real property damage(reductions in property value); economic losses (costs of alternative supplies of potable water); andnatural resource damages (cost of restoring areas of contaminated surface water, value of lost recreation,and cost of fish kills)
Description of Derivation of the Monetary Values
SEE BELOW
Comments
Includes many liabilitiesRelies on data in many instancesMeasures of personal injury, real property damage, and economic losses are limited
Liability estimation methodology for releases from hazardous waste landfills
(1) Costs for cap repair (surface sealing)
& Because surface sealing is assumed to take one year to complete, these costs include capital costsonly. Based on cost estimates from several sources, the methodology assumes that surface sealinghas an average cost of $1.51 million for a landfill with a yearly capacity of 60,000 metric tons, and$3.43 million for a landfill with a yearly capacity of 200,000 metric tons.
(2) Costs for fluid removal and treatment
& The methodology assumes a one-year capital investment period and a 100-year completion period(to reflect the ongoing need for fluid removal and treatment in the event that the contaminantsource is not removed completely). Average cost estimates for fluid removal and treatment arebased on the output from a stochastic simulation model. For a landfill with a
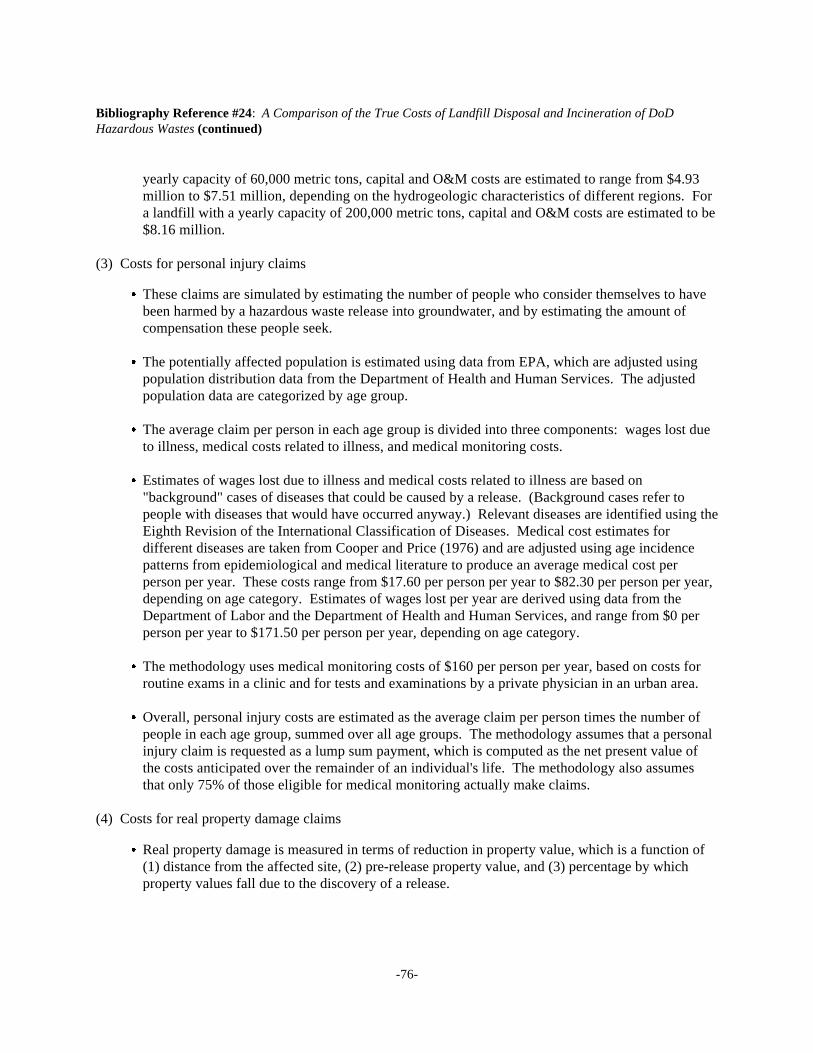
-76-
Bibliography Reference #24: A Comparison of the True Costs of Landfill Disposal and Incineration of DoDHazardous Wastes (continued)
yearly capacity of 60,000 metric tons, capital and O&M costs are estimated to range from $4.93million to $7.51 million, depending on the hydrogeologic characteristics of different regions. Fora landfill with a yearly capacity of 200,000 metric tons, capital and O&M costs are estimated to be$8.16 million.
(3) Costs for personal injury claims
& These claims are simulated by estimating the number of people who consider themselves to havebeen harmed by a hazardous waste release into groundwater, and by estimating the amount ofcompensation these people seek.
& The potentially affected population is estimated using data from EPA, which are adjusted usingpopulation distribution data from the Department of Health and Human Services. The adjustedpopulation data are categorized by age group.
& The average claim per person in each age group is divided into three components: wages lost dueto illness, medical costs related to illness, and medical monitoring costs.
& Estimates of wages lost due to illness and medical costs related to illness are based on"background" cases of diseases that could be caused by a release. (Background cases refer topeople with diseases that would have occurred anyway.) Relevant diseases are identified using theEighth Revision of the International Classification of Diseases. Medical cost estimates fordifferent diseases are taken from Cooper and Price (1976) and are adjusted using age incidencepatterns from epidemiological and medical literature to produce an average medical cost perperson per year. These costs range from $17.60 per person per year to $82.30 per person per year,depending on age category. Estimates of wages lost per year are derived using data from theDepartment of Labor and the Department of Health and Human Services, and range from $0 perperson per year to $171.50 per person per year, depending on age category.
& The methodology uses medical monitoring costs of $160 per person per year, based on costs forroutine exams in a clinic and for tests and examinations by a private physician in an urban area.
& Overall, personal injury costs are estimated as the average claim per person times the number ofpeople in each age group, summed over all age groups. The methodology assumes that a personalinjury claim is requested as a lump sum payment, which is computed as the net present value ofthe costs anticipated over the remainder of an individual's life. The methodology also assumesthat only 75% of those eligible for medical monitoring actually make claims.
(4) Costs for real property damage claims
& Real property damage is measured in terms of reduction in property value, which is a function of(1) distance from the affected site, (2) pre-release property value, and (3) percentage by whichproperty values fall due to the discovery of a release.
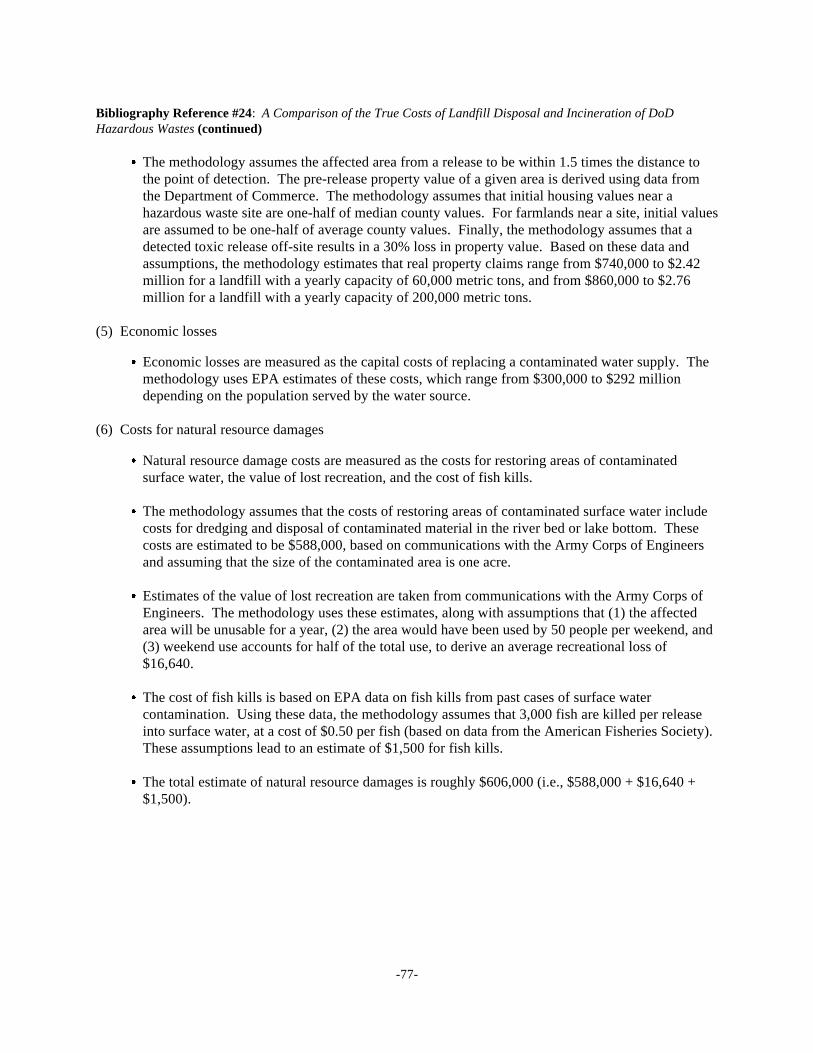
-77-
Bibliography Reference #24: A Comparison of the True Costs of Landfill Disposal and Incineration of DoDHazardous Wastes (continued)
& The methodology assumes the affected area from a release to be within 1.5 times the distance tothe point of detection. The pre-release property value of a given area is derived using data fromthe Department of Commerce. The methodology assumes that initial housing values near ahazardous waste site are one-half of median county values. For farmlands near a site, initial valuesare assumed to be one-half of average county values. Finally, the methodology assumes that adetected toxic release off-site results in a 30% loss in property value. Based on these data andassumptions, the methodology estimates that real property claims range from $740,000 to $2.42million for a landfill with a yearly capacity of 60,000 metric tons, and from $860,000 to $2.76million for a landfill with a yearly capacity of 200,000 metric tons.
(5) Economic losses
& Economic losses are measured as the capital costs of replacing a contaminated water supply. Themethodology uses EPA estimates of these costs, which range from $300,000 to $292 milliondepending on the population served by the water source.
(6) Costs for natural resource damages
& Natural resource damage costs are measured as the costs for restoring areas of contaminatedsurface water, the value of lost recreation, and the cost of fish kills.
& The methodology assumes that the costs of restoring areas of contaminated surface water includecosts for dredging and disposal of contaminated material in the river bed or lake bottom. Thesecosts are estimated to be $588,000, based on communications with the Army Corps of Engineersand assuming that the size of the contaminated area is one acre.
& Estimates of the value of lost recreation are taken from communications with the Army Corps ofEngineers. The methodology uses these estimates, along with assumptions that (1) the affectedarea will be unusable for a year, (2) the area would have been used by 50 people per weekend, and(3) weekend use accounts for half of the total use, to derive an average recreational loss of$16,640.
& The cost of fish kills is based on EPA data on fish kills from past cases of surface watercontamination. Using these data, the methodology assumes that 3,000 fish are killed per releaseinto surface water, at a cost of $0.50 per fish (based on data from the American Fisheries Society). These assumptions lead to an estimate of $1,500 for fish kills.
& The total estimate of natural resource damages is roughly $606,000 (i.e., $588,000 + $16,640 +$1,500).
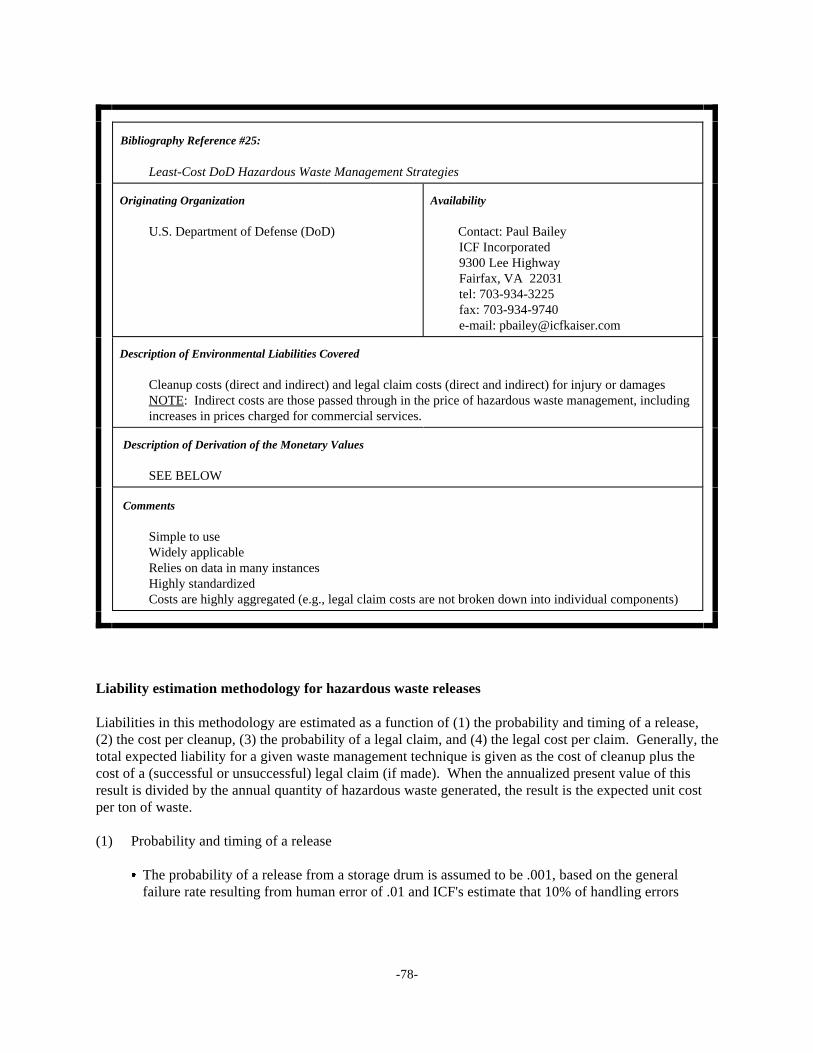
-78-
Bibliography Reference #25:
Least-Cost DoD Hazardous Waste Management Strategies
Originating Organization Availability
U.S. Department of Defense (DoD) Contact: Paul Bailey ICF Incorporated9300 Lee HighwayFairfax, VA 22031tel: 703-934-3225 fax: 703-934-9740 e-mail: [email protected]
Description of Environmental Liabilities Covered
Cleanup costs (direct and indirect) and legal claim costs (direct and indirect) for injury or damagesNOTE: Indirect costs are those passed through in the price of hazardous waste management, includingincreases in prices charged for commercial services.
Description of Derivation of the Monetary Values
SEE BELOW
Comments
Simple to useWidely applicableRelies on data in many instancesHighly standardizedCosts are highly aggregated (e.g., legal claim costs are not broken down into individual components)
Liability estimation methodology for hazardous waste releases
Liabilities in this methodology are estimated as a function of (1) the probability and timing of a release,(2) the cost per cleanup, (3) the probability of a legal claim, and (4) the legal cost per claim. Generally, thetotal expected liability for a given waste management technique is given as the cost of cleanup plus thecost of a (successful or unsuccessful) legal claim (if made). When the annualized present value of thisresult is divided by the annual quantity of hazardous waste generated, the result is the expected unit costper ton of waste.
(1) Probability and timing of a release
& The probability of a release from a storage drum is assumed to be .001, based on the generalfailure rate resulting from human error of .01 and ICF's estimate that 10% of handling errors
-79-
Bibliography Reference #25: Least-Cost DoD Hazardous Waste Management Strategies (continued)
result in releases. Because a release incident may happen any time, a drum release is assumed tohappen in the same year the waste is generated (i.e., year 0).
& The probability of a release from a storage tank is assumed to be .0116, based on data from areport prepared for EPA on tank failure. Releases and cleanup are assumed to occur in the 10thyear after the tank has begun operating.&The probability of a landfill leaking is assumed to be 1,based on ICF's analysis for EPA. Also based on this analysis, the methodology assumes that arelease occurs 17 years after a landfill opens.
& A release from an injection well is assumed to occur with probability .075, based on a surveyconducted for the Underground Injection Practices Council. This survey also indicates that arelease may occur 17 years after the well has begun operating. ICF estimated that the cleanup ofthis release would begin 3 years later.
& Based on an ICF report for EPA, the probability of a release per trip is assumed to be .000042 fortransportation of wastes to a regional facility. For transportation of wastes to a commercialfacility, this probability is assumed to be .00028. Because a release incident may happen any time,a release during transportation is assumed to happen in the same year the waste is generated (i.e.,year 0).
(2) Cleanup costs
& Cleanup costs can be direct or indirect. All costs for on-site and regional practices (e.g., drumstorage and tank storage) are assumed to be direct. Costs for releases during transportation areassumed to be indirect. Off-site practices (e.g., landfilling and deep-well injection) are assumed tolead to both direct and indirect costs. The probabilities that costs are direct or indirect are basedon EPA model results and an ICF report of firms in the commercial hazardous waste managementindustry.
& The methodology uses an ICF estimate of $500 for the cleanup of a drum release. This results inan expected unit cost of $3.26 per ton of hazardous waste stored in drums.
& Based on ICF calculations, the methodology assumes that a release from an on-site storage tankcosts an average of $10,100 to clean up. Expected unit costs are $6.68 per ton or $32.57 per ton,depending on how long the waste is stored (less than or greater than 90 days).
& Based on ICF calculations, the methodology assumes that a release from a regional storage tankcosts an average of $52,800 to clean up. Expected unit costs are $6.02 per ton or $20.31 per ton,depending on how long the waste is stored (less than or greater than 90 days).
& Based on an EPA study, the methodology assumes that the average cleanup cost for a landfillrelease is $11,782,000, which leads to an expected direct unit cost of $22.06 per ton and anexpected indirect unit cost of $4.12 per ton.
-80-
Bibliography Reference #25: Least-Cost DoD Hazardous Waste Management Strategies (continued)
& In the absence of data of deep-well injection, the methodology assumes that the average cleanupcost for an injection well release is equivalent to that for a landfill release -- $11,782,000. Basedon this figure, expected direct unit costs are $6.27 per ton, and expected indirect unit costs are$0.29 per ton.
& Based on a report by the Office of Technology Assessment, the methodology assumes that theaverage cleanup cost for a release during transportation is $20,000. Expected indirect unit costsrange from $0.03 per ton or $0.28 per ton, depending on the type of truck (flat bed or tanker) andthe waste's destination (regional or commercial facility).
(3) Probability of a legal claim
& Based on an ICF analysis of releases from solid waste management units, the methodologyassumes that, for all practices except drum storage, the probability of a claim given a release is .10. Drum releases are not assumed to result in legal claims because they are likely to be cleaned upquickly before contaminants can migrate off-site.
(4) Legal claim costs
& Legal claim costs include payments to third parties for damages, as well as defense costs.
& Legal claim costs can be direct or indirect. All legal claim costs for on-site and regional practices(e.g., tank storage) are assumed to be direct, and are assumed to be incurred in 20% of claims. Off-site practices (e.g., landfilling, deep-well injection, and transportation) are assumed to lead toboth direct and indirect costs. Several legal scenarios are possible in the case of off-site practices;thus, several probabilities are attached to incurring these costs. These probabilities are based ondiscussions with a lawyer, as well as assumption.
& The methodology assumes that a release from an on-site storage tank has an average legal claimcost of $1,000,000, which is consistent with liability coverage limits under RCRA and issupported by an EPA investigation of the liability costs of USTs. Expected unit costs are $0.25per ton or $0.85 per ton, depending on how long the waste is stored (less than or greater than 90days).
& The methodology assumes that a release from a regional storage tank has an average legal claimcost of $1,000,000, which is consistent with liability coverage limits under RCRA and issupported by an EPA investigation of the liability costs of USTs. Expected unit costs are $0.04per ton or $0.13 per ton, depending on how long the waste is stored (less than or greater than 90days).
& The methodology assumes that the average legal claim cost for a landfill release is $3,000,000,which is consistent with liability coverage limits under RCRA. Based on this figure, expecteddirect unit costs are $0.09 per ton and expected indirect unit costs are $0.04 per ton.
-81-
Bibliography Reference #25: Least-Cost DoD Hazardous Waste Management Strategies (continued)
& The methodology assumes that the average legal claim cost for an injection well release is$3,000,000, which is consistent with liability coverage limits under RCRA. Based on this figure,expected direct unit costs are $0.02 per ton and expected indirect unit costs are zero.
& The methodology assumes that the average legal claim cost for a release during transportation is$1,000,000, based on the assumptions for storage tanks. Expected direct unit costs range from$0.06 per ton to $0.55 per ton, depending on the type of truck (flat bed or tanker) and the waste'sdestination (regional or commercial facility). Expected indirect unit costs range from $0.46 perton to $4.02 per ton, depending on the type of truck and the waste's destination.
& Average legal defense costs are assumed to $60,000 per claim, based on ICF's review of legalcosts associated with hazardous waste litigation.
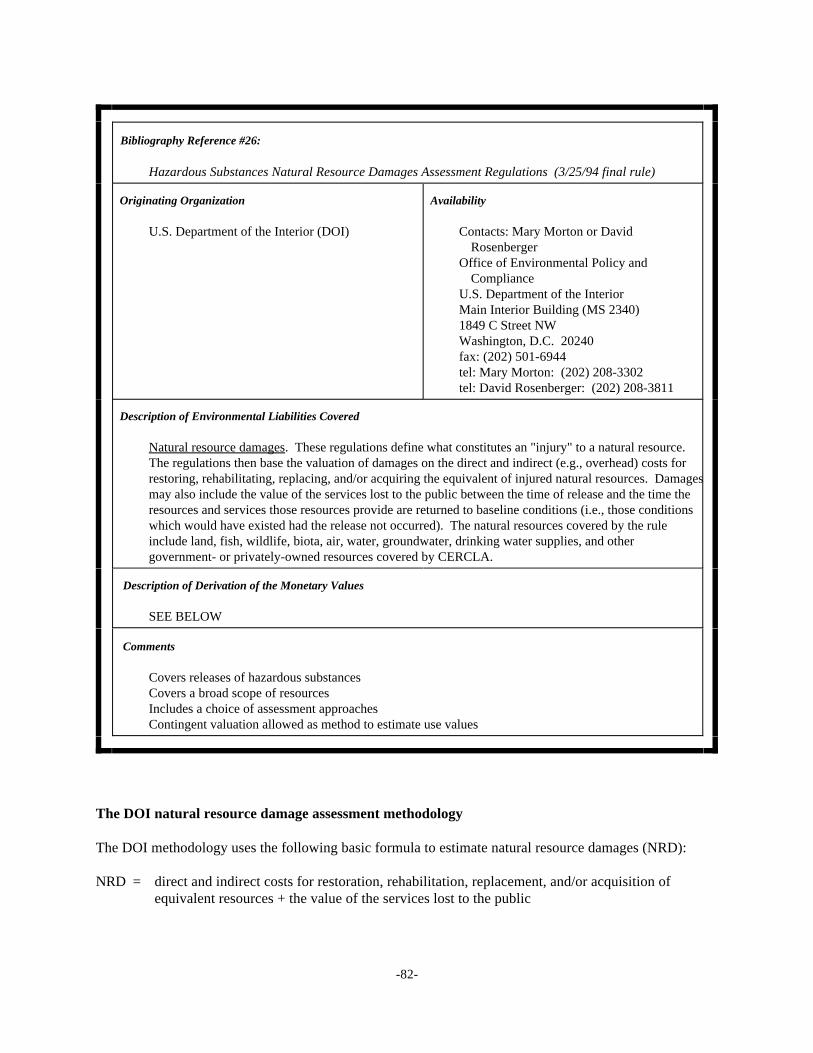
-82-
Bibliography Reference #26:
Hazardous Substances Natural Resource Damages Assessment Regulations (3/25/94 final rule)
Originating Organization Availability
U.S. Department of the Interior (DOI) Contacts: Mary Morton or David Rosenberger
Office of Environmental Policy and Compliance
U.S. Department of the InteriorMain Interior Building (MS 2340)1849 C Street NWWashington, D.C. 20240 fax: (202) 501-6944tel: Mary Morton: (202) 208-3302tel: David Rosenberger: (202) 208-3811
Description of Environmental Liabilities Covered
Natural resource damages. These regulations define what constitutes an "injury" to a natural resource. The regulations then base the valuation of damages on the direct and indirect (e.g., overhead) costs forrestoring, rehabilitating, replacing, and/or acquiring the equivalent of injured natural resources. Damagesmay also include the value of the services lost to the public between the time of release and the time theresources and services those resources provide are returned to baseline conditions (i.e., those conditionswhich would have existed had the release not occurred). The natural resources covered by the ruleinclude land, fish, wildlife, biota, air, water, groundwater, drinking water supplies, and othergovernment- or privately-owned resources covered by CERCLA.
Description of Derivation of the Monetary Values
SEE BELOW
Comments
Covers releases of hazardous substancesCovers a broad scope of resourcesIncludes a choice of assessment approachesContingent valuation allowed as method to estimate use values
The DOI natural resource damage assessment methodology
The DOI methodology uses the following basic formula to estimate natural resource damages (NRD):
NRD = direct and indirect costs for restoration, rehabilitation, replacement, and/or acquisition ofequivalent resources + the value of the services lost to the public
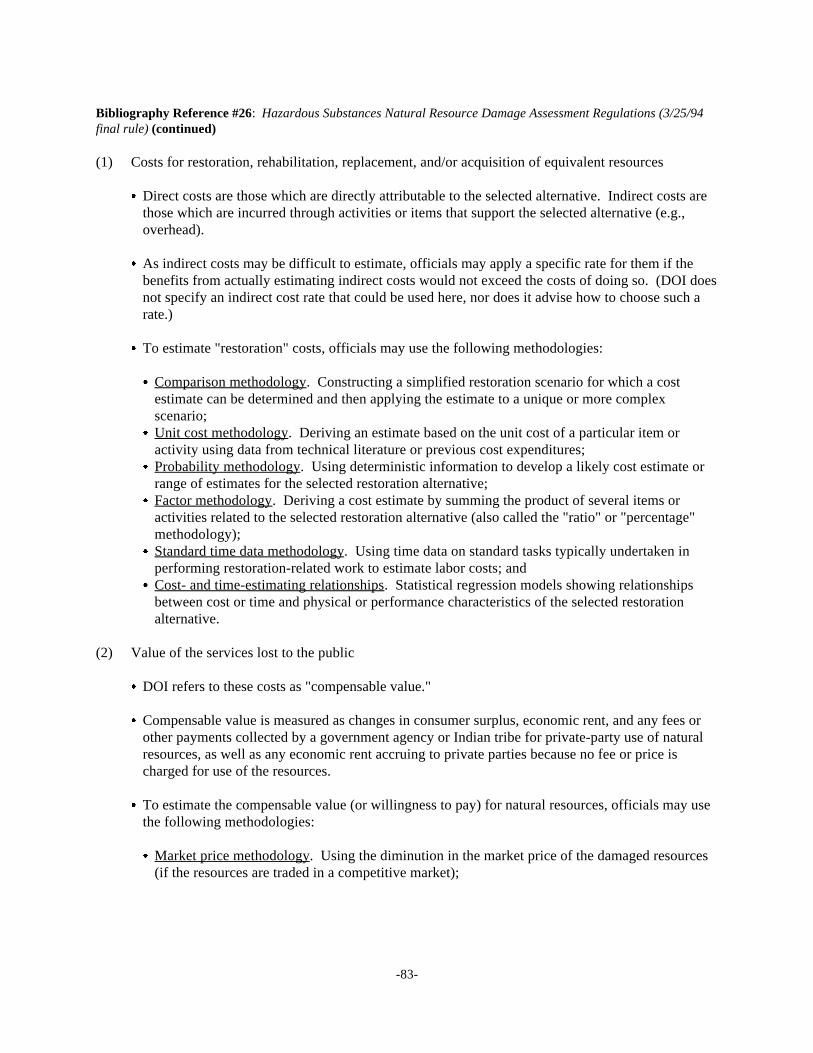
-83-
Bibliography Reference #26: Hazardous Substances Natural Resource Damage Assessment Regulations (3/25/94final rule) (continued)
(1) Costs for restoration, rehabilitation, replacement, and/or acquisition of equivalent resources
& Direct costs are those which are directly attributable to the selected alternative. Indirect costs arethose which are incurred through activities or items that support the selected alternative (e.g.,overhead).
& As indirect costs may be difficult to estimate, officials may apply a specific rate for them if thebenefits from actually estimating indirect costs would not exceed the costs of doing so. (DOI doesnot specify an indirect cost rate that could be used here, nor does it advise how to choose such arate.)
& To estimate "restoration" costs, officials may use the following methodologies:
& Comparison methodology. Constructing a simplified restoration scenario for which a costestimate can be determined and then applying the estimate to a unique or more complexscenario;
& Unit cost methodology. Deriving an estimate based on the unit cost of a particular item oractivity using data from technical literature or previous cost expenditures;
& Probability methodology. Using deterministic information to develop a likely cost estimate orrange of estimates for the selected restoration alternative;
& Factor methodology. Deriving a cost estimate by summing the product of several items oractivities related to the selected restoration alternative (also called the "ratio" or "percentage"methodology);
& Standard time data methodology. Using time data on standard tasks typically undertaken inperforming restoration-related work to estimate labor costs; and
& Cost- and time-estimating relationships. Statistical regression models showing relationshipsbetween cost or time and physical or performance characteristics of the selected restorationalternative.
(2) Value of the services lost to the public
& DOI refers to these costs as "compensable value."
& Compensable value is measured as changes in consumer surplus, economic rent, and any fees orother payments collected by a government agency or Indian tribe for private-party use of naturalresources, as well as any economic rent accruing to private parties because no fee or price ischarged for use of the resources.
& To estimate the compensable value (or willingness to pay) for natural resources, officials may usethe following methodologies:
& Market price methodology. Using the diminution in the market price of the damaged resources(if the resources are traded in a competitive market);
-84-
Bibliography Reference #26: Hazardous Substances Natural Resource Damage Assessment Regulations (3/25/94final rule) (continued)
& Appraisal methodology. Taking the difference between the with- and without-injury appraisalvalues of the resources as determined by the sales approach described in the Uniform AppraisalStandards (this approach may be used when resources traded in markets are similar to thedamaged resources);
& Factor income methodology. Estimating the in-place value of the resources by determining theeconomic rent associated with the use of the resources in the making of a product with a well-defined market price;
& Travel cost methodology. Using incremental travel costs to an area as a proxy for the value ofthe area's services (in this case, compensable value is the difference between the value of thearea with and without a discharge or release);
& Hedonic pricing methodology. Indirectly estimating the demand for nonmarketed resources byanalyzing commodities traded in a market (e.g., housing values at different distances fromamenities);
& Unit value methodology. Using preassigned dollar values (not specified by DOI) fornonmarketed recreational and other experiences by the public that closely resemble the serviceslost due to the natural resource damages; and
& Contingent valuation methodology. Determining the value of natural resources throughcarefully designed surveys.
Notes
& Officials may use methodologies not listed above if they are cost-effective and are based uponstandard, accepted cost estimating practices.
& Officials may use multiple methodologies as long as there is no double-counting.
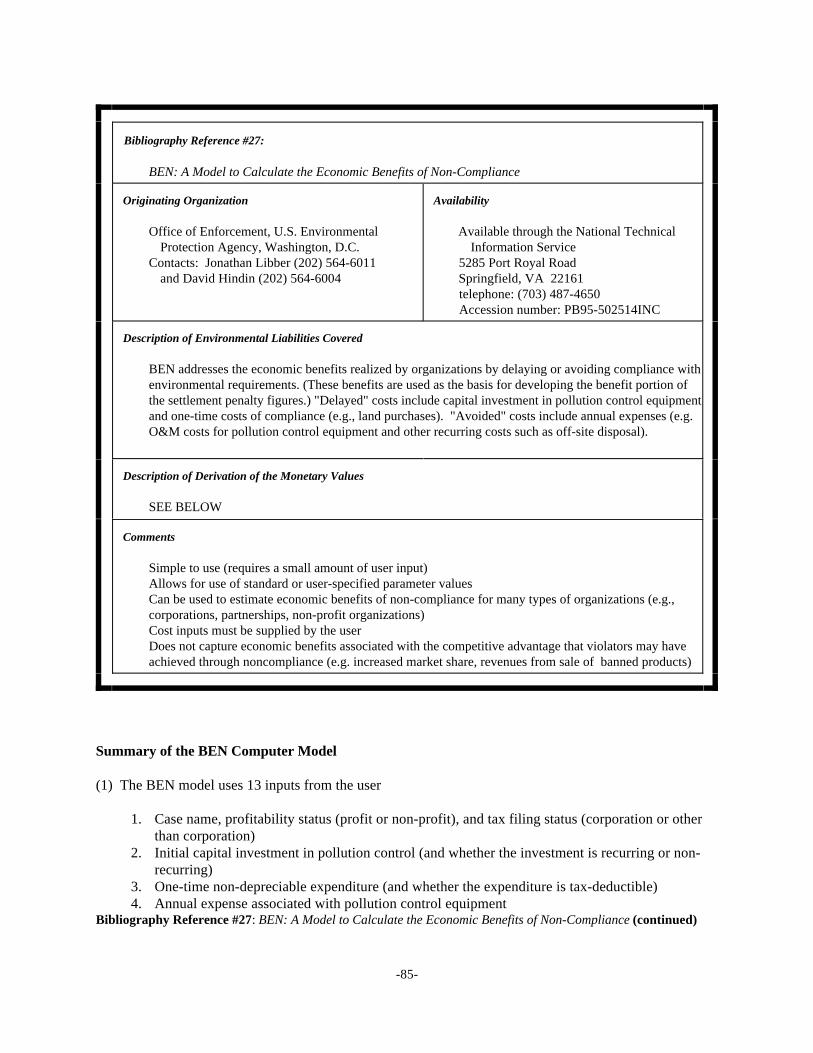
-85-
Bibliography Reference #27:
BEN: A Model to Calculate the Economic Benefits of Non-Compliance
Originating Organization Availability
Office of Enforcement, U.S. Environmental Available through the National Technical Protection Agency, Washington, D.C. Information Service
Contacts: Jonathan Libber (202) 564-6011 5285 Port Royal Roadand David Hindin (202) 564-6004 Springfield, VA 22161
telephone: (703) 487-4650 Accession number: PB95-502514INC
Description of Environmental Liabilities Covered
BEN addresses the economic benefits realized by organizations by delaying or avoiding compliance withenvironmental requirements. (These benefits are used as the basis for developing the benefit portion ofthe settlement penalty figures.) "Delayed" costs include capital investment in pollution control equipmentand one-time costs of compliance (e.g., land purchases). "Avoided" costs include annual expenses (e.g.O&M costs for pollution control equipment and other recurring costs such as off-site disposal).
Description of Derivation of the Monetary Values
SEE BELOW
Comments
Simple to use (requires a small amount of user input)Allows for use of standard or user-specified parameter valuesCan be used to estimate economic benefits of non-compliance for many types of organizations (e.g.,corporations, partnerships, non-profit organizations)Cost inputs must be supplied by the userDoes not capture economic benefits associated with the competitive advantage that violators may haveachieved through noncompliance (e.g. increased market share, revenues from sale of banned products)
Summary of the BEN Computer Model
(1) The BEN model uses 13 inputs from the user
1. Case name, profitability status (profit or non-profit), and tax filing status (corporation or otherthan corporation)
2. Initial capital investment in pollution control (and whether the investment is recurring or non-recurring)
3. One-time non-depreciable expenditure (and whether the expenditure is tax-deductible)4. Annual expense associated with pollution control equipment
Bibliography Reference #27: BEN: A Model to Calculate the Economic Benefits of Non-Compliance (continued)
-86-
5. Non-compliance date6. Compliance date7. Penalty payment date8. Useful life of pollution equipment*9. Marginal tax rate 1986 and before* 10.Marginal tax rate 1987 to 1992*11. Marginal tax rate 1993 and beyond*12. Annual inflation rate*13. Discount rate*
NOTE: BEN includes standard default values (which may differ for profit and non-profitorganizations) for the variables marked with an asterisk (*), although the user may enter alternatevalues if desired.
(2) BEN uses a four-step process to compute the economic benefit of non-compliance:
Step 1. Calculates the present value (as of the non-compliance date) of the incremental after-taxcash flows that the violator would have experienced if it had complied on time. ("On-Time" case)
Step 2. Calculates the present value (as of the non-compliance date) of the cash flows experiencedby the violator when making the expenditures necessary to comply after the delay. ("Delay" case)
Step 3. Calculates the violator's economic benefit as of the non-compliance date (the "initialeconomic benefit"), which is the difference between the cash flows in the On-Time case and the cashflows in the Delay case.
Step 4. Calculates the violator's economic benefit as of the penalty payment date, which is derivedby increasing the initial economic benefit at the discount rate for the number of months between thenon-compliance date and the penalty payment date.
(3) BEN can also be used to estimate economic benefits in special cases:
- Multiple BEN runs can be combined in situations where violators fail to comply with more thanone requirement.
- Using some of BEN's intermediate calculations, the user can address situations where a violatorcompletely avoids one-time capital expenditures or non-depreciable costs (e.g., if EPA seeks toclose down the violator's operation due to non-compliance).
- BEN can be used to estimate economic benefits in situations where annual expenditures aredelayed (as opposed to avoided in standard cases).
- Cost figures in BEN can be adjusted in cases where governmental entities or non-profitorganizations have portions of their pollution control costs and other compliance expenditurescovered by federal or state grants.
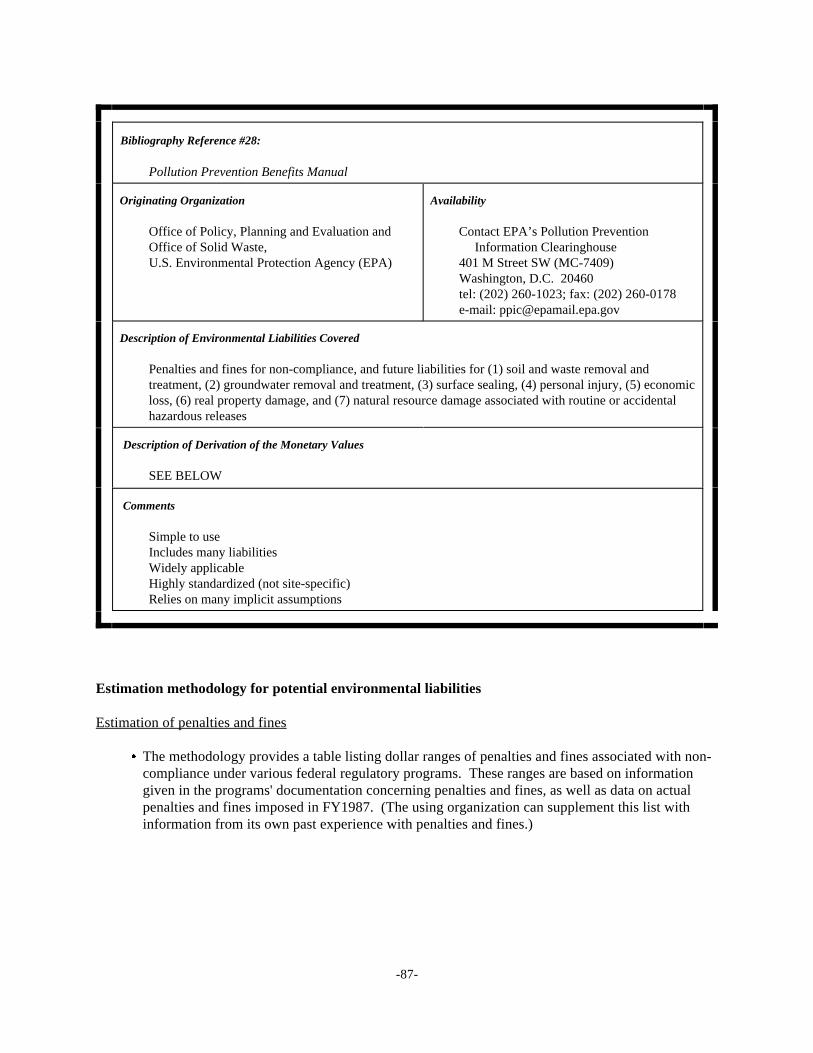
-87-
Bibliography Reference #28:
Pollution Prevention Benefits Manual
Originating Organization Availability
Office of Policy, Planning and Evaluation and Contact EPA’s Pollution PreventionOffice of Solid Waste, Information ClearinghouseU.S. Environmental Protection Agency (EPA) 401 M Street SW (MC-7409)
Washington, D.C. 20460tel: (202) 260-1023; fax: (202) 260-0178e-mail: [email protected]
Description of Environmental Liabilities Covered
Penalties and fines for non-compliance, and future liabilities for (1) soil and waste removal andtreatment, (2) groundwater removal and treatment, (3) surface sealing, (4) personal injury, (5) economicloss, (6) real property damage, and (7) natural resource damage associated with routine or accidentalhazardous releases
Description of Derivation of the Monetary Values
SEE BELOW
Comments
Simple to useIncludes many liabilitiesWidely applicableHighly standardized (not site-specific)Relies on many implicit assumptions
Estimation methodology for potential environmental liabilities
Estimation of penalties and fines
& The methodology provides a table listing dollar ranges of penalties and fines associated with non-compliance under various federal regulatory programs. These ranges are based on informationgiven in the programs' documentation concerning penalties and fines, as well as data on actualpenalties and fines imposed in FY1987. (The using organization can supplement this list withinformation from its own past experience with penalties and fines.)
-88-
Bibliography Reference #28: Pollution Prevention Benefits Manual (continued)
& The methodology then requires the using organization to estimate its probability of beingpenalized or fined by each program in a given year, based on past experience. These probabilitiesare multiplied by the corresponding penalty and fine dollar values to produce expected liabilityestimates for each applicable regulatory program. These estimates are then summed to producethe total expected value of penalties and fines.
Estimation of future liability costs
(1) Soil and waste removal and treatment = 8.9 x a x b x Q where:
a Correction factor (for type of tank)b Fraction of total annual quantity of waste (treated, stored in tanks, or transported) expected to be
releasedQ Total quantity of waste treated, stored in tanks, or transported
& This equation does not apply to landfills because excavation is unlikely to be the preferredremediation option for them.
& For tanks, "a" takes on a value of 1 for above ground tanks and 2 for underground tanks; "b"ranges from .0001 to .1 depending on the type of tank.
& For transportation, "a" equals 1, and the "b" factor in the equation is a function of "D," which is avariable for the distance to the treatment or disposal facility.
(2) Groundwater removal and treatment = a + (b x c) where:
a Capital costsb O&M costsc Multiplicative factor to determine present value of all O&M costs
& This equation does not apply to transportation because releases during transportation typically donot result in contamination of groundwater.
& Generally, "a" is a function of "D" (distance to the nearest drinking water well -- 150m to 3,200m),"W" (width of groundwater plume at facility boundary), "V" (groundwater velocity -- 30 to 3,000meters per year), and "CC" (unit capital cost of groundwater treatment).
& Generally, "b" is a function of "W," "D," "V," and "OM" (unit O&M cost of groundwatertreatment).
& For tanks, "c" ranges from 4 to 8, "W" ranges from 3m to 100m, "CC" equals $440 per cubic meterper day, and "OM" equals $120 per year per cubic meter per day.
& For landfill disposal, "c" ranges from 5 to 25, "W" ranges from 500m to 700m, "CC" equals $340per cubic meter per day, and "OM" equals $85 per year per cubic meter per day.
-89-
Bibliography Reference #28: Pollution Prevention Benefits Manual (continued)
(3) Surface sealing = CS x A where:
CS Unit cost of surface sealing landfillsA Area of the landfill
& This equation does not apply to tanks or transportation.
& For landfill disposal, "CS" ranges from $7,000 to $46,000 per acre. "A" ranges from 65 to 150acres.
(4) Personal injury = a x b where:
a Average claim per person for lost time due to disability and mortality, medical costs related toillness, and medical monitoring costs
b Potentially affected population
& This equation does not apply to transportation.
& For tanks or landfill disposal, "a" equals $56,000 per person; "b" equals 10 (best case), 3,500(typical case), or 15,000 (worst case).
(5) Economic loss = cost to replace a water supply source
& This equation does not apply to transportation.
& For tanks or landfill disposal, economic loss is calculated using a table of EPA cost estimates fordifferent population ranges.
(6) Real property damage = a x b x c where:
a Devaluation factorb Land valuec Area of the off-site plume
& This equation does not apply to transportation.
& Generally, "a" ranges from .15 to .30; "b" ranges from $900 to $3,500 per acre. The parameter "c"is a function of "D" (distance to the nearest drinking water well -- 150m to 3,200m) and "W"(width of groundwater plume at facility boundary).
& For tanks, "W" ranges from 3m to 100m.
& For landfill disposal, "W" ranges from 500m to 700m.
-90-
Bibliography Reference #28: Pollution Prevention Benefits Manual (continued)
(7) Natural resource damage = a x b where:
a Unit cost of dredging and disposing of contaminated material plus the cost of fish killedb Area of surface water contaminated
& For tanks or landfill disposal, "a" equals $692,000; "b" ranges from 1 to 3 acres.
& For transportation, "a" equals $692,000. The parameter "b" ranges from (1 x d) to (3 x d), where"d" is the quantity expected to be released, expressed as a fraction of the annual quantitytransported. The parameter "d" is a function of "D" (distance to the treatment or disposal facility).
Estimation of an organization's share of total future liabilities
Alpha = Q/Q where:t
Q Waste quantity contributed by the organizationQ Total quantity of waste managed by the disposal/transportation agent that manages thet
organization's waste
Estimation of the timing in which liabilities are incurred
Penalties and fines are assumed to be incurred annually, starting in the first year. For future liabilities, thefollowing formula is used:
Year = T + (D x RF)/V where:
T Expected time lapse between the start of the project and the initial releaseD Distance to nearest drinking water wellRF Retardation factor for waste constituentsV Groundwater velocity
& Generally, "RF" ranges from 1 to 1,000; "V" equals 30 meters per year (best case), 300 meters peryear (typical case), or 3,000 meters per year (worst case).
& For tanks and landfill disposal, "D" equals 150m (worst case), 1,500m (typical case), or 3,200m(best case).
& For transportation, "T" equals 1 year, and "D" equals 0.
& For tanks, "T" ranges from 1 to 20 years.
& For landfill disposal, "T" ranges from 1 to 40 years.
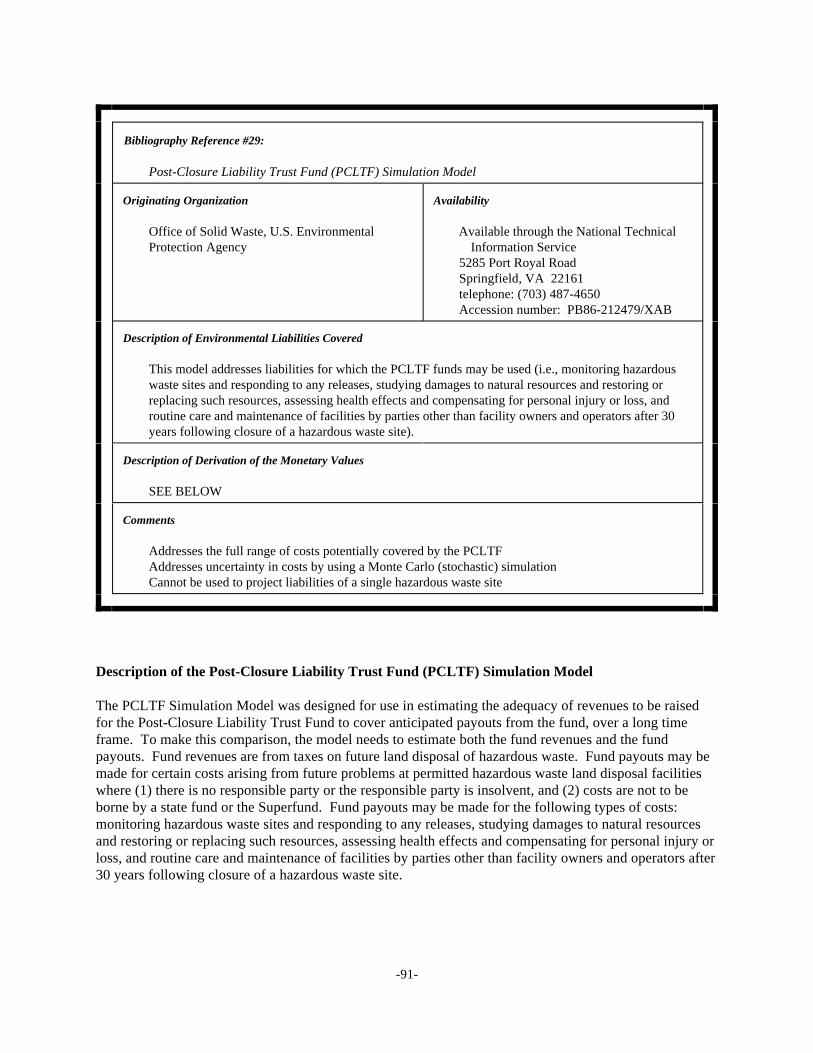
-91-
Bibliography Reference #29:
Post-Closure Liability Trust Fund (PCLTF) Simulation Model
Originating Organization Availability
Office of Solid Waste, U.S. Environmental Available through the National Technical Protection Agency Information Service
5285 Port Royal Road Springfield, VA 22161telephone: (703) 487-4650 Accession number: PB86-212479/XAB
Description of Environmental Liabilities Covered
This model addresses liabilities for which the PCLTF funds may be used (i.e., monitoring hazardouswaste sites and responding to any releases, studying damages to natural resources and restoring orreplacing such resources, assessing health effects and compensating for personal injury or loss, androutine care and maintenance of facilities by parties other than facility owners and operators after 30years following closure of a hazardous waste site).
Description of Derivation of the Monetary Values
SEE BELOW
Comments
Addresses the full range of costs potentially covered by the PCLTFAddresses uncertainty in costs by using a Monte Carlo (stochastic) simulationCannot be used to project liabilities of a single hazardous waste site
Description of the Post-Closure Liability Trust Fund (PCLTF) Simulation Model
The PCLTF Simulation Model was designed for use in estimating the adequacy of revenues to be raisedfor the Post-Closure Liability Trust Fund to cover anticipated payouts from the fund, over a long timeframe. To make this comparison, the model needs to estimate both the fund revenues and the fundpayouts. Fund revenues are from taxes on future land disposal of hazardous waste. Fund payouts may bemade for certain costs arising from future problems at permitted hazardous waste land disposal facilitieswhere (1) there is no responsible party or the responsible party is insolvent, and (2) costs are not to beborne by a state fund or the Superfund. Fund payouts may be made for the following types of costs: monitoring hazardous waste sites and responding to any releases, studying damages to natural resourcesand restoring or replacing such resources, assessing health effects and compensating for personal injury orloss, and routine care and maintenance of facilities by parties other than facility owners and operators after30 years following closure of a hazardous waste site.
-92-
Bibliography Reference #29: Post-Closure Liability Trust Fund (PCLTF) Simulation Model (continued)
The model documentation does not discuss how fund revenues are estimated. The model estimates fundpayouts using a Monte Carlo simulation that incorporates the uncertainties inherent in many of the factorsthat determine claims on the fund. The model produces output in the form of a distribution of potentialoutcomes.
Fund payouts are modeled based on (1) five categories of data regarding facilities, releases, and claims,and (2) six types of relationships among data in the five data categories. The five categories of data are asfollows:
1. Facility population2. Facility-level characterization3. Release data4. Monitoring and release response actions and claim data5. Funding sources
The six types of relationships among these data are as follows:
1. Economic relationships2. RCRA policies3. Financial relationships4. Physical relationships5. Legal issues6. Allocation policies
Additional details about the five categories of data are as follows:
& Facility population includes surface impoundments, landfills, land treatment, and injection wells. & Because facility-specific data were not available for most facilities, a distribution of facility
characteristics within the facility population was estimated (consequently, the model results arenot site-specific). The facility characteristics include the time of occurrence of certain milestones(e.g., end of the post-closure care period) that influence the allocation of costs among potentialfunding sources (see below).
& Seven types of releases were projected based on a model of releases developed by Battelle PacificNorthwest Laboratory. (Note: That model has since been updated.) Of the seven release types,three types were releases detected by an on-site monitoring well; three types were releases to theclosest off-site potable well or naturally occurring body of surface water; and one was theoverflow of contaminated leachate from the facility.
& Five types of monitoring actions are considered: (1) routine monitoring for indicator parametersat the on-site monitoring well, (2) monitoring for hazardous waste constituents at the on-sitemonitoring well, (3) plume delineation and tracking on site, (4) monitoring for hazardous wasteconstituents off site, and (5) plume delineation and tracking off site.
-93-
Bibliography Reference #29: Post-Closure Liability Trust Fund (PCLTF) Simulation Model (continued)
& Three types of response actions are considered: (1) cap repair, (2) fluid removal and treatment onsite, and (3) fluid removal and treatment off site.
& Four types of third-party claims are considered: (1) claims for personal injury, (2) damage to realproperty, (3) economic loss, and (4) damage to natural resources.
& Four funding sources are considered: (1) the PCLTF, (2) state funds, (3) Superfund, and (4)owners/operators. (If no funding source is available for a given action, the model assumes that theaction is not taken.)
Additional details about the six types of relationships among the five categories of data are as follows:
& The most important economic relationship is between the demand for land disposal and thesimulated facility population. The model ensures that there is sufficient disposal capacity to meetdemand by adding new disposal capacity as existing facilities close.
& Specific assumptions are made regarding the policies for approving final RCRA permits forinterim status facilities (a final RCRA permit is a condition of coverage by the PCLTF). Themodel also allows use of alternative policy assumptions.
& "Action rules" in the model regarding detection monitoring, compliance monitoring, correctiveaction, and post-closure care reflect EPA policies current at the time the model was developed. The model may, however, be run with modified "action rules."
& The likelihood of a firm going bankrupt is assessed annually and is modeled as a function of (1)the monitoring, response, and claims expenditures being incurred by the firm and (2) the financialstatus of the firm.
& Allocation policies identify the manner in which costs generated at the facility level are allocatedto the possible funding sources. A set of allocation rules is incorporated in the model to identifyhow each cost arising at the facility level is to be allocated in various situations.
& Legal validity of claims will vary by state, according to state law. Thus, legal validity of claims isrepresented using a set of seven representative legal regimes (based on a review of existing statelaws). The seven legal regimes were probabilistically assigned to the states.
& The effectiveness of response actions that are only partially completed is assumed to be a functionof the portion of the action completed.
When the PCLTF was run using a set of inputs believed by EPA to best reflect the then-current PCLTFstatute, the fund was projected to have sufficient revenues to cover potential costs over the next 20 to 40years. After that time, expenditures were expected to exceed revenues, in part because the tax rate wasfixed in nominal terms.
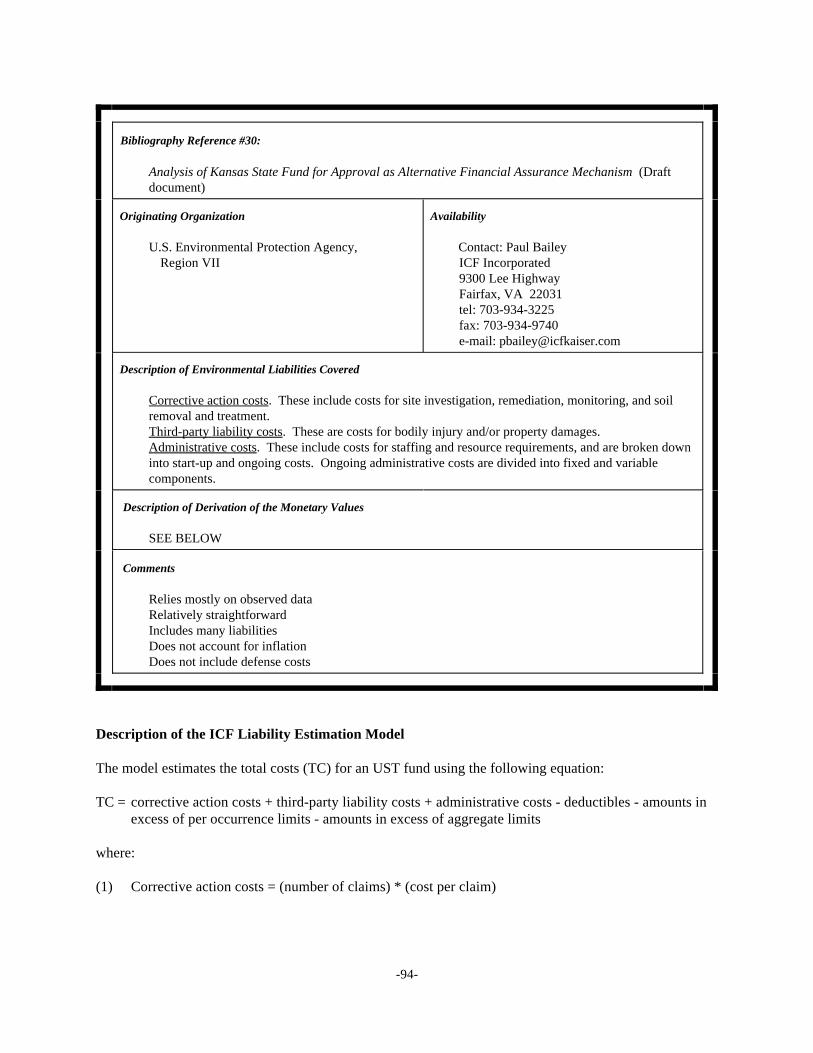
-94-
Bibliography Reference #30:
Analysis of Kansas State Fund for Approval as Alternative Financial Assurance Mechanism (Draftdocument)
Originating Organization Availability
U.S. Environmental Protection Agency, Contact: Paul Bailey Region VII ICF Incorporated
9300 Lee HighwayFairfax, VA 22031tel: 703-934-3225 fax: 703-934-9740 e-mail: [email protected]
Description of Environmental Liabilities Covered
Corrective action costs. These include costs for site investigation, remediation, monitoring, and soilremoval and treatment.Third-party liability costs. These are costs for bodily injury and/or property damages.Administrative costs. These include costs for staffing and resource requirements, and are broken downinto start-up and ongoing costs. Ongoing administrative costs are divided into fixed and variablecomponents.
Description of Derivation of the Monetary Values
SEE BELOW
Comments
Relies mostly on observed dataRelatively straightforwardIncludes many liabilitiesDoes not account for inflationDoes not include defense costs
Description of the ICF Liability Estimation Model
The model estimates the total costs (TC) for an UST fund using the following equation:
TC = corrective action costs + third-party liability costs + administrative costs - deductibles - amounts inexcess of per occurrence limits - amounts in excess of aggregate limits
where:
(1) Corrective action costs = (number of claims) * (cost per claim)
-95-
Bibliography Reference #30: Analysis of Kansas State Fund for Approval as Alternative Financial AssuranceMechanism (Draft document) (continued)
& The number of claims is based on several factors. First, state data (including the number of tanks,tank construction materials, and soil types under tanks) and information on types of piping(derived from national averages) are used to characterize the state's tank population. The resultsfrom an EPA model (see Notes) for estimating the frequency and severity of releases are thenweighted by these characteristics in order to produce state-specific release information. Release detection rates are based on regulatory requirements for monitoring and leak detection. Theserates are created by taking three-year rolling averages of the rates in EPA's technical UST rules.
& The average cost per claim is derived using national cost estimates from EPA's UST Model. Inorder to make these estimates more state-specific, they are adjusted using actual state data on siteinvestigation, capital, and O&M costs. Corrective action costs are assumed to be exponentiallydistributed. Also, a linear relationship between the costs of average cleanups and median-to-largecleanups is assumed.
(2) Third-party liability costs = (number of claims) * (cost per claim)
& The number of claims is based on the percentage of releases that lead to claims. The model usesan estimate of 1 to 2 percent based on reports from UST insurers.
& The average cost per claim is $341,000. This value is derived from the results of an ICF studydone in 1984 and is adjusted to reflect a $1 million ceiling on third-party recovery.
(3) Administrative costs = (corrective action costs + third-party liability costs) * (11%)
Subject to: Administrative costs � $2 million per year
& The 11% parameter is based on a rate proposed to the State of Washington by an insurer.
& The $2 million limit is derived from ICF's administrative cost estimates from an earlier study. These estimates indicate that, accounting for the staff needs of the state being examined,administrative costs are unlikely to exceed $2 million per year.
Notes
& Deductible amounts are based on state-required levels and are adjusted by estimates of default byowners and operators.
& Per occurrence and aggregate limits are based on those specified by the individual state beingexamined.
& As noted above, some of the calculations in this methodology are based on results from EPA'sUST Model. The UST model, which was developed in 1988, estimates the costs and benefitsassociated with implementing the UST regulations and remediating existing contamination of soiland/or groundwater. The model consists of three modules -- the event module, the risk module,and the cost module. The event module addresses tank failure and releases, fate and transport ofreleased hydrocarbons, and detection. The risk module estimates the human health risks fromexposure to benzene. The cost module estimates the cost of remediating contamination andreplacing damaged equipment.
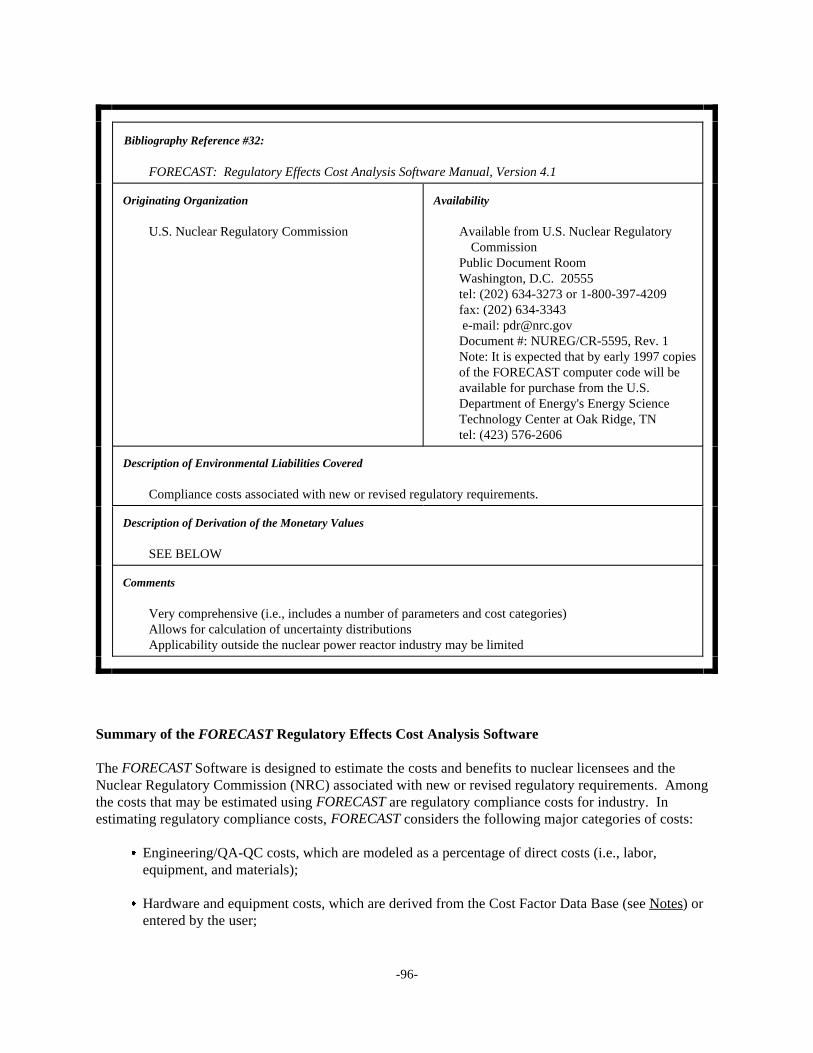
-96-
Bibliography Reference #32:
FORECAST: Regulatory Effects Cost Analysis Software Manual, Version 4.1
Originating Organization Availability
U.S. Nuclear Regulatory Commission Available from U.S. Nuclear RegulatoryCommission
Public Document RoomWashington, D.C. 20555tel: (202) 634-3273 or 1-800-397-4209fax: (202) 634-3343 e-mail: [email protected] #: NUREG/CR-5595, Rev. 1Note: It is expected that by early 1997 copiesof the FORECAST computer code will beavailable for purchase from the U.S.Department of Energy's Energy ScienceTechnology Center at Oak Ridge, TNtel: (423) 576-2606
Description of Environmental Liabilities Covered
Compliance costs associated with new or revised regulatory requirements.
Description of Derivation of the Monetary Values
SEE BELOW
Comments
Very comprehensive (i.e., includes a number of parameters and cost categories)Allows for calculation of uncertainty distributionsApplicability outside the nuclear power reactor industry may be limited
Summary of the FORECAST Regulatory Effects Cost Analysis Software
The FORECAST Software is designed to estimate the costs and benefits to nuclear licensees and theNuclear Regulatory Commission (NRC) associated with new or revised regulatory requirements. Amongthe costs that may be estimated using FORECAST are regulatory compliance costs for industry. Inestimating regulatory compliance costs, FORECAST considers the following major categories of costs:
& Engineering/QA-QC costs, which are modeled as a percentage of direct costs (i.e., labor,equipment, and materials);
& Hardware and equipment costs, which are derived from the Cost Factor Data Base (see Notes) orentered by the user;
-97-
Bibliography Reference #32: FORECAST: Regulatory Effects Cost Analysis Software Manual (continued)
& Health physics costs, which are based on radiation exposure and include costs for anti-contamination clothing, health physics personnel, shielding, and other factors;
& Installation labor costs associated with physical modifications (including base wages, fringebenefits, overhead, and fee);
& Procedural/analytical costs, which represent established industry costs for procedural,administrative, and analytical activities (e.g., technical specification changes, revisions to existingprocedures and development of new procedures, staff training and retraining, recordkeeping andreporting, in-depth technical analyses, computations and scientific analyses, and otheradministrative duties);
& Radioactive waste disposal costs, which are calculated based on a 1,000-mile transport distancefrom the plant to the disposal site;
& Reactor defueling/refueling costs;
& Reactor shutdown and start-up costs;
& Removal labor costs associated with physical modifications (including base wages, fringebenefits, overhead, and fee); and
& Replacement energy costs incurred during shutdown, which are derived from a database of allpower plants in the United States.
In addition to these cost categories, FORECAST also addresses the following types of costs:
& Averted on-site property costs due to accidents, including costs for (1) facility cleanup anddecontamination and (2) long-term replacement energy; and
& Averted off-site non-health costs, including costs for protective emergency actions,decontamination and interdiction of property, disposal of contaminated food and milk, long-termrelocation of people, and long-term interdiction/condemnation of property.
& Averted public and occupational health related costs due to accidents calculated at $2,000/person-rem. (See reference #33 for derivation of this value)
Notes(1) The default parameter values used in FORECAST are primarily taken from the Cost Factor Data Base
(which includes the Energy Economic Data Base), along with plant-specific data on replacementenergy costs and other default data. The Energy Economic Data Base includes nuclear plantgreenfield (new plant) construction costs as of 1989.
(2) Regulatory compliance costs can be modeled in FORECAST as both one-time costs and recurringcosts. All recurring costs estimated by FORECAST are discounted to the present using the discountrate selected by the user (or the default rate of 7%).
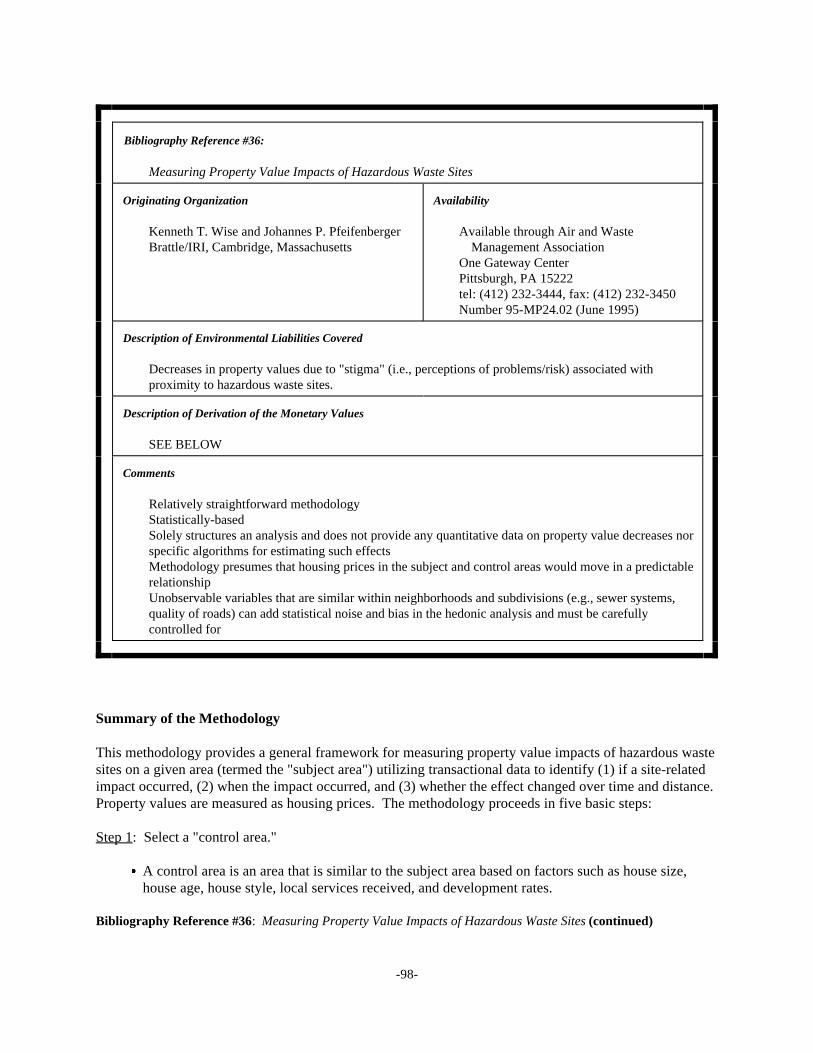
-98-
Bibliography Reference #36:
Measuring Property Value Impacts of Hazardous Waste Sites
Originating Organization Availability
Kenneth T. Wise and Johannes P. Pfeifenberger Available through Air and Waste Brattle/IRI, Cambridge, Massachusetts Management Association
One Gateway CenterPittsburgh, PA 15222 tel: (412) 232-3444, fax: (412) 232-3450Number 95-MP24.02 (June 1995)
Description of Environmental Liabilities Covered
Decreases in property values due to "stigma" (i.e., perceptions of problems/risk) associated withproximity to hazardous waste sites.
Description of Derivation of the Monetary Values
SEE BELOW
Comments
Relatively straightforward methodologyStatistically-basedSolely structures an analysis and does not provide any quantitative data on property value decreases norspecific algorithms for estimating such effectsMethodology presumes that housing prices in the subject and control areas would move in a predictablerelationshipUnobservable variables that are similar within neighborhoods and subdivisions (e.g., sewer systems,quality of roads) can add statistical noise and bias in the hedonic analysis and must be carefullycontrolled for
Summary of the Methodology
This methodology provides a general framework for measuring property value impacts of hazardous wastesites on a given area (termed the "subject area") utilizing transactional data to identify (1) if a site-relatedimpact occurred, (2) when the impact occurred, and (3) whether the effect changed over time and distance. Property values are measured as housing prices. The methodology proceeds in five basic steps:
Step 1: Select a "control area."
& A control area is an area that is similar to the subject area based on factors such as house size,house age, house style, local services received, and development rates.
Bibliography Reference #36: Measuring Property Value Impacts of Hazardous Waste Sites (continued)
-99-
& The control area is key for estimating what housing prices would have been absent any possibleimpact.
Step 2: Determine the true price appreciation for houses.
& This step in the methodology calls for the use of hedonic analysis. Specifically, statistical analysisis applied to transaction data in order to determine the contribution of different attributes of ahome (e.g., house size, lot size, location, condition) to its value.
Step 3: Find evidence of a price impact.
& The methodology calls for the hedonic model used in Step 2 to be used to identify the relationshipbetween price movements in the subject and control areas that existed before any impact could beexpected.
& The model compares actual price data for the subject area to the prices predicted by therelationship between prices in the subject and control areas. Statistically significant differencesrepresent evidence of an impact.
& To link the price impact to the hazardous waste site, events related to the site (e.g., negative newscoverage) must be analyzed.
Step 4: Determine the persistence of the price impact.
& Due to differences in volume, quality, and transmission of information about the hazardous wastesite over time, the methodology calls for the application of a flexible model specification thatefficiently uses available data to determine the nature of the price effect over time (i.e., steadydecline, initial drop followed by a further decline, drop with a constant impact, of drop followedby a trend back).
Step 5: Examine distance effects.
& This step also calls for the application of a flexible model specification that efficiently usesavailable data. Potential statistical analysis methods in this step could include dividing the subjectarea using simple concentric rings around the waste site or using non-linear or piece-wise lineardistance specifications. Additional variables measuring the interaction between time and distancemay also be necessary.
-100-
Retroactive, Retrospective, andProspective Liability
"Retroactive liability" is a term most often usedin connection with Superfund to refer to liabilityresulting from past activities that ceased beforeestablishment of the law creating the liability. Retrospective liability is a broader term thatencompasses liability for past deeds that cannot beavoided or prevented. While all retroactiveliabilities are retrospective in nature, retrospectiveliabilities are not necessarily retroactive. It isimportant to note that Superfund liability (andother laws) also applies prospectively, and, in sodoing, creates incentives for proper managementof hazardous substances.
Appendix A:Timing, Likelihood, and Uncertainty Issues
When incorporating the monetary values of environmental liabilities into planning,decision-making, and operations, organizations may want to express or adjust the estimateddollar value magnitudes to reflect the timing, likelihood, and/or uncertainty associated with suchfuture expenditures. This appendix introduces these topics.
1. Timing
By definition, all environmental liabilities involve future costs. A common approach toevaluating future payments is to calculate their net present value. This requires an estimate ofboth the magnitude and the timing of future outlays (as well as selection of an appropriatediscount rate). Sometimes, particularly for compliance and remediation obligations, the outlaysmay occur within three to five years. Such obligations, however, also may not occur until apoint quite remote in the future. For example, the cost of the compliance obligation todecommission a nuclear power plant or close a landfill following the end of its useful life maybe twenty-five or more years away. Similarly, a remediation obligation to cleanup acontaminated site may not arise for decades. Compliance and remediation obligations also maybe both years away and continuous in nature: in most cases, regulations require companies toprovide for at least thirty years of "post-closure care" following the closure of certain wastedisposal facilities. To remediate contaminated ground water in some locations could requirefifty or more years of removal and treatment. Thus, these obligations may well entail a streamof future payments extending over time, as opposed to a lump sum outlay.
Compensation and natural resource damage liabilities can arise in the near-term or canhave long time frames as well. Compensation and natural resource damage liability can betriggered by sudden accidents that can occur at any time. Conversely, existing or future releasesof contaminants and exposure of persons and property can continue over many years before anyadverse environmental aspects or health effects, such as many forms of cancer, manifestthemselves (termed the "latency period"). Thus, compensation and natural resource damageclaims may not materialize until years in the future after the use or release of a chemical orwaste. And the process of investigating andlitigating claims (e.g, linking health effects toprior exposures) can take several more years. On the other hand, claims for medicalmonitoring costs may be brought followingmere exposure and in the absence of clearhealth impacts, meaning that some portion ofthe potential liability may arise earlier thanother components.
In addition to understanding thepotential timing of environmental liabilities,it is important to distinguish between (1)future costs that cannot be avoided orprevented due to events that have alreadytaken place and (2) future costs that can be
Where managers decide not to adjust the estimated liabilities to reflect their likelihoods of occurrence, as22
described below, adjustments to reflect the timing of future expenditures may nevertheless be made.
More precisely, the expected value is the probability-weighted product of an array of forecasted23
magnitudes and the corresponding likelihoods of those magnitudes.
-101-
avoided or prevented. Most reported accounting and insurance discussions of environmentalliability relate to the first category, while most planning and risk management articles apply tothe second category. The terms "retrospective" and "prospective" liability are sometimes used aslabels for these two different situations. A related term "retroactive liability" has a specialconnotation and usage (see sidebox).
Understanding the timing of environmental liabilities is important in weighing the costs oftaking actions to reduce or prevent those liabilities. Although there may be some opportunitiesto manage future costs resulting from activities and releases that have already occurred, differentways of doing business now and in the future can greatly affect a company's other environmentalliabilities. In thinking about (and valuing) environmental liabilities, it may be useful todistinguish among:
(1) liabilities or potential liabilities due to past activities that have ceased(2) liabilities or potential liabilities due to current activities, and(3) potential liabilities due to future activities that have not yet begun.
The latter two categories represent opportunities for companies to prevent the incurrence ofenvironmental liability costs. By considering potential liability costs in forward-lookingbusiness decisions, planners, managers and managerial accountants may realize the financialbenefits of altering current practices or of avoiding new activities that might cause the incurrenceof environmental liabilities.
2. Likelihood
Managers may want to consider likelihood when weighing the monetary value of theirpotential environmental liabilities against the costs of potential management options forpreventing (or reducing the likelihood of) those liabilities. A common approach to evaluating a22
potential environmental liability is to calculate its expected value, which is the product of itsforecasted magnitude and its likelihood of occurrence. In this way, the monetary estimate is23
adjusted (i.e., reduced) to reflect the probability that a future expenditure will be made. Forexample, if a potential environmental liability has an estimated value of $1 million and thelikelihood of its occurrence is 10%, then the expected value of that liability is $100,000. Thelikelihood that a future expenditure will be made depends on whether the potential liability iscertain to be incurred or, alternatively, depends on the uncertain occurrence or nonoccurrence ofone or more future events.
What complicates management's evaluation of the likelihood of environmental liabilitycosts is that the uncertainties can include both factual questions (e.g., Will the tank car leak? Will children be exposed to substance X? Will they be harmed? Will ground water becontaminated?) and legal questions (e.g., Does this law apply to this facility? Will there be arequirement to remediate this property? Are these damage claims compensable? Who is or willbe legally responsible?) Thus, estimating the likelihood of a potential liability may require
As discussed earlier in this appendix, managers may choose to adjust the estimated cost of compliance to24
reflect the timing of the future expenditures.
-102-
engineering, scientific, statistical, and legal analysis and judgment. Both the factual and legalquestions may be difficult to answer with certainty, particularly when managers are makingprojections for forward-looking decisions; although, with time, better data tend to make thefactual questions easier to address and legal precedents tend to make the legal questions easier toanswer.
Likelihood of Compliance Liabilities
Of all the environmental liabilities discussed here, compliance liabilities have the lowestlevel of associated uncertainty. If a law applies to a facility, activity, or substance, expendituresto come into compliance must be made by a specified date. Therefore, there may be no need toadjust the estimated cost of compliance to reflect the likelihood of the incurrence of theliability. For example, regulations require that those who open a hazardous waste surface24
impoundment must, at some point in the future, properly close it. There is no way to avoid thatclosure obligation; it is not contingent on any future event. However, if the closure does notmeet "clean closure" standards, then post-closure care must be provided; this post-closure carerequirement is contingent upon the results of the closure procedure. In this example, because thelikelihood of closure is certain, its estimated cost need not be adjusted, but the potential cost ofpost-closure care can be adjusted to reflect the probability that post-closure care costs will beincurred. Another example: to avoid reporting and emissions control requirements that willapply to users of a particular ozone depleting substance, a business may switch to an alternativesubstance (or process) that is not regulated. This is an example of a compliance obligation thatis not contingent on a future event, but rather, becomes inapplicable (i.e., avoidable) once use ofthe substance stops. In this example, because the future compliance expenditures will certainlybe incurred, it would be inappropriate to adjust the estimated compliance cost for likelihood; thefull cost of compliance should be considered when evaluating alternative practices.
Likelihood of Potential Remediation Liabilities
Potential remediation liabilities for future contamination have different types of associateduncertainty. Potential factual uncertainties could include, at a minimum, whether there will be arelease or threat of release to the environment, transport through the environment, and/ordiscovery of the release. Depending on the situation, potential legal uncertainties could includewhether there will be an obligation to remediate and whether that liability will be shared withothers (often termed "joint and several" liability). The latter contingency may be relevant for acompany that sends its waste off-site for disposal at a commercial facility that also acceptswastes from others. (On the other hand, liability for remediation of contamination resultingfrom on-site waste disposal would not likely be shared with others unless the property issubsequently sold.) In these situations, the estimated monetary magnitude of the potentialremediation liability could be adjusted to reflect both the likelihood that the liability will ariseand the proportionate share of any liability for which other companies might be legallyresponsible.
However, it may be appropriate to view potential remediation liabilities for futurecontamination as certain to arise for such practices as the underground storage of petroleum
However, as discussed earlier in this appendix, managers may choose to adjust the estimated cost of25
remediation to reflect the expected timing of the future expenditures.
The comment in footnote 25 applies as well to compensation liabilities.26
-103-
products or other substances; the underground injection of wastes; or placing solid and liquidwastes into landfills and surface impoundments. Over time, leaks from containment maybecome increasingly likely. Given design limitations, releases may become quite probable. Aconservative management approach might treat such future remediation expenditures as acertainty by not adjusting the magnitude of the potential liability by the likelihood of itsoccurring; this would provide managers with greater incentives to find alternatives to the use ofsuch practices because a higher monetary value would be associated with the potential liability. 25
Some of reported tools employ this approach.
Likelihood of Compensation Liabilities
Compensation liabilities are not usually considered certainties due to the many factual andlegal hurdles that must be crossed prior to the incurrence of a liability. As with remediationliabilities, compensation liabilities may depend on such factors as the existence of releases (e.g.,accidental, intermittent, or continuous), exposure of human beings or their property to releases,and prevailing legal rules. For a compensation claim to become a compensation obligation,either the parties must agree to a settlement or one or more courts must find that the claimsatisfied a variety of legal and factual tests. In evaluating such potential liabilities, companiescan adjust their liability cost estimations to reflect their probabilities of occurrence. Forexample, the expected value of a potential compensation liability of $10 million with a onepercent likelihood is $100,000. Alternatively, just as a company in its planning and decision-making might want to treat certain remediation liabilities for future contamination (e.g., fromunderground storage or disposal of substances) as eventual certainties, a company with aconservative management approach might choose to treat selected compensation liabilities (e.g.,medical monitoring for people exposed to regular releases of hazardous air pollutants) as certainto arise in order to provide a greater financial incentive for developing alternative practices thatwould eliminate or reduce such regular releases.26
Likelihood of Penalties and Fines for Noncompliance
Penalties and fines are doubly uncertain. First, for most companies, noncompliance itselfis an uncertain and unlikely event, unless a firm has a corporate policy to deliberately floutenvironmental laws. Noncompliance may be likened to accidental releases -- neither isexplicitly intended but management can influence to some degree (e.g., through training,technology) the probabilities that these events will occur. Second, penalties and fines aretriggered only in the event of discovery (such as through an official inspection or review ofrequired submissions of information) of noncompliance. Thus, the magnitude of the potentialliability due to fines and penalties can be adjusted (1) to reflect the likelihood of being out ofcompliance and (2) to reflect the probability of discovery of the noncompliance. If a company,however, prefers to base its planning and decision-making on the presumption that any non-compliance will be discovered, it would choose not to make any adjustments for the likelihoodof discovery.
Likelihood of Natural Resource Damages
See footnotes 25 and 26.27
-104-
Natural resource damages that result from accidental releases, such as spills duringtransport, are by their nature unlikely events. Similarly, natural resource damages caused byreleases of hazardous substances due to fires, explosions, or earthquakes are uncommon events. Thus, it may be appropriate to adjust the potential magnitude of such natural resource damageliabilities to reflect the probability of their occurrence. Finally, because natural resource damageliability is so new, claims are likely to be litigated, perhaps further coloring natural resourcedamages as unlikely to occur. On the other hand, natural resource damages may be caused bythe regular release of pollutants into the environment; although any resulting natural resourcedamage may be unintentional, the releases themselves are not accidental in these cases. For suchintentional releases, a company might decide to view liability for natural resource damages asthe certain outcome of its practices and recognize those costs as fully avoidable (i.e., noadjustment for likelihood) when evaluating alternative pollution prevention and controlpractices.27
3. Uncertainty
Estimates or projections of future costs have unavoidable uncertainties. There may beuncertainties regarding (1) magnitude, (2) probability of occurrence, and/or (3) timing of aliability. These uncertainties may be due to inherent variability or to a lack of information.Several of the liability valuation approaches can develop results in ways that make uncertaintiesmore transparent. For example, levels of estimated liability costs can be paired with theirrespective probabilities of occurrence; this is termed a probability distribution. Developing aprobability distribution provides information on the potential range of liability costs andfacilitates the calculation of the "expected value" of a liability costs, which may differ from the"most likely" value. Such a probability distribution can easily be converted into a "cumulativefrequency distribution," which indicates the likelihood that liability costs will be at or above agiven value. For example, to reflect uncertainties in the potential for accidental releases and theresulting cost of remediation, decision analysis techniques have been used as a means forassessing the likelihoods of remediation costs exceeding various dollar levels. Compensationliabilities have been treated in a similar fashion. The approach also is applicable to liability forfines and penalties. This statistical approach provides more information than a single point "bestestimate" of the cost or a multiple point estimate of "worst case," "most likely," and "best case"estimates. Managers can select their own levels of risk adverseness from such distributions.
-105-
Appendix B:Annotated Bibliography
Environmental Liability Valuation(* Asterisked references are profiled in Section 5 of this report.)
*1. Aldrich, James R. Air Force Institute of Technology, Wright-Patterson Air Force Base,OH. "Expected Value Estimates of the Long-Term Liability from Landfilling HazardousWaste." Technical Paper. Journal of the Air & Waste Management Association, June1994, 44:800-803. ISSN 1047-3289. This paper develops liability factors for use injustifying pollution prevention investments based on the premise that the key element inpredicting future liability costs is the cost of waste destruction. See also "Estimating theLong-Term Liability from Landfilling Hazardous Waste." Ph.D. dissertation, Universityof Cincinnati, 1993. Dissertation available from UMI Dissertation Services, Ann Arbor,Michigan, 1-800-521-0600, Order Number 9313811.
*2. American Institute of Chemical Engineers (AIChE). Dow's Fire & Explosion IndexHazard Classification Guide. New York: AIChE, 1994. Technical manual, seventhedition. The primary purpose of this tool is to serve as a guide to determine the hazardsassociated with the use of flammable materials. It also serves as a tool for evaluating fireand explosion loss potential of process areas and for identifying ways to lessen theseverity and resultant dollar loss of potential incidents. Designed for operations where atleast 1,000 lb (454 kg) of a flammable, combustible, or reactive material is stored,handled, or processed.
3. Atomic Industrial Forum, Inc. Guidelines for Producing Commercial Nuclear Power PlantDecommissioning Cost Estimates. 1986. The 2-volume report on nuclear power plantdecommissioning estimates is available for $15 from the Nuclear Energy Institute (NEI),the successor to the Atomic Industrial Forum. Contact Stacy Bonds, NEI Publications,1776 I Street NW, Washington, D.C. 20006-3708. Telephone: (202) 739-8148. Newertools have since been developed by TLG Associates, Inc. and the U.S. NuclearRegulatory Commission to help project these costs.
4. Bailey, Paul E. ICF Incorporated, Fairfax, VA. "Quantifying Environmental Exposuresfor Business Decisions: Approaches to Monetizing Environmental Liabilities." Presented at the 87th Annual Meeting & Exhibition, Air & Waste ManagementAssociation (A&WMA), Cincinnati, OH, June 1994. 94-TA31.06. Available fromA&WMA, One Gateway Center, Pittsburgh, PA 15222, tel: (412) 232-3444, fax: (412)232-3450. This paper compares "top-down" and "bottom-up" approaches for valuing avariety of environmental liabilities. See also reference 21 below.
5. Bailey, Paul E. and Karam, Joseph G. "Expressing Environmental Liabilities in Dollarsand Cents: What Corporations Can Do Now." Environmental Finance, Winter 1991/92. This article discusses the nature of environmental liabilities, reasons for placing amonetary value on them, and the state of the art. Approaches to valuing remediationliabilities, penalties and fines, and personal injuries to nonemployees are illustrated.
*6. Chansky, Joel S. Milliman & Robertson, Inc. "An Actuarial Approach to QuantifyingEnvironmental Exposure." Presented at the 87th Annual Meeting and Exhibition, Air
-106-
and Waste Management Association, Cincinnati, OH, June 1994. This paper describes arisk modeling approach to environmental exposures where there may not be a crediblebody of historical data from which to make financial projections; the approach is appliedto underground storage tanks.
*7. Chansky, Joel S. and Gulledge, William. Milliman & Robertson, Inc., Wakefield, MA andEnvironmental Insurance Management, Inc. McLean, VA. Missouri UndergroundStorage Tank Insurance Fund. October 1990. This insurance fund covers tanks withoutexisting leaks, their remediation, and associated property damage only.
*8. Englehardt, James D. University of Miami, Department of Civil and ArchitecturalEngineering. "Information-Limited Benefit-Risk Analysis for Sustainable ProcessDesign." ASCE Journal of Environmental Engineering. Forthcoming, scheduled to bepublished in January, 1997. This article illustrates the application of Bayesian inference,viewed as superior to conventional statistical and fuzzy methods, in assessing uncertainand variable economic risks, including environmental, health, and safety liabilities. Seealso "Economic Evaluation and Risk Analysis for Industrial Waste Management Design."Ph.D. dissertation, University of California Davis, 1991.
9. Florida. Florida's Pollutant Discharge Natural Resource Damage AssessmentCompensation Schedule (Laws of Florida, Chapter 92-113). Assesses damages for injuryto natural resources as a result of a pollutant discharge into coastal waters of Florida. The equations used in the model are very simple and generalized, as are the model inputs.
*10. General Electric Corporate Environmental Programs. "Financial Analysis of WasteManagement Alternatives." 1987. Developed with ICF Incorporated. This workbookwas developed to aid plant professionals in selecting and justifying waste managementinvestment decisions by describing a process for determining the direct costs andpotential liabilities in dollars of various waste management practices. A scaling/scoringapproach is used to adjust reference liability costs.
11. Huffman, Larry; Karam, Joseph; and Bailey, Paul. "Estimating the Costs of CorrectiveAction at Land Disposal Facilities." Remediation, Winter 1990/91. This paper presentsparametric cost curves for estimating future corrective action costs for municipal solidwaste landfills, depending on landfill area, average waste thickness, and the presence orabsence of a clay liner The curves are constructed from engineering-based costestimates.
*12. Indiana. State of Indiana - Analysis of Funding Requirements for the PetroleumUnderground Storage Tank Excess Liability Fund. Chicago, IL. January 1990. Prepared by Tillinghast, a Towers Perrin company. This UST fund covers remediationliabilities as well as compensation liabilities for all tanks.
*13. James, Steven E. and Schaarsmith, James H. "Use of Decision Science Techniques inManagement of Environmental Financial Risks." Journal of Environmental Practice, September/October 1994. This article discusses the use of decision analysis techniques invaluing environmental liabilities. Some results are presented from a study performed fora large mining and basic minerals company.
-107-
*14. Koch, Gayle S.; Ammann, Paul R.; and Wise, Kenneth T. The Brattle Group, Cambridge,Mass. "Using Decision Analysis to Manage Environmental Costs." Presented at the 87thAnnual Meeting and Exhibition, Air and Waste Management Association, Cincinnati,OH, June 1994. This paper describes types of environmental uncertainties and illustratesdecision analysis with several case study summaries.
15. Meyers, Michael. Strata Environmental Services, Inc. Knoxville, Tenn. "The Shape ofRisk: A Protocol for Environmental Financial Risk Management." Environmental Lawand Practice, May-June 1994, pp. 44-57. This article proposes fuzzy set logic analysis asan alternative to probabilisitc risk assessment when conducting environmental financialrisk analysis.
*16. Miakisz, Joseph A. "How Niagara Mohawk Incorporates Environmental Factors intoPolicies, Plans, and Procedures." Total Quality Environmental Management, Summer1995. This article describes how Niagara Mohawk Power Corporation has incorporatedenvironmental considerations in its valuation of new and existing generation sources. The article discusses how both existing and future environmental requirements areincorporated into the planning process.
*17. Moilanen, Tuula and Martin, Christopher. Financial Evaluation of EnvironmentalInvestments. Houston: Gulf Publishing Company, 1996. This book presents a model andmethodology for assessing the expected monetary values of environmental investments,including an illustration of one equation used to put a monetary value on future liabilitycosts for insurable compensation.
18. Mukhopadhyay, Nik and Moretti, Edward C. Center for Waste Reduction Technologies,American Institute of Chemical Engineers (AIChE). Current and Potential FutureIndustrial Practices for Reducing and Controlling Volatile Organic Compounds. 1993.This book presents order-of-magnitude cost estimates of the capital and annualized costsof three end-of-pipe VOC abatement technologies under several operating conditions. For two of the technologies, the costs were estimated using the EPA's HAP-PROsoftware package Capital costs include direct capital and installation costs and someindirect costs. Operating costs include direct, indirect, operating and maintenance, andreplacement parts and labor. For the other technology, costs were not derived fromHAP-PRO, but from technical literature and a survey respondent. Available throughAIChE's Center for Waste Reduction Technologies. Contact the AIChExpress ServiceCenter, 345 E. 47th Street, New York, NY 10017-2395. Telephone: 1-800-AIChemE,fax: (212) 705-8400, e-mail: [email protected]. ISBN0816906157 (Publication # C-2).
-108-
19. New York State Department of Environmental Conservation. DEC Publication - Divisionof Hazardous Substances Regulation Bureau of Radiation. Draft Generic EnvironmentalImpact Statement for Promulgation of 6 NYCRR, Subpart 383-6, Financial AssuranceRequirements for Low-Level Radioactive Waste Disposal Facilities. September 1990,Vol. II. Prepared with ICF Incorporated. This study applied the BIPDAM (BodilyInjury, Property Damage Assessment Model) methodology to value environmentalliabilities associated with the disposal of low-level radioactive waste in New York. Available through Paul Merges, Chief, Bureau of Pesticides and Radiation, New YorkDepartment of Environmental Conservation, Room 402, Albany, New York 12233-7250;telephone: (518) 457-2225; fax: (518) 485-8390; e-mail:[email protected].
*20. New York State Department of Environmental Conservation. DEC Publication - Divisionof Hazardous Substances Regulation Bureau of Radiation. Risk Assessment andFinancial Surety Requirements Analysis for Transportation of Low-Level RadioactiveWaste in New York State. Volume II - Generic Environmental Impact Statement forPromulgation of 6 NYCRR Part 381: Regulations for Low-level Radioactive WasteTransporter Permit and Manifest System. February 1988. Prepared with ICFIncorporated. This report developed and applied the BIPDAM (Bodily Injury, PropertyDamage Assessment Model) methodology for valuing environmental liabilities associatedwith the transport of low-level radioactive waste in New York State, taking into accountdifferent vehicle categories, waste shipment characteristics, transport routes, accidentevents, and environmental settings. See, especially, "Appendix C - Derivation of UnitCost Estimates."
*21. Schoemaker, Paul J.H. and Schoemaker, Joyce A. "Estimating Environmental Liability: Quantifying the Unknown." California Management Review, Spring 1995. This paperdescribes an approach for valuing environmental liabilities developed for amanufacturing company engaged in litigation with its insurers. A top-down approachwas used for hazardous waste sites and a "case method" was used for tort liability. Thepaper also describes a scenario process used to assess potential future trends. See alsoreference 4 above.
*22. U.S. Air Force. Hazardous Materials Cost Trade-Off Analysis Tool (HMCTAT). Thistool, scheduled for release in December 1996, is a revised and enhanced Windows formatversion of the DOS, version 3.3, Hazardous Materials Life Cycle Cost Estimator(HMLCCE). This tool facilitates trade-off analyses for weapon system processes that usehazardous materials; among the costs considered are potential legal/environmentalliability costs.
-109-
*23. U.S. Department of Commerce, National Oceanic and Atmospheric Administration(NOAA). Natural Resource Damage Assessments. Notice of Proposed Rulemaking. 59FR 1062. 15 CFR Part 990. January 7, 1994. This proposed rule summarized writtencomments and issues raised during the public meetings and workshops, and responded tothose comments. It was reproposed August 3, 1995 (60 FR 39804), and a final rule waspromulgated January 5, 1996 (61 FR 440), effective February 5, 1996. See also 59 FR32148 (June 22, 1994) (summary of comments received at regional workshops and noticeof availability of summary report) and 58 FR 4601 (January 15, 1993) (report of thepanel commissioned to evaluate the reliability of contingent valuation in calculatingpassive use values for natural resources). See also Appendix C of this report.
*24. U.S. Department of Defense (DoD). Environmental Leadership Project Office. AComparison of the True Costs of Landfill Disposal and Incineration of DoD HazardousWastes. Draft, prepared by ICF Technology, a division of ICF Incorporated. Washington, D.C. September 1984. This study analyzes the true costs of landfilling andincineration, including closure/post-closure costs, remediation costs, and liability costs,for certain hazardous wastes. The analysis is very detailed and well documented.
*25. U.S. . Department of Defense (DoD). Environmental Leadership Project Office. "Least-Cost DoD Hazardous Waste Management Strategies." Final Draft Report, prepared byICF Incorporated. Washington, D.C. June 1987. The purpose of this study was toexamine available alternatives for managing hazardous wastes and to develop an optimalstrategy for DoD as a whole, taking into account the potential costs of future liabilities. This study covered a wider range of wastes and waste management alternatives than thestudy described in reference 24 above.
*26. U.S. Department of the Interior. Hazardous Substances Natural Resource DamagesAssessment Regulations. 43 CFR Part 11. 59 FR 14261, March 25, 1994. (RevisedType B procedures, except for lost nonuse values.) See also 61 FR 20559, May 7, 1996(Type A procedures); 59 FR 40319, August 8, 1994 (Proposed revised rule for additionalType A procedure for assessing natural resource damages in Great Lakes Environment); 59 FR 63300, December 8, 1994 (Proposed revised Type A procedure for coastal andmarine environments); and 51 FR 27673, August 1, 1986 (Initial Type B procedure forsite-specific assessments; Supplementary Technical Information Documents identified). See also Natural Resource Damage Assessments; Final Rule, 52 FR 9042, March 20,1987 (Initial simplified Type A procedures). Also see Appendix C.
*27. U.S. Environmental Protection Agency. Office of Enforcement. BEN: A Model toCalculate the Economic Benefits of Noncompliance (User's Manual). Revised December1993. EPA 300-B-94-002. This document describes the BEN computer model, whichEPA developed to calculate the economic benefit of noncompliance with environmentalrequirements.
-110-
*28. U.S. Environmental Protection Agency. Office of Policy, Planning, and Evaluation andOffice of Solid Waste. Pollution Prevention Benefits Manual - Volume I: The Manualand Volume II: Appendices. October 1989. Prepared by ICF Incorporated. This manualpresents a two-step approach to the evaluation of pollution prevention projects: (1) costcalculations and (2) financial calculators. The manual introduced a four-tiered approachto assessing costs, with liability costs comprising the third tier. The manual contains adetailed hypothetical facility example as an illustration.
*29. U.S. Environmental Protection Agency. Office of Solid Waste. Post-Closure LiabilityTrust Fund Simulation Model: Volume 1. Model Overview and Results. Volume 2.Graphs and Tables of Model Results. Volume 3. Model Description. May 1985. Prepared by ICF Incorporated. This multivolume report documents a major study toforecast the potential environmental liabilities of active hazardous waste managementfacilities in compliance with applicable standards and following the end of their usefullives. The study evaluated legal regimes as cost allocators, developed liability costestimates, and employed a sophisticated Monte Carlo simulation model to addressuncertainties.
*30. U.S. Environmental Protection Agency, Region VII. Analysis of Kansas State Fund forApproval as Alternative Financial Assurance Mechanism. Draft document. Prepared byICF Incorporated. July 1991. This UST fund covers remediation liabilities as well ascompensation liabilities for all tanks.
31. U.S. Environmental Protection Agency, Region VII. Evaluation of Fund Amount for theNebraska Petroleum Release Remedial Action Cash Fund. Draft document. Prepared byICF Incorporated. November 1990. For qualifying operators or owners (e.g., incompliance with applicable regulations at the time the release occurred) of both aboveand below ground tanks, this fund covers costs of remediation only, not third-partyliability costs.
*32. U.S. Nuclear Regulatory Commission (NRC). FORECAST: Regulatory Effects CostAnalysis Software Manual, Version 4.1. NUREG/CR-5595 Rev. 1. July 1996. FORECAST runs on Microsoft Windows™ Version 3.1. Prepared by Science andEngineering Associates, Inc. This generic costing tool applies to most nuclear plantphysical and procedural or analytical modifications that may be required because of aregulatory change. NUREG/CR-4627 Generic Cost Estimates. Abstracts from GenericStudies for Use in Preparing Regulatory Impact Analyses, Rev. 2 (Feb. 1992) includes acomplete set of abstracts of the NRC's generic cost analysis methodology. Both of thesedocuments are available for a fee from U.S. NRC, Public Document Room, Washington,D.C. 20555, tel: (202) 634-3273 or 1-800-397-4209, fax: (202) 634-3343, e-mail:[email protected].
-111-
33. U.S. Nuclear Regulatory Commission. Reassessment of NRC's Dollar Per Person-RemConversion Factor Policy, NUREG-1530. December 1995. This report describes howand why NRC decided to revise its dollar per person rem conversion factor, which it usesas the monetary valuation of the health consequences associated with radiologicalexposure. Available for a fee from U.S. NRC, Public Document Room, Washington,D.C. 20555, tel: (202) 634-3273 or 1-800-397-4209, fax: (202) 634-3343, e-mail:[email protected].
34. Washington. Preassessment Screening and Oil Spill Compensation Schedule Regulations(Washington Administrative Code, Chapter 173.183-185). This compensation scheduleassesses damages resulting from an oil spill into fresh waters, marine waters, andestuarine waters. Although the questions used in the model are specific to Washingtonstate, they are also relatively straightforward.
35. Wisconsin, State of. Department of Industry, Labor & Human Relations and Departmentof Natural Resources. Skornicka, Carol and C.D. Besadny, Secretaries. Joint AgencyReport on the Petroleum Storage Remedial Action Fund (PECFA). October 1991. ThisUST fund covers remediation liabilities for all petroleum tanks but does not covercompensation liabilities.
*36. Wise, Kenneth T. and Pfeifenberger, Johannes P. Brattle/IRI. "Measuring Property ValueImpacts of Hazardous Waste Sites." Presented at the 88th Annual Meeting andExhibition, Air & Waste Management Association, Cincinnati, OH, June 1995. Thispaper describes the use of statistical analysis of housing sales data to estimate the impactof proximity to a hazardous waste site on property values, including a case studyillustration.
37. Wise, Kenneth T.; Koch, Gayle S.; and Ammann, Paul R. "Evaluating EnvironmentalCosts: Accounting for Uncertainties." Chemical Waste Litigation Reporter, Washington,D.C., February 1994. This paper describes how decision analysis can be used to evaluateremediation liabilities, including future remediation costs resulting from past operations. The result is a distribution of potential costs as well as an expected cost, illustrated by ahypothetical example.
-112-
Appendix C:Natural Resource Damage Valuation Guidance Documents
U.S. Department of Commerce, National Oceanic and Atmospheric Administration (NOAA).1996. Natural Resource Damage Assessment Guidance Document: Injury Assessment (OilPollution Act of 1990). National Oceanic and Atmospheric Administration, DamageAssessment and Restoration Program, Silver Spring, MD. Available for a fee from theNational Technical Information Service (NTIS), 5285 Port Royal Road, Springfield, VA 22161; telephone: (703) 487-4650. NTIS accession number: PB96-199427.
NOAA. 1996. Natural Resource Damage Assessment Guidance Document: Specifications forUse of NRDAM/CME Version 2.4 to Generate Compensation Formula (Oil Pollution Actof 1990). National Oceanic and Atmospheric Administration, Damage Assessment andRestoration Program, Silver Spring, MD. Available for a fee from the National TechnicalInformation Service (NTIS), 5285 Port Royal Road, Springfield, VA 22161; telephone:(703) 487-4650. NTIS accession number: PB96-199435.
U.S. Department of the Interior (DOI). 1996. The CERCLA Type A Natural Resource DamageAssessment Model for the Great Lakes Environments (NRDAM/GLE). U.S. Department ofthe Interior, Office of Environmental Policy and Compliance, Washington, D.C., Vol. I-III. Available for a fee from the National Technical Information Service (NTIS), 5285 PortRoyal Road, Springfield, VA 22161; telephone: (703) 487-4650. NTIS accession number:PB96-501770 (4/96). Computer diskettes containing the version 1.2 natural resourcesdamage assessment models can be obtained from the Department of the Interior. (Theversion 1.31 computer model is available in draft status.)
DOI. 1996. The CERCLA Type A Natural Resource Damage Assessment Model for Coastaland Marine Environments (NRDAM/CME). U.S. Department of the Interior, Office ofEnvironmental Policy and Compliance, Washington, D.C., Vol. I-VI. Available for a feefrom the National Technical Information Service (NTIS), 5285 Port Royal Road,Springfield, VA 22161; telephone: (703) 487-4650. NTIS accession number: PB96-501788 (4/96). Computer diskettes containing the version 1.2 natural resources damageassessment models can be obtained from the Department of the Interior. (The version 2.2computer model is available in draft status.)
DOI. 1987. Type B Technical Information Document: Application of Air Models to NaturalResource Injury Assessment. Available for a fee from the National Technical InformationService (NTIS), 5285 Port Royal Road, Springfield, VA 22161; telephone: (703) 487-4650. NTIS accession number: PB88-100128 (6/87).
DOI. 1987. Type B Technical Information Document: Approaches to the Assessment of Injuryto Soils Arising from Discharges of Hazardous Substances and Oil. Available for a feefrom the National Technical Information Service (NTIS), 5285 Port Royal Road,Springfield, VA 22161; telephone: (703) 487-4650. NTIS accession number: PB88-100144 (6/87).
-113-
DOI. 1987. Type B Technical Information Document: Injury to Fish and Wildlife Species.Available for a fee from the National Technical Information Service (NTIS), 5285 PortRoyal Road, Springfield, VA 22161; telephone: (703) 487-4650. NTIS accession number: PB88-100169 (6/87).
DOI. 1987. Type B Technical Information Document: Guidance on Use of Habitat EvaluationProcedures and Habitat Suitability Index Models for CERCLA Applications. Available fora fee from the National Technical Information Service (NTIS), 5285 Port Royal Road,Springfield, VA 22161; telephone: (703) 487-4650. NTIS accession number: PB88-100151 (6/87).
DOI. 1987. Type B Technical Information Document: Techniques to Measure Damages toNatural Resources. Available for a fee from the National Technical Information Service(NTIS), 5285 Port Royal Road, Springfield, VA 22161; telephone: (703) 487-4650. NTISaccession number: PB88-100136 (6/87).
See also the following:
American Petroleum Institute (API). Measuring Natural Resource Damages: An EconomicAppraisal. API Publication No. 4490. Washington, D.C. 1989.
Kopp, Raymond J. and V. Kerry Smith (eds.). Valuing Natural Assets and the Economics ofNatural Resource Damage Assessment. Resources for the Future, Washington, D.C. 1993.
An exposure draft is not considered authoritative.28
-114-
Appendix D:Authoritative Literature on Accounting for Environmental Liabilities
in Financial Statements
American Institute of Certified Public Accountants. Statement of Position 96-1: EnvironmentalRemediation Liabilities (Including Auditing Guidance). October 10, 1996.
Financial Accounting Standards Board (FASB).
FASB Statement No. 5: Accounting for Contingencies.FASB Interpretation No. 14: Reasonable Estimation of the Amount of a Loss - An
Interpretation of FASB Statement No. 5.Exposure Draft, Accounting for Certain Liabilities Related to Closure or Removal of Long-Lived Assets. 28
Financial Accounting Standards Board, Emerging Issues Task Force (EITF).
EITF Issue 89-13: Accounting for the Cost of Asbestos Removal. 1989.EITF Issue 90-8: Capitalization of Costs to Treat Environmental Contamination. 1990.EITF Issue 93-5: Accounting for Environmental Liabilities. 1993.
Governmental Accounting Standards Boards (GASB). GASB Statement No. 18: Accounting forMunicipal Solid Waste Landfill Closure and Post-Closure Care Costs. 1993.
U.S. Securities and Exchange Commission (SEC). 17 CFR Part 211. SEC Staff AccountingBulletin No. 92: Accounting and Disclosures Relating to Loss Contingencies. 1993.