Embed Size (px)
Citation preview
Value of NFL Public Goods 1
The Value of Public Goods Generated by a National Football League Team
Bruce K. Johnson1
Centre College
Michael J. Mondello
Florida State University
John C. Whitehead
Appalachian State University
June 20, 2005
1 Johnson is with Centre College, Department of Economics, Danville, Kentucky, 40422.
Mondello is with Florida State University, Sport Administration Program, Tallahassee, Florida,
32306. Whitehead is with Appalachian State University, Department of Economics, Boone,
North Carolina, 28608.
Value of NFL Public Goods 2
Abstract
Using the Contingent Valuation Method, this paper estimates the value of public goods
the National Football League’s Jaguars produce for Jacksonville, Florida, including the value of
elevating Jacksonville to “major league” status and the value of improving racial relations. It also
estimates the incremental value of public goods potentially produced by a National Basketball
Association team in Jacksonville. The present value of public goods created by the Jaguars is
$36.5 million or less, far below subsidies provided to attract the Jaguars. For a basketball team,
the figure is less than $22.8 million. The results add to the growing body of CVM literature
indicating that sports public goods probably cannot justify the large public expenditures on
stadiums and arenas.

Value of NFL Public Goods 3
Introduction
Most of the large and growing literature on the public financing of sports stadiums
concludes that the costs far exceed the benefits. While most studies measure only the benefits of
increased economic activity, including jobs, taxes, and income (e.g., Coates & Humphreys,
1999; Noll & Zimbalist, 1997; Siegfried & Zimbalist, 2000), a few others have attempted to
measure the benefits from environmental amenities, or public goods, produced by sports teams.
This paper builds on the small literature employing Contingent Valuation Method (CVM)
surveys to estimate the value of such public goods produced by sports as civic pride and
community spirit.2
Johnson and Whitehead (2000) first used a CVM survey to estimate the value of sports
public goods. They found that construction costs far exceeded the estimated value of public
goods for both a new University of Kentucky basketball arena and a minor league baseball
stadium in Lexington, Kentucky.
Johnson, Groothuis, and Whitehead (2001) extended the use of CVM surveys to public
goods generated by a major league team. They found that Pittsburgh residents valued the
National Hockey League (NHL) Penguins public goods between $17.2 million and $48.3
million, far short of the $200 million needed to build a hockey arena. Fenn and Crooker (2003)
2 Another approach, the estimation of compensating wage and rent differentials across cities, is
hampered by the fact that major league teams and other cultural amenities are highly correlated
with population (Rappaport & Wilkerson, 2001), making it hard to say to what extent the
differentials can be attributed to teams rather than museums, ethnic restaurants, and other
cultural amenities. One attempt is reported in Carlino and Coulson (2004).
Value of NFL Public Goods 4
found comparable results for the National Football League’s (NFL) Minnesota Vikings, with the
estimated public goods value much less than the cost of a new stadium.
Rappaport and Wilkerson (2001) criticized the low estimates of Johnson et al. (2001) by
noting the Penguins play the least popular of the major league sports and that, as one of three
major league teams in Pittsburgh, the willingness to pay for the Penguins may reflect a
diminishing marginal value of sports teams. Siegfried and Zimbalist (2000) suggested another
reason that might explain the low willingness to pay for the Penguins. Specifically, they noted
that residents may benefit if they believe a team’s presence confers “major league” status on
their city—something the Pirates and Steelers would do for Pittsburgh even if the Penguins were
to leave.
Rappaport and Wilkerson’s (2001) criticism of Johnson et al. (2001) underscores the
need for more CVM studies to inform the debate over public subsidy of sports stadiums. Because
of the inherent heterogeneities across local economies and sports environments, generalizing
from one or two CVM estimates of public goods values is difficult. This paper adds to the CVM
evidence by asking, what is the value of public goods generated by the NFL’s Jacksonville
Jaguars? As its only major league team, the Jaguars elevated Jacksonville into the ranks of cities
with major league teams. The Jacksonville CVM survey asked questions to elicit willingness to
pay for the public good of major league status, among others. The survey also allows a test of
whether cities derive declining marginal utility from additional sports teams by asking about
willingness to pay to attract a National Basketball Association (NBA) franchise to Jacksonville.
The results show residents of Jacksonville value their Jaguars public goods much less
than the amount of public money spent on Alltel Stadium’s renovation. Jacksonville residents
place an even lower value on NBA public goods, consistent with a declining marginal value of

Value of NFL Public Goods 5
teams. The results therefore answer important questions raised by the specifics of the Johnson et
al. (2001) Pittsburgh study and the Fenn and Crooker (2003) Minnesota study. The results
represent a significant contribution to our knowledge about the value of sports public goods.
Jacksonville The Jacksonville metropolitan statistical area (MSA) consists of Duval and three other
counties. The city of Jacksonville and Duval County share a merged government. In 2000, Duval
County contained 72.8 percent of the MSA’s 1,100,491 residents. Jacksonville in the 2000
census was the 46th largest MSA in the U.S. and except for Green Bay, Wisconsin, the smallest
market with a team in the NFL, NBA, or Major League Baseball.
To lure an NFL expansion franchise, Jacksonville spent $121 million to renovate
Municipal Stadium, built in 1946. It financed the renovations through a bond issue, various
taxes, and its 50 percent share3 of the stadium naming rights. The renamed Alltel Stadium
opened when the Jaguars began play in 1995.
Jacksonville’s winning an NFL expansion team in 1993 surprised many observers, who
did not consider it a major league city. One columnist wrote, “But Jacksonville?...Was the NFL
looking for a small, dumpy city with no TV market, no sports history, and a decrepit stadium?”
(Mike Littwin of the Baltimore Sun, as quoted in “What the columnists are saying,” p. 3C).
Many locals saw the Jaguars as transforming the city’s image. “After decades of enduring
jokes about their city’s backwoods image, Jacksonville business leaders finally believe it is in the
same league as the Charlottes, Tampas, and Atlantas of the world” (Williams, 1993). They also
3 Alltel, Inc. pays $620,000 per year for naming rights for 10 years ending in 2007, half of which
goes toward the city’s $121-million commitment.
Value of NFL Public Goods 6
thought the Jaguars would improve race relations and unite the various neighborhoods in the
widely dispersed city (Stone, 1993).
In expecting greater racial harmony and community spirit, Jacksonvillians were perhaps
looking to the experience of other cities. “It’s what the janitor, valet parker, lawyer, and venture
capitalist can all talk about when they are in an elevator together. Very few things in society
could bring people together like a local sports team can,” says an attorney for the NFL San Diego
Chargers (Rovell, 2002). The Detroit Tigers’ 1968 World Series championship has been credited
with defusing racial tensions (Miller, 2002). Better race relations are a public good. They
improve the quality of life for all residents of a city, whether they buy tickets to games or not.
Theory To illustrate the economic theory serving as the foundation for CVM analysis, consider
the following example. Suppose Mary achieves a certain reference level of utility from her
consumption of goods and services, including the goods produced by a local sports team. If she
is rational, she will achieve this reference level of utility by minimizing her expenditures to
achieve that reference level of utility.
If the local sports team leaves town, Mary’s utility will fall below its reference level
because she will no longer be able to consume private and public goods produced by the team.
To return to the reference level, she will have to spend more on other goods and services. For
instance, if she spent $100 per year on the team, she might have to spend $110 per year on other
goods to achieve the same utility she got from the team. The difference in the two spending
levels, in this case $10, is defined as the annual willingness to pay to keep the team in the local
market. Therefore, annual willingness to pay is the difference in spending needed to achieve the
reference level of utility without the team and the spending needed with the team.
Value of NFL Public Goods 7
Annual willingness to pay consists of willingness to pay for use values, or private goods,
and nonuse values, or public goods. Annual use value is the difference between total willingness
to pay and the willingness to pay for nonuse value. For people who value any sports goods,
whether public or private, annual willingness to pay is positive. For those who do not value
sports goods, annual willingness to pay is zero.4 The CVM survey sent to Jacksonville was
designed to elicit annual willingness to pay and, through the questions asked about consumption
of sports private and public goods, to allow willingness to pay to be broken into use and nonuse
values.
Experimental Design and Survey In April 2002, CVM surveys were mailed to a random sample of 1,200 households in
Duval County. The Post Office returned 69 surveys as undeliverable, or 5.75 percent of the total.
Of the other 1,131 surveys, 421 produced responses, for a response rate of 37.2 percent. Because
some people did not answer all the questions, only 367 surveys are used in this analysis.5
4 For a more rigorous development of the theory of willingness to pay for sports public goods,
see Johnson and Whitehead (2000) or Johnson et al. (2001).
5 Recipients first received a postcard alerting them to the imminent arrival of the survey. They
received another postcard a week after the survey reminding them to return the survey and
thanking them. About a month later, all non-respondents received another copy of the survey and
a letter asking them to complete and return the survey. As an incentive, recipients of either
mailing who returned the survey postmarked by a specified date became eligible to win $100.
The reminder postcard and the second survey mailing generated many responses.
Value of NFL Public Goods 8
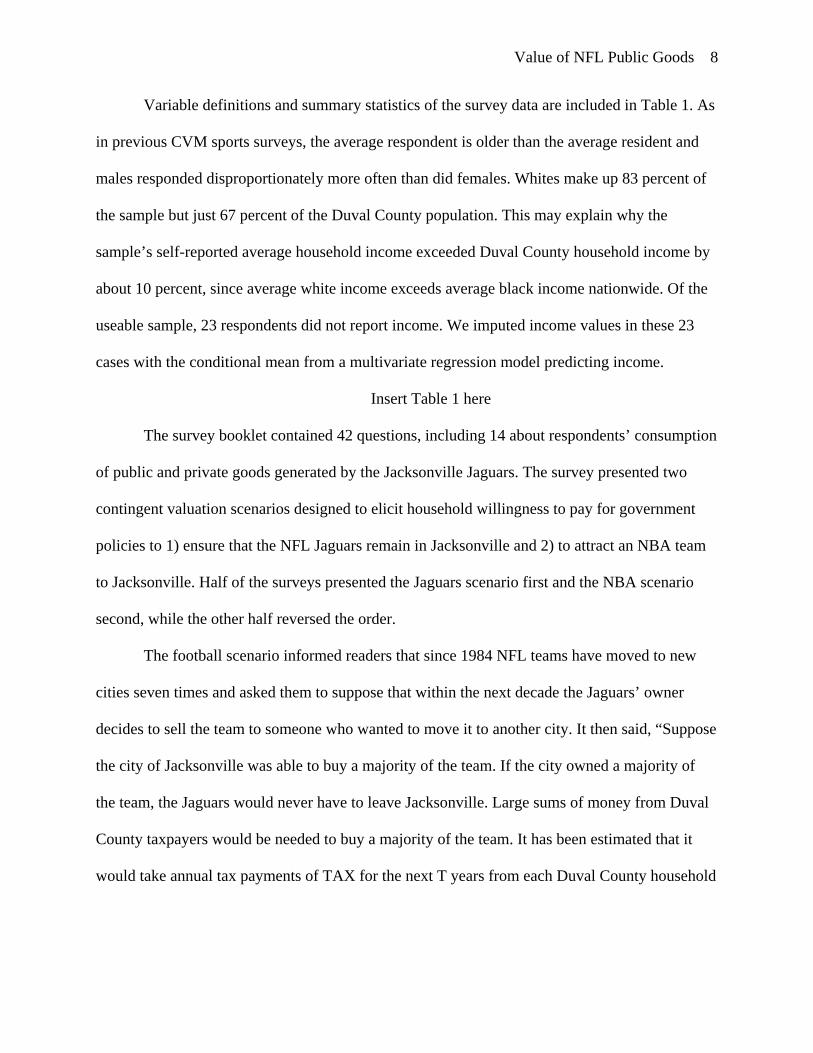
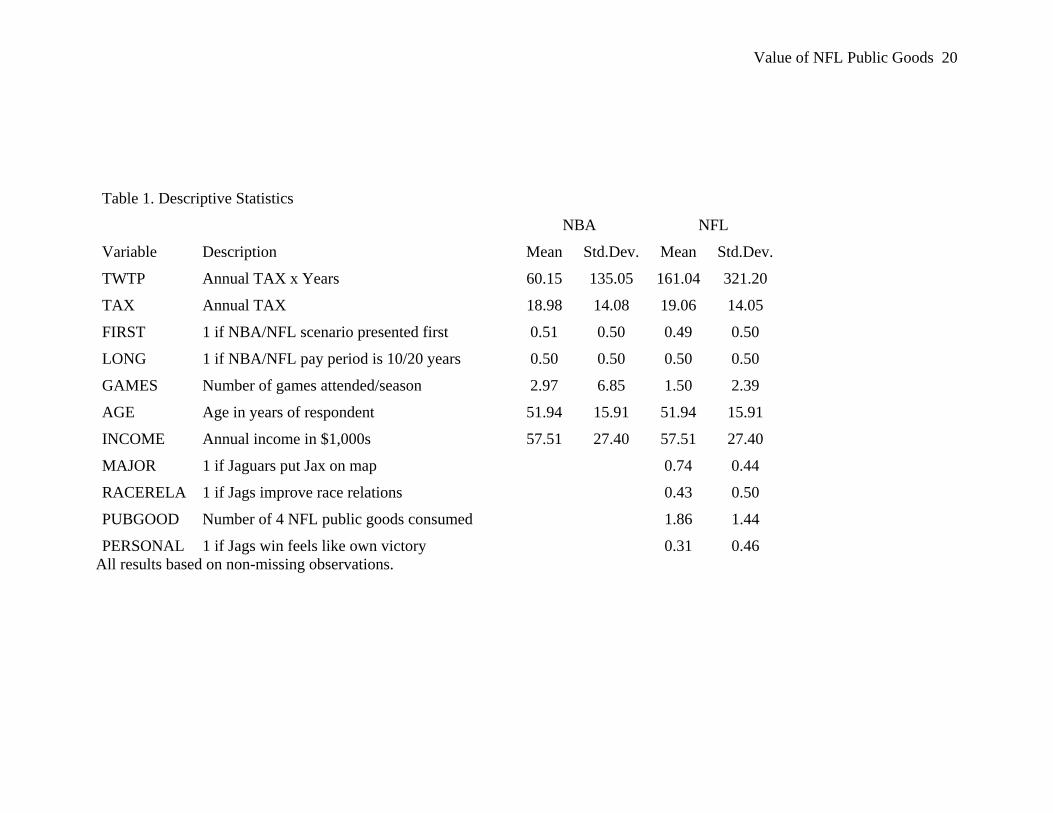
Variable definitions and summary statistics of the survey data are included in Table 1. As
in previous CVM sports surveys, the average respondent is older than the average resident and
males responded disproportionately more often than did females. Whites make up 83 percent of
the sample but just 67 percent of the Duval County population. This may explain why the
sample’s self-reported average household income exceeded Duval County household income by
about 10 percent, since average white income exceeds average black income nationwide. Of the
useable sample, 23 respondents did not report income. We imputed income values in these 23
cases with the conditional mean from a multivariate regression model predicting income.
Insert Table 1 here
The survey booklet contained 42 questions, including 14 about respondents’ consumption
of public and private goods generated by the Jacksonville Jaguars. The survey presented two
contingent valuation scenarios designed to elicit household willingness to pay for government
policies to 1) ensure that the NFL Jaguars remain in Jacksonville and 2) to attract an NBA team
to Jacksonville. Half of the surveys presented the Jaguars scenario first and the NBA scenario
second, while the other half reversed the order.
The football scenario informed readers that since 1984 NFL teams have moved to new
cities seven times and asked them to suppose that within the next decade the Jaguars’ owner
decides to sell the team to someone who wanted to move it to another city. It then said, “Suppose
the city of Jacksonville was able to buy a majority of the team. If the city owned a majority of
the team, the Jaguars would never have to leave Jacksonville. Large sums of money from Duval
County taxpayers would be needed to buy a majority of the team. It has been estimated that it
would take annual tax payments of TAX for the next T years from each Duval County household
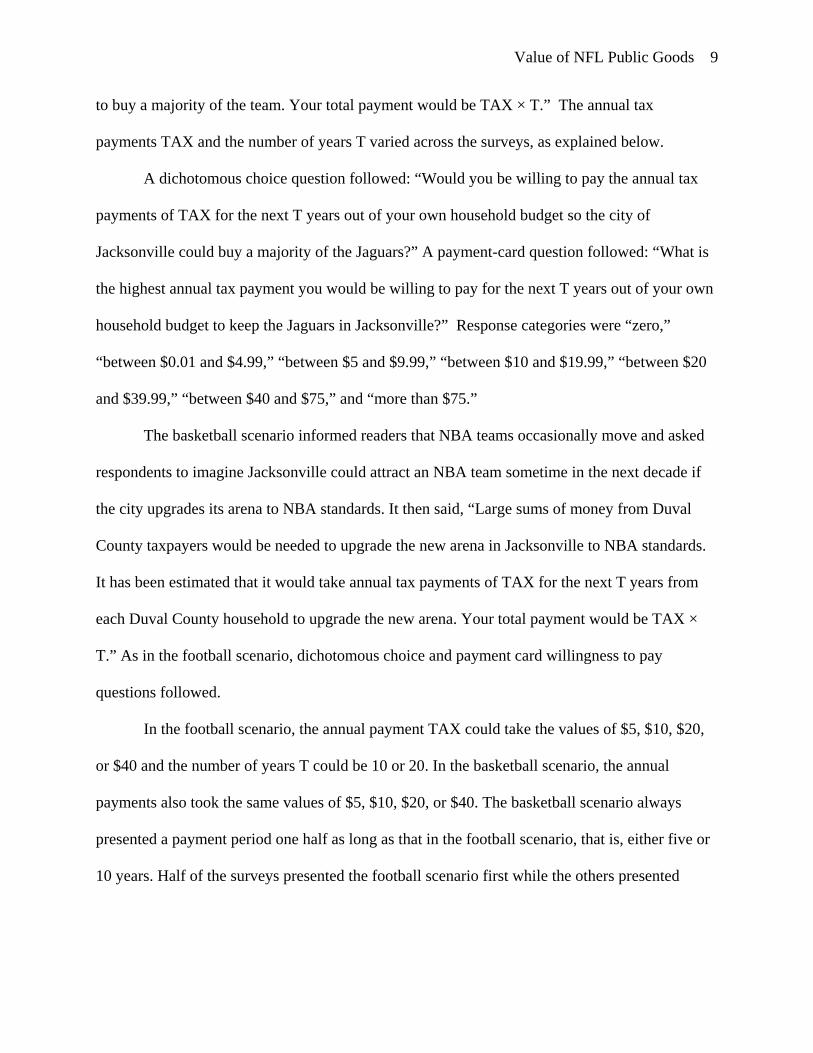
Value of NFL Public Goods 9
to buy a majority of the team. Your total payment would be TAX × T.” The annual tax
payments TAX and the number of years T varied across the surveys, as explained below.
A dichotomous choice question followed: “Would you be willing to pay the annual tax
payments of TAX for the next T years out of your own household budget so the city of
Jacksonville could buy a majority of the Jaguars?” A payment-card question followed: “What is
the highest annual tax payment you would be willing to pay for the next T years out of your own
household budget to keep the Jaguars in Jacksonville?” Response categories were “zero,”
“between $0.01 and $4.99,” “between $5 and $9.99,” “between $10 and $19.99,” “between $20
and $39.99,” “between $40 and $75,” and “more than $75.”
The basketball scenario informed readers that NBA teams occasionally move and asked
respondents to imagine Jacksonville could attract an NBA team sometime in the next decade if
the city upgrades its arena to NBA standards. It then said, “Large sums of money from Duval
County taxpayers would be needed to upgrade the new arena in Jacksonville to NBA standards.
It has been estimated that it would take annual tax payments of TAX for the next T years from
each Duval County household to upgrade the new arena. Your total payment would be TAX ×
T.” As in the football scenario, dichotomous choice and payment card willingness to pay
questions followed.
In the football scenario, the annual payment TAX could take the values of $5, $10, $20,
or $40 and the number of years T could be 10 or 20. In the basketball scenario, the annual
payments also took the same values of $5, $10, $20, or $40. The basketball scenario always
presented a payment period one half as long as that in the football scenario, that is, either five or
10 years. Half of the surveys presented the football scenario first while the others presented
Value of NFL Public Goods 10
basketball first. Given the permutations of the scenario ordering and the different TAX and T
values, 16 versions of the survey were sent out.
Both the football and basketball scenarios concluded with a pair of questions asking
people their reasons for their responses to the willingness to pay questions. The survey ended
with questions about household size, gender, race, age, tenure in Jacksonville, income,
education, and voting behavior.
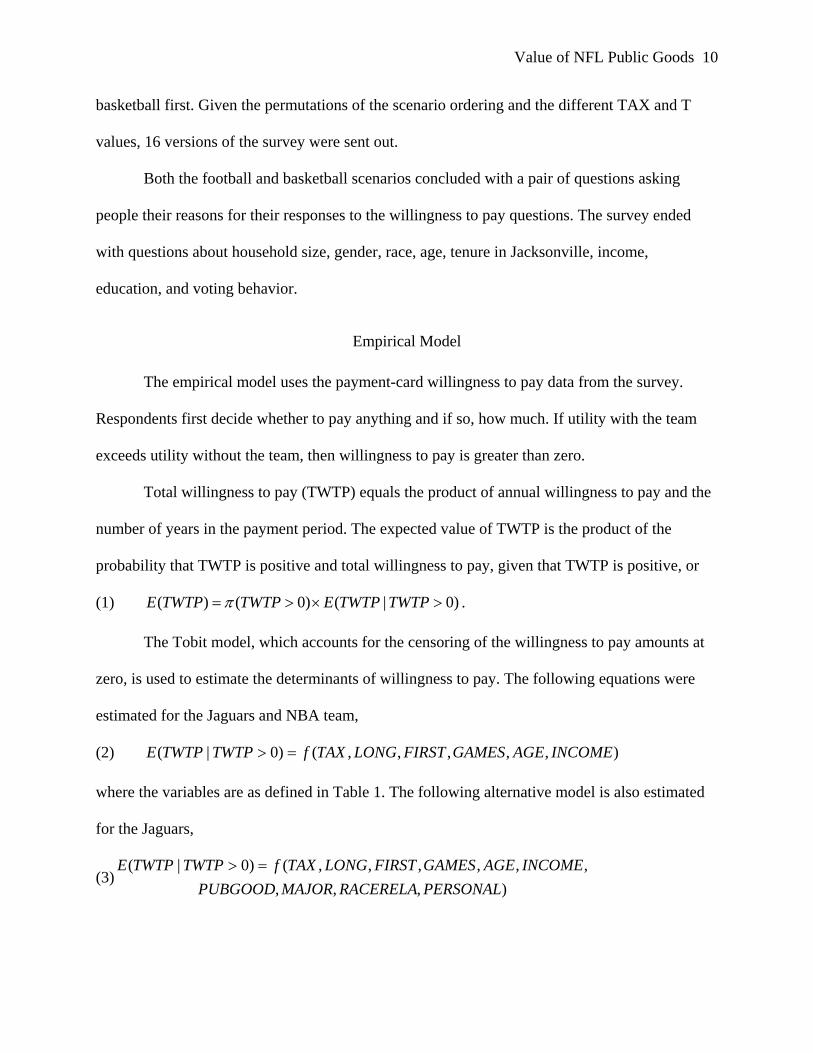
Empirical Model
The empirical model uses the payment-card willingness to pay data from the survey.
Respondents first decide whether to pay anything and if so, how much. If utility with the team
exceeds utility without the team, then willingness to pay is greater than zero.
Total willingness to pay (TWTP) equals the product of annual willingness to pay and the
number of years in the payment period. The expected value of TWTP is the product of the
probability that TWTP is positive and total willingness to pay, given that TWTP is positive, or
(1) )0|()0()( >×>= TWTPTWTPETWTPTWTPE π .
The Tobit model, which accounts for the censoring of the willingness to pay amounts at
zero, is used to estimate the determinants of willingness to pay. The following equations were
estimated for the Jaguars and NBA team,
(2) ),,,,,()0|( INCOMEAGEGAMESFIRSTLONGTAXfTWTPTWTPE =>
where the variables are as defined in Table 1. The following alternative model is also estimated
for the Jaguars,
(3)),,,
,,,,,,()0|(PERSONALRACERELAMAJORPUBGOOD
INCOMEAGEGAMESFIRSTLONGTAXfTWTPTWTPE =>
Value of NFL Public Goods 11
Including TAX in the model allows the detection and correction of starting point bias arising
from the initial dichotomous choice willingness to pay question. Starting point bias exists when a
suggested value affects subsequent valuation responses.
The number of Jaguars games attended during the past year and the number of potential
NBA games attended measure the intensity of use of the sports teams. Games attended are
potentially endogenous. An instrumental variables approach and a simultaneous equations Tobit
model were used to test for endogeneity. The instrumental variables approach includes the
predicted value of games as a covariate in the willingness to pay model. The simultaneous
equations model jointly estimates the determinants of games and willingness to pay with
correlated error terms (Whitehead, forthcoming). We find no evidence of endogeneity bias.
Inclusion of the games variable relative to the endogeneity models does not affect the estimation
of willingness to pay or the decomposition of willingness to pay into use and nonuse values.6
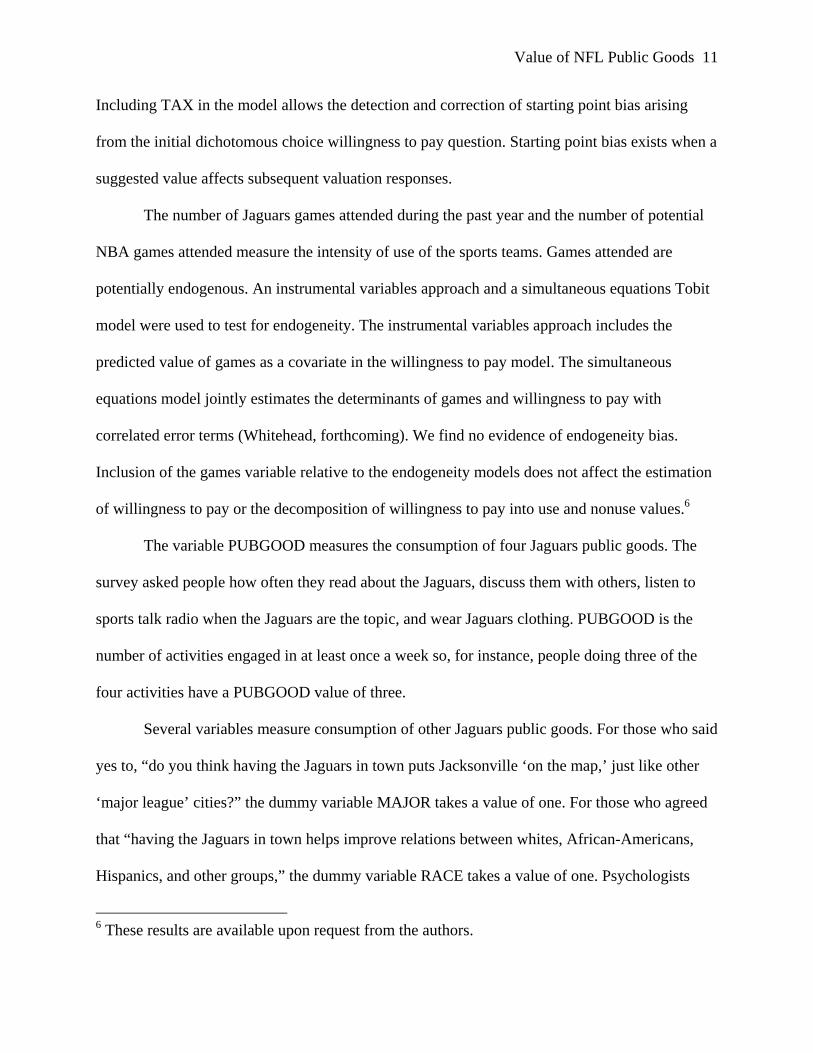
The variable PUBGOOD measures the consumption of four Jaguars public goods. The
survey asked people how often they read about the Jaguars, discuss them with others, listen to
sports talk radio when the Jaguars are the topic, and wear Jaguars clothing. PUBGOOD is the
number of activities engaged in at least once a week so, for instance, people doing three of the
four activities have a PUBGOOD value of three.
Several variables measure consumption of other Jaguars public goods. For those who said
yes to, “do you think having the Jaguars in town puts Jacksonville ‘on the map,’ just like other
‘major league’ cities?” the dummy variable MAJOR takes a value of one. For those who agreed
that “having the Jaguars in town helps improve relations between whites, African-Americans,
Hispanics, and other groups,” the dummy variable RACE takes a value of one. Psychologists
6 These results are available upon request from the authors.

Value of NFL Public Goods 12
have noted sports fans may feel a sense of personal victory when their teams win (End, Dietz-
Uhler, and Harrick, 2002). For respondents who said a Jaguars win “always,” “usually,” or
“sometimes” feels like a personal victory, PERSONAL takes a value of one. The coefficients on
PUBGOOD, MAJOR, RACE, and PERSONAL should be positive.
Results
Tobit regression results appear in Table 2. The dependent variable is TWTP, or annual
willingness to pay times the payment period. For instance, TWTP for those who said they were
willing to pay $25 per year for 10 years is $250.
Insert Table 2 here
In the NBA Tobit model, several factors increase total willingness to pay. If the NBA
scenario appears first, total willingness to pay rises by $33.75.7 Total willingness to pay is
$23.59 higher if the payment period is longer. Total willingness to pay increases by $4.77 for
each game the respondent expects to attend. Also, the NBA team is a normal good with a
positive and statistically significant coefficient on income. But willingness to pay for the NBA
falls with the age of the respondent, and the insignificant coefficient on TAX indicates that
starting point bias is not present.
In the NFL(1) Tobit model, willingness to pay also rises in the long scenario, by about
$44.09. The marginal Jaguars game attended is worth $35.50, compared to $4.77 for the
marginal NBA game. This may reflect relative scarcities, with eight home games in the NFL
versus 41 in the NBA. None of the other independent variables are statistically significant at the
5 percent level. Starting point bias does not exist and total willingness to pay does not differ
7 All hypothesis testing is conducted at the 5 percent level of significance.
Value of NFL Public Goods 13
whether the NFL scenario is presented first or second. The coefficients on income and age are
not statistically significant.
The NFL(2) model includes more measures of public goods and nonuse values than the
first model. In the second model, in contrast to the first, total willingness to pay rises with
income and falls with age. Total willingness to pay is higher if respondents think that the Jaguars
make Jacksonville a major city or if they think the team improves race relations. The coefficient
on PERSONAL is not significant at the 5 percent level, so those thinking a Jaguars win is a
personal victory are not willing to pay more. The significance of other variables included in the
first model remains unchanged.
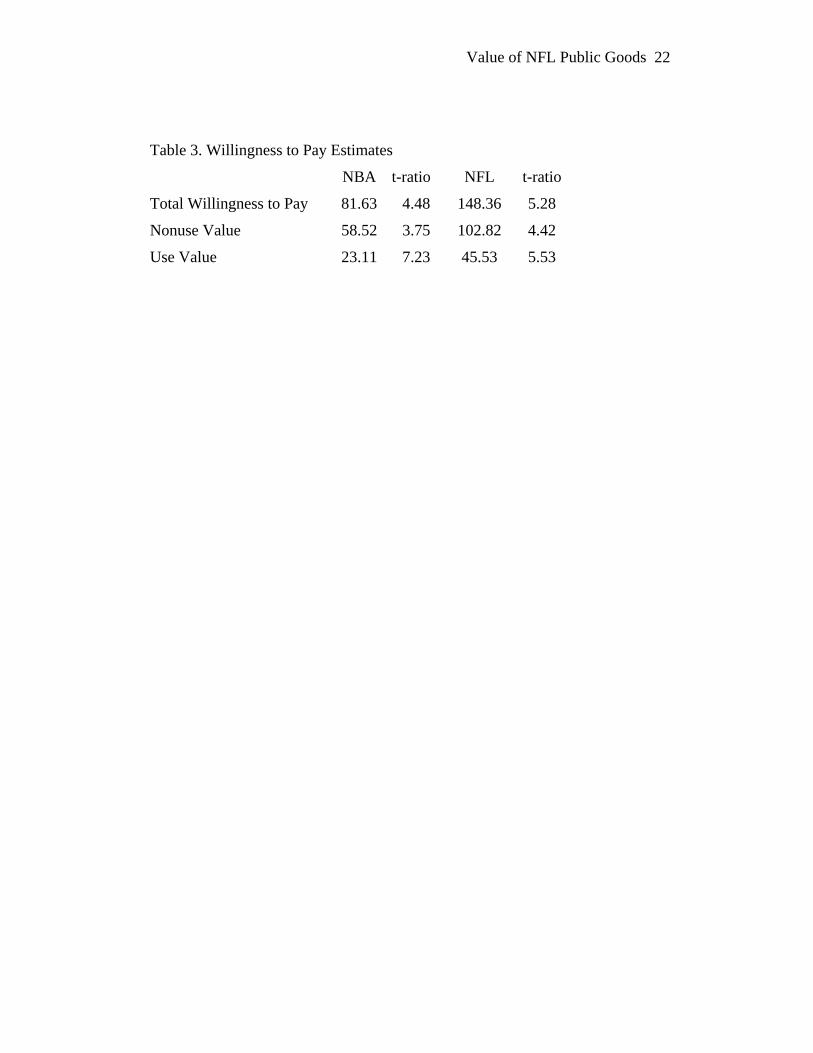
Table 3 presents estimated total willingness to pay per household. The variable FIRST is
set as if the NBA and NFL scenarios were both presented first and the payment period is set for
the longer time period, 10 years for the NBA and 20 years for the Jaguars. Both decisions either
raise willingness to pay or leave it unaffected. Mean values of all other variables are used. The
first NFL model is used for the football scenario.
Insert Table 3 here
Table 3 also shows total willingness to pay broken down into use and nonuse values.
Nonuse value is estimated by setting the game attendance variables equal to zero, with all other
variables set at their mean values. Use value is the residual difference between total willingness
to pay and nonuse value. Total willingness to pay for the NBA over the long period (10 years) is
$81.63, or about $8.16 per year. Use value is 28 percent of total willingness to pay for the NBA.
Total willingness to pay for the Jaguars is $148.36 over the long period (20 years), or about
$7.42 per year. Use value is 30 percent of total willingness to pay for the Jaguars.
Value of NFL Public Goods 14
Policy Implications and Conclusions
The annual willingness to pay reported in Table 3 represents the estimated annual
benefits per household generated by the Jaguars and an NBA team in Jacksonville. The
discounted present values of those benefits represent the capital values of the benefits per
household. In discounting the annual benefit streams, we employed two different discount rates,
2 percent and 7 percent, as recommended by the Congressional Budget Office and the Office of
Management and Budget, respectively, for benefit cost analyses of federal programs (Hartman,
1990; Office of Management and Budget, 1992).8 To determine whether the benefits generated
by a team exceed the costs of a subsidy, the capital values of the benefits must be aggregated
over all households so the total can be compared to the subsidy.
To aggregate the capital values across households, we multiplied the estimated capital
values per household by the total number of households in the Jacksonville MSA.9 This provides
an upper bound to the capital values because it assumes that the non-respondent households, had
they answered the surveys, would have answered them in the same way as the respondent
households.10 If, however, non-respondents did not return the surveys because they had no
interest in sports and no willingness to pay, the upper-bound estimates may be overestimated.
8 JGW used an 8 percent discount rate. Rappaport and Wilkerson discounted JGW’s estimated
willingness to pay at 6 percent.
9 We assume the households in counties other than Duval are otherwise identical to those in
Duval County in terms of their willingness to pay.
10 If households beyond the MSA would be willing to pay to keep the Jaguars in town or to
attract an NBA team, even these upper-bound aggregate values are understated because no
households beyond the MSA are included in the estimates.
Value of NFL Public Goods 15
Lower-bound estimates are computed by multiplying the upper-bound estimates by the
survey response rate of 37.2 percent on the assumption that the non-response rate reflects a
willingness to pay nothing. The lower-bound estimates almost certainly understate true
willingness to pay since some non-respondents would have been willing to pay some positive
amount but may have failed to return their surveys for a variety of reasons—they may have lost
them, not read them, or not wanted to fill them out. The true aggregate capital values for the
MSA likely lie somewhere between the upper and lower bounds.
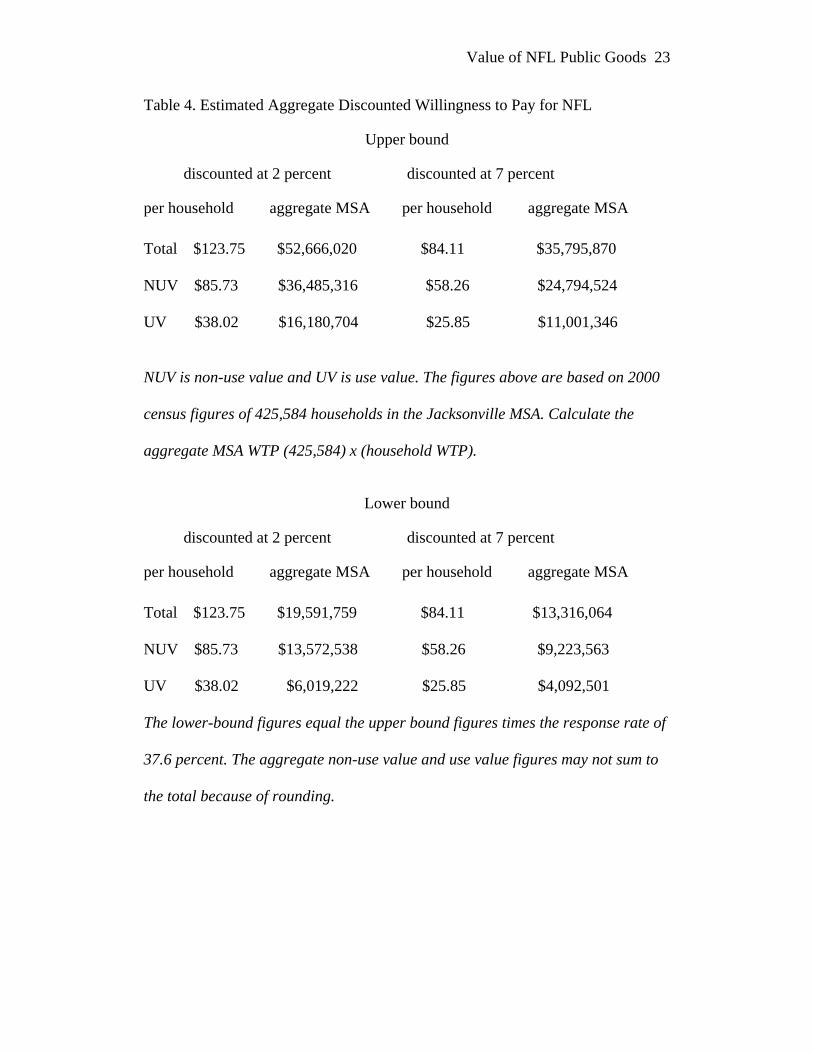
Table 4 shows the upper- and lower-bound capital values for the Jaguars discounted at
both 2 percent and 7 percent. Even at 2 percent, the upper-bound capital value of keeping the
Jaguars in town is less than $53 million, while the lower-bound value is $19.6 million, compared
to $121 million in public money provided for the renovation of Alltel Stadium. At a 7 percent
discount, the upper-bound capital value falls below $36 million, the lower-bound to $13.3
million.
Insert Table 4 here
Table 4 also shows the breakdown of the capital values into use values, or private goods
values, and nonuse values, or public goods values. The upper-bound capital value of public
goods discounted at 2 percent is about $36.5 million. The lower-bound value is about $13.6
million. Discounted at 7 percent, the upper- and lower-bound values drop to about $24.8 million
and $9.2 million.
Table 5 shows the present discounted aggregate willingness to pay to attract an NBA
team. The same discount rates and aggregation procedures used in the NFL calculations in Table
4 were used in Table 5. Because survey respondents indicated a lower willingness to pay for an
NBA team than for the Jaguars, the capital values reported in Table 5 are much lower than those
Value of NFL Public Goods 16
in Table 4. The upper-bound willingness to pay, discounted at 2 percent, is about $31.8 million,
of which just about $22.8 million is for nonuse value. The lower-bound value is about $11.8
million, of which about $8.5 million is for nonuse value.
Insert Table 5 here
The estimated use values reported in Tables 4 and 5 represent the value of consumer
surplus derived by Jacksonville residents from attending games. Alexander, Kern, and Neill
(2000) and Irani (1997) estimated consumer surplus from attending games using known ticket
prices and by making assumptions about the elasticity of demand. Their estimates of consumer
surplus exceed those produced by this CVM survey.
While consumer surplus is usually counted in benefit cost analyses, it may be
inappropriate to do so in the case of publicly financed stadiums. Major league sports teams enjoy
substantial local monopoly power given their exclusive territories. Teams have begun to exploit
increasingly their market power to extract as much consumer surplus as possible. For example,
they price discriminate through quantity discounts in the form of season tickets and other
multiple-games packages. They also do so through two-part tariffs such as personal seat licenses.
To the extent that consumer surplus can be captured through such pricing mechanisms, the teams
can force fans to pay closer to their reservation prices for the private sports goods they consume.
Surplus that teams can capture cannot be used to justify public subsidy on efficiency grounds.
Compared to typical construction costs exceeding $300 million for a new football
stadium and $200 million for a new NBA arena, the nonuse values estimated in Duval County
fall far short of the amounts needed to construct new stadiums. The upper bound estimated MSA
nonuse value for the Jaguars even falls far short of the $121 million city-paid renovation costs of
Alltel Stadium.
Value of NFL Public Goods 17
The upper- and lower-bound nonuse values for the Penguins estimated by Johnson et al.
(2001) were $48.3 million and $17.2 million, substantially higher than the Jaguars values
estimated here, and the Penguins values were calculated using an 8 percent discount rate. Had
Johnson et al. discounted the Penguins willingness to pay at 2 percent, the gap between the
Penguins and Jaguars figures would have been much higher. This may seem somewhat
surprising since the NFL is far more popular than the NHL and the Penguins, as one of three
major league teams in Pittsburgh, should have less impact than the Jaguars.
Two factors help explain the discrepancy. First, the Penguins figures rest on the
assumption people would pay the annual taxes in perpetuity, but respondents may have had a
finite period in mind. If many respondents assumed a short payment period, the Johnson et al.
(2001) estimates overstate true willingness to pay.
Second, Pittsburgh is bigger than Jacksonville. It has about 950,000 MSA households to
Jacksonville’s 425,000. Even if per capita willingness to pay were twice as high in Jacksonville,
the aggregate willingness to pay for the Penguins would exceed that for the Jaguars.
Willingness to pay for the NBA team was even lower than the Jaguars. Several possible
reasons exist. First, an NBA team would be the second major league team in Jacksonville and
consequently the marginal impact on Jacksonville’s status as a major league city and on other
sports public goods would be less than the Jaguars’. Second, the most popular sport among the
respondents was football, with those naming the NFL as their favorite sport outnumbering those
naming the NBA as their favorite by a 10 to one margin. Third, the endowment effect may be at
work. Specifically, people place a higher value on goods they already own than on similar goods
they do not own.

Value of NFL Public Goods 18
If some critics of CVM are correct, even the low figures found in CVM sports studies are
overstated. They claim CVM overstates willingness to pay for public goods and that willingness
to pay estimates should be calibrated to correct for hypothetical bias. The National Oceanic and
Atmospheric Administration in 1994 proposed a default calibration of dividing reported
willingness to pay by two to correct for bias in environmental CVM analyses (Diamond &
Hausman, 1994). To the extent the critics are correct, the estimates reported in this paper for the
value of public goods generated by the Jaguars, low as they are, may nevertheless be biased
upward.11
Even if the Jacksonville estimates are not biased upward, much larger cities with similar
per capita willingness to pay would be unable to justify paying the full cost of a new basketball
arena or outdoor stadium. For example, the Chicago MSA is about nine times as large as
Jacksonville. If Chicagoans have the same discounted per capita willingness to pay for football
public goods as Jacksonvillians, the aggregate upper bound willingness to pay would be about
$329 million, discounted at 2 percent. Discounted at 7 percent, Chicago’s upper bound would be
only about $223 million. However, Chicago has five major league teams, so per capita
willingness to pay may be less than in Jacksonville. If so, Chicago’s aggregate willingness to pay
would be less than these estimates. It is unlikely that the recent $600 million renovation of city-
11 To the extent that nonresidents of the MSA may benefit from the Jaguars, the results reported
here underestimate the value of public goods. However, since NFL teams do not market
themselves beyond a radius of 75 miles and since other NFL teams in Florida and Georgia
provide public goods not far from Jacksonville, we assume Jaguars public goods beyond the
MSA provide little value.
Value of NFL Public Goods 19
owned Soldier Field, home of the NFL Bears, could be justified by the Bears’ public goods
value.
Because the Jaguars have not threatened to relocate to another city, it is possible that
some survey respondents may have underestimated their willingness to pay, because they have
never been forced to seriously consider the possibility of losing their team. Fenn and Crooker
(2003) used CVM to estimate willingness to pay for the NFL Minnesota Vikings, a team that has
threatened to relocate. The low values of willingness to pay found by Fenn and Crooker suggest
that the Jacksonville results would not change much if the perceived probability of relocation
were to increase substantially.
Since every city and sport is to some extent unique, caution must be exercised in
generalizing the Jacksonville results to other cities. However, the evidence from CVM studies,
including Johnson and Whitehead (2000), Johnson et al. (2001), Fenn and Crooker (2003), and
now Jacksonville, weighs heavily against the notion that the public goods values approach the
costs of stadium subsidies. The Jacksonville results, in particular, suggest that the willingness to
pay for a team that provides its city with major league status is not very high and that the
marginal value of additional teams is declining. Coupled with the large body of literature finding
negligible economic impact of teams and stadiums on city and regional economies, the CVM
results strengthen the case against public subsidy. Nevertheless, given the uniqueness of each
case, additional CVM research is recommended to test other scenarios involving other leagues,
teams, and cities.
Value of NFL Public Goods 20
Table 1. Descriptive Statistics
NBA NFL
Variable Description Mean Std.Dev. Mean Std.Dev.
TWTP Annual TAX x Years 60.15 135.05 161.04 321.20
TAX Annual TAX 18.98 14.08 19.06 14.05
FIRST 1 if NBA/NFL scenario presented first 0.51 0.50 0.49 0.50
LONG 1 if NBA/NFL pay period is 10/20 years 0.50 0.50 0.50 0.50
GAMES Number of games attended/season 2.97 6.85 1.50 2.39
AGE Age in years of respondent 51.94 15.91 51.94 15.91
INCOME Annual income in $1,000s 57.51 27.40 57.51 27.40
MAJOR 1 if Jaguars put Jax on map 0.74 0.44
RACERELA 1 if Jags improve race relations 0.43 0.50
PUBGOOD Number of 4 NFL public goods consumed 1.86 1.44
PERSONAL 1 if Jags win feels like own victory 0.31 0.46 All results based on non-missing observations.

Value of NFL Public Goods 21
Table 2. Tobit Regression Models: Dependent Variable = TWTP NBA NFL (1) NFL (2)
Variable Coeff. t-ratio Marg. Effect Coeff. t-ratio
Marg. Effect Coeff. t-ratio
Marg. Effect
ONE -173.26 -2.83 -56.67 -276.93 -2.01 -117.59 -655.81 -4.45 3.46 TAX -2.35 -1.49 -0.77 3.14 1.45 1.33 2.41 1.16 0.92 FIRST 103.17 3.65 33.75 -20.59 -0.34 -8.74 3.46 0.06 1.32 LONG 72.11 2.43 23.59 103.82 1.72 44.09 117.06 2.04 44.76 GAMES 14.58 11.06 4.77 83.59 6.52 35.5 31.15 2.35 11.91 AGE -1.78 -2.12 -0.58 -2.37 -1.2 -1.01 -5.73 -2.87 -2.19 INCOME 1.43 2.84 0.47 1.36 1.17 0.58 1.97 1.75 0.75 PUBGOOD 111.42 4.17 42.61 MAJOR 332.42 3.62 127.12 RACERELA 153.3 2.41 58.62 PERSONAL 105.73 1.55 40.43 Heteroskedasticity TAX 0.02 3.52 σ 156.99 11.79 500.95 16.82 453.42 17.18 Log-Likelihood -1039.28 -1389.5 -1346.97
Value of NFL Public Goods 22
Table 3. Willingness to Pay Estimates
NBA t-ratio NFL t-ratio
Total Willingness to Pay 81.63 4.48 148.36 5.28
Nonuse Value 58.52 3.75 102.82 4.42
Use Value 23.11 7.23 45.53 5.53
Value of NFL Public Goods 23
Table 4. Estimated Aggregate Discounted Willingness to Pay for NFL
Upper bound
discounted at 2 percent discounted at 7 percent
per household aggregate MSA per household aggregate MSA Total $123.75 $52,666,020 $84.11 $35,795,870 NUV $85.73 $36,485,316 $58.26 $24,794,524 UV $38.02 $16,180,704 $25.85 $11,001,346
NUV is non-use value and UV is use value. The figures above are based on 2000
census figures of 425,584 households in the Jacksonville MSA. Calculate the
aggregate MSA WTP (425,584) x (household WTP).
Lower bound
discounted at 2 percent discounted at 7 percent
per household aggregate MSA per household aggregate MSA Total $123.75 $19,591,759 $84.11 $13,316,064 NUV $85.73 $13,572,538 $58.26 $9,223,563 UV $38.02 $6,019,222 $25.85 $4,092,501 The lower-bound figures equal the upper bound figures times the response rate of
37.6 percent. The aggregate non-use value and use value figures may not sum to
the total because of rounding.

Value of NFL Public Goods 24
Table 5. Estimated Aggregate Discounted Willingness to Pay for NBA
Upper bound
discounted at 2 percent discounted at 7 percent
per household aggregate MSA per household aggregate MSA Total $74.76 $31,816,660 $61.32 $26,096,811 NUV $53.69 $22,811,302 $44.04 $18,708,673 UV $21.26 $9,005,357 $17.43 $7,388,138 NUV is non-use value and UV is use value. The figures above are based on 2000
census figures of 425,584 households in the Jacksonville MSA. Calculate the
aggregate MSA WTP (425,584) x (household WTP). The aggregate NUV and UV
figures may not sum to the total because of rounding.
Lower bound
discounted at 2 percent discounted at 7 percent
per household aggregate MSA per household aggregate MSA Total $74.76 $11,835,797 $61.32 $9,708,014 NUV $53.69 $8,485,805 $44.04 $6,959,626 UV $21.26 $3,349,993 $17.43 $2,748,387 The lower-bound figures equal the upper-bound figures times the response rate of
37.6 percent. The aggregate non-use value and use value figures may not sum to
the total because of rounding.

Value of NFL Public Goods 25
Acknowledgements Centre College and Florida State University provided funding for this
project. The authors thank Dennis Coates, economics department workshop
participants at Louisiana State University, and several anonymous referees for
helpful comments.
References
Alexander, D. L., Kern, W. & Neill, J. (2000). Valuing the consumption
benefits from professional sports franchises. Journal of Urban Economics, 48(2),
321- 337.
Carlino, G. & Coulson, N.E. (2004). Compensating differentials and the
social benefits of the NFL. Journal of Urban Economics, 56(1), 25-50.
Coates, D. & Humphreys, B. R. (1999). The growth effects of sports
franchises, stadia, and arenas. Journal of Policy Analysis and Management, 18(4),
601-24.
Diamond, P. A. & Hausman, J. A. (1994). Contingent valuation: Is some
number better than no number? Journal of Economic Perspectives, 8(4), 45-64.
End, C. M., Dietz-Uhler, B., & Harrick, E. A. (2002). Identifying with
winners: A reexamination of sport fans' tendency to BIRG. Journal of Applied
Social Psychology, 32(5), 1017-1030.
Fenn, A. J., & Crooker, J. R. (2003). The willingness to pay for a new
Vikings stadium. Paper presented at the 2003 Western Economic Association
Meetings, Denver, CO.
Value of NFL Public Goods 26
Hartman, R.W. (1990). One thousand points of light seeking a number: A
case study of CBO’s search for a discount rate policy. Journal of Environmental
Economics and Management, 18(2), S3-7.
Irani, D. (1997). Public subsidies to stadiums: Do the costs outweigh the
benefits? Public Finance Review, 25(2), 238-253.
Johnson, B. K., & Whitehead, J.C. (2000). Value of public goods from
sports stadiums: The CVM approach. Contemporary Economic Policy, 18(1), 48-
58.
Johnson, B. K., Groothuis, P. A., & Whitehead, J. C. (2001). The value of
public goods generated by a major league sports team: The CVM approach.
Journal of Sports Economics, 2(1), 6-21.
Miller, John J. (2002, July 30). A city on fire. National Review, retrieved
March 1, 2003, from Lexis-Nexis.
Noll, R. G., & Zimbalist, A. (1997). The economic impact of sports teams
and facilities. In R. G. Noll, & A. Zimbalist (Eds.), Sports, jobs, and taxes: The
economic impact of sports teams and stadiums (pp. 55-91). Washington, DC: The
Brookings Institution.
Office of Management and Budget, Circular No. (1992, October 29). A-94
Revised (Transmittal Memo No. 64), Washington, DC. Retrieved April 4, 2004,
from http://www.whitehouse.gov/omb/circulars/a094/a094.html.
Rappaport, J. & Wilkerson, C. (2001, First Quarter). What are the benefits
of hosting a major league sports franchise? Federal Reserve Bank of Kansas City
Economic Review, 55-86.

Value of NFL Public Goods 27
Rovell, D. (2002, September 19). What’s the lease you can do? Retrieved
October 15, 2003 from
http://sports.espn.go.com/espn/print?id=1434048&type=story.
Siegfried, J. & Zimbalist, A. (2000). The economics of sports facilities and
their communities. Journal of Economic Perspectives, 14(3), 95-114.
Stone, A. (1993, December 2). Jacksonville ‘ready to take off’/NFL
franchise seen as a catalyst. USA Today, p. 10A, retrieved September 1, 2002
from Lexis-Nexis.
What the columnists are saying. (1993, December 2). USA Today, p. 3C,
retrieved September 1, 2002, from Lexis-Nexis.
Whitehead, John C., "Combining Contingent Valuation and Behavior Data
with Limited Information" Resource and Energy Economics, 27(2), 143-155.
Williams, M. (1993, December 12). NFL team boosts Jacksonville’s
image. Atlanta Constitution, p. H6, retrieved September 1, 2002, from Lexis-
Nexis.