Embed Size (px)
Citation preview
Presented by
Value for Money Scrutiny Committee -
Treasury Management Strategy &
Annual Investment Strategy 2013/14
Chris Scott, Director
Lincolnshire County Council - 26th February
2013
Member Briefing Treasury Management
Structure of the
Presentation
Lincolnshire County Council
1. Market Update
2. Investment Strategy
3. Debt Management
4. Questions
2

Member Briefing Treasury Management
Market Update
3
Lincolnshire County Council
Member Briefing Treasury Management
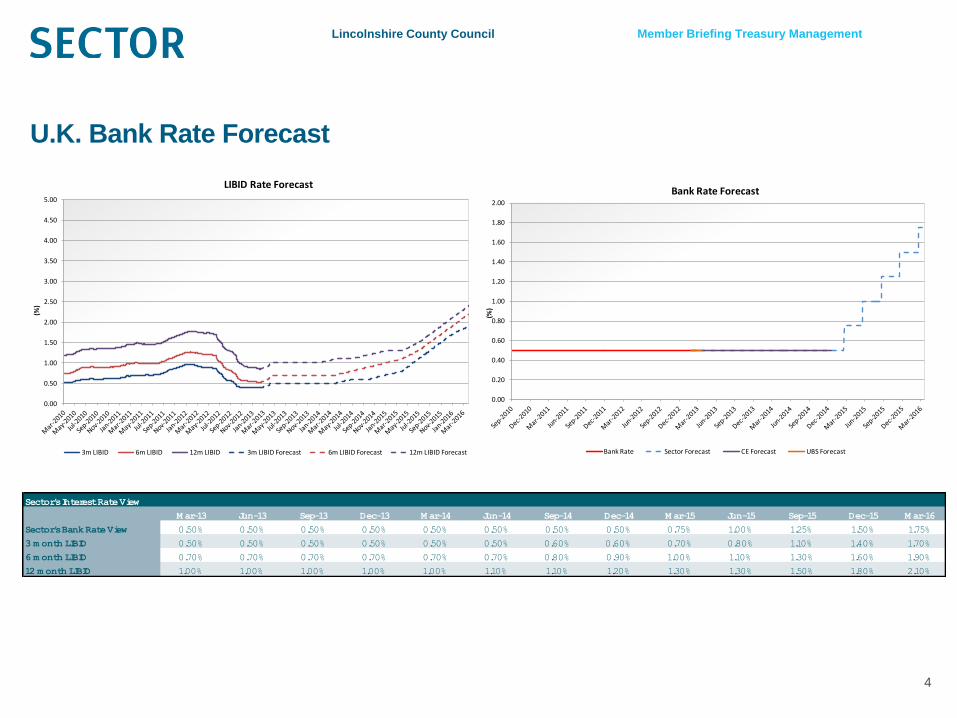
U.K. Bank Rate Forecast
4
Lincolnshire County Council
Sector's Interest Rate View
M ar-13 Jun-13 Sep-13 Dec-13 M ar-14 Jun-14 Sep-14 Dec-14 M ar-15 Jun-15 Sep-15 Dec-15 M ar-16
Sector's Bank Rate View 0.50% 0.50% 0.50% 0.50% 0.50% 0.50% 0.50% 0.50% 0.75% 1.00% 1.25% 1.50% 1.75%
3 m onth LIBID 0.50% 0.50% 0.50% 0.50% 0.50% 0.50% 0.60% 0.60% 0.70% 0.80% 1.10% 1.40% 1.70%
6 m onth LIBID 0.70% 0.70% 0.70% 0.70% 0.70% 0.70% 0.80% 0.90% 1.00% 1.10% 1.30% 1.60% 1.90%
12 m onth LIBID 1.00% 1.00% 1.00% 1.00% 1.00% 1.10% 1.10% 1.20% 1.30% 1.30% 1.50% 1.80% 2.10%
0.00
0.50
1.00
1.50
2.00
2.50
3.00
3.50
4.00
4.50
5.00
(%)
LIBID Rate Forecast
3m LIBID 6m LIBID 12m LIBID 3m LIBID Forecast 6m LIBID Forecast 12m LIBID Forecast
0.00
0.20
0.40
0.60
0.80
1.00
1.20
1.40
1.60
1.80
2.00
(%)
Bank Rate Forecast
Bank Rate Sector Forecast CE Forecast UBS Forecast
Member Briefing Treasury Management
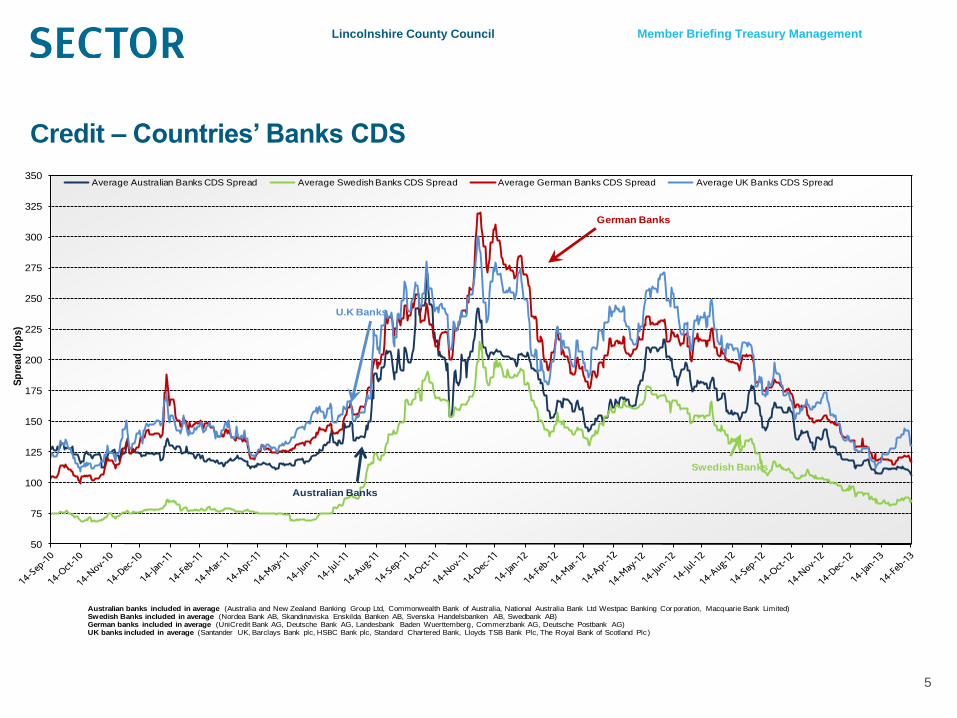
Credit – Countries’ Banks CDS
5
Lincolnshire County Council
50
75
100
125
150
175
200
225
250
275
300
325
350
Sp
read
(b
ps)
Average Countries' Bank CDS Spread
Average Australian Banks CDS Spread Average Swedish Banks CDS Spread Average German Banks CDS Spread Average UK Banks CDS Spread
Australian banks included in average (Australia and New Zealand Banking Group Ltd, Commonwealth Bank of Australia, National Australia Bank Ltd Westpac Banking Cor poration, Macquarie Bank Limited)Swedish Banks included in average (Nordea Bank AB, Skandinaviska Enskilda Banken AB, Svenska Handelsbanken AB, Swedbank AB) German banks included in average (UniCredit Bank AG, Deutsche Bank AG, Landesbank Baden Wuerttemberg, Commerzbank AG, Deutsche Postbank AG)UK banks included in average (Santander UK, Barclays Bank plc, HSBC Bank plc, Standard Chartered Bank, Lloyds TSB Bank Plc, The Royal Bank of Scotland Plc)
U.K Banks
Australian Banks
German Banks
Swedish Banks
Member Briefing Treasury Management
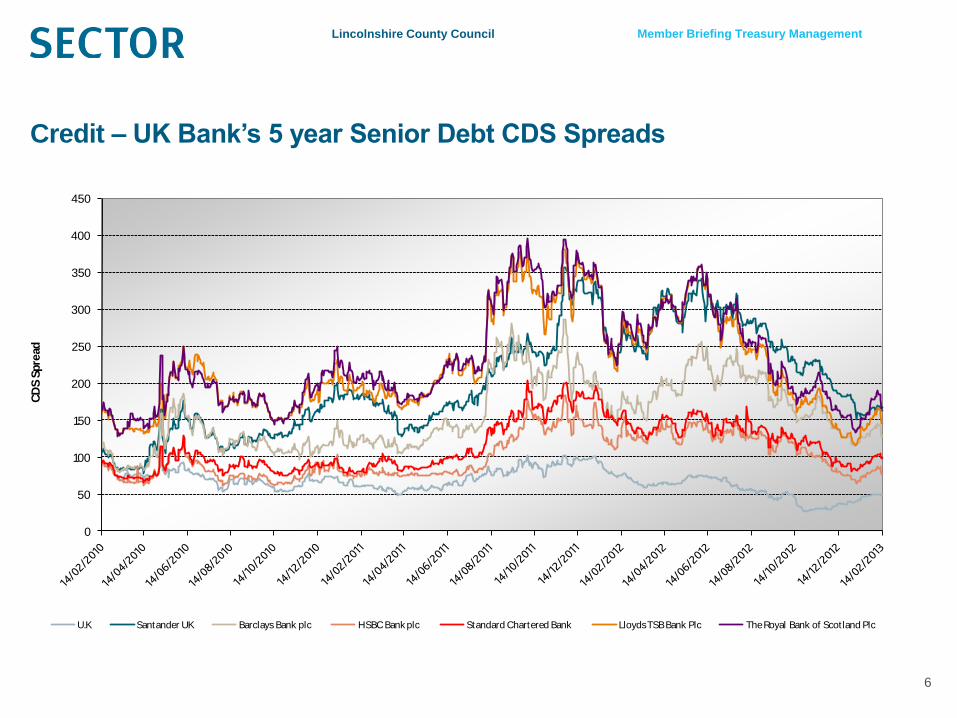
Credit – UK Bank’s 5 year Senior Debt CDS Spreads
6
Lincolnshire County Council
0
50
100
150
200
250
300
350
400
450
CD
S S
pre
ad
Date
UK Bank's 5 year Senior Debt Credit Default Swap Spreads
U.K Santander UK Barclays Bank plc HSBC Bank plc Standard Chartered Bank Lloyds TSB Bank Plc The Royal Bank of Scotland Plc
Member Briefing Treasury Management
Investment Strategy
7
Lincolnshire County Council
Member Briefing Treasury Management
Investment Conditions
8
Lincolnshire County Council
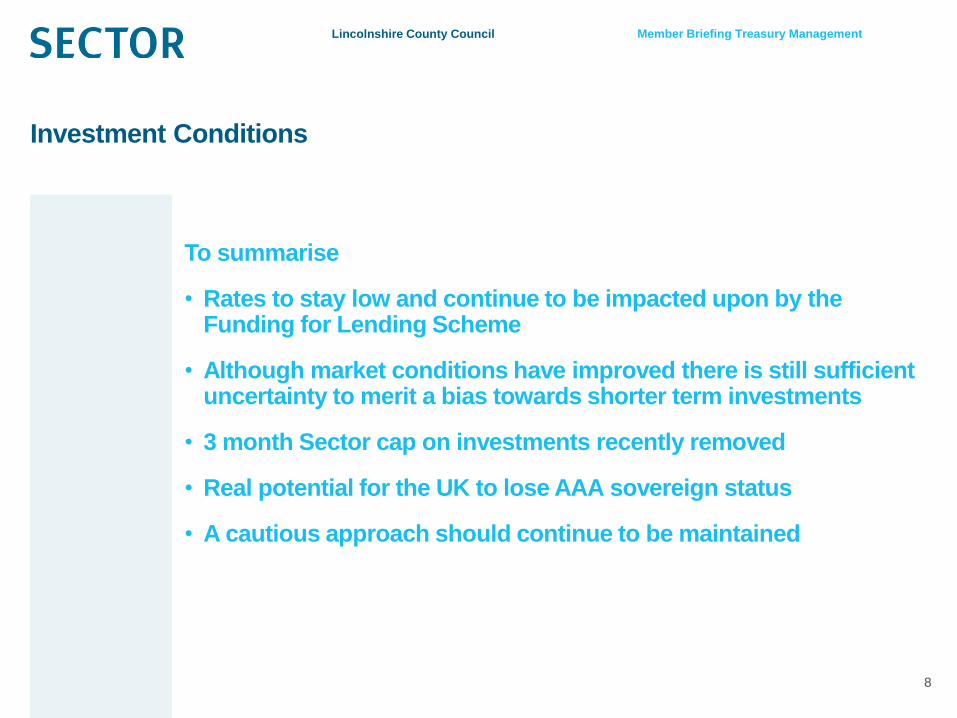
To summarise
• Rates to stay low and continue to be impacted upon by the Funding for Lending Scheme
• Although market conditions have improved there is still sufficient uncertainty to merit a bias towards shorter term investments
• 3 month Sector cap on investments recently removed
• Real potential for the UK to lose AAA sovereign status
• A cautious approach should continue to be maintained
Member Briefing Treasury Management
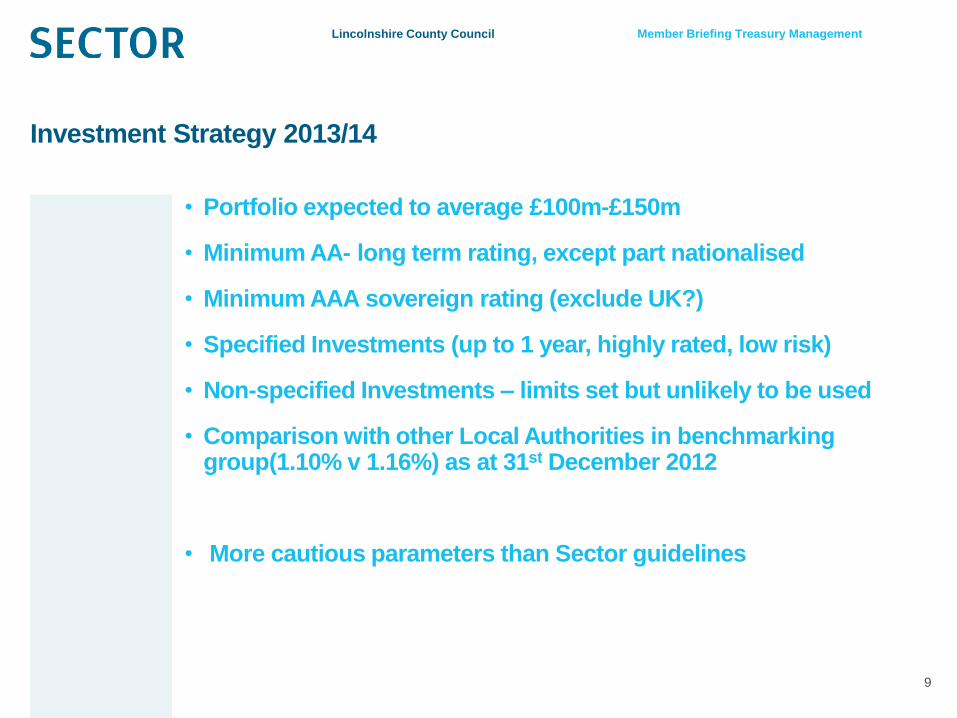
Investment Strategy 2013/14
9
Lincolnshire County Council
• Portfolio expected to average £100m-£150m
• Minimum AA- long term rating, except part nationalised
• Minimum AAA sovereign rating (exclude UK?)
• Specified Investments (up to 1 year, highly rated, low risk)
• Non-specified Investments – limits set but unlikely to be used
• Comparison with other Local Authorities in benchmarking group(1.10% v 1.16%) as at 31st December 2012
• More cautious parameters than Sector guidelines
Member Briefing Treasury Management
Debt Management
Strategy
10
Lincolnshire County Council
Member Briefing Treasury Management
11 11
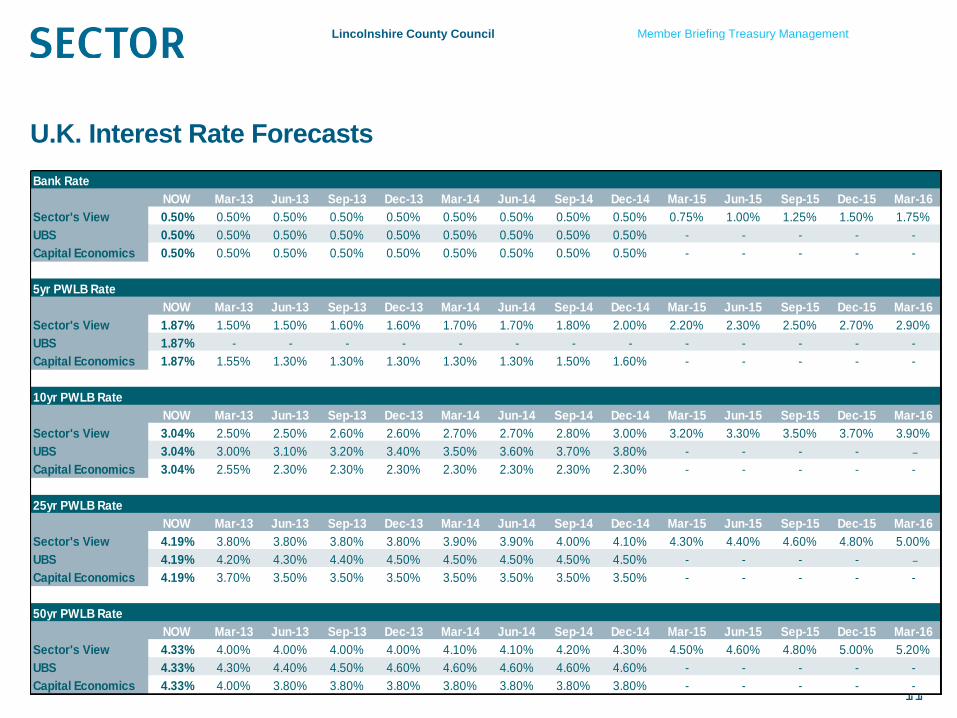
U.K. Interest Rate Forecasts
Lincolnshire County Council
Bank Rate
NOW Mar-13 Jun-13 Sep-13 Dec-13 Mar-14 Jun-14 Sep-14 Dec-14 Mar-15 Jun-15 Sep-15 Dec-15 Mar-16
Sector's View 0.50% 0.50% 0.50% 0.50% 0.50% 0.50% 0.50% 0.50% 0.50% 0.75% 1.00% 1.25% 1.50% 1.75%
UBS 0.50% 0.50% 0.50% 0.50% 0.50% 0.50% 0.50% 0.50% 0.50% - - - - -
Capital Economics 0.50% 0.50% 0.50% 0.50% 0.50% 0.50% 0.50% 0.50% 0.50% - - - - -
5yr PWLB Rate
NOW Mar-13 Jun-13 Sep-13 Dec-13 Mar-14 Jun-14 Sep-14 Dec-14 Mar-15 Jun-15 Sep-15 Dec-15 Mar-16
Sector's View 1.87% 1.50% 1.50% 1.60% 1.60% 1.70% 1.70% 1.80% 2.00% 2.20% 2.30% 2.50% 2.70% 2.90%
UBS 1.87% - - - - - - - - - - - - -
Capital Economics 1.87% 1.55% 1.30% 1.30% 1.30% 1.30% 1.30% 1.50% 1.60% - - - - -
10yr PWLB Rate
NOW Mar-13 Jun-13 Sep-13 Dec-13 Mar-14 Jun-14 Sep-14 Dec-14 Mar-15 Jun-15 Sep-15 Dec-15 Mar-16
Sector's View 3.04% 2.50% 2.50% 2.60% 2.60% 2.70% 2.70% 2.80% 3.00% 3.20% 3.30% 3.50% 3.70% 3.90%
UBS 3.04% 3.00% 3.10% 3.20% 3.40% 3.50% 3.60% 3.70% 3.80% - - - - -
Capital Economics 3.04% 2.55% 2.30% 2.30% 2.30% 2.30% 2.30% 2.30% 2.30% - - - - -
25yr PWLB Rate
NOW Mar-13 Jun-13 Sep-13 Dec-13 Mar-14 Jun-14 Sep-14 Dec-14 Mar-15 Jun-15 Sep-15 Dec-15 Mar-16
Sector's View 4.19% 3.80% 3.80% 3.80% 3.80% 3.90% 3.90% 4.00% 4.10% 4.30% 4.40% 4.60% 4.80% 5.00%
UBS 4.19% 4.20% 4.30% 4.40% 4.50% 4.50% 4.50% 4.50% 4.50% - - - - -
Capital Economics 4.19% 3.70% 3.50% 3.50% 3.50% 3.50% 3.50% 3.50% 3.50% - - - - -
50yr PWLB Rate
NOW Mar-13 Jun-13 Sep-13 Dec-13 Mar-14 Jun-14 Sep-14 Dec-14 Mar-15 Jun-15 Sep-15 Dec-15 Mar-16
Sector's View 4.33% 4.00% 4.00% 4.00% 4.00% 4.10% 4.10% 4.20% 4.30% 4.50% 4.60% 4.80% 5.00% 5.20%
UBS 4.33% 4.30% 4.40% 4.50% 4.60% 4.60% 4.60% 4.60% 4.60% - - - - -
Capital Economics 4.33% 4.00% 3.80% 3.80% 3.80% 3.80% 3.80% 3.80% 3.80% - - - - -
Member Briefing Treasury Management
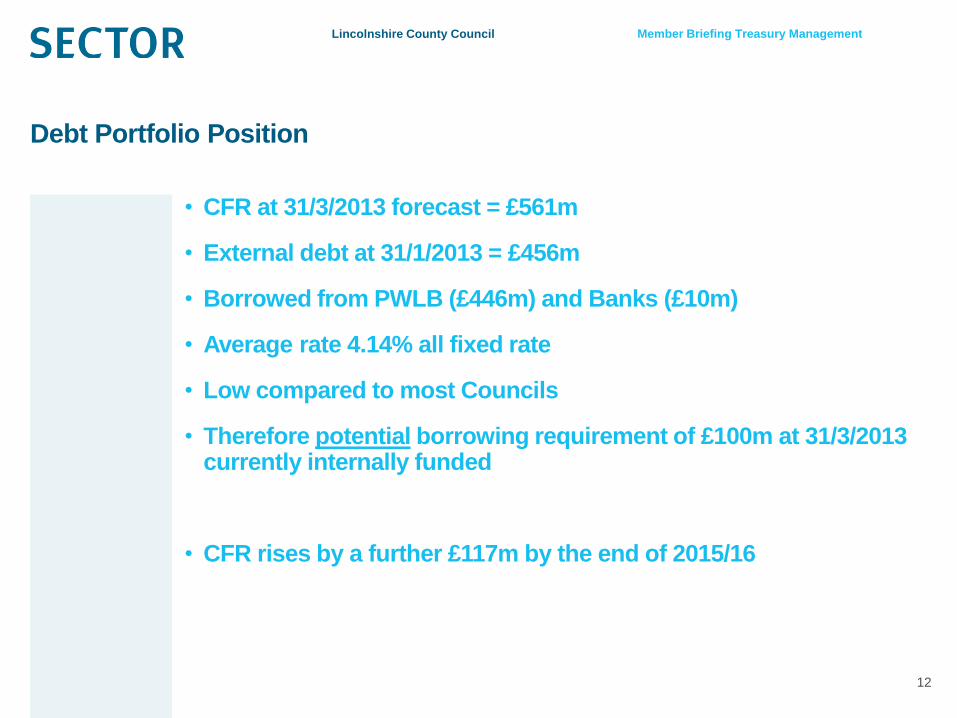
Debt Portfolio Position
12
Lincolnshire County Council
• CFR at 31/3/2013 forecast = £561m
• External debt at 31/1/2013 = £456m
• Borrowed from PWLB (£446m) and Banks (£10m)
• Average rate 4.14% all fixed rate
• Low compared to most Councils
• Therefore potential borrowing requirement of £100m at 31/3/2013 currently internally funded
• CFR rises by a further £117m by the end of 2015/16

Member Briefing Treasury Management
Debt Maturity Profile
13
Lincolnshire County Council
£0
£5,000,000
£10,000,000
£15,000,000
£20,000,000
£25,000,000
£30,000,000
£35,000,000
£40,000,000
VA
LUE
OF
PRIN
CIPA
L
FINANCIAL YEAR
PWLB - maturity PWLB - annuity PWLB - EIP PWLB - variable Market
Member Briefing Treasury Management
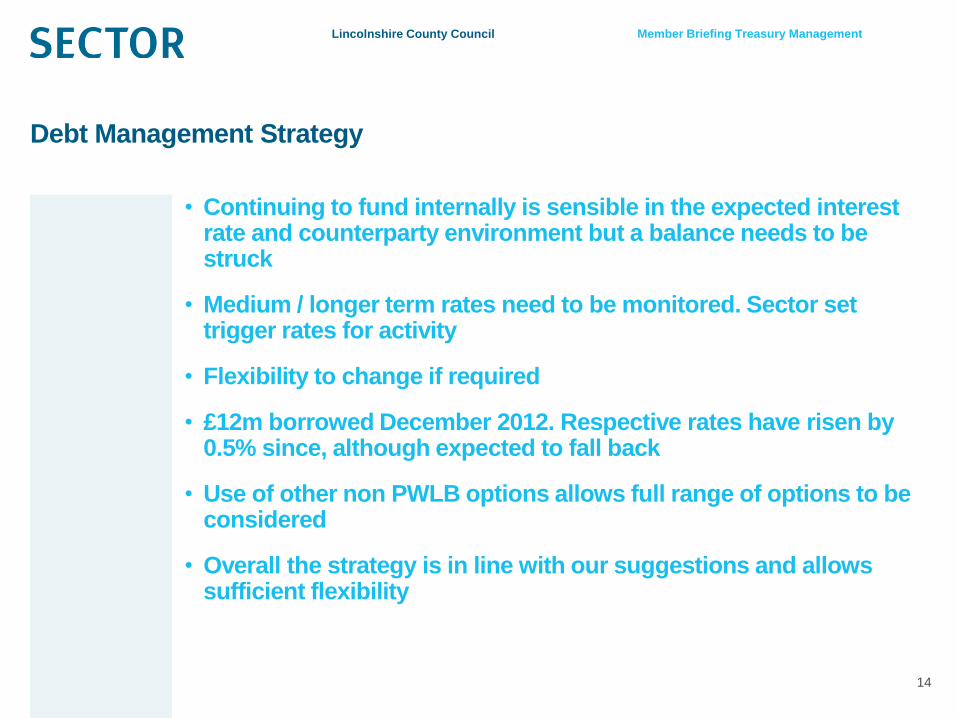
Debt Management Strategy
14
Lincolnshire County Council
• Continuing to fund internally is sensible in the expected interest rate and counterparty environment but a balance needs to be struck
• Medium / longer term rates need to be monitored. Sector set trigger rates for activity
• Flexibility to change if required
• £12m borrowed December 2012. Respective rates have risen by 0.5% since, although expected to fall back
• Use of other non PWLB options allows full range of options to be considered
• Overall the strategy is in line with our suggestions and allows sufficient flexibility
Member Briefing Treasury Management
15
Lincolnshire County Council
Member Briefing Treasury Management
Questions
16
Lincolnshire County Council