Embed Size (px)
Citation preview
VALUE FOR MONEY IN CAPITAL BUDGETING AND PROCUREMENT PRACTICES
World Bank Institute Global Roundtable on Value for Money in Public-Private Partnerships 28 May 2013, WB, Washington DC Ian Hawkesworth, Co-ordinator OECD PPP Network
1. Introduction and definition
2. Volumes and performance
3. Budgeting and accounting systems
4. The procurement cycle and institutional roles
5. Procurement and Value for Money
6. Some recommendations
Agenda
2
Table numbers refer to P. Burger & I .Hawkesworth ‘Capital budgeting and procurement practices’ presented to the OECD Annual Network Meeting of Senior Public-Private Partnership Officials 15-16 April 2013. It will be published in the OECD Journal on Budgeting.
• Key question: How to attain value for money?
• Key message: By aligning the system towards attaining it (budgeting, accounting, institutional, absolute and relative, culturally). This requires integrating PPP and traditional infrastructure procurement.
• Why? Because the main barriers to VfM are the wrong incentives, a lack of appropriate roles and responsibilities being maintained, the wrong tools.
• HMT: the optimum combination of whole-of-life costs and quality (or fitness for purpose) of the good or service to meet the user’s requirement. VfM is not the choice of goods and services based on the lowest cost bid.
• NN ‘What experienced experts agree represents the best chance of meeting the specified needs at the lowest price.’
3
1. Introduction
VOLUMES AND PERFORMANCE
4
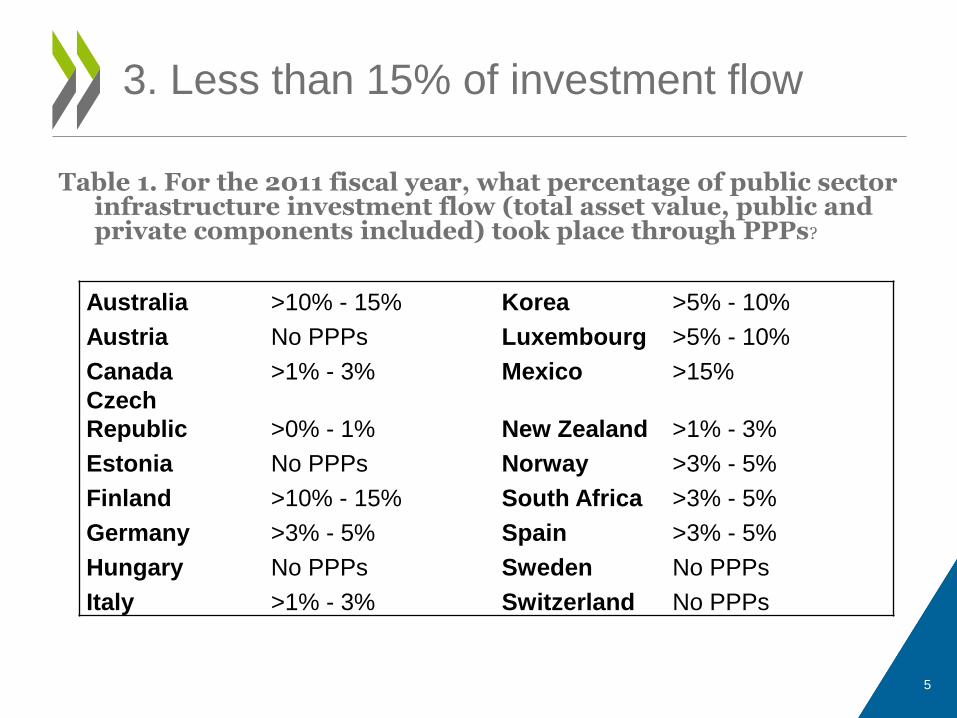
Table 1. For the 2011 fiscal year, what percentage of public sector infrastructure investment flow (total asset value, public and private components included) took place through PPPs?
3. Less than 15% of investment flow
Australia >10% - 15% Korea >5% - 10%
Austria No PPPs Luxembourg >5% - 10%
Canada >1% - 3% Mexico >15%
Czech
Republic >0% - 1% New Zealand >1% - 3%
Estonia No PPPs Norway >3% - 5%
Finland >10% - 15% South Africa >3% - 5%
Germany >3% - 5% Spain >3% - 5%
Hungary No PPPs Sweden No PPPs
Italy >1% - 3% Switzerland No PPPs
5
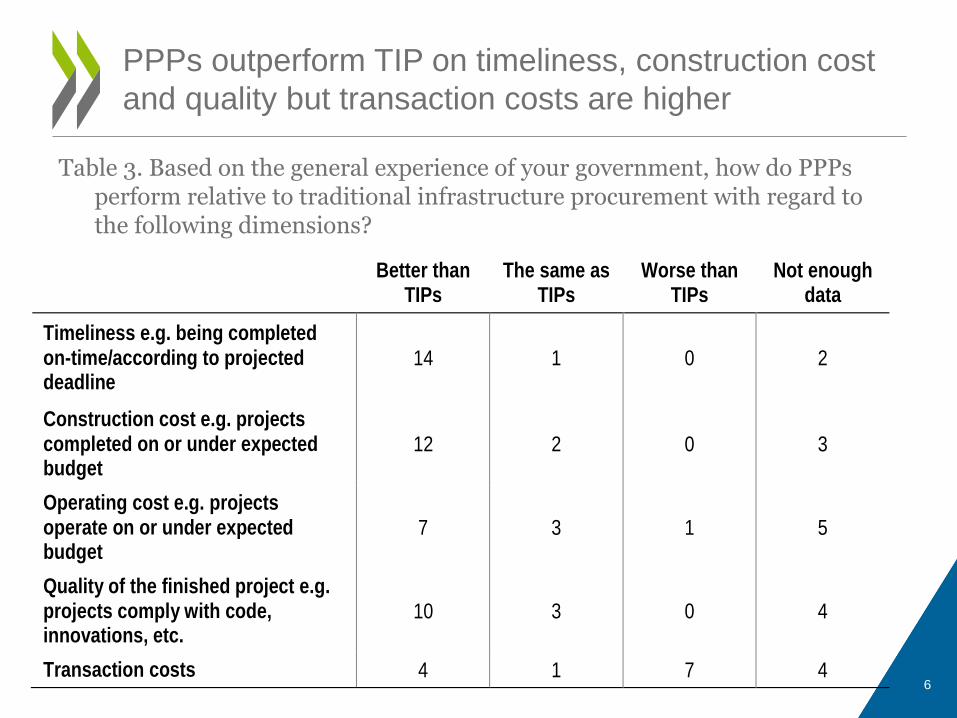
Table 3. Based on the general experience of your government, how do PPPs perform relative to traditional infrastructure procurement with regard to the following dimensions?
PPPs outperform TIP on timeliness, construction cost
and quality but transaction costs are higher
Better than TIPs
The same as TIPs
Worse than TIPs
Not enough data
Timeliness e.g. being completed on-time/according to projected deadline
14 1 0 2
Construction cost e.g. projects completed on or under expected budget
12 2 0 3
Operating cost e.g. projects operate on or under expected budget
7 3 1 5
Quality of the finished project e.g. projects comply with code, innovations, etc.
10 3 0 4
Transaction costs 4 1 7 4
6
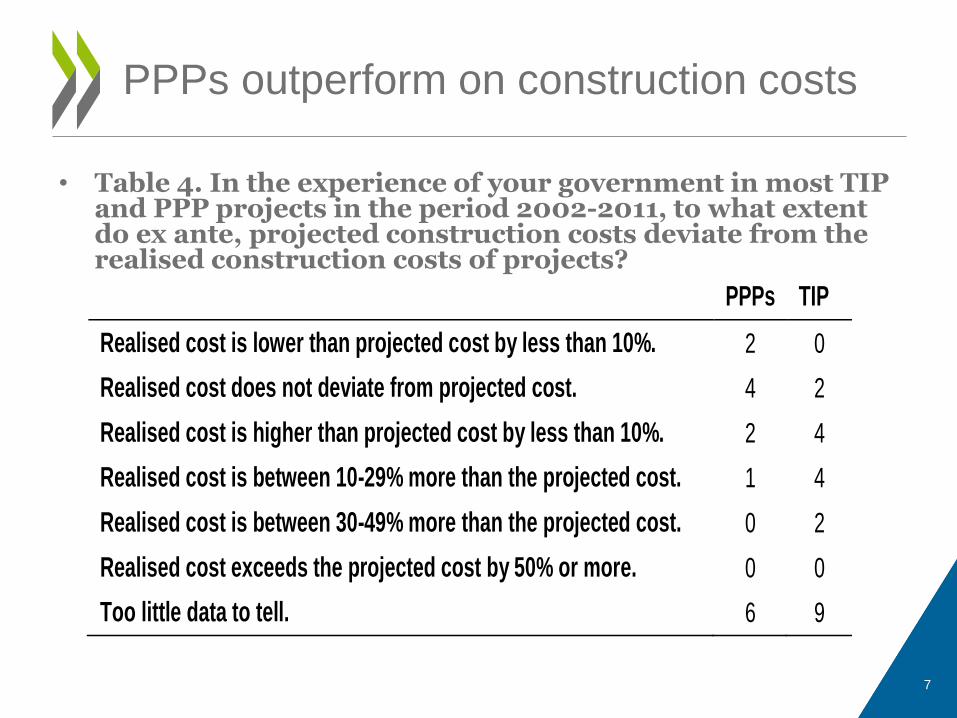
• Table 4. In the experience of your government in most TIP and PPP projects in the period 2002-2011, to what extent do ex ante, projected construction costs deviate from the realised construction costs of projects?
PPPs outperform on construction costs
PPPs TIP
Realised cost is lower than projected cost by less than 10%. 2 0
Realised cost does not deviate from projected cost. 4 2
Realised cost is higher than projected cost by less than 10%. 2 4
Realised cost is between 10-29% more than the projected cost. 1 4
Realised cost is between 30-49% more than the projected cost. 0 2
Realised cost exceeds the projected cost by 50% or more. 0 0
Too little data to tell. 6 9
7
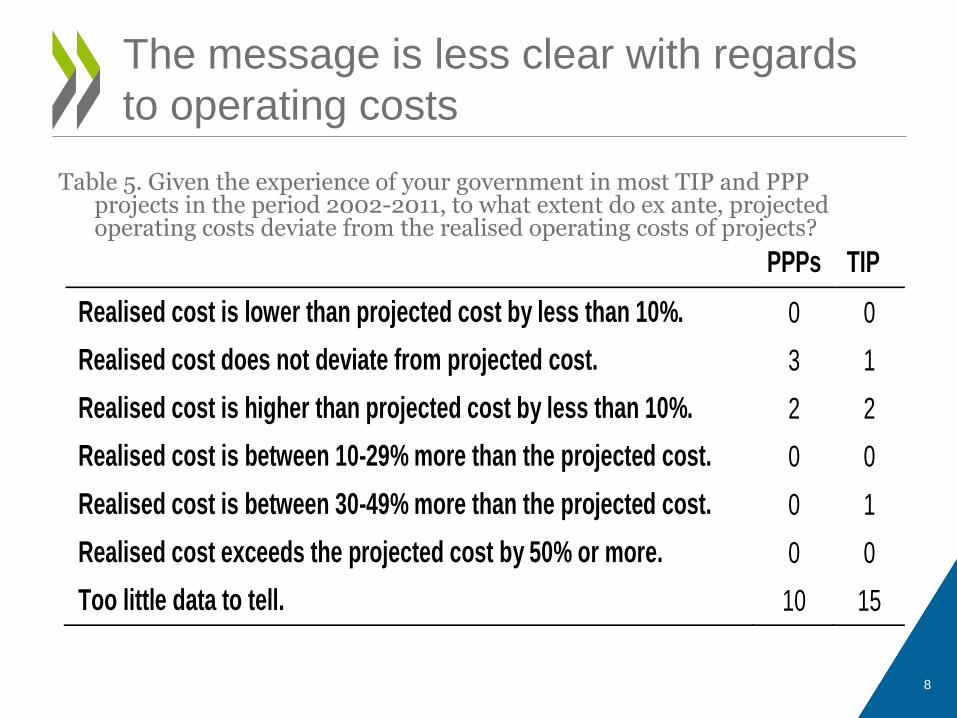
Table 5. Given the experience of your government in most TIP and PPP projects in the period 2002-2011, to what extent do ex ante, projected operating costs deviate from the realised operating costs of projects?
8
The message is less clear with regards
to operating costs
PPPs TIP
Realised cost is lower than projected cost by less than 10%. 0 0
Realised cost does not deviate from projected cost. 3 1
Realised cost is higher than projected cost by less than 10%. 2 2
Realised cost is between 10-29% more than the projected cost. 0 0
Realised cost is between 30-49% more than the projected cost. 0 1
Realised cost exceeds the projected cost by 50% or more. 0 0
Too little data to tell. 10 15
BUDGETING AND ACCOUNTING SYSTEMS
9
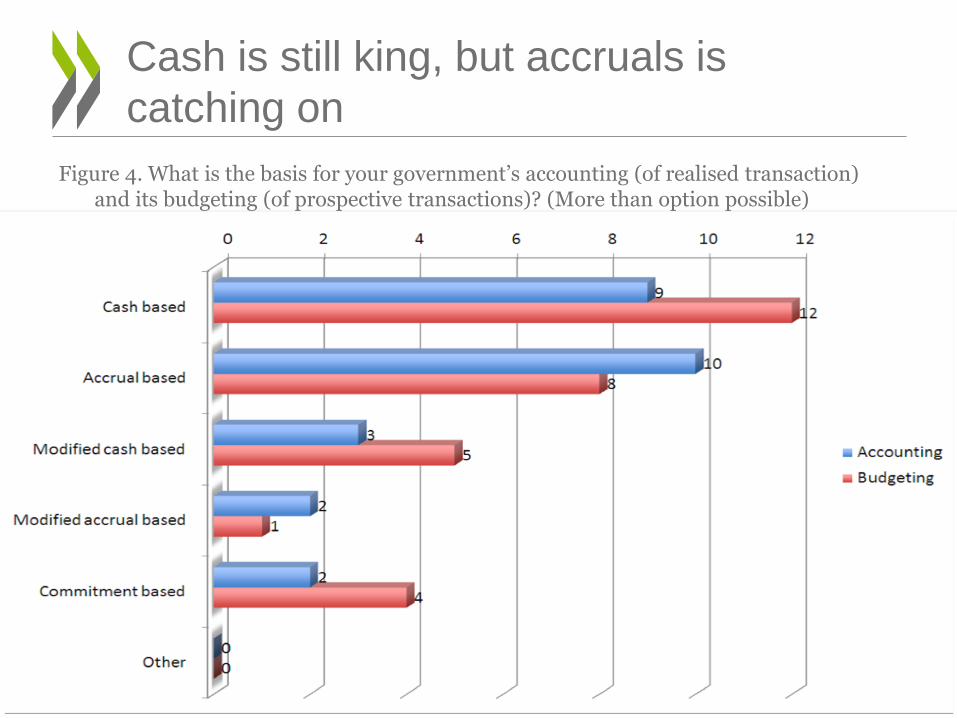
Figure 4. What is the basis for your government’s accounting (of realised transaction) and its budgeting (of prospective transactions)? (More than option possible)
10
Cash is still king, but accruals is
catching on
11
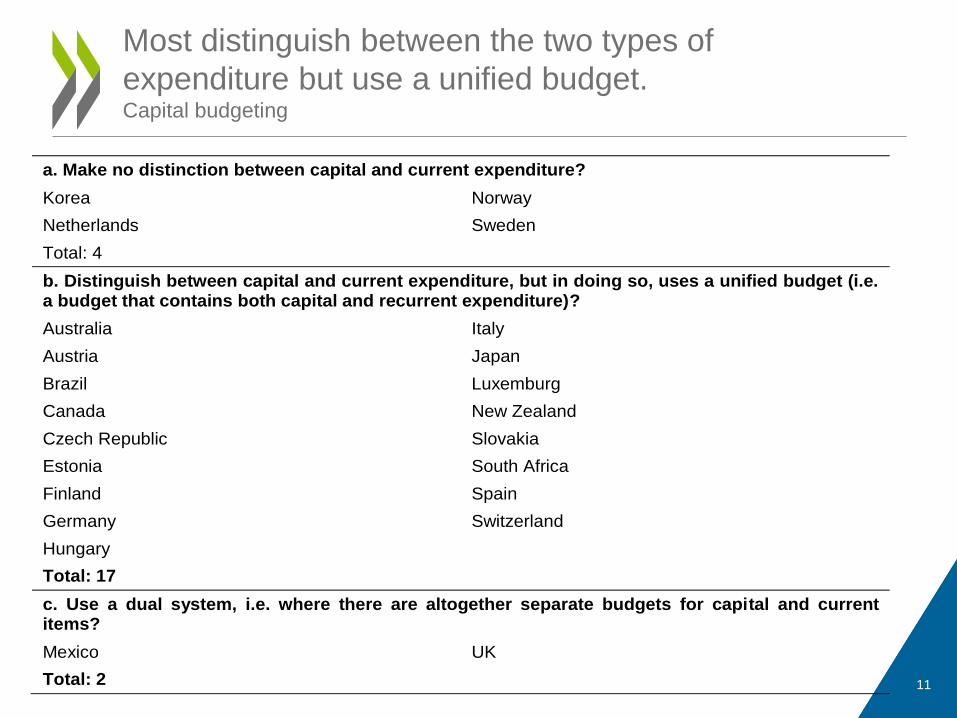
Most distinguish between the two types of
expenditure but use a unified budget. Capital budgeting
a. Make no distinction between capital and current expenditure?
Korea Norway
Netherlands Sweden
Total: 4
b. Distinguish between capital and current expenditure, but in doing so, uses a unified budget (i.e. a budget that contains both capital and recurrent expenditure)?
Australia Italy
Austria Japan
Brazil Luxemburg
Canada New Zealand
Czech Republic Slovakia
Estonia South Africa
Finland Spain
Germany Switzerland
Hungary
Total: 17
c. Use a dual system, i.e. where there are altogether separate budgets for capital and current items?
Mexico UK
Total: 2
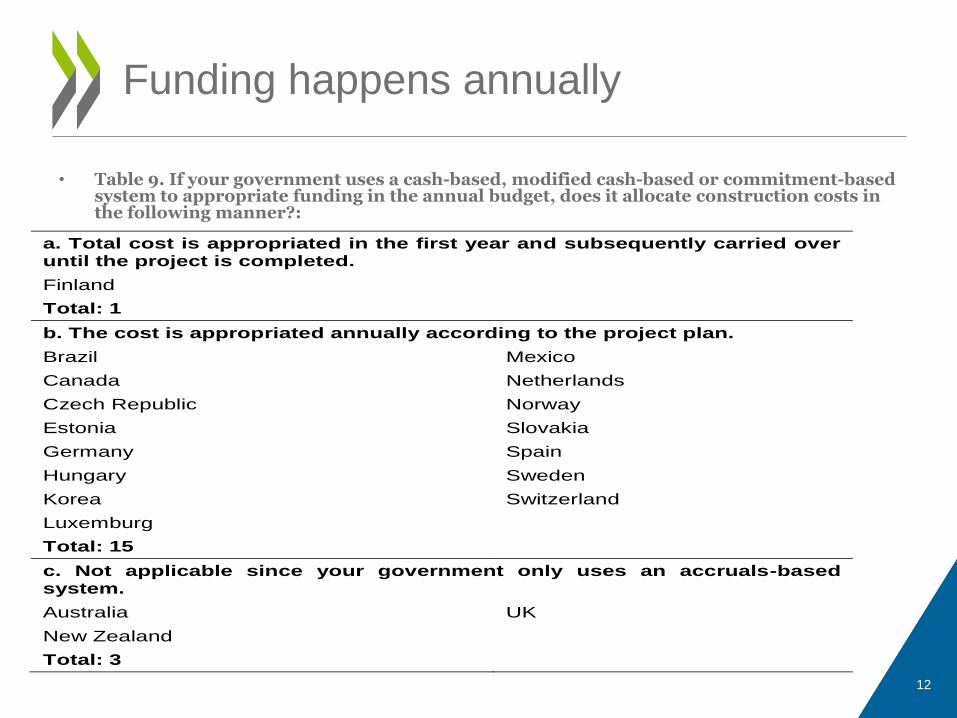
• Table 9. If your government uses a cash-based, modified cash-based or commitment-based system to appropriate funding in the annual budget, does it allocate construction costs in the following manner?:
12
Funding happens annually
a. Total cost is appropriated in the first year and subsequently carried over until the project is completed.
Finland
Total: 1
b. The cost is appropriated annually according to the project plan.
Brazil Mexico
Canada Netherlands
Czech Republic Norway
Estonia Slovakia
Germany Spain
Hungary Sweden
Korea Switzerland
Luxemburg
Total: 15
c. Not applicable since your government only uses an accruals-based system.
Australia UK
New Zealand
Total: 3
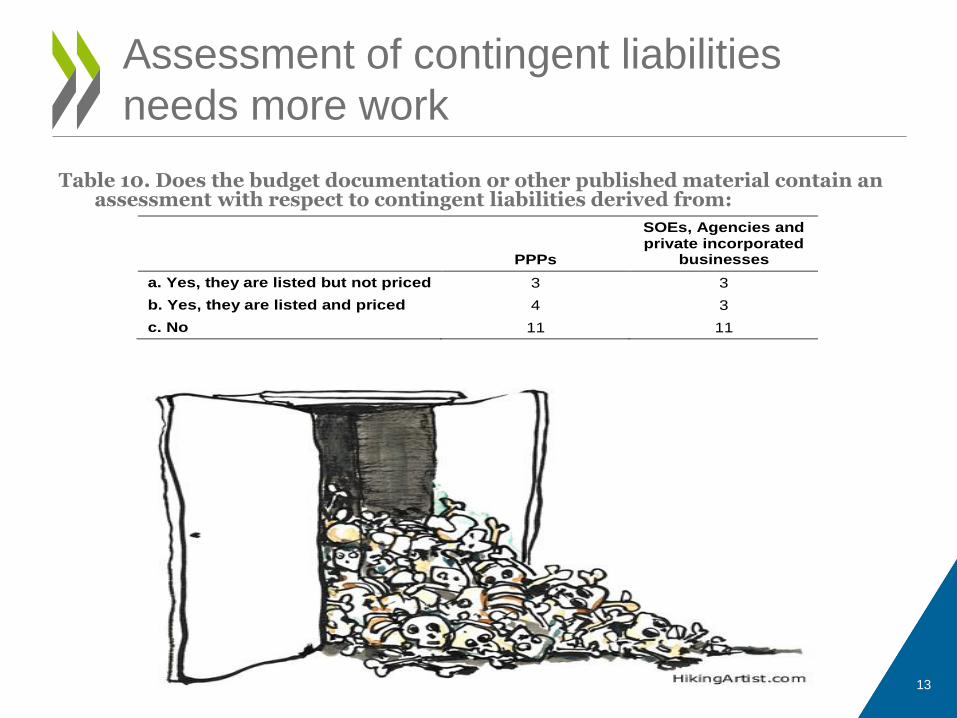
Table 10. Does the budget documentation or other published material contain an assessment with respect to contingent liabilities derived from:
13
Assessment of contingent liabilities
needs more work
PPPs
SOEs, Agencies and private incorporated
businesses
a. Yes, they are listed but not priced 3 3
b. Yes, they are listed and priced 4 3
c. No 11 11

THE PROCUREMENT CYCLE AND INSTITUTIONAL ROLES
14
15
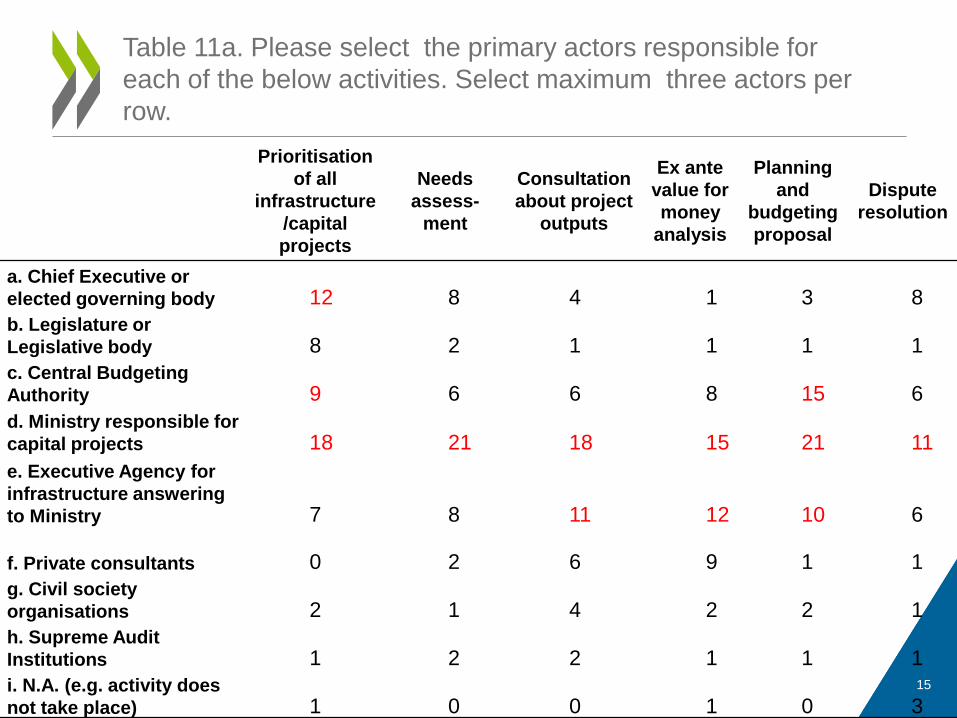
Table 11a. Please select the primary actors responsible for
each of the below activities. Select maximum three actors per
row.
Prioritisation
of all
infrastructure
/capital
projects
Needs
assess-
ment
Consultation
about project
outputs
Ex ante
value for
money
analysis
Planning
and
budgeting
proposal
Dispute
resolution
a. Chief Executive or
elected governing body 12 8 4 1 3 8
b. Legislature or
Legislative body 8 2 1 1 1 1
c. Central Budgeting
Authority 9 6 6 8 15 6
d. Ministry responsible for
capital projects 18 21 18 15 21 11
e. Executive Agency for
infrastructure answering
to Ministry 7 8 11 12 10 6
f. Private consultants 0 2 6 9 1 1
g. Civil society
organisations 2 1 4 2 2 1
h. Supreme Audit
Institutions 1 2 2 1 1 1
i. N.A. (e.g. activity does
not take place) 1 0 0 1 0 3
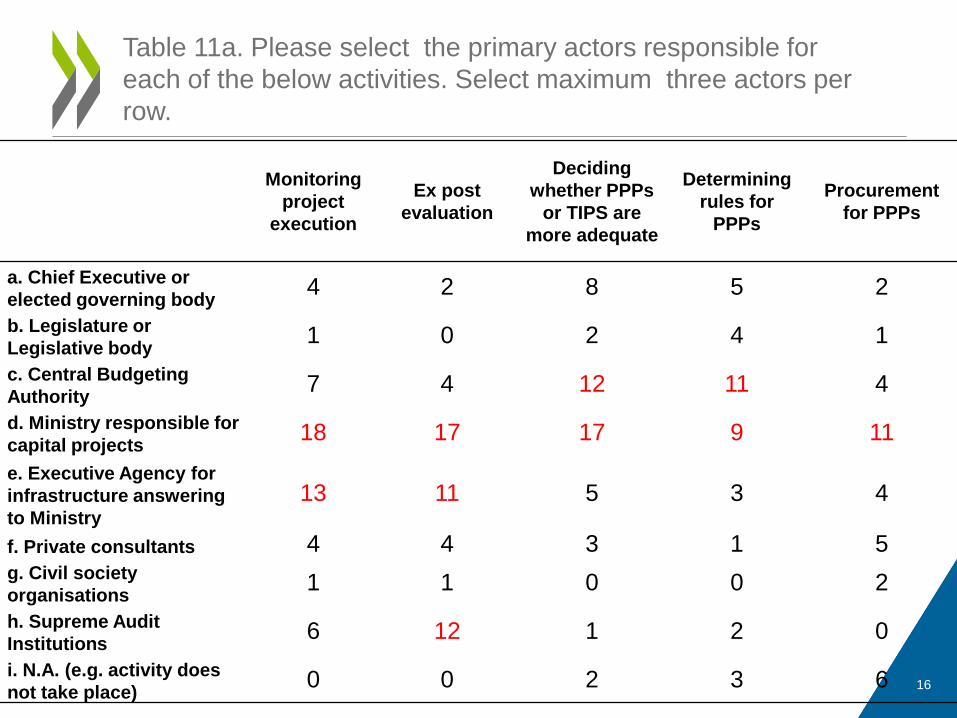
Monitoring
project
execution
Ex post
evaluation
Deciding
whether PPPs
or TIPS are
more adequate
Determining
rules for
PPPs
Procurement
for PPPs
a. Chief Executive or
elected governing body 4 2 8 5 2
b. Legislature or
Legislative body 1 0 2 4 1
c. Central Budgeting
Authority 7 4 12 11 4
d. Ministry responsible for
capital projects 18 17 17 9 11
e. Executive Agency for
infrastructure answering
to Ministry
13 11 5 3 4
f. Private consultants 4 4 3 1 5
g. Civil society
organisations 1 1 0 0 2
h. Supreme Audit
Institutions 6 12 1 2 0
i. N.A. (e.g. activity does
not take place) 0 0 2 3 6 16
Table 11a. Please select the primary actors responsible for
each of the below activities. Select maximum three actors per
row.
17
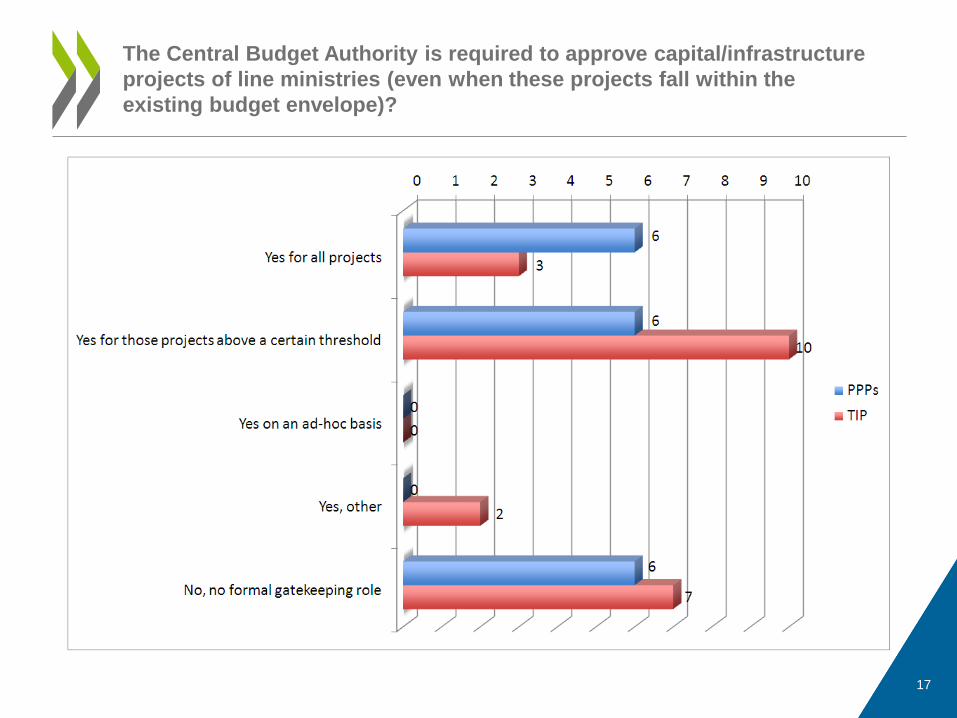
The Central Budget Authority is required to approve capital/infrastructure
projects of line ministries (even when these projects fall within the
existing budget envelope)?
PROCUREMENT AND VFM
18
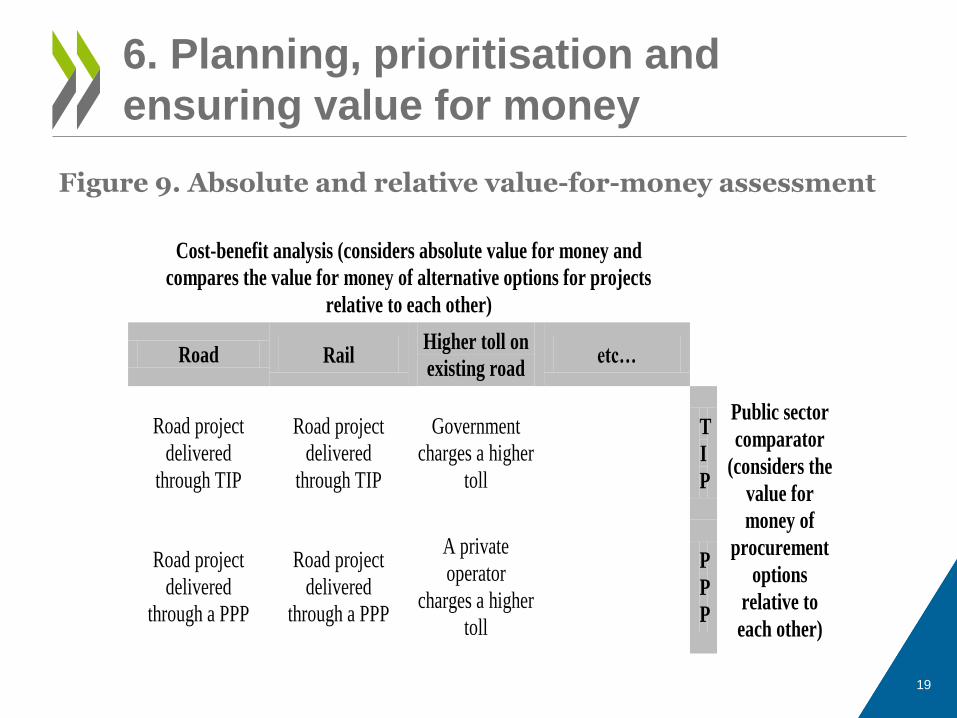
Figure 9. Absolute and relative value-for-money assessment
19
6. Planning, prioritisation and
ensuring value for money
Cost-benefit analysis (considers absolute value for money and
compares the value for money of alternative options for projects
relative to each other)
Road Rail Higher toll on
existing road etc…
Road project
delivered
through TIP
Road project
delivered
through TIP
Government
charges a higher
toll
T
I
P
Public sector
comparator
(considers the
value for
money of
procurement
options
relative to
each other)
Road project
delivered
through a PPP
Road project
delivered
through a PPP
A private
operator
charges a higher
toll
P
P
P
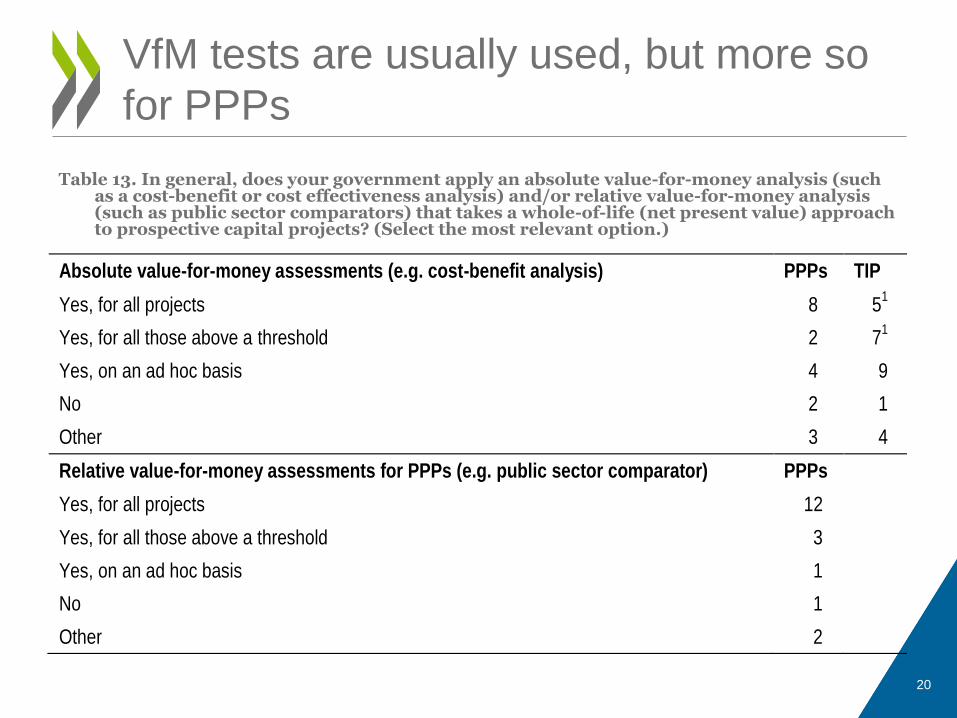
Table 13. In general, does your government apply an absolute value-for-money analysis (such as a cost-benefit or cost effectiveness analysis) and/or relative value-for-money analysis (such as public sector comparators) that takes a whole-of-life (net present value) approach to prospective capital projects? (Select the most relevant option.)
20
VfM tests are usually used, but more so
for PPPs
Absolute value-for-money assessments (e.g. cost-benefit analysis) PPPs TIP
Yes, for all projects 8 51
Yes, for all those above a threshold 2 71
Yes, on an ad hoc basis 4 9
No 2 1
Other 3 4
Relative value-for-money assessments for PPPs (e.g. public sector comparator) PPPs
Yes, for all projects 12
Yes, for all those above a threshold 3
Yes, on an ad hoc basis 1
No 1
Other 2
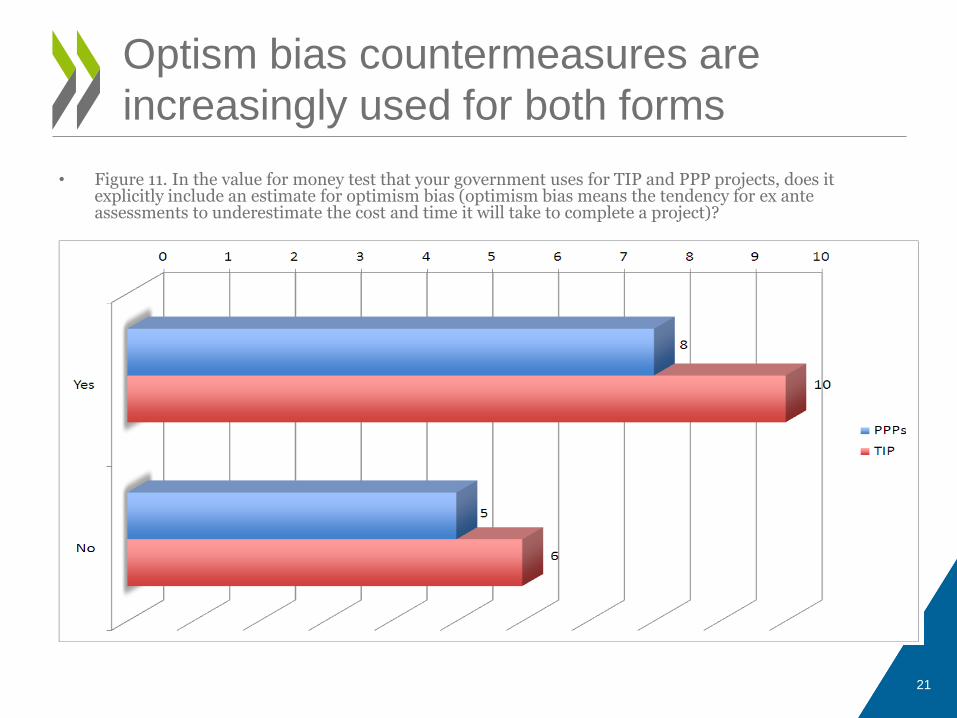
• Figure 11. In the value for money test that your government uses for TIP and PPP projects, does it explicitly include an estimate for optimism bias (optimism bias means the tendency for ex ante assessments to underestimate the cost and time it will take to complete a project)?
21
Optism bias countermeasures are
increasingly used for both forms
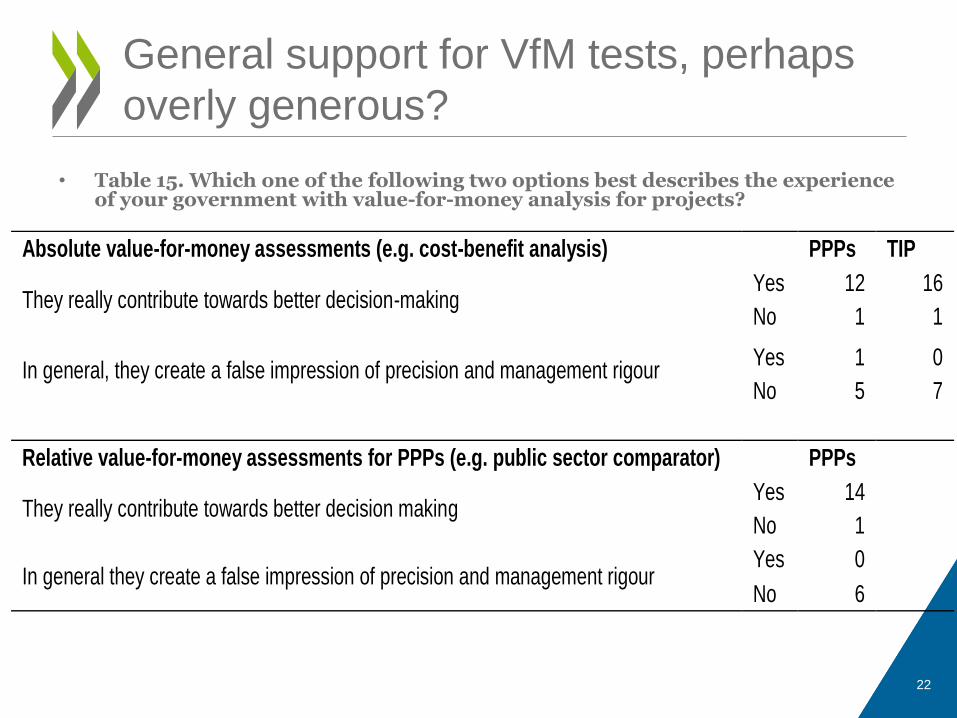
• Table 15. Which one of the following two options best describes the experience of your government with value-for-money analysis for projects?
22
General support for VfM tests, perhaps
overly generous?
Absolute value-for-money assessments (e.g. cost-benefit analysis)
PPPs TIP
They really contribute towards better decision-making Yes 12 16
No 1 1
In general, they create a false impression of precision and management rigour Yes 1 0
No 5 7
Relative value-for-money assessments for PPPs (e.g. public sector comparator)
PPPs
They really contribute towards better decision making
Yes 14
No 1
In general they create a false impression of precision and management rigour
Yes 0
No 6
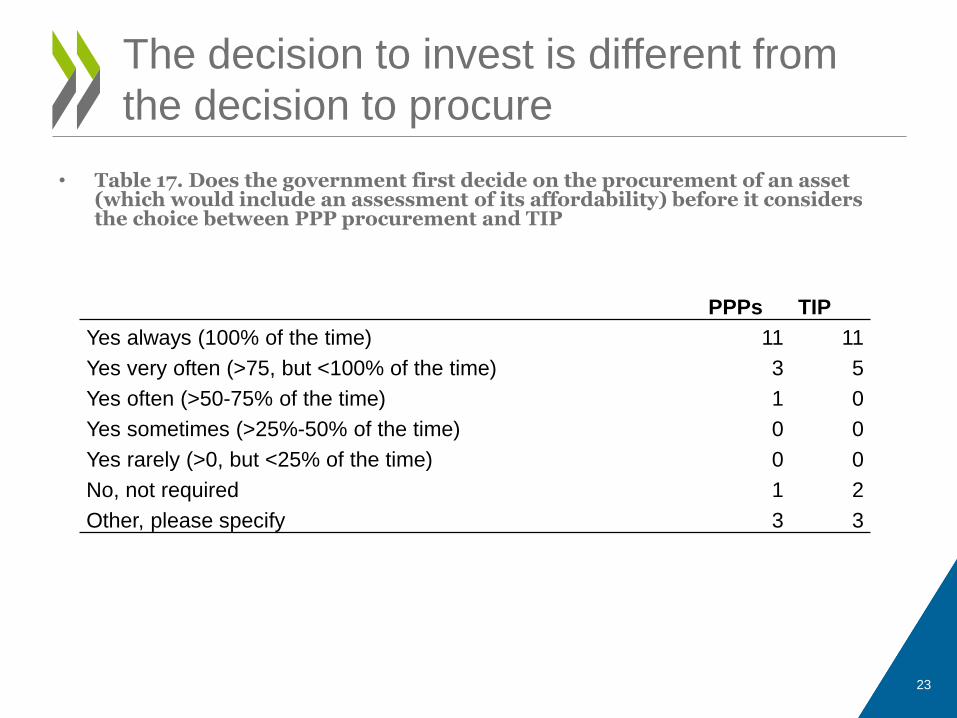
• Table 17. Does the government first decide on the procurement of an asset (which would include an assessment of its affordability) before it considers the choice between PPP procurement and TIP
23
The decision to invest is different from
the decision to procure
PPPs TIP
Yes always (100% of the time) 11 11
Yes very often (>75, but <100% of the time) 3 5
Yes often (>50-75% of the time) 1 0
Yes sometimes (>25%-50% of the time) 0 0
Yes rarely (>0, but <25% of the time) 0 0
No, not required 1 2
Other, please specify 3 3

SOME RECOMMENDATIONS
24
• The government should, irrespective of whether a project is a TIP or PPP project, budget the full capital cost upfront. In the case of a TIP project, the full capital cost is the direct capital cost, while in the case of a PPP it is the present value of the capital component of all future user charges to be paid to the private partner.
• The government should budget the full capital cost upfront for all investment projects delivering a public service by SOEs where the government carries a contingent liability.
• All debt of entities such as PPPs and SOEs that might impact government debt should be recognised explicitly and included in the assessment of fiscal sustainability.
• With respect to SOE investments where the government guarantees the debt of the issue, the contingent liability of government should be added to public debt to assess the sustainability of fiscal policy.
• All possible capital projects should be subjected to a needs analysis, an initial feasibility as well as an initial assessment of affordability.
25
Recommendations for capital budgeting
and procurement practices
• The prioritisation of projects should be synchronised with the budget cycle. This will require specific procedures to ensure the synchronisation occurs.
• The ex ante value for money assessment should take a whole-of-life approach. The initial affordability assessments of those projects that pass the ex ante value for money assessment should be revisited to establish whether they are still affordable and to reconsider the prioritisation of projects done in the initial affordability assessment..
• All projects, or at least all projects above a threshold, should include as part of their cost estimates an element that reflects the typical ‘optimism bias’ experienced in projects.
• When using PPPs to deliver services, it is advisable that governments apply procurement option pre-tests as well as relative value-for-money assessments such as PSC to support the pursuit of maximum value for money.
• Government should conduct ex post value-for-money assessments. These value-for-money assessments should compare realised outcomes with the ex ante value-for-money assessments to establish whether or not there has been deviations.
26
Recommendations for capital budgeting
and procurement practices

THE MAIN MESSAGE, AGAIN
27
• Key question: How to attain value for money?
• Key message: By aligning the system towards attaining it (budgeting, accounting, institutional, process, culture). This requires integrating PPP and traditional infrastructure procurement.
28
The main message again
For more information:
• www.oecd.org/gov/budget/ppp.
• OECD Principles for Public Governance of PPPs (2012)
29
Thanks!