Embed Size (px)
Citation preview

Annual R
eport 2013D
uni
Duni.com For ideas and inspiration.
Value enhancing design ANNUAL REPORT 2013
Duni_13_Omslag_EN.indd 1 2014-04-11 07.39
reports.duni.com/annualreport2013
2013 in brief 3
This is Duni 6
CEO statement 8
Financial targets 10
Strategy 11
Duni’s markets 14
The Duni brand 16
Design 17
Growth areas 18
Professional business area 20
Consumer business area 22
Tissue business area 24
Production and distribution 25
Our Blue Mission 26
Employees 30
The share 32
Annual Report 36–91
Directors’ report 37
Corporate governance report 40
Board of Directors 44
Group management 45
Auditor’s report 91
Key ratio definitions 92
Glossary 93
Calendar 94
Addresses 94
Innovative designwhich creates ambienceA well-set table with unique, innovatively designed products. Products that are designed to heighten the value of the mealtime experience and enhance the ambience around the dining table in more than 40 countries.
The appearance of the products is important and a self-evident part of the design. But for Duni, it is equally obvious that design also covers the choice of materials, production method and distribution method.
A carefully conceived design takes into account all possible environmental aspects and improves the function of the products. Ultimately, this increases value for the shareholders.
8“ Our focus is on products that enhance the experi-ence around the set table”
20
22
Increased focus on continuous product development and innovation
The creation of Designs för Duni® in 2013 shows that Duni is a creative player
17“ Design is an important basis for Duni’s success”
16“ We strengthen the brand through people, food and drink”
Duni_13_Omslag_EN.indd 2 2014-04-11 07.39

32
2013 IN BRIEF
KEY FIGURES
2013 2012 2011 2010 2009
Net sales 3 803 3 669 3 807 3 971 4 220
EBIT* 385 342 404 435 436
EBITDA* 503 454 510 537 539
Net income before tax 350 204 358 418 444
Net income for the year 267 126 261 306 336
Proposed dividend, SEK/Share 4.00 3.50 3.50 3.50 2.50
Shareholders' equity 2 099 1 985 2 082 1 991 1 789
Return on equity 12.72% 6.35% 12.54% 15.37% 18.78%
Number of employees 1 902 1 875 1 888 1 914 1 906 Net sales
Underlying operating income
NET SALES / UNDERLYING OPERATING INCOME
The overall rate of growth was 4.7% in comparable currency. Although the Euro-pean market as a whole was unchanged and markets in several regions declined somewhat, Duni grew within most areas.
Professional Business AreaNet sales increased to SEK 2,702 (2,682) m, thereby accounting for 71% (73%) of the Group’s net sales. Operating income increased to SEK 356 (337) m, with the operating margin strengthening to 13.2% (12.6%).
The traditional restaurant sector stagnated during the year, but with indications of a degree of improvement during the second half of the year. Catering demonstrated a significantly more positive trend, with Professional enjoying growth in this segment during the year. Customer solutions with a clear environmental profile, as well as new customized concepts, have proven to be successful.
During the year, the business area implemented a new, market-driven organization with greater focus on the take-away segment. This led to sound growth within the segment as well as greater cost efficiency which offset cost increases within other areas.
The acquisition of Song Seng in Singapore has made a positive contribution to earnings and additional synergies are expected within both purchasing as well as sales of Duni’s products.
5 000 500
4 000 400
2008 2009 2010 2011 2012 2013
3 000 300
2 000 200
1 000 100
Continued improved profitability
414436 435
404
342385
4 09
9
4 22
0
3 97
1
3 80
7
3 80
3
3 66
9
* EBIT and EBITDA are adjusted for non-recurring items.
Comparison figures for 2012 are recalculated in accordance with new accounting principles
Consumer Business AreaNet sales increased to SEK 603 (551) m, thereby accounting for 16% (15%) of the Group’s net sales. Operating income increased to SEK 12 (6) m, with the operating margin strengthening to 2.1% (1.0%).
Consumer grew on all important markets, at the same time as the retail trade began a slow recovery, with slightly positive figures for the year. The volatile business climate which characterizes the retail trade represents a challenge. Thus, a continued attractive product range is of the greatest importance in order to retain and satisfy existing customers and gain new contracts.
The added volumes and the increased capacity utilization have made a positive contribution to the increase in Consumer’s earnings.
Tissue Business AreaNet sales increased to SEK 499 (436) m, thereby accounting for 13% (12%) of the Group’s net sales. Operating income increased to SEK 17 (-1) m, with the operating margin strengthening to 3.4% (-0.2%). The increase in earnings is a result of the decision to discontinue external sales to the hygiene products sector.
Through the decision to discontinue the business, operational efficiency has increased, at the same time as measures can be gradually implemented towards the closure.
Net sales increased to SEK 3,803 (3,669) m
The operating margin strengthened to 10.1% (9.3%)
The Board proposes that the dividend be increased to SEK 4.00 (3.50) per share
Operating income (EBIT) increased to SEK 385 (342) m
Duni_ÅR_13_EN.indd 3 2014-04-15 15:05

This is Duni...Duni_ÅR_13_EN.indd 4 2014-04-15 15:05

55
XXXXXXXXXXXXXXX
This is Duni...Duni_ÅR_13_EN.indd 5 2014-04-15 15:05

This is Duni
Three business areasDuni’s business is divided into three busi-ness areas: Professional, covering sales to hotels, restaurants and catering firms; Consumer, primarily focusing on the grocery retail trade; and Tissue, producing wet laid and air laid tissue for table setting products and hygiene products.
ProductsDuni primarily operates on three product markets: single-use table setting products, meal packaging, and tissue. There is a rapid and high rate of renewal in response to current trends and in order to offer seasonal variations.
In 2013, Duni produced:
– 2.5 billion m2 of raw materials for the production of napkins and tablecoverings
– 9.3 billion napkins
– 126 million tablecoverings
Duni’s presenceTissue for napkins and tablecoverings is manufactured in Sweden, while Duni’s production of finished table setting products takes place in Germany and Poland. Duni’s head office is located in Malmö and the Company has approximately 1,900 employees in 18 countries. The largest markets are in Central and Northern Europe, but globally more than 40 markets are covered.
Market offices: Austria, Czech Republic, Finland, France, Germany, the Netherlands, Poland, Russia, Singapore, Spain, Sweden, Switzerland, and the UK.
Our Blue MissionApproximately 70% of Duni’s products are paper-based, and these products are produced almost entirely within the Group. Duni engages in long-term environmental and CSR work within the scope of the program entitled Our Blue Mission. 95% of paper-based products are FSC-certified (Forest Stewardship Council) and a
56%
NET SALES PER GEOGRAPHIC REGION, %
Professional
16%
13%
71%
Consumer Tissue Central Europe
19%
5%
20%
S. and E. Europe Nordic region Other
NET SALES PER BUSINESS AREA, %
significant portion of products bear the Svanen Ecolabel, a labeling system for the Scandinavian markets.
Targets for 2020 are presented below; they will be reviewed regularly, with a scheduled major review taking place in 2015
– The energy in Duni’s production shall be 100% fossil-free.
– Energy use shall be reduced by 20%.
– Renewable or compostable alternatives shall be available in 100% of Duni’s product groups.
– No product complaints shall relate to potential health hazards.
– Monitored suppliers shall account for 80% of the value of raw materials and end-products. All new suppliers of end-products shall be monitored.
– All employees shall be involved in improvements, be familiar with the ethical rules, and participate in the work relating to values.
Duni is a leader in Europe in the design, production and marketing of high-quality tablecoverings, napkins, candles and other table setting products. Duni also offers packaging and packaging solutions to the growing take-away market.
Duni_ÅR_13_EN.indd 6 2014-04-15 15:05
Duni has four core values which permeate the entire Company and its operations:
Ownership
Open Mind
Added Value
Will to win
We keep our promises and are committed to delivering results. We dare to try. We create value for our stakeholders while respecting sustainable development.
We trust and empower our colleagues. We have the courage to change. We listen, learn and share.
We put our customers first. Speed is of the essence and we cross borders to find the solution. Innovation and quality are part of our mindset.
We are always one step ahead. We seek opportunities and take action. We celebrate success.
THIS IS DUNI
76
Duni_ÅR_13_EN.indd 7 2014-04-15 15:05

Additional growth initiatives were taken in 2013 and both sales and profitability were stronger than last year. Sales increased in all business areas and, in total, the Group’s net sales (adjusted for exchange rate movements) increased by 4.7%, to SEK 3,803 (3,669) m. Underlying profitability increased to SEK 385 (342) m, entailing an increase in the operating margin to 10.1 (9.3)%.
Strengthened earnings and stronger initiatives for increased growth
Duni_ÅR_13_EN.indd 8 2014-04-15 15:05

98
CEO STATEMENT
The year’s improvements are essentially an effect of increased market shares which, among other things, led to improved capacity utilization at our production plants. Total demand in Europe within Duni’s product segments is assessed as being largely unchanged compared with last year. In southern Europe, the market continued to decline; conversely, we witnessed improved growth in the Nordic region and Central Europe. The growing trend towards more easily available take-away and fast food offerings at the expense of traditional restaurants is continuing.
During 2013, Professional defended the very strong positions it has held for a long time in, primarily, Germany, the Benelux countries, and the Nordic region. At the same time, an offensive strategy has been adopted on selected markets. Southern Europe provides an example, with the business area having developed products and offerings specifically adapted for that market. The work has been successful and contributed to sound growth.
During the year, Consumer has broad-ened and strengthened its customer offering. Focus will be increasingly placed on the premium concept, ”Designs for Duni®”, while at the same time we have expanded business with the retail trade’s private labels. The year saw several successful product launches and sales successes, among both existing as well as new customers. The Consumer business area’s market is stable, with low or zero growth, and is being increasingly driven by fixed- term contracts. In 2013, the business area signed a number of important customer contracts and demonstrated a clearly improved sales trend.
At the beginning of 2013, the initiative was taken to establish a place of business in Southeast Asia, with the objective of taking advantage of the strong growth in the region. It was, therefore, pleasing that as early as the second quarter of 2013 we were able to carry out the acquisition of Song Seng in Singapore.
Duni Song Seng is a leading supplier of single-use packaging for food and drink in Singapore. Customers comprise hotels, restaurants, various types of food chains, as well as hospitals and care centers. Duni Song Seng enjoys a strong
position in Singapore and an expanding export business in Asia and the Pacific region. The acquisition represents an important step in Duni’s strategy of expanding on growth markets and increases the service level within the growing take-away segment and fast food chains.
Duni Song Seng continued to grow positively during 2013 and the company’s profitability is well in line with Duni’s financial target of an operating margin in excess of 10%. The next step is to begin the launch of Duni’s premium range, and our ambition is to develop the market in the same way as we have done in Europe.
Focus on products for the set tableDuni’s core business comprises products which create an ambience around the set table and it is with these products that the Company will grow. A good example is provided by the tablecovering material, Evolin®, in which we have made significant investments in recent years. During 2013, we have continued to roll out Evolin® on the market and this work represents an important tool for maintaining Duni’s position as a leading innovator of products for the set table.
In line with our focus on products that enhance the experience around the set table, at the beginning of 2013 we decided to discontinue the hygiene business within the Tissue business area. The assessment was made that the operations will not achieve an acceptable level of profitability within the foreseeable future, and the operations are expected to be wound up in March 2015.
Duni shows respect for society and the environmentDuni’s approach to social responsibility is linked to our core business: creating a pleasant atmosphere around the table. The correct atmosphere can be created only with products which are manufactured with respect for society and the environment. At Duni, we regard this as sound common sense.
In ”Our Blue Mission” we have a long- term environmental strategy with targets extending until 2020. We are allocating major resources in order to act in a sustainable and responsible manner, while ensuring that this results in carefully
considered and responsible business decisions. During 2013, we have worked on attaining compostability certification in respect of our napkin and tablecovering range. We are also witnessing increased demand for products within our Ecoecho™ range. During the year, we launched several new products in order to meet the increased demand.
Customer relations and the brandDuring 2014, we will intensify our work on strengthening our customer relations and clarifying what our brand stands for. The Duni brand is well known to our target groups, but we need to vitalise and create additional relevance for our customers. Thus, it is pleasing that, throughout 2014, we will be a main sponsor of Bocuse d’Or Europe – the European professional cooking championship. Such a sponsorship is a ’match made in heaven’ for Duni’s brand.
During 2013, we strengthened and restructured our commercial organization. With the aim of increasing the degree of specialization and to enhance the focus on prioritized customer segments, the sales organization for the Professional business area has been divided into two sections: one focusing on the Table Top market segment, and one which is cultivating the Meal Service market segment. The change represents a natural step following the restructuring that was commenced in 2012. It creates conditions for more efficient resource utilization and improved integration between market and sales activities. The organizational change has been implemented gradually and is expected to be fully implemented by the end of the first quarter of 2014.
Well equipped for profitable growthDuni is now better organized, both towards the correct markets and with a focus on efficient sales work. An acquisition in 2013 has enabled us to make strides into the rapidly growing market in Southeast Asia.
Duni has value-generating growth strategies in place and is well equipped to create increased profitable growth in 2014.
Malmö, March 2014Thomas Gustafsson
President and CEO
“The correct atmosphere can be created only with products which are manufactured with respect for society and the environment.
At Duni, we regard this as sound common sense.”
Duni_ÅR_13_EN.indd 9 2014-04-15 15:05

Financial targets
5 %
10 %
40 %
Since being listed on the Stockholm Stock Exchange in November 2007, Duni has had consistent financial targets with respect to growth and profitability. Generally, the profitability target has been achieved, while growth has been below-target. In order to increase the rate of growth, Duni has adopted strategic measures to increase focus on higher growth markets and areas.
150
100
50
02009 2010 2011 20132012
15
10
5
02009 2010 2011 20132012
5
2,5
-5
-2,5
0
2009 2010 2011 20132012
GROWTH, 5 %
PROFITABILITY, 10 %
DIVIDEND, 40 % OF PROFIT
It is the Board’s intention that, in the long term, dividends shall amount to at least 40 % of income after tax.
The target is that Duni’s operating margin shall amount to 10 % or more. Profitability shall be increased through sales growth, continued focus on premium products, and continued improvements within purchasing and production.
Duni’s target is an average annual organic growth in sales in excess of 5 % per year over a business cycle. In addition, Duni may consider acquisitions in order to reach new growth markets or strengthen its position on existing markets.
Duni_ÅR_13_EN.indd 10 2014-04-15 15:05

11FINANCIAL TARGETS – STRATEGY
10
The European market for single-use tabletop products is worth around SEK 35 billion (EUR four billion). Duni is the leader within the premium segment and market leader on many of its core markets, which creates conditions for acting as a trendsetter and proactively promoting the trend within the industry towards increased use of single-use products. The position as market leader also constitutes an advantage in discussions with customers in the HoReCa area and also within the retail trade, where shelf space is often given only to leading brands. The strong market position, brand and broad product range also contribute to maintaining strong margins. Duni’s role as a market leader shall, therefore, be defended and further strengthened.
Duni’s market share in Europe for its main products (napkins and tablecoverings) exceeds 20%, which is more than twice that of its nearest competitor.
Unique sales modelDuni’s sales force maintains regular dialogue with the end customers concerning the selection and use of Duni’s products, while orders are placed with retailers (cash and carries) as well as distributors and wholesalers. The close relationship with customers creates customer loyalty and allows Duni to quickly receive signals regarding, and be able to adapt its range to, new trends and changes in demand. This entails an additional direct channel to the end consumer, with the possibility for greater dialogue, while at the same time increasing flexibility and accessibility for potential customers.
Leader in product development,design and materialsDuni’s development in terms of colors, designs and materials constitutes an important aspect of the business model. The product range is regularly evaluated based on sales, profitability, and inventory turnover rate criteria. New and existing products are evaluated using the same criteria. In recent years, Duni has placed
Position as market leader creates conditions for growth
Strategy
great importance on developing product concept work within the Company. A product concept development process has been implemented in which employees, customers and suppliers co-operate in order to create and evaluate product concepts. This increases the likelihood of success and of resources being focused on those products with the greatest potential on the market (see Brand & Design).
One quarter of the collection isrenewed each yearA high renewal rate creates possibilities to adapt the product range quickly to changing trends, while at the same time giving Duni the edge over its competitors. Duni thus endeavors to have the highest product range renewal rate on the market. Approximately 25% of the collection is renewed every year. Materials development within the table top products category takes place in close co-operation between the marketing department, product developers and production managers.
Control over value chain and logisticsControl over the value chain reduces the price risk, increases delivery certainty, and provides possibilities to plan the renewal of designs and materials. Thus, Duni is an integrated company which controls the entire value chain (apart from raw materials) in respect of its most important products, namely napkins and tablecoverings. Approximately 70% of the products are paper-based and in all essential respects produced within the Group, while other products are purchased from external suppliers.
Specialization in short runs enables Duni to adapt the collections quickly to the customers’ wishes. The majority of Duni’s production is made for stock. Duni’s central warehouse in Germany and a number of distribution centers handle distribution to customers (see Production and distribution).
The European market for single-use tabletop products is worth around SEK 35 billion (EUR four billion).
Duni thus endeavors to have the highest product range renewal rate on the market. Approximately 25% of the collection is renewed every year.
Approximately 70% of the products are paper-based and in all essential respects produced within the Group, while other pro-ducts are purchased from external suppliers.
Duni’s market share in Europe for its main products (napkins and tablecoverings) exceeds 20%.
Duni_ÅR_13_EN.indd 11 2014-04-15 15:05

Duni_ÅR_13_EN.indd 12 2014-04-15 15:06

1313
XXXXXXXXXXXXXXX
Duni_ÅR_13_EN.indd 13 2014-04-15 15:06

The European market for single-use tabletop products is worth around SEK 35 billion (EUR 4 billion. Source: Duni). Duni is the leader within the premium segment and market leader on many of its core markets, which creates conditions for acting as a trendsetter and proactively promoting the trend within the industry towards increased use of single-use products.
The restaurant market is undergoing rapid change driven by trends such as our increasingly mobile lifestyles and the fact that, to an ever increasing extent, we are eating “on the go”. The trend is also partially influenced by the same basic factors as lie behind the general increase in meals consumed outside the home: continued urbanization, an increase in the proportion of single households and in the proportion of the population in gainful employment, and an increase in disposable incomes.
An increasing number of restaurant chains with clear concepts and strong brands are springing up in response to the trend for “good food fast”. North America is dominant in terms of restaurant chains as a proportion of the total restaurant offering, with a penetration level of 50%. In Europe, chains account for just under 20% of the total restaurant offering. Eastern Europe and Asia are expected to account for the largest percentage rate of growth, as prosperity increases in countries in those regions.
Restaurant chains are expandingThe percentage of sales in Europe attribut-able to restaurant chains is continuing to increase, while the percentage attributable to independent restaurants has marginally declined. There is a uniform trend in almost all countries, but with variations in the percentages and rates of increase. Over the course of five years, the chains increased from 52 to 58% in the UK, from 42 to 45% in France, and from 23 to 27% in Germany. In southern Europe, the percent-ages are lower and the change somewhat slower. The chains increased their percent-age from 20 to 23% in Spain, and from 15 to 17% in Italy. In Russia, restaurant chains account for approximately 58% of total sales (Source: NPD-Group).
The percentage of take-away is continuing to increase. In a short time, in the five
largest countries in Europe take-away has increased from 11.4 to 11.9%, and Duni sees the same trend in other countries. Growth is expected to continue within both chain concepts and take-away.
Developing take-away conceptsDuni is responding to the growing demand within take-away by, in close cooperation with expanding restaurant chains, developing take-away packaging concepts which strengthen the customer’s brand profile. For some time Duni has been cooperating with restaurant chains such as Vapiano throughout Europe, Cojean and Resto In in France, as well as Nordsee, Dean & David and Jim Block in Germany.
The strategy is based on Duni develop-ing products and solutions for customers with international concepts, with the customized solutions that Duni creates supporting the customer’s brand. Duni adds value by offering product concepts or product families which are unique in form, design, function, and material. Geographic growth within the area often takes place by Duni following existing international chains into new markets.
In Europe, Duni is the only major European player focusing mainly on the table top concept market. Competitors primarily consist of small, local companies, as well as a number of larger paper and pulp companies. Some of these companies have concepts and product ranges which, similar to Duni’s, are focused on the HoReCa market.
By increasing sales of premium products, Duni is creating possibilities for increased profit margins. Standard products account for approximately 45%, and premium products for approximately 55%, of the total estimated sales on the European napkin and tablecovering market.
Premium products account for approximately two-thirds of the market in northern Europe and approximately one-third of the total market in southern and eastern Europe, where premium products are expected to grow more quickly than on other markets.
Southern Europe is the largest market region in Europe. This is explained by the large consumer sector, a high percentage
of meals eaten outside the home, and tourism in the region. In southern Europe, premium products account for approximately one-third of the total market. Italy is the single largest market in Europe for standard paper napkins and tablecoverings.
The Nordic region, Germany, Austria and Switzerland together comprise the second largest market region in Europe for single- use napkins and tablecoverings, with premium products accounting for roughly two-thirds of the market. The premium products’ high market share is largely due to the manufacturers’ dedicated sales work and historically strong economic growth.
The UK and the Benelux countries together constitute the third largest market region in Europe for paper napkins and tablecoverings. As in the Nordic region, Germany, Austria and Switzerland, premium products account for approxi-mately two-thirds of the total market in the Benelux countries. In the UK, premium products are believed to account for a smaller share of the total market.
Clear market leader in northernEuropeDuni is the clear market leader in central and northern Europe and the Benelux countries, i.e. markets where the premium segment is dominant. Simpler paper products dominate in the countries of southern and eastern Europe and it is in those countries that Duni perceives great growth potential.
Since the beginning of the 2000’s, grocery retail sales of private label products have increased at the expense of branded goods. In the single-use table top products sector, this has resulted in an increased focus on simpler, low price products. As a conse-quence of this trend, total retail sales within the table top products sector have stagnated on most European markets. Retail private labels are over-represented in the table top products category and often account for more than 50% of sales.
This creates opportunities for a strong brand such as Duni to contribute to increased value growth in the category by means of unique, premium-based product concepts aimed at quality-conscious consumers.
Restaurant chains and take-away continue to grow
Duni’s markets
Duni_ÅR_13_EN.indd 14 2014-04-15 15:06

15DUNI’S MARKETS
14
Duni perceives potential in thelinen marketTextile and linen tablecoverings still account for more than 80% of all tablecoverings used by restaurants and table service establishments in northern Europe. However, many of them are seeking alternatives to linen in order to avoid all the work and high costs associated with the use of linen. Thus, premium products constitute a growth area, primarily thanks to the trend whereby table linen is being replaced by high-quality single-use solutions. Duni is promoting this trend by constantly investing in product development of napkins, placemats and tablecoverings. Customers appreciate the design, variation and simple handling of the tablecoverings offered by Duni, and consequently many customers are replacing cloth-based products with Duni’s products.
Duni has several products which replace linen. At the end of 2011, Duni launched a new tablecovering material – Evolin® – which combines the feel of textile and linen tablecoverings with the advantages of single-use products. Evolin is targeted at restaurants and catering firms which currently use linen. The product has been developed with the help of some of the leading restaurateurs in Europe and was rolled out in Europe in 2012 with the support of a number of well-known restaurant profiles, such as Pontus Frithiof, Christophe Margin and Gennaro Cocoza. The successful promotion of Evolin has continued in 2013. The product constitutes one of the cornerstones for future growth by converting customers currently using linen.
2
1
2
1
1
1
MARKET (BY SIZE, IN VALUE)
PREMIUM SHARE OF MARKET
DUNI’S POSITION
Southern Europe 1/3 2
Central Europe 2/3 1
The UK 1/3 2
Northern Europe 2/3 1
Benelux 2/3 1
Eastern Europe 1/3 1
WITHIN THE RESTAURANT INDUSTRY, RESTAURANTS ARE DIVIDED INTO VARIOUS CATEGORIES:
Fine DiningFine, highly priced
restaurants.
Casual DiningFamily restaurants, often operated
in chains under a single brand, with a lower average price than
Fine Dining, but a low percentage of take-away.
Fast CasualSalad bars, etc., with an even
higher percentage of chain operations, higher percentage
of take-away and lower average price than Casual Dining.
Quick Service RestaurantsHamburger chains, sandwich
chains, etc.; the lowest average price, highest percentage of take-away and highest percentage of
chain operations.
Duni_ÅR_13_EN.indd 15 2014-04-15 15:06

“Duni is a strong and well-known brand which is going well. Based on an already stable platform, we will now build further and develop our values and the offering we provide to our customers.”
So says Duni’s Corporate Marketing and Communications Director, Tina Andersson.
“No one can have failed to notice the increased interest in food and cooking in recent years. Chefs enjoy rock star status. The cuisine of unfamiliar countries gives rise to new habits. Old restaurant concepts give way to new ones. Gourmet food can be bought in the street. In brief, a lot is happening, it’s happening fast, and impressions from the market are numerous and inspiring. As far as Duni is concerned, it’s now a question of forging an even clearer link between the brand and interior design, food, drink, people and the shared experience around the set table.”
“It’s never been more important to think from the customer’s perspective. For a restaurant or hotel, the entire design concept is important. The set table represents an inspirational part of the overall offering that our customers provide to their guests. Duni’s products are part of the overall design. Therefore, we will develop our way of supporting and inspiring the endeavours of innkeepers and restaura-teurs to accentuate and underscore their interior design concept.”
Main sponsor of Bocuse d’Or 2014For Duni, 2014 very much involves coming
“ Brand enhancement through people, food and drink”
The Duni brand
95 % of HoReCa customers in northern and central Europe choose Duni’s napkins.
The Duni brand is trustworthy and attrac-tive and is considered the leading brand for single-use tablecoverings and napkins on the northern and central European HoReCa market* .
Most of Duni’s customers choose the brand thanks to its reputation for quality and Duni’s extensive range of colors*.
The Duni brand is ”the preferred brand” within napkins (95%) and single-use tablecoverings (83%) (Here, Duni is ranked ahead of brands such as Kimberly Clark, SCA and Georgia Pacific within the northern and central European HoReCa market)** .
Sources: * Duni Image Survey, April 2013 via BTG covering
450 HORECA customers in F, DE, SE.
** Kunde Survey, 2007, covering 1,340 HORECA customers in DE, NL, F, NO.
closer to food, drink, people and the shared dining experience. Among other things, Duni is one of the main sponsors of Bocuse d’Or, which will be held in Stockholm in May. The competition is regarded as a European cooking champion-ship, with chefs participating from 20 countries. Bocuse d’Or takes place over the same weekend as the Gastro Nord food and drink trade fair, and leads up to the world championship in Lyon in 2015.
“Bocuse d’Or fits in perfectly with our ambitions to vitalise Duni’s brand profile around food and interior design, and can be used by Duni’s entire international organization.”
Tina Andersson believes that the special- designed range entitled Designs for Duni® provides a good example of Duni’s ability to create something out of the ordinary in terms of design. Designs for Duni® is a clear concept in which known designers create exceptional product ranges. With the concept, Duni is successfully climbing up the value chain, while at the same time infusing the brand with modern values.
“In 2013, Duni also launched a number of exciting, innovative products,” says Tina. “One example is a round pizza carton made out of bagasse – a resource-efficient material with a strong environmental profile – which has been developed in close cooperation with one of our customers.”
“I believe in increased cooperation with our customers,” concludes Tina. “The restaurant and hotel industry is full
of knowledge, experience, drive and innovative thinking. The key to our continued successful development of the Duni brand lies in listening to, and assimilating, what the restaurant and hotel industry has to offer.”
Duni_ÅR_13_EN.indd 16 2014-04-15 15:06

17THE DUNI BRAND – DESIGN
16
“ Design is an important basis for Duni’s success”
Design
“Design is extremely important, since it’s the customer’s initial impression of our product,” says Karin Nyhuis, Head of Design at Duni. Design adds value, makes the products stick out, and is thereby able to achieve more.
“Good, modern design makes a vital contribution to Duni’s success, and is often a key factor. Since Duni is a market leader, we must be at the forefront.”
Karin Nyhuis and her team work on the design of the products 12–18 months in advance. Thus, identifying trends and receiving the right inspiration are key factors.
“I acquire inspiration in many different ways,” says Karin. “Often, it’s enough to look at how people are dressing and how they furnish their homes, to observe details in shop windows, or to see the design concept in restaurants and hotels”.
Many sources of inspiration“I also gain inspiration from books covering trends in interior design and colour schemes, by visiting stores, and by attending inter -national trade fairs, such as “Heimtextil” in Frankfurt, “Maison & Objects” in Paris, and “Formex” in Stockholm. Other important sources of inspiration are, of course, trend magazines and the Internet. Once a year, I travel to New York to seek out new trends.”
All the impressions gained are consoli-dated and adapted to the different target groups. Each year, Duni replaces approxi-mately 25% of its product range, to ensure that the Company conveys the image of
being one step ahead. Just as in the fashion industry, seasonal collections are important: spring, Easter, summer, autumn, winter and Christmas are the seasons that dictate Duni’s product range strategy. For 2014, Duni has created four design categories: “The raw chic”, “Cosy way of living”, “Journeys through times” and “Nature’s evolution”.
“The growing interest in environmental issues among customers is a major source of inspiration. We can express environ-mental awareness through color and design. The new design category, “Nature’s evolution” is a good example of this.”
Duni_ÅR_13_EN.indd 17 2014-04-15 15:06

At the beginning of 2012, Duni took the strategic decision to focus, in a structured manner, on growth markets outside Europe. The New Markets organization was formed in order to take advantage of the high rate of growth for Duni’s products on new geographic markets. On average, sales on markets outside Europe are growing at approximately 20%, albeit from relatively low levels thus far.
In 2013, a systematic and structured re-view was undertaken regarding the countries outside Europe in which Duni has sales. The review will subsequently be carried out regularly in order to define which countries are to be developed into strategic markets.
Acquisition in Singapore In 2013, Duni took an important step
Focus on growth in Southeast Asia and Russia
Growth areas
when it was able to add south-east Asia as a strategic market thanks to the acquisition of Song Seng in Singapore. Duni Song Seng has 30 employees and sales continued to grow positively in 2013. The company has been established in Singapore since 1984 and is very well acquainted with the local market.
Duni Song Seng buys and sells finished products, mainly single-use articles for take-away and fast-food chains. The company sells to several of the world’s largest global fast-food chains on the Asian market. Through several of these major customers, possibilities are created for Duni to make inroads in other countries in south-east Asia, as well as other countries in the rest of Asia.
The focus as regards Duni Song Seng is to gradually work Duni’s premium products into its product range. At present, Duni Song Seng’s customer offering comprises some 100 articles, out of Duni’s total of 5,000 products.
High rate of growth in RussiaDuni has had its own organization in Russia for almost 10 years. The head office, which is located in Moscow, has approximately 20 employees. The market is large and growing rapidly. It is estimated that there are 21,000 hotels and restaurants in the country. Duni has enjoyed extremely strong growth in Russia, but profitability has not been at satisfactory levels.
Duni_ÅR_13_EN.indd 18 2014-04-15 15:06

1918
GROWTH AREAS
During the year, Duni created a platform for profitable growth in Russia. Accordingly, focus has been placed on profitability, which to a certain extent has held back the rate of growth. Despite this, Duni’s sales in Russia in 2013 increased by 16%.
Other exports strengthenedOther exports are driven by distributors in some 30 selected countries. It is now important for Duni to create its own presence on the most highly prioritized markets. Such presence makes it easier to understand the special conditions on each market: competi-tion, the customers’ needs, or market dynamics. In 2013, Duni strengthened its operations by stationing its own personnel in certain strategically selected countries.
On average, sales on markets outside Europe
are growing at approximately 20%.
Duni_ÅR_13_EN.indd 19 2014-04-15 15:06

57%
NET SALES AND OPERATING INCOME, SEK M
NET SALES PER GEOGRAPHIC REGION, %
Napkins
10%
23%
10%
6%
2%
49%
Candles Other Other
Tablecoverings Packaging solutions
Serving products
Central Europe
23%
17%
3%
S. and E. Europe
Nordic region
NET SALES PER PRODUCT GROUP, %
Increased focus on growth niches within stable marketsFollowing a weak start to the year, both growth and profitability within the Professional business area picked up during the second half of 2013. Sales rose to SEK 2,702 (2,682) m and profitability increased to SEK 356 (337), equal to an operating margin of 13.2% (12.6%).
The business area comprises two customer categories: Table Top and Meal Service. Table Top focuses primarily on hotels and restaurants, while Meal Service focuses on larger chain-driven restaurant and cafe concepts with a large percentage of take-away, as well as players within the public sector and various types of catering. Both categories focus primarily on various decision-makers and satisfy different needs with different products. In the case of Table Top, this involves products for the set table to create atmosphere and provide convenience. Meal Service focuses on functional packaging and serving solutions.
Specialized, more efficient sales organizationsA large part of the internal work during the year has been devoted to developing the sales organization. This has resulted in two specialized sales organizations – one within Table Top and one within Meal Service. Each of them is a specialist as regards a narrower range of products, thereby resulting in more efficient sales work.
For the customers, the change means
Professional business area
that they meet two experts, each of whom is even more knowledgeable about his or her area. This is considered to be a significant competitive advantage in most major customer interactions. Within the wholesale trade, Table Top and Meal Service largely focus on the same customers, a factor which requires internal coordina-tion between the activities of the sales organizations of both customer categories.
Offensive strategy in selectedgrowth areasTable Top accounted for approximately 80% of the business area’s sales in 2013. Table Top is largely operating on mature markets with overall low or zero growth. Table Top has long focused on defending the positions built up within the premium segment. During 2013, Table Top defined a number of areas – both geographic markets and product areas – on which there is a higher rate of growth and where there is an opportunity for Duni to strengthen its presence by adopting an offensive strategy.
During the past three years, when most European countries have been plagued with severe economic difficulties, it has been a challenge to identify geographic growth areas in Europe. This has further contributed to the overall stagnation on the market, not least in those countries which, a few years ago, were regarded by Duni as growth markets – for example, the countries of southern Europe.
Historically, Germany, the Nordic countries and the Benelux countries have been Table Top’s strongest markets. In 2013, the strategy of defending our positions on these markets was maintained, in order to be able to go on the offensive in other countries, particularly in Italy and England.
Focus on southern EuropeDuring 2013, focus was placed on southern Europe, with the business area developing products and offerings specifically adapted for the market. The work has been successful and will continue in the coming years.
Regained strong position in EnglandIn contrast to the countries of southern Europe, the English market is dominated by a small number of wholesalers. In 2013, Table Top’s structured activities resulted in it regaining a position on the market.
Candles and accessories – a natural part of the offeringIn 2013, Table Top also focused on Duni’s third product category: “Candles and accessories”. For Table Top, these types of products are strategically important in order to be able to offer an attractive, all-inclusive concept for the set table. During the year, Table Top expanded the product range and successfully sourced suppliers in Asia in order to increase its competitiveness.
4 000 400
3 000 300
2 000 200
1 000 100
Net sales
Operating income
2009 2010 2011 2012 2013
402384
357337
356
2 88
5
2 78
3
2 76
6
2 68
2
2 70
2
Duni_ÅR_13_EN.indd 20 2014-04-15 15:06
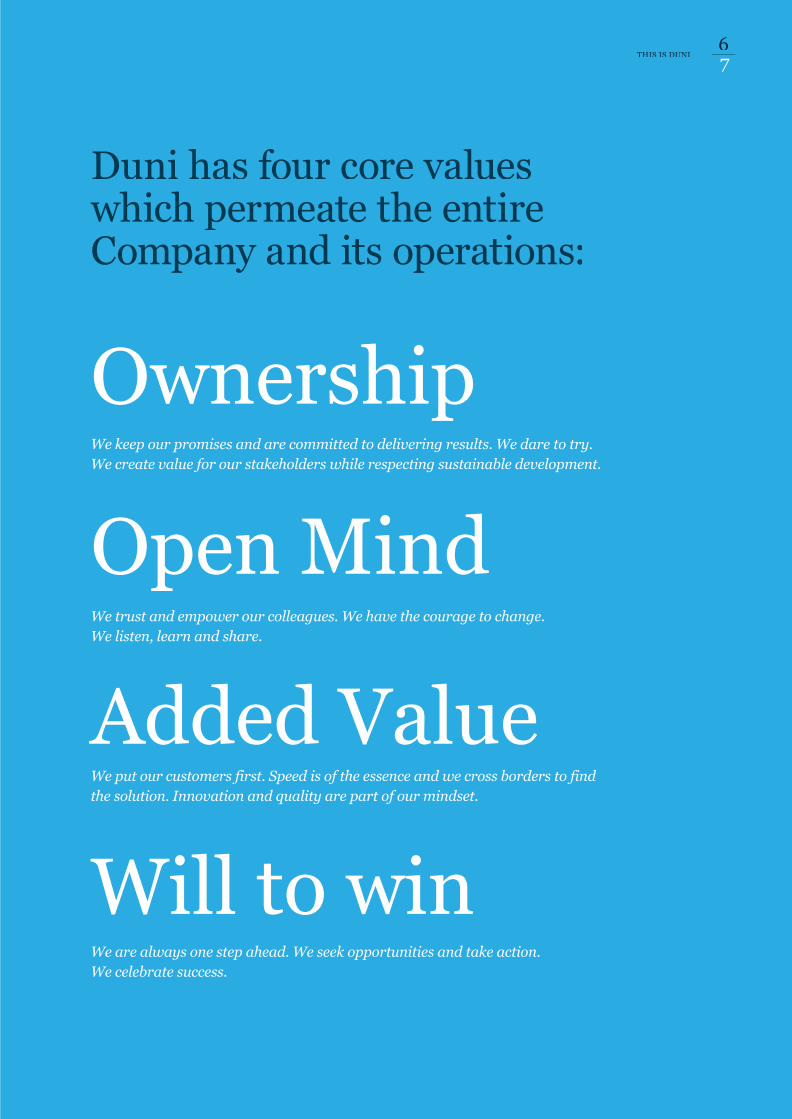
CUSTOMER CATEGORIES
Hotels The hotel industry is less fragmented than the
restaurant industry. Hotel operations – usually with integrated restaurant operations – are often conducted in chains with centralized purchasing. Hotels on higher quality and price levels account for the overwhelming majority of purchases of Duni’s premium products.
Restaurants The restaurant industry is
very fragmented, but there are some chains, often with well-defined business concepts. Within the restaurant industry there is a trend towards a clearer segmentation, with strategies focused on quality, lifestyle and price level constituting the basis for the business and dictating its focus. Restaurants on higher quality and price levels account for the overwhelming majority of purchases of Duni’s premium products, i.e. higher quality products, often deep dyed or with color print. Take- away is a rapidly expanding segment
within the restaurant industry, and one on which Duni develops products in close cooperation with its customers.
Catering In addition to catering, the larger firms in the
catering industry also offer and operate commercial kitchens within both the private and public sector. Within the areas of contract catering and concession catering, the market is dominated by a small number of large companies with international
operations. In addition, there are a very large number of smaller companies.
Public sector The public sector is an area outside the normal
HoReCa industry, but one in which meals and the handling of foodstuffs play a significant part, which is incre-asing in importance and demands.
The Professional business area’s strategy in brief:– To be the leader within the premium segment.– Growth through geographic expansion with focus on increased market shares in Southern and Eastern Europe and the UK.– To take advantage of new trends and concepts on the HoReCa market, such as increased demand within take-away.
PROFESSIONAL BUSINESS AREA
2120
Duni_ÅR_13_EN.indd 21 2014-04-15 15:06

Designs for Duni® strengthens the brand and increases profitabilityIn 2013, the Consumer business area enjoyed solid growth, with an increase in volumes of 11.1% at fixed exchange rates. The increase is primarily due to the business area’s success in securing a number of large new customer contracts.
Sales increased to SEK 603 (551) m and operating income increased to SEK 12 (6) m, representing an operating margin of 2.1% (1.0%).
Strong growth in GermanyGeographically, sales take place throughout Europe, crucially in central Europe, especially Germany. For several years, the European grocery retail trade within Duni’s product range has been characterized by a low rate of growth and declining volumes. Sales have been differentiated and the products are now available at significantly more points of sale. At the same time, the packages have become ever larger.
Towards the end of 2012, contracts were signed with a number of major customers in Germany, which strongly contributed to the positive volume trend in 2013. Generally, the business area has succeeded in attracting several new customers and strengthening its market position on the important German market. Switzerland is another country which exhibited a positive trend in 2013.
The Nordic region accounts for approxi-mately 17% of sales. There, too, volumes developed positively with an increase of 39%. Also in this region, the positive trend is attributable to new contracts and customers.
The business area has identified Poland and France as important growth markets. Here, special sales activities were initiated in 2013 aimed at promoting growth. In Poland, the business area can also take advantage of Duni’s presence on the market thanks to its production in Poznan.
Designs for Duni® strengthensDuni’s innovative role One of the most important activities in 2013 was the start of a change in the business area’s product range strategy, involving a gradual focus on premium products.
In order to strengthen the Duni brand as an innovative player, 2013 saw the creation of ”Designs for Duni®”, a unique concept in which Duni develops selected products in cooperation with well-known European designers and design houses. The concept positions Duni as a leading design partner at the retailers. This provides an opportunity for a larger percentage of higher margin contracts, while at the same time creating improved drawing power and a greater degree of innovation in the product range.
Consumer business area
The Finnish design house Vallila was the first off the mark in Scandinavia. Their designs range from playful to futuristic and provide inspiration for elegant and unexpected table settings. During 2013, products were also launched with the Dutch design house Melli Mello. For 2014, products have been developed together with the well-known Swedish designer Hanna Werning. New collections from Vallila and Melli Mello were also launched in January 2014.
”Designs for Duni®” contributes to higher profitability and supports the business area’s endeavors – through being highly innovative – to be a total supplier of products around the dining table. Both sales and profitability in 2013 indicate that the business area is taking the right step in this direction.
800 40
600 30
400 20
200 10
80%
2009 2010 2011 2012 2013
Napkins
12%
15%
3%
42%
28%
Tablecoverings
Other CandlesServing products
Central Europe
3%
17%
S. and E. Europe
Nordic region
6
12
18
32
21
792
689
612
603
551
NET SALES AND OPERATING INCOME, SEK M
NET SALES PER GEOGRAPHIC REGION, %
NET SALES PER PRODUCT GROUP, %
Net sales
Operating income
Duni_ÅR_13_EN.indd 22 2014-04-15 15:06

CUSTOMER CATEGORIES ON THE CONSUMER MARKET
DESIGNS FOR DUNI
Customers are mainly grocery retail chains, but also other channels such as specialty stores. Sales within the Consumer business area are characterized by short-term campaigns and projects, as distinct from Professional where transactions are more long-term in nature.
Grocery retail tradeThe European grocery retail trade is concentrated
on a small number of large companies in each country, such as Tesco (the
UK), Aldi (Germany), Carrefour (France), and ICA (Sweden). The larger companies have centralized purchasing and some have joined forces in international purchasing associations.
OtherOther customers within Consumer consist of
pharmacies, various specialty stores, gardening outlets as well as other department stores and home furnishing chains.
The Consumer business area’s strategy in brief:– Duni shall be the natural business partner for the European grocery retail trade.– To operate in the category together with the grocery retail trade, based on a customer and consumer perspective.– Through high flexibility and a service offering, to be part of the customer’s business model, both within the trade’s private labels
and Duni’s own brand.
Hanna Werning works across a broad design
spectrum with projects throughout the world; her speciality is pattern design on materials such as textiles, wallpaper, glass and porcelain.
Melli Mello comes from the design house La Terzi, one
of the leading design studios in the Netherlands.
Industry leader Vallila is a Finnish family-owned
home furnishings company with the ambition to be a creative, refreshing leader in the furnishings world. Vallila’s broad collections include a choice of textiles, carpets and furniture.
CONSUMER BUSINESS AREA
2322
Duni_ÅR_13_EN.indd 23 2014-04-15 15:06

The Tissue business area produces and sells tissue and airlaid for conversion into tabletop products and hygiene products. During 2013, sales to external customers increased by 14% (2%). Just over 45% of production is sold to external customers, while the remainder is used within the Group.
Tissue and airlaid constitute the basis for Duni’s production of table top products, such as napkins and tablecoverings, as well as hygiene products. The term ‘airlaid’ refers to air laid tissue, while ‘tissue’ refers to wet laid tissue. Production plants are located in Skåpafors and Dals Långed in Dalsland. These paper mills are special-ized in the production and deep dyeing of high-quality tissue and airlaid.
Development in 2013In 2013, sales within Tissue increased to SEK 499 (436) m. Operating income was SEK 17 (-1) m and the operating margin was 3.4% (-0.2%).
Tissue and airlaid – Duni’s baseTissue business area
Closure of hygiene materials production unitIn February 2013, Duni took the decision to discontinue the operations within the Tissue business area involving the manufacture and sale of materials to the hygiene products sector. The business is not profitable and the assessment is that acceptable profitability cannot be achieved within the foreseeable future. In November 2013, a decision was taken to extend production for an additional year. Consequently, production is continuing with satisfactory profitability until closure of the plant.
Final closure of the production unit is expected to take place in March 2015. As a consequence of the decision to discontinue the production of hygiene materials, the plant has been operating at a high level of capacity utilization, thereby contributing to the satisfactory profitability reported by Tissue in 2013, which will continue until the plant is closed in March 2015.
51%
Internal
47%
53%
External Central Europe
Other
2%
17%
30%
S. and E. Europe
Nordic region
EXTERNAL AND INTERNAL SALES, %
CUSTOMER CATEGORIES
Most of Duni’s production of air laid tissue, commonly referred to only as airlaid,
is sold externally as an input material to manufacturers of hygiene products for the consumer market. Customers within this category are often global companies with their own organiza-tions for product development, manufacturing and distribution.
Duni’s production of wet laid tissue, commonly referred to as tissue, is
mainly used internally and meets Duni’s own needs for the manufac-ture of table top products. Tissue is produced in various qualities and processed into various materials, such as Dunicel® and Dunisilk®. Dunicel® is a robust material which
is suitable for the production of table top products and has a feel which resembles cotton and linen table- coverings. Dunisilk® is a material which is used for tablecoverings and has been produced to protect the table and can be wiped off after use. Production of airlaid meets Duni’s own needs for the production of napkins. The unique premium
material, Dunilin®, has incredibly good absorption quality combined with a very soft feel. Since the end of 2011, production is also taking place of Evolin®, a new and revolutionary tablecovering material which is a direct alternative to linen.
600 60
450 45
300 30
150 15
2009 2010 2011 2012 2013
16 18
25
17
-1543
499
428
499
436
NET SALES AND OPERATING INCOME, SEK M
Net sales
Operating income
NET SALES PER GEOGRAPHIC REGION, %
Duni_ÅR_13_EN.indd 24 2014-04-15 15:06

25TISSUE BUSINESS AREA – PRODUCTION AND DISTRIBUTION
24
Production
Raw materials and productionDuni produces tissue and airlaid in Skåpafors and Dals Långed, Sweden. These paper machines are capital-intensive and thus full capacity utilization is important.
ConvertingDuni has two converting plants – one in Bramsche, Germany, and one in Poznan, Poland. Converting involves Duni manufacturing finished products based on the paper material (tissue, airlaid or suchlike) which is mainly produced in Skåpafors or Dals Långed. Transportation costs account for a large portion of total production costs and thus it is important that conversion plants be geographically located in proximity to the end markets. The German plant in Bramsche enjoys a strategically favorable location. Germany is one of Duni’s main markets, and other important markets such as the Benelux countries, France, Austria, and Switzerland can be reached with short transportation times. In recent years, Duni has regularly carried out improvement measures aimed at increasing the productivity and efficiency of the plants.
Efficient logistics with the customers in focus
Production and distribution
Distribution
Logistics and warehousingThe logistics function handles both internal transportation between Duni’s strategically located warehouses and external transportation from Duni to the Company’s customers. In 2013, Duni had six distribution centers of varying sizes. The largest is located at the plant in Bram-sche, Germany. Eastern Europe is covered by the warehous-ing and distribution center at the plant in Poznan, Poland. Sweden, Norway and Denmark are covered from a center in Norrköping, Sweden.
Lead times constitute an important competition factor and it is important to cut them as much as possible. Therefore, Duni has smaller distribution centers in Finland, Russia (Moscow) and Singapore.
Singapore
Duni_ÅR_13_EN.indd 25 2014-04-15 15:06

AtmosphereA good atmosphere for life on Earth is important to Duni. We depend on clean water, air and soil. As humans and as a company. Caring about our climate and environment is fundamental to our future business
“Duni is actively working to reduce the company’s CO2 footprint. Duni recognizes the need for the industry to take a lead in finding new ways of working, new materials and the technology to minimize impact on the climate from products and operations.”
AmbiencePeople are what make things happen. When they feel engaged, safe and healthy. Creating a fair and open ambience for customers, employees and suppliers is deeply rooted within Duni’s business.
“The work climate at Duni is characterized by respect for the equal value of each individual, irrespective of gender, ethnic background, nationality, religion, disability or other differences which are unrelated to good work performance.”
AccountabilityThe reliability of Duni’s products – our core business – makes the company accountable. We believe that what is good for people and the environment is good for Duni’s profitability.
“As a market-leading brand, Duni recognizes the trust that customers put in the company to follow high ethical and environmental standards. Duni’s guidelines for social responsibility apply to employees and in all business areas, without exception and they comply with national laws and legislation.”
From Duni’s “Our Blue Mission”
Duni_ÅR_13_EN.indd 26 2014-04-15 15:06

27OUR BLUE MISSION
26
Our products – The core of ourvalue chainDuni offers a competitive product range from a sustainability perspective. Focusing on responsibly sourced raw materials and efficient production, we are seeking innovative solutions in order to constantly improve our environmental profile. Most of Duni’s products are made from the renewable raw material, paper, which is sourced from responsibly managed forests certified in accordance with FSC®.
Manufacturing is certified in accordance with ISO 14001 and Duni demands that the Group’s subcontractors engage in systematic environmental work. Develop-ment work within the area is focused on using resource-efficient materials which are renewable (plant-based), compostable, or from a certified raw material.
“It is Duni’s ambition that information about the environmental and safety profile of the products shall be based on facts and be easy for the consumer to understand,” says Duni’s Corporate CSR & Quality Director Elisabeth Gierow. As part of the work, Duni has commissioned life-cycle studies in respect of napkins and tablecoverings (To read the reports, visit www.duni.com).
“Duni’s products are primarily intended for contact with food. This carries with it a responsibility to guarantee safety for defined use. Duni’s products are tested to ensure the Duni does not exceed the stringent limits that are in place, for example to prevent chemicals from
Clean Atmosphere. Ambience. Accountability. Our Blue Mission
plastics or dyes passing into food. In addition, Duni’s candles comply with the RAL standard (quality marking for candles) in respect of quality and Duni also offers candles with Svanen environmental marking.
Duni’s own production plants are certified in accordance with ISO 14001, environmental management system, and ISO 9001, quality management system.
Duni’s conversion plants are certified for BRC-CP (British Retail Consumer-products) within the area of product safety and quality.
Code of conduct for Duni and its suppliersAs a market-leading brand focused on growth within new sectors and geographic areas, Duni recognizes the trust that customers place in the Company complying with the highest ethical standards. Duni’s corporate social responsibility guidelines include a code of conduct (both for Duni and suppliers) focused on human and worker rights and occupational health and safety, as well as procedures for business ethics, crisis management and support for charitable purposes.
The guidelines apply to all employees and within all business areas, without exception, in addition to compliance with national laws and regulations.
The supply chainDuni carries out annual audits of, and follow-up visits to, the production plants of its suppliers in order to ensure
compliance with Duni’s requirements. One principle guiding Duni’s work concerning codes of conduct is to achieve a neutral competition situation by applying uniform requirements to all subcontractors, irrespective of where in the world they operate.
Only suppliers with a positive and responsible attitude towards social issues and work conditions are used. The work of evaluating suppliers is based on agreements with Duni’s labor unions. Duni also complies with requirements set forth in a number of ILO (International Labor Organization) conventions in the area. In conjunction with the audits, evaluations are made regarding, among other things, working conditions, safety at the plant, ensuring that child labor does not occur, compliance with minimum wages, and that the number of work hours is in accordance with the legislation of the country where the production takes place. An evaluation is also made of hygiene issues to ensure that rigorous hygiene standards are observed when producing the products.
In addition, an evaluation is made as to whether the subcontractor actively works with the ISO 9000 quality system and the ISO 14001 environmental management system or equivalent.
Duni issues a separate CSR report entitled Our Blue Mission. For more information about ”Our Blue Mission”: www.duni.se/corporate-responsibility
100
75
50
25
2010 2011 2012
100
2013
97 94 86
“Our Blue Mission” represents Duni’s corporate social responsibility program. It involves Duni creating a good Atmosphere, Ambience, and Accountability.
CARBON FOOTPRINT EMISSIONS (CO2EQ.)
DUNI HAS IDENTIFIED A NUMBER OF MAIN AREAS FOR ITS CSR WORK:
ELISABETH GIEROW, CORPORATE CSR & QUALITY DIRECTOR
• Dependence on, and usage of, raw-materials & energy.
• Impact on the climate.• Products intended for food contact use and
safety for consumers.• Occupational health and human rights of people
working to manufacture Duni products.• Short life-cycle of Duni products, end-of life impact.• Impact on local communities and environment
of Duni’s own manufacturing.• Risk in external business relations, anti-
corruption, business ethics.
“It is Duni’s ambition that information about the environmental and safety profile of the products shall be based on facts and be easy for the consumer to understand”
Duni_ÅR_13_EN.indd 27 2014-04-15 15:06

Duni_ÅR_13_EN.indd 28 2014-04-15 15:06

2929
XXXXXXXXXXXXXXX
Duni_ÅR_13_EN.indd 29 2014-04-15 15:06
Enhanced businessmanship
With the aim of increasing the degree of specialization and strengthening focus on prioritized customer segments, the Profes-sional business area’s sales organization has been divided into two parts – one focusing on the Table Top market segment, and the other working the Meal Service market segment. The change represents a natural step following the reorganization that was initiated in 2012. It creates conditions for more efficient resource utilization and improved integration between market and sales activities.
Core values and operating principlesDuni operates on the basis of four core values which provide guidance in the day-to-day operations and clarify how things are to be done “the Duni way”. The core values – Ownership, Added value, Open mind and Will to win – find concrete expression in a number of operating principles and, taken together, are aimed at creating profitable growth, organizational efficiency, and improved customer satisfaction.
Employees
Duni’s core values and operating principles are:
Ownership:We keep our promises and are committed to delivering results. We dare to try. We create value for our stakeholders while respecting sustainable development.
Added value:We put our customers first. Speed is of the essence and we cross borders to find the solution. Innovation and quality are part of our mindset.
Open mind:We trust and empower our colleagues. We have the courage to change. We listen, learn and share.
Will to win:We are always one step ahead. We seek opportunities and take action. We celebrate success.
The work climate in Duni is characterized by respect for the equal value of each individual, irrespective of gender, ethnic background, nationality, religion, disability or other differences which are unrelated to good work performance.
Skills and management development Skills and management development are prioritized issues at Duni. Each employee shall have a personal development plan prepared by the employee personally in consultation with his/her supervisor. The personal development plan is adopted at the annual individual planning and performance review.
RecruitmentRecruitment is a key issue for the Company’s success. Duni requires well-qualified and motivated staff to ensure that we achieve our goals. A successful company with a strong brand creates opportunities for a qualitative recruitment process and structure that contribute to the recruitment of the very best employees.
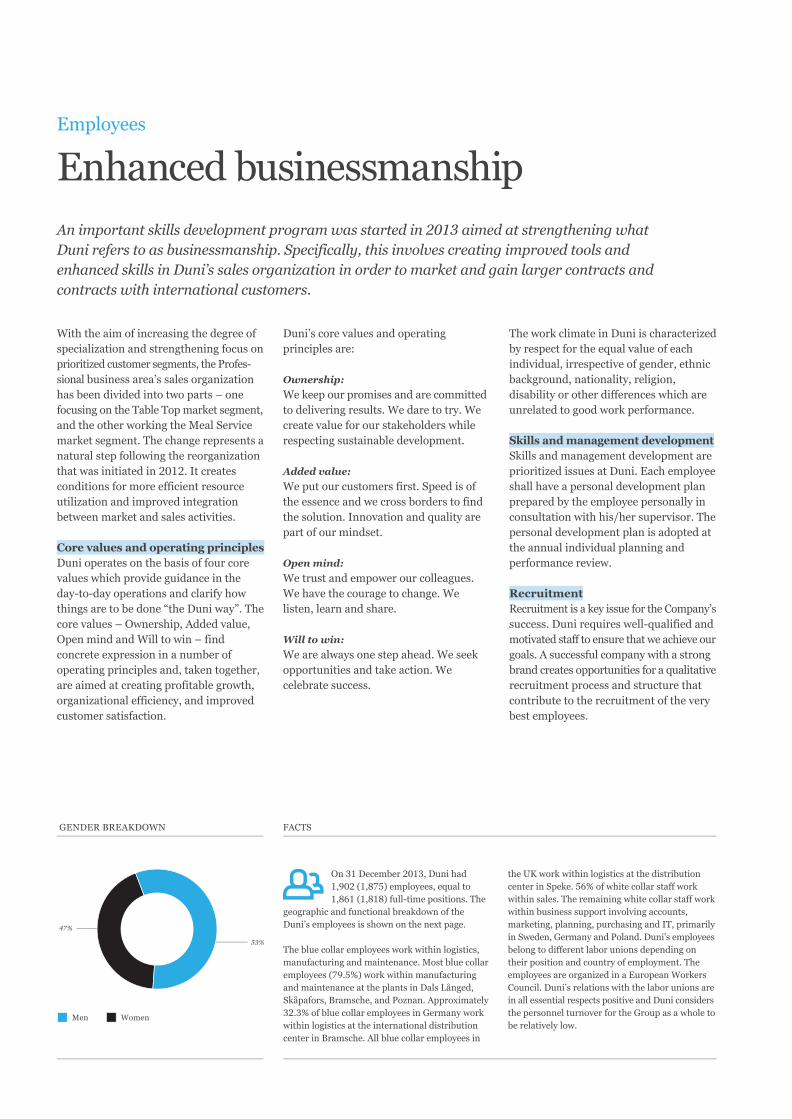
53%
GENDER BREAKDOWN
Men
47%
Women
FACTS
An important skills development program was started in 2013 aimed at strengthening what Duni refers to as businessmanship. Specifically, this involves creating improved tools and enhanced skills in Duni’s sales organization in order to market and gain larger contracts and contracts with international customers.
On 31 December 2013, Duni had 1,902 (1,875) employees, equal to 1,861 (1,818) full-time positions. The
geographic and functional breakdown of the Duni’s employees is shown on the next page.
The blue collar employees work within logistics, manufacturing and maintenance. Most blue collar employees (79.5%) work within manufacturing and maintenance at the plants in Dals Långed, Skåpafors, Bramsche, and Poznan. Approximately 32.3% of blue collar employees in Germany work within logistics at the international distribution center in Bramsche. All blue collar employees in
the UK work within logistics at the distribution center in Speke. 56% of white collar staff work within sales. The remaining white collar staff work within business support involving accounts, marketing, planning, purchasing and IT, primarily in Sweden, Germany and Poland. Duni’s employees belong to different labor unions depending on their position and country of employment. The employees are organized in a European Workers Council. Duni’s relations with the labor unions are in all essential respects positive and Duni considers the personnel turnover for the Group as a whole to be relatively low.
Duni_ÅR_13_EN.indd 30 2014-04-15 15:06

31EMPLOYEES
30
AVERAGE NUMBER OF EMPLOYEES
Country Blue collar employees White collar staff Total
Sweden 221 167 388
Germany 543 276 819
Poland 270 99 369
The Netherlands – 54 54
UK 18 21 39
Other 17 175 192
Total 1 069 792 1 861
2009 1 953
2010 1 948
2011 1 928
2012 1 889
2013 1 902
GEOGRAPHIC AND FUNCTIONAL BREAKDOWN
Salaries and reward systemDuni applies individual salaries and, in several subsidiaries, salaries are partially linked to performance, based on a combination of financial targets and other measurable business targets.
Business ethics Business ethics are of the utmost impor-tance. Duni’s growth on new markets is accompanied by a clear establishment of ethical guidelines. Duni’s employees are in daily contact with customers, suppliers, owners, representatives of the community and other stakeholders. It is of fundamental importance that, at Duni, profits and sound business ethics go hand in hand.
First and foremost, it is a question of how our employees behave in their day-to-day business contacts. Duni’s business ethics policy defines and establishes rules within areas such as behavior, conflicts of interest, confidentiality, cartels, gifts/corruption/bribes, as well as reporting of violations.
Duni_ÅR_13_EN.indd 31 2014-04-15 15:06

Performance and turnover Duni has been listed on NASDAQ OMX Stockholm since November 14, 2007, in the Midcap, Consumer Discretionary list with the ticker name ”DUNI” and ISIN-kod SE0000616716. The final price upon listing was SEK 50 per share, entailing a market capitalisation for Duni of SEK 2.35 billion. Since the listing, Duni’s share price has increased by 67% up to December 31, 2013, entailing a market capitalisation of SEK 3.91 billion at the end of 2013. During 2013, the closing price varied between a high of SEK 83.25 on December 20 and a low of SEK 56.75 on February 4. Earnings per share for the year were SEK 5.68. During 2013, 13.5 million Duni shares changed hands, valued at SEK 869 million.
Number of shares and share capital On December 31, 2013, Duni AB (publ) had 46,999,032 outstanding shares. Each share entitles the holder to one vote and to an equal share in the Company’s assets and earnings. The quotient value is SEK 1.25 and the share capital is SEK 58,748,790.
Dividend policy and dividends It is the intention of the Board of Directors that, in the long term, dividends shall amount to at least 40% of income after tax. However, when deciding whether to propose any dividend, consideration shall be given to Duni’s possibilities for expansion, the need to strengthen the balance sheet, liquidity as well as financial position in general. The Board of Directors proposes to the annual general meeting that a dividend be paid of SEK 4.00 per share for the 2013 financial year, corresponding to 70% of earnings after tax.
External analyses were published by:
– SEB Enskilda Equities, Christopher Lyrhem
– ABG Sundal Collier, Andreas Lundberg
– Handelsbanken Capital Markets, Casper Blom
The share OWNERSHIP STRUCTURE DEC 31, 2013
SHAREHOLDERS DEC. 31, 2013
DATA PER SHARE
Number of shareholders Number of shares % of share
1 – 500 4 541 779 550 1.66
501 – 1 000 855 712 005 1.51
1 001 – 5 000 582 1 344 205 2.86
5 001 – 10 000 65 504 045 1.07
10 001 – 15 000 22 285 458 0.61
15 001 – 20 000 16 293 737 0.62
20 001 – 95 43 080 032 91.66
Total 6 176 46 999 032 100.00
Number of shares % of shares
Mellby Gård Investerings AB 14 094 500 29.99 %
Carnegie fonder 4 464 416 9.50 %
Polaris Capital Management, LLC 3 847 477 8.19 %
Lannebo fonder 3 823 082 8.13 %
Swedbank Robur fonder 3 438 359 7.32 %
Odin Fonder 2 268 527 4.83 %
State Street Bank & Trust Com 2 010 334 4.28 %
Mellon US 1 316 030 2.80 %
4th Swedish National Pension Fund 1 278 770 2.72 %
JPM Chase NA 1 089 865 2.32 %
Total, the ten largest owners
– in terms of holdings 37 631 360 80.07 %
Other shareholders 9 367 672 19.93 %
Total 46 999 032 100.00 %
Amount, SEK Dec. 31, 2013
Number of shares at end of period (thousands): 46 999
Average number of shares before and after dilution (thousands): 46 999
Price on December 31: 83.25
Earnings per share before and after dilution: 5.68
Equity per share: 44.67
P/E-ratio per Dec. 31, 2013 14.66
Further information about the Duni share is available on
www.duni.com
Duni_ÅR_13_EN.indd 32 2014-04-15 15:06

2013-01-02
SHARE PERFORMANCE 2013, SEK, CLOSING PRICE
SHARE PERFORMANCE 2007–2013, SEK, CLOSING PRICE
10
10
0
0
20
20
30
30
40
40
50
50
60
60
90
90
70
70
80
80
THE SHARE3233
2013-12-30
2013-12-30 2007-11-14
Duni_ÅR_13_EN.indd 33 2014-04-15 15:06

Duni_ÅR_13_EN.indd 34 2014-04-15 15:06

3535
XXXXXXXXXXXXXXX
Duni_ÅR_13_EN.indd 35 2014-04-15 15:06

ContentAnnual Report
Directors’ report 36Corporate Governance Report for Duni AB (publ) 40Board of Directors 44Senior Executives 45Five-year summary, Consolidated Income Statements 46Five-year summary, Consolidated Balance Sheets 47Key ratios in brief, Group 47Consolidated Income Statement 48Consolidated Statement of Comprehensive Income 49Consolidated Balance Sheet 50Consolidated Statement of Changes in Equity 52Consolidated Cash Flow Statement 53Parent Company, Income Statement 54Parent Company, Statement of Comprehensive Income 54Parent Company, Balance Sheet 55Parent Company, Changes in Shareholders’ Equity 57Parent Company, Cash Flow Statement 58
Notes
1. General information 592. Summary of important accounting principles 592.1 Bases for preparation of the financial
statements 592.2 Consolidated reporting 592.3 Segment reporting 602.4 Translation of foreign currency 602.5 Cash flow statement 602.6 Revenue 602.7 Intangible assets 612.8 Tangible fixed assets 612.9 Impairment of non-financial assets 612.10 Leasing 612.11 Financial assets 612.12 Inventories 622.13 Cash and cash equivalents 622.14 Financial liabilities 622.15 Income taxes 622.16 Compensation to employees 632.17 Provisions 632.18 Fixed assets held for sale and discontinued
operations 632.19 Emission rights 632.20 The parent company’s accounting principles 633. Financial risks 643.1 Financial risk factors 643.2 Management of risk capital 663.3 Calculation of fair value 664. Important estimations and assess ments for
accounting purposes 66
4.1 Important estimations and assumptions for accounting 66
4.2 Important assessments upon application of the company’s accounting principles 67
5. Operating segments 676. Intra-group purchases and sales 687. Expenses by nature 688. Depreciation/amortization 699. Restructuring expenses/allocation to
restructuring reserve 6910. Inventories 7011. Compensation to auditors 7012. Personnel (average number) 7113. Salaries and other remuneration 7114. Other operating income 7315. Other operating expenses 7416. Net exchange rate differences 7417. Income from financial items 7418. Income from participations in group companies 7519. Income tax 7520. Share capital and earnings per share 7721. Intangible assets 7722. Buildings, land and land improvements 7923. Machinery and other technical equipment 8024 Equipment, tools and installations 8125. Construction in progress and advanced
payments for tangible assets 8126. Participations in group companies 8227. Other long-term receivables 8228. Accounts receivable and other receivables 8229. Derivative instrument 8430. Prepaid expenses and accrued income 8431. Borrowing 8432. Classification of financial instruments 8533. Pension provisions 8634. Accrued expenses and deferred income 8935. Pledged assets and contingent liabilities 8936. Adjustments for items not included in
the cash flow 8937. Obligations 8938. Acquisitions 9039. Related-party transactions 9040. Events after the balance sheet date 90
Auditor’s report 91Key Ratio Definitions 92Glossary 93Calendar 94Addresses 94
Duni_ÅR_13_EN.indd 36 2014-04-15 15:06

37DIRECTORS’ REPORT
36
Directors’ reportDirectors’ report – the GroupDuni is one of the leading companies in Europe within attractive, quality table setting products and concepts, as well as packaging for take-away. The Group’s strong position has been achieved thanks to a combination of high quality products, a well-reputed brand, established customer relations, as well as a strong local presence on most European markets. Operations are conducted within three business areas: Professional, Consumer and Tissue.
The Professional business area offers Duni concepts and products primarily to hotels, restaurants and catering companies. Professional comprises two product categories: Table Top and Meal Service. Table Top primarily markets napkins, tablecoverings and candles, combined in matching concepts for the set table. Duni is a market leader within the premium segment in Europe. Meal Service markets more functional concepts for meal packaging and serving products, for example to-go, take-away and catering. As a niche player within this area, Duni enjoys a leading position in the Nordic region. The Professional business area accounts for approximately 71% of Duni’s sales.
Within the Consumer business area, Duni offers consumer products primarily to the retail trade. The range includes napkins, tablecov-erings, candles, glasses and cutlery. The products are marketed primarily under the Duni brand. Duni also develops and manufactures products for customers who market them under private labels. Duni enjoys a leading position in the Benelux countries, the Nordic region, Germany, Switzerland and the UK. The business area accounts for 16% of Duni’s sales.
The Tissue business area produces airlaid and tissue based material which is used in products within the other business areas and is a subcontractor to external customers, mainly within the hygiene products industry. Tissue accounts for approximately 13% of Duni’s sales.
Product and concept developmentWithin product development, Duni’s work involves new designs and color schemes, as well as new materials and solutions. Duni focuses on product and concept development, and possesses a unique strength within form, design and functionality. Duni’s innovation process is characterized by the ability to quickly and flexibly develop new collections, concepts and products which create a clear added value for the various customer categories on the market.
Duni engages in development within the market segments in which the Group enjoys a leading position. At the same time, the Group continues to develop new products and concepts for new segments.
Designs for Duni®
In order to strengthen the Duni brand as an innovative player, 2013 saw the creation of “Designs for Duni®”, a unique concept whereby Duni develops products in cooperation with well-known European designers and design houses. The concept positions Duni as the leading design partner at the retailers. It creates an opportunity for higher margin contracts, while at the same time strengthening drawing power and a higher degree of innovation in the product range. Among other things, a successful launching with the design house Melli Mello was carried out in Germany in 2013.
Amuse-bouche is another premium product, with the bit-portion sized holders for finger food being frequently used in catering and at events. Duniform® – a comprehensive solution comprising sealing equipment, trays and sealing film – is yet another interesting concept. Increased focus will be placed on both of these product concepts going forward.
Continuous innovationProducts in the Duni ecoecho™ premium range are manufactured in innovative materials with a clearly improved environmental profile compared with the standard product range. Focus is placed on aspects such as resource efficiency, renewability, composta-bility, and responsible forest management.
Examples of new, innovative products include a large range of products made from bagasse, a waste product from sugarcane manufactur-ing. 2013 saw the introduction of a series of salad bowls made of this material. A round pizza carton is yet another product made from the material; this represents double innovation, in terms of both material and design.
Duni has a number of materials that replace linen. Evolin®, an entirely new tablecovering material which combines the look and feel of textile and linen tablecoverings with the advantages of the single-use product, was launched at the end of 2011. Evolin is aimed at those restaurants and catering firms that currently use linen. The product constitutes one of the cornerstones for future growth by converting customers currently using linen. The roll-out of Evolin has continued in 2013.
Market developmentGlobal economic prospects are a main indicator as regards the state of health of the HoReCa market. Broad economic growth is positive for the HoReCa industry since it stimulates consumption within HoReCa and demand for single-use products. Most European markets continued to display sluggish GNP growth in 2013. The long-term trend continues, though, to point to more restaurant visits and an increase in the number of hotel nights spent,
primarily driven by changing consumption patterns. New restaurant concepts, as well as ready prepared food in grocery stores, take-aways and quick service restaurants, are increasing in number and these concepts are gaining ever larger market shares. After a number of years of stagnating economic growth, consumers on the mature European markets are seeking greater value and HoReCa companies are competing harder in order to gain even larger shares of total meal experiences. On the customer side we are witnessing continued structural changes within the restaurant industry, with the restaurant chains operating under a common brand growing more quickly than the market in general. This development benefits Duni’s sales of customized concepts.
Duni’s product categories in the retail sector demonstrate a low to flat rate of growth (AC Nielsen), with a major focus on cut-price products and private labels. Parts of the categories have also obtained an expanded distribution base in new channels, such as garden centers, home furnishing stores and DIY stores. On selected markets, these are also retailer categories on which Duni is increasingly focusing its sales efforts.
Prospects The HoReCa industry is greatly influenced by lifestyle changes and trends. Long-term demand is being driven primarily by greater purchasing power combined with changed habits, including an increased proportion of meals being eaten outside the home. In addition, demand for Duni’s products benefits from the fact that more restaurants are choosing to replace linen with premium quality single- use solutions. Furthermore, the trend towards increased accessibility and convenience connected with meals is continuing, and thus the take-away alternative is continuing to grow. This trend is reinforced by the increase in the number of single households and the fact that urbanization is continuing. The launch of Evolin also opens up a new, potential market for Duni among a larger part of the traditional linen market.
From a macroeconomic perspective, there is continued uncertainty as regards 2014, but a degree of growth is anticipated.
ReportingThe annual report covers the 2013 financial year. ‘Preceding year’ means the 2012 financial year. The reported operating income includes the following non-recurring items: restructuring costs and unrealized valuation effects of currency derivatives.
The restructuring costs amount to SEK -17 (-113) m. SEK 11 m of the restructuring costs for the year comprise personnel termination costs in connection with the
Duni_ÅR_13_EN.indd 37 2014-04-15 15:06

division of the Professional business area’s sales and marketing department into Table Top and Meal Service. In addition, SEK 6 m relates to efficiency improvement measures within the logistics operations. SEK 83 m of the restructuring costs in 2012 related to write downs of fixed assets and inventory relating to the plant closure in the hygiene products unit within Tissue.
For more information about restructuring costs, see Note 9.
The unrealized valuation effect of currency derivatives which is reported in the operating income amounts to SEK 0 (0) m.
The operating income is commented on in the text, exclusive of these non-recurring items.
SEK m 2013 2012
Non-recurring items
Underlying operating income 385 342
Unrealized value changes, derivative instruments 0 0
Restructuring costs -17 -113
Reported operating income 369 229
SalesDuni’s net sales amounted to SEK 3,803 (3,669) m, an increase in sales of 3.7% At unchanged exchange rates from the preceding year, net sales were SEK 173 m higher than the outcome for 2012, equal to an increase in sales of 4.7%. At fixed exchange rates, organic growth was 3.3%.
Sales within the Professional business area increased by 0.7% in 2013, equal to 1.8% at fixed exchange rates. The catering, fast food and take-away segment experienced positive growth. The sales growth is primarily attributable to the acquisition of Song Seng in Singapore.
Sales within the Consumer business area increased by 9.4%. At fixed exchange rates, this corresponds to an increase of 11.1%. The strong sales for the year were influenced by the positive effects from new contracts gained in 2012 and 2013.
Sales within the Tissue business area increased by 14.2%. The higher sales are a temporary consequence of the decision to close down the hygiene products business. Closure of the unit was scheduled for April 2014, but during the fourth quarter of 2013 Duni announced that the closure would be postponed until the first quarter of 2015.
IncomeUnderlying operating income amounted to SEK 385 (342) m. At unchanged exchange rates from the preceding year, operating income for the year would be SEK 6 m higher. The operating margin strengthened from 9.3 % to 10.1%. All business areas reported an improvement in income compared with the preceding year. Although growth within Professional was slow, Consumer contributed to improved capacity utilization.Financial items amounted to SEK -19 (-25) m. Income before tax was SEK 350 (204) m.
A tax expense of SEK 83 (79) m is reported for the year. The effective tax rate is 23.7% (38.9%). The tax expense in the previous year was negatively affected by a write down SEK 30 m in the deferred tax asset, which is a consequenceof the Swedish corporate income tax rate being reduced from 26.3% to 22%, as of January 1, 2013.
During the year, the deferred tax asset relating to loss carryforwards was reduced by SEK 40 (12) m.
Net income for the year was SEK 267 (126) m.
InvestmentsThe Group’s net investments amounted to SEK 82 (113) m. Depreciation and amortization amounted to SEK 117 (112) m. Following a number of years characterized by launchings of new materials as well as environment improvement investments, 2013 has seen a lower level of investments. Investments made related primarily to the Group’s production plants in Poland, Germany and Sweden.
Cash flow and financial positionThe Group’s operating cash flow was SEK 463 (429) m. Duni’s strong cash flow is a result of improved earnings as well as sound control over accounts receivable and accounts payable. During the autumn, Duni experienced certain delivery problems in connection with the implementation of a new stock management system. These disruptions in delivery had only a marginal impact on the Group’s working capital.
The Group’s total assets as per December 31 amounted to SEK 3,695 (3,531) m.
The Group’s interest-bearing net debt was SEK 491 m. The interest-bearing net debt on December 31, 2012 was SEK 638 m.
Operating and financial risksDuni is exposed to a number of operational risks which it is important to manage.
The development of attractive product ranges, particularly the Christmas collection, is very important in order for Duni to achieve satisfactory sales and income growth. Duni addresses this issue by constantly developing its range. Approximately 25% of the collection is replaced each year in response to, and to create, new trends.
A weaker economic climate over an extended period of time in Europe could lead to a reduction in the number of restaurant visits, reduced consumption and increased price competition, which can impact on volumes and gross margins.
Duni’s finance management and its handling of financial risks are regulated by a finance policy adopted by the Board of Directors. This work is presided over and managed by the Group’s Treasury, which is included as a unit within the Parent Company. The Group divides the financial risks into market risks, consisting of currency risks, price risks and interest rate risks, as well as credit risks and liquidity risks. These risks are controlled in an overall risk
management policy which focuses on unforeseeability on the financial markets and endeavors to minimize potential adverse effects on the Group’s financial results. See also Note 3 regarding risk management.
Legal disputesUpon closing of the accounts, there were a few disputes with customers and suppliers involving small amounts. Provisions have been made in the annual accounts which, in the management’s opinion, cover any negative outcome of these disputes. See also Note 35, Pledged assets and contingent liabilities.
EnvironmentIn accordance with an adopted environmental strategy, Duni works according to policies and goals covering development and information concerning products, efficiency and controlled production, as well as knowledge and commu-nication from an environmental perspective.
Environmental and quality systems in accordance with ISO 14001 and ISO 9001 have been implemented and certified at all of the Group’s production units. Suppliers are evaluated in accordance with the Group’s Code of Conduct, which covers both environmental and social responsibility.
Duni has also been granted FSC (Forest Stewardship Council) certification regarding the sale, production and distribution of, among other products, napkins, table covers and serving products. This means that Duni’s cellulose products are sourced from sustainable forests.
Rexcell Tissue & Airlaid AB conducts two operations which are subject to permit requirements pursuant to the Swedish Environ-mental Code. The Group holds permits for the production of 65,000 tonnes of wet laid tissue per year and 52,000 tonnes of airlaid tissue per year at the mill in Skåpafors and 10,000 tonnes of airlaid tissue in Dals Långed. The mills hold permits issued by the Administrative Board in Västra Götaland County regarding emissions of carbon dioxide, CO2. The allocation of emission rights comprises 2,318 tonnes for Dals Långed in 2013 and 19,840 tonnes for Skåpafors in 2013. The total number of emission rights will decline each year up to 2020, when Dals Långed will be granted emission rights equivalent to 2,027 tonnes per year and Skåpafors 17,349 tonnes per year.
The Board’s workUntil August 2013, the Board comprised five members. Alex Myers was elected as a new director at the annual general meeting held on May 2, 2013. He replaced Thomas Gustafsson, who became Duni’s President and CEO in December 2012. On September 1, Tina Andersson was recruited as Duni’s Corporate Marketing and Communications Director. Tina resigned from Duni’s Board at her own request, following which the Board comprises four members until the 2014 annual general meeting. During the year, the Board held ten meetings at which minutes were taken. For
Duni_ÅR_13_EN.indd 38 2014-04-15 15:06

3938
Allocation of earnings, Parent Company (SEK)Unrestricted equity in the Parent Company
Retained earnings 1 729 693 297
Income for the year 138 344 424
Total unrestricted equity in the Parent Company 1 868 037 721
The Board and CEO propose: A dividend to the shareholders of SEK 4.00 per share 187 996 128
and that the remaining amount be carried forward 1 680 041 593
Total 1 868 037 721
further information regarding the work of the Board, see the Corporate Governance Report.
EmployeesGood working conditions, clear goals and structures combined with regular support to employees constitute the foundations for creating growth and profit. Human Resources (HR) has the task of supporting management, supervisors and employees in order to stimulate employee development, increase involvement, and drive and coordinate work regarding change. HR also assists in the work of ensuring a sound work environment for all employees.
Duni operates based on four core values which provide guidance in the day-to-day work and clarify how things are done “the Duni way”. The core values – Ownership, Added value, Open mind, and Will to win – find concrete expression in a number of operational principles which, taken together, are aimed at creating profitable growth, organizational efficiency, and increased customer satisfaction.
On December 31, 2013, there were 1,902 employees. On December 31, 2012, there were 1,875 employees.
Remuneration for the CEO and senior executives Principles regarding the CEO and senior execu-tives, as proposed to the 2014 annual general meeting, to be applicable in 2014, correspond in all essential respects to the established principles which were adopted by the 2013 annual general meeting. For information regarding remuneration to the CEO and senior executives and relevant guidelines, see the Corporate Governance Report and Note 13.
Foreign companies and branchesDuni conducts operations under its own management and has employees in 17 European countries and in Singapore.
Important events since December 31, 2013No important events have occurred since December 31, 2013.
Directors’ report – the Parent CompanySales, income and financial position The Parent Company, Duni AB, is responsible for the Group’s sales and customer support on the Nordic market. The Parent Company also contains Group management and joint Group staff functions such as finance, personnel, purchasing, communication, marketing and IT. Parts of the Group’s development resources are located in the Parent Company.
Net sales amounted to SEK 1,113 (1,056) m. Operating income was reported at SEK -86 (-135) m, and net financial items at SEK 262 (245) m. The net financial items include internal dividends received during the year of SEK 109 (153) m and a received group
contribution of SEK 146 (84) m. Net income for the year was SEK 138 (63) m.
The Parent Company’s investments in fixed assets amounted to SEK 9 (14) m.
The Parent Company’s equity ratio at year- end was 65.4% (64.7%). The Parent Company’s cash and equivalents on December 31, 2013 amounted to SEK 164 (130) m.
Operational and financial risks in the Parent CompanyThe Parent Company’s risks correspond in all essential respects to the Group’s risks.
Duni’s finance management and its management of financial risks are regulated by a finance policy adopted by the Board of Directors. This work is presided over and managed by the Group’s Treasury, which is included as a unit within the Parent Company. The Group shares in the financial risks in market risks, comprising currency risk, price risk and interest rate risk, as well as credit risk and liquidity risk.
Ownership and shareOwnership structure on December 31, 2013 Duni is listed on NASDAQ OMX in Stockholm under the ticker name “DUNI”. The largest owners on December 31, 2013 were Mellby Gård Investerings AB (29.99%), Carnegie fonder (9.5%) and Polaris Capital Management, LLC (8.19%).
Duni’s shareDuni’s share capital consists of 46,999,032 outstanding common shares, each carrying 1 vote per share. The quotient value of the shares is SEK 1.25. Duni holds no shares in treasury.
There shall be no fewer than 32,008,000 and no more than 128,032,000 shares. There are no outstanding warrants or convertible debentures. Senior executives together own 0.2% of the shares in Duni as per December 31, 2013.
Further information concerning Duni’s share and owners is provided in the Corporate Governance Report.
Allocation of earnings proposed by the Board of Directors and CEOThe Board of Directors proposes to the 2014 Annual General Meeting that a resolution be adopted regarding allocation of earnings
entailing that a dividend of SEK 4.00 per share, equal in total to SEK 187,996,128, be paid to shareholders registered on the record date, May 9, 2014, and that the remaining unrestricted shareholders’ equity be carried forward.
Provided that the 2014 Annual General Meeting resolves in accordance with the Board’s dividend proposal, SEK 1,680 m will be carried forward. After the proposed dividend, there will be full coverage for the Parent Company’s restricted equity. The Group’s shareholders’ equity amounts to SEK 2,099 m.
As a basis for its dividend proposal, pursuant to Chapter 18, section 4 of the Swedish Companies Act (2005:551) the Board has made the assessment that the proposed dividend is defendable in light of the demands imposed by the business as regards the size of the share- holders’ equity in the Parent Company and the Group, as well as the needs of the Parent Company and the Group to strengthen the balance sheet, and as regards their liquidity and financial position in general. The proposed dividend represents in total 6.3% of the share- holder’s equity of the Parent Company and 9.0% of the shareholders’ equity on the Group. The Group generates strong cash flows, and the Board makes the assessment that Duni has a strong balance sheet. After the dividend, the equity ratio of the Parent Company and the Group will be 65.4% and 56.8% respectively. Thus, even after the dividend the equity ratio and liquidity will be satisfactory relative to the industry in which the Company and the Group operate, and it is believed that the Company and the Group will be able to perform their obligations in the short term and long term, and be able to implement planned investments.
The proposed dividend will not affect the ability of the Parent Company and the Group to discharge their payment obligations. The Board considers that the Parent Company and the Group are well prepared to manage changes in liquidity and any contingencies. The Board believes that the Parent Company and the Group possess the conditions to take future commercial risks and also carry any losses. Based on Duni’s income after tax, the proposed dividend is well in line with the Group’s dividend policy.
Had financial instruments been valued at fair value pursuant to Chapter 4, section 14 of the Annual Accounts Act, instead of being valued at the lower of cost or market, shareholders’ equity would have been SEK 2.4 m lower.
DIRECTORS’ REPORT
Duni_ÅR_13_EN.indd 39 2014-04-15 15:06

Duni AB is a Swedish limited public company which has been listed on NASDAQ OMX in Stockholm since November 14, 2007. Governance of Duni takes place through General Meetings, the Board of Directors and the CEO, as well as Duni’s group management, in accordance with, among other things, the Swedish Companies Act, the Company’s Articles of Association and rules of procedure for the Board of Directors and the CEO. Representatives from Duni’s group management also serve as directors on the boards of subsidiaries.
Duni has undertaken to NASDAQ OMX Stockholm to apply the Swedish Corporate Governance Code (the ”Code”), which is applied by all Swedish companies whose shares are admitted to trading on a regulated market in Sweden. Duni applies the Code in full. During the period December 1, 2012 up to the annual general meeting in May 2013, Duni applied the Code subject to one exception, namely that the Remuneration Committee comprised two board members instead of three.
Articles of association The current articles of association were adopted at the Annual General Meeting held on May 6, 2009. They provide, among other things, that the registered office shall be in Malmö, that members of the Board of Directors shall be elected each year for a term of office until the close of the next Annual General Meeting, and that each share shall carry one vote. The complete articles of association are available on Duni’s website, www.duni.com.
General meetings At the General Meeting, the shareholders decide upon key issues. Among other things, the General Meeting adopts the income statements and balance sheets, resolves upon allocation of the Company’s earnings, discharge from liability for the directors and the CEO, election of the Board of Directors and auditors, as well as remunera-tion to the Board of Directors and auditors.
Pursuant to the Swedish Companies Act, notice to attend Duni’s Annual General Meeting must be given not earlier than six weeks and not later than four weeks prior to the meeting. Notice shall be given through an announcement in Post and Inrikes Tidningar (The Official Gazette) and on Duni’s website. The fact that notice has been given shall be announced in Svenska Dagbladet and in Sydsvenska Dagbladet. In order to participate at the Annual General Meeting, a shareholder must notify the Company not later than the date stated in the notice.
2013 Annual General Meetings Duni’s 2013 Annual General Meeting was held on Thursday, May 2, 2013 in Malmö. 113 share- holders, representing approximately 51.6% of the voting rights, were present at the General
Meeting in person or through proxies. The Chairman of the Board, Anders Bülow, was elected to chair the meeting. All directors were present, as were members of group manage-ment and the auditor. The minutes from the meeting are available on Duni’s website, www.duni.com. All resolutions were adopted in accordance with the Nomination Commit-tee’s proposals. Some of the resolutions adopted at the General Meeting were:
– a dividend of SEK 3.50 per share for the 2012 financial year;
– that the Board shall comprise five directors without alternates;
– re-election of the directors Anders Bülow, Pia Rudengren, Magnus Yngen and Tina Andersson;
– Thomas Gustafsson declined re-election and Alex Myers was elected as a new director;
– that Anders Bülow be re-elected as Chairman of the Board;
– that PwC be re-elected as auditors;– that fees be paid to the Chairman of the Board
in the amount of SEK 500,000 and to other directors in the amount of SEK 265,000 each;
– that compensation be paid to the chairman of the Audit Committee in the amount of SEK 107,000 and to the chairman of the Remuneration Committee in the amount of SEK 55,000;
– that compensation be paid to other members of the Audit Committee in the amount of SEK 50,000 each, and to the other members of the Remuneration Committee in the amount of SEK 25,000 each;
– that all Board fees, including compensation for committee work, are unchanged from the preceding year;
– adoption of the Board’s proposals for guide- lines for compensation to senior executives;
– procedures regarding the composition and work of the Nomination Committee;
– that the Board be authorized, on one or more occasions until the next annual general meeting, to decide upon an increase in the Company’s share capital not exceeding SEK 5,800,000, through the issuance of not more than 4,640,000 shares.
2014 Annual General MeetingThe next Annual General Meeting of the share- holders of Duni will be held at 3pm on Tuesday, May 6, 2014 at Skånes Dansteater, Östra Varvs- gatan 13A in Malmö. More information about the Annual General Meeting, notice of partici-pation, etc. is available on Duni’s website.
Nomination CommitteeThe Nomination Committee nominates the persons to be proposed at the Annual General Meeting for election to Duni’s Board. Proposals are also produced regarding auditor fees, Board fees for the Chairman of the Board and other
directors, as well as compensation for committee work. All proposals are presented at the Annual General Meeting as well as in the notice to attend and on the website prior to the Annual General Meeting. The Nomination Committee shall be comprised of representatives of Duni’s three largest shareholders as per September 30. Board Chairman Anders Bülow convened the Nomination Committee in October 2013 and the composition was presented on November 5, 2013.
During the period pending the 2014 Annual General Meeting, the Nomination Committee held two meetings at which minutes were taken. The work of the Nomination Committee begins by reviewing the independent evaluation of the current Board, which is carried out each year. Pending the coming Annual General Meeting, there is a vacant seat on Duni’s board since Tina Andersson resigned at her own request on September 1, 2013 upon taking up the position of Duni’s Corporate Marketing and Communications Director. The work of the Nomination Committee has thus focused on identifying a suitable replacement for Tina. The ambition of the Board of Directors and also the Nomination Committee has been to find a person possessing international marketing experience within the HoReCa industry or fast-moving consumer goods.
The Nomination Committee comprises the following members:
Name Represents
Ownership stake,
Dec. 31, 2013
Anders Bülow Chairman of the Board
Rune Andersson (chairman)
Mellby Gård Investerings AB 29.99 %
Hans Hedlund Carnegie fonder 9.50 %
Bernard R. Horn Jr
Polaris Capital Management, LLC 8.19 %
Total 47.68 %
The Board of DirectorsDuni’s Board decides on the Company’s business focus, strategy, business plans, resources and capital structure, organization, acquisitions, major investments, divestments, the annual report and interim reports, and other over- arching issues of a strategic nature. The Board also appoints the CEO, who is responsible for the day-to-day management in accordance with the Board’s instructions.
The directors The directors are elected each year by the Annual General Meeting for a term of office until the close of the next annual general meeting. Pursuant to the Articles of Association, the Board shall comprise no fewer than three and no more than twelve directors, as well as employee representatives. Since the Annual General Meeting held on May 2, 2013, the Board
Corporate governance report for Duni AB (publ)
Duni_ÅR_13_EN.indd 40 2014-04-15 15:06

4140
CORPORATE GOVERNANCE REPORT
comprises five directors and two employee representatives. However, as from September 1, 2013 there has been a vacant seat on the Board since director Tina Andersson resigned at her own request. Duni’s CEO is not a member of the Board but usually participates at board meetings to present matters, as does the CFO.
The Board’s work At the first ordinary board meeting which is held after the Annual General Meeting, Duni’s Board adopts written instructions which describe the Board’s rules of procedure. The adopted rules of procedure state how the work is to be allocated between the Board’s members, and how often the Board shall meet. In addition, the rules of procedure regulate the Board’s obligations, quorum, instructions to the CEO, the allocation of responsibility between the Board and the CEO, etc. The Board has also established two committees from among its members: the Audit Committee and the Remuneration Committee.
The Board meets in accordance with a predetermined yearly plan, and additional meetings are arranged as needed. During 2013, the Board held ten meetings at which minutes were taken.
The following items, among others, were on the agenda in 2013:
– Annual accounts, including report from the auditors, proposed allocation of earnings,
and Year-End report;– Annual report and preparations pending
the Annual General Meeting;– Follow up of the audit performed with main
responsible auditor;– Interim reports;– Rules of procedure for the Board and the CEO;– Annual review of the policy manual;– Review of business plans;– Strategic issues and risks;– Organizational changes;– Cost efficiency program;– Establishment and platform in Southeast Asia– Acquisition of the assets of Song Seng
Associates Pte Ltd– Regular forecasts for 2014 – Strategies concerning the hygiene products
business; – Growth issues and acquisition issues; – The economic climate and economic
conditions.
In addition to the board meetings, the Chairman of the Board and the CEO hold regular discussions concerning the management of the Company.
The CEO, Thomas Gustafsson, is responsible for implementation of the business plan as well as the regular management of the Company’s affairs, and also the day-to-day operations in the Company.
The Board receives monthly written information in the form of a monthly report containing monitoring of the Company’s sales,
operating income and working capital trend, as well as comments on how the various markets are developing. Prior to board meetings, the Board also reviews the balance sheet and cash flow.
The main owners, the directors and the CEO also conduct each year a detailed evaluation of the Board of Directors based on the adopted rules of procedure. The evaluation covers, among other things, the composition of the Board, individual directors, as well as the Board’s work and routines.
The ”Code” contains rules regarding the independence of the directors and imposes the requirement that a majority of the directors must be independent of the Company and company management.
At least two of the directors who are independent of the Company and company management must also be independent in relation to all shareholders who control ten percent or more of the share capital or voting capital of Duni AB. Not more than one member of company management may be a member of the Board.
Remuneration Committee The Remuneration Committee prepares issues concerning remuneration and other benefits for corporate management, while decisions thereon are taken by Duni’s Board of Directors. Compensation and benefits for corporate management are evaluated through comparisons with market data provided by external sources. Such data demonstrates that Duni has competitive compensation levels and that the total compen-sation package is reasonable and not excessively high. Once a year, the Remuneration Committee evaluates the performance of senior executives and also certain second-tier managers in accordance with a systematic procedure.
The Remuneration Committee held three meetings in 2013. At the initial meeting held following the annual general meeting on May 2, 2013 , the Remuneration Committee was once again at full strength and comprised three members: Magnus Yngen (Chairman), Anders Bülow and Alex Myers. Between December 2012 and the annual general meeting in May 2013, the Remuneration Committee comprised two members. When Thomas Gustafsson became Duni’s CEO on December 1, 2012, he relinquished his position on the Remuneration Committee since he could no longer be deemed independent in relation to the Company. However, just as his predecessor, Fredrik von Oelreich, he participates at meetings of the Remuneration Committee, except when questions concerning remuneration to the CEO are addressed. The HR Director serves as secretary at meetings of the Remuneration Committee.
Audit CommitteeDuni’s Audit Committee is responsible for ensuring the quality of the Company’s financial and business reporting. The Committee also evaluates Duni’s internal control processes and management of financial and operating risks. The Committee meets regularly with the Company’s auditors in order to obtain informa-tion regarding the focus and scope of the external audit and to evaluate the work of the external auditors. The evaluation also covers the scope
Board attendance, 2013
Function Independent 1)
Board meetings
Audit Committee
Remuneration Committee
Anders Bülow Chairman 2) 10 of 10 4 of 4 3 of 3
Tina Andersson Director x 8 of 8 2 of 2 –
Thomas Gustafsson Director, CEO 3) 4) 6 of 6 – –
Alex Myers Director x 3 of 4 1 of 2 0 of 2
Pia Rudengren Director x 10 of 10 4 of 4 –
Magnus Yngen Director x 10 of 10 – 3 of 3
Per-Åke Halvordsson Employee
representative 3) 10 of 10 – –
Henry OlsenEmployee
representative 3) 10 of 10 – –
Åsa LundqvistEmployee
representative 3) 6 of 10 – –
Inge Larsson Employee
representative 3) 10 of 10 – –
1) As defi ned in the Swedish Corporate Governance Code.2) Not independent (in relation to Duni’s major shareholders).3) Not independent (in relation to Duni).4) Thomas Gustafsson was not independent in relation to Duni’s major shareholders up to and including
November 2012. He resigned his directorship at the 2013 Annual General Meeting.
Corporate governance
Nomination Committee General Meeting External Auditor
Remuneration Committee Board of Directors Audit Committee
CEO Staff functions
24 Subsidiaries
Duni_ÅR_13_EN.indd 41 2014-04-15 15:06

of any non-audit-related work performed by the auditors on behalf of Duni. When preparing a proposal regarding the election of auditors and compensation for audit work, the Nomination Committee is assisted by the Audit Committee.
The Audit Committee held four meetings in 2013 and comprises three members: Pia Rudengren (Chairman), Anders Bülow and Tina Andersson (who resigned in September 2013 and was subsequently replaced by Alex Myers). The CFO and the Group Accounting Manager, as well as the auditors, participate at all meetings.
Remuneration to the Board of DirectorsFees and other remuneration to the Board, including the Chairman of the Board, are decided upon by the Annual General Meeting. In accordance with a resolution adopted by the Annual General Meeting on May 2, 2013, the annual fee was set at a total of SEK 1.6 m, of which SEK 0.5 m is payable to the Chairman of the Board. In addition, a resolution was adopted regarding fees for committee work totaling SEK 0.3 m.
The allocation of the remuneration among the members of the Board is shown in the table below.
CEO Duni’s CEO is Thomas Gustafsson (1965), Diploma in Business Administration. The Board has adopted instructions regarding the work and role of the CEO. The CEO is responsible for the day-to-day management of the Company’s operations in accordance with guidelines issued by the Board of Directors.
On December 31, 2013 Thomas Gustafsson held 26,400 shares in Duni AB. No party closely related to the CEO has any significant share-holding in Duni AB. Thomas Gustafsson has no ownership interests in companies with which Duni has significant commercial relations. Further information regarding the CEO is provided in Note 13 in the Annual Report.
Group management Thomas Gustafsson presides over the work of group management and adopts decisions in consultation with other members of group management, consisting of the heads of business areas and heads of staff functions.
As part of the market-oriented organization which entered into force commencing April 2012, during 2013 the Professional business area’s sales and marketing departments were divided into two parts – one focusing on the Table Top market segment and one working the Meal Service market segment. This is leading to an increased degree of specialization and greater focus on prioritized customer segments, thereby creating conditions for more efficient resource utilization.
Group management comprises nine persons. Group management held ten meetings in 2013. The year’s meetings focused on organizational structure, growth and how to create customer focus. At each meeting the following items, among others, are on the agenda: financial review, update from each area, issues of an operational, strategic or market nature of importance for Duni, as well as investments and follow-up of investments. Other matters
addressed include the business plan, strategic issues and strategic plan, as well as budget for the coming year. Group management also addresses issues concerning the Group as a whole, as well as concerning individual business areas. Members of group management conduct regular visits to subsidiaries, and at least one such visit is carried out jointly. In 2013, a group management meeting was held in Hamburg in connection with a joint study visit at a trade fair for the HoReCa industry.
Compensation to senior executivesRemuneration to the CEO and other members of group management is in accordance with guidelines regarding remuneration to senior executives adopted by the Annual General Meeting on May 2, 2013 and which apply until the next Annual General Meeting. The guidelines proposed to the 2014 Annual General Meeting are in all essential respects equivalent to the guidelines which applied in 2013. Remuneration shall be on market terms and comprise fixed and variable salary, other benefits as well as pension. The variable salary may never exceed the fixed salary.
The table below shows the total gross remuneration paid to group management, including basic salaries, variable remuneration, pension payments and other benefits. Thomas Gustafsson receives an annual gross salary of SEK 3,538,000 and has a possibility to achieve a bonus not exceeding 55% of his annual basic salary, based on predetermined targets for the Group. In addition, he is entitled to certain other employment benefits such as a company car. Both Duni and Gustafsson may terminate the agreement upon six months’ written notice. In addition, except in the event of termination by the Company due to negligence, Gustafsson is entitled to an amount equal to twelve times his monthly salary. Thomas Gustafsson participates in a contribution-based pension scheme to which Duni makes an annual contribution equal to 35% of his annual gross salary and a three-year average of bonus payments, until termination of the agreement. Thomas Gustafsson’s retirement age is 65.
Duni has not granted any loans, extended or issued any guarantees or provided any security to the benefit of Duni’s directors, senior executives or auditors. None of the directors, senior executives or auditors has entered into transactions with Duni, whether directly or indirectly through any affiliated company.
AuditAt the Annual General Meeting held on May 2, 2013, PricewaterhouseCoopers AB was elected auditor, with Eva Carlsvi as auditor-in-charge. The auditors review the annual accounts and the Annual Report as well as the Company’s ongoing operations and
Board remuneration for the period May 2013 – April 2014
SEK Board meetings Audit CommitteeRemuneration
Committee TotalAnders Bülow 500 000 50 000 25 000 575 000
Tina Andersson* 88 333 16 667 – 105 000
Alex Myers 265 000 33 333 25 000 323 333
Pia Rudengren 265 000 107 000 – 372 000
Magnus Yngen 265 000 – 55 000 320 000
Total 1 383 333 207 000 105 000 1 695 333
* Tina Andersson resigned on September 1, 2013 and her seat is vacant pending the 2014 Annual General Meeting.
Total gross remuneration paid to group management, including basic salaries, variable remuneration, pension payments and other benefits.
2013, SEK m Basic salaryVariable
remuneration Other benefi ts Pension costSeverance
compensation Total
CEO – Thomas Gustafsson 3.5 1.9 0.0 1.2 – 6.6
Other senior executives 10.7 4.6 0.5 2.5 – 18.3
14.2 6.5 0.5 3.7 0.0 24.9
Group management 2013
CEO
Corporate Marketing & Communications CFO
Commercial Development Business Development & New markets
Business AreaConsumer
Business Area Tissue
Production & Supply Chain
Table Top Meal Service
Business Area Professional
Duni_ÅR_13_EN.indd 42 2014-04-15 15:06
4342
CORPORATE GOVERNANCE REPORT
Compensation to accounting firm
Group Parent Company
SEK m 2013 2012 2013 2012
Compensation for audit engagement 4.1 3.7 1.9 1.7
Compensation for auditing work other than audit engagement 0.2 0.4 0.1 0.3
Compensation for tax consultation 0.9 2.2 0.2 0.3
Compensation for other consultations 1.5 1.4 1.0 1.1
Total compensation, accounting firm 6.7 7.7 3.2 3.4
routines in order to express an opinion regarding the accounts and management by the Board of Directors and the CEO. The audit of the annual accounts and Annual Report is conducted in January-February. Thereafter, compliance with the Annual General Meeting’s guidelines regarding remuneration for senior executives is audited. The auditors participate at all meetings of the Audit Committee during the year. In October, an interim audit is carried out in combination with a general review of Duni’s report for the third quarter. Other than Duni, Eva Carlsvi has no engagements in companies over which Duni’s major owners, directors or the CEO
The Board’s description of the internal control with respect to the financial reporting for the 2013 financial yearPursuant to the Swedish Companies Act and the Swedish Corporate Governance Code, the Board of Directors is responsible for the internal control. This entails, among other things, monitoring Duni’s financial reporting and efficiency in the Company’s internal control and risk assessment.
Internal control as regards financial reporting is aimed at providing reasonable certainty regarding the reliability of the external financial reporting in the form of annual reports and interim reports published by Duni each year, and to ensure that the financial reporting is prepared in accordance with law, applicable accounting principles, and other requirements imposed on listed companies.
Duni describes the internal control system with respect to financial reporting based on the areas that constitute the basis for internal control in accordance with the framework issued by COSO, “Internal Control – Integrated Frame- work”, namely the following areas: control environment, risk assessment, control activities, information and communication, as well as follow-up.
Control environmentThe rules of procedure of the Board and the instructions issued by the Board regarding the work of the CEO and board committees clearly define the allocation of responsibilities and powers, with the aim of ensuring efficient management of risks in the business operations. Duni has established an Audit Committee to review the instructions and routines used in the financial reporting process, as well as accounting principles and changes therein. Group management reports each month to the Board in accordance with established routines. Internal control instruments for the financial reporting consist primarily of finance policy, communications policy, and the Group’s finance handbook, which defines accounting and reporting rules.
Furthermore, in a business ethics policy which is reviewed each year by the Board, group management has formulated its view on how the operations are to be conducted. During the year, the business ethics policy was reviewed and updated to ensure compliance with the
new anti-corruption legislation introduced in Europe. Presentations and training courses were also held on the subject for almost 100 senior Duni executives.
Risk assessment and control structureMaterial risks for the operations are analyzed by the Board as a part of the financial reporting. In addition, group management provides the Audit Committee with an overall risk analysis of income statements and balance sheets, as well as the factors which impact on them. Risk areas are documented and assessed based on likelihood and impact. Based on this, control processes are structured to ensure high quality in the financial reporting. The risk areas are evaluated by the Audit Committee at least once per year.
The organization structure together with the allocation of responsibilities and payment authorization procedure are clearly described and communicated by means of instructions and policies. The operations are organized into business areas with profit centers. The Audit Committee regularly communicates with the auditors in order to evaluate and improve the internal control. Duni has established a European accounting function which independently provides accounting services to the operations. This function complies with standardized procedures and routines. The head of the accounting function reports to the CFO.
Information and communicationInformation, both externally and internally, is governed by Duni’s communications and IR policy. A specific section addresses responsibility, routines and rules. The policy is regularly evaluated to ensure that information to the stock market is constantly of a high quality and in accordance with the stock exchange rules. Finan- cial information such as quarterly reports, annual reports and important events are published through press releases and on the Company’s website. Meetings with financial analysts are arranged regularly in connection with publication of quarterly reports. The intranet is the main source of information internally in the Company. Accounting handbooks and instructions regarding financial reporting are
available on the intranet and these are regularly updated in light of changes to IFRS and other recommendations.
Follow-upThe Board and Audit Committee review all financial reports before they are formally approved by the Board. The Audit Committee receives regular reports from the auditor regarding the internal control and monitors significant issues. The Board receives a monthly written financial report covering sales, operating income, market trend, as well as other material information regarding the operations, and a review of current financial reports constitutes a standing item on the agenda at all meetings. Group management analyses each month the financial trend within the Group’s business areas. Follow-up through comparisons with the preceding year, against budget and plans, and through evaluation of the key performance indicators, takes place generally at all levels in the organization.
Statements regarding internal audit Duni has found no need for a formal internal audit department. Duni has an accounting center in Poznan in Poland which functions as a centralized European accounting function providing accounting services to all subsidiar-ies in Europe, apart from Russia. The Russian accounts department and the accounting center in Poland have been integrated to such an extent that the accounting center is able to support and assist the Russian office on accounting issues. The accounting center operates based on standardized processes and routines, is independ-ent of the operational business, and reports directly to the CFO. This centralized and independent process for accounting and financial reporting is considered to constitute a platform for sound internal control with respect to the financial reporting. Duni’s group accounts department also performs certain internal audit work in the form of, among other things, controls at the reporting center as well as follow-ups as regards Russia and Singapore. During the year, Duni acquired a business in Singapore and great focus has been placed on under-standing and ensuring that the company complies with Duni’s accounting principles.
have a significant influence. Eva Carlsvi is an authorized public accountant and member of FAR SRS. Apart from the audit engagement,
fees to PwC for other engagements during 2013 totaled SEK 2.4 (2012: 4.0) m.
Duni_ÅR_13_EN.indd 43 2014-04-15 15:06

Duni’s Board of Directors comprises five members elected by the annual general meeting as well as two employee representatives and two alternates.
The Board of Directors is the Company’s highest decision-making body after the general meeting. The Board’s overarching duty is to decide upon the Company’s business focus, the Company’s resources and capital structure, as well as the Company’s organization and management of the Company’s affairs.
The directors are elected each year at the annual general meeting for a term of office until the close of the next annual general meeting. The Board shall comprise no fewer than three and no more than 12 ordinary members. In addition, there may be employee representatives.
Henry Olsen Born 1953
Employee representative for LO
Employee representative on the Board of Rexcell Tissue & Airlaid ABMr Olsen is employed as an operator at Airlaid TM 3 vid Rexcell Tissue & Airlaid AB
Mr Olsen has undertaken Pappers board training
Elected 2012
Shares in Duni: 0Not independent in relation to the Company
Board of Directors
Anders Bülow Born 1953
Chairman of the Board since 2009
Board Chairman: KappAhl AB, Cale Access AB and Feralco Holding AB.Director: Mellby Gård AB, Roxtec AB, Meet Your Future Group AB and Älvsbyhus AB.
Work experiencePresident, Mellby Gård Industri AB, 2002-2013President and CEO, BolidenVice president, Trelleborg AB
Mr Bülow holds a BA in Business Economics from the University of Stockholm
Elected 2008
Shares in Duni: 10,000Not independent in relation to Duni’s largest shareholders
Alex Myers Born 1963
President and CEO, Hilding Anders Group
Work experiencePresident, ArjoHuntleigh/Executive Vice President Getinge GroupSenior Vice President, Western Europe and Global Sales & Marketing as well as member of the management group of Carlsberg BreweriesVice President Marketing & Innovation and member of the management group of Pripps-Ringnes (Orkla Drinks)Several middle management positions at Unilever in Sweden and Germany
Mr Myers holds a BA in Organizational Behavior from Yale University, USA
Elected 2013
Shares in Duni: 0Independent in relation to the Company, company management, and Duni’s largest shareholders
Pia Rudengren Born 1965
Board Chairman: Social Initiative AB.
Director: KappAhl AB, Swedbank AB, Tikkurila Oyj, Valmet Oyj and WeMind Digital Psykologi AB
Work experienceFull-time executive directorVice president, W Capital Management ABCFO and member of the management group, Investor AB
Ms. Rudengren holds an MSc in Economics and Business Administration from the Stockholm School of Economic
Elected 2007
Shares in Duni: 1 200Independent in relation to the Company, company management and Duni’s major shareholders
Magnus Yngen Born 1958
President and CEO, Camfil.
Board Chairman: Sveba Dahlen ABDirector: Dometic Group and Intrum Justitia.
Work experiencePresident and CFO, DometicPresident and CFO, HusqvarnaVice president, Electrolux
Mr Yngen holds a Master of Engineering and Licentiate of Technology from the Royal Institute of Technology, Stockholm
Elected 2008
Shares in Duni: 0 Independent in relation to the Company, company management and Duni’s major shareholders
Per-Åke Halvordsson Born 1959
Employee representative for PTK
Mr Halvordsson is employed as Production Manager Airlaid at Rexcell Tissue & Airlaid AB
Mr Halvordsson has undertaken PTK board training
Elected 2005
Shares in Duni: 0 Not independent in relation to the Company
Duni_ÅR_13_EN.indd 44 2014-04-15 15:07

45BOARD OF DIRECTORS – GROUP MANAGEMENT
44
Thomas Gustafsson Born 1965
President and Chief Executive Officer of Duni since 1 December 2012.
Thomas Gustafsson’s most recent position was at Mellby Gård AB overseeing their consumer goods companies and, before that, he served as President and CEO of 2E Group AB (publ). Prior to that, he has served in senior executive positions at Spendrups Bryggeri AB, Brämhults Juice AB and Eckes Granini GmbH.
Thomas Gustafsson is a director of Smarteyes AB and was a director of Duni between 2009 and November 2012.
Thomas Gustafsson holds a Diploma in Business Administration.
Shares in Duni: 26,400
Linus Lemark Born 1977
Director Meal Service, Business Area Professional, since 14 May, 2012.
Before that, Linus Lemark was Innovation Director at The Absolut Company AB. During the years 2007-2009, Linus Lemark held the positions of Corporate Development Manager and Marketing Manager Duni Food Solutions at Duni.
Linus Lemark holds an MSc in Economics and Business Administration from the Stockholm School of Economics.
Shares in Duni: 2,000
Leendert Amersfoort Born 1958
Director Commercial Development since August 2013. Before then was Director of Sales Professional as from 2006. Has been employed at Duni since 1995.
Leendert Amersfoort holds a degree in marketing and business administration from Hoge Economische School Utrecht BA in Holland.
Shares in Duni: 22,018
Patrik Söderstjerna Born 1964
Director Business Development / New Markets since 1 April 2012.
Before that President of Rexcell Tissue & Airlaid AB since 2007.
In the years before that Mr. Söderstjerna was Chief Executive Officer of Zarlink Semiconductor AB, Advanced Printing Ascherleben GmbH and Finotech Verbund-stoffe GmbH.
Patrik Söderstjerna has an MSc in Mechanical Engineering from the Faculty of Engineering at Lund University.
Shares in Duni: 10,000
Tina Andersson Born 1969
Corporate Marketing & Communications Director at Duni with responsibility for branding, PR, Investor Relations, quality and environment since September 2013.
Tina Andersson was most recently market and innovation director at Hilding Anders and, before that, held the position of market and innovation director at Findus.
Tina Andersson is a director of Midsona AB and was a director of Duni between 2011 and August 2013.
Tina Andersson holds a Master of Science in Business and Economics from Lund University.
Shares in Duni: 0
Robert Dackeskog Born 1971
Director Business Area Consumer since August 6, 2012
Robert Dackeskog comes from the Findus group and was most previously Managing Director Denmark / Foodservice & Export Director within Findus Sweden.
Robert Dackeskog holds an MSc in Business Administration from the University of Gothenburg.
Shares in Duni: 5,000
Ulfert Rott Born 1960
Director of Production & Supply Chain since 1 April 2012 including responsibility for production within subsidiary Rexcell Tissue & Airlaid AB.
Before that Director Operations in Duni and has been employed by Duni since 2004.
Ulfert Rott has previously been Chief Executive Officer and Plant Manager of Nylstar GmbH.
Ulfert Rott holds a PhD in Mechanical Engineering and an MSc in Business Administration.
Shares in Duni: 22,018
Mats Lindroth Born 1960
Chief Financial Officer of Duni since 2009 and has been employed at Duni since 1987.
Mats Lindroth holds an MSc in Economics and Business Administration from the Stockholm School of Economics.
Shares in Duni: 24,700
Maria Wahlgren Born 1963
Director Table Top, Business Area Professional
Maria Wahlgren comes from the Amcor group and has most previously been Commercial Director for High Performance Laminates at Amcor Flexibles.
Marie Wahlgren holds a Master of Science, Chemical Engineering from the University of Lund.
Shares in Duni: 2,000
Group management
Duni_ÅR_13_EN.indd 45 2014-04-15 15:07

SEK m 2013 2012 2011 2010 2009
Net sales 3 803 3 669 3 807 3 971 4 220Costs of goods sold -2 798 -2 724 -2 776 -2 919 -3 054
Gross profit 1 005 945 1 031 1 052 1 166
Selling expenses -437 -438 -441 -434 -482
Administrative expenses -173 -176 -172 -174 -184
Research and development expenses -19 -26 -30 -25 -29
Other operating incomes 2 4 15 76 41
Other operating expenses -10 -81 -15 -58 -24
Operating income 369 229 388 436 488
Financial incomes 7 5 3 1 2
Financial expenses -26 -30 -33 -19 -45
Net financial items -19 -25 -30 -18 -43
Income after financial items 350 204 358 418 444
Income tax -83 -79 -98 -112 -108
Net income for the period, continuing operations 267 126 261 306 336 Net income for the period from discontinued operations – – – – – Net income for the period 267 126 261 306 336
Five-year summary, Consolidated Income Statements
Duni_ÅR_13_EN.indd 46 2014-04-15 15:07

SEK m 2013-12-31 2012-12-31 2011-12-31 2010-12-31 2009-12-31
ASSETS
Goodwill 1 249 1 199 1 199 1 199 1 199
Other intangible fixed assets 78 51 57 44 29
Tangible fixed assets 723 744 830 588 510
Financial fixed assets 180 219 243 289 336
Total fixed assets 2 230 2 213 2 329 2 120 2 074
Inventories 434 387 470 437 382
Accounts receivable 658 624 663 634 640
Other receivables 148 126 134 174 163
Cash and cash equivalents 225 181 85 122 230
Total current assets 1 465 1 318 1 352 1 367 1 415
TOTAL ASSETS 3 695 3 531 3 681 3 487 3 489
SHAREHOLDERS' EQUITY AND LIABILITIES
Shareholders' equity 2 099 1 985 2 082 1 991 1 789
Long-term financial liabilities 492 576 26 530 682
Other long-term liabilities 263 275 212 211 216
Total long-term liabilities 755 851 238 741 898
Accounts payable 348 301 302 315 344
Short-term financial liabilities – – 633 – –
Other short-term liabilities 493 394 426 440 458
Total short-term liabilities 841 695 1 361 755 802
TOTAL SHAREHOLDERS' EQUITY AND LIABILITIES 3 695 3 531 3 681 3 487 3 489
Key ratios in brief, Group 2013 2012 2011 2010 2009
Net sales, SEK m 3 803 3 669 3 807 3 971 4 220
Gross profit, SEK m 1 005 945 1 031 1 052 1 166
EBIT*, SEK m 385 342 404 435 436
EBITDA*, SEK m 503 454 510 537 539
Interest-bearing net debt 491 638 745 582 631
Number of employees 1 902 1 875 1 888 1 914 1 906
Gross margin* 26.4 % 25.8 % 27.1 % 26.5 % 27.6 %
EBIT margin* 10.1 % 9.3 % 10.6 % 10.9 % 10.3 %
EBITDA margin* 13.2 % 12.4 % 13.4 % 13.5 % 12.8 %
* Calculated based on underlying operating income
Five-year summary, Consolidated Balance Sheets
4746FIVE-YEAR SUMMARY, CONSOLIDATED INCOME STATEMENTS – FIVE-YEAR SUMMARY, CONSOLIDATED BALANCE SHEETS
– KEY RATIOS IN BRIEF, GROUP
Duni_ÅR_13_EN.indd 47 2014-04-15 15:07

Consolidated Income StatementSEK m Note 1–5, 12–13 2013 2012
Sales 5–6 3 803 3 669
Costs of goods sold 6–10 -2 798 -2 724
Bruttoresultat 1 005 945
Selling expenses 7–9 -437 -438
Administrative expenses 7–9, 11 -173 -176
Research and development expenses 7– 8 -19 -26
Other operating incomes 14 2 4
Other operating expenses 7–8, 15 -10 -81
Operating income 5, 16 369 229
Income from financial items 16–17
Financial incomes 7 5
Financial expenses -26 -30
Net financial items -19 -25
Income after financial items 350 204
Income tax 19 -83 -79
Net income for the year 267 126
Income attributable to: Equity holders of the Parent Company 267 126
Earnings per share (expressed in SEK per share), calculated on net income for the year attributable to equity holders of the Parent Company during the year: - Before and after dilution 20 5.68 2.67
Duni_ÅR_13_EN.indd 48 2014-04-15 15:07

Consolidated Statement of Comprehensive IncomeSEK m 2013 2012
Net Income for the year 267 126
Other comprehensive income:
Items that will not be reclassified to profit or loss:Actuarial loss on post emplyment benefit obligations 15 -26
Total 15 -26
Items that may be reclassified subsequently to profit or loss:Exchange rate differences for the year – translation of foreign subsidiaries -5 11
Cash flow hedge 1 -2
Total -4 9
Other comprehensive income for the year, net after tax: 11 -17
Sum of comprehensive income for the year 278 109
Sum of comprehensive income for the year attributable to: Equity holders of the Parent Company 278 109
4948
CONSOLIDATED INCOME STATEMENT – CONSOLIDATED STATEMENT OF COMPREHENSIVE INCOME
Duni_ÅR_13_EN.indd 49 2014-04-15 15:07

SEK m Note 2013-12-31 2012-12-31
ASSETS 1–5
Fixed assets Intangible fixed assets 21
Goodwill 1 249 1 199
Customer relations 25 –
Capitalized development expenses 48 48
Trademarks and licenses 6 3
Total intangible fixed assets 1 327 1 250
Tangible fixed assets Buildings, land and land improvements 22 191 186
Machinery and other technical equipment 23 436 470
Equipment, tools and installations 24 62 50
Construction in progress and advance payments for tangible fixed assets 25 34 38
Total tangible fixed assets 723 744
Financial fixed assets Deferred tax assets 19 178 217
Other long-term receivables 27 1 2
Total financial fixed assets 179 219
Total fixed assets 2 230 2 213
Current assets Inventories 10
Raw materials and supplies 102 98
Products in progress 5 6
Finished goods and goods for resale 323 277
Advances to suppliers 4 6
Total inventories 434 387
Current receivables Accounts receivable 28 658 624
Derivative instruments 29 5 1
Tax assets 37 21
Other receivables 28 75 68
Prepaid expenses and accrued incomes 30 32 37
Total current assets 806 750
Cash and cash equivalents 225 181
Total current assets 1 465 1 321 TOTAL ASSETS 3 695 3 531
Consolidated Balance Sheet
Duni_ÅR_13_EN.indd 50 2014-04-15 15:07

SEK m Note 2013-12-31 2012-12-31
SHAREHOLDERS’ EQUITY AND LIABILITIES 1–5
Shareholders' equity Share capital 20 59 59
Other injected capital 1 681 1 681
Reserves 61 65
Retained earnings including profit for the year 298 180
Total shareholders' equity attributable to equity holders of the Parent Company 2 099 1 985
Long-term liabilities 31
Overdraft facility 31 0 17
Bank loans 31 490 558
Financial leasing liabilities 2 –
Deferred tax liabilities 19 40 29
Pension provisions 33 223 246
Total long-term liabilities 755 851
Short-term liabilities Accounts payable 348 301
Tax liabilities 9 3
Bank loans 31 – –
Derivative instruments 29 3 3
Other liabilities 79 50
Allocation to restructuring reserve 9 21 17
Accrued expenses and deferred incomes 34 381 320
Total short-term liabilities 841 695 TOTAL SHAREHOLDERS’ EQUITY AND LIABILITIES 3 695 3 531
Pledged assets 35 – –
Contingent liabilities 35 55 58
Consolidated Balance Sheet, cont.
5150
CONSOLIDATED BALANCE SHEET
Duni_ÅR_13_EN.indd 51 2014-04-15 15:07

Attributable to equity holders of the Parent Company
SEK m Share capital Other injected
capital Other
reserves Cash flow
reserve Fair value
reserve*
Profit carried forward incl.
net income for the year Total equity
Opening balance, Jan 1, 2012 59 1 681 43 0 13 286 2 082
Change of accounting principle IAS19 – – – – – -40 -40
Adjusted opening balance, Jan 1, 2012 59 1 681 43 0 13 246 2 042Comprehensive income Net income for the year – – 11 -2 – 100 109
Total comprehensive income for the year 0 0 11 -2 0 100 109 Transactions with owners Dividends relating to 2011 – – – – – -164 -164
Total transactions with owners 0 0 0 0 0 -164 -164
Opening balance, Jan 1, 2013 59 1 681 54 -2 13 180 1 985
Comprehensive income Net income for the year – – -5 1 – 282 278
Total comprehensive income for the year 0 0 -5 1 0 282 278
Transactions with owners Dividends relating to 2012 – – – – – -164 -164
Total transactions with owners 0 0 0 0 0 -164 -164
Closing balance, Dec 31, 2013 59 1 681 49 -1 13 298 2 099
* Fair value reserve means a reappraisal of land in accordance with earlier accounting principles. The reappraised value is adopted as the acquisition value in accordance with the transition rules in IFRS 1.
Consolidated Statement of Changes in Shareholders’ Equity
Duni_ÅR_13_EN.indd 52 2014-04-15 15:07

SEK m Note 2013 2012
Cash flow from operating activities Operating income 369 229
Adjustments for items not included in cash flow 36 106 188
Interest received 7 5
Interest paid -17 -15
Paid income tax -52 -54
Cash flow from operating activities before changes in working capital 413 353
Changes in working capital Increase (-)/decrease (+) in inventories -35 66
Increase (-)/decrease (+) in accounts receivable -4 20
Increase (-)/decrease (+) in receivables 53 -21
Increase (+)/decrease (-) in accounts payable 30 7
Increase (+)/decrease (-) in current liabilities 6 4
Cash flow from operating activities 463 429
Cash flow used in investing activities Acquisition of tangible fixed assets 22–25 -76 -110
Acquisition of intangible fixed assets -7 -5
Sale of tangible fixed assets 1 1
Sale of intangible fixed assets 0 0
Acquisition of subsidiaries -57 –
Change in other long-term receivables 1 2
Cash flow from operating activities -138 -112
Cash flow used in investing activities Dividends to shareholders -164 -164
Net change, overdraft facility and other financial liabilities -28 -10
Repayment of loans -254 -180
Loans received 164 134
Cash flow used in financing activities -283 -220
Cash flow for the year 42 97Cash and cash equivalents, opening balance 181 85
Exchange rate differences, cash and cash equivalents 1 -1
Cash and cash equivalents, closing balance 225 181
Consolidated Cash Flow Statement
5352
CONSOLIDATED STATEMENT OF CHANGES IN SHAREHOLDERS’ EQUITY – CONSOLIDATED CASH FLOW STATEMENT
Duni_ÅR_13_EN.indd 53 2014-04-15 15:07

SEK m Note 1–5, 12–13 2013 2012
Sales 5–6 1 113 1 056
Costs of goods sold 6, 8–10 -980 -936
Gross profit 133 120
Selling expenses 8–9 -118 -123
Administrative expenses 8–9, 11 -122 -132
Research and development expenses 8 -8 -12
Other operating incomes 14 198 190
Other operating expenses 8, 15 -168 -178
Operating income 16 -86 -135
Income from financial items 16–17
Income from participations in Group companies 18 255 238
Other interest income and similar income 31 30
Interest expenses and similar expenses -24 -22
Net financial items 262 245
Income after financial items 176 110
Tax on income for the year 19 -37 -48
Income for the year 138 63
Parent Company, Statement of Comprehensive IncomeSEK m 2013 2012
Net income for the year 138 63
Other comprehensive income, net after taxExchange rate differences for the period - translation of foreign subsidiares* 3 0
Cash flow hedge 1 -2
Other comprehensive income for the year, net after tax 4 -2
Total comprehensive income for the year 143 61
Total comprehensive income for the year attributable to:Equity holders of the Parent Company 143 61
*Relates to a Turkish branch which has no tax effect.
Parent Company, Income Statement
Duni_ÅR_13_EN.indd 54 2014-04-15 15:07
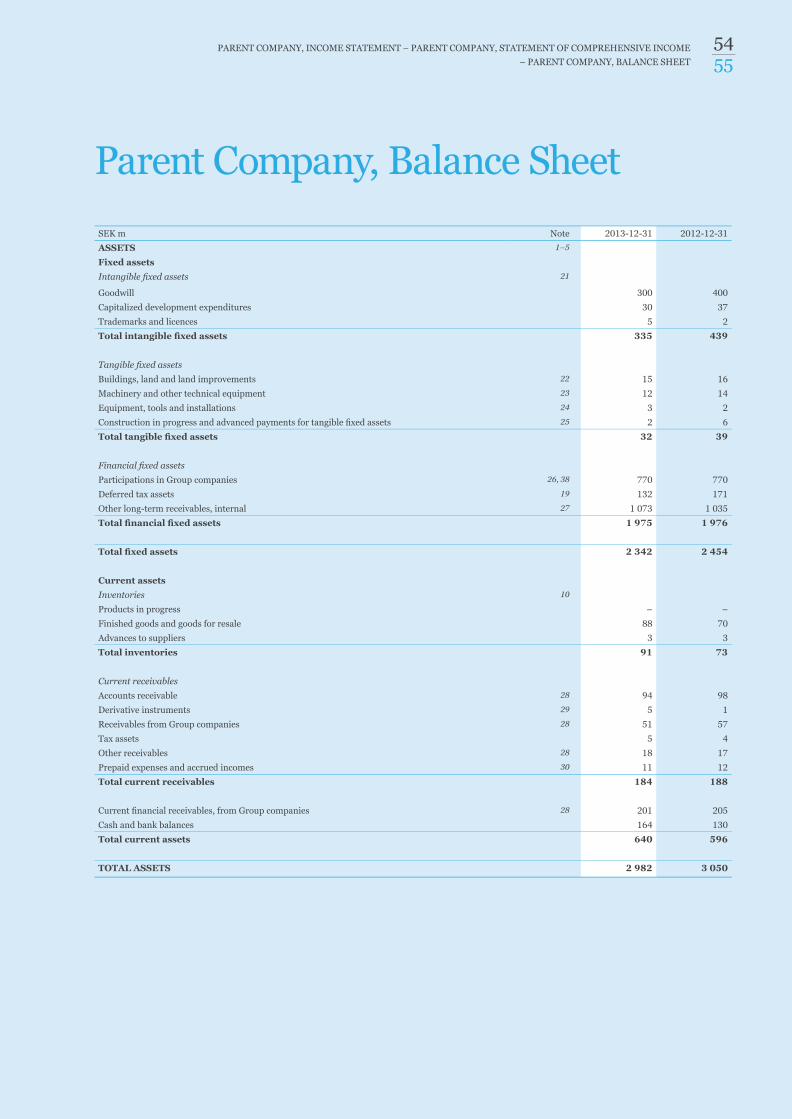
SEK m Note 2013-12-31 2012-12-31
ASSETS 1–5
Fixed assets Intangible fixed assets 21
Goodwill 300 400
Capitalized development expenditures 30 37
Trademarks and licences 5 2
Total intangible fixed assets 335 439
Tangible fixed assets Buildings, land and land improvements 22 15 16
Machinery and other technical equipment 23 12 14
Equipment, tools and installations 24 3 2
Construction in progress and advanced payments for tangible fixed assets 25 2 6
Total tangible fixed assets 32 39
Financial fixed assets Participations in Group companies 26, 38 770 770
Deferred tax assets 19 132 171
Other long-term receivables, internal 27 1 073 1 035
Total financial fixed assets 1 975 1 976 Total fixed assets 2 342 2 454
Current assets Inventories 10
Products in progress – –
Finished goods and goods for resale 88 70
Advances to suppliers 3 3
Total inventories 91 73
Current receivables Accounts receivable 28 94 98
Derivative instruments 29 5 1
Receivables from Group companies 28 51 57
Tax assets 5 4
Other receivables 28 18 17
Prepaid expenses and accrued incomes 30 11 12
Total current receivables 184 188
Current financial receivables, from Group companies 28 201 205
Cash and bank balances 164 130
Total current assets 640 596
TOTAL ASSETS 2 982 3 050
Parent Company, Balance Sheet
5554PARENT COMPANY, INCOME STATEMENT – PARENT COMPANY, STATEMENT OF COMPREHENSIVE INCOME
– PARENT COMPANY, BALANCE SHEET
Duni_ÅR_13_EN.indd 55 2014-04-15 15:07

SEK m Note 2013-12-31 2012-12-31
SHAREHOLDERS’ EQUITY, PROVISIONS AND LIABILITIES Shareholders' equity
Restricted shareholders' equity Share capital 20 59 59
Statutory reserve 11 11
Revaluation reserve 13 13
Total restricted shareholders' equity 83 83
Unrestricted shareholders' equity Retained earnings 1 729 1 827
Net income for the year 138 63
Total unrestricted shareholders' equity 1 868 1 890Total shareholders' equity 1 951 1 972
Provisions Pension provisions 33 109 112
Deferred tax liability 19 – –
Total provisions 109 112
Long-term liabilities 31
Overdraft facility 31 – 1
Bank loans 31 490 557
Total long-term liabilities 490 559
Short-term liabilities Accounts payable 52 53
Liabilities to Group companies 272 267
Bank loans 31 – –
Derivative instruments 29 3 3
Other liabilities 18 11
Allocation to restructuring reserve 9 5 6
Accrued expenses and deferred incomes 34 83 66
Total short-term liabilities 432 407
TOTAL SHAREHOLDERS’ EQUITY, PROVISIONS AND LIABILITIES 2 982 3 050
Pledged assets 35 – –
Contingent liabilities 35 52 55
Parent Company, Balance Sheet cont.
Duni_ÅR_13_EN.indd 56 2014-04-15 15:07

Parent Company, Changes in Shareholders’ Equity
SEK m Share
capital Statutory
reserve Translation
reserve Cash flow
reserve Revaluation
reserve
Unrestricted sharehol-
ders' equity
Total share-holders'
equity
Opening balance, Jan 1, 2012 59 11 3 0 13 1,992 2,076
Comprehensive income Comprehensive income for the year – – 0 -2 – 63 61
Total comprehensive income for the year 0 0 0 -2 0 63 61
Transactions with owners Dividends relating to 2011 – – – – – -164 -164
Total transactions with owners 0 0 0 0 0 -164 -164
Opening balance, Jan 1, 2013 59 11 3 -2 13 1 891 1 972
Comprehensive income Comprehensive income for the year – – 3 1 – 138 143
Total comprehensive income for the year 0 0 3 1 0 138 143
Transactions with owners Dividends relating to 2012 – – – – – -164 -164
Total transactions with owners 0 0 0 0 0 -164 -164
Closing balance, Dec 31, 2013 59 11 6 -1 13 1 865 1 951
Accumulated translation differences in the Parent Company which were reported directly against shareholders’equity were SEK 32 m (2012: SEK 29 m).
5756
PARENT COMPANY, BALANCE SHEET – PARENT COMPANY, CHANGES IN SHAREHOLDERS’ EQUITY
Duni_ÅR_13_EN.indd 57 2014-04-15 15:07

SEK m Note 2013 2012
Cash flow from operating activities Operating income -86 -135
Adjustments for items not included in cash flow 36 133 152
Interest received 31 38
Dividends received 104 153
Interest paid -24 -33
Paid income tax 0 0
Cash flow from operating activities before changes in working capital 158 175
Changes in working capital Increase (-)/decrease (+) in inventories -12 11
Increase (-)/decrease (+) in accounts receivable 11 -21
Increase (-)/decrease (+) in receivables -11 -12
Increase (+)/decrease (-) in accounts payable 11 -16
Increase (+)/decrease (-) in current liabilities 15 12
Cash flow from operating activities 172 149
Cash flow used in investing activities Acquisition of intangible fixed assets 21 -9 -8
Acquisition of tangible fixed assets 22–25 -1 -10
Sale of tangible fixed assets 0 25
Change in net lending to Group companies 106 182
Change in non-interest-bearing receivables -1 2
Change in interest-bearing receivables 1 3
Cash flow used in investing activities 96 194
Cash flow used in financing activities Dividends to shareholders -164 -164
Net change, overdraft facilities and other financial liabilities 20 -45
Repayment of loans -254 -180
Loans received 164 133
Cash flow used in financing activities -234 -256
Cash flow for the year 34 87
Cash and equivalents, opening balance 130 43
Cash and equivalents, closing balance 164 130
Parent Company, Cash Flow Statement
Duni_ÅR_13_EN.indd 58 2014-04-15 15:07

NotesNOTE 1 – GENERAL INFORMATIONDuni AB and its subsidiaries operate internationally and are leaders within attractive, quality table setting products and concepts as well as packaging for take-aways. The Group develops, manufactures and sells functional and attractive concepts and products for serving and packaging of meals. The Group enjoys a leading position thanks to a combination of high-quality, established customer relations, a well-reputed brand, and strong local presence in Europe.
The Parent Company is a registered limited company with its registered office in Malmö. The address of the head office is Box 237, 201 22 Malmö. The website is www.duni.com. Duni is listed on NASDAQ OMX in Stockholm under the ticker name ”DUNI”.
This Annual Report was approved for publication by the Board of Directors on March 20, 2014. The Annual Report may be changed by the Company’s owners after approval by the Board.
Unless otherwise specifically stated, all amounts are reported in million kronor (SEK m) and relate to the period January 1 - December 31 with respect to income statement items and cash flow items, and December 31 with respect to balance sheet items. Information in brackets relates to the preceding financial year, viz. January 1, 2012 – December 31, 2012.
NOTE 2 – SUMMARY OF IMPORTANT ACCOUNTING PRINCIPLES
This Note sets forth the most important accounting principles applied in the preparation of the annual report. Subject to the exceptions stated below, these principles have been applied consistently for all presented years.
2.1 Bases for preparation of the financial statementsThe consolidated financial statements for the Duni Group have been prepared in accordance with the Swedish Annual Reports Act, RFR 1 ”Supplementary Accounting Rules for Groups”, and International Financial Reporting Standards (IFRS) and IFRIC interpretations as adopted by the EU. The consolidated financial statements have been prepared in accordance with the purchase method, other than with respect to reappraisals of buildings and land, valuation of financial assets and liabilities (including derivative instruments) at fair value through profit or loss and financial assets and liabilities (including derivative instruments) classified as hedge instruments.
The preparation of financial statements in compliance with IFRS requires the use of a number of important estimations for accounting purposes. Furthermore, when applying the Group’s accounting principles, management must make certain assessments. The areas which involve a high degree of assessment, which are complex, or such areas in which assumptions and estimations are of material significance for the consolidated financial statements, are set forth in Note 4.
The Parent Company applies the Swedish Annual Accounts Act and RFR 2, Reporting for Legal Entities. In those cases where the Parent Company applies different accounting principles than the Group, such fact is stated separately in section 2.22, Parent Company’s accounting principles.
2.1.1 Changes in accounting principles and disclosureDuni applies the new and amended standards and interpretations from IASB and statements from IFRIC as adopted by the EU and which are mandatory commencing January 1, 2013. No standards or interpretations have been applied prematurely. Presented below are the standards that Duni applies for the first time with respect to the financial year commencing January 1, 2013, and which have had a material impact on the Group’s financial statements:
Changes have been introduced into IAS 1 ”Presentation of Financial Statements” with respect to comprehensive income. The most important change is the requirement that the items reported in ”Other comprehen-sive income” be presented divided into two groups. The division is based on whether or not the items can be reclassified to the income statement (reclassification adjustments).
The amendment to IAS 19 ”Employee Benefits” entails the removal of the corridor method and that financial expenses must be calculated based on the net surplus or net deficit in the plan. This means that previously non-reported actuarial losses are reported at the time of transition and that future actuarial gains or losses will be reported in Other comprehensive income. Opening shareholders’ equity for 2012 has been negatively affected by the changed accounting principle in the amount of SEK 39 m. The income statement has been affected in the amount of SEK + 2 m for 2012 and other comprehensive income has been affected in the amount of SEK -25 m. All amounts take into account payroll tax and are stated net following deferred tax. All comparison figures for 2012 in this annual report have been adjusted in accordance with the above-mentioned impact. In addition, the methodology for calculating the pension expense will be changed since the standard requires that the return on plan assets, which must be reported in the income statement, be established based on the discount rate applied when calculating the obligation.
The amendment to IFRS 7 ”Financial Instruments: Disclosure” concerns disclosure relating to the net reporting of assets and liabilities. The amendment contains new disclosure requirements to facilitate comparisons between entities which prepare their financial statements in accordance with IFRS and those entities which prepare their financial statements in accordance with US GAAP.
IFRS 13 ”Fair Value Measurement” is aimed at making measurement of fair value more consistent and less complex, by means of the standard containing an exact definition and a joint source in IFRS for fair value measurement and related disclosure. The standard provides guidance on the fair value measurement of all types of assets and liabilities, financial and non-financial. The requirements do not expand the scope of the area in which fair value is to be applied, but provide guidance on how it is to be applied where other IFRS already require or allow measurement at fair value.
A number of new standards and amendments of interpretations and existing standards enter into force as regards financial years beginning after January 1, 2013, and these have not been applied in conjunction with the preparation of the consolidated financial statements. None of the aforementioned is expected to have any material impact on the consolidated financial statements.
• IAS 36, ”Impairment of Assets”, regarding disclosure of the recovery value of non-financial assets
• IFRS 10, ”Consolidated Financial Statements”
• IFRS 11, ”Joint Arrangements”
• IFRS 12, ”Disclosure of Interests in Other Entities”
• IFRS 9, ”Financial instruments”
• IFRIC 21, ”Levies”
None of the other IFRS or IFRIC interpretations which have not yet entered into force are expected to have any material impact on Duni.
2.2 Consolidated reporting 2.2.1 SubsidiariesSubsidiaries are all companies (including companies for specific purposes) in which the Group is entitled to formulate financial and
5958
PARENT COMPANY, CASH FLOW STATEMENT – NOTES
Duni_ÅR_13_EN.indd 59 2014-04-15 15:07

operational strategies in a manner which normally is a concomitant of a shareholding in excess of 50% of the voting rights of shares or participating interests or where the Group, through agreements, exercises a sole controlling influence. Subsidiaries are included in the consolidated financial statements commencing the day on which the controlling influence is transferred to the Group. They are removed from the consolidated financial statements as of the day on which the controlling influence ceases.
The purchase method is used for reporting the Group’s acquisitions of subsidiaries. The purchase price for the acquisition of a subsidiary consists of fair value of transferred assets, debts and the shares issued by the Group. The purchase price also includes the fair value of all assets or liabilities which are a consequence of an agreement regarding a conditional purchase price. Acquisition-related costs are booked when incurred. Identifiable acquired assets and assumed liabilities in a business acquisition are initially valued at fair value on the acquisition date. For each acquisition, the Group determines whether all holdings without a controlling interest in the acquired company shall be reported at fair value, or proportionately to the share in the net assets of the acquired company represented by the holding.
The amount by which purchase price, any holding without controlling interest, as well as the value on the acquisition date of earlier shareholdings exceeds the fair value of the Group’s share of identifiable acquired net assets, is reported as goodwill. If the amount is less than fair value for the assets of the acquired subsidiary, in the event of a ”bargain purchase”, the difference is reported directly in the Consolidated statement of comprehensive income.
Intra-group transactions and balance sheet items, as well as unrealized profits on transactions between group companies, are eliminated. Unrealized losses are also eliminated, but any losses are regarded as an indication of possible impairment. Where appropriate, the accounting principles for subsidiaries have been changed to ensure consistent application of the Group’s principles.
2.2.2 Transactions with holders of non-controlling interestsThe Group applies the principle of reporting transactions holders of non-controlling interests as transactions with the Group’s equity holders. Upon acquisitions from holders of non-controlling interests, the difference between the purchase price paid and the actual acquired portion of the reported value of the subsidiary’s net assets is reported in shareholders’ equity. Profits or losses upon divestments to holders of non-controlling interests are also reported in shareholders’ equity. Duni has no holdings which are without a controlling interest.
2.2.3 Affiliated companiesAffiliated companies are all companies in which the Group has a significant, but not controlling, influence, which generally is the case with stakes of between 20% and 50% of the voting capital. Holdings in affiliated companies are reported in accordance with the equity method and initially valued at the acquisition value. At present, the Group has no affiliated companies.
2.3 Segment reportingOperating segments are reported in a manner which is consistent with the internal reporting provided to the highest executive decision-maker. The highest executive decision-maker is the function which is responsible for allocation of resources and assessment of the income of the operating segment. In Duni, this function has been identified as the group management which takes strategic decisions. Duni’s segment reporting covers the reporting of three business areas, based on underlying operating income following allocation of shared expenses to each business area. For a detailed description, see Note 5.
2.4 Translation of foreign currency2.4.1 Functional currency and reporting currencyItems included in the financial statements for the various units in the Group are valued in the currency which is used in the economic environment in which the relevant company primarily operates (functional currency). In the consolidated financial statements, Swedish kronor (SEK) are used; this is the Parent Company’s functional currency and reporting currency.
2.4.2 Transactions and balance sheet itemsTransactions in foreign currency are translated to the functional currency in accordance with the exchange rates applicable on the transaction date. Currency gains and losses which arise in conjunction with payments of such transactions and in conjunction with translation of monetary assets and liabilities in foreign currency at the closing day rate are reported in the income statement. Exchange rate differences on lending and borrowing are reported in the net financial items, while other exchange rate differences are included in the operating income. Exceptions apply when the transactions constitute hedging which satisfies the conditions for hedge accounting of cash flows or of net investments, since profits/losses are reported in other comprehensive income. Duni applies hedge accounting via interest rate swaps, with part of the interest rate risk being hedged at a fixed rate.
2.4.3 Group companiesThe results and financial position of all group companies (of which none has a high inflation currency as functional currency) which have a functional currency other than the reporting currency are translated to the Group’s reporting currency in accordance with the following:
a) assets and liabilities for each of the balance sheets are translated at the closing day rate;
b) income and expenses for each of the income statements are translated at the average exchange rate;
c) all exchange rate differences which arise are reported in the Consolidated statement of comprehensive income.
Upon consolidation, exchange rate differences which arise as a consequence of translation of net investments in foreign operations are transferred to the Consolidated statement of comprehensive income. Upon the full or partial divestment of a foreign business, the exchange rate differences which are reported in the Consolidated statement of comprehensive income are transferred to the income statement and reported as a part of capital gains/losses.
Goodwill and adjustments of fair value which arise upon the acquisition of a foreign business are treated as assets and liabilities of such business and translated at the closing day rate.
2.5 Cash flow statementThe cash flow statement is prepared in accordance with the indirect method. The reported cash flow covers only transactions which result in payments being received or made. Cash and cash equivalents in the cash flow statement accord with the definition of cash and cash equivalents in the balance sheet, see 2.13.
2.6 Revenue2.6.1 Revenue recognitionRevenue includes the fair value of what has been, or is to be, received for sold goods in the Group’s current operations. Revenue is reported exclusive of value added tax, returns and discounts and after elimination of intra-group sales.
Duni reports revenue when the amount thereof can be measured in a reliable manner and it is likely that future economic benefits will accrue to the Company. The amount of revenue is not deemed measurable in a reliable manner until all obligations associated with the sale have been fulfilled or have lapsed. Duni bases its assessments on historic results and thereupon takes into consideration the type of customer, type of transaction and special circumstances in each individual case.
Sales of goods are reported as revenue when a group company has delivered products to customers and when responsibility for the products has passed to the customer. The responsibility is governed by the delivery terms and conditions. The customer’s acceptance consists of delivery approval, conditions for approval having expired, or the fact that the Group has objective evidence that all criteria for approval are fulfilled. Delivery does not occur before the products have been dispatched to a designed place and the risks and possibilities associated with the products (obsolescence, result upon future sale) have passed to the customer.
Duni_ÅR_13_EN.indd 60 2014-04-15 15:07

In those cases where Duni’s products are sold with volume rebates and the customers are entitled to return defective products, the sales revenues are reported based on the price stated in the sales contract, net after estimated volume rebates and returns at the time of the sale. Accumulated experience is used to assess and make provision for rebates and returns. The assessment of volume rebates is based on expected annual purchases. No financial component is deemed to be involved since the sale takes place with an average credit period of 46 days, which is in accordance with market practice.
2.6.2 Dividend incomeDividend income is reported when the right to receive the payment has been established.
2.7 Intangible assets 2.7.1 GoodwillGoodwill comprises the amount by which the acquisition value exceeds the fair value of the Group’s share of the identifiable net assets of acquired subsidiaries at the time of acquisition. Goodwill on acquisition of subsidiaries is reported as intangible assets. Goodwill is reviewed annually to identify any impairment and reported at acquisition value less accumulated impairment. Impairment of goodwill is not reversed. Profits or losses upon the divestment of a unit include remaining reported value on the goodwill which relates to the divested unit.
Detailed information regarding Duni’s definition of cash-generat-ing units upon the allocation of goodwill is provided in Note 21.
2.7.2 Customer relations, trademarks and licensesIdentifiable acquired customer relations are reported at fair value and relate to Duni’s operations in Singapore. Depreciation takes place on a straight-line basis over an assessed useful life of 10 years.
Acquired trademarks and licenses are reported at acquisition value. Trademarks and licenses have a determinable useful life and are reported at acquisition value less accumulated amortization. Amortization takes place on a straight-line basis in order to allocate the cost for trademarks and licenses over their assessed useful life (3–10 years).
2.7.3 Research and developmentCapitalized research expenditures relate primarily to expenditures for the implementation of the SAP business system.
Research expenditures are booked when incurred.Expenditures incurred in development projects (relating to design
and testing of new or improved products) are reported as intangible assets when the following criteria are fulfilled:
(a) it is technically feasible to finish the intangible asset so that it can be used or sold;
(b) management intends to finish the intangible asset and use or sell it;
(c) conditions exist to use or sell the intangible asset;
(d) the way in which the intangible asset will generate probable future economic benefits can be demonstrated;
(e) adequate technical, financial and other resources exist to complete the development and to use or sell the intangible asset; and
(f) the expenditures which relate to the intangible asset during its development can be calculated in a reliable manner.
Other development expenditures which do not fulfill these conditions are reported as expenses when incurred. Development expenditures previously reported as an expense are not reported as an asset in a subsequent period. Capitalized development expenditures are reported as intangible assets and amortization takes place from the time when the asset is finished for use, on a straight-line basis over the assessed useful life (3-10) years.
2.8 Tangible fixed assetsBuildings and land include primarily plants and offices. All tangible fixed assets are reported at acquisition value less depreciation. The acquisition value includes expenditures directly related to the
acquisition of the asset, as well as interest expenses in conjunction with the construction of qualifying assets.
Additional expenditures are added to the reported value of the asset or reported as a separate asset only where it is likely that the future economic benefits associated with the asset will vest in the Group and the asset’s acquisition value can be measured in a reliable manner. Reported value for the replaced part is removed from the balance sheet. All other forms of repairs and maintenance are reported as expenses in the income statement during the period in which they are incurred.
No depreciation takes place for land. Depreciation on other assets, in order to allocate their acquisition value down to the estimated residual value over the estimated useful life, takes place on a straight-line basis in accordance with the following:
Type of asset Useful life
Buildings 20–40 yearsPaper machinery 17 yearsOther machinery 10 yearsVehicles 5 yearsEquipment, tools, and installations 3-8 years
The residual value and useful life of the assets are assessed on each balance sheet date and adjusted as required.
Profits or losses from divestments are established through a comparison between the sales revenue and the reported value, and are reported in other operating income or other operating expenses in the income statement.
2.9 Impairment of non-financial assetsWith respect to goodwill and other assets with an undetermined useful life, an annual assessment is conducted to ascertain that the recovery value, i.e. the net realizable value or the use value, whichever is higher, exceeds the reported value. With respect to other non-financial assets, a similar assessment is carried out as soon as there are indications that the reported value is too high. The asset’s value is written down to the recovery value as soon as it is shown that it is lower than the reported value.
2.10 LeasingFixed assets which are used via leasing are classified in accordance with the financial terms of the leasing agreement. Leasing of fixed assets, where the Group in all essential respects holds the financial risks and benefits associated with ownership, is classified as financial leasing. Financial leasing is reported at the beginning of the leasing period at the fair value of the leasing object or the present value of the minimum leasing fees, whichever is the lower. Other leasing agreements are classified as operational leasing. Payments made during the leasing term (less deductions for any incentives from the lessor) are reported as an expense in the income statement on a straight-line basis over the leasing term.
2.11 Financial assetsThe Group classifies its financial assets in the following categories: financial assets at fair value through profit or loss, and loans and receivables. The classification depends on the purpose for which the financial asset was acquired. Management determines the classifica-tion of the financial assets on the first reporting occasion and reviews this decision on each subsequent reporting occasion.
2.11.1 General principlesPurchase and sales of financial assets are reported on the transaction day – the date on which the Group undertakes to purchase or sell the asset. Financial instruments are initially reported at fair value plus transaction expenses, which applies to all financial assets which are not reported at fair value through profit or loss. Financial assets valued at fair value through profit or loss are reported initially at fair value, while related transaction expenses are reported in the income statement. Financial assets are removed from the balance sheet when the right to receive cash flows from the instrument has expired or has been transferred and the Group has largely transferred all risks and benefits associated with the ownership. Financial assets valued at fair
6160
NOTES
Duni_ÅR_13_EN.indd 61 2014-04-15 15:07

value through profit or loss are reported after the acquisition date at fair value. Loans and receivables are reported at accrued acquisition value applying the effective annual interest rate method.
Fair value of listed financial assets corresponds to the listed bid price on the balance sheet date. Fair value of unlisted financial assets is determined by using valuation techniques, for example recently completed transactions, the price of similar instruments or discount-ed cash flows. Fair value of currency forwards is determined based on the applicable forward rate on the balance sheet date, while interest rate swaps are valued based on future discounted cash flows.
The Group assesses on each balance sheet date whether there is any objective evidence of impairment of a financial asset or a group of financial assets, such as the discontinuation of an active market or that it is unlikely that the debtor will be to meet its obligations. The impairment is calculated as the difference between the reported value of the asset and the present value of estimated future cash flows, discounted to the financial asset’s original effective rate of interest. The reported value of the asset is written down and the impairment charge is reported in the consolidated income statement. If a loan or an investment which is held to maturity carries valuable interest, the relevant effect rate of interest established in accordance with the agreement is used as the discount rate when establishing impairment. As an expediency, the Group can establish impairment on the basis of the fair value of the instrument applying an observable market price. Impairment of accounts receivable is described below in the section on loans and receivable.
2.11.2 Financial assets at fair value through profit or lossFinancial assets at fair value through profit or loss consist of financial assets that are held for trading. A financial asset is classified in this category if it is acquired primarily in order to be sold within a short time. Derivative instruments are classified as held for trading if they are not identified as hedge instruments. Duni holds derivative instruments in the form of currency forward contracts, interest rate swaps on long-term lending as well as financial contracts in the form of energy derivatives.
Duni applies hedge accounting in accordance with IAS 39 on the interest rate swaps entered for hedging payments of variable interest. Changes in value of derivatives designated for hedge accounting are reported in Other comprehensive income.
Assets in this category are classified as current assets if they are expected to be settled within 12 months; otherwise they are classified as fixed assets.
2.11.3 Hedge accountingThe effective part of changes in fair value on a derivative instrument which is identified as cash flow hedging and which satisfies the conditions for hedge accounting is reported in Other comprehensive income. The profit or loss attributable to the ineffective part is reported immediately in the income statement under Other net profits/losses. The profit or loss attributable to the effective part of an interest rate swap which hedges borrowing at a variable rate is reported in the income statement in Financial expenses.
2.11.4 Loan receivables and accounts receivableLoan receivables and accounts receivable are financial assets which are not derivative instruments. They have determined or determinable payments and are not listed on an active market. They are included in current assets, with the exception of items payable more than 12 months after the balance sheet date, which are classified as fixed assets. Impairment of accounts receivable is reported in the income statement in the sales function and impairment of loan receivables is reported as a financial item. Cash and cash equivalents in the balance sheet are also included in this classification.
Accounts receivable and loans receivables are initially reported at fair value and thereafter at accrued acquisition value applying the effective annual interest rate method, less any provisions for depreciation.
Provision is made for impairment of accounts receivable when there is objective evidence that the Group will be unable to receive all amounts which are due and payable according to the original terms of the receivables. Significant financial difficulties of the debtor, the probability that the debtor will go into bankruptcy or undergo financial restructuring, and non-payment or delayed payment (payment
overdue by more than 30 days) are regarded as indications that impairment may exist. The size of the provision is determined by the difference between the reported value of the asset and the present value of assessed future cash flows.
2.12 InventoriesInventories are reported at the acquisition value or the net realizable value, whichever is lower. The acquisition value is determined using the first in, first out method (FIFO). The acquisition value of finished goods and work in progress consists of design expenses, raw materials, direct salaries, other direct expenses and associated indirect manufacturing expenses (based on normal production capacity). Loan expenses are not included. The net realizable value is the estimated sales price in the current operations, less applicable variable selling expenses.
2.13 Cash and cash equivalentsIn both the balance sheet and the cash flow statement, cash and cash equivalents include cash, bank balances and other short-term invest-ments which mature within three months of the date of acquisition.
2.14 Financial liabilitiesThe Group classifies its financial liabilities in the following categories: financial liabilities valued at fair value through profit or loss and financial liabilities valued at accrued acquisition value. The classification depends on the purpose for which the financial liability was acquired. Management determines the specification of the financial liabilities on the first reporting occasion and reviews this decision on each subsequent reporting occasion.
2.14.1 Financial liabilities at fair value through profit or lossDerivative instruments with a negative fair value which do not meet the criteria for hedge accounting are valued at fair value through profit or loss. For a description of the derivative instruments held by Duni and for further information regarding reporting, see section 2.11 ”Financial assets at fair value through profit or loss.”
Derivative instruments which satisfy the rules for hedge accounting, including the interest rate swaps taken out by Duni, are reported at fair value via Other comprehensive income. For a more detailed description of the reporting of derivative instruments designated for hedging, see 2.11.3.
Liabilities in this category are classified as short-term liabilities if they are expected to be settled within 12 months; otherwise they are classified as long-term liabilities.
2.14.2 Financial liabilities valued at amortized costBorrowing and other financial liabilities, e.g. accounts payable, are included in this category. Accounts payable are obligations to pay for goods or services which have been acquired from suppliers in the course of day-to-day operations. Accounts payable are classified as short-term liabilities if they fall due within one year or earlier (or during a normal business cycle, if that is longer). If not, they are reported as long-term liabilities.
Financial liabilities are valued initially at fair value, net after transaction expenses. Financial liabilities are thereafter valued at accrued acquisition value, and any difference between the received amount (net after transaction expenses) and the repayment amount is reported in the income statement, allocated over the period of the loan, applying the effective annual interest rate method. The prepayment fee upon premature redemption of loans is reported in the income statement at the time of redemption. Loan expenses affect the result for the period to which they relate. Issued dividends are reported as loans after the Annual General Meeting has approved the dividend.
Borrowing and other financial liabilities are classified as short-term liabilities unless the Group has an unconditional right to defer payment of the liability for at least 12 months after the balance sheet date.
2.15 Income taxesReported income taxes includes tax which is to be paid or received regarding the current year, adjustments regarding the relevant tax for previous years, and changes in deferred taxes.
All tax liabilities/tax assets are valued at the nominal amount in accordance with the tax rules and tax rates decided upon or announced
Duni_ÅR_13_EN.indd 62 2014-04-15 15:07

and which in all likelihood will be adopted.With respect to items reported in the income statement, the associated
tax consequences are also reported in the income statement. The tax consequences of items reported in the Consolidated statement of comprehensive income are reported in the Consolidated statement of comprehensive income.
Deferred tax is calculated in accordance with the balance sheet method on all temporary liabilities which arise between reported and tax values of assets and liabilities.
Deferred tax assets with respect to loss carry-forwards and other future taxable deductions are reported to the extent it is likely that the deduction may be set off against surpluses in conjunction with future payments. Deferred tax liabilities relating to temporary differences attributable to investments in subsidiaries and branches are not reported in the consolidated financial statements since the Parent Company can, in all cases, determine the date for reversal of the temporary differences and it is not deemed likely that a reversal will take within the foreseeable future.
2.16 Employee benefits2.16.1 PensionsDuni has various pension plans. The pension plans are normally financed through payments to insurance companies or manager-administered funds, where the payments are determined based on periodic actuarial calculations. Duni has both defined benefit and defined contribution pension plans. A defined contribution pension plan is a pension plan pursuant to which Duni pays fixed fees to a separate legal entity. Duni has no legal or informal obligations to pay additional fees if the legal entity has insufficient assets to pay all compensation to employees relating to the employee’s service during a current or earlier period. A defined benefit plan is a pension plan which is not a defined contribution plan. The distinguishing feature of defined benefit plans is that they state an amount for the pension benefit an employee will receive after retirement, normally based on one or more factors such as age, period of employment and salary.
The liability reported in the balance sheet with respect to defined benefit plans is the present value of the defined benefit obligation on the balance sheet date, less the fair value of the managed assets. The defined benefit pension obligation is calculated annually by independ-ent actuaries applying the projected union credit method. The present value of a defined benefit obligation is determined by discounting the estimated future pension payments using the rate of interest on first class corporate bonds issued in the same currency as the currency in which payments are to be made, with terms to maturity comparable to the relevant pension liability. Approximately one half of pension obligations relate to Sweden. Swedish mortage bonds considered to be corporate bonds.
Swedish mortgage bonds correspond to investment-grade corporate bonds in the sense that the market for mortgage bonds has a high turnover and is considered to be liquid and deep; furthermore, these bonds often have a triple A rating and thus are extremely creditworthy.
Actuarial gains and losses arising from experience-based adjustments and changes in actuarial assumptions are reported in ”Other compre-hensive income” during the period in which they arise.
Expenses relating to employment in earlier periods are reported directly in the income statement.
In respect of defined contribution plans, Duni pays fees to publicly or privately administered pension insurance plans pursuant to contractual obligations or on a voluntary basis. The Group has no further payment obligations when the contributions are paid. The contributions are reported as personnel expenses when they fall due for payment. Prepaid contributions are reported as an asset to the extent the Company may benefit from cash repayments or a reduction in future payments.
2.16.2 Compensation upon termination of employmentCompensation upon termination of employment is paid when an employee’s employment is terminated by Duni prior to the normal retirement date or when an employee accepts voluntary severance in exchange for certain compensation. Duni reports severance compensation when the Group is demonstrably obliged either to terminate an employee pursuant to a detailed formal plan without the possibility of recall, or
to provide compensation upon termination as a result of an offer made to encourage voluntary retirement. Benefits payable more than 12 months after the balance sheet date are discounted to present value.
2.17 ProvisionsProvisions for, primarily, environmental restoration measures, restructuring expenses and any legal claims are reported when the Group has a legal or informal obligation as a consequence of earlier events, it is likely that an outflow of resources will be required to settle the obligation, and the amount can be calculated in a reliable manner. Duni reports allocations for restructuring expenses, see Note 9. No provisions are made for future operating losses.
2.18 Fixed assets held for sale and discontinued operations
Fixed assets which are held for sale (or divestment groups) are classified as fixed assets held for sale if their reported value will primarily be recovered through a sales transaction, not through ongoing use. Fixed assets (or divestment groups) classified as fixed assets which are held for sale are reported at the reported value or the fair value less selling expenses, whichever is the lower. Such assets may constitute a part of a company, a divestment group or an individual fixed asset. As regards the reported financial year, Duni has no assets which meet the criteria for reporting as fixed assets held for sale.
2.19 Emission rightsDuni participates in the EU’s emission rights trading system. Received emission rights are initially valued at the acquisition value, i.e. SEK 0. Revaluations do not take place. A provision is made if an emission rights deficit is identified between owned rights and the rights which will need to be delivered due to emissions made. The value of any surplus emission rights is reported only when realized upon an external sale.
2.20 The Parent Company’s accounting principlesThe Parent Company prepares its annual report pursuant to the Swedish Annual Accounts Act and the Swedish Financial Reporting Board’s Recommendation RFR 2, Reporting for Legal Entities. RFR 2 entails that the Parent Company’s annual report for the legal entity shall apply all IFRS and statements approved by the EU, insofar as possible within the scope of the Swedish Annual Accounts Act and taking into consideration the connection between reporting and taxation. The Recommendation states which exceptions and supplements are to be made compared with reporting pursuant to IFRS.
The principles regarding the Parent Company are unchanged compared with the preceding year.
2.20.1 Differences between the Group’s and the Parent Company’s accounting principles
Differences between the Group’s and Parent Company’s accounting principles are set forth below. The accounting principles stated below have been applied consistently to all periods presented in the Parent Company’s financial statements.
SubsidiariesParticipating interests in subsidiaries are reported in the Parent Company pursuant to the purchase method. Received dividends and group contributions are reported as financial incomes.
Intangible fixed assetsIntangible fixed assets in the Parent Company are reported at acquisition value less deduction for accumulated amortization and any impairment. Reported goodwill in the parent company relates to acquisition goodwill; the useful life is thus assessed by company management at not more than 20 years. Amortization of goodwill takes place on a straight-line basis over an assessed useful life of 20 years.
Tangible fixed assetsTangible fixed assets in the Parent Company are reported at acquisition value less deduction for accumulated depreciation and any impairment in the same manner as for the Group, but with a supplement for any revaluations.
6362
NOTES
Duni_ÅR_13_EN.indd 63 2014-04-15 15:07

Leased assetsAll leasing agreements are reported in the Parent Company pursuant to the rules for operational leasing.
Pension provisionsThe Parent Company reports pension liabilities based on a calculation pursuant to the Swedish Pension Obligations (Security) Act.
Income taxDue to the connection between reporting and taxation, in the Parent Company the deferred tax liability on untaxed reserves is reported as a part of the untaxed reserves.
Presentation of income statement and balance sheetThe Parent Company complies with the form for presentation of income statements and balance sheets as set forth in the Swedish Annual Reports Act. This entails, among other things, a different presentation as regards shareholders’ equity and that provisions are reported as a separate main heading in the balance sheet.
NOTE 3 – FINANCIAL RISKS
3.1 Financial risk factorsDuni is exposed through its operations to a large number of different risk factors: market risks (including currency risks, price risks regarding energy consumption and pulp purchases by the subsidiary, Rexcell Tissue & Airlaid AB, interest rate risks in the cash flow, as well as interest rate risks in fair value), credit risks and liquidity risks. Duni’s overall risk management policy focuses on contingencies on the financial markets.
Risk management is handled by a central finance department (Treasury) in accordance with policies adopted by the Board of Directors. Treasury identifies, evaluates and hedges financial risks in close cooperation with the Group’s operational units. The Board prepares specific policies regarding the overall risk management and for specific areas, such as currency risks, interest rate risks, use of derivative and non-derivative financial instruments, as well as investments of surplus liquidity. The financial hedge relations established by Duni as an element in its risk management do not qualify for hedge accounting pursuant to the rules in IAS 39. However, there is one exception: in 2013 Duni designated an interest rate swap as a hedge instrument. The interest rate swap is reported in accordance with the rules governing cash flow hedging.
3.1.1 Market risksCurrency riskDuni operates internationally and is exposed to currency risks which arise from various currency exposures. The Group’s exposure to changes in exchange rates may be described as translation exposure and transaction exposure.
Duni manages its translation exposure and transaction exposure by concentrating the exposure to a small number of Group companies and through a finance policy adopted by the Board of Directors.
Translation exposure Items included in each individual subsidiary’s annual report are calcu-lated based on the currency of the country in which the subsidiary has its primary financial and/or legal domicile (functional currency). The Parent Company’s annual report is presented in Swedish kronor (SEK), which is the Group’s presentation currency. Translation from each company’s functional currency to SEK does not give rise to any significant cash flow and thus this exposure is not hedged. Translation exposure arises when the income statements of subsidiaries are translated to SEK. At unchanged exchange rates compared with 2012, net sales for the year would have been SEK 39 m and the underlying operating income would have been SEK 6 m higher.
Duni is also exposed to another type of translation exposure which occurs in the balance sheets of the individual group companies due to the fact that such balance sheets may include items in a currency other than such group company’s functional currency. Revaluation of these items to the closing day rate is included in the Group’s result. This type of translation exposure is addressed in the section below.
The financial borrowing and lending in the individual subsidiaries is primarily internal through the Parent Company and in the respective subsidiary’s functional currency. In this manner, currency exposure regarding these items has been centralized on the Parent Company. In the Parent Company, 100% of the financial borrowing and lending is hedged in accordance with the Group’s policy, and thus a change in exchange rates has no essential effect on the result. The Parent Company’s external borrowing is matched to approximately 32% by internal net lending with the same currency breakdown. The remaining 68% is hedged on the currency futures market in accordance with Duni’s policy. Note 29 presents the value and nominal amounts regarding currency forward contracts entered into regarding financial borrowing and lending in the Parent Company.
As described in greater detail below in the section addressing transaction exposure, Duni manages its currency risks primarily by concentrating commercial transactions to take place essentially in the functional currencies of the subsidiaries. Thus, as regards the consoli-dated Group, the translation exposure in the working capital of the individual subsidiaries is assessed as minor.
Had all currencies been 5% higher/lower, due to exposure in the individual subsidiaries and the consolidated balance sheet items, the Group’s income would have been approximately +/- SEK 0 m (2012: +/- SEK 2 m). Corresponding figures for the Parent Company are approximately +/- SEK 0 m (2012: +/- SEK 2 m).
Transaction exposure The transaction exposure is minimized primarily through external commercial transactions essentially being carried out in the functional currency of the subsidiaries. Purchases by subsidiaries, primarily internal, may however take place in currencies other than the company’s own functional currency, and thus these purchases are exposed to a currency risk. By also directing the internal flows as far as possible to the functional currency of the recipient subsidiary, the currency risk is concentrated to a small number of subsidiaries. The Group’s external flows are primarily in SEK as well as PLN, while external inward flows are primarily in DKK, NOK, CHF and GBP.
Duni does not have a policy to hedge interest payments, whether internal or external.
Duni has an indirect currency risk in USD through the subsidiary, Rexcell Tissue & Airlaid AB. Internationally, pulp is priced in USD; a strengthening/weakening of USD results in higher or lower purchas-ing costs for the Group. However, this risk is neutralized to a certain extent since the pulp price becomes lower or higher in the event of a strengthening/weakening of USD.
Price risksEnergy price risks During 2013, the subsidiary Rexcell Tissue & Airlaid AB purchased approximately 80,600 MWh electricity at a cost of approximately SEK 351 m; 4,700 tonnes of LPG for approximately SEK 30 m; and wood chips for the biofuel boiler were bought for approximately SEK 11 m (2012: 81,000 MWh electricity for SEK 31 m; 4,800 tonnes of LPG for SEK 34 m; and wood chips for SEK 10 m).
Due to its energy-intensive operations, Rexcell Tissue & Airlaid AB is exposed to risks associated with changes in the price of energy, particularly gas and electricity. In those cases where the energy price is not hedged, price changes on the energy market have a direct impact on the company’s income. An electricity price change of +/- 5% for the energy used by Rexcell Tissue & Airlaid AB affects the net income by approx. -/+ SEK 2 m (2012: -/+ SEK 2 m).
Rexcell Tissue & Airlaid AB has been allocated emission rights for the period 2013 to 2020, divided between Dals Långed and Skåpafors. The allocation for 2013 was as follows: Dals-Långed, 2,318 tonnes and Skåpafors, 19,840 tonnes. The total number of emission rights will diminish each year up to 2020.
Excess emission rights are carried over to the following year, while support purchases are made if the emission rights are insufficient. In the event support purchases are made in 2013, the assessment is that they will not amount to any significant sum. On December 31, 2013, Rexcell Tissue & Airlaid AB had 8,054 (2,237) unused emission rights with a market value of SEK 0 (0) m.
Duni_ÅR_13_EN.indd 64 2014-04-15 15:07

1–3 months 3–12 monthsLater than1 year
but within 5 years
SEK m Book value Interest Repayment Interest Repayment Interest Repayment
Bank loans -490 -1 -492 – – – –
Overdraft facility 0 0 0 – – – –
Accounts payable and other liabilities -429 – -429 – – – –
- Currency forward contracts* -2 – -1 – -1 – –
- Interest rate swaps -1 0 – 0 – 0 –
Derivative instruments - Liabilities -3 0 -2 0 0 0 0
- Currency forward contracts* 5 – 5 – – – –
- Interest rate swaps 0 0 – – – – –
Derivative instruments – Assets 5 0 5 0 0 0 0Total -917 -1 -918 0 0 0 0
* Gross flows are shown in the table below.
The market value of derivative instruments above regarding liabilities is broken down as follows:
SEK m 2013 2012
Currency forward contracts 3 0
Interest rate swaps -1 -2
Total 2 -2
Pulp price risksOTC trading in financial contracts takes place with respect to certain paper and pulp products, i.e. there is a possibility to reduce the risk of fluctuations in the paper and pulp price. Purchases of paper and pulp are carried out by the subsidiary, Rexcell Tissue & Airlaid AB. Duni currently has not signed any such contracts. A change in the price of pulp during 2013 of +/- 1% per tonne affects income by -/+ SEK 3 m (2012: -/+ SEK 3 m).
Interest rate risks with respect to cash flows and fair valueDuni is exposed to interest rate risks, primarily in EURIBOR, since all external borrowing is at variable interest rates (see Note 31 for more details). The Parent Company’s internal lending and borrowing also take place at variable rates. Part of the interest rate risk has been hedged at a fixed rate through 24-month interest rate swaps, expiring in February 2014, which in 2013 was extended by 12 months, expiring in February 2015.
Duni has no significant interest-bearing assets. The Group’s revenue and cash flows from the ongoing operations are, in all essential respects, independent of changes in market interest rates. The Group’s interest rate risk with respect to cash flows arises through external long-term borrowing at a variable rate of interest. Outstanding loans are entirely in EUR.
Had interest rates on the Group’s borrowing as per December 31, 2013 been 100 points higher/lower with all other variables being constant, the Duni’s net income for 2013 would have been SEK 5 m lower/higher (2012: SEK 4 m).
3.1.2 Credit risksCredit risks are managed on a Group level. Credit risks arise through cash or cash equivalents, derivative instruments and balances held with banks and financial institutions as well as credit exposures vis-à-vis the Group’s customers, including outstanding receivables and agreed transactions.
Only banks and financial institutions with a long-term credit rating from an independent rating agency of at least ”A- (minus)” are accepted. The total amount deposited or invested in a bank or a single finance company may not exceed SEK 150 m.
All new customers are subject to a credit rating assessment by an independent rating agency. In those cases where there is no independent credit rating, a risk assessment is made regarding the customer’s creditworthiness with consideration being given to the customer’s
financial position, previous experience and other factors. Individual risk limits are established based on internal or external credit assessments in accordance with the limits established by the Board. The use of credit limits is monitored regularly.
The maximum credit risk consists of the book value of the exposed assets including derivatives with positive market values.
Receivables overdue by more than 180 days accounted for 1.17% of total accounts receivable (2012: 0.6%). For the Parent Company, the corresponding portion is 0.0% (2012: 0.0%).
3.1.3 Liquidity risksDuni’s liquidity risks consist of the Group lacking cash or cash equivalents for payment of its obligations. The risk is managed by within Duni by Treasury ensuring that sufficient cash and cash equivalents are available, that financing is available through agreed credit facilities (these are described in greater detail in Note 31) and the possibility to close market positions.
As per December 31, 2013 Duni had cash and cash equivalents of SEK 225 m (2012: SEK 181 m) as well as a non-utilized credit facility of SEK 733 m (2012: SEK 625 m). Payments for coming periods relating to financial liabilities are shown in tables below.
Duni’s credit facility is subject to covenants which consist of a key financial ratio as well as a number of non-financial conditions. The financial key ratio comprises financial net debt in relation to underlying EBITDA. The interest margin is calculated based on the same key ratio and adjusted based on given levels each quarter.
Current financing consists of a revolving credit facility of EUR 130 m which has not been fully utilized. In addition to this financing, there are overdraft facilities totaling SEK 7 m and PLN 10 m. Duni’s long-term financing since 2012 is secured by a finance agreement expires in May 2015. The table below shows the Group’s contracted outstanding undiscounted interest payments and repayment of principal on the financial liabilities, as well as assets and liabilities regarding derivative instruments:
6564
NOTES
Duni_ÅR_13_EN.indd 65 2014-04-15 15:07

Currency forward contracts are settled gross. The table below shows these currency forward contracts broken down by the time which, on the balance sheet date, remains until the contractual expiration date. The amounts stated below are the contractual non-discounted amounts.
SEK m 2013 2012
Currency forward contracts – Inflow regarding contracts for financial assets
and liabilities 529 333
– Outflow regarding contracts for financial assets and liabilities -529 -334
All flows are due and payable within one year. Financial currency forward contracts relate to both internal and external liabilities and receivables.
The above presentation includes all financial liabilities and derivative instruments with negative and positive values. Amounts in foreign currency and amounts paid based on a variable rate of interest have been estimated through the use of the prevailing exchange rates on the balance sheet date and the most recent interest rate adjustments. Total repayment does not always correspond to the book value. This is due to the fact that the Group’s transaction costs in connection with the arrangement of loans are booked against the loan.
3.2 Management of capital riskDuni’s objective with respect to the capital structure is to ensure the Group’s ability to continue its operations. The Group assesses capital on the basis of the net/debt equity ratio. This key ratio is calculated as net debt divided by total capital. The net debt is calculated as total borrowing less cash and cash equivalents. Total capital is calculated as shareholders’ equity in the consolidated balance sheet plus net debt.
The net debt/equity ratio is as follows:
Group Parent Company
SEK m 2013 2012 2013 2012
Total borrowing 490 576 490 559Other long-term receivables 0 -2 0 -2
Pension provisions 223 246 109 112
Group loans / receivables – – -1 062 -1 028
Less: cash and cash equivalents -225 -181 -164 -130
Net debt* 491 638 -627 -483
Total shareholders' equity 2 099 1 985 1 951 1 972Total capital 2 590 2 623 1 324 1 489Net debt/equity ratio 19 % 24 % -47 % -32 %
* Calculation of debt debt is exclusive of derivative instruments.
3.3 Calculation of fair value The fair value of derivatives traded on an active market is based on the listed market prices on the balance sheet date. The relevant ask price constitutes the listed market price which is used for the Group’s financial assets.
Fair value of financial instruments which are not traded on an active market (e.g. OTC derivatives) is determined through the use of valuation techniques. The Group uses a number of different methods and makes assumptions based on the market conditions prevailing on the balance sheet date. Listed market prices or broker listings for similar instruments are used with respect to long-term liabilities. Other techniques, such as calculation of discounted cash flows, are used to establish fair value for remaining financial instruments. Fair value for interest rate swaps is calculated as the present value of asses-sed future cash flows. Fair value for currency forward contracts is established through the use of listed prices for currency forward contracts on the balance sheet date.
Reported value for accounts receivable and accounts payable, less any impairment, is assumed to correspond to fair value since these items are short-term in nature. For information purposes, fair value of financial liabilities is calculated by discounting the future contracted cash flow to the current market interest rate which is available to the Group for similar financial instruments.
Commencing January 1, 2009, Duni applies the amended IFRS 7 as regards financial instruments which are valued at fair value in the
balance sheet. Disclosure is thereupon required regarding valuation at fair value per level in the following fair value hierarchy:
Level 1 – Listed prices (unadjusted) on active markets for identical assets or liabilities.
Level 2 – Other observable data for assets or liabilities comprises listed prices included in level 1, either directly (as price) or indirectly (derived from price).
Level 3 – Data for assets or liabilities which is not based on observable market data.
As stated in Note 32, Duni only has derivative instruments valued at fair value; all derivative instruments are classified in level 2.
NOTE 4 – IMPORTANT ESTIMATIONS AND ASSESSMENTS FOR ACCOUNTING PURPOSES
Estimations and assessments are evaluated regularly based on historical experience and other factors, including expectations of future events which may be deemed reasonable under prevailing circumstances.
4.1 Important estimations and assumptions for accounting purposes
The Group makes estimations and assumptions regarding the future. From a definition perspective, the estimations for accounting purposes which follow therefrom rarely correspond to the actual outcome. The estimations and assumptions which entail a significant risk of material adjustments in reported values for assets and liabilities during the following accounting period are outlined below.
4.1.1 Useful life, in tangible and intangible fixed assetsGroup management determines assessed useful life and thereby associated amortization/depreciation on the Group’s intangible and tangible fixed assets. These estimations are based on historical knowledge of the useful life of corresponding assets. Useful life and assessed residual values are reviewed on each balance sheet date and adjusted as required.
Regarding reported values for each balance sheet date for intangible and tangible fixed assets, see Notes 21–25.
4.1.2 Test of impairment of goodwillEach year, the Group assesses whether there is any impairment of goodwill, in accordance with the accounting principle described in Note 2 under section 2.9, ”Impairment of non-financial assets”. The recovery value of cash-generating units has been determined by calculating the use value. For these calculations, certain estimations must be made; see Note 21.
Reported values as per the balance sheet date for goodwill are allocated per cash-generating unit; see Note 21.
Even if the estimated rate of growth which is applied to discounted cash flows after the forecast 5-year period had been 0% instead of the management’s assessment of 1%, there would be no impairment of goodwill.
Even if the estimated discount rate before tax which is applied to discounted cash flows had been 12.4% instead of the management’s assessment of 11.4%, there would be no impairment of goodwill.
4.1.3 Valuation of loss carry-forwardsEach year, the Group assesses whether there is any impairment of deferred tax assets regarding loss carry-forwards for tax purposes. In addition, the Group assesses the possibility to capitalize new deferred tax assets with respect to the year’s loss carry-forwards for tax purposes, where appropriate. Deferred tax assets are reported only in those cases where it is likely that, in the future, from a tax perspective there will be surpluses against which the temporary difference may be utilized.
Reported values for deferred tax assets for each balance sheet date are set forth in Note 19 ”Income taxes”. As set forth in Note 19, non-appraised loss carry-forwards as per December 31, 2013 amount to SEK 0 m (2012: SEK 0 m).
Duni_ÅR_13_EN.indd 66 2014-04-15 15:07
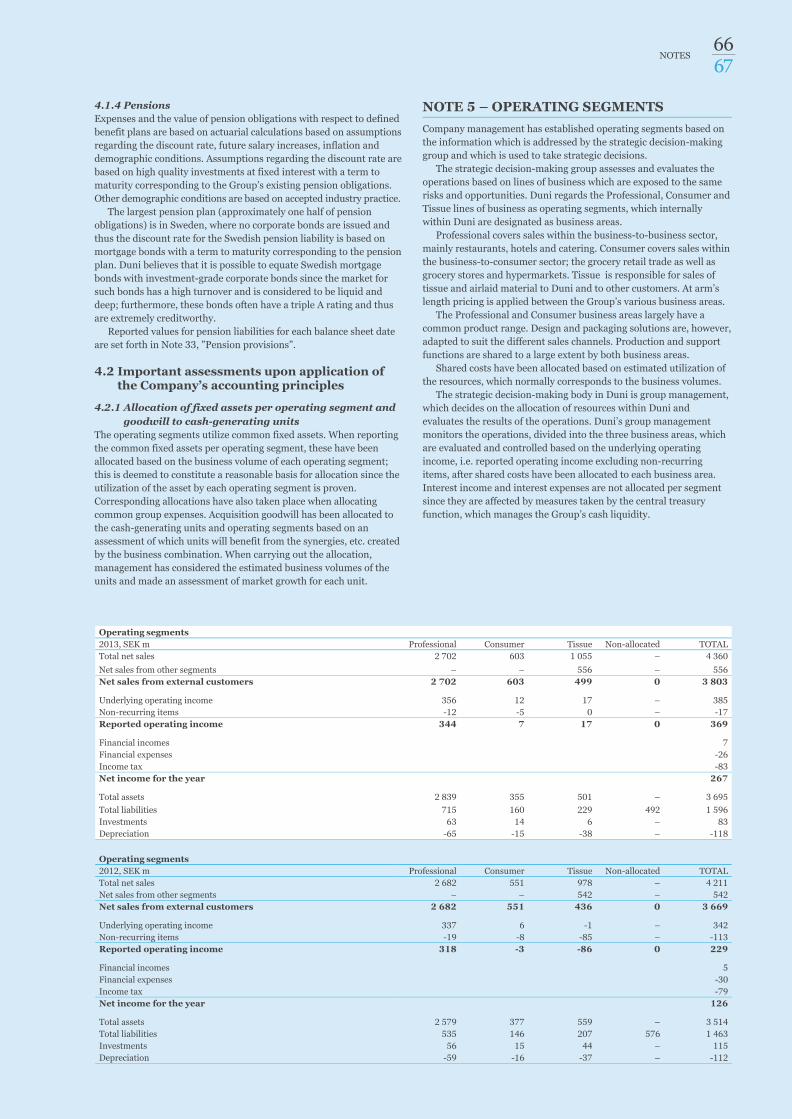
4.1.4 PensionsExpenses and the value of pension obligations with respect to defined benefit plans are based on actuarial calculations based on assumptions regarding the discount rate, future salary increases, inflation and demographic conditions. Assumptions regarding the discount rate are based on high quality investments at fixed interest with a term to maturity corresponding to the Group’s existing pension obligations. Other demographic conditions are based on accepted industry practice.
The largest pension plan (approximately one half of pension obligations) is in Sweden, where no corporate bonds are issued and thus the discount rate for the Swedish pension liability is based on mortgage bonds with a term to maturity corresponding to the pension plan. Duni believes that it is possible to equate Swedish mortgage bonds with investment-grade corporate bonds since the market for such bonds has a high turnover and is considered to be liquid and deep; furthermore, these bonds often have a triple A rating and thus are extremely creditworthy.
Reported values for pension liabilities for each balance sheet date are set forth in Note 33, ”Pension provisions”.
4.2 Important assessments upon application of the Company’s accounting principles
4.2.1 Allocation of fixed assets per operating segment and goodwill to cash-generating units
The operating segments utilize common fixed assets. When reporting the common fixed assets per operating segment, these have been allocated based on the business volume of each operating segment; this is deemed to constitute a reasonable basis for allocation since the utilization of the asset by each operating segment is proven. Corresponding allocations have also taken place when allocating common group expenses. Acquisition goodwill has been allocated to the cash-generating units and operating segments based on an assessment of which units will benefit from the synergies, etc. created by the business combination. When carrying out the allocation, management has considered the estimated business volumes of the units and made an assessment of market growth for each unit.
NOTE 5 – OPERATING SEGMENTSCompany management has established operating segments based on the information which is addressed by the strategic decision-making group and which is used to take strategic decisions.
The strategic decision-making group assesses and evaluates the operations based on lines of business which are exposed to the same risks and opportunities. Duni regards the Professional, Consumer and Tissue lines of business as operating segments, which internally within Duni are designated as business areas.
Professional covers sales within the business-to-business sector, mainly restaurants, hotels and catering. Consumer covers sales within the business-to-consumer sector; the grocery retail trade as well as grocery stores and hypermarkets. Tissue is responsible for sales of tissue and airlaid material to Duni and to other customers. At arm’s length pricing is applied between the Group’s various business areas.
The Professional and Consumer business areas largely have a common product range. Design and packaging solutions are, however, adapted to suit the different sales channels. Production and support functions are shared to a large extent by both business areas.
Shared costs have been allocated based on estimated utilization of the resources, which normally corresponds to the business volumes.
The strategic decision-making body in Duni is group management, which decides on the allocation of resources within Duni and evaluates the results of the operations. Duni’s group management monitors the operations, divided into the three business areas, which are evaluated and controlled based on the underlying operating income, i.e. reported operating income excluding non-recurring items, after shared costs have been allocated to each business area. Interest income and interest expenses are not allocated per segment since they are affected by measures taken by the central treasury function, which manages the Group’s cash liquidity.
Operating segments2013, SEK m Professional Consumer Tissue Non-allocated TOTALTotal net sales 2 702 603 1 055 – 4 360Net sales from other segments – – 556 – 556Net sales from external customers 2 702 603 499 0 3 803 Underlying operating income 356 12 17 – 385Non-recurring items -12 -5 0 – -17Reported operating income 344 7 17 0 369 Financial incomes 7Financial expenses -26Income tax -83Net income for the year 267 Total assets 2 839 355 501 – 3 695Total liabilities 715 160 229 492 1 596Investments 63 14 6 – 83Depreciation -65 -15 -38 – -118
Operating segments2012, SEK m Professional Consumer Tissue Non-allocated TOTALTotal net sales 2 682 551 978 – 4 211Net sales from other segments – – 542 – 542Net sales from external customers 2 682 551 436 0 3 669 Underlying operating income 337 6 -1 – 342Non-recurring items -19 -8 -85 – -113Reported operating income 318 -3 -86 0 229 Financial incomes 5Financial expenses -30Income tax -79Net income for the year 126 Total assets 2 579 377 559 – 3 514Total liabilities 535 146 207 576 1 463Investments 56 15 44 – 115Depreciation -59 -16 -37 – -112
6766
NOTES
Duni_ÅR_13_EN.indd 67 2014-04-15 15:07

Presented below is a specification of what Duni considers to be non-recurring items and the difference on the underlying and reported operating income.
SEK m 2013 2012
Non-recurring items
Underlying operating income 385 342
Unrealized valuation effects of derivative instruments 0 0
Restructuring expenses -17 -113Reported operating income 369 229
The assets and liabilities included in each business area include all operating capital which is used, primarily inventories, accounts receivable and accounts payable. In addition, certain assets which are shared (primarily fixed assets) have been allocated. Duni has chosen not to allocate financial liabilities, with the exception of accounts payable and derivative instruments. See also the table on non-allocated liabilities below and Note 4.2.
SEK m 2013 2012
Non-allocated liabilities
Overdraft facility 0 17
Leasing 2 0
Bank loans 490 558
Total non-allocated liabilities 492 576
Total net sales from external customers broken down by product groups:
SEK m 2013 2012
Product groups
Napkins 1 604 1 562
Tablecoverings 812 848
Candles 172 172
Serving products 345 286
Packaging solutions 284 273
Other 588 528
Net sales from external customers 3 803 3 669
Total net sales from external customers broken down by geographic areas:
SEK m 2013 2012
Net sales
Sweden 291 285
Rest of Nordic region 439 419
Germany 1 222 1 220
Rest of Central Europe 930 963
Southern and Eastern Europe 743 703
Rest of the world 179 79
Net sales from external customers 3 803 3 669
Total intangible and tangible fixed assets broken down by geographic areas:
SEK m 2013 2012
Intangible and tangible fixed assets
Sweden 1 476 1 518
Germany 392 377
Rest of Central Europe 2 3
Southern and Eastern Europe 105 96
Rest of the world 76 –
Total tangible and intangible assets 2 050 1 994
Parent Compnay’s breakdown of net sales per operating segment and geographic area:
Parent Company, SEK m 2013 2012
Operating segment
Professional 965 910
Consumer 145 144
Tissue 3 2
Total net sales 1 113 1 056
Parent Company, SEK m 2013 2012
Geographic areas
Nordic region 684 682
Central Europe 316 321
Southern and Eastern Europe 113 54
Total net sales 1 113 1 056
NOTE 6 – INTRA-GROUP PURCHASES AND SALES
Intra-group purchases and sales amounted to SEK 2,409 m (2012: SEK 2,272 m). The Parent Company sold goods to its subsidiaries for SEK 401 m (2012: SEK 352 m) and purchased goods from subsidiaries in the value of SEK 534 m (2012: SEK 477 m). At arm’s length pricing has been applied in conjunction with intra-group purchases and sales.
NOTE 7 – EXPENSES BY NATURE
In the consolidated income statement, expenses are grouped by function. Presented below is information regarding significant types of expenses.
Group
SEK m Note 2013 2012
Changes in inventories of finished products and products in progress 557 563
Raw materials and consumables 951 913
Expenses for compensation to employees 13 869 845
Depreciation and impairment 8 118 195
Other expenses 979 970
Total operating expenses 3 474 3 486
”Other expenses” means expenses for real estate, rents, logistics expenses, marketing, travel expenses, etc.
Duni_ÅR_13_EN.indd 68 2014-04-15 15:07

NOTE 8 – DEPRECIATION/AMORTIZATION AND IMPAIRMENTDepreciation/Amortization Group Parent Company
SEK m 2013 2012 2013 2012Goodwill – – 100 100Capitalized development expenditures 13 14 12 14Trademarks and licenses 1 1 1 1Buildings and land improvements 6 7 1 2Plant and equipment 98 90 6 5Total depreciation/amortization 118 112 120 122
Depreciation/amortization are included in the cost for each function as follows:Group Parent Company
SEK m 2013 2012 2013 2012Costs of goods sold 94 87 5 5Selling expenses 0 1 – –Administrative expenses 24 24 15 17Other operating expenses – – 100 100Total depreciation/amortization 118 112 120 122
Depreciation/amortization reported under the heading ”Other operating expenses” for the Parent Company in the table above relates in its entirety to amortization of goodwill.
NOTE 9 – RESTRUCTURING EXPENSES – ALLOCATION TO RESTRUCTURING RESERVEFollowing the entry into force of a new organisation in April 2012, during 2013 a restructuring program was initiated entailing a division of the sales and marketing departments between Table Top and Meal Service within the Professional business area. The program started with the Nordic region during the third quarter and, during the fourth quarter, was expanded to cover additional sales organisations in Europe. In total, restructuring expenses of SEK 11 m were incurred relating to the program. Together, the measures are expected to generate annual savings on par with the structural expenses, and the full impact on earnings is expected to be achieved during the second half of 2014.
In addition, SEK 6 m is attributable to efficiency improvements within the logistics operations.During 2012, restructuring expenses totalling SEK 113 m were incurred. SEK 83 m of these expenses related to the plant closure of the
hygiene products unit within Tissue. This relates primarily to the write-down of fixed assets and also, to a certain extent, of inventory. The final closure of the unit is expected to take place in April 2015.
Restructuring expenses are included in each function as follows:
Group Parent Company
SEK m 2013 2012 2013 2012Costs of goods sold 6 14 – –Selling expenses 11 12 3 12Administrative expenses 0 10 – –Other operating expenses 0 77 – 17Total restructuring expenses 17 113 3 28
Allocation to restructuring reserve:
Group Parent Company
SEK m 2013 2012 2013 2012Opening balance, restructuring reserve 17 11 6 5Utilized reserves -15 -15 -5 -6Reversal of reserve 0 -1 0 -1Allocations for the year 19 22 3 8Closing balance, restructuring reserve 21 17 5 6Of which short-term 21 17 5 6
Impairment Group Parent Company
SEK m 2013 2012 2013 2012Capitalized development expenditures – 3 – –Buildings and land improvements – 16 – –Plant and equipment – 45 – –Construction in progress and advance payments for tangible assets – 21 – –Total impairment 0 85 0 0
Impairment charges are included in the cost for each function as follows:
Group Parent Company
SEK m 2013 2012 2013 2012Selling expenses – 4 – 4Other operating expenses – 81 – 16Total impairment 0 85 0 21
6968
NOTES
Duni_ÅR_13_EN.indd 69 2014-04-15 15:07

NOTE 10 – INVENTORIESGroup Parent Company
SEK m 2013 2012 2013 2012
Raw materials and consumables 102 98 – –
Work in progress 5 6 – –
Finished goods and goods for resale 323 277 88 70
Advance payments to suppliers 4 6 3 3
Total 434 387 91 73
The change in inventories is reported under the item ”Costs of goods sold” and, for the Group, amounts to SEK 2,460 m (2012: SEK 2,221 m). The corresponding item for the Parent Company amounts to SEK 715 m (2012: SEK 681 m).
The Group’s impairment write-down of inventory to the net realizable value amounts to SEK 9 m (2012: SEK 20 m). Impairment for the year is reported as a restructuring cost in connection with the planned closure within the Tissue business area. The Parent Company’s reported impairment write-down of inventory amounts to SEK 2 m (2012: SEK 8 m). No reversal of write-downs has taken place in 2013 or 2012.
NOTE 11 – COMPENSATION TO AUDITORSGroup Parent Company
SEK m 2013 2012 2013 2012
PwC - Audit engagement 4.0 3.6 1.9 1.7
- Auditing work other than audit engagement 0.2 0.4 0.1 0.3
- Tax advice 0.7 2.1 0.2 0.3
- Other services 1.5 1.4 1.0 1.1
Total 6.4 7.5 3.2 3.4
Group Parent Company
SEK m 2013 2012 2013 2012
Other auditors - Audit engagement 0.1 0.1 – –
- Auditing work other than audit engagement – – – –
- Tax advice 0.2 0.1 – –
- Other services 0.0 0,0 – –
Total 0.3 0.2 0,0 0,0Total compensation to auditors 6.7 7.7 3.2 3.4
”Audit engagement” means compensation for the statutory audit, i.e. work essential for the issuance of an Audit Report, as well as so-called audit consulting which is performed in connection with the audit engagement.
Duni_ÅR_13_EN.indd 70 2014-04-15 15:07

NOTE 12 – PERSONNEL (AVERAGE NUMBER)The average number of employees has been calculated as the number of hours worked divided by normal annual work time.
2013 2012
Men Women Total Men Women Total
Parent Company Sweden 62 68 130 66 60 126
Total Parent Company 62 68 130 66 60 126
Subsidiaries Austria 6 4 10 6 4 10
Belgium 6 5 11 7 4 11
Czech Republic 3 7 10 4 5 9
Denmark 7 4 11 9 4 13
Finland 9 10 19 9 10 19
France 12 29 41 12 29 41
Germany 491 326 817 492 338 830
Hungary 1 0 1 1 0 1
Italy 5 4 9 5 4 9
Netherlands 26 21 47 28 22 50
Norway 13 7 20 14 8 22
Poland 149 230 379 140 219 359
Russia 6 12 18 6 11 17
Singapore 26 7 33 – – –
Spain 7 5 12 8 5 13
Sweden 212 59 271 232 65 297
Switzerland 15 9 24 13 7 20
UK 26 13 39 29 13 42
Total, subsidiaries 1 020 752 1 772 1 015 748 1 763Total 1 082 820 1 902 1 081 808 1 889
NOTE 13 – SALARIES AND OTHER REMUNERATIONGroup Parent Company
SEK m 2013 2012 2013 2012
Salaries and other remuneration 673 653 86 71
Social security expenses 154 148 27 22
Pension expenses - contribution-based plans 31 30 14 10
Pension expenses - defined benefit plans 11 13 4 5
Total 869 845 131 108
Salaries and other remuneration to senior executives and other employees:
2013 2012
SEK m
Salaries and other
remunera-tion (of which
bonuses)Pension
expenses
Salaries and other
remunera-tion (of which
bonuses)Pension
expenses
Board, CEO, VPs, and other senior executives 30 (7) 4 26 (1) 5
Other employees 643 38 627 38
Group, total 673 42 653 43
7170
NOTES
Duni_ÅR_13_EN.indd 71 2014-04-15 15:07

Board fees as well as employment and termination terms and conditions for senior executives:The Group’s Board comprises 4 (2012: 5) persons, of whom 75% are men (2012: 60%).
Other senior executives, including the CEO, comprise 9 (2012: 8) persons, of whom 78% are men (2012: 88%). On September 1, board member Tina Andersson assumed the position of Corporate Market and Communications Director and joined the management group. She resigned from the Board at her own request and the seat is vacant until the next Annual General Meeting, to be held on May 6, 2014.
PrinciplesFees and other remuneration to the Board of Directors, including Duni’s Board Chairman, are decided upon by the Annual General Meeting (AGM). Pursuant to guidelines adopted by the AGM on May 2, 2013, remuneration to the CEO and other senior executives shall be on market terms and consist of basic salary, other benefits (including car benefit), other remuneration (including bonus, mileage compensation and vacation pay) and pension. At present, there are no long-term share-related incentive programs. ”Other senior executives” are those persons who, together with the CEO, constitute group management. Pension benefits and other remuneration to the CEO and other senior executives are payable as part of the total remuneration. Guidelines for remuneration to senior executives, which are proposed for adoption at the 2014 AGM, are in all essential respects the same as those which applied in 2013.
In accordance with a resolution adopted by the AGM on May 2, 2013, the annual fee for the current Chairman of the Board was set at SEK 500,000, while the annual fee for other directors shall be SEK 265,000 per director. In addition, fees shall be paid for committee work in the amount of SEK 55,000 to the Chairman of the Remuneration Committee and SEK 25,000 each to the other members of the Remuneration Committee, as well as SEK 107,000 to the Chairman of the Audit Committee and SEK 50,000 each to other members of the Audit Committee.
The Chairman of the Board received no remuneration other than fees for board work and committee work.The tables below specify the amounts by which the decided fees stated above were incurred in the 2013 and 2012 financial years.
Remuneration and other benefits during the year
2013, SEK ’000Basic salary /
board feePension
expense*Other
benefitsVariable remu-
neration**Severance
compensation Total
Chairman of the Board - Anders Bülow 575 – – – – 575
Director - Tina Andersson 210 – – – – 210
Director - Alex Myers 210 – – – – 210
Director - Pia Rudengren 372 – – – – 372
Director -Magnus Yngen 320 – – – – 320
CEO - Thomas Gustafsson 3 538 1 232 8 1 946 – 6 724
Other senior executives 10 658 2 527 461 4 603 – 18 249
TOTAL 15 883 3 759 469 6 549 – 26 660
* Of the Group’s pension expenses above, SEK 3 m relate to the Parent Company. ** Variable remuneration relates to bonuses booked as expenses for the 2013 financial year, which are paid out in 2014.
2012, SEK ’000Basic salary /
board feePension
expense*Other
benefitsVariable remu-
neration**Severance
compensation Total
Chairman of the Board - Anders Bülow 575 – – – – 575
Director - Tina Andersson 310 – – – – 310
Director - Thomas Gustafsson 285 – – – – 285
Director - Pia Rudengren 365 – – – – 365
Director - Magnus Yngen 313 – – – – 313
CEO - Fredrik von Oelreich, resigned on Dec 1, 2012 4 270 1 963 – – 8 120 14 353
CEO - Thomas Gustafsson assumed position on Dec 1, 2012 290 – – – – 290
Other senior executives 8 068 2 060 342 389 640 11 499
TOTAL 14 476 4 023 342 389 8 760 27 990
* Of the Group’s pension expenses above, SEK 1 m relate to the Parent Company. ** Variable remuneration relates to bonuses booked as expenses for the 2012 financial year, which are paid out in 2013.
BonusThe CEO and all senior executives are included in a bonus system which is based on profitability and capital tie-up targets, primarily with respect to their individual operational area but also Group targets. For the CEO and CFO, the variable remuneration is capped at 55% of basic salary. For other senior executives, the variable remuneration is capped at 45% of basic salary. The bonus system covers only one year each time following a decision by the Board of Directors. For the 2013 financial year, a bonus of SEK 1.9 m (2012: SEK 0 m) was paid to the CEO.
Duni_ÅR_13_EN.indd 72 2014-04-15 15:07

PensionsCEOThe CEO has an agreed retirement age of 65. The pension expense corresponds to the costs for a defined contribution plan. Until the agreed retirement age, Duni shall allocate each month an amount equal to 35% of the CEO’s annual gross salary and a three-year average of the bonus, paid into a designated occupational pension insurance scheme. The allocated occupational pension provision is fully tax-deductible for Duni. There are no other outstanding pension obligations to the CEO.
Other senior executivesSix other senior executives have defined contribution plans, while two have defined benefit plans. ”Pension entitlement salary” means fixed annual salary plus holiday pay, as well as an average of bonus payments received for the past three years. In addition, there are commitments regarding sickness pension and survivor’s pension. Each month, Duni pays a cash pension contribution in accordance with each senior executive’s individual pension plan. Pension is earned on a straight-line basis during the employment period, i.e. from the date of employment until retirement age. There are no outstanding pension obligations to other senior executives.
Severance compensationCEOThe CEO has a separate agreement regarding severance compensation. The severance compensation comprises payment for twelve months following a termination period of six months. Only the Company is entitled to trigger the agreement.
The CEO is entitled to terminate his employment on six months’ notice. There is no entitlement to severance compensation in the event of termination by the CEO.
Other senior executivesThe majority of the other senior executives have employment contracts which are terminable on six months notice, by either the Company or the executive. In the event of termination by the Company, the executive is entitled to severance compensation equal to 6 monthly salaries, which is included in the basis for pension computation. There are three exceptions to this arrangement: one executive is entitled to terminate on three months’ notice, and otherwise on the same terms as above; in the case of another executive, the employment is terminable on 12 month’s notice by the executive or the Company, without severance compensation; and in the case of the third executive, the employment is terminable by the executive on six months’ notice and by the Company on 12 months’ notice, without severance compensation.
Preparation and decision-making processThe Remuneration Committee prepares issues relating to remuneration for Duni’s senior executives based on the guidelines adopted by the AGM regarding remuneration for senior executives, and negotiates with the CEO regarding the latter’s salary.
The Remuneration Committee and its Chairman are appointed each year at the constituent Board meeting following election. The Committee comprises at least three of Duni’s directors, one of whom shall be the Chairman of the Board. Pursuant to Duni’s rules of procedure, the other members of the Remuneration Committee shall be independent in relation to the Company and company management. Duni reported a deviation from the Code between December 1, 2012 until the Annual General Meeting held on May 2, 2013 in connection with the appointment of Thomas Gustafsson (a director and member of the Remuneration Committee) as Duni’s new CEO. Thomas Gustafsson participates at meetings of the Remuneration Committee, except when questions are addressed which relate to the CEO’s remuneration. The HR Director serves as secretary at meetings of the Remuneration Committee. The Remuneration Committee shall meet at least three times per year.
Duni’s Remuneration Committee is responsible for preparing issues concerning remuneration and other benefits for company management. Decisions are thereafter taken by Duni’s Board. The Remuneration Committee also participates in the preparation of proposals regarding the adoption of any share-related incentive programs within Duni. In 2013, the Remuneration Committee held three meetings at which minutes were taken.
NOTE 14 – OTHER OPERATING INCOMEGroup Parent Company
SEK m 2013 2012 2013 2012
Administrative services – – 198 189
Other items 2 4 0 1
Total other operating income 2 4 198 190
7372
NOTES
Duni_ÅR_13_EN.indd 73 2014-04-15 15:07

NOTE 15 – OTHER OPERATING EXPENSESGroup Parent Company
SEK m 2013 2012 2013 2012
Exchange rate losses 1 0 1 4
Depreciation/amortization – – 100 100
Administrative services – – 62 57
Other items 8 81 5 17
Total other operating expenses 10 81 168 178
NOTE 16 – NET EXCHANGE RATE DIFFERENCES
Exchange rate differences have been reported in the income statement as follows:
Group Parent Company
SEK m 2013 2012 2013 2012
Operating income Change in fair value – currency derivatives 0 0 0 0
Other exchange rate differences in operating income -1 0 -1 -4
Total exchange rate differences in operating income -1 0 -1 -4
Financial items Change in fair value – currency derivatives – – – –
Exchange rate differences in financial items -4 -4 -4 -3
Total exchange rate differences in financial items -4 -4 -4 -3Total net exchange rate differences in income statement -5 -4 -5 -7
NOTE 17 – INCOME FROM FINANCIAL ITEMSGroup Parent Company
SEK m 2013 2012 2013 2012
Financial income Interest income, external investments 7 5 7 4
Interest income, Group companies – – 24 26
Total financial income 7 5 31 30
Financial expenses Interest expenses, external loans -12 -11 -11 -10
Interest expenses, pensions -7 -9 -4 -5
Interest expenses, Group companies – – 0 0
Interest expenses, interest rate swaps -2 -1 -2 -1
Change in fair value, currency forwards 3 -1 3 -1
Other financial expenses -8 -8 -10 -7
Total financial expenses -26 -30 -24 -22
The interest portion in the year’s pension expenses is reported among interest expenses. The rate of interest used in the Parent Company is 4.1% set by PRI (2012: 4.2%), calculated on the average of opening and closing balances on the item ”Pension provisions”.
Other financial income and expenses include reported bank charges as well as exchange rate effects on financial loans and investments. Since Duni is primarily a borrower, the entire effect is reported among interest expenses.
Duni_ÅR_13_EN.indd 74 2014-04-15 15:07

Income tax on the Group’s income before tax differs from the theoretical amount which would have arisen upon use of a weighted average tax rate for the income in the consolidated companies in accordance with the following:
Group Parent Company
SEK m 2013 2012 2013 2012Reported income before tax 350 202 176 110Tax according to applicable tax rate -81 -53 -39 -29Tax effect of non-deductible expenses -2 -4 -23 -27Tax effect of non-taxable income 3 7 25 41Effect of foreign tax rates 0 0 0 0Tax income/expenses due to changed tax rate -1 -30 0 -33Current tax attributable to previous years 0 1 – – Tax on income for the year according to the income statement -83 -79 -37 -48
Tax rateThe Parent Company’s applicable income tax rate is 22% (2012: 26.3%). As from January 1, 2013, the tax rate in Sweden (the Parent Company) was reduced to 22%.
Temporary differencesTemporary differences exist in those cases where the reported values and tax values of assets or liabilities differ. Changes are in deferred tax assets and liabilities during the year, without consideration being given to set-offs made under the same tax law.
NOTE 18 – INCOME FROM PARTICIPATIONS IN GROUP COMPANIESDuring the year, the Parent Company received dividends from subsidiaries amounting to SEK 109 m (2012: SEK 153 m).
NOTE 19 – INCOME TAXGroup Parent Company
SEK m 2013 2012 2013 2012
Current tax for the year -43 -48 0 0
Current tax attributable to previous years 0 1 – –
Deferred tax -40 -32 -37 -48
Tax on net income for the year -83 -79 -37 -48
Deferred tax in the income statement consists of the following items:
Group Parent Company
SEK m 2013 2012 2013 2012
Deferred tax, internal profit on inventories -1 -2 – –
Deferred tax, untaxed reserves -4 15 – –
Deferred tax, appraised loss carry-forwards -40 -45 -37 -51
Deferred tax, other 5 0 0 3
Total deferred tax -40 -32 -37 -48
7574
NOTES
Duni_ÅR_13_EN.indd 75 2014-04-15 15:07
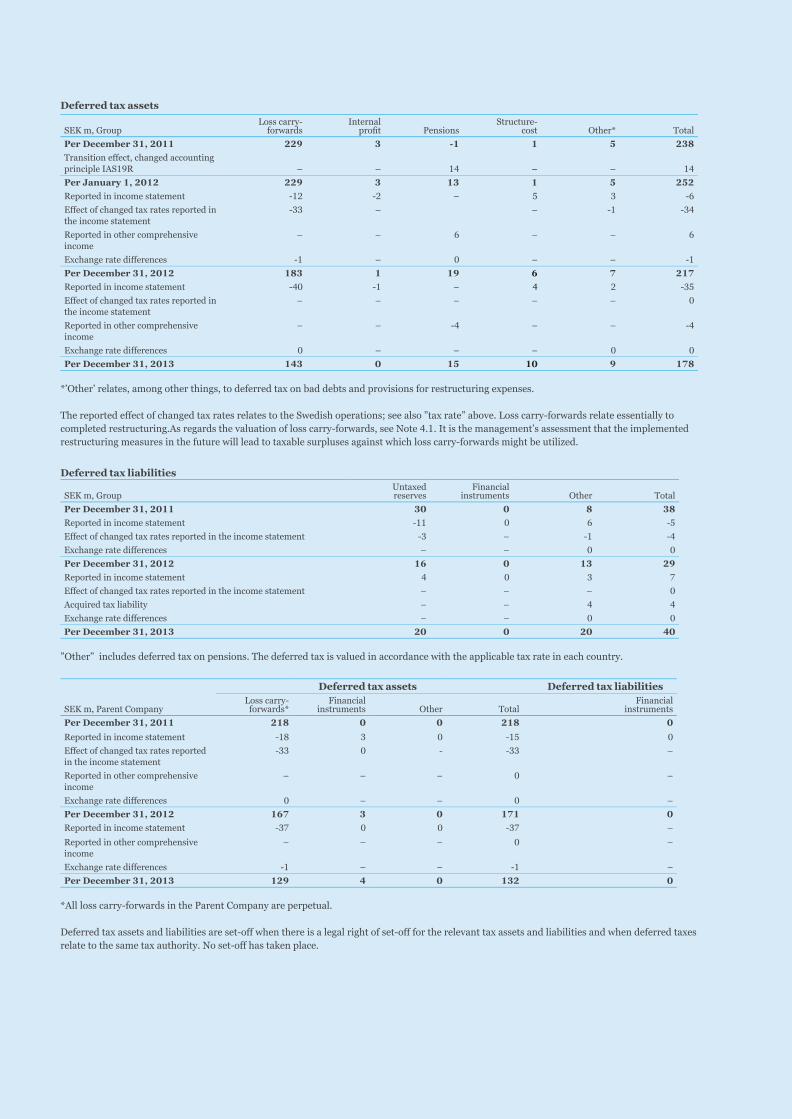
Deferred tax assets
SEK m, GroupLoss carry-
forwards Internal
profit Pensions Structure-
cost Other* TotalPer December 31, 2011 229 3 -1 1 5 238Transition effect, changed accounting principle IAS19R – – 14 – – 14Per January 1, 2012 229 3 13 1 5 252Reported in income statement -12 -2 – 5 3 -6Effect of changed tax rates reported in the income statement
-33 – – -1 -34
Reported in other comprehensive income
– – 6 – – 6
Exchange rate differences -1 – 0 – – -1Per December 31, 2012 183 1 19 6 7 217Reported in income statement -40 -1 – 4 2 -35Effect of changed tax rates reported in the income statement
– – – – – 0
Reported in other comprehensive income
– – -4 – – -4
Exchange rate differences 0 – – – 0 0Per December 31, 2013 143 0 15 10 9 178
*’Other’ relates, among other things, to deferred tax on bad debts and provisions for restructuring expenses.
The reported effect of changed tax rates relates to the Swedish operations; see also ”tax rate” above. Loss carry-forwards relate essentially to completed restructuring.As regards the valuation of loss carry-forwards, see Note 4.1. It is the management’s assessment that the implemented restructuring measures in the future will lead to taxable surpluses against which loss carry-forwards might be utilized.
Deferred tax liabilities
SEK m, GroupUntaxed reserves
Financial instruments Other Total
Per December 31, 2011 30 0 8 38 Reported in income statement -11 0 6 -5 Effect of changed tax rates reported in the income statement -3 – -1 -4Exchange rate differences – – 0 0Per December 31, 2012 16 0 13 29 Reported in income statement 4 0 3 7 Effect of changed tax rates reported in the income statement – – – 0Acquired tax liability – – 4 4Exchange rate differences – – 0 0 Per December 31, 2013 20 0 20 40
”Other” includes deferred tax on pensions. The deferred tax is valued in accordance with the applicable tax rate in each country.
Deferred tax assets Deferred tax liabilities
SEK m, Parent CompanyLoss carry-
forwards*Financial
instruments Other Total Financial
instrumentsPer December 31, 2011 218 0 0 218 0 Reported in income statement -18 3 0 -15 0Effect of changed tax rates reported in the income statement
-33 0 - -33 –
Reported in other comprehensive income
– – – 0 –
Exchange rate differences 0 – – 0 – Per December 31, 2012 167 3 0 171 0Reported in income statement -37 0 0 -37 –
Reported in other comprehensive income
– – – 0 –
Exchange rate differences -1 – – -1 –Per December 31, 2013 129 4 0 132 0
*All loss carry-forwards in the Parent Company are perpetual.
Deferred tax assets and liabilities are set-off when there is a legal right of set-off for the relevant tax assets and liabilities and when deferred taxes relate to the same tax authority. No set-off has taken place.
Duni_ÅR_13_EN.indd 76 2014-04-15 15:07

Reporting of expiration dates:Group Parent Company
SEK m 2013 2012 2013 2012
Deferred tax assets
Utilized after more than 12 months 137 171 106 135
Utilized within 12 months 41 46 26 35
Total 178 217 132 171
Deferred tax liabilities
Utilized after more than 12 months 20 16 – –
Utilized within 12 months 20 13 – –
Total 40 29 0 0
The net change regarding deferred taxes is as follows: Group Parent Company
SEK m 2013 2012 2013 2012
Opening balance 188 214 171 218Reported in income statement -38 -1 -37 -15
Effect of changed tax rates reported in the income statement
– -30 – -33
Reported in other comprehensive income -4 6 – 0
Acquired tax liability -4 – – –
Exchange rate differences 0 -1 -1 0
Closing balance 142 188 132 171
Tax regarding items reported directly against shareholders’ equityDeferred taxes reported in shareholders’ equity during the year amount to SEK 0 m (2012: SEK 0 m) in both the Group and the Parent Company.
NOTE 20 – SHARE CAPITAL AND EARNINGS PER SHAREOn December 31, 2013 the share capital consisted of 46,999,032 (2012: 46,999,032) shares of common stock. Each share carries an entitlement to one vote. All shares registered on the balance sheet date are fully paid up. On December 31, 2013 the quotient value of the shares was SEK 1.25 per share.
A specification of changes in shareholders’ equity is provided in the Consolidated Statement of Changes in Equity, which is presented immediately after the balance sheet.
Since Duni has had no outstanding convertible debentures or warrants, there has been no dilution of Duni’s shares in the 2013 and 2012 financial years.
Earnings per share, before and after dilutionEarnings per share before and after dilution are calculated based on the following income and number of shares:
2013 2012
Income attributable to the equity holders of the Parent Company (SEK m) 267 126
Weighted average number of outstanding shares of common stock (thousands) 46 999 46 999
Earnings per share, before and after dilution (SEK per share) 5.68 2.67
NOTE 21 – INTANGIBLE ASSETS
Group Parent Company
SEK m 2013 2012 2013 2012Goodwill Acquisition values Opening acquisition values 1 199 1 199 2 053 2 053Investments – – – –Increase through business acquisition 50 – – –Sales and disposals – – – –Translation differences – – – –Closing accumulated acquisition values 1 249 1 199 2 053 2 053 Amortization Opening accumulated amortization – – -1 653 -1 553Amortization for the year – – -100 -100Sales and disposals – – – –Translation differences – – – –Closing accumulated amortization 0 0 -1 753 -1 653Closing book value 1 249 1 199 300 400
7776
NOTES
Duni_ÅR_13_EN.indd 77 2014-04-15 15:07

Group Parent Company
SEK m 2013 2012 2013 2012Trademarks and licences Acquisition values Opening acquisition values 45 66 43 64 Investments 0 0 0 –Sales and disposals – -23 – -23Reclassifications 4 2 4 2
Translation differences 0 0 – –Closing accumulated acquisition values 49 45 48 43 Amortization Opening accumulated amortization -42 -65 -41 -63Amortization for the year -1 -1 -1 -1Sales and disposals – 23 – 23 Reclassifications – – – –Translation differences 0 0 – –Closing accumulated amortization -44 -42 -42 -41Closing book value 6 3 5 2
Group Parent Company
SEK m 2013 2012 2013 2012Capitalized development expenditures Acquisition values
Opening acquisition values 126 116 103 96Investments 7 5 – 1Sales and disposals – – – –Reclassifications 5 5 5 5 Translation differences 0 0 – –Closing accumulated acquisition values 138 126 108 103 Amortization Opening accumulated amortization -75 -60 -63 -48Amortization for the year -13 -14 -12 -14Sales and disposals – 0 – –Reclassifications – – – –Translation differences 0 0 – –Closing accumulated amortization -87 -75 -75 -63
Impairment Opening accumulated impairment -3 – -3 –
Impairment for the year – -3 – -3Translation differences – – – –Closing accumulated impairment -3 -3 -3 -3Closing book value 48 48 30 37 Intangible assets, total 1 327 1 250 335 439
Group Parent Company
SEK m 2013 2012 2013 2012Other intangible fixed assets, customer rela-tions
Acquisition values Opening acquisition values – – – –Investments – – – –Increase through business acquisition 25 – – –Sales and disposals – – – –Translation differences – – – –Closing accumulated acquisition values 25 0 0 0 Amortization Opening accumulated amortization Amortization for the year – – – –Sales and disposals – – – –Reclassifications – – – –Translation differences – – – –Closing accumulated amortization 0 0 0 0Closing book value 25 0 0 0
Duni_ÅR_13_EN.indd 78 2014-04-15 15:07

NOTE 22 – BUILDINGS, LAND AND LAND IMPROVEMENTS
Group Parent Company
SEK m 2013 2012 2013 2012Buildings Acquisition values Opening acquisition values 277 281 120 120
Investments 1 1 – –
Sales and disposals – 0 – –
Reclassifications 6 1 – –
Translation differences 6 -5 – –
Closing accumulated acquisition values 289 277 120 120
Depreciation Opening accumulated depreciation -109 -102 -101 -98
Depreciation for the year -6 -7 -2 -2
Sales and disposals – 0 – –
Reclassifications – – – –
Translation differences 0 0 – –
Closing accumulated depreciation -116 -109 -102 -101
Impairment Opening accumulated impairment -16 – -16 –
Impairment for the year – -16 – -16
Transation differences – – – –
Closing accumulated impairment -16 -16 -16 -16Closing book value 157 151 1 3
In 2005, the EU introduced an emission rights system as a method for restricting carbon dioxide emissions. For the period 2008 up to and including 2012, Rexcell Tissue & Airlaid AB was allocated a total of 84,665 tonnes: Dals Långed 2,779 tonnes per year and Skåpafors 14,154 tonnes per year. The allocation for 2013 is 2,318 tonnes for Dals Långed and 19,840 tonnes for Skåpafors. The allocation will gradually diminish up to 2020. The 2020 allocation is 2,027 tonnes/year for Dals Långed and 17,349 tonnes/year for Skåpafors. In total, 14,104 tonnes were consumed in 2013 and 14,696 tonnes in 2012. Received emission rights are reported as intangible assets booked at an acquisition value of zero.
Tests for impairment of goodwillTests for impairment of goodwill were carried out at the end of the financial year on December 31, 2013 and December 31, 2012. With the implementation of IFRS, allocation of the Group’s goodwill items has taken place through the use of allocation ratios; see Note 4.2.
During 2013, Duni acquired the assets of Song Seng Associates Pte Ltd and an acquisition goodwill of SEK 50 m arose. For more information, see Note 38 Acquisition Analysis.
Goodwill is allocated on the Group’s cash-generating units identified per business area as follows:
SEK m 2013 2012
Professional 1 249 1 199
Tests for impairment of goodwill take place annually and where there are indications of impairment. Recoverable amounts for cash-generating units are determined based on estimated use values. The calculations are based on estimated future cash flows before tax, based on financial forecasts approved by company management and which cover the current year as well as a five-year period. Cash flows beyond this period are extrapolated using an assessed growth rate. The growth rate does not exceed the long-term growth rate for the industry as a whole. During the period covered by the forecast, the growth rate for the Professional business area is estimated at an average of 2.0% (2012: 2.2%) per year and at 1.0% (2012: 1.0%) as a weighted average rate of growth beyond the period covered by the forecast.
Important assumptions which are used for calculations of use values are primarily profit margin, growth rate and a nominal discount rate of 11.4% (2012: 11.4%). The discount rate before tax is used in conjunction with present value calculation of estimated future cash flows.
Company management has established profit margin and growth rate based on previous results and its expectations as regards market growth. The discount rates used are stated before tax and reflect specific risks in the business area.
Company management believes that reasonable possible changes in the significant assumptions used in the calculations would not have such a major impact as to reduce per se the recovery value to a value which is below the reported value.
7978
NOTES
Duni_ÅR_13_EN.indd 79 2014-04-15 15:07
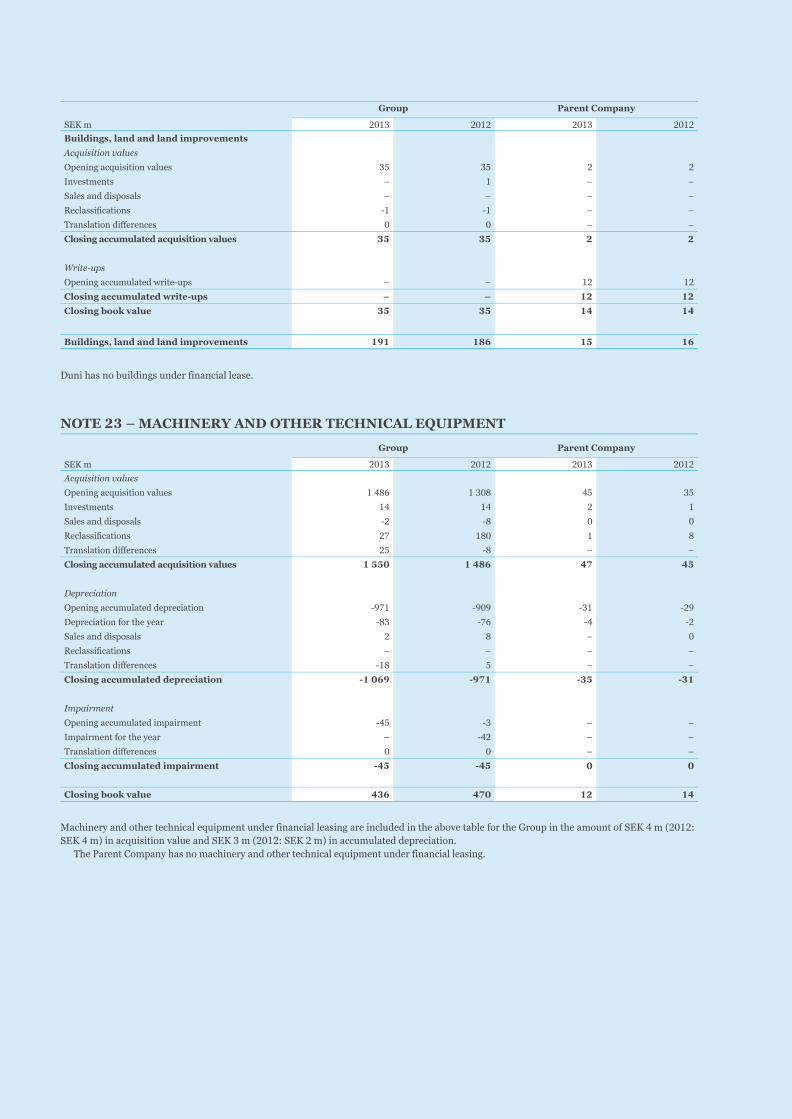
NOTE 23 – MACHINERY AND OTHER TECHNICAL EQUIPMENT
Group Parent Company
SEK m 2013 2012 2013 2012Acquisition values Opening acquisition values 1 486 1 308 45 35
Investments 14 14 2 1
Sales and disposals -2 -8 0 0
Reclassifications 27 180 1 8
Translation differences 25 -8 – –
Closing accumulated acquisition values 1 550 1 486 47 45
Depreciation Opening accumulated depreciation -971 -909 -31 -29
Depreciation for the year -83 -76 -4 -2
Sales and disposals 2 8 – 0
Reclassifications – – – –
Translation differences -18 5 – –
Closing accumulated depreciation -1 069 -971 -35 -31
Impairment Opening accumulated impairment -45 -3 – –
Impairment for the year – -42 – –
Translation differences 0 0 – –
Closing accumulated impairment -45 -45 0 0
Closing book value 436 470 12 14
Machinery and other technical equipment under financial leasing are included in the above table for the Group in the amount of SEK 4 m (2012: SEK 4 m) in acquisition value and SEK 3 m (2012: SEK 2 m) in accumulated depreciation.
The Parent Company has no machinery and other technical equipment under financial leasing.
Group Parent Company
SEK m 2013 2012 2013 2012Buildings, land and land improvements
Acquisition values
Opening acquisition values 35 35 2 2
Investments – 1 – –
Sales and disposals – – – –
Reclassifications -1 -1 – –
Translation differences 0 0 – –
Closing accumulated acquisition values 35 35 2 2
Write-ups Opening accumulated write-ups – – 12 12
Closing accumulated write-ups – – 12 12Closing book value 35 35 14 14
Buildings, land and land improvements 191 186 15 16
Duni has no buildings under financial lease.
Duni_ÅR_13_EN.indd 80 2014-04-15 15:07
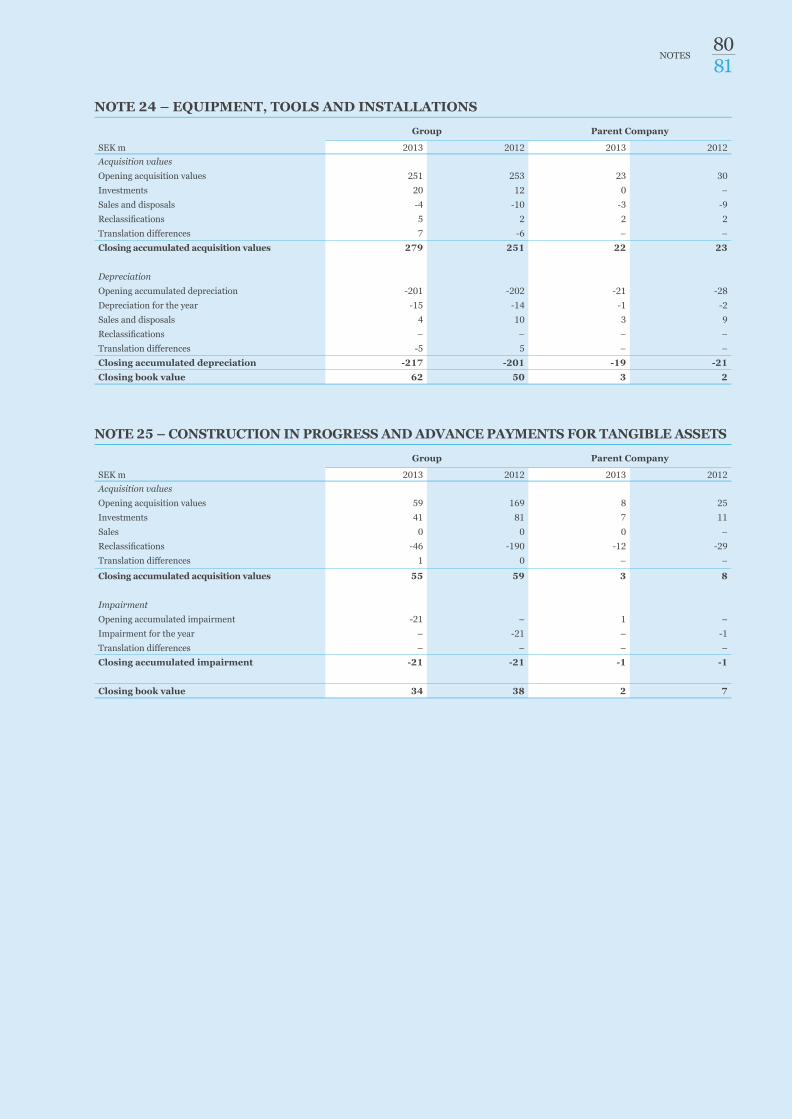
NOTE 25 – CONSTRUCTION IN PROGRESS AND ADVANCE PAYMENTS FOR TANGIBLE ASSETS
Group Parent Company
SEK m 2013 2012 2013 2012Acquisition values Opening acquisition values 59 169 8 25
Investments 41 81 7 11
Sales 0 0 0 –
Reclassifications -46 -190 -12 -29
Translation differences 1 0 – –
Closing accumulated acquisition values 55 59 3 8
Impairment Opening accumulated impairment -21 – 1 –
Impairment for the year – -21 – -1
Translation differences – – – –
Closing accumulated impairment -21 -21 -1 -1
Closing book value 34 38 2 7
NOTE 24 – EQUIPMENT, TOOLS AND INSTALLATIONS
Group Parent Company
SEK m 2013 2012 2013 2012Acquisition values Opening acquisition values 251 253 23 30
Investments 20 12 0 –
Sales and disposals -4 -10 -3 -9
Reclassifications 5 2 2 2
Translation differences 7 -6 – –
Closing accumulated acquisition values 279 251 22 23
Depreciation Opening accumulated depreciation -201 -202 -21 -28
Depreciation for the year -15 -14 -1 -2
Sales and disposals 4 10 3 9
Reclassifications – – – –
Translation differences -5 5 – –
Closing accumulated depreciation -217 -201 -19 -21Closing book value 62 50 3 2
8180
NOTES
Duni_ÅR_13_EN.indd 81 2014-04-15 15:07

NOTE 27 – OTHER LONG-TERM RECEIVABLES
Group Parent Company
SEK m 2013 2012 2013 2012Loan claims 1 2 0 2Financial receivables from Group companies – – 1 073 1 033Total other long-term receivables 1 2 1 073 1 035
Loan claims are valued at accrued acquisition value. Loan claims mainly carry variable interest and thus the fair value is assessed as correspon-ding to the book value.
NOTE 28 – ACCOUNTS RECEIVABLE AND OTHER RECEIVABLES
Group Parent Company
SEK m 2013 2012 2013 2012Accounts receivable 658 624 94 98Receivables from Group companies – – 51 57Other receivables 75 71 18 17Current financial receivables, internal – – 201 205
Total accounts receivable and other receivables 733 695 364 377
Regarding credit risks and exposures, see Note 3.1.2.
Other receivables above relate to:Group Parent Company
SEK m 2013 2012 2013 2012Receivables from suppliers 6 8 – –VAT claims 50 38 18 17Factoring 5 6 – –Other receivables 14 19 – 0Total other receivables 75 71 18 17
NOTE 26 – PARTICIPATIONS IN GROUP COMPANIES
Registration number Registered officeNumber of shares and participations Equity, %
Book value, SEK ’000
Swedish subsidiaries Rexcell Tissue & Airlaid AB 556193-9769 Bengtsfors 12 000 100 81 440Finess Borrby AB 556262-2604 Malmö 1 000 100 0
81 440Foreign subsidiaries Duni Holding BV 23068767 Breda, NL 260 731 100 597 856 - Duni Verwaltungs GmbH Osnabrück HRB 19689 Bramsche, DE ( 100 ) (€ 20 467) - Duni Holding S.A.S 3493 0993 000064 Ste Helene du Lac, FR ( 100 ) (€ 2 871) - Duni Benelux B.V. 23052488 Breda, NL ( 100 ) (€ 7 250) - Duni Ltd. 897172 Runcorn, GB ( 100 ) (€ 8 395) - Duni A/S 10 99 98 98 Köpenhamn, DK ( 100 ) (€ 1 377) - Duni AS 962346057 Oslo, NO ( 100 ) (€ 370) - Duni OY 0864585-8 Helsingfors, FI ( 100 ) (€ 1 578) - Duni Holding Asia &Pacific Pte Ltd. 201316245E Singapore, SG ( 100 ) (€ 62)Duni Iberica S.L. B60689692 Barcelona, ES 200 000 100 23 176Duni Poland Sp. z o.o. KRS no. 40401 Poznan, PL 15 300 100 48 133Duni Sales Poland Sp. z o.o. KRS no. 254481 Poznan, PL 1 000 100 1 190Duni EFF Sp. z o.o. KRS no. 249084 Poznan, PL 1 000 100 1 130Duni (CZ) s.r.o. 65410106 Kladno, CZ 1 100 6 740Duni AG 212544 Rotkreutz, CH 400 100 578Duni ZAO 7816110025 Moskva, RU 1 100 11Duni Beteiligungsgesellschaft mbH Osnabrück HR B20099 Bramsche, DE 1 100 3 076Duni OY – Helsingfors, FI 6 443 688 333Participations in Group Companies 769 773
Parent CompanySEK '000 2013 2012Opening value, participations in Group companies 769 773 769 773Investments for the year – –Shareholders' contributions – –Divestments for the year – –Impairment for the year – –Closing value, participations in Group companies 769 773 769 773
Duni_ÅR_13_EN.indd 82 2014-04-15 15:07

Aging of impaired accounts receivable:Group Parent Company
SEK m 2013 2012 2013 2012Less than 3 months 3 4 – –
3-6 months 4 4 – –
More than 6 months 10 6 1 1
Total 16 14 1 1
Specification of bad debt provisions:Group Parent Company
SEK m 2013 2012 2013 2012Opening balance 9 8 1 2
Provision for bad debts 7 5 0 –
Claims written-off during the year -1 -3 0 -1
Reversed non-utilized amount -4 -2 – 0
Closing balance 12 9 1 1
Provisions for the respective reversal of reserves for bad debts are included in the item ”Selling expenses” in the income statement.In other categories within accounts receivable and other receivables, no assets are included for which a need for write-down exists.The maximum exposure for credit risks as per the balance sheet date is the fair value for each category of receivables mentioned above. The
Group holds no assets pledged as security.
Reported amounts, per currency, for the Group’s accounts receivable:Group Parent Company
SEK m 2013 2012 2013 2012SEK 65 63 33 33
EUR 406 391 13 13
GBP 60 54 0 0
DKK 24 26 24 26
NOK 24 26 23 26
PLN 26 15 0 0
Other currencies* 54 49 0 0
Total 658 624 94 98
*”Other currencies” refers to CHF, CZK, RUB, USD, etc.
Credit exposure:Group Parent Company
SEK m 2013 2012 2013 2012Accounts receivable not due or impaired 598 560 90 92
Accounts receivable due but not impaired 56 58 5 6
Impaired accounts receivable 16 14 1 1
Provision for bad debts -12 -9 -1 -1
Total accounts receivable 658 624 94 98
The credit risk associated with accounts receivable that are neither due nor impaired is not deemed to be so great. 29% of total accounts receivable which are not due or impaired have a rating of AA or higher. Due to the geographical spread, the history Duni possesses regarding its customers and the improbability of all customers encountering payment difficulties at the same time, Duni sees no reason for impairment in this category. No individual debt exceeds 4.4% (2012: 5.2%) of the total accounts receivable that are neither due nor impaired.
Aging of accounts receivable overdue but not impaired:Group Parent Company
SEK m 2013 2012 2013 2012Less than 1 month 39 50 4 6
1-3 months 18 5 2 0
3-6 months 1 2 0 0
More than 6 months -1 0 -1 0
Total 56 58 5 6
On December 31, 2013, the provisions for bad debts amounted to SEK 12 m (2012: SEK 9 m). The individually assessed receivables in respect of which the need for impairment is deemed to exist relate primarily to wholesalers who have unexpectedly encountered financial difficulties. The assessment has been made that some of the claims are expected to be recoverable.
8382
NOTES
Duni_ÅR_13_EN.indd 83 2014-04-15 15:07
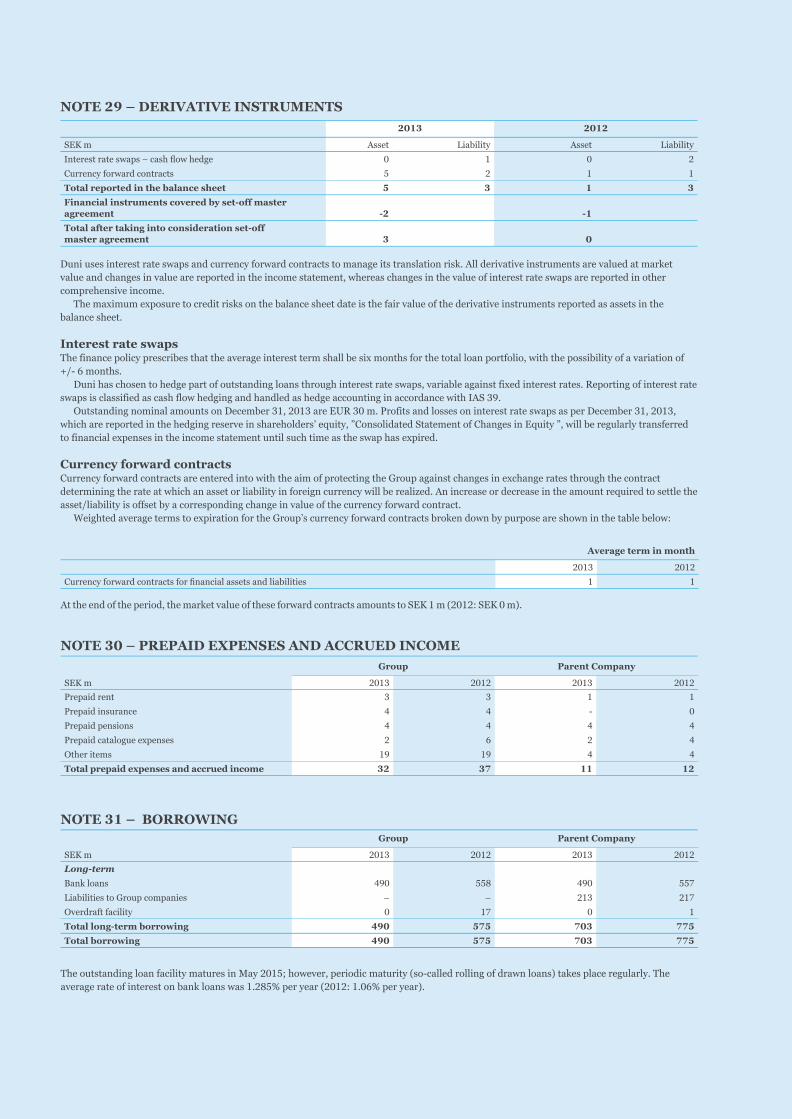
Duni uses interest rate swaps and currency forward contracts to manage its translation risk. All derivative instruments are valued at market value and changes in value are reported in the income statement, whereas changes in the value of interest rate swaps are reported in other comprehensive income.
The maximum exposure to credit risks on the balance sheet date is the fair value of the derivative instruments reported as assets in the balance sheet.
Interest rate swapsThe finance policy prescribes that the average interest term shall be six months for the total loan portfolio, with the possibility of a variation of +/- 6 months.
Duni has chosen to hedge part of outstanding loans through interest rate swaps, variable against fixed interest rates. Reporting of interest rate swaps is classified as cash flow hedging and handled as hedge accounting in accordance with IAS 39.
Outstanding nominal amounts on December 31, 2013 are EUR 30 m. Profits and losses on interest rate swaps as per December 31, 2013, which are reported in the hedging reserve in shareholders’ equity, ”Consolidated Statement of Changes in Equity ”, will be regularly transferred to financial expenses in the income statement until such time as the swap has expired.
Currency forward contracts Currency forward contracts are entered into with the aim of protecting the Group against changes in exchange rates through the contract determining the rate at which an asset or liability in foreign currency will be realized. An increase or decrease in the amount required to settle the asset/liability is offset by a corresponding change in value of the currency forward contract.
Weighted average terms to expiration for the Group’s currency forward contracts broken down by purpose are shown in the table below:
Average term in month
2013 2012
Currency forward contracts for financial assets and liabilities 1 1
At the end of the period, the market value of these forward contracts amounts to SEK 1 m (2012: SEK 0 m).
NOTE 30 – PREPAID EXPENSES AND ACCRUED INCOMEGroup Parent Company
SEK m 2013 2012 2013 2012Prepaid rent 3 3 1 1
Prepaid insurance 4 4 - 0
Prepaid pensions 4 4 4 4
Prepaid catalogue expenses 2 6 2 4
Other items 19 19 4 4
Total prepaid expenses and accrued income 32 37 11 12
NOTE 31 – BORROWING Group Parent Company
SEK m 2013 2012 2013 2012Long-term
Bank loans 490 558 490 557
Liabilities to Group companies – – 213 217
Overdraft facility 0 17 0 1
Total long-term borrowing 490 575 703 775Total borrowing 490 575 703 775
The outstanding loan facility matures in May 2015; however, periodic maturity (so-called rolling of drawn loans) takes place regularly. The average rate of interest on bank loans was 1.285% per year (2012: 1.06% per year).
NOTE 29 – DERIVATIVE INSTRUMENTS 2013 2012
SEK m Asset Liability Asset Liability
Interest rate swaps – cash flow hedge 0 1 0 2
Currency forward contracts 5 2 1 1
Total reported in the balance sheet 5 3 1 3Financial instruments covered by set-off master agreement -2 -1 Total after taking into consideration set-off master agreement 3 0
Duni_ÅR_13_EN.indd 84 2014-04-15 15:07

With respect to borrowing, Duni’s exposure on the balance sheet date to changes in interest rates and contractual dates for interest renegotiation was as follows:
SEK m 2013 20126 months or less 0 0Total 0 0
Duni’s borrowing is valued at the accrued acquisition value applying the effective annual interest rate method. The difference between the values reported in the balance sheets for December 31, 2013 and the nominal values consists of transaction costs.
Duni’s accrued interest is reported as accrued expenses. Shown below are the nominal values excluding accrued interest and reported values for Duni’s borrowing.
Fair valuesCurrent financingDuni’s long-term bank loans and overdraft facility, amounting to SEK 490 m (2012: SEK 575 m) carry variable interest which is determined in conjunction with each loan period and an essentially unchanged credit margin. The discount effect for such a relatively short period of time and an unchanged credit margin is insignificant and thus the fair value corresponds to the nominal value plus accrued interest.
2013 2012
SEK mReported
valueNominal
valueReported
valueNominal
valueBank loans 490 492 558 560Overdraft facility 0 0 17 17Leasing 2 2 0 0Total 493 494 575 577
Reported amounts, per currency, for the Group’s borrowing are as follows:
SEK m 2013 2012EUR 490 558Other currencies 3 17Total 493 575
Bank loansDuni has a revolving credit facility in a nominal amount of EUR 130 m which extends until May 2015. The interest rate is variable and set as EURIBOR, until the next rolling plus a margin.
Overdraft facility On behalf of the Group, the Parent Company has taken out an overdraft facility in a nominal amount of SEK 81 m. As per December 31, 2013, the sum utilized was SEK 0 m.
NOTE 32 – CLASSIFICATION OF FINANCIAL INSTRUMENTS
Group Parent Company
SEK m 2013 2012 2013 2012Assets Non-financial assets
Tangible and intangible fixed assets 2 050 1 994 367 478Deferred tax asset 178 217 132 171Other financial fixed assets – – 770 770Inventories 434 387 91 73Prepaid expenses and accrued income 32 37 11 12Total non-financial assets 2 694 2 635 1 371 1 504
Loans and receivables
Other long-term receivables 1 2 1 2Accounts receivable 658 624 94 98Tax assets 37 21 5 4Other receivables 75 68 18 17Receivables from Group companies – – 1 324 1 295Cash and cash equivalents/Cash and bank balances 225 181 164 130Total loans and receivables 996 896 1 606 1 545
Assets at fair value through profit or loss
Derivative instruments 5 1 5 1Total assets and fair value through profit or loss 5 1 5 1Total assets 3 695 3 531 2 982 3 050
Duni has no assets which are classified as ”Derivatives used for hedging” and ”Held for trading”.
8584
NOTES
Duni_ÅR_13_EN.indd 85 2014-04-15 15:07

Group Parent Company
SEK m 2013 2012 2013 2012Liabilities Non-financial liabilities
Deferred tax liability 40 29 – –Pension provisions 223 246 109 112Allocation to restructuring reserve 21 17 5 6Total non-financial liabilities 284 293 114 118
Liabilities at amortized cost
Overdraft facility 0 17 0 1Bank loans 490 558 490 557Accounts payable 348 301 52 53Tax liabilities 9 3 – –Other liabilities 82 50 18 11Liabilities to Group companies – – 272 267Accrued expenses and deferred income 381 320 83 66Total liabilities at amortized cost 1 310 1 250 915 957
Derivative instruments used for hedging purposes Derivative instruments 2 2 3 2Total derivative instruments used for hedging purposes 2 2 3 2
Liabilities valued at fair value through profit or loss Derivative instruments 0 1 0 1Total liabilities at fair value through profit or loss 0 1 0 1Total liabilities 1 596 1 546 1 032 1 078
NOTE 33 – PENSION PROVISIONSCompensation for pensions and other compensation after employment is mainly paid through contribution-based plans in which regular payments are made to authorities and insurance companies. These independent bodies thereby assume the obligations vis-à-vis the employees. Within the Group, there are also a number of benefit-based plans under which the employees are guaranteed a pension corresponding to a percentage of salary.
Provisions for pensions and similar obligations
GroupSEK m 2013 2012
Defined benefit plans 223 246
Defined benefit plans Within the Group, there are a number of defined benefit plans where, after completion of employment, the employees are entitled to compensa-tion based on final salary and period in employment. The largest plans relate to Sweden (representing approximately 40% of the total pension plan), Germany, the UK, the Netherlands, and Belgium. The plans are consolidated externally, with the plan assets being held by foundations or similar legal entities. The activities of the foundations are governed by national rules and practice as regards the relationship between the Group and manager (or equivalent) of the foundation’s plan assets, and the composition of plan assets in terms of different types of assets.
Commencing January 1, 2013, Duni applies the revised IAS 19 Employee Benefits (IAS19R). This entails that previously non-reported actuarial losses are reported at the time of transition and that actuarial gains and losses which arise in the future will be reported in ’Other comprehensive income’. Comparison figures for 2012 have been recalculated in accordance with IAS19R.
Pension insurance with AlectaObligations regarding retirement pensions and family pensions for white collar staff in Sweden are secured through insurance with the independent insurance company, Alecta. According to a statement issued by the Swedish Financial Reporting Board, URF 3, this is a defined benefit plan which covers several employers. Duni does not have access to such information as makes it possible to report this plan as a defined benefit plan. The pension plan according to ITP2, which is secured through insurance with Alecta, is thus reported as a defined contribution plan. The premium for the defined benefit retirement and family pension is calculated on an individual basis and depends, among othe things, on salary,previously earned pension entitlement, and expected remaining period of employment. Expected fees for the next reporting period for ITP2 policies taken out with Alecta amount to SEK 3 m (2012: SEK 3 m).
Alecta’s surplus may be divided among the policy holders and/or the insured. As per December 31, 2013, Alecta’s surplus in the form of the collective funding level amounted to 148% (2012: 129%). The collective funding level constitutes the market value of Alecta’s assets as a percentage of the insurance obligations, calculated in accordance with Alecta’s actuarial calculation assumptions, which do not correspond to IAS 19.
Duni_ÅR_13_EN.indd 86 2014-04-15 15:07

The expenses regarding defined benefit plans are allocated in the consolidated income statement on the following items:
Defined benefit plans
SEK m 2013 2012
Operating income -4 -4
Financial expenses -7 -9
Total expenses from defined benefit plans in the income statement -11 -13
The change in the defined benefit obligation during the year is as follows:
Defined benefit plans
SEK m 2013 2012 (recalculated)
At beginning of year 381 328
Employment expenses during current year 4 3
Interest expenses 12 14
Reappraisals, losses (+)/gains (-) -12 57
Exchange rate differences 8 -6
Disbursed benefits -15 -15
Settlements 1 0
At year-end 379 381Experience-based adjustments of defined benefit obligations -2 2
Reappraisals entail gains/losses as a consequence of changed demographic assumptions, financial assumptions and experience-based gains/losses.
The change in fair value of plan assets during the year is as follows:
SEK m 2013 2012
At beginning of year -135 -104
Interest income -5 -4
Actuarial losses (+)/gains (-) -5 -23
Exchange rate differences -5 3
Employer's contributions -8 -8
Employees' contributions -1 -1
Disbursed benefits 3 3
Settlements 0 -1
At year-end -156 -135Experienced-based adjustments of plan asset -5 -23
The plan assets are located primarily in UK and Holland. In Holland and Germany, funding consists primarily of plan assets which provide a guaranteed annual return with the possibility of a bonus decided on annually by the insurance company. In the UK, 65% of the plan assets are invested in equity instruments, 20% in bonds, and 14% in real estate. A essentially unchanged distribution from previous year.
Contributions to defined benefit plans in 2014 are expected to reach the same level as in 2013.The weighted average term for pension obligations in 16.4 years.
The amounts reported in the consolidated balance sheet consist of:
Defined benefit plans
SEK m 2013 2012 (recalculated) Present value of funded obligations 181 166Fair value of plan assets -156 -135Present value of underfunded obligations 198 215Net debt in the balance sheet 223 246
Total pension expenses reported in the consolidated income statement are as follows:
SEK m 2013 2012
Costs relating to employment during the current year -4 -3
Interest expenses -12 -14
Interest income 5 4
Actuarial net gains reported for the year – 0
Total pension expenses for the year regarding defined benefit plans -11 -13Pension expenses of the year regarding defined contribution plans -31 -30
Total expenses for the year, including personnel expenses (Note 13) -42 -43 The year’s reappraisal of pension plans reported in Other comprehensive income 17 -34
8786
NOTES
Duni_ÅR_13_EN.indd 87 2014-04-15 15:07

Actuarial assumptions on the balance sheet date
Sweden Germany UK Netherlands Belgium
Discount rate 3.6 % (3.1) 2.8 % (2.8) 4.5 % (4.4) 3.6 % (3.5) 2.8 % (2.4)
Expected return on plan assets – 2.8 % (2.8) 4.5 % (4.4) 3.6 % (3.5) 2.8 % (2.4)
Future annual salary increases 0.0 % (0.0) 0.0 % (0.0) 4.1 % (3.7) 2.5 % (2.5) 3.0 % (3.0)
Future annual pension increases 1.4 % (1.5) 2.0 % (2.0) 3.35 % (2.9) 0.0 % (0.0) 0.0 % (0.0)
Personnel turnover 0.0 % (0.0) 0.0 % (0.0) 0.0 % (0.0) 0.0 % (0.0) 0.0 % (0.0)
The assumptions regarding future lifespan are based on public statistics and experiences from mortality studies in each country, and are established in consultation with actuarial experts.
Through its defined benefit pension plans, Duni is exposed to a number of risk, the most important of which are the following:
Asset volatility: The plan’s liabilities are calculated applying a discount rate which is based on corporate bonds. If the plan assets do not achieve a corresponding return, a deficit arises. In the short term, this can result in volatility, but since the liability in the pension plan is long-term in nature, investments in, e.g. equity instruments are appropriate for managing the plan efficiently and for obtaining the best return.
Changes in the yield on the bonds: A reduction in the interest rate paid on corporate bonds will result in an increase in the liabilities in the plans.
Inflation risk: Certain of the plan’s pension obligations are linked to inflation, with higher inflation resulting in greater liabilities. Most of the plan assets are either unaffected by inflation (fixed interest on bonds) or have a weak correlation to inflation (equities), entailing that an increase in inflation will also increase the deficit.
Lifespan assumptions: Most of the pension obligations entail that the employees covered by the plan will receive lifelong benefits, and consequently increased lifespan assumptions result in higher pension liabilities. This is particularly important in the Swedish plans, with increases in inflation resulting in greater sensitivity to changes in lifespan assumptions.
Summary per country, 2013
SEK m Sweden Germany UK Netherlands Belgium Total
Present value of defined benefit obligations 144 53 104 73 5 379
Fair value of plan assets – 0 -90 -62 -4 -156
Total, defined benefit pension plans per country 144 53 14 11 1 223
Discount rate sensitivity in the determined benefit obligation (DBO):
Change in assumption
Increase in assumption
Decrease in assumption
Discount rate +/- 1.0% Decrease by 13.9% Increase by 16.9%
If the expected lifespan in the Swedish pension plan were to increase by 1 year from the assumption, the Swedish pension plan would increase by 5.3%.If the pension increases in the Swedish pension plan were to increase by 1% from the assumption, the Swedish pension plan would increase by 13.9%.If the pension increases in the Swedish pension plan were to decrease by 1% from the assumption, the Swedish pension plan would decrease by 11.7%.The sensitivity analysis assumes all other assumptions unchanged.
Provisions in accordance with the Swedish Pension Obligations (Security) Act
Parent Company
SEK m 2013 2012
FPG/PRI-pensions 112 112
Liability in the balance sheet 112 112
The following amounts are reported in the Parent Company’s income statement :
SEK m 2013 2012
Earned during the year 0 0
Interest expenses -4 -5
Pension expenses for the year -4 -5
The change in the defined benefit during the year is as follows:
SEK m 2013 2012
At beginning of year 112 114
Net expense reported in the income statement 4 5
Disbursed benefits -7 -7
Settlements 0 0
At year-end 109 112
The liability in the Parent Company relates to pension obligations at PRI.
Duni_ÅR_13_EN.indd 88 2014-04-15 15:07

NOTE 34 – ACCRUED EXPENSES AND DEFERRED INCOMEGroup Parent Company
SEK m 2013 2012 2013 2012Accrued personnel expenses 135 105 33 21
Accrued interest expenses 1 0 0 0
Accrued expenses, invoices 61 46 20 15
Accrued expenses, freight 9 5 2 2
Accrued liabilities to customers 156 145 23 24
Other items 20 17 5 5
Total accrued liabilities and deferred income 381 320 83 66
NOTE 35 – PLEDGED ASSETS AND CONTINGENT LIABILITIES
Pledged assetsThe Group and the Parent Company had no pledged assets in 2013 or 2012.
Contingent liabilitiesGroup Parent Company
SEK m 2013 2012 2013 2012Guarantees 52 55 50 53
FPG/PRI 3 3 2 2
Total contingent liabilities 55 58 52 55
Of the guarantees in the Parent Company, SEK 50 m (2012: SEK 53 m) are pledged to the benefit of group companies. Guarantees in the Parent Company relate primarily to local customs and excise of SEK 12 m (2012: SEK 14 m).
Duni has an environmental policy and has implemented control systems which assist Duni in ensuring compliance with environmental legislation. Duni considers the existing operations and production plants to fulfill in all essential respects requirements stipulated in environme-ntal legislation and provisions which extend to Duni. However, Duni cannot guarantee that currently unknown obligations, for example cleanup or restoration of property owned or previously owned by Duni, cannot arise in the future. Discussion are taking place with responsible authori-ties concerning allocation of responsibility and technical investigation of suspected past soil contamination on two properties owned by Duni AB.
Through an amalgamated company which is no longer owned by the Group, Duni AB has become a party to a preliminary investigation concerning suspected past soil contamination. A technical investigation has been completed and the risk is currently regarded as minimal since no further demands for investigation or rectification are anticipated.
No significant liabilities are expected to rise as a consequence of any of the above types of contingencies.
NOTE 36 – ADJUSTMENTS FOR ITEMS NOT INCLUDED IN THE CASH FLOWGroup Parent Company
SEK m 2013 2012 2013 2012Depreciation/amortization 118 112 120 122
Impairment, fixed assets – 83 – 16
Impairment, inventory – 10 – –
Restructuring 3 7 1 -1
Pension provisions -12 -19 4 5
Other -3 -5 8 10
Total 106 188 133 152
NOTE 37 – OBLIGATIONS
Operational leasing agreementsDuni rents a number of offices and warehouses as well as passenger cars, primarily for the sales organization. In addition, certain machinery is leased in the production operations. ”Agreements” means non-terminable operational leasing agreements. Leasing agreements have varying terms, index clauses and rights of extension. The terms are market terms as regards prices and length of the agreements.
The nominal value of future minimum leasing charges, with respect to non-terminable leasing agreements, is broken down as follows:
Group Parent Company
SEK m 2013 2012 2013 2012Payable within one year 53 58 9 8
Payable later than one but within five years 72 96 8 12
Payable later than five years 26 31 – –
Total 151 185 17 20Of which leasing agreements signed during the year 18 90 4 18
Total expenses relating to operational leasing agreements during the year amount to SEK 75 m (2012: SEK 86 m) in the Group and SEK 20 m (2012: SEK 20 m) in the Parent Company.
8988
NOTES
Duni_ÅR_13_EN.indd 89 2014-04-15 15:07

NOTE 38 – ACQUISITIONSOn July 1, 2013, Duni acquired the assets of Song Seng Associates Pte Ltd in Singapore, which is a leading supplier of single-use packaging for food and drink in Singapore, with a growing export market in Southeast Asia. As a result of the acquisition, Duni is expected to strengthen its presence on these markets. Duni Song Seng is consolidated within the Professional business area.
Purchase price, SEK ’000
Cash and equivalents 57 151
Conditional purchase price 19 152
Total purchase price 76 302
Reported amount of identifiable net assets, SEK ‘000Intangible fixed assets, customer relations 25 116
Tangible fixed assets 944
Inventories 4 969
Accounts receivable 10 247
Other current receivables 77
Deferred tax liability -4 375
Accounts payable -10 329
Other current liabilities -593
Total identifiable net assets 26 055
Goodwill 50 247
Total 76 302
Acquisition-related expenses of SEK 2.8 m are included in ’Other operating expenses’ in the income statement for the 2013 financial year.
The total purchase price amounts to SEK 76 m, of which SEK 57 m was paid in cash and SEK 19 m constitutes a supplemental purchase price which is conditional on the earnings trend in the company. The fair value of the supplemental purchase price constitutes an
assessment of the likelihood that the earnings trend will be achieved during the coming three years.
The fair value of identifiable net assets amounts to SEK 26 m, of which an intangible assets in the form of customer relations has been identified totalling SEK 25 m. In addition, goodwill of SEK 50 m arises through the acquisition. This relates to acquired favorable purchasing channels as well as a platform for Duni in Asia. No part of the reported goodwill is expected to be deductible in conjunction with income taxation.
Sales generated by Duni Song Seng, which are included in the consolidated income statement since July 1, 2013, amount to SEK 51.5 m. Duni Song Seng has also contributed income after tax of SEK 3.7 m for the same period. Had Duni Song Seng been consolidated commencing January 1, 2013, the consolidated income statement would have reported additional sales of SEK 46.5 m.
Accounts receivable and other current receivables correspond to the contractual amounts, since it is anticipated that it will be possible to collect all accounts receivable and other current receivables.
No acquisitions took place during the financial year Jan 1, 2012 - Dec 31, 2012.
NOTE 39 – RELATED-PARTY TRANSACTIONSNo transactions with related parties have taken place during the 2013 financial year or during the 2012 financial year.
Other than the information above and information in Note 13 regarding Remuneration to senior executives and in Note 6 regarding Intra-group purchases and sales, there are no transactions with closely related companies.
NOTE 40 – EVENTS SINCE THE BALANCE SHEET DATE
No material events have occurred since the balance sheet date.
Financial leasing agreementsThe nominal value of future minimum leasing charges, with respect to non-terminable leasing agreements, is broken down as follows:
Group Parent Company
SEK m 2013 2012 2013 2012Payable within one year 0 0 – –
Payable later than one but within five years 1 1 – –
Total 1 1 0 0Present value of future leasing charges 0 0 0 0
The Board’s assurance and signaturesThe Board’s assurance The Board of Directors and CEO hereby affirm that the consolidated financial statements have been prepared in accordance with international accounting standards, IFRS, as adopted by the EU and provide a fair and a true view of the Group’s financial position and results. The annual report has been prepared in accordance with generally accepted accounting principles and provides a fair and true view of the Parent Company’s financial position and results.
The Directors’ Report for the Group and Directors’ Report for the Parent Company provide fair and true overviews of the development of the operations, financial position and results of the Group and Parent Company and describe significant risks and uncertainty factors facing the Parent Company and the Group, as well as companies in the Group.
Malmö, 20-03-2014
Anders Bülow Chairman of the Board
Alex MyersDirector
Pia RudengrenDirector
Magnus YngenDirector
Per-Åke HalvordssonEmployee representative, PTK
Henry Olsen Employee representative, LO
Our audit report was submitted on April 2, 2014 PricewaterhouseCoopers AB
PricewaterhouseCoopers AB
Eva Carlsvi Authorized Public Accountant
Main auditor
Duni_ÅR_13_EN.indd 90 2014-04-15 15:07

Report on the annual accounts and consolidated accountsWe have audited the annual accounts and consolidated accounts of Duni AB (publ) for the year 2013, except for the corporate governance statement on pages 40–43. The annual accounts and consolidated accounts of the company are included in the printed version of this document on pages 37–90.
Responsibilities of the Board of Directors and the Managing Director for the annual accounts and consolidated accounts The Board of Directors and the Managing Director are responsible for the preparation and fair presentation of these annual accounts in accordance with the Annual Accounts Act and of the consolidated accounts in accordance with International Financial Reporting Standards , as adopted by the EU, and the Annual Accounts Act, and for such internal control as the Board of Directors and the Managing Director determine is necessary to enable the preparation of annual accounts and consolidated accounts that are free from material misstatement, whether due to fraud or error.
Auditor’s responsibility Our responsibility is to express an opinion on these annual accounts and consolidated accounts based on our audit. We conducted our audit in accordance with International Standards on Auditing and generally accepted auditing standards in Sweden. Those standards require that we comply with ethical requirements and plan and perform the audit to obtain reasonable assurance about whether the annual accounts and consolidated accounts are free from material misstatement.
An audit involves performing procedures to obtain audit evidence about the amounts and disclosures in the annual accounts and consolidated accounts. The procedures selected depend on the auditor’s judgement, including the assessment of the risks of material misstatement of the annual accounts and consolidated accounts, whether due to fraud or error. In making those risk assessments, the auditor considers internal control relevant to the company’s preparation and fair presentation of the annual accounts and consolidated accounts in order to design audit procedures that are appropriate in the circumstances, but not for the purpose of expressing an opinion on the effectiveness of the company’s internal control. An audit also includes evaluating the appropriateness of accounting policies used and the reasonableness of accounting estimates made by the Board of Directors and the Managing Director, as well as evaluating the overall presentation of the annual accounts and consolidated accounts.
We believe that the audit evidence we have obtained is sufficient and appropriate to provide a basis for our audit opinions.
OpinionsIn our opinion, the annual accounts have been prepared in accordance with the Annual Accounts Act and present fairly, in all material respects, the financial position of the parent company as of 31 December 2013 and of its financial performance and its cash flows for the year then ended in accordance with the Annual Accounts Act. The consolidated accounts have been prepared in accordance with the Annual Accounts Act and present fairly, in all material respects, the financial position of the group as of 31 December 2013 and of their financial performance and cash flows for the year then ended in accordance with International Financial Reporting Standards, as adopted by the EU, and the Annual Accounts Act. Our opinions do not cover the corporate governance statement on
Auditor’s reportTo the annual meeting of the shareholders of Duni AB (publ), corporate identity number 556536-7488
pages 40–43. The statutory administration report is consistent with the other parts of the annual accounts and consolidated accounts.
We therefore recommend that the annual meeting of shareholders adopt the income statement and balance sheet for the parent company and the group.
Report on other legal and regulatory requirements In addition to our audit of the annual accounts and consolidated accounts, we have also audited the proposed appropriations of the company’s profit or loss and the administration of the Board of Directors and the Managing Director of Duni AB (publ) for the year 2013. We have also conducted a statutory examination of the corporate governance statement.
Responsibilities of the Board of Directors and the Managing DirectorThe Board of Directors is responsible for the proposal for appropriations of the company’s profit or loss, and the Board of Directors and the Managing Director are responsible for administration under the Companies Act and that the corporate governance statement on pages 40–43 has been prepared in accordance with the Annual Accounts Act.
Auditor’s responsibility Our responsibility is to express an opinion with reasonable assurance on the proposed appropriations of the company’s profit or loss and on the administration based on our audit. We conducted the audit in accordance with generally accepted auditing standards in Sweden.
As a basis for our opinion on the Board of Directors’ proposed appropriations of the company’s profit or loss, we examined the Board of Directors’ reasoned statement and a selection of supporting evidence in order to be able to assess whether the proposal is in accordance with the Companies Act.
As a basis for our opinion concerning discharge from liability, in addition to our audit of the annual accounts and consolidated accounts, we examined significant decisions, actions taken and circumstances of the company in order to determine whether any member of the Board of Directors or the Managing Director is liable to the company. We also examined whether any member of the Board of Directors or the Managing Director has, in any other way, acted in contravention of the Companies Act, the Annual Accounts Act or the Articles of Association.
We believe that the audit evidence we have obtained is sufficient and appropriate to provide a basis for our opinions.
Furthermore, we have read the corporate governance statement and based on that reading and our knowledge of the company and the group we believe that we have a sufficient basis for our opinions. This means that our statutory examination of the corporate governance statement is different and substantially less in scope than an audit conducted in accordance with International Standards on Auditing and generally accepted auditing standards in Sweden.
OpinionsWe recommend to the annual meeting of shareholders that the profit be appropriated in accordance with the proposal in the statutory administration report and that the members of the Board of Directors and the Managing Director be discharged from liability for the financial year.
A corporate governance statement has been prepared, and its statutory content is consistent with the other parts of the annual accounts and consolidated accounts.
Malmö, April 2, 2014
PricewaterhouseCoopers AB
Eva CarlsviAuthorized Public Accountant
Main auditor
9190
NOTES – AUDITOR’S REPORT
Duni_ÅR_13_EN.indd 91 2014-04-15 15:07

Capital employedNon-interest-bearing fixed assets and current assets less non-interest-bearing liabilities.
Costs of goods soldCosts of goods sold, including production and logistics expenses.
Currency adjustedFigures adjusted for the effects of exchange rate differences in conjunction with consolida-tion. Figures for 2013 are calculated applying exchange rates for 2012. Effects of conversion of balance sheet items are not included.
Earnings per shareProfit for the period divided by the average number of shares outstanding.
EBITOperating income.
EBIT underlyingOperating income adjusted for non-recurring items.
EBIT marginEBIT as a percentage of sales.
EBITAOperating income adjusted for amortization of intangible fixed assets and impairment of goodwill.
EBITA marginEBITA as a percentage of sales.
EBITDAOperating income adjusted for total amortization, depreciation and impairment.
EBITDA marginEBITDA as a percentage of sales.
Gross marginGross profit as a percentage of sales.
Interest-bearing net debtInterest-bearing liabilities and pension provisions minus interest-bearing assets and cash and cash equivalents.
Net debt/equity ratioNet debt relative to total capital, where the net debt is the total borrowing less cash and cash equivalents and the total capital is shareholders’ equity and the net debt.
Number of employeesThe number of employees at end of period.
P/E ratioCurrent share price relative to earnings per share.
Return on capital employedOperating income as a percentage of capital employed.
Return on equityIncome for the period as a percentage of shareholders’ equity.
Key ratio definitions
Duni_ÅR_13_EN.indd 92 2014-04-15 15:07

GlossaryAirlaidA material known for its wetness allocation, absorption capability and softness. The process is based on using air in order to divide the fibers in the material, instead of water as in traditional tissue production. Airlaid is used for table covers, placemats, napkins as well as an input material for various types of intimate hygiene products.
Amuse-boucheAmuse-bouche are a series of transparent miniature dishes that are perfect for appetizers and desserts.
BRCBRC is a management system for hygene and food safety. The units in Bramsche and Poznan are BRC-certified.
CAGRAnnual growth.
Cash-and-carriesHypermarkets at which commercial customers personally collect their goods.
Concession cateringOperation of a restaurant or café on behalf of another organization in a fixed sales area.
ConsumerOne of Duni’s three business areas – sales primarily to the retail trade.
Contract cateringOperation of restaurant, café, catering on behalf of another organization.
ConvertingThe manufacturing phase in which tissue and airlaid in large rolls are cut, printed, embossed and folded into prepared napkins and table coverings.
CustomizationTo tailor make solutions for specific customers so they reinforce the customer’s own concept and brand.
Duni ecoecho™Duni ecoecho™ is a range for serving and meal solutions with sound environmental character-istics. The best available materials have been used in this range, with the aim of limiting the use of non-renewable resources in order to reduce our carbon footprint. The products have been developed giving consideration to the environment and have been selected on the ground that they possess one or more environmentally improved characteristics.
Dunicel®
Dunicel is a table cover based on a unique material with a fall similar to cloth. Thanks to a special patented production method, the feel is entirely different from ordinary paper table covers.
DuniForm®
DuniForm is a system for food distribution and covers everything from packaging machines to heat maintenance bags.
Duniletto®
Premium napkin and cutlery bag in one.
Dunilin®
Dunilin feels and folds like linen and is used for the most luxurious napkins. A unique material with a woven effect to look like linen, but is based on paper pulp. Dunilin combines strength with high absorption capability and is perfect for napkin folding.
Dunisilk®
Dunisilk is a wipeable material and can also be used outdoors. Is available as slipcover and ordinary table cover.
EleganceDuni Elegance® is a linen-like exclusive napkin produced with a new patented production process. It is twice as heavy as a high quality paper napkin, has an appealing structure, linen-like embossment and high absorption capability.
Evolin®
Evolin is a new, revolutionary tablecovering material which combines the feel and look of textile and linen tablecoverings with the advantages of the single-use product. It is a hybrid material based on cellulose fibre.
Focus groupsA research method in which questions regarding a product or idea are put to a group of persons. The group is led by a moderator and the method is a tool for obtaining feedback regarding, e.g., new products prior to launching.
FSCShort for Forest Stewardship Council, an independent membership organization which certifies forest management regarding social responsibility, environmental sustainability and economic viability.
HoReCaIs an acronym for Hotel, Restaurant and Catering.
ISO 14001ISO 14001 is the only international standard for environmental management systems and has been chosen as a standard within Duni. Units in Bramsche, Poznan, Dals Långed and Skåpafors are ISO 14001-certified.
ISO 26000ISO 26000 is an international standard which defines corporate social responsibility.
ISO 9001ISO 9001 is an international standard for quality management. The units in Bramsche, Poznan, Dals Långed and Skåpafors are ISO 9001-certified.
Key account managementKey account management ensures long-term and profitable relations with the most important customers.
Life cycle managementNew and existing products are evaluated based on criteria for stock-keeping, turnover, and profitability
MerchandisingDuni assists store owners fill the shelves, build displays and deals with sales campaigns and offers.
Private labelProducts marketed under customer’s own label.
ProfessionalOne of Duni’s three business areas – sales to hotels, restaurants, catering firms and wholesalers.
REACHREACH is an acronym for Registration Evaluation Authorization and Restriction of Chemicals. It constitutes new chemicals legislation throughout the European Union (EEA countries) and entered into force in June 2007.
SacchettoPaper cutlery pocket with space for a napkin.
SensiaSensia® table runners fall beautifully over the table, soften the edges and, thanks to their embossed structure, create a 3D-effect.
Tête-à-têteTable cover roll, 40 cm in width, with perforation; can be used as table runner, placemat or placed across the table.
TissueOne of Duni’s three business areas – produces tissue. The material, tissue, is used for table covers, placemats, and napkins. Different qualities are produced by combining 1 to 4 plies of tissue.
9392
KEY RATIO DEFINITIONS — GLOSSARY
Duni_ÅR_13_EN.indd 93 2014-04-15 15:07

Annual General Meeting, May 6, 2014The Annual General Meeting will be held at Skånes Dansteater, Östra Varvsgatan 13 A, Malmö at 3.00pm on Tuesday May 6, 2014. Registration commences at 2.15pm.
ApplicationsShareholders who wish to participate must be entered in the share register maintained by Euroclear Sweden AB not later than April 29, 2014 and must give notice of their participation not later than the same date in any of the following ways:
– by telephone +46 40-10 62 00
– by letter to Duni AB, Bolagsstämma, Box 237, 201 22 Malmö
– by email [email protected]
In the notice, the shareholder shall state:
– name
– personal ID no./registration no.
– address and telephone number
– number of shares
A shareholder whose shares are nominee-registered must, in order to vote at the AGM, request that the bank or nominee managing the shares effects temporary ownership registration a couple of business days prior to April 29, 2014.
DividendThe Board of Directors proposes a dividend of SEK 4.00 per share, equal to SEK 188 m. May 9, 2014 is proposed as the record date for the right to receive dividends. In the event the AGM resolves in accordance with the proposal, dividends will be disbursed on May 14.
Duni AB’s Nomination CommitteeDuni AB’s Nomination Committee is composed as follows:
Anders Bülow, Chairman of the Board of Duni AB
Rune Andersson, Mellby Gård Investerings AB, Chairman of the Nomination Committee
Hans Hedström, Carnegie Fonder
Bernard R. Horn, Jr., Polaris Capital Management, LLC
The Nomination Committee has the task of submitting proposals to the AGM regarding the election of the Board, auditors and alternate auditors, and the fees therefor.
Complete information regarding the AGM is available on the Company’s website.
Timetable for financial information:
Publication datesInterim report, January – March 2014: April 25, 2014
Interim report, January – June 2014: July 11, 2014
Interim report, January – September 2014: October 22, 2014.
Closing accounts and interim reports are published in Swedish and English and can be downloaded from Duni’s website, www.duni.com. The reports can also be ordered from Duni AB.
The Annual Report is produced in Swedish and English. In the event of any discrepancy between the versions, reference is made to the Swedish text.
Head Office Duni ABBox 237201 22 MALMÖ
Visiting address: Ubåtshallen, Östra Varvsgatan 9ATel +46 40 10 62 00 Fax +46 40 39 66 30
E-mail general enquiries: [email protected]
For addresses of Duni’s subsidiaries and distributors, kindly see www.duni.com
Contact Investor Relations:Mats Lindroth, CFO, [email protected]
Contact press, market and communication:Tina Andersson, Corporate Marketing and Communications Director, [email protected]
Calendar
Addresses
Duni AB (publ) Annual Report 2013 Reg. no. 556536-7488
The content of this annual report may not be duplicated in whole or in part, or stored on any mechanically readable medium, without the consent of Duni AB (publ).
Text: Aspekta ABGraphic design and production: Bysted AB
Duni_ÅR_13_EN.indd 94 2014-04-15 15:07

reports.duni.com/annualreport2013
2013 in brief 3
This is Duni 6
CEO statement 8
Financial targets 10
Strategy 11
Duni’s markets 14
The Duni brand 16
Design 17
Growth areas 18
Professional business area 20
Consumer business area 22
Tissue business area 24
Production and distribution 25
Our Blue Mission 26
Employees 30
The share 32
Annual Report 36–91
Directors’ report 37
Corporate governance report 40
Board of Directors 44
Group management 45
Auditor’s report 91
Key ratio definitions 92
Glossary 93
Calendar 94
Addresses 94
Innovative designwhich creates ambienceA well-set table with unique, innovatively designed products. Products that are designed to heighten the value of the mealtime experience and enhance the ambience around the dining table in more than 40 countries.
The appearance of the products is important and a self-evident part of the design. But for Duni, it is equally obvious that design also covers the choice of materials, production method and distribution method.
A carefully conceived design takes into account all possible environmental aspects and improves the function of the products. Ultimately, this increases value for the shareholders.
8“ Our focus is on products that enhance the experi-ence around the set table”
20
22
Increased focus on continuous product development and innovation
The creation of Designs för Duni® in 2013 shows that Duni is a creative player
17“ Design is an important basis for Duni’s success”
16“ We strengthen the brand through people, food and drink”
Duni_13_Omslag_EN.indd 2 2014-04-11 07.39

Annual R
eport 2013D
uni
Duni.com For ideas and inspiration.
Value enhancing design ANNUAL REPORT 2013
Duni_13_Omslag_EN.indd 1 2014-04-11 07.39