Embed Size (px)
Citation preview

Value engineeringspecialist
CS Swiss Equity Forum16 November 2021

2
1. Positioning of SFS
2. Key takeaways 1H 2021
3. Development by segment 1H 2021
4. Development of key financials 1H 2021
5. Updated guidance 2021 & Group priorities
CS Swiss Equity Forum | 16 November 2021
Table of contents

Positioningof SFS
3CS Swiss Equity Forum | 16 November 2021

4
Mission critical products for selected niche applicationsWe are by your side – 24/7
CS Swiss Equity Forum | 16 November 2021

SFS Value EngineeringCreating customer benefit in three dimensions
Solution provider
Fastening Systems
• lower process cost
• increased reliability
• improved ergonomics
Engineering partner
Engineered Components
• reduction of product complexity
• lower cost due to cold forming
• improved product characteristics
Supply partner
Distribution & Logistics
• process automation
• higher product availability
• lower inventory cost
5CS Swiss Equity Forum | 16 November 2021

6
Our core technologiesExcellence in technology enables compelling solutions
CS Swiss Equity Forum | 16 November 2021

In depth plastics injection molding
know-how allowed to fulfill custom-
er's material requirements for the
dental industry. High market accept-
ance resulting 110m parts in 2019
7
Creating sustainable benefitSFS Value Engineering – Reference Case Dental
Labelling, packaging and storage
directly at SFS' site and shipments
to customer's distribution hub allow
for significantly reduced handling
CS Swiss Equity Forum | 16 November 2021
Leverage Industry 4.0 opportunities
of digitization to constantly improve
processes

Innovative and patented fastener for
the invisible fastening of façade
panels. Compared to other solutions
simpler installation and lower costs
8
Creating sustainable benefitSFS Value Engineering – Reference Case Construction
Efficient installation process with in-
house developed setting tool from
GESIPA
Technical values, BIM data and
sales via eShop
CS Swiss Equity Forum | 16 November 2021

Large D&L product offering in tools
and fasteners (>150,000 items)
allows customer to source more than
5,000 articles from SFS, leading to
reduce supplier base
9
Creating sustainable benefitSFS Value Engineering – Reference Case D&L
Efficient supply processes and
global footprint offer stable supply
chain for customer's Swiss and
international facilities
SFS logistic systems (eLogistics,
eShop, toolLog) created for tailor
made order processes, resulting in
increased efficiency, reduced invent-
tory and lower risk of shortages
CS Swiss Equity Forum | 16 November 2021
Key takeaways
10CS Swiss Equity Forum | 16 November 2021

11CS Swiss Equity Forum | 16 November 2021
Convincing sales and profitability improvement realised
• Strong 1H 2021 results achieved, supported by dynamic market environment, retained capacity
and capability to fulfill customer requirements and continued attention to employee health
• Advantage taken of driving market demand, 1H 2021 gross sales amounted to CHF 957.8 million
(+23.8% vs. PY) driven mainly by segments Engineered Components and Fastening Systems
• High capacity utilization, proactive price management and cost consciousness lead to operating
profit margin peaking at 17.1%
• Progress on infrastructure projects as planned, with most recently announced expansion of
production platform in Nantong (CN) planned to be commissioned in autumn 2023
• Highlights from the Sustainability Report for the period of 2020:
• Number of work-related accidents reduced by another –13.3% (total of 85 accidents)
• 5.0% of workforce enrolled in dual education programe
• Implementation of CO2 roadmap, containing measurable targets for reduction of CO2 emissions
Key takeaways

• Economic
performance
• Occupational health
and safety
• Training and
education
• Emission reductions
• Socioeconomic
compliance
• Continued focus on
set goals
• Update materiality
assessment
12CS Swiss Equity Forum | 16 November 2021
Key elements to improve sustainable developmentFocus on sustainability
Mgmt
attention
• Regular reporting
on progress
• Management
remuneration tied
to ESG KPIs
Reporting
• UN Global Compact
(SDGs)
• GRI (“core" option),
Sustainability re-
port 2020 released
end of May
https://sustainability.
sfs.com/en
Core
KPIs
CO2 emission
reduction:
• Scope 1 and 2 by
≥90% by 2030
• Scope 3 by ≥90%
by 2040
CO2
roadmapOutlook
2021

13CS Swiss Equity Forum | 16 November 2021
Like the milestone to reduce our emissions by ≥90%GRI materiality analysis identifies priorities
We aim to reduce our CO2 emissions (Scopes 1 and 2) by ≥90% by 2030 through the optimisation of
processes, products and digitalisation, with a focus on sustainable customer benefits.
14
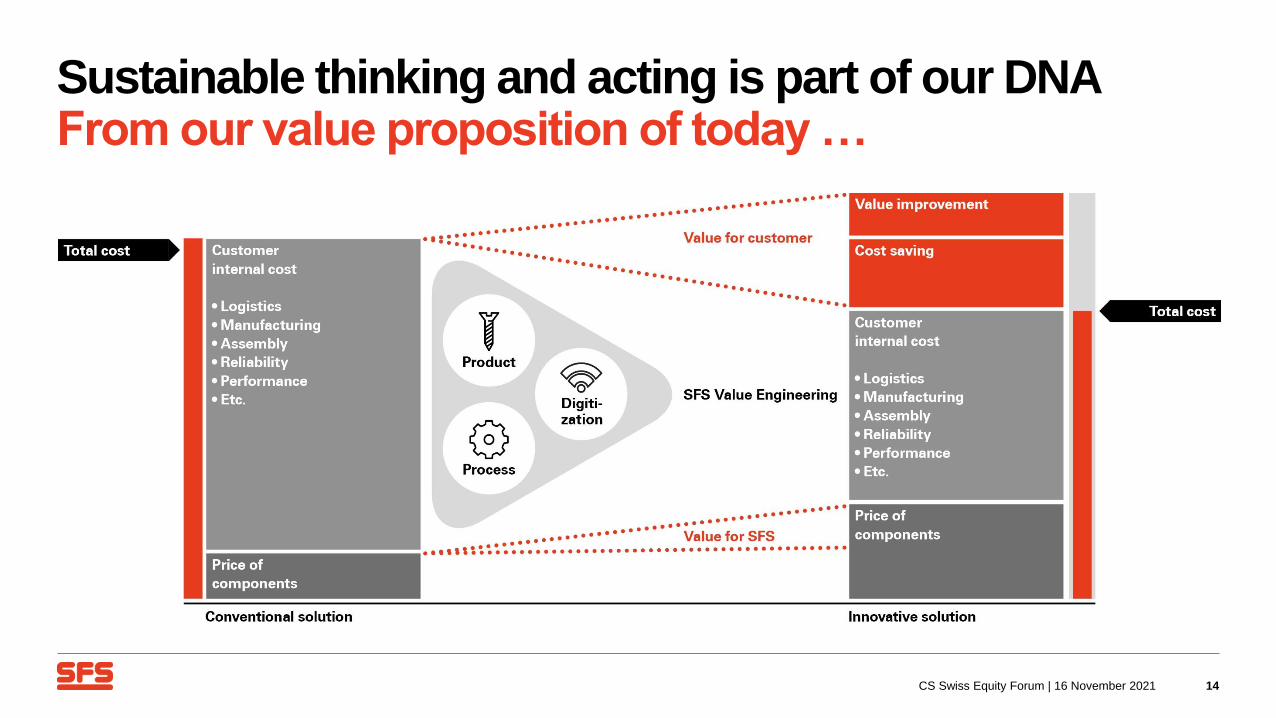
Sustainable thinking and acting is part of our DNA From our value proposition of today …
CS Swiss Equity Forum | 16 November 2021

15
Sustainable thinking and acting is part of our DNA … to a holistic view on sustainability
CS Swiss Equity Forum | 16 November 2021
Price of sustainable
components & services
Direct &
indirect cost
for:
•Social, health
& safety risks
•Resources
•Emissions
•Waste
•Disposals
Direct &
indirect cost
for:
•Social, health
& safety risks
•Resources
•Emissions
•Waste
•Disposals
Customer
internal cost
• Logistics
• Manufacturing
• Assembly
• Reliability
• Performance
• Etc.
Total cost
Total cost

Developmentby segment
16CS Swiss Equity Forum | 16 November 2021

17
• Positive development in most end markets
resulted in 1H 2021 reported sales of CHF
492.1 m (+29.5% YOY and +8.3% vs. 1H 19)
• Pronounced recovery in Automotive and most
Industrial markets. Electronics with continued
strong demand pattern
• Local-for-Local strategy supported largely
high delivery performance and allowed
selective market share gains
• Global Medical platform positively received
• High utilisation of production capacity
resulting in strong EBIT margin of 18.7%
CS Swiss Equity Forum | 16 November 2021
Participated in strong market recoveryHeadlines Engineered Components segment
Key figures Engineered Components
In CHF million (unaudited)
2021
1H
+/–
PY
2020
1H
Third party sales
Sales growth comparable
492.1 29.5%
29.1%
380.1
EBITDA
As a % of net sales
128.9
25.9
86.5% 69.1
17.9
Operating profit (EBIT)
As a % of net sales
93.1
18.7
165.2% 35.1
9.1
Average Capital Employed 733.8 3.3% 710.3
Investments 33.8 –30.5% 48.6
Full-time equivalents (FTE) 6,955 –0.3% 6,978
ROCE in % 25.4 9.9

18
• Recovery in demand across regions and
applications, but dampened by shortages in
semiconductor supply
• Ongoing electrification of vehicles continue to
be major engine for innovation and growth of
the division, evidenced by new project wins in
the area of electric brake applications
• Building expansion project for electric brake
systems production in Heerbrugg (CH)
developing as planned
• Market conditions expected to remain unchang-
ed, supporting position to outgrow the market
CS Swiss Equity Forum | 16 November 2021
Pent-up demand driving market environmentKey messages Automotive division
Progress building expansion project in Heerbrugg (CH)

19
• Continued growth in the areas of mobile
devices and lifestyle electronics supported by
home office push
• Positive demand pattern for HDD appli-
cations, stimulated by cloud and enterprise
computing
• Shortages in semiconductor supply creating
some degree of volatility
• Expansion of Nantong platform planned
• Positive development expected for full
FY2021 vs. previous year
CS Swiss Equity Forum | 16 November 2021
Stable growth across all applicationsKey messages Electronics division
Platform in Nantong (CN)

20
• Platform combines all SFS core technologies
under one roof and was occupied in 2018
• Ongoing growth of mobile devices, lifestyle
electronics and demand from other divisions
requiring expansion
• Floor space will increase by approx. 70% to
a total of 130,000 m2
• Ready for occupancy in autumn 2023
• Total investment spending budgeted at about
CHF 32 million
CS Swiss Equity Forum | 16 November 2021
Provide capacity for future growthExpansion of production platform in Nantong (CN)
Expansion of platform in Nantong (CN)
21
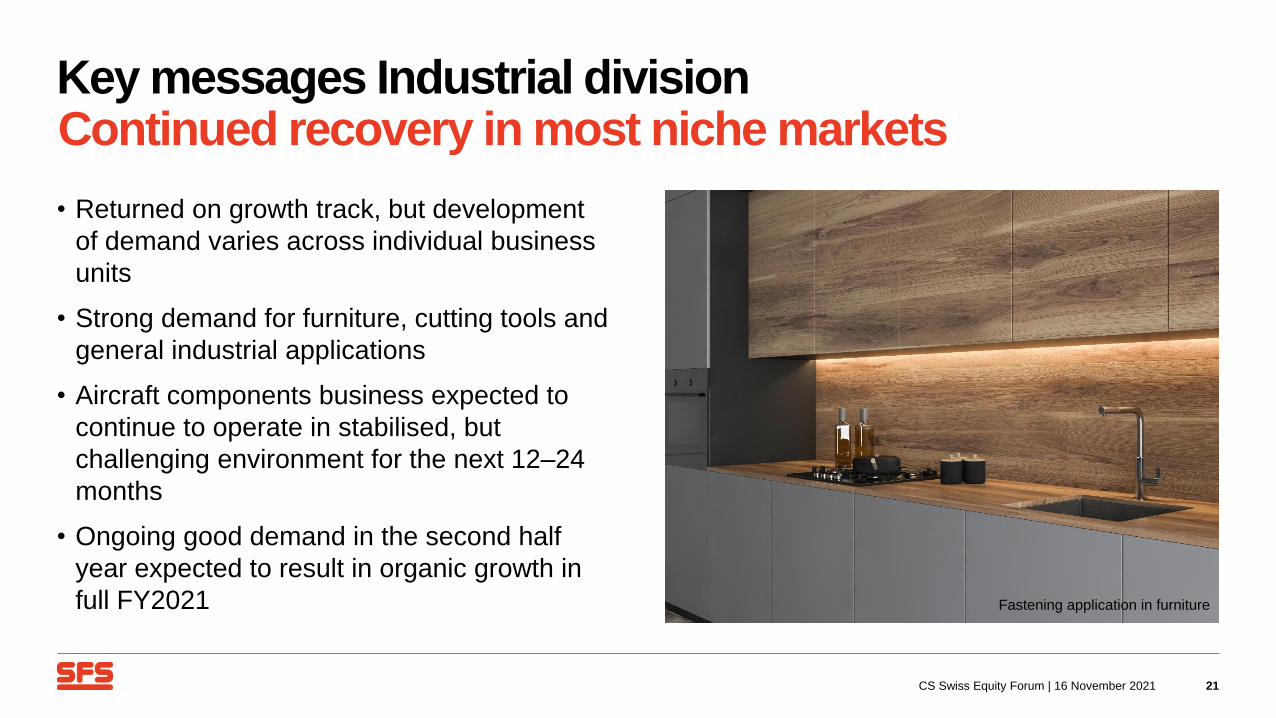
• Returned on growth track, but development
of demand varies across individual business
units
• Strong demand for furniture, cutting tools and
general industrial applications
• Aircraft components business expected to
continue to operate in stabilised, but
challenging environment for the next 12–24
months
• Ongoing good demand in the second half
year expected to result in organic growth in
full FY2021
CS Swiss Equity Forum | 16 November 2021
Continued recovery in most niche marketsKey messages Industrial division
Fastening application in furniture
22
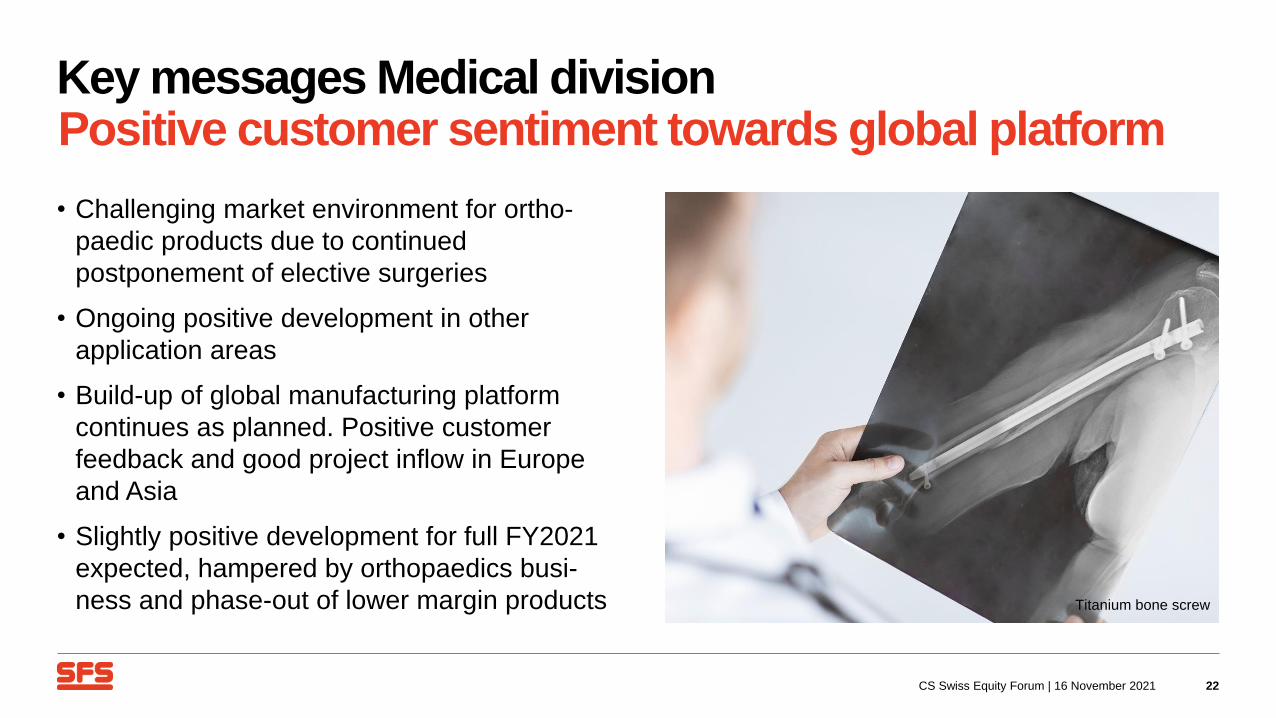
• Challenging market environment for ortho-
paedic products due to continued
postponement of elective surgeries
• Ongoing positive development in other
application areas
• Build-up of global manufacturing platform
continues as planned. Positive customer
feedback and good project inflow in Europe
and Asia
• Slightly positive development for full FY2021
expected, hampered by orthopaedics busi-
ness and phase-out of lower margin products
CS Swiss Equity Forum | 16 November 2021
Positive customer sentiment towards global platformKey messages Medical division
Titanium bone screw

23
• Continued high demand in construction and
industrial manufacturing industries and pent-
up demand in automotive market resulted in
1H 2021 reported sales of CHF 293.1 m
(+25.3% YOY and +18.0% vs. 1H 19)
• High market demand put supply chains and
material prices under considerable strain
• Strong performance orientation allowed
divisions to navigate challenging environment
and benefit from market opportunities
• High capacity utilisation and thorough cost
management resulted in record EBIT of 17.7%
CS Swiss Equity Forum | 16 November 2021
Advantage taken of dynamic market environmentHeadlines Fastening Systems segment
Key figures Fastening Systems
In CHF million (unaudited)
2021
1H
+/–
PY
2020
1H
Third party sales
Sales growth comparable
293.1 25.3%
25.5%
234.0
EBITDA
As a % of net sales
62.2
20.7
93.2% 32.2
13.5
Operating profit (EBIT)
As a % of net sales
53.0
17.7
133.5% 22.7
9.5
Average Capital Employed 262.8 –8.9% 288.5
Investments 4.2 –2.3% 4.3
Full-time equivalents (FTE) 2,522 5.7% 2,386
ROCE in % 40.3 15.7

24
• Construction market continued its positive
development, driven by rebound effects and
moved up orders
• Extraordinary demand across applications in
EU and NA resulted in historically high sales
• Increasing signs of overheating expected to
result in slowdown of construction projects
and potentially normalisation of demand
• Expansion of TFC branch network by ac-
quisition of GLR Fastener in San Jose (CA)
• Division expects a positive development for
full FY2021
CS Swiss Equity Forum | 16 November 2021
Strong demand and high capacity utilisationKey messages Construction division
Extraordinary market environment across Europe and North America

25
• Denmark-based provider of fastening solutions
for application in high quality building
envelopes
• Expansion of market access to the Danish
construction industry
• High technology and application competence,
including specific services
• Key figures FY2020:
• sales of approx. EUR 5 m
• 10 employees
• First-time consolidation as per 1 July 2021
CS Swiss Equity Forum | 16 November 2021
Broaden market access in DenmarkAcquisition of Jevith
Brick fixings for rainscreen facades

26
• Pent-up demand in automotive market and
recovery of industrial manufacturing industry
drove growth across all application areas
• Some automotive customers have been
negatively impacted by shortage in semi-
conductor supply
• Relocation of Chinese production site to
Nantong (China) expected to yield further
efficiency gains
• Market environment expected to remain stable,
resulting in organic growth for full FY2021
CS Swiss Equity Forum | 16 November 2021
Continued improvement of performanceKey messages Riveting division
Relocation of production site from Nansha to Nantong (CN)

27
• Overall good market demand continued in
1H 21 and resulted in reported sales growth of
13.0 m (+8.1% YOY and +4.4% vs. 1H 19)
• Strong demand from construction customers,
still challenging environment in milling and
machining end markets
• High market demand put supply chains and
price levels under considerable strain,
expected to result increasingly in reduced
availability of certain product categories
• Segment expects organic growth for full
FY2021
CS Swiss Equity Forum | 16 November 2021
Ongoing positive developmentHeadlines Distribution & Logistics segment
Key figures Distribution & Logistics
In CHF million (unaudited)
2020
1H
+/–
PY
2019
1H
Third party sales
Sales growth comparable
172.6 8.1%
7.8%
159.6
EBITDA
As a % of net sales
18.7
10.7
8.7% 17.2
10.6
Operating profit (EBIT)
As a % of net sales
16.2
9.2
11.7% 14.5
8.9
Average Capital Employed 126.8 –1.7% 129.0
Investments 2.2 15.8% 1.9
Full-time equivalents (FTE) 591 –0.7% 595
ROCE in % 25.6 22.4

Development ofkey financials
28CS Swiss Equity Forum | 16 November 2021

868
774
0 0 0
958
0
100
200
300
400
500
600
700
800
900
1’000
1HY19 1HY20 Organic Scope FX 1HY21
29
Reported growth of +23.8% (PY –10.8)
• Core business +23.6% (PY –10.4)
• Scope +1.4% (PY 3.4)
• FX impact –1.2% (PY –3.8)
Organic growth SFS Group
• Q1 2021 +10.4%
• Q2 2021 +13.2%
Like-for-like growth by segment
• +29.1% in EC (PY –13.5%)
• +25.5% in FS (PY –10.0%)
• +7.8% in D&L (PY –2.6%)
Sales bridgeOn the path of guided organic growth in 1H 2021
In CHF million +182.4 +10.7 –9.0
CS Swiss Equity Forum | 16 November 2021
-3.1%-1.7%1.4%0.7%
7.5%6.7%4.1%
-1.0% 0.9%
-21.0%
-2.4%
9.9%
10.4%
39.8%
-40%
-30%
-20%
-10%
0%
10%
20%
30%
40%
Weakening global economy COVID-19 Rebound
30
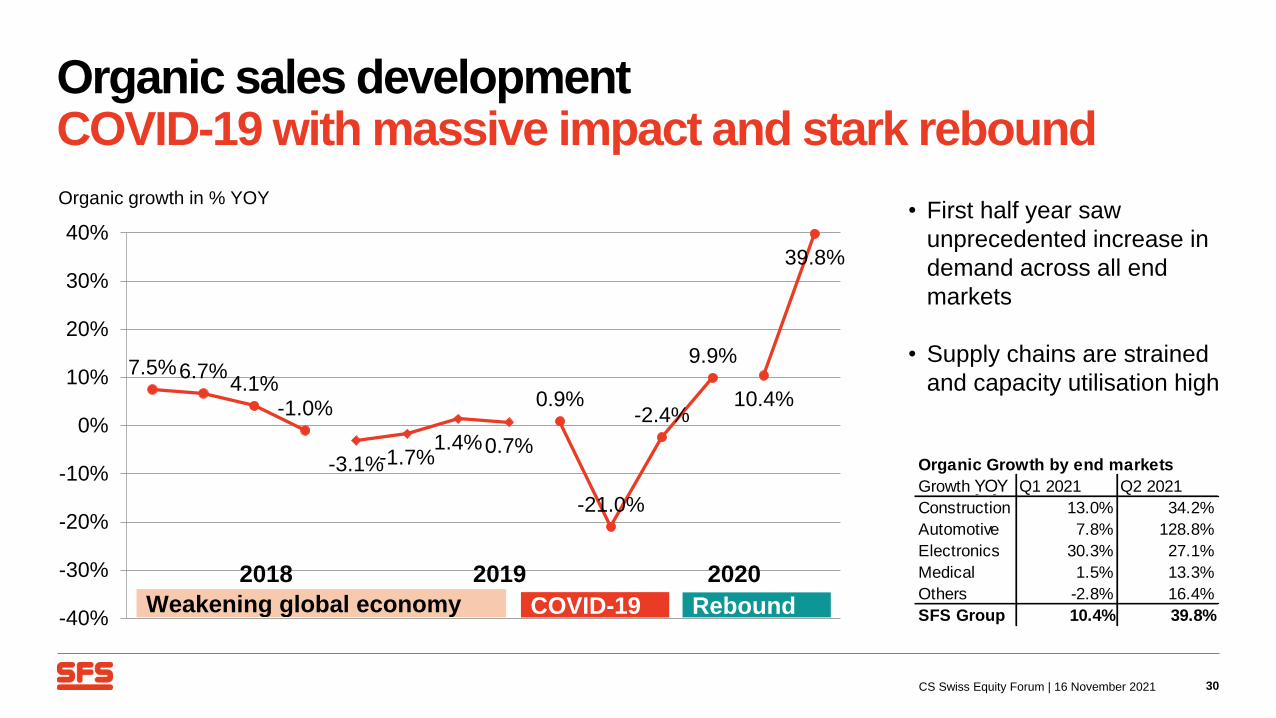
Organic sales developmentCOVID-19 with massive impact and stark rebound
CS Swiss Equity Forum | 16 November 2021
Organic growth in % YOY
2018 2019 2020
• First half year saw
unprecedented increase in
demand across all end
markets
• Supply chains are strained
and capacity utilisation high
Organic Growth by end markets
Growth yoy Q1.2021 Q2.2021
Construction 13.0% 34.2%
Automotive 7.8% 128.8%
Electronics 30.3% 27.1%
Medical 1.5% 13.3%
Others -2.8% 16.4%
SFS Group 10.4% 39.8%
YOY
31
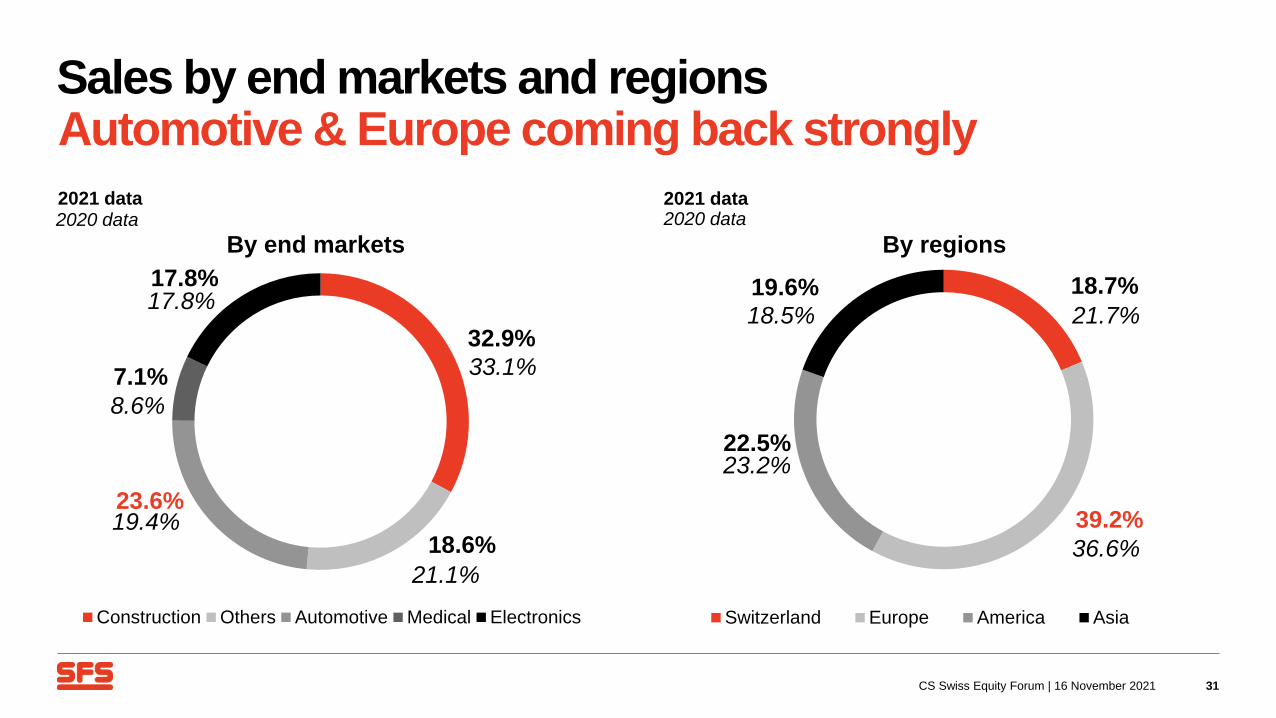
Automotive & Europe coming back stronglySales by end markets and regions
18.7%
39.2%
22.5%
19.6%
By regions
Switzerland Europe America Asia
21.7%18.5%
23.2%
36.6%
2020 data2021 data
32.9%
18.6%
23.6%
7.1%
17.8%
By end markets
Construction Others Automotive Medical Electronics
19.4%
33.1%
17.8%
8.6%
21.1%
2020 data2021 data
CS Swiss Equity Forum | 16 November 2021

233
.3
243
.1
239
.1
225
.3
71.0
161
.0
14.3% 14.0% 13.4% 13.2%
9.2%
16.8%
19.8%19.2% 18.6% 19.2%
15.5%
22.4%
0
100
200
300
400
500
0%
5%
10%
15%
20%
25%
2017 2018 2019 2020 1H20 1H21
32
• EBIT margin adjusted 16.8% or CHF 161.0 m;
we report the 4th quarter in a row EBIT >15%
• EBITDA margin 22.4% or CHF 215.0 m
• High utilization supports overall profitability
• Supply chain and logistics cost ask for high focus
and close management
• Diligent cost management remains in place for
personnel and other operating expenses
High utilisation and cost discipline drive performanceOperating profitability
In % of net sales In CHF million
CS Swiss Equity Forum | 16 November 2021

33
Operating profitability Seasonal patterns to continue?
CS Swiss Equity Forum | 16 November 2021
11
0.9
122
.4
11
6.0
127
.1
109
.2 129
.9
71.0
154
.3
161
.0
14.2% 14.3%13.6%
14.4%
12.6%
14.2%
9.2%
16.6% 16.8%
0%
4%
8%
12%
16%
20%
0
50
100
150
200
250
1HY17 2HY17 1HY18 2HY18 1HY19 2HY19 1HY20 2HY20 1HY21 2HY21
EBIT adjusted in CHF million EBIT adjusted margin in %

1’3
27
1’1
22
1’0
93
1’0
68
1’1
93
1’3
31
1’3
83
1’3
76
1’4
37
1’6
33
1’7
39
1’7
81
1’7
05
1’9
00
958
15.5%
11.7%
19.1%
17.3% 17.1%18.9%
19.7%18.5%
20.7%19.5% 19.2% 18.6% 19.2%
22.1%
0%
5%
10%
15%
20%
25%
0
500
1’000
1’500
2’000
2’500
2008 2009 2010 2011 2012 2013 2014 2015 2016 2017 2018 2019 2020 G 2021 H12021
34
Growth through the cycle holds firmOperating profitability
Sales in CHF million EBITDA margin adjusted
CS Swiss Equity Forum | 16 November 2021
113
111
10
9
111 12
4
114
31.1% 30.3% 29.8% 30.3%
34.0%
31.3%
0
25
50
75
100
125
150
175
0%
5%
10%
15%
20%
25%
30%
35%
2017 2018 2019 2020 1HY20 1HY21
35
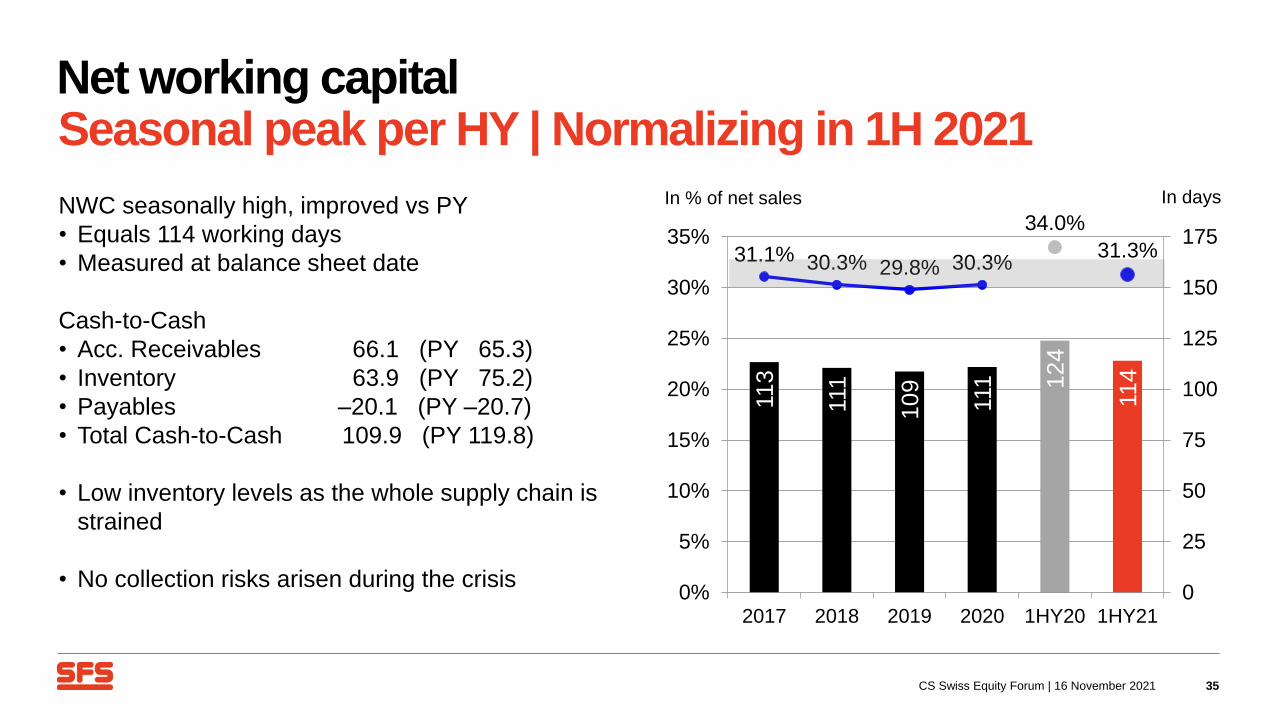
NWC seasonally high, improved vs PY
• Equals 114 working days
• Measured at balance sheet date
Cash-to-Cash
• Acc. Receivables 66.1 (PY 65.3)
• Inventory 63.9 (PY 75.2)
• Payables –20.1 (PY –20.7)
• Total Cash-to-Cash 109.9 (PY 119.8)
• Low inventory levels as the whole supply chain is
strained
• No collection risks arisen during the crisis
Seasonal peak per HY | Normalizing in 1H 2021Net working capital
In % of net sales
CS Swiss Equity Forum | 16 November 2021
In days
36
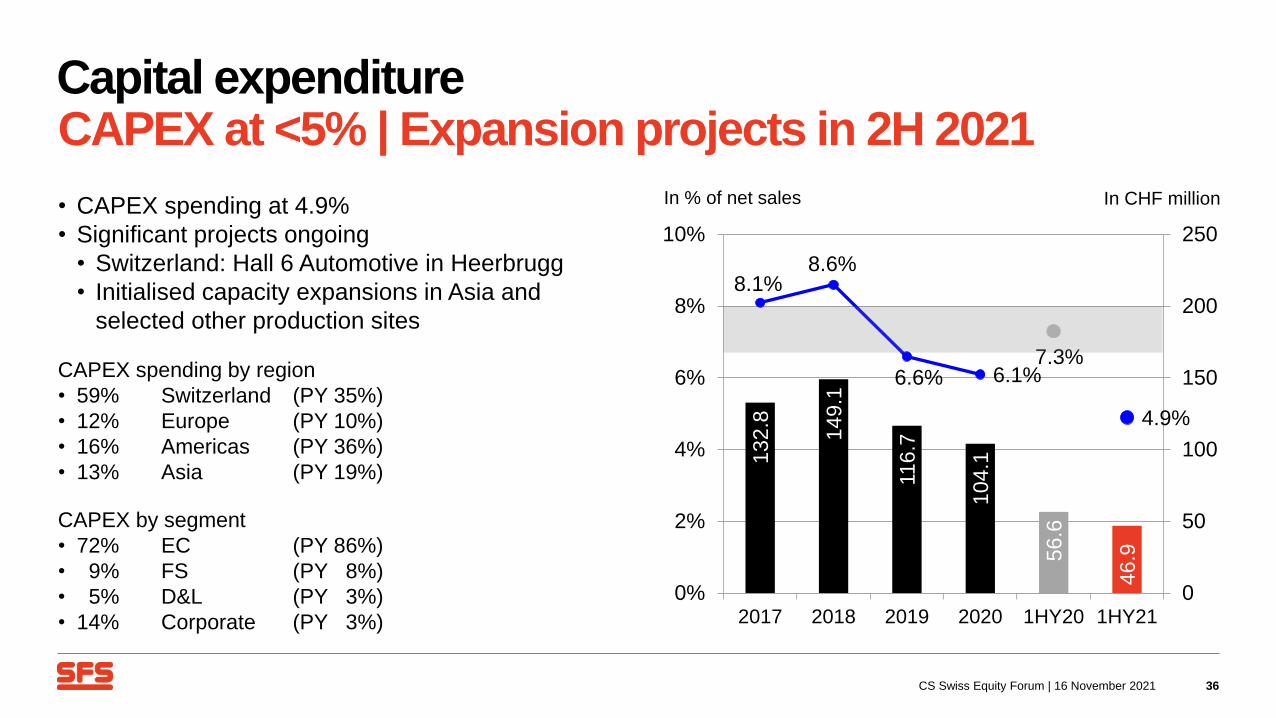
• CAPEX spending at 4.9%
• Significant projects ongoing
• Switzerland: Hall 6 Automotive in Heerbrugg
• Initialised capacity expansions in Asia and
selected other production sites
CAPEX spending by region
• 59% Switzerland (PY 35%)
• 12% Europe (PY 10%)
• 16% Americas (PY 36%)
• 13% Asia (PY 19%)
CAPEX by segment
• 72% EC (PY 86%)
• 9% FS (PY 8%)
• 5% D&L (PY 3%)
• 14% Corporate (PY 3%)
CAPEX at <5% | Expansion projects in 2H 2021Capital expenditure
132
.8
149
.1
11
6.7
104
.1
56.6
46.9
8.1%8.6%
6.6% 6.1%7.3%
4.9%
0
50
100
150
200
250
0%
2%
4%
6%
8%
10%
2017 2018 2019 2020 1HY20 1HY21
In CHF millionIn % of net sales
CS Swiss Equity Forum | 16 November 2021

37
Good cash generation (in CHF)
• 136 m cash flow from operations (PY 103 m)
• –47 m CAPEX (PY –57 m)
• 89 m operating free cash flow (PY 46 m)
Conversion rate at 41.3%
• Target range of 40–50%
CAPEX and NWC increase fully financed by cash flowFree cash flow
94 1
14
161
192
46
89
29.0% 34.4%
48.5%
58.7%
0
50
100
150
200
250
300
0%
10%
20%
30%
40%
50%
60%
70%
2017 2018 2019 2020 1H20 1H21
CHF millionIn % of EBITDA
CS Swiss Equity Forum | 16 November 2021
38.2%41.3%

38
Equity ratio increased to 78.3%
• Target range >60%
Net cash at year end CHF 144 m increased to
CHF 180 m as of 30 June
• 89 m operating free cash flow
• 12 m disposal PPE
• –66 m dividend payout
• 35 m increase vs. year end 2020
Financial flexibility for growth secured by
• Unused and existing credit facilities
• Annual free cash flow
Strong balance sheet and financingBalance sheet ratios
Equity ratio in % CHF million net cash/debt
CS Swiss Equity Forum | 16 November 2021
72.7%
78.3%
35
59 69
14
4
-11
18
0
71.6%74.4% 75.5% 75.9%
-30
0
30
60
90
120
150
180
210
240
0%
10%
20%
30%
40%
50%
60%
70%
80%
90%
2017 2018 2019 2020 1H20 1H21

24.6%
22.7%21.1%
19.9%
9.8% 9.7% 9.2%8.6%
0%
5%
10%
15%
20%
25%
30%
2017 2018 2019 2020 1H20 1H21
39
Return on capital employed at 28.3%
• EBIT adjusted in % of Ø CE CHF 1.1 bn
Return on invested capital at 12.0%
• EBIT after tax (flat rate of 17.5%)
• Invested capital CHF 2.2 bn including goodwill
offset with CHF 1.0 bn
Bridge between ROIC and ROCE
12.0% ROIC after tax
+11.3% CHF 1.1 bn higher capital
+5.0% tax impact on EBIT
28.3% ROCE before tax
High capital intensity | Strong leverage from EBITReturn on capital
Return in %
CS Swiss Equity Forum | 16 November 2021
12.5%
28.3%
5.5%
12.0%

40
Performing and participating from the rebound
In CHF million 1H 2021 % 1H 2020 % YOY
Sales 957.8 773.7 +23.8%
EBITDA margin 215.0 22.4% 120.3 15.5% +690bps
EBIT adjusted margin 161.0 16.8% 71.0 9.2% +760bps
Net income margin 134.1 14.0% 53.9 7.0% +700bps
Equity ratio 1,370.7 78.3% 1,169.0 72.7% +560bps
Net cash 179.9 –11.4 +191.3
CAPEX % net sales 46.9 4.9% 56.6 7.3% –240bps
Free cash flow conversion rate 88.9 41.3% 46.0 38.2% +310bps
ROCE 28.3% 12.5%
CS Swiss Equity Forum | 16 November 2021
KPI summary
Updated guidance 2020 &Group priorities
41CS Swiss Equity Forum | 16 November 2021

42
Assumptions:
• Continued dynamic development in second half year 2021
• No further global waves of COVID-19 infections leading
to a deterioration of the economic conditions
Guidance FY2021Increased expectations thanks to organic growth
CS Swiss Equity Forum | 16 November 2021
2020A 2021G
(10 June)
Mid-TermG
Gross sales development(in local currencies incl. M&A)
–0.2% ca. CHF 1.9 bn 3–6%
EBIT margin 13.3% ca. 15% 13–16%
A = Actual G = Guidance

CS Swiss Equity Forum | 16 November 2021
Continued focus on organic growth pathSFS Group priorities
43
Megatrends
Strengthening
innovation,
particularly in the
megatrends of
digitisation &
autonomous driving
Growth
Investments in
future growth pro-
jects in particular
in the med-tech,
automotive &
electronics sectors
Employees
Continue with
preventive meas-
ures to protect
employee health
and safety
Profitability
Balance produc-
tion capacity with
demand, while
ensuring supply
capability & control
of costs
Sustain-
ability
Continued focus
on the set goals
and update of
materiality
assessment

Thank you foryour attention
44CS Swiss Equity Forum | 16 November 2021
45CS Swiss Equity Forum | 16 November 2021

46CS Swiss Equity Forum | 16 November 2021
This presentation includes forward looking statements. These statements reflect the SFS Group's
current assessment of market conditions and future events. The statements are therefore subject
to risks, uncertainties and assumptions. Unforeseen events may lead to deviations of the actual
results from the forecasts and estimates made in this presentation and in other published
information. To this extent all forward looking statements in this presentation are subject to such
limitations.
Disclaimer