Embed Size (px)
Citation preview
Value-Driven Delivery by Mike Griffiths
1© 2011 RMC Publications, Inc • 952.846.4484 • [email protected] • www.rmcproject.com
CHAPTER 3
Delivering value, specifi cally business value, is a core component of agile methods. Th is concept is woven into the agile DNA with its inclusion in the Agile Values (“Working soft ware over comprehensive documentation”) and the Agile Principles (“Deliver working soft ware frequently” and “Working soft ware is the primary measure of progress”) that make up the Agile Manifesto. Th e focus on delivering value drives many of the agile activities and decisions on a project, and it manifests itself in many of the Tools and Techniques (T&T) and Knowledge and Skills (K&S) used. Th is focus is such an essential component of agile methods that the “Value-Driven Delivery” domain has the most T&T and K&S of any of the six domains. Th is means we are starting with the biggest section early in this book.
What Is Value-Driven Delivery?
Let’s start by defi ning value-driven delivery. Th e reason projects are undertaken is to generate business value, be it to produce a benefi t or to improve a service. Even safety and regulatory compliance projects can be expressed in terms of business value by considering the business risk and impact of not undertaking them. If value then is the reason for doing projects, value-driven delivery is the focus of the project throughout the planning, execution, and control eff orts.
Aiming to maximize value delivery is an overarching theme, or mantra, for agile teams. When faced with a decision between two or more options, they oft en ask the question, “Which choice would add the most value for the customer?” to help them determine the way forward. Agile teams also have an obligation to consider technical dependencies and risks. A choice that could lead to future problems or rework does not support the long-term goal of value-driven development, even if it gives the illusion of early progress. Teams therefore need to consider nonfunctional requirements and risks and advise the customer about how those elements will impact the project.
Risks as Anti-value
Th e concept of risk is closely related to value, so much so that we can think of project risks as anti-value, or factors that have the potential to erode, remove, or reduce value if they occur. If value is the “heads” side of a coin, then risk is the “tails” side. To maximize value, we must also minimize risks, since risk can reduce value. Th is is why the Value-Driven Delivery domain emphasises risk reduction concepts and techniques.
Here’s another simple way to grasp the relationship of value and risks. Th ink of value-driven delivery as creating credits or deposits that are paid into your bank account. Risks—or at least risks that occur and become issues on your project—are then like withdrawals or charges that are taken out of your account. To create the most value, you need to maximize the infl ow and minimize the outfl ow of value from your account.
Eat Your Dessert First—Early Value Delivery
Agile methods promote early value delivery. Th is means the team aims to deliver the highest value portions of the project as soon as possible. Th ere are some key reasons for this approach. First, life is

2 © 2011 RMC Publications, Inc • 952.846.4484 • [email protected] • www.rmcproject.com
PMI-ACPSM Exam Prep—Prerelease Draft
short, weird stuff happens, and the longer a project runs, the longer the horizon becomes for risks such as failure, reduced benefi ts, erosion of opportunities, and so on. To maximize success, we should aim to deliver as many high-value components as soon as we can, before things change or go sideways.
Th e second major reason is that stakeholder satisfaction plays a huge role in project success. Engaged, committed sponsors and business representatives who support a project are vital to removing project obstacles and defi ning success. All project teams are on a trial period when they start, since the sponsors may not be convinced that the team can deliver. By delivering high-value elements early, the team demonstrates an understanding of the stakeholders’ needs, shows a recognition of the most important aspects of the project, and proves they can deliver. Tangible results raise stakeholders’ confi dence, build rapport with them, and get them on board early, creating virtuous circles of support.
In short, value-driven delivery is about making decisions that prioritize the value-adding activities and risk-reducing actions for the project, and then executing based on these priorities.
— IN THIS CHAPTER —
Now that we’ve covered some of the basic concepts related to value-driven delivery, the rest of this chapter will focus on the processes of assessing, planning, delivering, confi rming, tracking, and reporting value, including the Tools and Techniques and Knowledge and Skills involved in those practices, as shown in the following chart. Although these practices are not offi cial terms that will appear on the exam, they provide the context of why and how you use the T&T and K&S that you will be tested on.
Practice Tool/Technique Knowledge/Skill (Level)Assessing value » Return on investment (ROI)
» Net present value (NPV)» Internal rate of return (IRR)
Planning value » Chartering» Value stream mapping» Customer-valued
prioritization» Relative prioritization/
ranking» Product roadmap» Risk adjusted backlog
» Prioritization (Level 1)» Agile contracting methods
(Level 3)
Delivering value » Task/Kanban boards» WIP limits
» Incremental delivery (Level 1)
Confi rming value » Customer-valued prioritization
» Feedback through prototypes, simulation, and demonstration (Level 1)
Tracking and reporting value » Earned value management for agile projects
» Cumulative fl ow diagrams (CFDs)
» Risk burndown graphs» Task/Kanban boards

3© 2011 RMC Publications, Inc • 952.846.4484 • [email protected] • www.rmcproject.com
Value Driven Delivery CHAPTER 3
Assessing Value
Business value is usually assessed in fi nancial terms. Some projects are undertaken for safety or regulatory compliance purposes and do not have an easily determined monetary value. In these cases, the organization might want to look at the fi nancial ramifi cations of not undertaking the project, such as the risk of the business being shut down, fi nes, or lawsuits. Or it can simply label the project as mandatory and not spend any additional time trying to quantify its value.
For business projects, value is commonly estimated using methods such as return on investment (ROI), internal rate of return (IRR), and net present value (NPV). ROI, IRR, and NPV are among the Tools and Techniques the exam will test you on, so you need to know how to calculate them. You will see examples of these calculations later in this section, but fi rst let’s look at the benefi ts such techniques provide.
Using economic models to assess value removes individual bias and emotion from the process of selecting and justifying projects. Instead, with economic models, you can focus on comparing a common variable (fi nancial return) across projects. Th e results are “in the numbers,” and are, in theory, more objective than other project selection models (in practice, however, the inputs into the calculations can be manipulated to sway the outcome).
T&T Return on Investment (ROI)
Let’s look at an example of return on investment. We have a project that will run from January until May and then deliver a solution that generates some fi nancial return. From January until May we will spend money on the project, paying hourly rates for the resources (shown in the chart by the black line with triangle markers indicating negative cumulative cashfl ow). In May, we will deploy our solution and start to get a positive income (shown by the light gray line with circle markers).
-$300,000
-$200,000
-$100,000
$0
$100,000
$200,000
$300,000
$400,000
$500,000
$600,000
PV at 10%Net CashflowCumulative IncomeCumulative Spending
SepAugJulJunMayAprMarFebJan
Project Spending and Income
4 © 2011 RMC Publications, Inc • 952.846.4484 • [email protected] • www.rmcproject.com
PMI-ACPSM Exam Prep—Prerelease Draft
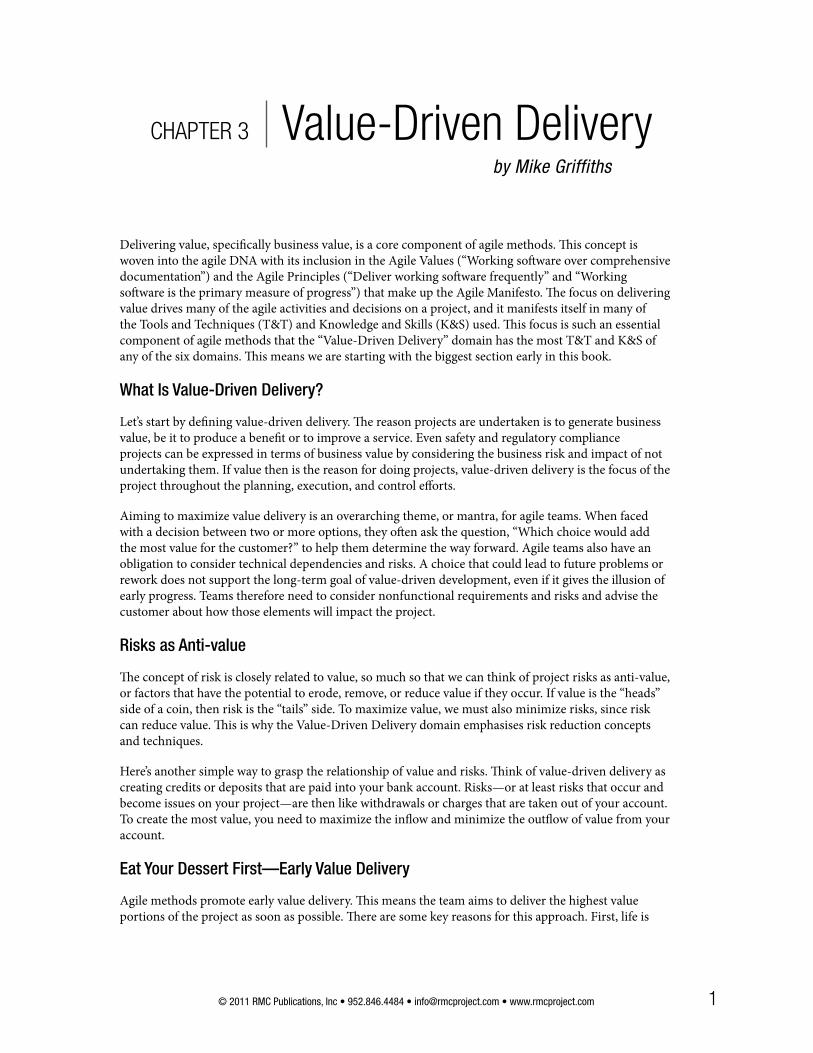
When we add the new income to the outfl ow fi gures, we can see net cash fl ow (indicated in the following chart by the dark line with square markers). Based on the following chart, when do you think we will have met our return on investment?
-$300,000
-$200,000
-$100,000
$0
$100,000
$200,000
$300,000
$400,000
$500,000
$600,000
PV at 10%Net CashflowCumulative IncomeCumulative Spending
SepAugJulJunMayAprMarFebJan
Net Cash Flow
It is tempting to assume that when this net cash fl ow reaches zero (July in our example), we will have met our return on investment and that January to July is our payback period. In a way, this is true; we will have received back as much money as we spent. We need to consider the eff ect of infl ation, however. Money that is received in the future is less valuable than money we hold, or spend, right now. Th is is especially true if, to fund the project, we have to borrow money that we will need to pay back with interest. So when determining ROI, we need a way to take into account the eff ect of infl ation and the cost of borrowing money.
T&T Net Present Value (NPV)
Th is is where the concept of present value comes in. Present value is a way of calculating the value in today’s terms of a future amount, given an assumed interest rate or infl ation rate. Let’s take a look at how present value is calculated.
Present ValuePresent Value = Th e value in today’s terms of a future amount
PV = FV(1+r)n
What is the present value of $200,000 received 4 years from now if the interest rate is 7%?
200,000(1+0.07)4
= $152,579
FV = Future valuer = Interest raten = Number of time periods
5© 2011 RMC Publications, Inc • 952.846.4484 • [email protected] • www.rmcproject.com
Value Driven Delivery CHAPTER 3
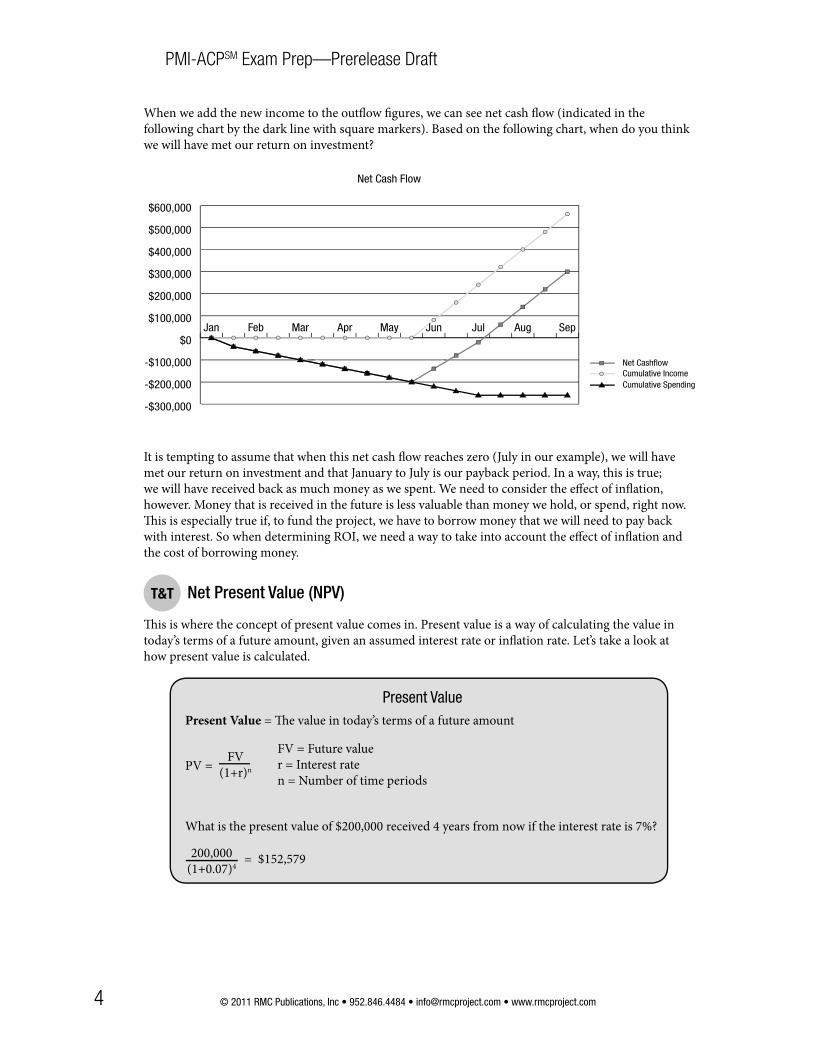
Now let’s apply the concept of present value to our sample project. In the following chart, the line with X markers indicates the present value of the money we will receive in the future, based on a projected interest rate of 2 percent (to represent infl ation).
-$300,000
-$200,000
-$100,000
$0
$100,000
$200,000
$300,000
$400,000
$500,000
$600,000
PV at 10%Net CashflowCumulative IncomeCumulative Spending
SepAugJulJunMayAprMarFebJan
Present Value
Now let’s take the concept of present value further, to net present value (NPV). NPV is the total benefi ts (the income minus costs) for a revenue stream adjusted to today’s value. Organizations have found present value calculations and the resulting ability to compare money going out and money coming in so valuable that NPV is widely used to evaluate project returns.
Net Present ValueNet Present Value = Th e total benefi ts (income minus the costs) for a revenue stream
NPV = Io + I1
(1+r)1 +
I2
(1+r)2 ... +
In
(1+r)n
What is the net present value of a project that costs $300,000 in the fi rst year and returns $80,000 for the next 4 years, assuming a discount rate of 5%?
-300,000 + 80,000(1+0.05)
+ 80,000(1+0.05)2
+ 80,000(1+0.05)3 + 80,000
(1+0.05)4 = –$16,324
I = Income for each yearr = Discount raten = Number of time periods
By using NPV to assess our project cost and income streams we can fi nd, aft er adjustment for infl ation, the true ROI point and payback period. In large multiyear projects, the payback period can be substantially longer, especially if money to invest in projects is borrowed at high interest rates.
T&T Internal Rate of Return (IRR)
Now let’s look at the internal rate of return technique. Th e IRR calculation helps simplify the evaluation of projects by turning the return on investment period around. Rather than using an interest rate

6 © 2011 RMC Publications, Inc • 952.846.4484 • [email protected] • www.rmcproject.com
PMI-ACPSM Exam Prep—Prerelease Draft
to calculate a value of an investment in today’s terms, it uses duration and payback information to calculate an eff ective interest rate for the project.
Th e offi cial defi nition of IRR is the discount rate “at which the project infl ows (revenues) and project outfl ows (costs) are equal.” In other words, “What discount rate would I have to use to move the true payback period to the end of my project?” From an economic perspective, the higher the rate, the better the project.
Internal Rate of ReturnFrom an economic perspective, the higher the discount rate, the better the project is.
If Project A has an IRR of 25% and Project B has an IRR of 18%, choose Project A to maximize the rate of return.
Planning Value
Now that we’ve discussed ways of assessing value when selecting projects, let’s look at how value-driven delivery plays out in planning a project aft er it has been selected. Th e focus on value-driven delivery permeates the agile planning process. We prioritize the work to be done on a project according to business value, putting high-value deliverables at the top of the list, or backlog. When we start working on the project, we start with the items at the top of the backog. Change requests and defect fi xes—in fact any work that wasn’t initially planned and is added later—are prioritized in the backlog based on their business value and whether they are deemed more important than the existing items on the list.
Th e concept of planning value comes up a lot in the PMI-ACP exam content outline, particularly in the Tools and Techniques of chartering, value stream mapping, relativ e prioritization/ranking, and the product roadmap. Since risks can reduce value, we also need to address them in planning through tools like a risk adjusted backlog. Let’s review each of these T&T in turn, focusing on what you need to know for the PMI-ACP exam.
T&T Chartering
Th e technique of chartering in agile projects has the same general goal as the Develop Project Charter process defi ned in the PMBOK® Guide, but the level of detail and the set of assumptions are diff erent. Like a nonagile charter, the goal of an agile charter is to describe the project at a high level, gain agreement about the project’s W5+ (What, Why, Who, When, Where, and How) attributes, and obtain the authority to proceed. However, since agile methods are oft en used on projects with uncertainty around the requirements or technology and where high levels of changes are expected, there is typically less certainty around scope.
As a result, agile charters generally have less detail than nonagile charters, are shorter documents, and focus more on how the project will be run than on what exactly will be built. When aiming at a static target (with unchanging requirements or technology), it is appropriate to plan, plan some more, and then execute. But on a dynamic project with a moving target, a high degree of planning may be inappropriate because elements of the project are likely to change and to do so quickly. For such projects, we need to allow for mid-fl ight adjustments and make sure we have the processes (i.e., prioritization, demos, retrospectives, etc.) in place to allow us to make such adjustments eff ectively and effi ciently.
7© 2011 RMC Publications, Inc • 952.846.4484 • [email protected] • www.rmcproject.com
Value Driven Delivery CHAPTER 3
Any elements of the agile methodology that may be diff erent for an organization, such as how changes are approved and then, upon approval, prioritized into the backlog, should be clearly outlined in the charter. Th is is especially important if the agile methodology is new to the organization and if any part of the approach is a departure from how aspects of a project, such as change control and inclusion, were handled in the past.
We will discuss agile charters in more detail in the Adaptive Planning chapter. For purposes of the Value-Driven Delivery domain, understand that chartering in an agile environment results in a fl exible document to allow the team to respond to changing needs and technology and to ultimately deliver high-value components that the organization can begin using quickly.
T&T Value Stream Mapping
Value stream mapping is a lean manufacturing technique that has been adopted by agile methods. Th is technique illustrates the fl ow of information (or materials) required to complete a process. It can help determine elements of waste that could be removed to improve the effi ciency of the process. Value stream mapping usually involves creating visual maps of the process (value stream maps) and follows these steps:
1. Identify the product or service that you are analyzing.2. Create a value stream map of the current process identifying steps, queues, delays, and information
fl ows.3. Review the map to fi nd delays, waste, and constraints.4. Create a new value stream map of the future state optimized to remove or reduce delays, waste,
and constraints.5. Develop a roadmap to create the optimized state.6. Plan to revisit the process in the future to continually tune and optimize.
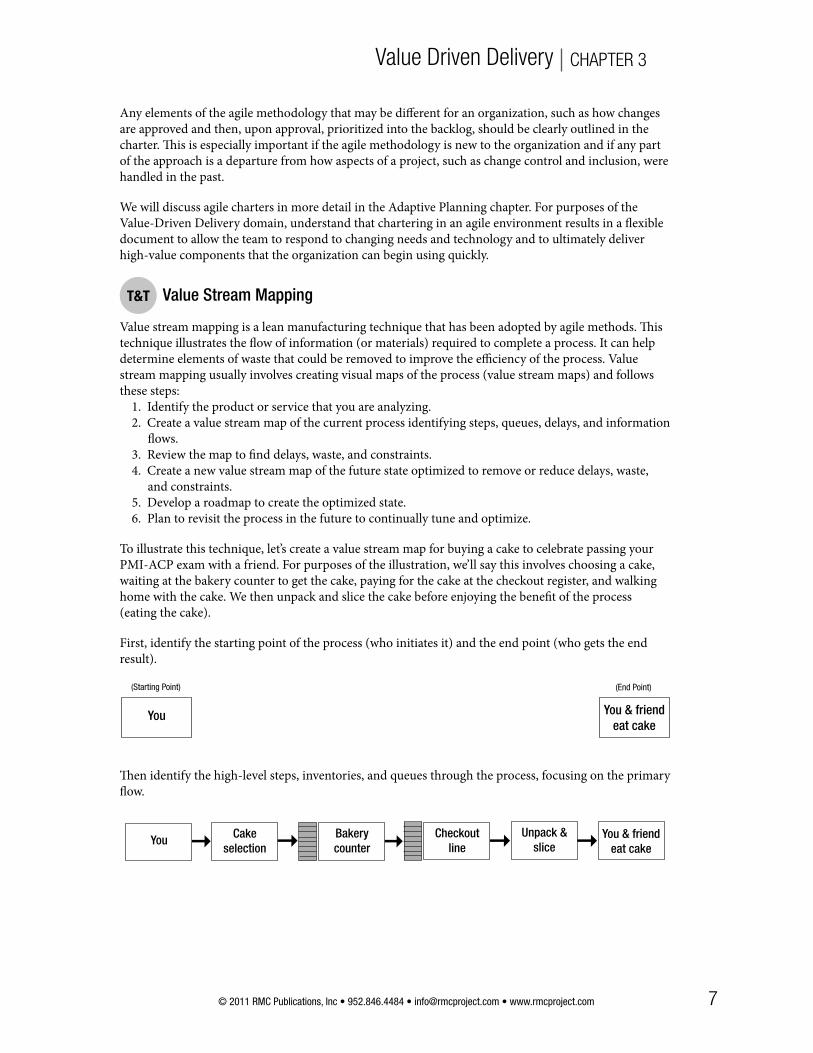
To illustrate this technique, let’s create a value stream map for buying a cake to celebrate passing your PMI-ACP exam with a friend. For purposes of the illustration, we’ll say this involves choosing a cake, waiting at the bakery counter to get the cake, paying for the cake at the checkout register, and walking home with the cake. We then unpack and slice the cake before enjoying the benefi t of the process (eating the cake).
First, identify the starting point of the process (who initiates it) and the end point (who gets the end result).
You You & friend eat cake
(Starting Point) (End Point)
Th en identify the high-level steps, inventories, and queues through the process, focusing on the primary fl ow.
You You & friend eat cake
Cake selection
Bakery counter
Checkoutline
Unpack &slice
8 © 2011 RMC Publications, Inc • 952.846.4484 • [email protected] • www.rmcproject.com
PMI-ACPSM Exam Prep—Prerelease Draft
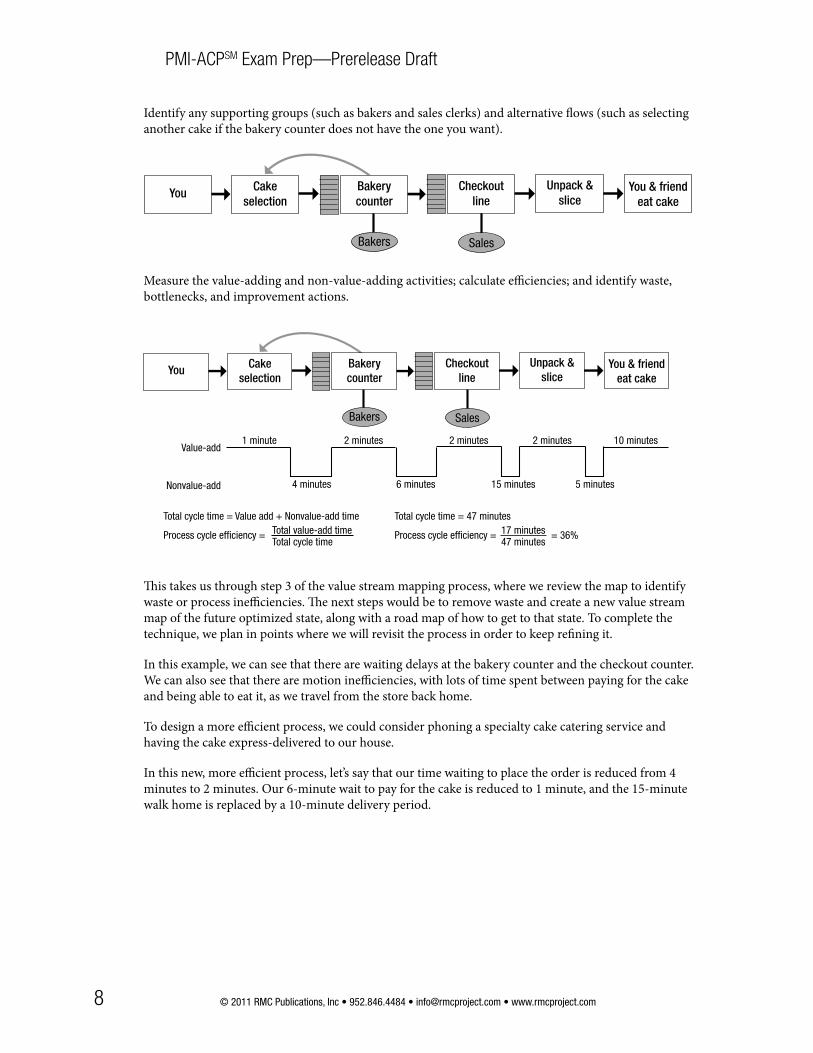
Identify any supporting groups (such as bakers and sales clerks) and alternative fl ows (such as selecting another cake if the bakery counter does not have the one you want).
You You & friend eat cake
Cake selection
Bakery counter
Checkoutline
Unpack &slice
Bakers Sales
Measure the value-adding and non-value-adding activities; calculate effi ciencies; and identify waste, bottlenecks, and improvement actions.
You You & friend eat cake
Cake selection
Bakery counter
Checkoutline
Unpack &slice
Bakers Sales
Value-add
Nonvalue-add
1 minute
4 minutes
2 minutes
6 minutes
2 minutes
15 minutes
2 minutes
5 minutes
10 minutes
Total cycle time = Value add + Nonvalue-add time
Process cycle efficiency =
Total cycle time = 47 minutes
Process cycle efficiency = = 36%Total value-add timeTotal cycle time
17 minutes47 minutes
Th is takes us through step 3 of the value stream mapping process, where we review the map to identify waste or process ineffi ciencies. Th e next steps would be to remove waste and create a new value stream map of the future optimized state, along with a road map of how to get to that state. To complete the technique, we plan in points where we will revisit the process in order to keep refi ning it.
In this example, we can see that there are waiting delays at the bakery counter and the checkout counter. We can also see that there are motion ineffi ciencies, with lots of time spent between paying for the cake and being able to eat it, as we travel from the store back home.
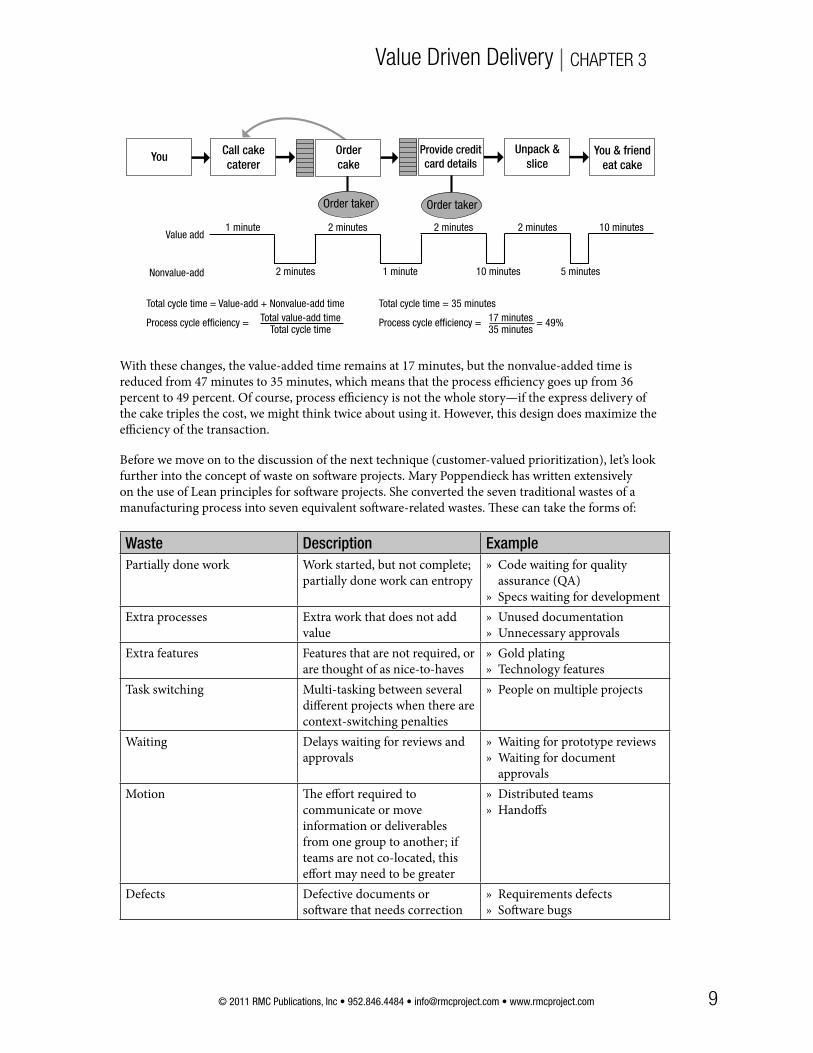
To design a more effi cient process, we could consider phoning a specialty cake catering service and having the cake express-delivered to our house.
In this new, more effi cient process, let’s say that our time waiting to place the order is reduced from 4 minutes to 2 minutes. Our 6-minute wait to pay for the cake is reduced to 1 minute, and the 15-minute walk home is replaced by a 10-minute delivery period.
9© 2011 RMC Publications, Inc • 952.846.4484 • [email protected] • www.rmcproject.com
Value Driven Delivery CHAPTER 3
You You & friend eat cake
Call cake caterer
Provide credit card details
Unpack &slice
Order taker Order taker
Value add
Nonvalue-add
1 minute
2 minutes
2 minutes
1 minute
2 minutes
10 minutes
2 minutes
5 minutes
10 minutes
Total cycle time = Value-add + Nonvalue-add time
Process cycle efficiency =
Total cycle time = 35 minutes
Process cycle efficiency = = 49%
Order cake
Total value-add timeTotal cycle time
17 minutes35 minutes
With these changes, the value-added time remains at 17 minutes, but the nonvalue-added time is reduced from 47 minutes to 35 minutes, which means that the process effi ciency goes up from 36 percent to 49 percent. Of course, process effi ciency is not the whole story—if the express delivery of the cake triples the cost, we might think twice about using it. However, this design does maximize the effi ciency of the transaction.
Before we move on to the discussion of the next technique (customer-valued prioritization), let’s look further into the concept of waste on soft ware projects. Mary Poppendieck has written extensively on the use of Lean principles for soft ware projects. She converted the seven traditional wastes of a manufacturing process into seven equivalent soft ware-related wastes. Th ese can take the forms of:
Waste Description ExamplePartially done work Work started, but not complete;
partially done work can entropy» Code waiting for quality
assurance (QA)» Specs waiting for development
Extra processes Extra work that does not add value
» Unused documentation» Unnecessary approvals
Extra features Features that are not required, or are thought of as nice-to-haves
» Gold plating» Technology features
Task switching Multi-tasking between several diff erent projects when there are context-switching penalties
» People on multiple projects
Waiting Delays waiting for reviews and approvals
» Waiting for prototype reviews» Waiting for document
approvalsMotion Th e eff ort required to
communicate or move information or deliverables from one group to another; if teams are not co-located, this eff ort may need to be greater
» Distributed teams» Handoff s
Defects Defective documents or soft ware that needs correction
» Requirements defects» Soft ware bugs

10 © 2011 RMC Publications, Inc • 952.846.4484 • [email protected] • www.rmcproject.com
PMI-ACPSM Exam Prep—Prerelease Draft
T&T Customer-Valued Prioritization
Customer-valued prioritization is concerned with working on the items that yield the highest value to the customer as soon as possible. Th is technique aims to engage the customer in the prioritization process, in which the team identifi es high-value features and moves them up the backlog of items to work on.
Th e use of customer-valued prioritization schemes is a common thread through the diff erent agile methods. While the terminology oft en varies—Scrum, for instance, has a “product backlog,” FDD has a “feature list,” and DSDM has a “prioritized requirements list”—the idea is the same. Th e project works through a prioritized list of items that have discernable customer value.
Prioritization is essential for the team to be able to adjust the scope to meet budget or timeline objectives while still retaining the useful set of functionality that makes up the minimum marketable release. For example, in the following diagram, items A through D are part of the defi ned minimum marketable release. If scope needs to be cut to meet the budget and schedule objectives, adjustments should be made to item E. (See the Adaptive Planning chapter of this book for a related discussion of the minimally marketable feature tool.)
A
B
C
D
E
Prioritizedlist
} Minimummarketablerelease
Cut-offto meetbudget/time
Prioritization also provides a framework for deciding if and when to incorporate changes. When a change is requested, the team can ask the business, “What items are more important than this change?” Th e new change can then be inserted into the prioritized work list at the appropriate point (see the following diagram).
A
B
C
D
E
Prioritizedlist
Changeconsideredand prioritized
Cut-offto meetbudget/time
1
Δ
A
B
Prioritizedlist
Changeaccepted,deferring “E”
C
D
E
Cut-offto meetbudget/time
2
Δ

11© 2011 RMC Publications, Inc • 952.846.4484 • [email protected] • www.rmcproject.com
Value Driven Delivery CHAPTER 3
While agile methods provide tremendous fl exibility in accepting late-breaking changes, they cannot bend the laws of time and space. So if your project time or budget was estimated to be fully consumed with the current scope, then adding a new change will inevitably force a lower priority feature below the “cutoff point” of what you expect to deliver. So, yes, we can accept late-breaking changes on projects—but only at the expense of lower-priority work items.
An advantage of having a single prioritized work list is that it simplifi es the view of the remaining work. Rather than having separate “buckets” of work representing change requests, defect fi xes, and new features, a single prioritized list combining these items gives people a clear, complete view of all remaining work. When fi rst adopting an agile approach, many teams miss this point and instead retain separate budgets for bug fi xes and changes. Th is separation muddies velocity, however. A single prioritized list of work-to-be-done, regardless of its origin, off ers better transparency and trade-off control.
Prioritization SchemesTh e prioritization schemes used vary from method to method—and sometimes project to project—based on what works for the business. Let’s look at a few examples. One of the simplest schemes is to label items as “Priority 1,” “Priority 2,” “Priority 3,” etc. While this approach is straightforward, it can be problematic in that people have a tendency to designate everything a “Priority 1.” If too many items are labelled “Priority 1,” the scheme becomes ineff ective. Business representatives rarely ask for a new feature and say it should be a Priority 2 or 3, since they know that low-priority items risk getting cut out of the project. For the same reasons, “high,” “medium,” and “low” prioritizations can also be problematic. Without a shared, defendable reason for what defi nes “high,” we end up with too many items in this category and a lack of true priority.
Th e MoSCoW prioritization scheme, popularized by DSDM, is another example. Th is scheme derives its name from the fi rst letters of the following labels:
» “Must have”» “Should have”» “Could have”» “Would like to have, but not this time”
MoSCoW presents categories that are easier to defend than the “Priority 1” or “High Priority” labels of the simpler schemes we just discussed. “Must-have” requirements or features are those that are fundamental to the system; without them, the system does not work or has no value. “Should have” features are important—by defi nition, we should have them for the system to work correctly; if they are not there, then the workaround will likely be costly or cumbersome. “Could have” features are useful net additions that add tangible value, and “Would like” requirements are the “nice-to-have” requests that are duly noted—but unlikely to make the cut.
Another approach I have seen work well is giving sponsors Monopoly money equalling the amount of the project budget and asking them to distribute it amongst the system features. Th is approach is useful for identifying the general priority of system components, but it can be taken too far if the people distributing the money start to question activities like documentation that they perceive as having a low value-add to the project. Th e Monopoly money technique is most eff ective when it’s limited to prioritizing business features.
Th e 100-Point Method, originally developed by Dean Leffi ngwell and Don Widrig for use cases, is another way to prioritize features. In this method, each stakeholder is given 100 points that he or she can use to vote for the most important requirements. How the stakeholders distribute the 100 points is up to them: 30 here, 15 there, or even all 100 on a single requirement if that is their only priority.

12 © 2011 RMC Publications, Inc • 952.846.4484 • [email protected] • www.rmcproject.com
PMI-ACPSM Exam Prep—Prerelease Draft
Kano analysis, developed in the 1980s by Professor Noriaki Kano, can also be used as a prioritization scheme. Th is technique classifi es customer preferences into categories, such as delighters/exciters, satisfi ers, dissatisfi ers, and indiff erent. It can help the team better understand how needs relate to customer satisfaction. Kano analysis can set the context for questions about features and help build release plans that promote improved customer satisfaction.
Needwell fulfilled
Neednot fulfilled
Satisfied
Dissatisfied
Delighters /
Exciters
Satisfiers
Dissatisfiers
Indifferent
As noted in the previous paragraph, Kano analysis places requirements into diff erent categories. Some features are Exciters; they deliver unexpected, novel, or new high-value benefi ts to the customer. For example, an exciter feature could be the visual mapping of data that was previously only available in tabular form. Exciters yield high levels of customer support.
For features that are categorized as Satisfiers, the more the better. Th ese features bring value to the customer, For example, a useful reporting function could be a Satisfi er. Dissatisfiers are things that will cause a user to dislike a product if they are not there, but these features will not necessarily raise satisfaction if they are present. For example, the ability to change a password within the system could be a Dissatisfi er.
Th e fi nal category is Indifferent. Th ese features have no impact on customers one way or another. As customers are indiff erent to them, we should look to eliminate, minimize, or defer them.
Th e Requirements Prioritization Model created by Karl Wiegers is a more mathematically rigorous method of calculating priority than the other schemes we’ve discussed. Every proposed feature is rated for benefi t, penalty, cost, and risk on a relative scale of 1 (lowest) to 9 (highest). Customers rate the benefi t score for having the feature and the penalty score for not having it. Developers rate the cost of producing the feature and the risk associated with producing it. Aft er entering the numbers for all the features, the relative priority for each feature is calculated using a weighted formula.
T&T Relative Prioritization / Ranking
Regardless of the prioritization scheme being used, the focus should be on the end goal—understanding the priority of features. Sometimes the eff ort involved in refereeing the schemes can detract from meaningful discussions about prioritization. For this reason, I am personally a fan of simply asking

13© 2011 RMC Publications, Inc • 952.846.4484 • [email protected] • www.rmcproject.com
Value Driven Delivery CHAPTER 3
the business to list features in priority order—no category 1, 2, or 3; no high, medium, or low; no must haves, etc. A simple list (whether this is created in a spreadsheet or in an agile requirements management tool) removes the categories that people tend to fi xate upon from the debate and allows the focus of the discussion to be on priorities.
Although I endorse the use of a simple list, there is no single best way to always prioritize features on every project. Whatever technique you use, try to diagnose issues arising in the prioritization process, be it “lack of involvement” or “too many priority 1s.” You can then add in diff erent approaches, such as using Monopoly money, applying the MoSCoW prioritization scheme, or simply listing the features in order of priority, to see if you can resolve the issues by framing the discussion in a new way. Th e goal of such eff orts is to understand where features lie in relation to each other, rather than to simply assign a category label. You will then end up with a fl exible list of prioritized requirements that you can revisit and reprioritize as needed. Th is allows you to maintain the agility to deliver the highest value set of features within the available time and budget.
T&T Product Roadmap
A product roadmap is a visual overview of a product’s releases and its main components. It is a communication tool that provides project stakeholders with a quick view of the primary release points and intended functionality. Th ere is no one set way of depicting a product roadmap, but story maps, popularized by Jeff Patton, are a commonly used approach.
Story maps help select and group features for a release. Th ese diagrams show the sequence of the features and indicate their importance to the project by classifying them as “backbone,” “walking skeleton,” or additional features. All systems have some essential functionality that they need to perform. Th is essential functionality makes up the backbone of the system. Th ere is little point overly prioritizing such functions; they just need to be in the system. Hanging off of the backbone is the walking skeleton functionality. Th e walking skeleton describes the smallest system that could possibly work. Finally, any remaining features hang below the walking skeleton and are prioritized by their importance to the system. See the following diagram for an example of a story map.
SequenceBackbone
Walking skeleton
Optio
nalit
y
More optional
Less optional
Once the features are placed on the map according to their importance and sequence, the customer’s priorities are balanced with the team’s capacity to deliver, and the releases that will make up the product

14 © 2011 RMC Publications, Inc • 952.846.4484 • [email protected] • www.rmcproject.com
PMI-ACPSM Exam Prep—Prerelease Draft
roadmap are identifi ed. See the following diagram for an example of a product road map showing the fi rst, second, and third release.
SequenceBackbone
Walking skeleton
Optio
nalit
y
More optional
Less optional
First Release
Second Release
Third Release
Using this approach, the fi nal product roadmap consists of collections of story maps and shows what will go into each release. It depicts what is absolutely essential for the system (the backbone) and necessary for the solution (the walking skeleton), along with the other features that will comprise later releases.
T&T Risk Adjusted Backlog
As we discussed at the start of this chapter, risks are like anti-value; should they occur, they take time and resources away from eff orts that deliver value and they threaten the project benefi ts. Th erefore, we should not only plan to deliver high-business-value features early, but we should plan to execute risk avoidance and risk mitigation activities early, too.
Risk management may seem like a traditional, process-driven project management eff ort that would not work well in an agile environment. However, agile methods are great risk reduction vehicles and are actually very well suited for rapidly identifying and reducing risks. Let’s explore risk management in more detail, starting with the defi nition of a risk.
A risk is an event or circumstance that could transpire and impact the project. Most risk literature focuses on events that have the potential to negatively impact or threaten the project, but the PMBOK® Guide also talks about good risks, or opportunities, for the project.
Th e following diagram shows the risk management process that is outlined in the PMBOK® Guide:
Plan RiskManagement
Identify Risks
PerformQuantitativeRisk Analysis
Plan RiskResponses
Monitor & Control Risks
PerformQualitative
Risk Analysis
(1 Decide how)
(2 Find them)
(3 Sift)
(4 Measure)
(5 Decide actions)
(6 Act and measure)
15© 2011 RMC Publications, Inc • 952.846.4484 • [email protected] • www.rmcproject.com
Value Driven Delivery CHAPTER 3
One step that appears to be absent from this process is a “Risk Response Doing” step in which the actions identifi ed in the risk mitigation plan are completed. Th is step is not actually missing; instead the PMBOK® Guide moves these activities to the project management plan, where they are scheduled with the regular work activities. Th e apparent lack of a “doing” step does mirror a problem seen on many projects, however—namely, that risk management is undertaken as a separate (sometimes once only) passive activity that does not drive enough action on the project to prevent the risks from happening. As a result, we see risks occurring and can point to where they were identifi ed on the risk list, yet not enough was done to prevent them.
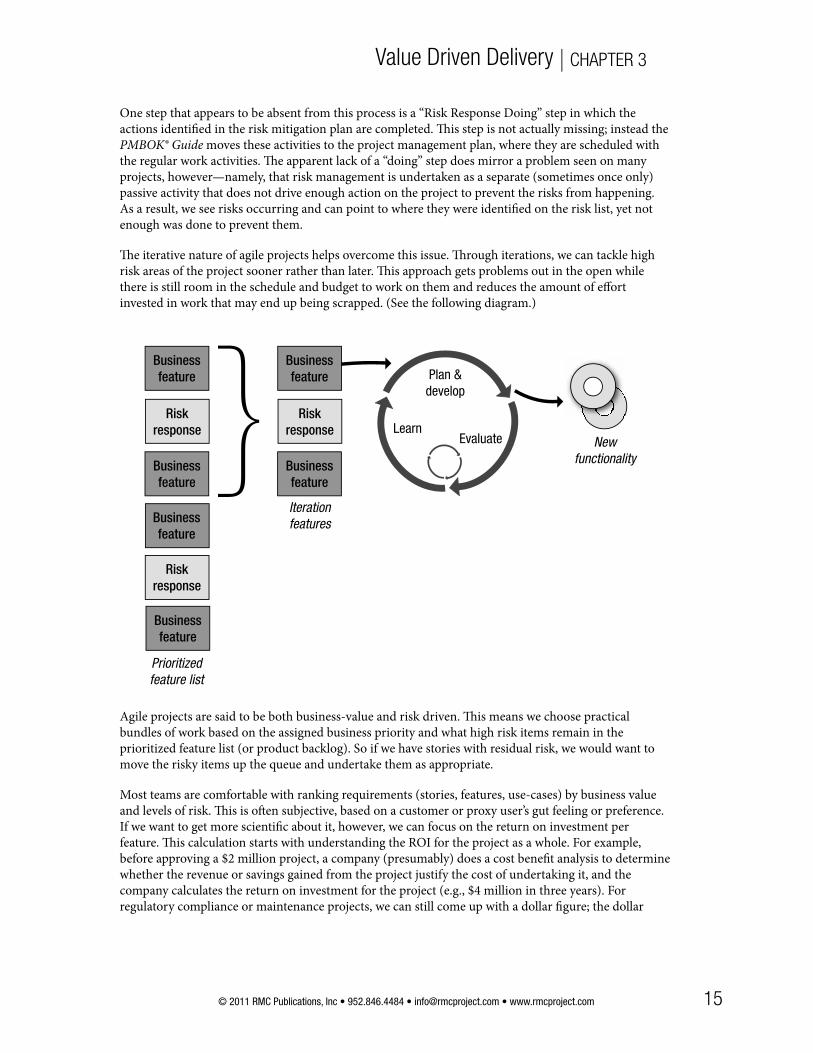
Th e iterative nature of agile projects helps overcome this issue. Th rough iterations, we can tackle high risk areas of the project sooner rather than later. Th is approach gets problems out in the open while there is still room in the schedule and budget to work on them and reduces the amount of eff ort invested in work that may end up being scrapped. (See the following diagram.)
Business feature
Prioritizedfeature list
}Risk response
Business feature
Business feature
Business feature
Risk response
Business feature
Risk response
Business feature
Iterationfeatures
Plan &develop
LearnEvaluate New
functionality
Agile projects are said to be both business-value and risk driven. Th is means we choose practical bundles of work based on the assigned business priority and what high risk items remain in the prioritized feature list (or product backlog). So if we have stories with residual risk, we would want to move the risky items up the queue and undertake them as appropriate.
Most teams are comfortable with ranking requirements (stories, features, use-cases) by business value and levels of risk. Th is is oft en subjective, based on a customer or proxy user’s gut feeling or preference. If we want to get more scientifi c about it, however, we can focus on the return on investment per feature. Th is calculation starts with understanding the ROI for the project as a whole. For example, before approving a $2 million project, a company (presumably) does a cost benefi t analysis to determine whether the revenue or savings gained from the project justify the cost of undertaking it, and the company calculates the return on investment for the project (e.g., $4 million in three years). For regulatory compliance or maintenance projects, we can still come up with a dollar fi gure; the dollar

16 © 2011 RMC Publications, Inc • 952.846.4484 • [email protected] • www.rmcproject.com
PMI-ACPSM Exam Prep—Prerelease Draft
amount is related to the economic penalties for non-compliance (fi nes, lost business, etc). (See the Assessing Value discussion earlier in this chapter for more on how ROI is used to select projects.)
Once we have a ROI fi gure for a project, the business representatives (not the development team) should distribute or pro-rate this amount across the identifi ed features. Business representatives oft en push back at this idea with comments like, “I can’t put a dollar value on a sales report; that would be too subjective or misleading.” It can be helpful to remind them that someone came up with a projected payback for this project. If it cannot be divided across the system’s features, then where did the fi gure come from in the fi rst place?
Aft er the business representatives have (perhaps somewhat arbitrarily) attributed a dollar value to the system features, we have a prioritized feature list with ROI values. See the example in the following diagram.
Prioritizedrequirements
list
Must
Must
Must
Should
Should
Should
Could
$5,000
$4,000
$3,000
$2,000
$1,000
$500
$100
Now we need some way of monetizing all the risk avoidance and risk mitigation requirements. To get this fi gure, we can calculate the expected monetary value of the risk. For purposes of a sample calculation, let’s assume using an in-house reporting tool has no cost to the project but buying a high-performance reporting engine will cost $10,000. Th ere is a 50 percent chance we will need the high-performance tool. With this data, we can calculate expected monetary value using the following formula:
Risk Expected Monetary Value = Risk Impact (in dollars) × Risk Probability (as a percentage)
So in our example, $10,000 × 50% = $5,000. Th is fi gure allows us to say to the project sponsors that we believe the economic value to the organization of mitigating this risk is $5,000; therefore, its development priority should be on par with functional features valued at $5,000.
Th is calculation can be done for most risks. Technical risks usually have a purchase cost (e.g., $10,000 for a high-performance reporting engine) or a time penalty (e.g., it will take two developers another three weeks) that can be translated into a dollar amount. Human resource and business risks can likewise be estimated in monetary terms. We tend to think some things cannot have a value assigned to them, but insurance companies are able to determine a value for a lost fi nger or emotional distress for clients. Th e same concept applies to assigning value to project risks. It is important to remember that we are looking for relative scorings rather than precise numbers. In many cases, the initial ROI fi gure the business established to justify the project is suspect anyway, so we should not get hung up on the level of accuracy of the risk values. Instead, the focus should be on coming up with general, justifi able numbers that have consensus from the project stakeholders to use as a basis for prioritization, not a balance sheet.
17© 2011 RMC Publications, Inc • 952.846.4484 • [email protected] • www.rmcproject.com
Value Driven Delivery CHAPTER 3
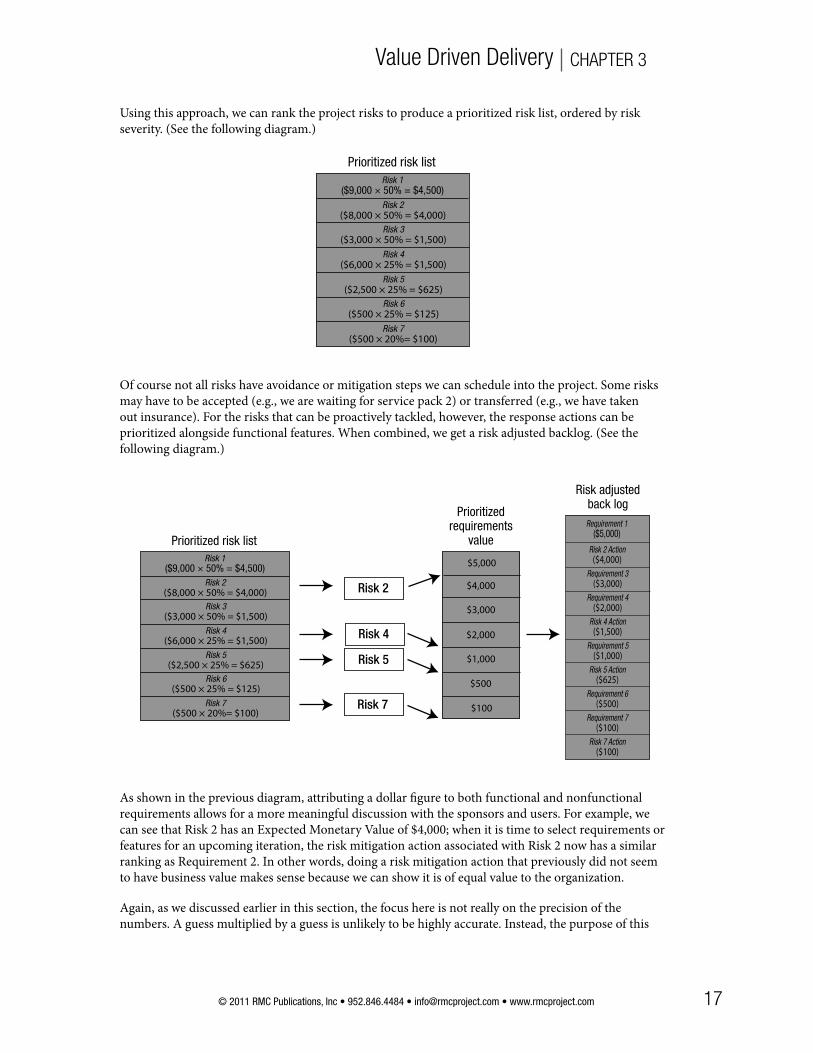
Using this approach, we can rank the project risks to produce a prioritized risk list, ordered by risk severity. (See the following diagram.)
Prioritized risk list
Risk 2($8,000 × 50% = $4,000)
Risk 1($9,000 × 50% = $4,500)
Risk 3($3,000 × 50% = $1,500)
Risk 4($6,000 × 25% = $1,500)
Risk 5($2,500 × 25% = $625)
Risk 6($500 × 25% = $125)
Risk 7($500 × 20%= $100)
Of course not all risks have avoidance or mitigation steps we can schedule into the project. Some risks may have to be accepted (e.g., we are waiting for service pack 2) or transferred (e.g., we have taken out insurance). For the risks that can be proactively tackled, however, the response actions can be prioritized alongside functional features. When combined, we get a risk adjusted backlog. (See the following diagram.)
Prioritizedrequirements
value
Risk adjusted back log
$4,000
$3,000
$5,000
$2,000
$1,000
$500
$100
Prioritized risk list
Risk 2($8,000 × 50% = $4,000)
Risk 1($9,000 × 50% = $4,500)
Risk 3($3,000 × 50% = $1,500)
Risk 4($6,000 × 25% = $1,500)
Risk 5($2,500 × 25% = $625)
Risk 6($500 × 25% = $125)
Risk 7($500 × 20%= $100)
Risk 2 Action($4,000)
Requirement 1($5,000)
Requirement 3($3,000)
Requirement 4($2,000)
Risk 4 Action($1,500)
Requirement 5($1,000)
Risk 5 Action($625)
Requirement 6($500)
Requirement 7($100)
Risk 7 Action($100)
Risk 5
Risk 4
Risk 2
Risk 7
As shown in the previous diagram, attributing a dollar fi gure to both functional and nonfunctional requirements allows for a more meaningful discussion with the sponsors and users. For example, we can see that Risk 2 has an Expected Monetary Value of $4,000; when it is time to select requirements or features for an upcoming iteration, the risk mitigation action associated with Risk 2 now has a similar ranking as Requirement 2. In other words, doing a risk mitigation action that previously did not seem to have business value makes sense because we can show it is of equal value to the organization.
Again, as we discussed earlier in this section, the focus here is not really on the precision of the numbers. A guess multiplied by a guess is unlikely to be highly accurate. Instead, the purpose of this
18 © 2011 RMC Publications, Inc • 952.846.4484 • [email protected] • www.rmcproject.com
PMI-ACPSM Exam Prep—Prerelease Draft
exercise is to facilitate better discussions with the business regarding how to best sequence the work items. If people start rigging the numbers to serve their personal agendas, the purpose and true power of the process has been lost. And technical dependencies and sponsor mandates will take precedence over sequences derived from this approach. So think of the risk-adjusted backlog as a tool that uses numbers only to get to what is truly important—the priority of the work items that need to be done. Th e true benefi ts of this tool are in that it helps the business and the development team bridge a communications gap and have meaningful discussions about schedule and scope trade-off s. So although we assign numerical values to help level the playing fi eld, creating a risk adjusted backlog is really more a qualitative than quantitative practice.
K&S3
Agile Contracting
Now that we’ve discussed the Tools and Techniques used in planning value on agile projects, how does this agility work when a project is done on a contract basis? While agile methods provide great fl exibility and allow us to manage changing requirements and priorities, this adaptability and scope fl exibility can create contract problems when defi ning acceptance criteria and when outsourcing work.
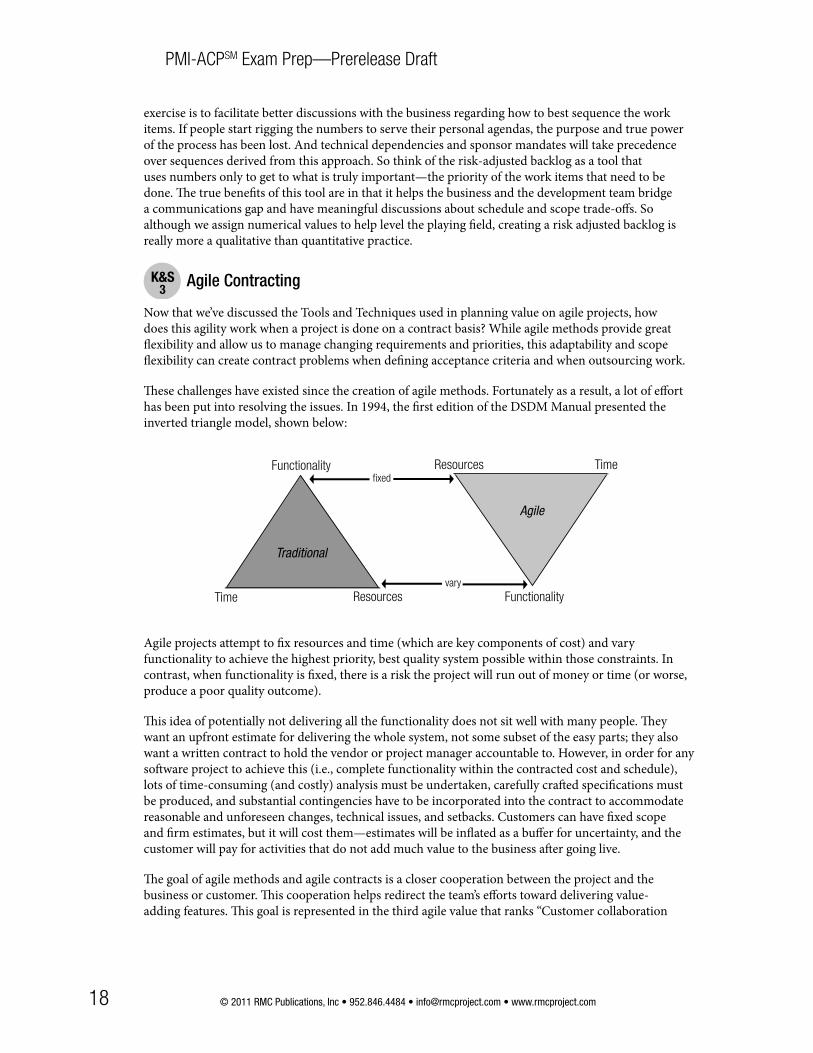
Th ese challenges have existed since the creation of agile methods. Fortunately as a result, a lot of eff ort has been put into resolving the issues. In 1994, the fi rst edition of the DSDM Manual presented the inverted triangle model, shown below:
Functionality
Time Resources
Traditional
vary
fixed
Agile
Resources Time
Functionality
Agile projects attempt to fi x resources and time (which are key components of cost) and vary functionality to achieve the highest priority, best quality system possible within those constraints. In contrast, when functionality is fi xed, there is a risk the project will run out of money or time (or worse, produce a poor quality outcome).
Th is idea of potentially not delivering all the functionality does not sit well with many people. Th ey want an upfront estimate for delivering the whole system, not some subset of the easy parts; they also want a written contract to hold the vendor or project manager accountable to. However, in order for any soft ware project to achieve this (i.e., complete functionality within the contracted cost and schedule), lots of time-consuming (and costly) analysis must be undertaken, carefully craft ed specifi cations must be produced, and substantial contingencies have to be incorporated into the contract to accommodate reasonable and unforeseen changes, technical issues, and setbacks. Customers can have fi xed scope and fi rm estimates, but it will cost them—estimates will be infl ated as a buff er for uncertainty, and the customer will pay for activities that do not add much value to the business aft er going live.
Th e goal of agile methods and agile contracts is a closer cooperation between the project and the business or customer. Th is cooperation helps redirect the team’s eff orts toward delivering value-adding features. Th is goal is represented in the third agile value that ranks “Customer collaboration

19© 2011 RMC Publications, Inc • 952.846.4484 • [email protected] • www.rmcproject.com
Value Driven Delivery CHAPTER 3
over contract negotiation.” An agile approach requires more trust between parties than the traditional approach, but it focuses resources on what they are trying to build rather than bogging them down in debates around how changes will be negotiated or what the completion criteria really is.
An agile approach also requires the business to be more involved in providing feedback on iterations, reprioritizing the backlog, and evaluating the value of change requests against the remaining work items. For trusting, invested clients, agile contracts are great tools for extracting more value and give the clients a competitive advantage. For untrusting or hands-off clients, agile contracts will be a tough sell and may not be suitable.
DSDM ContractTh ere are diff erent ways agile contracts can be structured. For purposes of the exam, let’s briefl y look at some of them, starting with the DSDM contract. In 1996, the DSDM Consortium commissioned a legal team to draft an agile contract. Th is contract, which has continued to evolve, focuses on work being “fi t for business purpose” and passing tests, rather than matching a specifi cation. Th e DSDM contract is used primarily in the United Kingdom and Europe.
Money for Nothing and Change for FreeJeff Sutherland also promotes a structure for an agile contract in his popular article, “Money for Nothing and Your Change for Free.” In the article, he suggests early termination options and proposes a model that allows for fl exibility in making changes. Th e structure Sutherland promotes starts with a standard fi xed-price contract that includes time and materials for additional work. He then inserts a “change for free” option clause.
Th e customer can only use this “change for free” clause by working with the team on every iteration. Failure to be engaged like this voids the clause, and the contract reverts back to time and materials. Assuming the customer stays engaged, the product owner can reprioritize the product backlog at the end of an iteration and changes are then free if the total contract work is not changed. Th is allows new features to be added for free if lower-priority items that require equal or greater amounts of time and eff ort are removed.
Want this new one!
Drop this one
Busi
ness
val
ue
Time
Change for Free
Like the “change for free” clause, the “money for nothing” concept is also only valid if the customer plays their part in the agile project. “Money for nothing” allows the customer to terminate the project

20 © 2011 RMC Publications, Inc • 952.846.4484 • [email protected] • www.rmcproject.com
PMI-ACPSM Exam Prep—Prerelease Draft
early when they feel there is no longer suffi cient ROI in the backlog to warrant further iterations. Th e supplier allows termination of the contract at any time for 20 percent of the remaining contract value.
Don’t do these two
Busi
ness
val
ue
Time
Money for Nothing
ROI cut-off
Stop here
✓ Customer gets best 80%
✓ Projects are done early!
✓ Supplier gets 20%
✓ Avoids code bloat
✓ Avoids unnecessary features
Th e 20 percent of the remaining contract value is the “money for nothing” part and helps off set the risk of having a team idle while the supplier pays their salaries. Using the “money for nothing” approach, the customer gets their top-priority business value, projects always fi nish early, and good relations are maintained with the supplier. In addition, the system stays effi cient without leading to code bloat and unnecessary features. Th e arrangement remains open to additional releases if required at the time and material rates.
Graduated Fixed Price ContractGraduated fi xed price contracts are promoted by Th orup and Jensen (2009) as another type of agile contract. With this contract, both parties share some of the risk reward associated with schedule variance. Th orup and Jensen suggest using diff erent hourly rates based on early, on-time, or late delivery. For example:
Project Completion Graduated Rate Total FeeFinish early $110 / hour $92,000Finish on time $100 / hour $100,000Finish late $90 / hour $112,000
Under this arrangement, if the supplier delivers on time, they get paid for the hours worked at the standard rate. If they deliver early, they get paid for fewer hours—but at a higher rate. Customers are happy because they get the work done early and pay less overall. Th e supplier is happy because they make a higher margin. However, if the supplier delivers late, they will get paid for more hours, but at a lower rate. When this occurs, both parties are somewhat unhappy since they are both losing money, but at a gradual, sustainable rate that hopefully does not lead to contract abandonment.
Fixed Price Work PackagesEstablishing fi xed price work packages is another approach to setting up an agile contract. Fixed price work packages mitigate the risks of under- or over-estimating a chunk of work by reducing scope and the costs involved. Marriott International (2009) successfully broke their Statements of Work (SOW) into

21© 2011 RMC Publications, Inc • 952.846.4484 • [email protected] • www.rmcproject.com
Value Driven Delivery CHAPTER 3
individual work packages, each with its own fi xed price. Th en as the work progressed, the supplier was allowed to reestimate the remaining work packages in the SOW based on new information and new risks.
Th is approach allows the customer to reprioritize remaining work based on evolving costs, and it gives the contractor the ability to update their costs if new details emerge, removing the need for the contractor to build excess contingency funds into the project cost. Th e changes are then localized to small components (i.e., the work packages) and if extra funding is required, it is easy to identify and justify the need. See the following diagrams for an illustration of a traditional SOW vs. fi xed price work packages.
$30k
TraditionalSOW
$15k
$5k
Fixed price work packages
$10k
Withoption to
reestimate
$12k
✓
✓
×
Th ese diff erent agile approaches to contracts can be pieced together to create a customized contract that benefi ts both the customer and the supplier; the customer retains fl exibility to reprioritize work, and the supplier is not penalized for sharing information about increased costs and does not have an incentive to add large amounts of contingency to the project cost. By combining elements of a graduated fi xed price contract and fi xed price work packages, along with the early termination (money for nothing) and reprioritization (change for free) concepts, you can create a contract that protects both parties and encourages positive behavior.
Although agile contracts can be highly benefi cial to both parties, we must remember that creating a contract between one party that wants to minimize cost for a product or service and another party that is in business to maximize revenue will always be a balancing act. Agile projects have traditionally been extra diffi cult where procurement is concerned since the scope is oft en not fully defi ned early in the project. In addition, the intangible nature of soft ware can make evaluation and acceptance diffi cult. Any type of procurement—whether it’s for agile or traditional contracts—works best when both parties want successful results that lead to future work. Final project success is determined by the levels of ongoing collaboration between the customer and supplier. Agile contracts will not generate or enforce that collaboration, but with some work and creativity, they can at least be better structured to support it.
Delivering Value
Now that we’ve discussed what’s involved in assessing and planning value for agile projects, let’s look at what it means to deliver value. Th e goal of delivering value is emphasized throughout the execution of agile projects. To accomplish this goal, the team should apply the lean concepts of maximizing value-delivering activities and minimizing “waste“ or compliance (non-value-adding activities). For example, activities such as time recording that may be necessary for an organization, but are not directly focused on delivering value, may be reduced or transferred while a project is being executed. Mary

22 © 2011 RMC Publications, Inc • 952.846.4484 • [email protected] • www.rmcproject.com
PMI-ACPSM Exam Prep—Prerelease Draft
Poppendieck’s seven soft ware-related wastes, which we discussed earlier in this chapter and are again outlined in the following table, are useful to consider when aiming to maximize value.
Waste Description ExamplePartially done work Work started, but not complete;
partially done work can entropy» Code waiting for quality
assurance (QA)» Specs waiting for
developmentExtra processes Extra work that does not add
value» Unused documentation» Unnecessary approvals
Extra features Features that are not required, or are thought of as nice-to-haves
» Gold plating» Technology features
Task switching Multi-tasking between several diff erent projects when there are context-switching penalties
» People on multiple projects
Waiting Delays waiting for reviews and approvals
» Waiting for prototype reviews» Waiting for document
approvalsMotion Th e eff ort required to
communicate or move information or deliverables from one group to another; if teams are no co-located, this eff ort may need to be greater
» Distributed teams» Handoff s
Defects Defective documents or soft ware that need correction
» Requirements defects» Soft ware bugs
Where we see activities on our projects that are wasteful, we can aim to eliminate them. Let’s look at a few Tools and Techniques that can clarify the project work and help identify and eliminate waste activities.
T&T Task and Kanban Boards
Task and Kanban boards can help deliver value on agile projects in a number of ways. While it may seem like a step backward to go from sophisticated soft ware scheduling tools to cards on a wall, the transition brings many benefi ts.
Th e technical features that Gantt charts provide can actually present some disadvantages on agile projects. Scheduling soft ware can illustrate very deep hierarchies of tasks, support task dependency integrity checks, and calculate interesting metrics like slack, subassembly costs, and resource utilization. Yet the technical sophistication of these tools is the principle reason they are not ideal for agile methods. Th e math, statistics, and reports that can be produced with these tools disguise the volatile nature of what is being analyzed—project tasks and estimates. In addition, sophisticated scheduling tools can alienate the team and discourage whole-team collaboration.
When we use tools that perform scheduling calculations and forecasting, two problems arise: data accuracy perception increases, and barriers for stakeholder interaction are created. Let’s look at these problems in more detail.
23© 2011 RMC Publications, Inc • 952.846.4484 • [email protected] • www.rmcproject.com
Value Driven Delivery CHAPTER 3
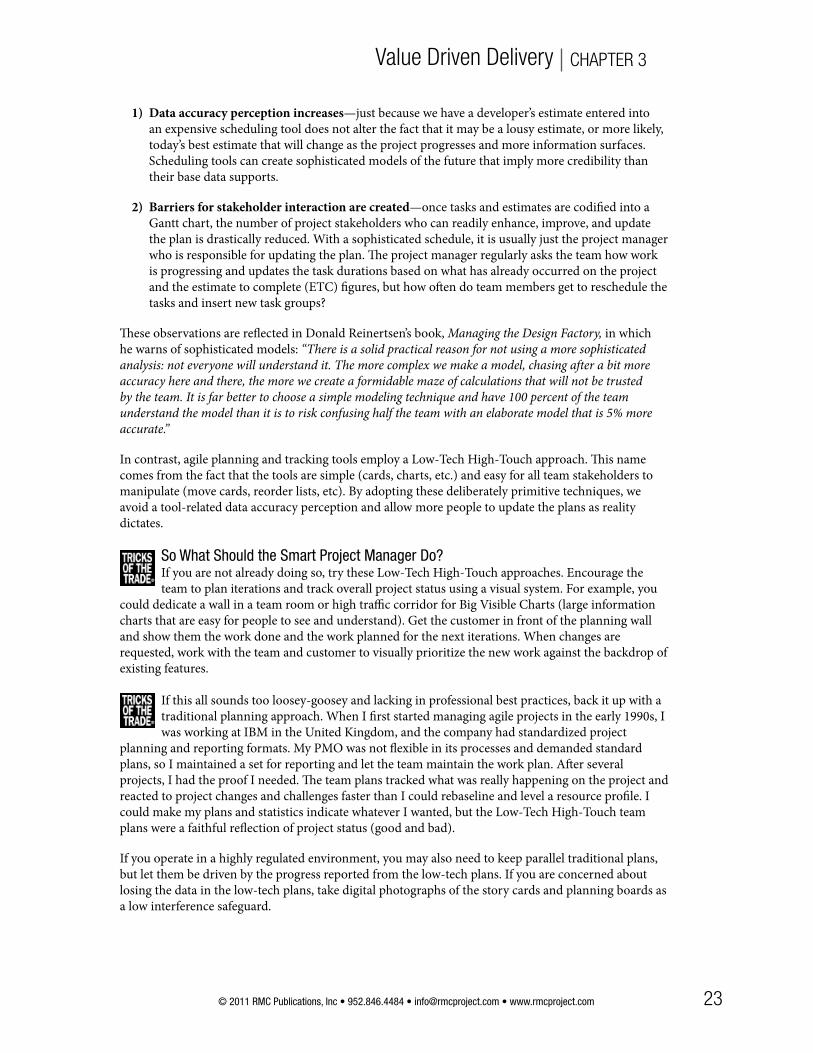
1) Data accuracy perception increases—just because we have a developer’s estimate entered into an expensive scheduling tool does not alter the fact that it may be a lousy estimate, or more likely, today’s best estimate that will change as the project progresses and more information surfaces. Scheduling tools can create sophisticated models of the future that imply more credibility than their base data supports.
2) Barriers for stakeholder interaction are created—once tasks and estimates are codifi ed into a Gantt chart, the number of project stakeholders who can readily enhance, improve, and update the plan is drastically reduced. With a sophisticated schedule, it is usually just the project manager who is responsible for updating the plan. Th e project manager regularly asks the team how work is progressing and updates the task durations based on what has already occurred on the project and the estimate to complete (ETC) fi gures, but how oft en do team members get to reschedule the tasks and insert new task groups?
Th ese observations are refl ected in Donald Reinertsen’s book, Managing the Design Factory, in which he warns of sophisticated models: “There is a solid practical reason for not using a more sophisticated analysis: not everyone will understand it. The more complex we make a model, chasing after a bit more accuracy here and there, the more we create a formidable maze of calculations that will not be trusted by the team. It is far better to choose a simple modeling technique and have 100 percent of the team understand the model than it is to risk confusing half the team with an elaborate model that is 5% more accurate.”
In contrast, agile planning and tracking tools employ a Low-Tech High-Touch approach. Th is name comes from the fact that the tools are simple (cards, charts, etc.) and easy for all team stakeholders to manipulate (move cards, reorder lists, etc). By adopting these deliberately primitive techniques, we avoid a tool-related data accuracy perception and allow more people to update the plans as reality dictates.
So What Should the Smart Project Manager Do?If you are not already doing so, try these Low-Tech High-Touch approaches. Encourage the team to plan iterations and track overall project status using a visual system. For example, you
could dedicate a wall in a team room or high traffi c corridor for Big Visible Charts (large information charts that are easy for people to see and understand). Get the customer in front of the planning wall and show them the work done and the work planned for the next iterations. When changes are requested, work with the team and customer to visually prioritize the new work against the backdrop of existing features.
If this all sounds too loosey-goosey and lacking in professional best practices, back it up with a traditional planning approach. When I fi rst started managing agile projects in the early 1990s, I was working at IBM in the United Kingdom, and the company had standardized project
planning and reporting formats. My PMO was not fl exible in its processes and demanded standard plans, so I maintained a set for reporting and let the team maintain the work plan. Aft er several projects, I had the proof I needed. Th e team plans tracked what was really happening on the project and reacted to project changes and challenges faster than I could rebaseline and level a resource profi le. I could make my plans and statistics indicate whatever I wanted, but the Low-Tech High-Touch team plans were a faithful refl ection of project status (good and bad).
If you operate in a highly regulated environment, you may also need to keep parallel traditional plans, but let them be driven by the progress reported from the low-tech plans. If you are concerned about losing the data in the low-tech plans, take digital photographs of the story cards and planning boards as a low interference safeguard.

24 © 2011 RMC Publications, Inc • 952.846.4484 • [email protected] • www.rmcproject.com
PMI-ACPSM Exam Prep—Prerelease Draft
T&T WIP Limits
Work In Progress (WIP) (sometimes known as Work in Process or even Work In Play) is the term given to work that has been started, but has not yet been completed.
Excessive WIP is associated with a number of problems, including:» WIP consumes investment capital and delivers no return on the investment until it is converted
into an accepted product. It represents money spent with no return, something we want to limit.» WIP hides bottlenecks in processes that slow overall workfl ow (or throughput), and it masks
effi ciency issues.» WIP also represents risk in the form of potential rework, since there may still be changes to items
until those items have been accepted. If there is a large inventory of WIP, there may in turn be a lot of scrap or expensive rework if a change is required.
Because of these problems, agile approaches generally aim to limit WIP. A common way to apply WIP limits on agile projects is to use Kanban boards that restrict the amount of work in a system and help ensure that WIP limits are not exceeded. Th e boards can indicate WIP limits by displaying a preset number for how many tasks should be worked on at any given time. Another option is to restrict the designated space for where task cards must be placed on the board so only a select number of cards will fi t into the space. Agile teams use tools such as Kanban boards with WIP limits to help identify and remove bottlenecks and, as a result, keep the process running effi ciently with optimal WIP. Th ese tools then help reduce the risks of tied-up capital, rework, and waste on the project.
Without limits on WIP, a project team may be tempted to undertake too many diff erent pieces of work all at once. Th is may be done with the best intentions, such as to utilize everyone’s availability and to keep people busy working on the project. But the problem is that if we have a bottleneck in processing database requests or doing user interface design, for example, then tasks may end up sitting for a while and work accumulates in the system. When this occurs, it is diffi cult to identify where the bottleneck is because everyone appears to be busy.
Th e following diagram illustrates a Kanban board with no WIP limit. You can see that there is a lot of WIP, which means the team is busy. But you cannot see which tasks are idle and where the bottlenecks are that are contributing to a slow workfl ow.
To Do InProgress
No WIP Limit
Done
Amend order
Item details
Archive order
Order refund
Create order
Stock search
Stock update
Process order
DB schema
Login
Limiting WIP is like draining the water out of a river; it shows us where all the boulders and obstacles are. We don’t want to run the system with next to no WIP for too long, since it slows throughput
25© 2011 RMC Publications, Inc • 952.846.4484 • [email protected] • www.rmcproject.com
Value Driven Delivery CHAPTER 3
because everyone but the bottleneck is waiting for work, but it is an eff ective method for identifying bottlenecks (or “constraints,” if we use Th eory of Constraints terminology, which is the origin of this concept).
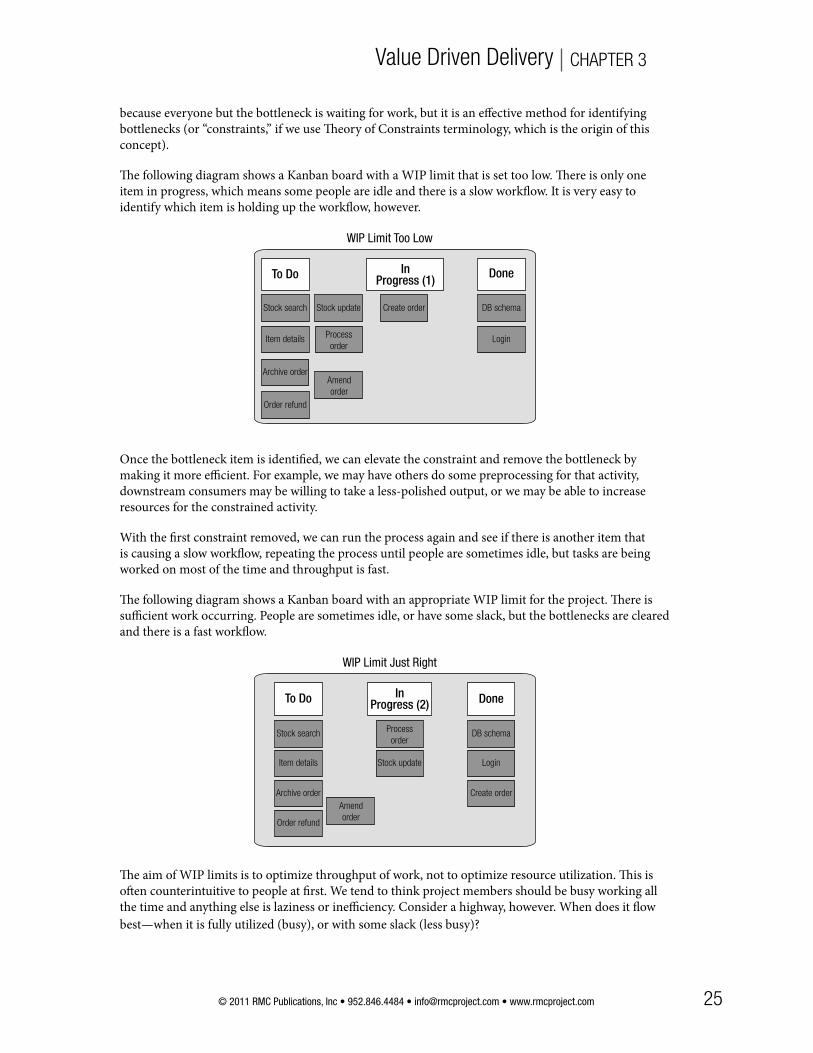
Th e following diagram shows a Kanban board with a WIP limit that is set too low. Th ere is only one item in progress, which means some people are idle and there is a slow workfl ow. It is very easy to identify which item is holding up the workfl ow, however.
To Do InProgress (1)
WIP Limit Too Low
Done
Archive order
Order refund
Create orderStock search Stock update
Process
order
DB schema
Login
Amend
order
Item details
Once the bottleneck item is identifi ed, we can elevate the constraint and remove the bottleneck by making it more effi cient. For example, we may have others do some preprocessing for that activity, downstream consumers may be willing to take a less-polished output, or we may be able to increase resources for the constrained activity.
With the fi rst constraint removed, we can run the process again and see if there is another item that is causing a slow workfl ow, repeating the process until people are sometimes idle, but tasks are being worked on most of the time and throughput is fast.
Th e following diagram shows a Kanban board with an appropriate WIP limit for the project. Th ere is suffi cient work occurring. People are sometimes idle, or have some slack, but the bottlenecks are cleared and there is a fast workfl ow.
To Do InProgress (2)
WIP Limit Just Right
Done
Archive order
Order refund
Create order
Stock search
Stock update
Process
orderDB schema
Login
Amend
order
Item details
Th e aim of WIP limits is to optimize throughput of work, not to optimize resource utilization. Th is is oft en counterintuitive to people at fi rst. We tend to think project members should be busy working all the time and anything else is laziness or ineffi ciency. Consider a highway, however. When does it fl ow best—when it is fully utilized (busy), or with some slack (less busy)?

26 © 2011 RMC Publications, Inc • 952.846.4484 • [email protected] • www.rmcproject.com
PMI-ACPSM Exam Prep—Prerelease Draft
A fully utilized highway A highway with some slack
Limiting WIP helps identify bottlenecks and maximize throughput on a project, just like limiting the number of cars on a road helps traffi c fl ow faster. On soft ware projects, WIP limits equate to features being worked on but not yet accepted by the business.
Little’s Law, which is shown in the following diagram, is related to WIP. It states that how long we are going to have to wait for benefi ts (the cycle time) is proportional to how much WIP we have (the queue size). In other words, we can predict completion times based on the size of the WIP queue. We will discuss this concept in more detail later in this chapter.
Total
In progress
Completed
600
500
400
300
100
Project XYZ—Feature Flow
Toal
feat
ures
0
Apr May Jun Jul Aug Sep
Date
200
B = Queue length (units)A = Queue duration (time)
B
A

27© 2011 RMC Publications, Inc • 952.846.4484 • [email protected] • www.rmcproject.com
Value Driven Delivery CHAPTER 3
K&S1
Incremental Delivery
Incremental delivery is another way to optimize the delivery of value on a project. With incremental delivery, the team regularly deploys working soft ware over the course of the project. Th e soft ware is usually deployed to a test environment for evaluation, but if it makes sense for the business, it could mean delivering functionality to production in increments. If we can deliver the “plain vanilla” version of a system or service while working on the more complex elements, then there is an opportunity for early benefi ts realization and return on investment.
Even if we are incrementally delivering soft ware into test environments, rather than into production, this approach can still help with the overall delivery of value. Finding issues in soft ware deployed in a test environment for evaluation (point 1 in the following diagram) are much cheaper to fi x than those found in production (point 2 in the following diagram). Incremental delivery reduces the amount of rework by fi nding issues earlier and, therefore, contributes to the delivery of value on the project.
Cost of Change
Requirements Analysis &Design
Coding Testing Production
Time
UAT
Confi rming Value
It is one thing to think we are building great products and services and another thing entirely to have our sponsors and business users confi rm this. Agile methods are oft en used on projects that are intangible (e.g., designs, soft ware, etc.). Th e intangible nature of these projects means it is all that much more important to validate that what we are building is, in fact, on the right track and seen as highly valuable by the business.
Because discovering a gap between requested and delivered features may involve rework, it is best to fi nd out about these diff erences early. Th erefore, confi rming value—meaning verifying the team is building the right thing and it works as desired (not as fi rst described, which could be diff erent)—is a key practice when using agile methods.
T&T Customer-Valued Prioritization
We discussed customer-valued prioritization as part of Planning Value earlier in this chapter. Th is tool and technique can also be used to confi rm value, however. Working with the customer to prioritize the remaining items to be done helps ensure the work is progressing toward the target of the project, which

28 © 2011 RMC Publications, Inc • 952.846.4484 • [email protected] • www.rmcproject.com
PMI-ACPSM Exam Prep—Prerelease Draft
may itself be moving. Th e team and customer answer the questions of, “Have things changed?” and “Do we still want to move on to item X next?” Th ese reprioritization sessions, typically done at the end of each iteration, serve as an important checkpoint for agile projects. New and evolving priorities are then captured in the product backlog, which is revisted again at the next session.
I am oft en surprised at what the customer ranks highly when we fi rst begin to prioritize the features and stories to work on. What usually emerges from these seemly unlikely fi rst choices are conversations that bring political and residual risks to the surface. “We are doing Premium Rates fi rst because it is an objective for our Quarter 1 milestones” or “We need to deliver the CIO dashboard to secure project funding for next year.” While you could argue these are not really true system business benefi ts, we are oft en wise to listen to these motivators since the business representatives are our allies in the project and the people who declare what success looks like.
By asking the customer (business) what their top priority features are, we learn about their motivations, risks, and acceptance criteria. Projects that do not engage in customer-valued prioritization likely miss out on identifying important critical success factors.
K&S1
Prototypes, Simulation, Demonstration
Demonstrations of functionality are critical to confi rming success on soft ware projects. Soft ware is intangible and diffi cult to reference. Companies rarely build the same system twice; this means projects are developing products that, for the most part, are new to the users. Th erefore, the opportunity to look at something and try it out is very important for confi rming whether the functionality is suitable. Th e term IKIWISI (I’ll Know It When I See It) is oft en used in soft ware development. It is not until something is demonstrated and used that the true requirements emerge.
In addition to helping clarify requirements, demonstrations can uncover the need for new features. Oft en, it is not until the business representatives actually see the functionality that they realize additional elements are required. For example, “Th e order entry screen looks great, but by trying it, we now realize we need a duplicate order function.”
When teams demonstrate functionality, two things occur. First, we learn about the diff erences between what was asked for and what was interpreted and built (the gulf of evaluation). Second, we learn about new or adjusted functionality (IKIWISI).
So requirements evolve with prototypes, simulation, and demonstrations. Giving people a chance to evaluate and use something uncovers the true business requirements. Our solution then converges toward the emerging requirements, and the gulf of evaluation is reduced on the project. Th is concept is illustrated in the following diagram, where X1, X2, and X3 are the emerging requirements and O1,

29© 2011 RMC Publications, Inc • 952.846.4484 • [email protected] • www.rmcproject.com
Value Driven Delivery CHAPTER 3
O2, and O3 are what was interpreted and implemented. As you can see, the solution builds as the requirements and what is being built move closer together over three iterations.
Func
tiona
lity
Func
tiona
lity
Func
tiona
lity
TimeIteration 1
x1o1
TimeIteration 2
x1o1
x2 o2
TimeIteration 3
x1o1
x2 o2
x3o3
x = Requirement 0 = As built
Tracking and Reporting Value
We’ve talked about assessing, planning, delivering, and confi rming value. Finally, let’s look at tracking and reporting value. In an agile environment, it is important to monitor the rate of feature and value delivery to make sure we are on track to complete the project as it was agreed upon. We then need to communicate our status to stakeholders. Th is can be done using techniques like earned value.
T&T Agile Earned Value
When it comes to tracking and reporting on our projects, S-curves are great tools to track project spending. Th ey are simple to interpret, and they quickly convey whether the project is over or under budget, as shown in the following example.
EstimateActual
$100,000
$90,000
$80,000
$70,000
$60,000
$50,000
$40,000
$30,000
$20,000
$10,000
Project Expenditure
Mon
ey S
pent
$0
Jan20
Jan27
Feb3
Feb10
Feb17
Feb 24
Mar3
Mar 10
Mar 17
Mar 24
Mar 31
Apr7
30 © 2011 RMC Publications, Inc • 952.846.4484 • [email protected] • www.rmcproject.com
PMI-ACPSM Exam Prep—Prerelease Draft
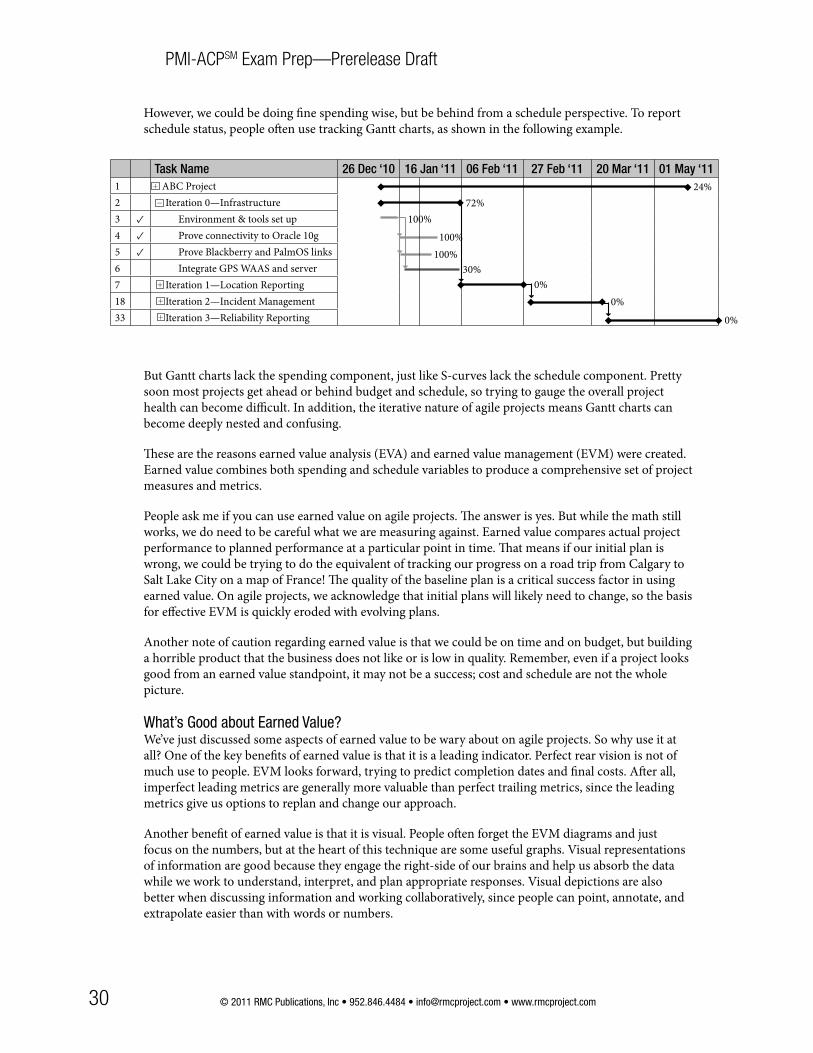
However, we could be doing fi ne spending wise, but be behind from a schedule perspective. To report schedule status, people oft en use tracking Gantt charts, as shown in the following example.
Task Name 26 Dec ‘10 16 Jan ‘11 06 Feb ‘11 27 Feb ‘11 20 Mar ‘11 01 May ‘111 ABC Project2 Iteration 0—Infrastructure3 ✓ Environment & tools set up4 ✓ Prove connectivity to Oracle 10g5 ✓ Prove Blackberry and PalmOS links6 Integrate GPS WAAS and server7 Iteration 1—Location Reporting18 Iteration 2—Incident Management33 Iteration 3—Reliability Reporting
72%24%
100%100%
100%
0%0%
0%
30%
+
+
+
+
−
But Gantt charts lack the spending component, just like S-curves lack the schedule component. Pretty soon most projects get ahead or behind budget and schedule, so trying to gauge the overall project health can become diffi cult. In addition, the iterative nature of agile projects means Gantt charts can become deeply nested and confusing.
Th ese are the reasons earned value analysis (EVA) and earned value management (EVM) were created. Earned value combines both spending and schedule variables to produce a comprehensive set of project measures and metrics.
People ask me if you can use earned value on agile projects. Th e answer is yes. But while the math still works, we do need to be careful what we are measuring against. Earned value compares actual project performance to planned performance at a particular point in time. Th at means if our initial plan is wrong, we could be trying to do the equivalent of tracking our progress on a road trip from Calgary to Salt Lake City on a map of France! Th e quality of the baseline plan is a critical success factor in using earned value. On agile projects, we acknowledge that initial plans will likely need to change, so the basis for eff ective EVM is quickly eroded with evolving plans.
Another note of caution regarding earned value is that we could be on time and on budget, but building a horrible product that the business does not like or is low in quality. Remember, even if a project looks good from an earned value standpoint, it may not be a success; cost and schedule are not the whole picture.
What’s Good about Earned Value?We’ve just discussed some aspects of earned value to be wary about on agile projects. So why use it at all? One of the key benefi ts of earned value is that it is a leading indicator. Perfect rear vision is not of much use to people. EVM looks forward, trying to predict completion dates and fi nal costs. Aft er all, imperfect leading metrics are generally more valuable than perfect trailing metrics, since the leading metrics give us options to replan and change our approach.
Another benefi t of earned value is that it is visual. People oft en forget the EVM diagrams and just focus on the numbers, but at the heart of this technique are some useful graphs. Visual representations of information are good because they engage the right-side of our brains and help us absorb the data while we work to understand, interpret, and plan appropriate responses. Visual depictions are also better when discussing information and working collaboratively, since people can point, annotate, and extrapolate easier than with words or numbers.
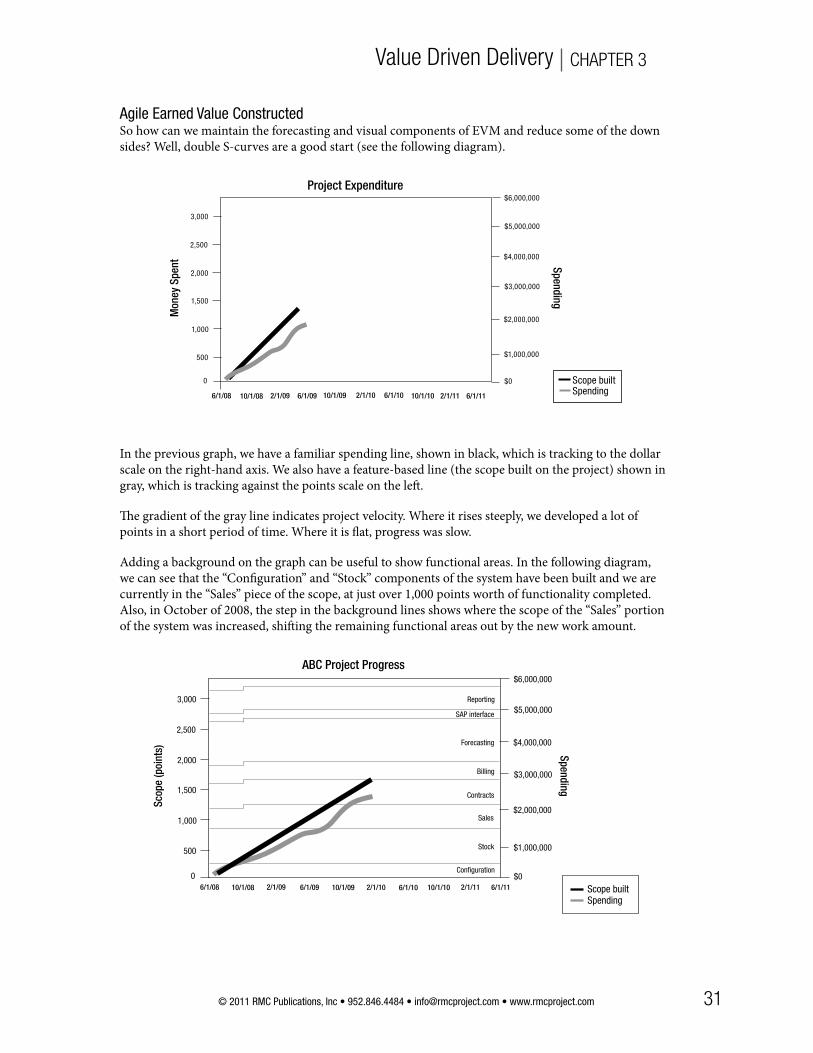
31© 2011 RMC Publications, Inc • 952.846.4484 • [email protected] • www.rmcproject.com
Value Driven Delivery CHAPTER 3
Agile Earned Value ConstructedSo how can we maintain the forecasting and visual components of EVM and reduce some of the down sides? Well, double S-curves are a good start (see the following diagram).
Scope builtSpending
3,000
2,500
2,000
1,500
500
Project ExpenditureM
oney
Spe
nt
0
$5,000,000
$4,000,000
$3,000,000
$2,000,000
$1,000,000
$0
$6,000,000
Spending
1,000
6/1/112/1/1110/1/106/1/102/1/1010/1/096/1/092/1/0910/1/086/1/08
In the previous graph, we have a familiar spending line, shown in black, which is tracking to the dollar scale on the right-hand axis. We also have a feature-based line (the scope built on the project) shown in gray, which is tracking against the points scale on the left .
Th e gradient of the gray line indicates project velocity. Where it rises steeply, we developed a lot of points in a short period of time. Where it is fl at, progress was slow.
Adding a background on the graph can be useful to show functional areas. In the following diagram, we can see that the “Confi guration” and “Stock” components of the system have been built and we are currently in the “Sales” piece of the scope, at just over 1,000 points worth of functionality completed. Also, in October of 2008, the step in the background lines shows where the scope of the “Sales” portion of the system was increased, shift ing the remaining functional areas out by the new work amount.
Scope builtSpending
3,000
2,500
2,000
1,500
500
ABC Project Progress
Scop
e (p
oint
s)
0
$5,000,000
$4,000,000
$3,000,000
$2,000,000
$1,000,000
$0
$6,000,000
Spending
1,000
Reporting
Configuration
Stock
Forecasting
SAP interface
Billing
Contracts
Sales
6/1/112/1/1110/1/106/1/102/1/1010/1/096/1/092/1/0910/1/086/1/08
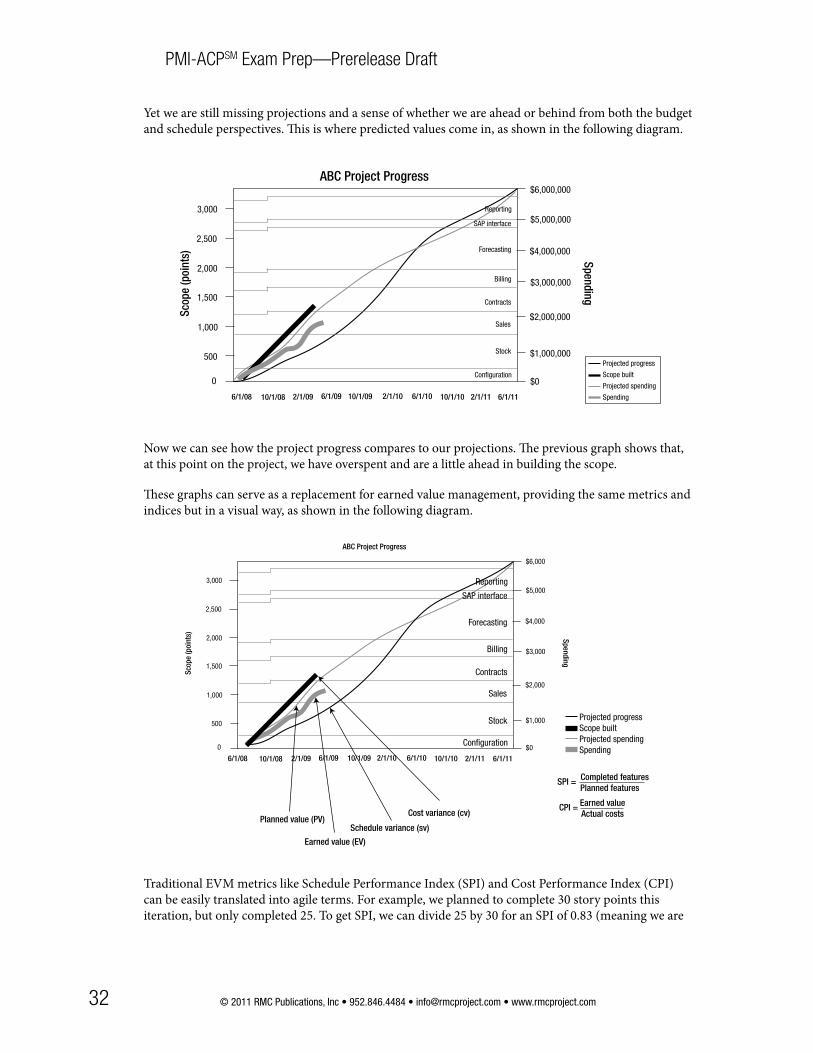
32 © 2011 RMC Publications, Inc • 952.846.4484 • [email protected] • www.rmcproject.com
PMI-ACPSM Exam Prep—Prerelease Draft
Yet we are still missing projections and a sense of whether we are ahead or behind from both the budget and schedule perspectives. Th is is where predicted values come in, as shown in the following diagram.
Projected progress
Scope built
Projected spending
Spending
3,000
2,500
2,000
1,500
500
ABC Project ProgressSc
ope
(poi
nts)
0
$5,000,000
$4,000,000
$3,000,000
$2,000,000
$1,000,000
$0
$6,000,000
Spending
1,000
Reporting
Configuration
Stock
Forecasting
SAP interface
Billing
Contracts
Sales
6/1/112/1/1110/1/106/1/102/1/1010/1/096/1/092/1/0910/1/086/1/08
Now we can see how the project progress compares to our projections. Th e previous graph shows that, at this point on the project, we have overspent and are a little ahead in building the scope.
Th ese graphs can serve as a replacement for earned value management, providing the same metrics and indices but in a visual way, as shown in the following diagram.
Projected progressScope builtProjected spendingSpending
3,000
2,500
2,000
1,500
500
ABC Project Progress
Scop
e (p
oint
s)
0
$5,000
$4,000
$3,000
$2,000
$1,000
$0
$6,000
Spending
1,000
Planned value (PV)
Earned value (EV)
Schedule variance (sv)
Cost variance (cv)
SPI = Completed featuresPlanned features
CPI = Earned valueActual costs
Reporting
Configuration
Stock
Forecasting
SAP interface
Billing
Contracts
Sales
6/1/112/1/1110/1/106/1/102/1/1010/1/096/1/092/1/0910/1/086/1/08
Traditional EVM metrics like Schedule Performance Index (SPI) and Cost Performance Index (CPI) can be easily translated into agile terms. For example, we planned to complete 30 story points this iteration, but only completed 25. To get SPI, we can divide 25 by 30 for an SPI of 0.83 (meaning we are

33© 2011 RMC Publications, Inc • 952.846.4484 • [email protected] • www.rmcproject.com
Value Driven Delivery CHAPTER 3
working at only 83 percent of the rate planned). Likewise, CPI is the earned value (EV, or the value of completed features to date) divided by the actual costs (AC) to date. So in the example in the previous chart, CPI = $2,200,000 / $2,800,000 = 0.79. Th is means we are only getting 79 cents on the dollar compared to what we had predicted.
T&T Cumulative Flow Diagrams (CFDs)
Cumulative fl ow diagrams are valuable tools for tracking and forecasting agile projects. CFDs can help us gain insights into project issues, cycle times, and likely completion dates. Th e following diagram (fi gure 1) is an example of a CFD.
Total
In progress
Completed
600
500
400
300
100
Project XYZ—Feature Flow
Toal
feat
ures
0
Apr May Jun Jul Aug Sep
Date
200
Figure 1: Sample Cumulative Flow Diagram
Our sample CFD shows the features completed versus the features remaining for a fi ctional project that is still in progress. Th e gray area represents all the planned features to be built. Th is number rose from 400 to 450 in June and then to 500 in August as additional features were added to the project. Th e dotted section plots the work in progress, and the striped section shows the total number of features completed on the project.

34 © 2011 RMC Publications, Inc • 952.846.4484 • [email protected] • www.rmcproject.com
PMI-ACPSM Exam Prep—Prerelease Draft
Little’s LawIn Managing the Design Factory, published in 1997, Donald Reinertsen introduces Little’s Law as a way to analyze queues from CFDs. Th is concept is illustrated in the following diagram.
Total
In progress
Completed
600
500
400
300
100
Project XYZ—Feature Flow
Toal
feat
ures
0
Apr May Jun Jul Aug Sep
Date
200
B = Queue length (units)A = Queue duration (time)
B
A
Figure 2: Examining Work In Progress
Th e dotted section representing work in progress (WIP) is our queue; it is the work started that has not yet been completed. We can see how many items are in the queue by looking at the vertical (B) distance, and we can determine the cycle time, or how long it will likely take to complete the items in the queue, by examining the horizontal (A) distance.
Cycle times are important metrics for creating lean production systems. Th is data helps us predict when all the work currently in progress will be done. We should aim to keep WIP and cycle times as low as possible, as they represent sunk investment costs that have not yet resulted in business benefi ts. Th e more WIP and the longer cycle times we have on the project, the higher the amount of potential scrap we have in the system if a problem is encountered.
Looking for Bottlenecks and the Theory of ConstraintsWe talked about bottlenecks, the Th eory of Constraints, and WIP in the Delivering Value section of this chapter, but let’s look at these concepts again from the perspective of tracking and reporting value on agile projects.
Eli Goldratt introduced the Th eory of Constrains (TOC) as a tool for optimizing a production system. He observed that “Changes to most of the variables in an organization usually have only small impacts on global performance. Th ere are few variables (perhaps only one) for which a signifi cant change in local performance will eff ect a signifi cant change in global performance.” So to achieve the greatest benefi ts, we should fi nd these constraints (or bottlenecks in the system) and focus on improving these issues.
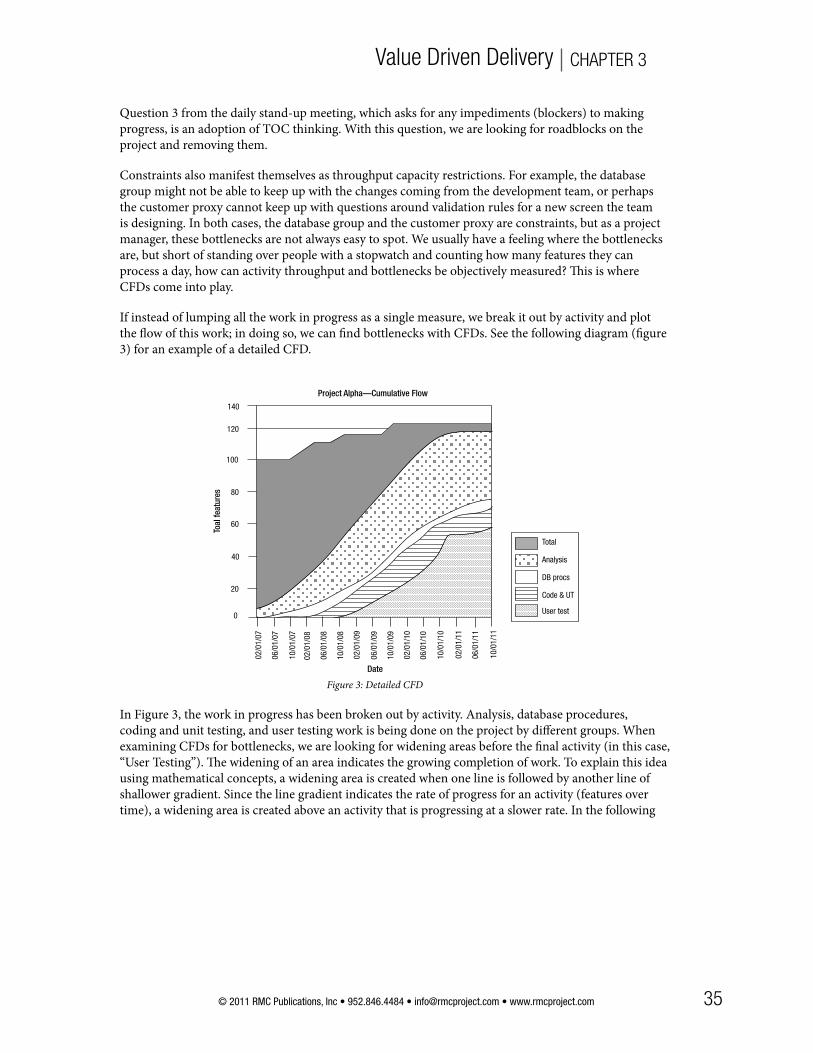
35© 2011 RMC Publications, Inc • 952.846.4484 • [email protected] • www.rmcproject.com
Value Driven Delivery CHAPTER 3
Question 3 from the daily stand-up meeting, which asks for any impediments (blockers) to making progress, is an adoption of TOC thinking. With this question, we are looking for roadblocks on the project and removing them.
Constraints also manifest themselves as throughput capacity restrictions. For example, the database group might not be able to keep up with the changes coming from the development team, or perhaps the customer proxy cannot keep up with questions around validation rules for a new screen the team is designing. In both cases, the database group and the customer proxy are constraints, but as a project manager, these bottlenecks are not always easy to spot. We usually have a feeling where the bottlenecks are, but short of standing over people with a stopwatch and counting how many features they can process a day, how can activity throughput and bottlenecks be objectively measured? Th is is where CFDs come into play.
If instead of lumping all the work in progress as a single measure, we break it out by activity and plot the fl ow of this work; in doing so, we can fi nd bottlenecks with CFDs. See the following diagram (fi gure 3) for an example of a detailed CFD.
Total
Analysis
DB procs
Code & UT
User test
120
100
80
60
20
Project Alpha—Cumulative Flow
Toal
feat
ures
0
Date
40
140
02/0
1/07
06/0
1/07
10/0
1/07
02/0
1/08
06/0
1/08
10/0
1/08
02/0
1/09
06/0
1/09
10/0
1/09
02/0
1/10
06/0
1/10
10/0
1/10
02/0
1/11
06/0
1/11
10/0
1/11
Figure 3: Detailed CFD
In Figure 3, the work in progress has been broken out by activity. Analysis, database procedures, coding and unit testing, and user testing work is being done on the project by diff erent groups. When examining CFDs for bottlenecks, we are looking for widening areas before the fi nal activity (in this case, “User Testing”). Th e widening of an area indicates the growing completion of work. To explain this idea using mathematical concepts, a widening area is created when one line is followed by another line of shallower gradient. Since the line gradient indicates the rate of progress for an activity (features over time), a widening area is created above an activity that is progressing at a slower rate. In the following

36 © 2011 RMC Publications, Inc • 952.846.4484 • [email protected] • www.rmcproject.com
PMI-ACPSM Exam Prep—Prerelease Draft
diagram (fi gure 4), you can see Analysis is a widening area activity, while Database Procedures is a bottleneck activity.
Total
Analysis
DB procs
Code & UT
User test
120
100
80
60
20
Project Alpha—Cumulative Flow
Toal
feat
ures
0
02/0
1/07
06/0
1/07
10/0
1/07
02/0
1/08
06/0
1/08
Date
40
140
10/0
1/08
02/0
1/09
06/0
1/09
10/0
1/09
02/0
1/10
06/0
1/10
10/0
1/10
02/0
1/11
06/0
1/11
Widening area activity
Bottleneck activity
10/0
1/11
Figure 4: Detailed CFD with Bottleneck Identifi ed
Regardless of whether the mathematical explanation makes sense to you, all you need to remember for the exam is that the bottleneck is the activity below the widening band. Th e widening band is the feeding activity, not the problem activity. So in the example shown in fi gure 4, Analysis is going okay, but creating the database stored procedures (DB Procs) is below the widening band, indicating a slower rate of progress. Th e CFD gives us a warning that creating the database stored procedures is our bottleneck in the system.
So we do not need to micro-manage team throughput to determine where the bottlenecks are. Instead, by using CFDs to track progress we can identify bottlenecks unobtrusively. Th en once we know where the problem is, we can start addressing the issue by applying the TOC actions items from step 2 onwards in the following list:
1. Identify the constraint.2. Exploit the constraint.2. Subordinate all other processes to exploit the constraint.3. If aft er #2 and #3 are done, more capacity is needed to meet demand, elevate the constraint. 4. Go back to #1, but don’t let inertia (complacency) become the system’s constraint.
Th e use of agile methods inherently reduces the likelihood of activity-based bottlenecks because these methods promote multidisciplined teams. By avoiding role specialization, people are able to move between roles more eff ectively and share the workload. However, while the goal is to have fully multidisciplined teams, in practice some role specialization and workfl ow management is the norm on projects.
T&T Risk Burndown Graphs
As we’ve discussed at earlier points in this chapter, risk and value are closely related. Th erefore, risk management is an important activity on agile projects. Risk management should serve as a driver for work scheduling, moving high risk activities into earlier iterations of the project and incorporating risk mitigation actions into the backlog. As the project progresses, we need to continue to manage risks and track the eff ectiveness of our eff orts.

37© 2011 RMC Publications, Inc • 952.846.4484 • [email protected] • www.rmcproject.com
Value Driven Delivery CHAPTER 3
Th e following table presents some of the identifi ed risks and their associated probability, impact, and severity scores for a fi ctitious project. (See the Risk Adjusted Backlog discussion in the Planning Value section of this chapter for more on calculating risk severity and expected monetary value.)
ID Short Risk Name Impact Prob. Sev.1 JDBC driver performance 3 2 62 Calling Oracle stored procs. via web service 2 2 43 Remote app. distribution to PDAs 3 2 64 Oracle warehouse builder stability 2 2 45 Legacy system stability 2 1 26 Access to user community 2 1 27 Availability of architect 2 2 48 Server upgrade necessary 1 2 29 Oracle handheld warehouse browser launch 3 1 3
33
As the project progresses, we record how our attempts to manage the project risks are working. Th e next table shows the progress of the risks through the fi rst four months of the project.
January February March AprilID Short Risk Name Impact Prob. Sev. Impact Prob. Sev. Impact Prob. Sev. Impact Prob. Sev.1 JDBC driver performance 3 2 6 3 0 0 3 0 0 3 0 02 Calling Oracle stored procs. via web service 2 2 4 2 0 0 2 0 0 2 0 03 Remote app. distribution to PDAs 3 2 6 3 1 3 3 0 0 3 0 04 Oracle warehouse builder stability 2 2 4 2 3 6 2 2 4 2 0 05 Legacy system stability 2 1 2 2 1 2 2 0 0 2 0 06 Access to user community 2 1 2 2 2 4 2 1 2 2 1 27 Availability of architect 2 2 4 2 3 6 2 2 4 2 0 08 Server upgrade necessary 1 2 2 1 1 1 1 0 0 1 0 09 Oracle handheld warehouse browser launch 3 1 3 3 1 3 3 3 9 3 1 310 PST changes for British Columbia 0 0 0 0 0 0 2 2 4 2 1 2
33 25 23 7
During these four months, many of the project risks were mitigated or avoided completely. For example, the fi rst risk, “JDBC driver performance,” ended up not being a problem because database features and performance testing were deliberately included during the fi rst (one month) iteration. As a result, the probability of this risk occurring was reduced from 2 (Medium) to 0, and so the risk severity went from 6 to 0.

38 © 2011 RMC Publications, Inc • 952.846.4484 • [email protected] • www.rmcproject.com
PMI-ACPSM Exam Prep—Prerelease Draft
Th ese types of details can be diffi cult to determine from just looking at tables. Instead, we can convert this information into risk burndown graphs, which are excellent tools for showing status and trends. Th e following is a sample risk burndown graph.
JDBC driver performance
Calling Oracle stored procs. via web service
Remote app. distribution to PDAs
Oracle warehouse builder stability
Legacy system stability
Access to user community
Availability of architect
Server upgrade necessary
Oracle handheld warehouse browser launch
PST changes for British Columbia
30
25
20
15
5
Project Risk ProfileCu
mul
ativ
e ris
k
0
10
35
1 42 3
Risk burndown graphs are essentially stacked area graphs of cumulative project risk severity. Th e risk severity scores for each risk are plotted one on top of another to show a cumulative severity profi le of the project. When risks and their history of severities are displayed in this format, it is much easier to interpret the overall risk status of the project.
For instance, we can tell from the general downward trend of the previous graph that the project risks are reducing. Th is visual graph is an excellent way to demonstrate the value of “Iteration 0” activities—activities that may not directly deliver much or any business value, but are extremely useful in proving whether a particular approach will work and reducing project risks.
Escalating risks and new risks are also easy to spot on risk burndown graphs. In our example, Risk 9, “Oracle Handheld Warehouse browser launch,” escalated from a Severity 3 risk to Severity 9 risk in March. Risk 10, “PST Changes for British Columbia,” is a new risk that was assessed as a Severity 4 risk in March and went down to a Severity 2 risk in April.
Risk burndown graphs quickly inform stakeholders if the risks are moving in the right direction (downwards), or if issues and concerns are escalating. Th ey provide a simple-to-interpret health-check for your project and can be quickly produced in tools like Microsoft Excel. Tracking the reduction of project risks is a useful metric on projects. Although it is not a core metric like features delivered, we need to actively try to control risks. How eff ective we are in these eff orts impacts whether we achieve our goal of delivering a successful project.
T&T Task and Kanban Boards
Th e fi nal tools we will discuss in this section are task boards and Kanban boards. While these boards are primarily thought of as planning and monitoring tools (see the Delivering Value section earlier in this chapter), they can also be a great way to track and report value.

39© 2011 RMC Publications, Inc • 952.846.4484 • [email protected] • www.rmcproject.com
Value Driven Delivery CHAPTER 3
In the example task board shown in the previous image, we were tracking all activities that needed to happen for a release to production. One of the nice things about meeting at the board and updating it everyday was that the team saw a gradual left to right migration of cards across the board as work items moved from “To-Do,” to “In Progress,” to “Done.”
It was rewarding to the team, and reassuring to the sponsor, to see an increasing collection of completed work as the deadline was approaching. It also focused everyone’s attention on the few remaining issues as those issues really began to stand out, being the last ones to move.
Th ese tools help with tracking and reporting value, and their results are oft en shown on information radiators, a form of Big Visible Charts that are displayed in prominent places. Th ese are explored further in the next chapter, Stakeholder Engagement.
“PMI-ACP,” “PMP,” “PMBOK,” and “PMI” are marks of the Project Management Institute, Inc. RMC Project Management has been reviewed and approved as a provider of project management training by the Project Management Institute (PMI). As a PMI Registered Education Provider (R.E.P.), RMC Project Management, an affi liate of RMC Publications, Inc., has agreed to abide by PMI-established quality assurance criteria.