Embed Size (px)
Citation preview
E VALUATION OF THE QUALITY OF BACTERIOLOGIC METHODS USED TO DIAGNOSE TUBERCULOSIS IN
ARGENTINA1 Omar L&i, 2 GZadis E. Amado,’ Martha DtLonardo, 4
Lzcciir Barrera,, and Isabe N. de Kantor
I NTRODUCTION More and more Latin Ameri-
can and Caribbean countries are inte- grating the activities of their national tu- berculosis programs into the general health services. For this and other rea- sons, the number of such services doing bacteriologic diagnosis of tuberculosis, usually by sputum-smear microscopy, is increasing. In addition, some of the dis- pensaries, hospitals, and general services with laboratories of some complexity have added culture diagnosis to their work. A recent survey conducted in 12 Latin American countries (I) found that 2,884 laboratories at level III (laborato- ries with microscopy only) were employ- ing only sputum microscopy to diagnose tuberculosis, while 456 others, at level II (laboratories with microscopy and cul-
’ This article has previously appeared in Spanish in the Boletin de la Ojicina Sanitatia Panamericana, vol. 104, no. 5, 1988.
* National Institute of Epidemiology. C. Correo 106, 3000 Santa Fe, Argentina.
3 Regional Tuberculosis Laboratory, Pan American Zoonosis Center-CEPANZO (PAHO I WHO), Car- doba, Argentina.
4 Center of Tuberculosis and Pulmonary Diseases, Uni- versity of Buenos Aires, Buenos Aires, Argentina.
s “Dr. Carlos G. Malbr2n” National Institute of Micro- biology, Buenos Aires. Argentina.
6 Pan American Zoonoses Center (CEPANZO, PAHO/ WHO). Buenos Aires, Argentina.
ture facilities) and at level I (with micros- copy, culture, and differentiation test fa- cilities) were also using bacteriologic cultures.
The culture technique is a more sensitive diagnostic method than direct sputum microscopy. It has been determined that sputum microscopy stands only a 50% chance of yielding a positive result if the sample contains be- tween 5,000 and 10,000 acid-fast bacilli. In contrast, the culture technique is vir- tually certain to yield at least one colony if 10 bacilli are present (2). Thus, when correctly employed, the culture tech- nique is a highly useful tool for diagnos- ing paucibacillary cases of tuberculosis- such as pulmonary forms with negative smear examinations, extrapulmonary forms, and pediatric cases. On the other hand, the method is more costly and technically complex than direct sputum 3 microscopy. 2
_ The survey mentioned above 3 (1) also reported that 48 laboratories in 2
.$ P,
2
2
3 a,
269
270
the 12 survey countries, in addition to performing sputum microscopy and cul- ture diagnosis, tested the sensitivity of Mycobactetiwn tzlberczllosis to antibiotic agents and, in some cases, performed mycobacterial differentiation tests. Gen- eralized performance of sensitivity tests is not advisable because of their technical complexity and currently limited util- ity-utility that is limited because adop- tion of treatment regimens with several antibacterial drugs has overcome the problem posed by the appearance of bac- terial resistance (3). Nevertheless, sensi- tivity testing is indicated for cases need- ing retreatment, for therapeutic failures, and for epidemiologic surveys of primary and acquired resistance.
Mycobacterial differentiation, which requires the right technical equip- ment and personnel with the bacterio- logic experience and judgment needed to perform the work involved correctly, can help determine the frequency with which nontuberculous (“atypical”) my- cobacteria are being isolated in particular laboratories, as well as the relative impor- tance of the different mycobacterial dis- eases and of bovine tuberculosis in man in areas where current information on these problems is scarce (4, 5).
With respect to standards, PAHO / WHO has published standards for tuberculosis bacteriology tests that range from sputum-smear microscopy to tests for typing mycobacteria (6, 7, 8). Also, in most countries of the Americas tuberculosis control programs have pub- lished national standards.
Regarding training, two re- gional reference laboratories give train-
ing courses and provide advice and ser- vices in the field of tuberculosis bacteriology. These are the Central Dis- ease Control Laboratory (a WHO Collab- orating Center) in Ottawa, Canada, and the Pan American Zoonoses Center (CEPANZO, PAHO I WHO) in Marti- nez, Argentina. In general, most coun- tries’ control programs enjoy the services of well-trained and experienced bacteri- ologists .
Given these circumstances, development of supervisory systems to control the methods used in tuberculosis bacteriology is both possible and essen- tial. Such systems will permit evaluation and improvement, as needed, of the effr- ciency of diagnosis and bacteriologic con- trol through treatment, as well as evalua- tion and improvement of the quality of epidemiologic information on tuberculo- sis and other mycobacterial diseases in Latin America and the Caribbean, For such reasons several countries already have programs for supervising the qual- ity of sputum-smear microscopy (9).
Turning specifically to Argen- tina, that country currently has 423 offi- cial laboratories (at level III) that do only sputum-smear microscopy, another 50 (at level II) that do both sputum micros- copy and culture diagnosis, and 10 (at level I) whose services include mycobac- terial differentiation (1).
At present, the National In- stitute of Epidemiology (INE) in Santa Fe provides coordination at the national level for supervision of sputum-smear microscopy conducted by the central lab- oratories of the various provincial tuber- culosis control programs (10). With a view to extending this supervision to other bacteriologic techniques, in 1980 the Argentine Commission on Tubercu- losis Bacteriology proposed a cooperative survey that might provide the basis for a stable quality-control program, This arti- cle presents the results of that survey.
M ATERIALSAND METHODS
Indirect Supervision of Sputum-Smear Microscopy
During 1985 the INE, in its role as supervisory coordinator, directed the central laboratories of the provincial tuberculosis control programs to submit slides from sputum-smear examinations that they had received during a single month from the laboratories under their supervision. This request was made each month to the central laboratories of three different provinces throughout the one- year 1985 study period.
Up to 100 of the slides re- ceived were reread at the INE. When more than a hundred slides were received from a given health service, all those that had yielded positive results were reread together with a random sample of the ones yielding negative results, up to the point where the number of reread posi- tive and negative slides totaled 100.
Besides checking the results, the INE classified the quality of the spu- tum specimen, the smear, and the stain in accordance with procedures that have already been described (11). That is, the sputum was classified as mucous, muco- purulent, or consisting mainly of saliva; the smear was classified as good, thin, thick, or uneven; and the staining was classified as good, good with comments, or inadequate. The quantitative reading was done according to national stan-
dards, which are the same as those rec- ommended by PAHO / WHO (6). The results were compared with those ob- tained by the peripheral laboratories and were communicated to them through the provincial control programs.
Evaluation of Culture Media Quality
In general, evaluation of the culture media being used for diagnosis provides useful insight into the relative sensitivity that bacteriologic diagnosis of tuberculosis can attain vis-a-vis the qual- ity of the medium employed. In general, the less sensitive the medium the larger the number of bacilli needed in the sam- ple in order to get a positive result. Inoc- ulated on a medium of low sensitivity, for example, paucibacillary samples (such as those from cerebrospinal fluid) could give false negative results. Obser- vations about the medium’s presenta- tion, appearance, consistency, and con- tamination can also help to improve the techniques used in its preparation.
Quality control of this kind makes it possible to know at the central level when a laboratory is using a me- dium of relatively low sensitivity, to re- view with it the methods being used for preparation and preservation, and to in- troduce any necessary changes. We be- lieve that such quality control of culture media can be easily implemented on an ongoing basis in the central tuberculosis laboratories of those Latin American and Caribbean countries where the culture technique is being used.
With regard to the study re- ported here, each of the 13 participating laboratories sent the Center for Tubercu- losis and Pulmonary Diseases (C&e&u de Tisionezcmonolog+) a sample from a batch of recently prepared Lowenstein- Jensen medium, together with the data requested in Form 1 (Annex 1). The 13
batches were tested in a single experi- ment, which was conducted according to a protocol prepared at CEPANZO. The strain used was M. t&rcdosis H37Rv, from which suspensions were prepared at lob4 mg/ml, low5 mg/ml, and 10m6 mg I ml-starting with a bacillary suspen- sion of 1 mg (wet weight) per ml. The next step was to inoculate 0.2 ml from each of these three bacillary dilutions into four tubes of the medium being tested. These were incubated at the usual temperature of 37 “C (7) , and the result- ing colonies were counted at three, four, and five weeks. All of the tubes were coded so that those doing the work did not know the source of the test batch- either at the time of inoculation or when the number of colonies was read.
It would be possible for the number of colonies appearing in each of the four tubes inoculated with the same dilution to exhibit normal variation within certain limits. This variation was evaluated by the chi-square test. If x2 ex- ceeded the critical value for the number of tubes (n =4)-namely, 7.8 (P = 0.05) (12)-it would be taken as an indication of significant experimental error beyond the normal variation in inoculum from one tube to another; and so the experi- ment would need to be repeated.
The indicators of quality for each of the controlled batches were: (a) the total number of colonies in the 12
cg tubes containing the test batch; (b) the co c% relationship between the number of col- r-l -. onies observed at three and at five weeks;
3 2
and (c) the number of colonies in the
.g tubes inoculated with the 10v5 suspen-
PI sion, this being the lowest bacillary con-
2 centration yielding growth in all of the
z controlled batches.
2
It was decided that a batch would be deemed to have significantly low sensitivity if the total number of col- onies obtained was less than the average
272
value minus two standard deviations (% - 2 SD).
Antibiotic Sensitivity Test Evaluation
Five laboratories sent 299 M. tzlbercdosis cultures tested for isoniazid and streptomycin sensitivity to the Re- gional Tuberculosis Laboratory in CBr- doba, where the sensitivity tests were re- peated. The results were then compared with those obtained by the laboratory of origin. In all cases the technique em- ployed was the low-cost variant of the previously described proportions method using Lowenstein-Jensen medium (8,).
Evaluation of Mycobacterial Differentiation
Fifteen laboratories partici- pated in this part of the study, which was conducted over a three-year period (Jan- uary 1982 through December 1984). Each of them sent the National Institute of Microbiology (INM) all the cultures that had yielded isolates of mycobacteria and that, according to their own judg- ment, had at least one of the following characteristics: (a) growth in Stonebrink medium but little or no growth in Lo- Wenstein-Jensen medium; (b) abundant growth in both these media within less than 10 days; (c) morphology or pigmen- tation of the colonies different from that of M. tubercdosis; (d) resistance to sev- eral drugs in the case of cultures obtained from previously untreated patients; (e) a negative niacin test.
Accompanying each culture was the following information: (a) the type of sample (sputum, urine, etc.); (b) the number of positive cultures previ-
ously obtained from the same patient; (c) the number of colonies grown in each of these cultures; (d) the patient’s name, place of residence, and other data of in- terest; and (e) the treatment given.
Final identification of the my- cobacteria in the cultures received was ac- complished by the INM with the support of CEPANZO, using previously de- scribed methods (8, 13).
RE SULTS
Sputum-Smear Microscopy A total of 2,293 slides from
316 laboratories in 14 provinces were re- ceived and checked at the INE. The INE readings indicated that 66.8 % of these came from adequate samples classified as either mucous or mucopurulent. The re- maining 33.2 % were classified as consist- ing mainly of saliva, either because the sample was inadequate or because an in- correct portion of it had been selected.
As the proportion of defective samples increases, the probability of finding bacilli in smears from tuberculo- sis patients tends to decline. Table 1 shows the share of positive findings in the present study accounted for by sam- ples in the three aforementioned cate- gories .
TABLE 1. Positive sputum-smear examinations obtained with sputum samples classified as consisting of saliva or as being mucous or mucopurulenf (Argentina, 1985).
Classification of sample
Saliva Mucous Mucopurulent
Total
No. of % of all positive positive samples samples
34 11.4 75 25.1
190 63.5
299 100
In 97 % of the slides the stain- ing was classified as good because 100 microscopic fields could be read that were stained and did not contain fuchsin crystals. Table 2 shows the differences found between the INE readings and those taken at the laboratories of origin, according to the quality of the staining. The proportion of discrepancies found in the slides with deficient staining (7.5 %) was 4.5 times greater than that found in the slides with good staining ( 1.6 % ). All of the discrepancies found in the inade- quately stained slides involved false posi- tive results.
Table 3 summarizes the results obtained by comparing all the readings from the 14 participating prov- inces with the INF rereadings. Agree- ment between these two sets of readings was 98.0%, within a range of 92.6- 100.0 % . Of 1,994 slides read as negative at the INE, 24 (1.2%) were reported as positive by the laboratories of origin. On the other hand, 22 of the 299 slides whose INE readings were positive (7.4 % ) had been considered negative by the lab- oratories of origin.
As in a previous survey (lo), the rate of disagreement was very high in the case of slides that had few bacilli. Specifically, five of the eight slides (62.5 % ) in which the first observer had found only l-4 acid-fast bacilli (AFB) in the entire slide were read as negative at the INE. However, the disagreement lessened as the level of slide positivity in- creased. That is, there was 7.5 % dis- agreement for slides classified ( + ) by the laboratory of origin, 4.7 % for those clas- sified ( + + ), and 0% for those classified (+++).
273
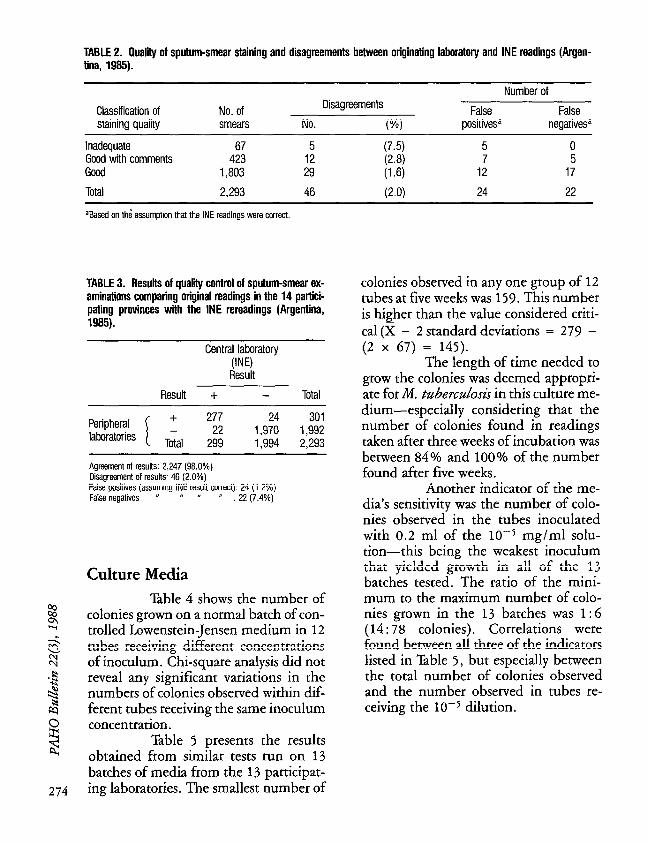
TABLE 2. Qualii of sputum-smear staining and disagreements between originating laboratory and INE readings (Argen- tina, 1985).
Number of
Classification of No. of Disagreements False False staining quality smears No. W) positivesa negative9
Inadequate 67 5 (7.5) 5 0 Good with comments 423 12
I:::,’ 1: 5
Goad 1,803 29 17
Total 2,293 46 (2.0) 24 22
Qased on the’assumptlon that the INE readings were correct
TABLE 3. Resuh of quality control of sputum-smear ex- aminations comparing original readings in the 14 partici- pating provinces with the INE rereadings (Argentina, 1985).
Central laboratory WE) Resut
Result + - Total
Peripheral laboratories
+
- Total
277 24 301 22 1,970 1,992
299 1.994 2,293
Agreement of results: 2.247 (98.0%) Disagreement of results 46 (2.0%) False positives (assuming INE resuii correct): 24 (1 2%) False negatives ’ ’ ” ” 22 (7.4%)
Culture Media Table 4 shows the number of
colonies grown on a normal batch of con- trolled Lowenstein-Jensen medium in 12 tubes receiving different concentrations of inoculum. Chi-square analysis did not reveal any significant variations in the numbers of colonies observed within dif- ferent tubes receiving the same inoculum concentration.
Table 5 presents the results obtained from similar tests run on 13 batches of media from the 13 participat- ing laboratories. The smallest number of
colonies observed in any one group of 12 tubes at five weeks was 15 9. This number is higher than the value considered criti- cal (% - 2 standard deviations = 279 - (2 x 67) = 145).
The length of time needed to grow the colonies was deemed appropri- ate for M. tzlberc&osis in this culture me- dium-especially considering that the number of colonies found in readings taken after three weeks of incubation was between 84% and 100% of the number found after five weeks.
Another indicator of the me- dia’s sensitivity was the number of colo- nies observed in the tubes inoculated with 0.2 ml of the 10es mg/ml solu- tion-this being the weakest inoculum that yielded growth in all of the 13 batches tested. The ratio of the mini- mum to the maximum number of colo- nies grown in the 13 batches was 1: 6 (14 : 78 colonies). Correlations were found between all three of the indicators listed in Table 5, but especially between the total number of colonies observed and the number observed in tubes re- ceiving the lo-> dilution.
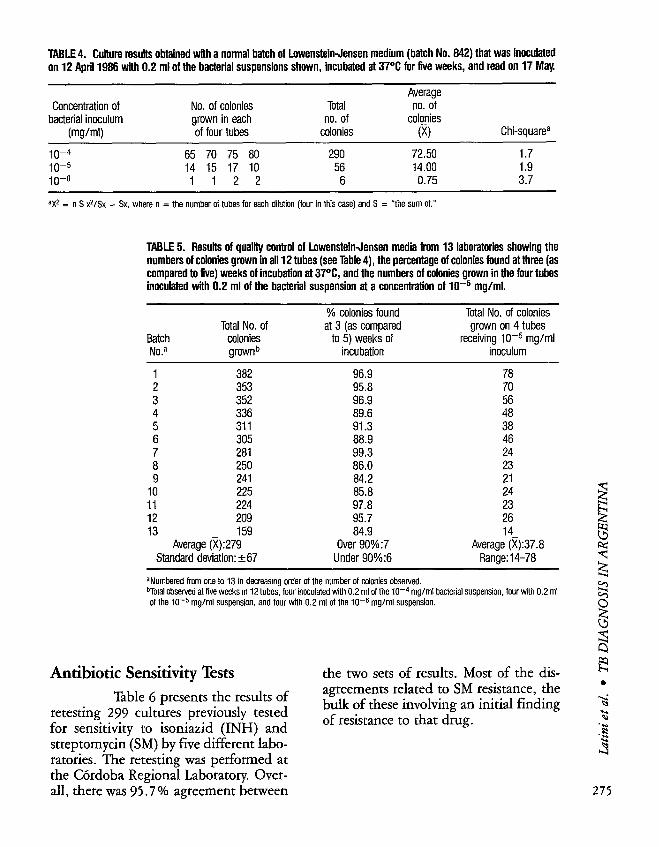
TABLE 4. Culture results obtained with a normal batch of LowensteinJensen medium (batch No. 842) that was inoculated on 12 April 1986 with 0.2 ml of the bacterial suspensions shown, incubated at 37OC for ffve weeks, and read on 17 May.
Concentration of No. of colonies Total bacterial inoculum grown in each no. of
Ow/ml) of four tubes colonies
10-4 65 70 75 80 290 10-5 14 15 17 10 56 10-c 1 1 2 2 6
Average no. of
colojes W)
72.50 14.00 0.75
Chi-squarea
1.7 1.9 3.7
‘X2 = n S x%x - Sx. where n = the number of tubes ior each dilution (four in this case) and S = “the sum of.”
TABLE 5. Resulfs of quality control of Lower&stein-Jensen media from 13 laboratories showing the numbers of colonies grown in all 12 tubes (see Table 4), the percentage of colonies found at three (as compared to ffve) weeks of incubation at 37% and the numbers of colonies grown in the four tubes inoculated with 0.2 ml of the bacterial suspension at a concentratfon of 10W5 mg/ml.
% colonies found Total No. of colonies Total No. of at 3 (as compared grown on 4 tubes
Batch colonies to 5) weeks of receiving lo+ mg/ml No? grownb incubation inoculum
1 382 96.9 78 2 353 95.8 70 3 352 96.9 56
l 336 311 89.6 91.3 2 6 305 88.9 46 7 281 99.3 24 8 250 86.0 23 9 241 84.2 21
IO 225 85.8 24 11 224 97.8 23 12 209 95.7 26 13 159 84.9 14-
Average (x):279 Over 90%:7 Average (X):37.8 Standard deviation: 267 Under 90%:6 Range:14-78
‘Numbered lmm one to 13 in decreasing order of the number of colonies observed. bTotal observed at fife weeks In 12 tubes, four inoculated with 0.2 ml of the 1O-4 mg/ml bacterial suspension, four with 0.2 ml of the low5 mg/ml suspension, and four with 0.2 ml of the 10e6 mg/ml suspension.
Antibiotic Sensitivitv Tests the two sets of results. Most of the dis- d
Table 6 presents the results of retesting 299 cultures previously tested for sensitivity to isoniazid (INH) and streptomycm(SM) by five different labo- ratories. The retesting was performed at the Cdrdoba Regional Laboratory. Over- all, there was 95.7 % agreement between
agreements related to SM resistance, the bulk of these involving an initial finding of resistance to that drug.
275
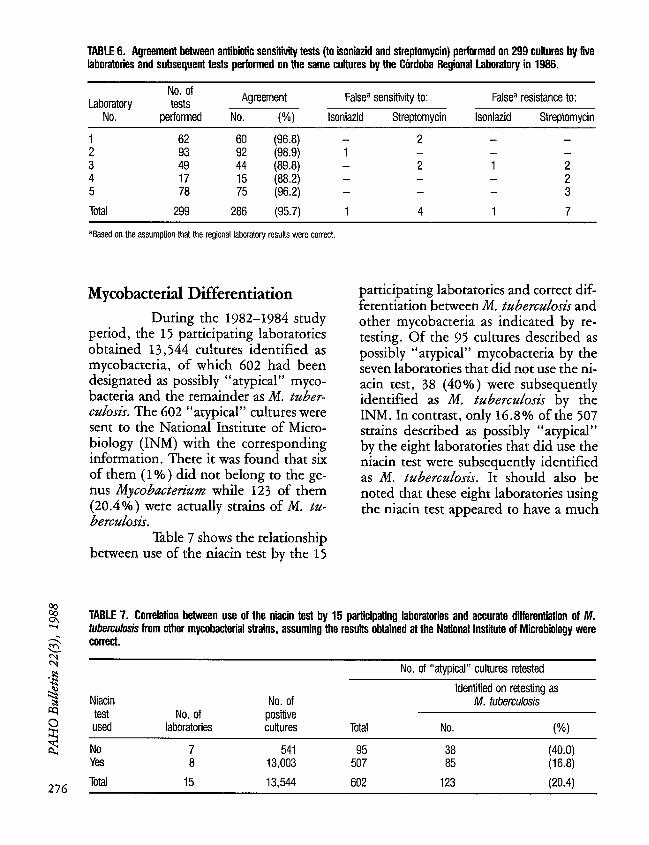
TABLE 6. Agreement between antibiotic sensiii tests (to isoniazid and streptomycin) performed on 299 cultures by five laboratories and subsequent tests performed on the same cultures by the C&doba Regional Laboratory in 1986.
Laboratory No.
No. of tests Agreement
performed No. (%I
Falsea sensitivity to:
lsoniazid Streptomycin
Falsea resistance to:
lsoniazid Streptomycin
1 62 60 (96.8) 2 2 93 92 (98.9) 1 3 49 44 (89.8) - 1 2 4 17 15 (88.2) -
2 2
5 78 75 (96.2) - 3
Total 299 286 (95.7) 1 4 1 7
%ased on the assumption that the regional laboratory results were correct
Mycobacterial Differentiation During the 1982-1984 study
period, the 15 participating laboratories obtained 13,544 cultures identified as mycobacteria, of which 602 had been
participating laboratories and correct dif- ferentiation between M. tzlberczdosis and other mycobacteria as indicated by re- testing. Of the 95 cultures described as possibly “atypical” mycobacteria by the seven laboratories that did not use the ni-
designated as possibly “atypical” myco- bacteria and the remainder as M. tdwr-
acin test, 38 (40%) were subsequently
ctiZcxis. The 602 “atypical” cultures were identified as M. tuberczllosis by the
sent to the National Institute of Micro- INM. In contrast, only 16.8% of the 507
biology (INM) with the corresponding strains described as possibly “atypical”
information. There it was found that six by the eight laboratories that did use the
of them (1% ) did not belong to the ge- niacin test were subsequently identified as M. tubercdosis. It should also be
nus Mycobactetimv while 123 of them (20.4%) were actually strains of M. tw hdosis.
Table 7 shows the relationship
noted that these eight laboratories using the niacin test appeared to have a much
between use of the niacin test by the 15
TABLE 7. Correlation between use of the niacin test by 15 participating laboratories and accurate diirentfation of M. luberculosis from other mycobacterial strains, assuming the results obtained at the National Institute of Microbiology were correct.
Niacin test used
No. of laboratories
No. of positive cultures Total
No. of “atypical” cultures retested
Identified on retesting as M. tuberculosis
No. (%I
No 7 541 95 38 (40.0) Yes 8 13,003 507 85 (16.8)
Ttial 15 13,544 602 123 (20.4)
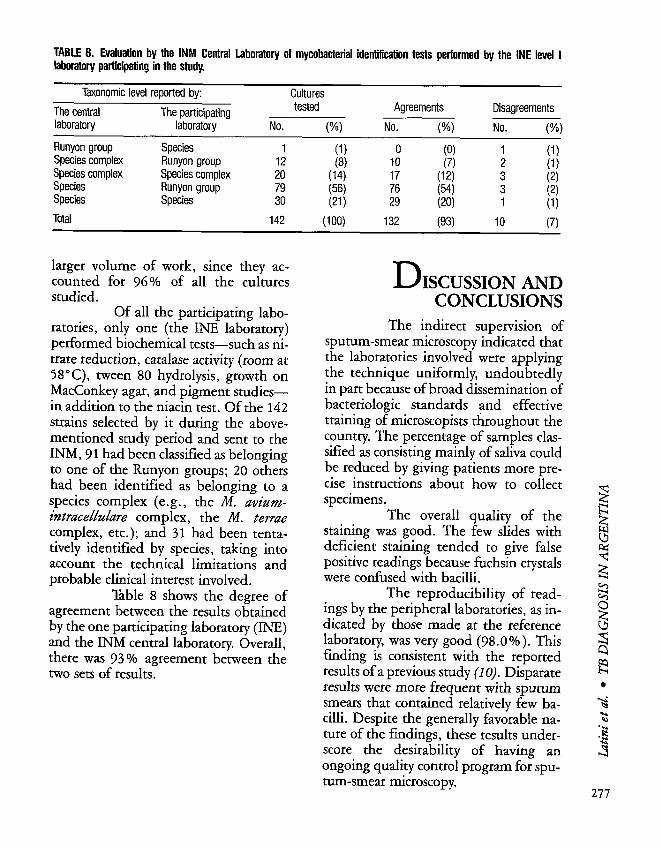
TABLE 8. Evaluation by the INM Central Laboratory of mycobacterial iderdikation tests performed by the INE level I laboratory participating in the study,
Taxonomic level reported by:
The central The participating laboratory laboratory
Runyon group Species Species complex Runyon group Species complex Species complex Species Species
Runyon group Species
Total
Cultures tested Agreements Disagreements
No. (%) No. (%) No. (%I 1 (1) 0
12 IO K-3) :;I 1
I:; 20 (14) 17 (12) 3’ 79
;z; :i (54) 3 I;;
30 (20) 1 iv 142 (100) 132 (93) IO (7)
larger volume of work, since they ac- counted for 96% of all the cultures studied.
Table 8 shows the degree of
Of all the participating labo- ratories, only one (the INE laboratory) performed biochemical tests-such as ni- trate reduction, catalase activity (room at 58°C) tween 80 hydrolysis, growth on MacConkey agar, and pigment studies- in addition to the niacin test. Of the 142 strains selected by it during the above- mentioned study period and sent to the INM, 91 had been classified as belonging to one of the Runyon groups; 20 others had been identified as belonging to a species complex (e.g., the M. avizmz- intraceZZ%Zare complex, the M. tevae complex, etc.); and 31 had been tenta- tively identified by species, taking into account the technical limitations and probable clinical interest involved.
agreement between the results obtained by the one participating laboratory (INE) and the INM central laboratory. Overall, there was 93% agreement between the two sets of results.
D ISCUSSION AND CONCLUSIONS
The indirect supervision of sputum-smear microscopy indicated that the laboratories involved were applying the technique uniformly, undoubtedly in part because of broad dissemination of bacteriologic standards and effective training of microscopists throughout the country. The percentage of samples clas- sified as consisting mainly of saliva could be reduced by giving patients more pre- cise instructions about how to collect specimens.
The overall quality of the staining was good. The few slides with deficient staining tended to give false positive readings because fuchsin crystals were confused with bacilli.
The reproducibility of read- ings by the peripheral laboratories, as in- dicated by those made at the reference laboratory, was very good (98.0%). This finding is consistent with the reported results of a previous study (1 O), Disparate results were more frequent with sputum smears that contained relatively few ba- cilli. Despite the generally favorable na- ture of the findings, these results under- score the desirability of having an ongoing quality control program for spu- tum-smear microscopy.
Regarding evaluation of the media being used to culture specimens, the 13 batches of media evaluated yielded a minimum of 159 and a maxi- mum of 382 colonies, so that the maxi- mum was no greater than 2.4 times the minimum. In this same vein, every batch yielded a total number of colonies ex- ce_eding the critical number of 145 (X - 2 SD). Hence, the results indicate that the general quality of media being used in the 13 participating laboratories was adequate.
However, on the basis of this first quality control trial of culture diag- nosis, CEPANZO has modified the recommended bacillary concentrations of the inoculum and the recommended number of tubes to be employed as spelled out in the original protocol. The current protocol, as amended, calls for dilutions of 1 X lo-* mglml and 0.5 X 10m4 mg/ ml, a minimum of four tubes being inoculated with 0.2 ml each of the first dilution and twice as many (at least eight) being inoculated with the second in order to obtain less of a range in the readings and less likelihood of negative cultures (14, 15).
Evaluation of antibiotic sensi- tivity testing at five laboratories demon- strated that the quality of testing in those laboratories was good. However, tests of streptomycin sensitivity were less reliable than those of isoniazid sensitivity. This
2 appears to have been due mainly to the
2 inferior thermal stability of dihydro- -
3 streptomycin sulfate, a conclusion un-
2 derscoring the fact that maintaining
..g proper storage conditions-both for the
u pure drug and for the medium once it is %
2
prepared-are of fundamental impor- tance (8).
278
With regard to mycobacterial differentiation, the results suggest it would be desirable to extend use of the niacin test to all level II laboratories that perform culture diagnosis. In addition, it appears important to upgrade knowl- edge of basic mycobacterial differentia- tion in these level II laboratories through specific training, so that the bacteriolo- gists involved will know how to proceed in the event of unusual isolations. Over- all, the results obtained in this study showed a high level of agreement be- tween the two laboratories that per- formed tests identifying mycobacterial species or groups of species.
S UMMARY Bacteriologic methods-in-
cluding sputum-smear microscopy, cul- turing, drug sensitivity tests, and tests distinguishing between different kinds of mycobacteria-are being used increas- ingly in Argentina and other Latin American and Caribbean countries to di- agnose tuberculosis. This has created a growing need for adequate quality con- trol systems to momtor and supervise performance of these tests.
To that end, in 1985 a cooper- ative quality control study of all such di- agnostic methods was undertaken in Ar- gentina. A total of 2,293 sputum smears from 316 laboratories were reread at Ar- gentina’s National Institute of Epidemi- ology in Santa Fe, and the quality of each specimen was assessed. Batches of Lo- wenstein-Jensen culture medium from 13 laboratories were tested by inocula- tion and culturing of Mycobacterizcm tzl- bercdosis strain H37Rv at the University of Buenos Aires’ Center for Tuberculosis and Pulmonary Diseases. M. tzdwadosi~ cultures tested for sensitivity to strepto- mycin and isoniazid at five laboratories
were retested at the Regional Tuberculo- sis Laboratory in C6rdoba. A total of 602 cultures of possibly “atypical” mycobac- teria from 15 laboratories were evaluated at the National Institute of Microbiology in Buenos Aires. And 142 cultures of atypical mycobacteria classified at the National Institute of Epidemiology were retested and reclassified at the National Institute of Microbiology.
In general, the results of this extensive evaluation were satisfactory. There was 98% agreement between the original and subsequent sputum-smear readings, and the laboratories involved appeared to be applying the sputum- smear microscopy technique uniformly. The general quality of the culture media tested appeared adequate. The quality of antibiotic sensitivity testing was found to be good. And a high level of agreement was found between the two laboratories performing tests to classify atypical my- cobacteria. Regarding mycobacterial dif- ferentiation between cultures of M. tzl- bemdosis and “atypical” mycobacteria, the results suggest it would be desirable to have the niacin test used by all level II laboratories performing culture diag- nosis .
Overall, it is felt that the pro- cedures and methods used to perform these evaluations can serve as a useful ref- erence model in Argentina and other countries for establishing a complete quality control system operating on a regular basis to monitor and supervise the tuberculosis laboratory network.
RE FERENCES
ComisiBn Latinoamericana de Bacteriologia de la Tuberculosis. Encuesta de COLABAT, resu- men de resultados. Bokttit Informative de La Comisio’n LatinoameriGana de Bacteribl’oLz de la %berczLo& 3(1):12, 1987. ”
David, H. Bacteriology of the Mycobacte- rioses. United States Centers for Disease Con- trol, Atlanta, 1976.
Pan American Health Organization. Tzbercu- Corir Cont&: A Manlrd on Method’ and Pro- cedures for IntegratedPrograms. PAHO Scien- tific Publication 498. Pan American Health Organization, Washington, D.C., 1986.
DiLonardo, M., N. C. Isola, M. Ambroggi, G. Fulladosa, and I. N. de Kantor. Enfermedad producida por micobacterias no tuberculosas en Buenos Aires, Argentina. Bol Of Sanit Panam 95(2):134-141:1983. -
Barrera, L., and I. N. de Kantor. Nontubercu- lous mycobacteria and Mycobacterilrm bovis as a cause of human disease in Argentina. T7op Geogr Med 39(3):222-227, 1987.
Centro Panamericano de Zoonosis. Manual de normas y procedimientos tknicos para la bac- teriologia de la tuberculosis: La muestra; el examen microsc6pico. Nota ticnica No. 26. Ramos Mejia, Argentina; 1984.
Centro Panamericano de Zoonosis. Manual de normas y procedimientos tknicos para la bac- teriologia de la tuberculosis: El cultivo de1 My- cobactekm tz&erczlosis. Nota tEcnica No. 27. Martinez, Argentina; 1985.
Centro Panamericano de Zoonosis. Manual de normas y procedimientos tknicos para la bac- teriologia de la tuberculosis: Sensibilidad de1 Mycobacte&m tzcberculosis a las drogas; la identificaci& de micobacterias. Nota tEcnica No. 28. Martinez, Argentina; 1986.
9 Comisidn Latinoamericana de Bacteriologia de la Tuberculosis. Encuesta dirieida a 10s inte- grantes de COLABAT. Bo/etZn”I~fotmativo de la ComzZn Latinoameticana de BactenbLogib de l’a Taberczdosis 1(2):4-6, 1985.
10 Latini, 0. A., M. D. S. Latini, and J. 0. Cec- coni. Calidad de la baciloscopia de esputo en la red de laboratorios de la Argentina. Bd Of Sanit Panam 100(6):622, 633, 1986.
t 1 Organizaci6n Panamericana de la Salud I Or- ganizaciGn Mundial de la Salud. Protocolos
para estudios comparatives de investigation en bacteriologia de la tuberculosis. Centro Na-
14 Comision Latinoamericana de Bacteriologia de la Tuberculosis. Control de calidad de1 medio
cional de Referencia en Tuberculosis, Centro de Laboratorios para el Control de Enferme-
de cultivo Lowenstein Jensen. BoLetin de la
dades, Ottawa, 1982. Comisio’n LatinoameriGana de Bacteriologia de l’a %berc&osis 3(1):1-11, 1987.
12 Bancroft, H. Introduccio’n a La bioestadirtica. Editorial Universitaria de Buenos Aires, Buenos Aires, 1960.
13 Kantor, I. N. de. Bacteriolog2; de la Tgbercz- ksis. CEPANZO Monograph 11, Centro Pana- mericano de Zoonosis. Ramos MejIa, Argen- tina; 1979.
15 World Health Organization. In Vitro Assays of BCG Products. WHO document TBITechni- cal Guide177.9. Geneva, 1977.
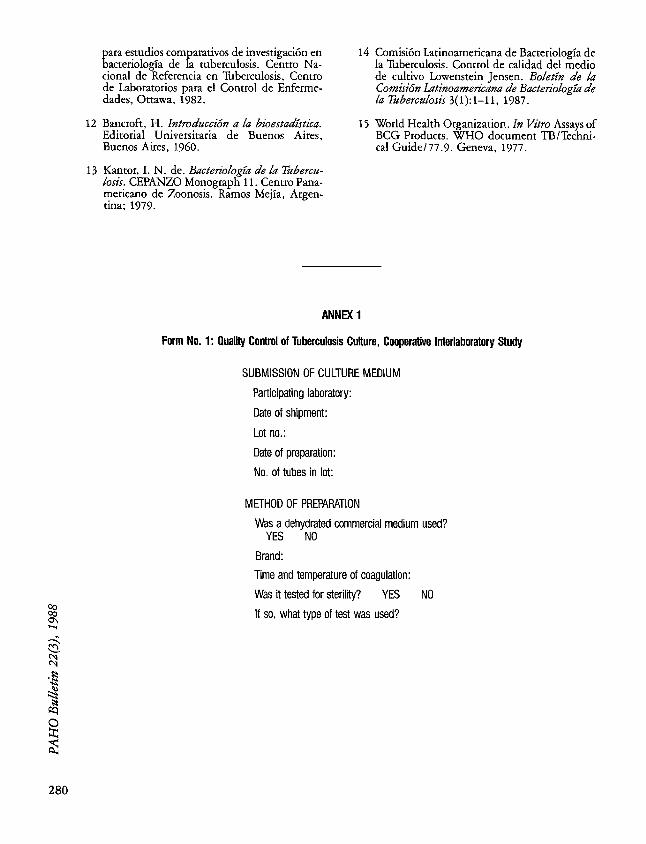
ANNEX 1
Farm No. 1: Qualii Control of Tuberculosis Culture, Caoperalive Interlaboratory Study
SUBMISSION OF CULTURE MEDIUM
Participating laboratory:
Date of shipment:
Lot no.:
Date of preparation:
No. of tubes in lot:
METHOD OF PREPARATION
Was a dehydrated commercial medium used? YES NO
Brand: Time and temperature of coagulation:
Was it tested for sterility? YES NO
If so, what type of test was used?
280