Embed Size (px)
Citation preview

Copenhagen Business School
MSc. Accounting, Strategy and Control (ASC)
Master Thesis
Valuation in Turbulent Times:
With the oil and gas industry at a critical junction what will become of Welltec?
Natalia Kirilenko
Supervisor: Ole Vagn Sørensen
Number of pages: 80
Hand-in date: 15 March 2017

2
Table of Content
Executive summary 3
CHAPTER 1. Introduction 4
1.1. Industry overview 4
1.2. Company presentation 6
1.3. Research question 7
1.4. Methodology 8
CHAPTER 2. Financial analysis 11
2.1. Accounting quality 12
2.2. Analytical balance sheet 13
2.3. Analytical income statement 22
2.4. Profitability analysis 27
2.5. Sub conclusion 30
CHAPTER 3. Strategic analysis 31
3.1. PESTEL Analysis 32
3.2. Industry Scenario 45
3.3. Industry analysis 49
3.4. Internal analysis 53
3.5. SWOT 58
CHAPTER 4. Forecast and valuation 58
4.1. Adjustments for non-recurring items 59
4.2. Forecast of Q4 2016 and full 2016 60
4.3. Forecast of 2017+ 69
4.4. Cost of capital 75
4.5. Valuation 77
4.6. Sensitivity analysis 78
CHAPTER 5. Conclusion 79
Bibliography 82
Data sources 89
Appendix 91

3
Executive summary
I set out to write this thesis with the principal purpose of estimating Welltec’s fair market value as of
31 December 2016, in case of an M&A interest from one of OFS majors. To fulfil this task, I
performed financial and strategic analysis to create a basis for forecast, which is the foundation for
the valuation.
Currently, Welltec’s finances are in a bad shape. Nevertheless, Welltec has a genuine chance of
rebounding once oil prices recover. Whether or not it will be able to capitalize on this opportunity is
another question.
The strategic analysis foresees a growing demand for equipment designed to work in unconventional
wells and rising oil prices, which is good news for Welltec. The flipside of the coin is that alternative
energy sources’ infiltration of the energy market is gaining traction. The forecast prepared reflects
prevailing professional concerns over these developments.
According to the forcast, on 31 of December 2016, the company market value of equity is estimated
to be $109.464 thousand. Estimated market value of equity is equal to 63% of book value. This value
estimate is compared to an EVA model valuation and a multiple valuation (however, only a single
company was deemed to be comparable to Welltec), in order to check the reliability of the result
obtained from the DCF model. In addition, the valuation was accompanied by a sensitivity analysis
that revealed that the value estimate is sensitive to changes in some of the key value drivers, especially
to changes in EBITDA-margin.
In conclusion, the estimated Welltec value is the result of the author’s interpretation of the
information generated by the strategic and profitability analysis. Turbulent times added uncertainty
to a valuation. The only thing that is certain these days is that for the oil and gas industry business is
not as usual, and no company can afford let go of the controls and switch to autopilot mode. Turbulent
times open up for new opportunities as well as new threats.
It is also important to highlight that for the purpose of M&A the estimated value could be used as a
starting point in defining the price of acquisition. The forecast, which was the basis for the valuation,
was prepared using very moderate figures/assumptions. At the same time, the analysis revealed that
there existed good opportunities for bolstering the company’s value if internal policies and processes
were improved. Armed with such a plan for improvement, the potential buyer would stand a good
chance of profiting from his purchase. More so, if potential benefits from synergies and economies
of scale are factored into his computations.

4
CHAPTER 1. Introduction
Oil is an essential commodity. Mainly, it is used as a source of energy – directly as fuel and indirectly
as power supply. Petroleum is simple to transport, store and use compared to other energy sources. It
is an important input in different economic sectors, principally, in chemical industry. Plastic, synthetic
rubber and fabrics, as well as cosmetics products and medicines are made of petroleum or
petrochemicals. [3] In other words, oil is an indispensable part of our daily lives.
The oil industry and the prices of oil have a tremendous influence on national and global economies.
In consequence, oil attracts the attention of people from all walks of live with various professional
affiliations, including politicians, economists, industrialists, and even the ordinary citizen. In short,
almost everyone.
Because oil is so much enmeshed in our daily lives, and because of entanglement in many aspects of
the world’s economy, it is important that we improve our understanding of how the market assigns
value to the companies operating in that field. This is even more so in the low oil prices and the
emergence of renewables as economically viable sources of energy.
1.1. Industry overview
To begin with, I will draw a quick sketch of industry’s value chain and its recent trends.
The oil and gas industry is comprised of numerous processes and activities. Their overarching purpose
is transforming the crude resources into useful petro-based-products for the end users. First, they must
identify the sites where they have a good chance of finding these resources, and an even better chance
of extracting them. Should they be fortunate and hit black gold, they must then assess if it is
worthwhile to proceed with development and production. The aforementioned activities comprise the
activities generally labelled upstream oil and gas. Services associated upstream oil and gas include
UPSTREAM DOWNSTREAM
Operator
(E&P)
Service
(OFS)
Refinery Distribution Production Exploration

5
“geological and geophysical surveys and analyses, drilling, equipment supply and engineering
projects” [38, p.2]. The downstream part of the industry’s value chain is where the crude resources
are refined into useful substances and transported to their end users.
As this description indicates, the scale of the work involved is vast and the activities are diverse.
Therefore, exploring, developing and producing petroleum is the collaborative effort of a number of
specialized companies. Leading these efforts are the exploration and production companies (E&P for
short) (a.k.a. the operators). E&P companies are the conductors of big oil orchestras: “The operators
judge the economics and politics of resource acquisition, development and production, and coordinate
the knowledge and operations of a number of service companies”. [38, p.2-3]
Operators are the ones who enlist the services of ‘oil and gas service companies’ (OFSs) “to, among
other things, provide the equipment, technology, and man-power needed to locate and retrieve oil”
[38, p.4]. Thus, OFSs “provide products and services to E&P companies but are typically not
producers of oil or natural gas themselves.” [10, p.1]
Companies, in the OFS, are characterized by high degree of heterogeneity “rang[ing] in size from
Fortune 500 companies to small local retailers” [10, p.1], and, in the scope of their services, from the
provision of a single service to integrating a series of services along the entire value chain. The OFS
market is highly competitive. In the US alone, there were more than 10,000 OFS companies operating
in 2013, its biggest players are “Schlumberger Ltd., Halliburton Co., Baker Hughes Inc., and
Weatherford International”. [10, p.1] Within the OFS sector itself there exist a number of sub-
segments: “The service and equipment subsectors are comprised of a number of segments with
hydraulic fracturing (“fracking”), subsea equipment, and drilling & completion fluids representing
the largest segments”. [10, p.2] For a more detailed list, I refer the reader to the Appendix 2.
From the description above, it is apparent that the future fortunes of the OFS industry is a function of
“the capital spending budgets of E&P companies as demand [for OFS products/services] is driven by
the availability of capital for E&P companies as well as long-term expectations regarding the prices
of oil and natural gas”. [10, p.2]
At present, companies throughout the length of the industry’s value chain, including OFS companies,
have been struggling with low oil prices. As a result, pressures to economize have coursed through
the value chain: “E&P companies have been pushing the supply chain to aggressively lower costs
which in turn is impacting margins. This is hitting the service sector [OFS companies] by reducing
capacity utilization and lowering rates, to which service companies are responding by downsizing”.
[44, p.1]

6
The evolution of OFS sector is characterized by integration of services driven by E&P customers’
preference for ‘single company’ and ‘single contact’ solutions. The Spears and Associates estimates
that 25% of a major OFS company’s sales will be integrated services while in 2005 and 2010 the
numbers were 5 and 10% accordingly. The trend within the upstream towards more integrated project
management handled by OFS companies will lead to OFS sector consolidation. Bigger OFS
companies continue to build capabilities and competencies over a wider range of activities in the field
life cycle. According to KPMG, “in the current low oil price environment, integration is being pushed
through mergers and acquisitions” [44, p.4].
One of the key factors in the integration movement is the ability to leverage certain technologies on
a company wide scale. The ability of OFS companies to compete profitably depends on their ability
to stay technologically competitive. In low oil price environment companies reduce their costs
including the investments in research and development. However, some (mainly bigger) companies
will stand out by investing and maintaining a focus on technology through the industry downturn
“either in-house or by acquiring weaker companies with strong technology potential” [44, p.10]. The
strategy for technological improvement through M&A with smaller companies with specified
technological capabilities gives bigger OFS company an advantage to respond faster on innovation
calls. Big OFS companies frequently look for smaller companies as potential M&A targets.
There is a trend in Oil industry towards developing unconventional oil plays. That set a direction for
technological development in OFS sector. Service companies are challenged to provide well
diagnostic, intervention, stimulation, completion and other well services technologically suitable for
unconventional wells. For example, “demand for fracking services has grown with increased reliance
on horizontal drilling and fracking of denser rock formations in the unconventional plays.” [10, p.2]
Low price environment further boosts the integration trend. As major operators integrate into
downstream to offset lower profits in the upstream, OFS companies increase the range of services to
reduce costs through economies of scope and economies of scale. According to KPMG Global Energy
Institute, “on a typical onshore, unconventional project the complexities associated with an non-
integrated supply chain drive up costs much higher than necessary” [44, p.10].
Seeing as there are clear signs that the OFS sector is moving towards greater consolidation driven by
customers’ preference for integrated services, need to reduce costs through economies of scale and to
respond on technological challenges, there is a high probability that a small innovative company will
be object of M&A by one of the bigger players.

7
1.2. Company presentation
Welltec is an international provider of well completion technology and intervention solutions for the
oil and gas industry. [73] It was Founded in 1994 by Jørgen Hallundbæk. Welltec started out as a
subcontractor graduating into a direct contractor in 2003.
A comparatively small group of private actors own Welltec. At present, EXOR S.p.A. and Holding
B.V. are Welltec’s largest external shareholders. [68, p.60-61] Nevertheless, Hallundbæk remains in
full command of the company.
In laymen terms, Welltec provides patented technological solutions that facilitates the exploitation of
oil and gas resources. In particular, from wells with geological features regarded as being
unaccommodating.
Their range of services include: conveyance solutions, open and cased hole logging, perforating,
coiled tubing stimulations [61], clean-out solutions [64], milling solutions, mechanical solutions (incl.
setting and pulling plugs and packers, valve manipulation, fishing services, etc.) [51] and completions
solutions [63].
Welltec solutions are universal. They are compatible with non-Welltec equipment and other 3rd party
systems and tools.
Welltec head office, production and service facilities are located in Denmark. Today, Welltec has
more than 29 offices and service facilities worldwide employing more than 800 people.
More than a half Welltec revenue comes from Europe, Africa and Russia/CIS (see Appendix 17).
About 1/3 of the Welltec income comes from a single customer (Statoil) who has been working
closely with Welltec’s from its early beginnings [68, p.35] Almost 1/3 of revenue comes from the
Americas and less than 1/5 comes from Asia Pacific and the Middle East. Only a negligible share of
the group’s revenues are generated in Denmark [68, p.35]
To put it concisely, Welltec’s strategy is the provision of reliable technologies that can extend the list
of non-conventional oil and gas fields that can be economically exploited:
“Welltec is a solution-driven company where we develop and apply proven technology to
address the challenges of tomorrow’s needs. We continue to push the boundaries of
conventional oil field technology to their limits and force the only constant parameter we know;
change. Only through constant change are we capable of capturing the necessary improvements
to assure a strong future for our stakeholders: the industry, our clients and employees”. [73]

8
1.3. Research question
Welltec is a possible candidate for the future M&A which is highlighted by the fact that it is in
possession of specified technological knowhow that is required to develop unconventional oil plays.
As Welltec is non-listed company, the market has not established a price for it. The research question
(RQ) of this thesis is:
What would be a fair market price for Welltec in case of M&A interest from one of OFS majors.
The answer for that question will be revealed by valuating the company. The steps that need to be
taken to reach a proper valuation will determine the sub-questions (SRQ).
The first step is dedicated to identifying the relevant financial value drivers by means of a thorough
analysis of the company’s financial statements. Analyzing financial statements is an important
starting point as they contain many historical data about past operations that explain the current
workings of the company. However, such historical data can reveal little information of how the
company can be expected to perform in the future. Hence, a proper company valuation is
indispensable.
This takes to the next step, which is the identification of the factors that determine Welltec’s financial
value and attempting to project their future trajectory and behavior. These drivers of financial value
will be ferreted out and pinpointed using a thorough strategic analysis.
The results and conclusions that financial statement analysis and strategic analysis will enable us to
forecast Welltec’s future cash flows and risk.
Knowing what future cash flows that can be expected I will be able to carry out a valuation of the
company and determine what a fair market price for Welltec would be.
The Appendix 3 explains the logical progression of the thesis’s research plan.
1.4. Methodology
Following the logical progression of the thesis’s research plan. The thesis is structured as presented
in the figure below:
Chapter 2. Financial analysis
reformulation of Balance
sheet and Income statement
profitability analysis Chapter 1. Introduction
research question
industry overview
company presentation
methodology
Chapter 3.
Summary of
financial and strategic
analysis Chapter 3. Strategic analysis
Analysis of macro factors
Industry analysis
Internal analysis
Chapter 4. Forecast & valuation
forecast of Q4 2016
forecast of 2017+
WACC estimate
valuation
Chapter 4.
Conclusion

9
1.4.1. Choice of models and methods
Below I will provide a short overview of the models and methods used. A more detailed description
of each model will be included in the section where it is applied.
1.4.1.1. Financial analysis
I acquired the Excel footwork that I used in my calculations from the course ‘Applying Excel Models
in Operations Management’. For instance, when adjusting Welltec’s financial statements, I needed to
capitalize operating leases. Here, I used the Excel functionality ‘Goal Seek’ to estimate the interest
rate for financial leases that I then used to capitalize operating leases. Also, the info on operating
lease payments and obligations was very compressed and limited in detail. Here, I used Excel’s
‘Solver’ functionality to decompress the info and build a model scheduling lease payments and
obligations with obligations organized according to their lease term period.
In chapter 2, my main fount of theories and methods is Petersen and Plenborg (2012), with tributary
contributions from Wild et al. (2007), Krishna et al. (2013), and Koller et al. (2010).
1.4.1.2. Strategic analysis
To analyze the macro factors influencing the OFS sector, which Welltec belongs to, I use the PESTEL
model. To appraise the attractiveness of the OFS industry to prospective investors I use the Six Forces
model. To examine internal inimitable resources that sharpen Welltec’s competitive edge I use the
VRIO model. Finally, I use the SWOT model to sum up where potential market threats might come
from, what makes Welltec vulnerable, how Welltec strengths might be used to strike back, and where
potentially promising market opportunities might be found.
In chapter 3 dealing with strategic analysis, I follow the top-down approach advocated in Petersen
and Plenborg (2012). However, in this chapter, my primary theoretical source was Johnson et al.
(2014), supplemented with McManners (2014).
1.4.1.3. Forecasting and valuation
To forecast 2016’s Q4 I use models from the ‘Applying Excel Models in Operations Management’
course. Primary my focus is on three models: ‘Winter’s Model’ (that captures level, trend and
seasonality), ‘Holt’s model’ (that forecasts level and trend) and ‘Simple Exponential Smoothing’
(applied to forecast the level).
When forecasting 2017+, I preserve Welltec’s historical sustainable growth, as I am assuming that
Welltec will be unable to obtain additional funds at a reasonable cost due to its poor credit rating.

10
When calculating weighted average cost of capital (WACC), I will estimate β for Welltec from
comparable companies. I will also use the multiple BVE
MVE from a comparable company to estimate
Welltec’s market value of equity (MVE). I use CAPM to estimate investors required rate of return.
Finally, to valuate the company I use discounted cash flow approach (DCF).
In chapter 4, the models and methods applied in forecasting 2016’s Q4 come from Chiara Gobbi’s
(2013) lectures on ‘Applying Excel models in Operations Management’. However, for the preparation
of the pro forma statements, WACC calculations, valuation, sensitivity analysis etc. I, again, turn to
Petersen and Plenborg (2012).
1.4.2. Data collection
I had no access to any additional insider knowledge of Welltec’s activities. So, the data and
information on which this paper is based, comes, solely, from sources available to the general public,
such as the company’s annual reports, web pages, articles, etc. Consequently, data used in the
financial analysis, comes, mostly, from Welltec itself, including annual and quarterly reports,
presentations to investors, company announcements etc., which can all be accessed from the
company’s Website.
Undoubtedly, there is always some risk (however small) that such internally prepared data has been
cooked to suite Welltec’s tastes (i.e. interests). However, Welltec’s accounts have been examined by
independent auditors, who judged their financial statements to be a true (or plausible) representation
of the company’s economic circumstances, which reduces the chances of any wanton
misrepresentation of reality. Nevertheless, I recognize that for other types of internal information,
such as company announcements, one has to exercise more caution, as a company will always try
(given the chance) to paint a rosier picture (or is it a blacker picture in our case since we are dealing
with the oil and gas industry). Therefore, for such types of information, it is always beneficial,
circumstances allowing, to seek verification from external, independent sources to bolster the
information’s credibility.
For outlining the general contours of the oil and gas industry and the macro factors affecting (or
afflicting) it I have used a much broader palette of secondary information sources, including textbooks,
academic journals, industry journals, the official websites of governmental and non-governmental
agencies, reports from consultancy firms, and online newspapers.
The above listed sources of data, especially academic journals, claim to offer factual, unbiased
renditions of reality; which is probably true in the majority of cases. Nevertheless, one should always

11
keep his skepticism close at hand, especially, where the commercial press is concerned, as their
opinions are, usually, more susceptible to corporate influence.
In order to forecast Welltec’s future, I first needed a general projection of the possible future
developments in the oil and gas industry and its governing macro factors. For this purpose, I use a
long-term scenario that synthesizes the future outlooks envisaged in BP’s “Energy Outlook 2017”
and the IEA’s “World Energy Outlook 2016”, which, in many of their points, concur with the future
prognostications of another major oil and gas player (Statoil 2016) and two of the world’s leading
consultancy firms (Deloitte 2016, and KPMG 2016). However, the figures in the BP report are the
most recent. The fact that the future outlooks of these experts closely agree helps reinforces the
credibility of data on which my scenario is founded.
In calculating cost of capital (WACC), I used the data of comparable companies obtained from
Yahoo!Finance and The Wall Street Journal (https://www.wsj.com).
In the main, I consider the data, from both my primary and secondary sources, to be sound and highly
valid.
1.4.3. Demarcation
In this paper, I attempt to assess what Welltec’s worth to investors would be on 31 December 2016.
Thus, any events taking place post 31 December 2016, which could either raise or lower Welltec’s
value are not incorporated into this analysis. However, in my scenario forecast of the industry, I have
taken care to update the ‘Energy Outlook’ with important events taking place before the closure of
2016 (e.g. Trump election) that could potentially alter the outcome of Welltec’s valuation.
Unfortunately, Welltec’s annual report for 2016 is not included in the analysis, as its publication date
is the end of February, which is beyond the timeline of this study. However, seeing as 2016 has been
a particularly tough year for the industry, with negative side effects that will, most probably, carryover
to 2017’ profit/loss figures. Hence, omitting 2016’ performance would greatly degrade the quality of
the analysis. Therefore, I used Welltec’s quarterly reports to forecast 2016.
I used data from comparable companies to estimate weighted average cost of capital (WACC). This
was done fairly lately in my research process. By that time, the 2016 annual reports for the comparable
companies had already been published, allowing me to bypass forecasting 2016 for these companies.
CHAPTER 2. Financial analysis
The activities of a company are divided into operating, investing, and financial activities. Operating
activities, as the name suggests, are the ones responsible for creating value. Moreover, a company’s
operating activities are what distinguish it from its rivals, and their replication should, preferably, not
12
be easy. Therefore, assessing the company’s ability to generate value and overcome competition
requires that operating activities are isolated so I can subject them to closer analytical scrutiny. On
the other hand, financial items, while not unimportant, only inform about the commonplace financial
blind which the company’s management has settled on for financing its operations (including
investments). [8, p.68] Before I can go ahead with the financial analysis, I need to assess Welltec’s
accounting quality.
2.1. Accounting quality
An analyst should always regard the data provided in the financial statement with some degree of
skepticism or even mistrust if it is warranted. Hence, he should always assess the data’s quality before
he proceeds with the analysis, as judgements based on low-quality accounting “could lead to
misinterpretations and false conclusions”. [8, p.64] Below, I include a summation of my impressions
concerning the quality of Welltec’s accounting figures.
I consider the data to be consistent, since Welltec did not change accounting policies throughout the
analyzed period.
I regard Welltec’s annual statement as being transparent; the notes contain a lot of additional
information that facilitate the performance of a thorough analysis. However, quarterly reports do not
contain notes. Therefore, when performing analysis and forecast of Q4 2016 I had to make
assumptions about some of the accounting items based on previous years trends.
With that being said, the more demanding challenge was the modifications made to the way the data
was depicted in the statements: “In 2013, Management decided to change the presentation currency
of its consolidated financial statements [from DKK] to USD….”[68, p.42]. Welltec restated income
statement for 2011 and 2012 is in USD. However, the earliest available balance sheet in USD is from
2012. This curtails the number of consistent financial statements available for analysis. To overcome
this problem, balance sheet data for 2010 and 2011 is converted from DKK to USD using the annual
exchange rates for these years. The converted data is used in profitability analysis, but only on a
highly aggregated level. The quality of the data is not expected to suffer from the currency
conversions. Moreover, it helps to extend the periods available for spotting (possible) trends.
An integral part of financial analysis and company valuation is identifying the “sources of noise” [8,
p.64] in ones data. In 2012, Welltec launched a new product that was intended for the ‘completion
services segment’, which was new territory for Welltec. With that being said, Welltec’s
services/products range remains narrow when one looks at product diversification and services
integration that prevails in the OFS market. Thus, this, relatively restrained extension of Welltec’s

13
product/service mix is not expected to alter its risk profile significantly. In addition to this, Welltec
has been growing extensively during the analyzed period, extending its global geographic presence
to 29 countries compared with 21 in 2010 (see Appendix 4)
Any of the abovementioned factor can change the company’s risk profile. In the event that “the risk
profile of [a] company has change[d] over time it is necessary to adjust the required rate of return
accordingly”. [8, p.65] In profitability analysis, I compare Welltec’s ROIC with the WACC from
their annual reports notes. This should mitigate the noise from some of the changes in Welltec’s risk
profile.
2010 and 2011 are excluded from indexing and common size analysis because of the currency
representation issues described above. Additionally, the main changes that could affect company’s
risk profile that took place in 2010-2011. That is to say, they take place during a period not covered
in the indexing and common size analysis.
Welltec’s income statement contains special items. Some of them relate to restructuring costs and
regarded as recurring. It also contains special items that are regarded as non-recurring. The latter is
excluded from financial statement for the purpose of forecasting and valuation.
Welltec has both financial and operating leases. The latter are not recorded in balance sheet but
disclosed in annual report notes. To improve representativeness/quality of the financial analysis and
the valuation, operating leases are capitalized and the necessary adjustments to financial statement
are made.
In conclusion, overall Welltec’s financial statement data is regarded to be a good quality. Factors that
could create ‘noise’ are addressed before forging ahead with the analysis.
2.2. Analytical balance sheet
For items in the ‘analytical income statement’ to be commensurate with related items in the ‘analytical
balance sheet’. [8, p.73] For the analytical balance sheet look in Appendix 5.
2.2.1. Intangible assets
Welltec’s intangible assets consist of the following: goodwill, development projects (completed and
still in-progress); patents, licenses, acquired intangibles including ‘technology’, ‘customer
relationship’ and brand. [68, p.22] For detailed information on intangible assets, I refer the reader to
Appendix 6. All intangible assets are regarded as being part of Welltec operations and classified as
operational items.

14
2.2.2. Tangible assets
Tangible assets consist of land and buildings; plant-equipment and fleets (including those that are still
under construction); other fixtures, fittings, tools and equipment; and leasehold improvements. [68,
p.22] Some of these tangible assets are held under finance lease. Welltec has manufacturing
equipment that has been leased for 3-5 years and a (single) new building acquired in 2014 with a lease
term of 12,5 years. Leased assets are depreciated according to the lease term period. [69, p.61] For
detailed information on tangible assets, I refer the reader to Appendix 7.
All tangible assets are considered to be part of Welltec operations and, therefore, classified as
operational items.
2.2.3. Operating lease
Welltec has entered into operating lease agreements concerning rental of houses and office furniture
for periods ranging from 3 months and up to 3 years. Welltec has, also, leased company cars for
periods of up to 7 years and even longer. [72, p.60] , [71, p.63], [69, p.63], [68, p.55]
Operating leases are not recognized in the balance sheet. Lease contracts are disclosed as contingent
liabilities in the Annual report notes. [8, p.421] Not disclosing the assets and their related liabilities
in the balance sheet can positively bias financial ratios. [1, p.125] Therefore, in order to improve the
analysis’s reliability, operating leases with duration periods that are more than 1 year are capitalized
(i.e. converted to finance/capital leases). As for operating lease agreements with duration periods that
are less than or equal to 1 year, they are treated as operating expenses.
Finance lease is an alternative to operating lease. It appears in the balance sheet as lease asset with an
offsetting lease liability. [8, p.421] Therefore, the following adjustments to Welltec balance sheet and
income statement are required.
To convert operating leases to financial leases the present value of operating lease liabilities needs to
be estimated.
The first step is to estimate the interest rate that should be used to discount the projected lease
payments. Welltec reports both financial and operating leases. Therefore, assuming that operating
and financial leases have a similar interest rate, then the interest rate can be estimated based on
projected financial lease payments and their present value (see Appendix 8). [1, p.127]
In its notes Welltec discloses projected financial lease payments and their present values grouped into
3 categories depending on maturity of lease obligations. According to its Annual reports for 2013-
2015, finance lease obligations that would be due in 1 year and those that would be due in 1 to 5 years
are related to manufacturing equipment with lease terms of 3-5 years. [68, p.53], [69, p.61], [70, p.61]

15
Finance lease obligations with maturity periods that are longer than 5 years are related to a single new
building, acquired in 2014, with a lease term of 12,5 years. [69, p.61]
Estimating the implicit interest rate for obligations maturing in less than 5 years is challenging as
obligations with different length are jumbled up together. However, by creating a model with the
system of constrains derived from Welltec Annual report notes for 2012-2015, the interest rates can
be estimated using ‘Solver’ functionality in Excel (see Appendix 8):
Year 2012 2013 2014 2015 Average
Implicit interest rate (lease obligations due from 1 to 5 years) 2,5% 2,2% 2,5% 2,2% 2,3%
An average rate is used as a proxy for the interest rate for capitalizing operating, mid-term (1-3 years),
leases.
According to Welltec notes, financial leases have a floating interest rate. [68, p.52] Based on the
information about long-term liability (> 5 years) provided in Annual report notes 2014 and 2015, an
implicit interest rate can be estimated using Excel’s ‘Goal Seek’ functionality (for detailed calculation,
I refer the reader to Appendix 8).
The interest rate for long-term leases on a new building was 3,4% in 2015 and 1,0% in 2014. I could
use an average rate. However, there are only two observations and the difference between them is
substantial. Therefore, as an alternative, I use the yield on Welltec’s long-term debt to estimate the
interest rate on company cars operating lease. [1, p.127]
From the start of 2012, Welltec’s interest rate is mainly connected with its ‘interest bearing debt to
bondholders’ which has a fixed effective rate of 8,5%. [68, p.52] This rate is used to capitalizing
operating leases related to company cars.
Once the interest rates are determined, the next step is to estimate the present value of operating lease
obligations. This is done by creating schedules for the liabilities and their amortization. Welltec has
a mixture of ‘operating lease liabilities’ whose terms range anywhere from 3 month till 9 years.
However, these obligations are grouped according to their maturity and not the length of their terms.
Moreover, rental and leasing expenses for the year are not split according to how the leases are
grouped, but are reported as a single, combined yearly figure. Therefore, in order to overcome the
difficulties of creating the schedule model for the leases, part of the analysis has been performed
using Excel’s ‘Solver’ functionality.
In addition, before I could proceed with the creation of a schedule for the leases, some assumptions
about its inputs needed to be in place. Below there is a short summary of model input (for detailed
calculations, I refer the reader to Appendix 9):

16
Operating liabilities: Model input Comment/Assumptions
Long-term obligations
(company car lease
agreements for period > 5
years)
Long-term obligations were split into several
agreements based on the Annual reports
notes.
Annual payments and obligations related to
car lease agreements are estimated based on
‘Over 5 years’ obligations values and their
dynamic.
Assumptions:
Lease agreement of 2015-2023
replaced the previous one. It was
renewed as well a year later.
Annual payment for each agreement
was considered a constant amount
where possible.
Mid-term obligations (rental
obligations running for the
period 1-5 years)
Mid-term rental obligations were split into 2
groups based on duration: running for 2 years
and running for 3 years.
Assumptions:
Annual payment for each agreement
was considered to be variable.
Short-term obligations
(rental obligations running
for the period from 3 months
to 1 year)
Short-term obligations and related payments
were calculated as residual after subtracting
long- and mid-term obligations.
Short-term obligations are not
capitalized and, therefore, the
estimated values are not included in
adjustments.
Using this model, lease-payout-schedules for lease agreements that were valid from 2012 to 2015
were created. Based on lease-payout-schedules, values of lease obligations, at the time of their initial
recognition, were calculated as present values of the payments.
Next step was to calculate the interest expense for each lease agreement for each year. Interest
expense is determined by applying the estimated interest rates to the value of lease liability at the
beginning of period. [1, p.128]
The difference between lease payment for the year and interest expense for the same period equals to
the value of amortization of lease obligation. Capitalized operating lease liabilities for the following
periods are calculated as the values of lease obligation passed on from previous periods less present
year’s amortization. At the end of lease term, the lease obligation will be fully amortized and equal
to ZERO.
A further step is to calculate lease asset values and their depreciation. Welltec uses straight-line
depreciation for assets held under financial lease terms. Therefore, it is reasonable to assume that a
straight-line depreciation method is used for capitalized operating lease assets as well. The value of
lease asset at the time of initial recognition is equal to the value of lease obligation. Annual
depreciation expense is calculated by dividing the value of the capitalized lease asset by the lease
term and assuming a ZERO salvage value for each lease asset. [1, p.128] Lease asset values for the
following years equal to asset values of previous year less depreciation for the year. At the end of
lease term the lease obligation will be fully amortized and equal to ZERO.
Once the capitalized operating lease liabilities and assets have been determined, the impact of lease
reclassification on reported income should be calculated: “[If] leases are classified as operating leases,
[then] the entire payment [should be] recognized as an operating expense”. [8, p.423]
17
There are two types of expenses relating to financial leases – interest and depreciation. Adjusting the
income statement requires that ‘operating lease expenses’ that were capitalized to be added back and
that expenses connected with financial leases should be deducted.
It is important to emphasize that if amortization equals depreciation, then ‘earnings before tax’ (EBT)
is not affected. The adjustments described above only impact ‘earnings before interest, tax,
depreciation and amortization’ (EBITDA), ‘net operating profit after tax’ (NOPAT) and ‘net financial
expenses’ (NFE). However, if it is ‘straight-line depreciation' that is being used, then amortization
value is not be equal to depreciation value. This would affect EBT and would require some additional
adjustments. Firstly, the tax expense difference is calculated as a difference between amortization and
depreciation multiplied by that year’s corporate tax rate. If amortization proves to be higher than
depreciation, its consequence will be an increase in EBT, tax expense, and net earnings. The effect
this has on tax expense should be recognized as ‘deferred tax liability’ and the effect on ‘net earnings’
should be added to ‘retained earnings’. [9, p.4-46] On the reverse side, if amortization is lesser than
depreciation, it will create a ‘deferred tax asset’ and decrease ‘retained earnings’. It is worth noting,
that the effects of the yearly deferred tax asset/liability and retained earnings are accumulated over
the leases’ terms.
Finally, as Danish corporation tax rate has changed during the period in question, accumulated
deferred tax asset/liability should be adjusted with the accumulated difference between amortization
and depreciation multiplied by difference in tax rate. The value of deferred tax adjustment is added
back in income statement and deducted from deferred tax asset/liability and in the year of tax rate
change.
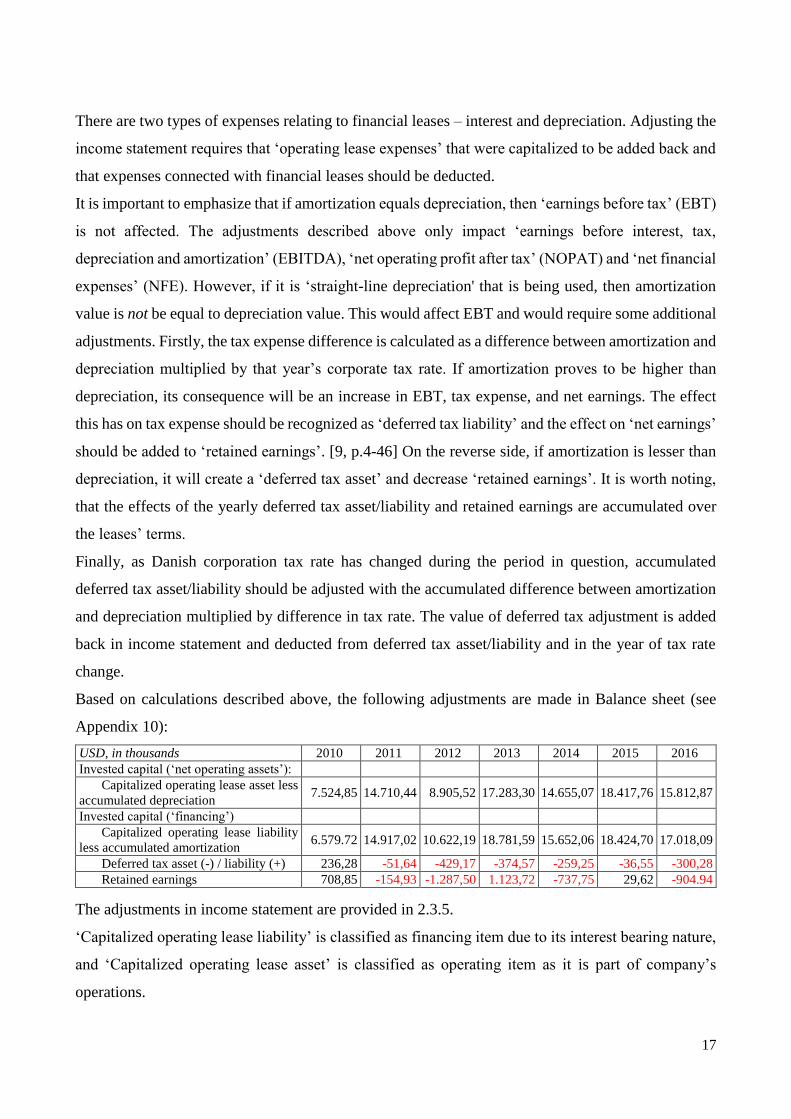
Based on calculations described above, the following adjustments are made in Balance sheet (see
Appendix 10):
USD, in thousands 2010 2011 2012 2013 2014 2015 2016
Invested capital (‘net operating assets’):
Capitalized operating lease asset less
accumulated depreciation 7.524,85 14.710,44 8.905,52 17.283,30 14.655,07 18.417,76 15.812,87
Invested capital (‘financing’)
Capitalized operating lease liability
less accumulated amortization 6.579.72 14.917,02 10.622,19 18.781,59 15.652,06 18.424,70 17.018,09
Deferred tax asset (-) / liability (+) 236,28 -51,64 -429,17 -374,57 -259,25 -36,55 -300,28
Retained earnings 708,85 -154,93 -1.287,50 1.123,72 -737,75 29,62 -904.94
The adjustments in income statement are provided in 2.3.5.
‘Capitalized operating lease liability’ is classified as financing item due to its interest bearing nature,
and ‘Capitalized operating lease asset’ is classified as operating item as it is part of company’s
operations.

18
2.2.4. Tax receivables
Welltec’s ‘tax receivables’ appear under the headings ‘financial assets’ and ‘receivables’ [68, p.22]
and are classified as financing and operating items respectively.
2.2.5. Deferred tax assets and liabilities
‘Deferred tax’ is caused by differences between accounting and tax regulations. This results in, a
temporary, deference between assets and liabilities’ book values and their tax-based values. Deferred
tax liability (asset) occurs when asset (liability) book value is higher (lower) than its tax-based value.
Differed tax asset arises in the reverse situations.
An inspection of Welltec’s ‘deferred tax’ shows that the majority of it relates to operating activities
(tangible and intangible assets, current assets) and, therefore, is classified as an operating item. As
for the portion of deferred tax related to ‘current and non-current liabilities’, I assume that it was the
result of financial activities, such as the disposal of bonds, and classify it as a financial item. No
information is provided as to whether ‘tax contingencies’, ‘tax loss carried forward’ and ‘change in
tax rate’ is related to operations or financing. However, as deferred tax is, mostly, linked to operations
[8, p.88] they are be classified as operating items. Moreover, the smallness of their values means that
regardless of how they are classified they have no significant bearing on the analysis’s outcome. For
detailed information on deferred tax assets and liabilities, I refer the reader to Appendix 11.
Welltec reports deferred tax assets and liabilities. Nevertheless, these two items are reconciled to
simplify the reformulation of the financial statements and only their net (which is primary deferred
tax liability) is posted in analytical balance sheet.
2.2.6. Other receivables
‘Other receivables’ appear under ‘financial assets’ and ‘receivables’. [68, p.22] ‘Other receivables’
under the heading financial assets are financial investments/loans with a fixed maturity [68, p.32] and
is classified as a financial item. As for ‘other receivables’ beneath the heading ‘receivables’, are,
owing to lack of information, regarded as part of operation and classified as an operating item.
2.2.7. Inventories
Inventories are considered to be part of Welltec operations and, therefore, classified as operating
items.
2.2.8. Trade receivables
Trade receivables are considered to be part of Welltec operations and, therefore, classified as
operational items.

19
2.2.9. Current portion of non-current assets
As ‘current portion of non-current assets’ is probably related to the non-current financial assets, it is
classified as financing items as well.
2.2.10. Prepayments
Welltec discloses details about prepayments which allows to classify each of the prepayments element
separately. For detailed information on prepayments, I refer the reader to Appendix 12.
The largest part of prepayments is the ‘prepaid creditors’. Assuming that it is not related to operations
it is considered as financing item. Welltec rents furniture and leases company cars [68, p.31],
manufacturing equipment, and its new building. All these items can all be considered as prerequisites
for normal business operations. Therefore, prepaid lease and rent are classified as operating items.
Owing to their nature, Welltec’s business operations can be risky and are therefore insured. Hence,
‘prepaid insurance’ is classified as an operating item. No information is provided the other types of
prepayments. I assume that they are also required operating expenses and classify them as operating
items.
2.2.11. Securities
Welltec’s securities include mortgage bonds, corporate bonds, and shares [68, p.32]; they are all listed
securities. Taking into account that securities are a financial asset that requires a return, securities are
classified as financing item.
2.2.12. Cash and cash equivalents
As the label indicates, ‘cash and cash equivalents’ includes cash [68, p.33]. I would have liked to
separate the ‘cash needed for operations’ from ‘excess cash’. Welltec’s annual report provides no
further information about this item. Therefore, I consider all of ‘cash and cash equivalents’ to be
excess cash. Thus, ‘cash and cash equivalents’ is regarded as a financing item.
2.2.13. Equity
Equity is comprised of share capital, currency translation reserve, retained earnings, and non-
controlling interest. [68, p.23] Equity is a source of financing that requires a return. Thus, it is
classified as a financing item. [8, p.75] For detailed information on equity, I refer the reader to
Appendix 13.
2.2.14. Finance lease commitments
‘Finance lease commitments’ relate to lease agreements for the manufacturing equipment and the
new building. [68, p.53] At initial recognition (start of the lease) they are measured at the lower of
20
the leased asset’s fair value and the present value of future lease payments. Afterwards, lease
commitments are measured at amortized cost. The difference between the present value and the
nominal amount of the lease payments is recognized in income statement as a financial expense. [68,
p.32] To facilitate the matching of items from the analytical income statement with related items in
the analytical balance sheet operating activities and financing activities should be classified the same
way in both statements. [8, p.73] So, ‘finance lease commitments’ are classified as a financing item.
2.2.15. Issued bonds
Based on the company’s notes, “In February 2012, Welltec A/S issued bonds of a value of USD 325
million. The bonds have a fixed interest of 8% and an effective rate of 8,5%. The bonds are repayable
in full in February 2019”. [68, p.52] For detailed information on issued bonds, I refer the reader to
Appendix 14.
As ‘issued bonds’ are a source of financing that requires a return, they are, accordingly, classified as
a financing item.
2.2.16. Bank debt
According to Welltec’s notes:
In April 2015, Welltec A/S obtained a bank loan through the European Investment Bank of
EUR 25 million (USD 28 million). The bank loan has a variable interest of 2.2% + 6 months
EURIBOR. The bank loan is repayable in December 2018. The carrying amount of the bank
debt is approximately equal to the fair value as of December 31, 2015. [68, p.52]
Since ‘Bank debt’ is a source of financing that requires a return, it is classified as a financing item.
2.2.17. Other non-current liabilities
The item ‘other non-current liabilities’ appears in the statements of 2012 and 2013. [70, p.33] In the
statements of 2014 and 2015, there is no such item. [68, p.23] Welltec does not provide details
regarding its ‘other non-current liabilities’. However, they are not listed under ‘current and non-
current financial liabilities’. [70, p.60] Thus, Welltec, most probably, regards ‘other non-current
liabilities’ to be part of company operations. Consequently, I have chosen to classify it as an operating
item.
2.2.18. Current portion of non-current liabilities
‘Current portion of non-current liabilities’ represents the item ‘finance lease commitments’ which
was classified as financing item. For this reason, ‘current portion of non-current liabilities’ is given
the same classification as the item it represents, financing item.

21
2.2.19. Other provisions
‘Other provisions’ appear in 2012 and 2013 [70, p.33] but are absent in 2014 and 2015 [68, p.23].
‘Other provisions’ are described in Welltec’s notes as follows: “Other provisions are recognized when
the group has a legal or constructive obligation as a result of past events in the financial year or prior
years, and it is probable that settlement of such obligation is lead to an outflow of the company’s
financial resources”. [70, p.43] Welltec’s notes do not provide further details about ‘Other provisions’.
However, Welltec does not record its ‘other provisions’ under ‘current and non-current financial
liabilities’. Judging from this indirect/subtle hint I can infer that the reason for this may be that Welltec
regards ‘other provisions’ as part of its operations. Hence, ‘other provisions’ are classified as an
operating item.
2.2.20. Payables to affiliates
The item ‘payables to affiliates’ makes an appearance in 2012 and 2013 [70, p.33] but is absent from
the scene in 2014 and 2015 [68, p.23]. Welltec’s notes inform that ‘affiliates’ are principle
shareholders. [70, p.69] Since affiliates/principle shareholders are not directly involved in operations
(but are rather beneficiaries awaiting their financial rewards for investing in the company), ‘payables
to affiliates’ are regarded as a financing item.
2.2.21. Trade payables
‘Trade payables’ are considered to be part of Welltec operations and, therefore, classified as
operational items.
2.2.22. Current tax liabilities
Welltec’s reports do not say much about the item ‘current tax liabilities’. Also, ‘current tax liabilities’
are not listed under the banner ‘current and non-current financial liabilities’ [70, p.60]. Guided by
what this information hints at, ‘other non-current liabilities’ are regarded as part of company
operations. Ergo, I classify ‘other non-current liabilities’ as an operating item.
2.2.23. Other payables
Welltec provides details on ‘other payables’ allowing for the separate classification of each element
(see Appendix 15).
I believe that there can be little doubt that items such as wages; salaries; personal income taxes; social
security costs; and holiday pay are integral part of any company’s operations. Hence, they are all
classified as operating items.

22
On the other hand, ‘derivative financial instruments’ and ‘accrued interests’ are, as is apparent from
their titles, part of financing activities and are, accordingly, classified as financing items.
Next in the list of ‘other payables’ is the item ‘earn out related to HPI’. This was the second and final
‘earn out payment’, made in 2013, as the result of Welltec acquiring ‘HPI Technology AS’ in 2009.
Because the acquisitioned ‘HPI Technology AS’ was incorporated into Welltec’s business operations,
the ‘earn out payment’ has been classified as an operating item.
2.3. Analytical income statement
In the following section, items in Welltec’s income statement are divided into two groups: ‘operations’
or ‘finance’. The purpose of this split is providing a clearer understanding of where value is created
within Welltec [8, p.70]. For the analytical income statement, see Appendix 16.
2.3.1. Revenue
Using the guidelines of ‘IFRS 8 Operating Segment’, the group assessed that the activities of Welltec
International ApS could be, appropriately, disclosed in a single segment. [68, p.35]
Regarding the question of when Welltec recognizes revenue, this happens when the agreed service is
provided/performed. In cases where development projects have been subcontracted to a third part (i.e.
the actual work or some of it has been handed over to a subcontractor), the income is recognized
when services have been delivered to the client or when value, in some form or other, is perceived to
have been added to the client’s processes/products/services. [68, p.29] As for revenue from the selling
of physical products, “[it] is recognized in the income statement if delivery and transfer of risk to the
buyer have taken place before year end, and if the income can be reliably measured and is expected
to be received”. [68, p.29] For detailed information on revenue, I refer the reader to Appendix 17.
And, just to dispel any doubts, revenue is regarded as a, purely, operating item.
2.3.2. Cost of services provided
“Cost of services provided comprises direct and indirect expenses incurred to realize revenue” [68,
p.30]. Depreciation, amortization, and impairment losses are part the expenses incurred to realize
revenue. As will be described in 2.3.6., depreciation and amortization are deducted from the ‘cost of
services’ figure. Obviously, the adjusted ‘cost of services provided’ figure is tied to Welltec’s core
operating activities. So, it is classified as an operating expense.
2.3.3. Development and manufacturing cost
A company may capitalize its development costs and expenses. However, the capitalization of
development costs requires that ‘technical/financial benefits’ from using the (completed) intangible

23
asset or its market value (selling price) can be verified. In other words, a company must provide proof
of its intention and ability to complete the intangible asset “and demonstrate how the asset will
generate future economic benefits”. [8, p.391] Welltec capitalizes most of its development costs.
However, a small portion of its engineering and development costs are not capitalized but expensed
and given the title ‘developments and manufacturing costs’ [68, p.30]. These costs are indispensible
to Welltec’s core operating activities and should, therefore, be pigeonholed as an operating expense.
A point worth noting is that, in the past, Welltec, customarily, expensed no more than 1% of its yearly
engineering and development costs. However, in 2015, the portion of expensed engineering and
development costs was more than 10%.
2.3.4. Administrative and sales cost
As Welltec’s notes inform, “administrative and sales costs comprise costs required to sustain the
business including finance, IT, legal, HR and other overhead costs”. [68, p.30] That being said,
Welltec’s ‘administrative and sales costs’ contain depreciation, amortization and impairment losses
which is excluded as described in 2.3.6.
The adjusted ‘administrative and sales costs’ are costs closely knit to Welltec’s operating activities.
Hence, they are categorized as ‘operating expenses’.
2.3.5. Operating lease
As mentioned earlier (in 2.2.3.), Welltec enter into a number of operating lease agreements. In order
to improve the quality of the analysis, operating lease agreements lasting longer than 1 year have
been capitalized (see 2.2.3. and Appendix 10).
To accomplish abovementioned analytical adjustments, following modifications were made to
Welltec’s income statement:
Operating lease expense related to mid- and long-term agreements was added back;
Depreciation expense was deducted;
Interest expense was deducted;
Tax expense was adjusted for differences between amortization and depreciation;
Tax expense was adjusted for change in Danish corporation tax in relation to deferred tax
assets/liabilities;
The adjustments described above will impact ‘Net earnings’:

24
USD, in thousands 2010 2011 2012 2013 2014 2015 2016
Operating expenses 2.332,27 2.504,84 4.664,00 5.817,00 6.452,00 4.850,00 2.945,07
Depreciation, amortization
and impairment losses -1.713,50 -3.466,99 -5.805,59 -5.354,25 -4.768,34 -2.648,19 -2.604,90
Interest expense -163,39 -189,56 -368,50 -244,37 -1.182,37 -1.211,75 -1.538,46
Operating tax (adjustment
related to difference
between amortization and
depreciation)
-113,85 287,93 377,52 -54,60 -122,82 -232,66 263,62
Operating tax (adjustment
related to tax rate change) 0,00 0,00 0,00 0,00 7,49 9,97 0,10
Impact on Net earnings 341,54 -863,79 -1.132,57 163,79 385,97 767,36 -934,56
Note:
Danish corporation tax 25% 25% 25% 25% 24,5% 23,5% 22%
2.3.6. Depreciation, amortization and impairment losses (including amortization of acquired
intangibles in a business combination)
In Welltec’s consolidated income statement depreciation, amortization and impairment losses appear
under the item that they are associated with. However, the full amount of the year’s depreciation,
amortization and impairment losses and how it is allocated is disclosed in the company’s notes.
Once I reclassify depreciation, amortization and impairment losses in the analytical income statement,
it will be possible to calculate EBITDA. The EBITDA figure is useful in cash flow statement
calculations and in evaluating the firm’s earning abilities.
So, according to the adjustments I described above, cost of services provided, development and
manufacturing cost, and administrative and sales costs are appear net of their related depreciation,
amortization and impairment losses.
Because depreciation, amortization and impairment losses are the result of the company’s acquisition
and usage of intangible and tangible assets, and because these assets are recognized as operating items,
it, logically, that depreciation, amortization and impairment losses should be given the same
classification.
2.3.7. Special items
Welltec reports ‘special items’, by themselves, “to facilitate the comparability of the profit or loss
and provide a better picture of the operational results”. [68, p.30] As described in their report, “special
items consist of costs of a special nature in relation to the activities of the group, including costs of
structural changes and other significant amounts of a one-off nature”. [68, p.30]
In 2013, Welltec’s ‘special items’ consisted of ‘non-recurring consultancy fees’ and ‘costs related to
resigned employees and special bonus’.

25
Welltec’s report does not say what the consultancy work was for. However, in early February of 2013,
news circulated that Welltec was considering going ahead with an IPO and consultants were hired for
that purpose [59]. It would not be a stab in the total darkness, to deduce that the ‘non-recurring
consultancy fees’ were connected with the IPO launch. Moreover, there can hardly be anything more
non-recurring than an IPO.
Because an IPO is not something connected with a company’s operations but rather a way of financing
them, the consultancy fees spent in connection with Welltec’s IPO are classified as a financial
expense. Additionally, since it highly unlikely that such consultancy expenses will be recurring in the
foreseeable future, they are excluded from our analytical forecasting.
Unlike an IPO, ‘costs related to resigned employees and special bonuses’ are not a one of a kind event,
they appear in 2013 and, once again, in 2015 along with ‘costs related to termination of rental
agreements etc’. Costs such as these can best be described as tactical costs linked to the changes that
companies carry out in order for it to adapt (i.e. restructure) their businesses “to [fit] changed market
[i.e. business] conditions” [68, p.41] and are “accounting item[s] that frequently appears in the income
statement”. [8, p.353]
Based on the above written, it would not be inappropriate to classify both ‘costs related to resigned
employees and special bonuses’ and costs related to termination of rental agreements etc’ as
(recurring) operating items.
2.3.8. Financial income and expenses
In its notes, Welltec lists its ‘financial income and expenses’ as being comprised of “interest income
and expenses, the interest portion of finance lease payments, realized and unrealized capital gains and
losses on payables and transactions in foreign currencies, amortization premium/allowance on debt,
etc. as well as interest on tax” [68, p.30] (see Appendix 18).
Welltec treats ‘exchange differences’ resulting from discrepancies between the rate-of-exchange at
the time when the transactions took place and the rate-of-exchange when it is time to for them to be
paid or posted to the end-of-period financial reports as financial income or financial expenses in its
income statement. [68, p.28]
That being said, it is important to point out that there exists more than one opinion on how ‘exchange
rate differences’ should be handled. There are those who believe that these differences should be split
into their operating and financing components as ‘exchange rate differences’ are not, exclusively, tied
to either type of activity. Then again, there are those who, like Welltec, view ‘exchange rate
differences’ as being a, purely, financial item. They argue that losses or gains from variations in

26
exchange rates are the result of financial acumen and prudence (or lack of both) rather than
operational excellence. Depending on its financial policies, a company can choose whether or not to
hedge a currency risks using financial instruments. On the other hand, if a company elects not to
hedge its currency risks, then it leaves its earnings wholly exposed to exchange-rate winds, which
can end in profit or loss depending on which direction these winds blow. [8, p.77]
Taking into consideration the above argument, exchange rate gains and losses is classified as financial
item.
As for ‘other items’, they, as well, are linked to financial activities and are interest bearing and, as a
result, are classified as financial items.
2.3.9. Income taxes
Welltec’s corporation tax appears as a single item in its income statement. Yet, corporate tax is the
result of both operating and financing activities. Therefore, Welltec’s corporation tax mixture must
be disentangled and divided into two figures: ‘taxes from operating income’ and ‘tax shield on net
financial expenses’. The result of this division hinges on the chosen assumptions with respect to tax
rate. I can choose to use a ‘marginal tax rate’ or an ‘effective tax rate’:
Welltec tax rates 2011 2012 2013 2014 2015
Effective tax rate (current tax) 35,0% 36,9% 36,0% 36,3% n/a
Danish corporation tax 25,0% 25,0% 25,0% 24,5% 23,5%
As shown in Appendix 19, financial items include income and expenses other than just interest
expenses (or income). Welltec does not disclose whether such financial items are taxable, and if so at
which rate. This informational gap can be overcome by using the effective tax rate:
taxbeforeEarnings
taxnCorporatiorateTax
%100 [8, p.73]
Welltec’s income tax returns are filed in several jurisdictions. The year’s taxes consist of: ‘current
tax for the year’, ‘adjustments in corporation tax previous years, ‘changes in deferred tax’ and ‘other
taxes’ (see Appendix 19).
Welltec’s ‘effective tax rate’ is determined by a number of variables including tax laws and
regulations and how they are interpreted in the different jurisdictions where Welltec operates.
Moreover, there is also the issue of how compliance-failures that are discovered during tax audits are
resolved. [68, p.18] Therefore, effective tax rate can be calculated by dividing ‘current tax’ by
‘earnings before tax’. Yet, it is not possible to calculate an effective tax rate for 2015 because
Welltec’s ‘earnings before tax’ that year was negative while its ‘current tax’ was positive.
27
It is more suitable to use an effective tax rate when company’s borrowings come from countries with
different taxation rates. Welltec’s notes say nothing about where (i.e. which countries) its borrowed
funds originate from. However, it is highly probable that its issued bonds and the loan it acquired
through the European Investment Bank are covered by Danish tax regulations. Also, Welltec’s ‘lease
commitments’ relate to assets that were leased in Denmark. Therefore, using the Danish corporation
tax rate to estimate tax shield would seem to be a good and sober choice.
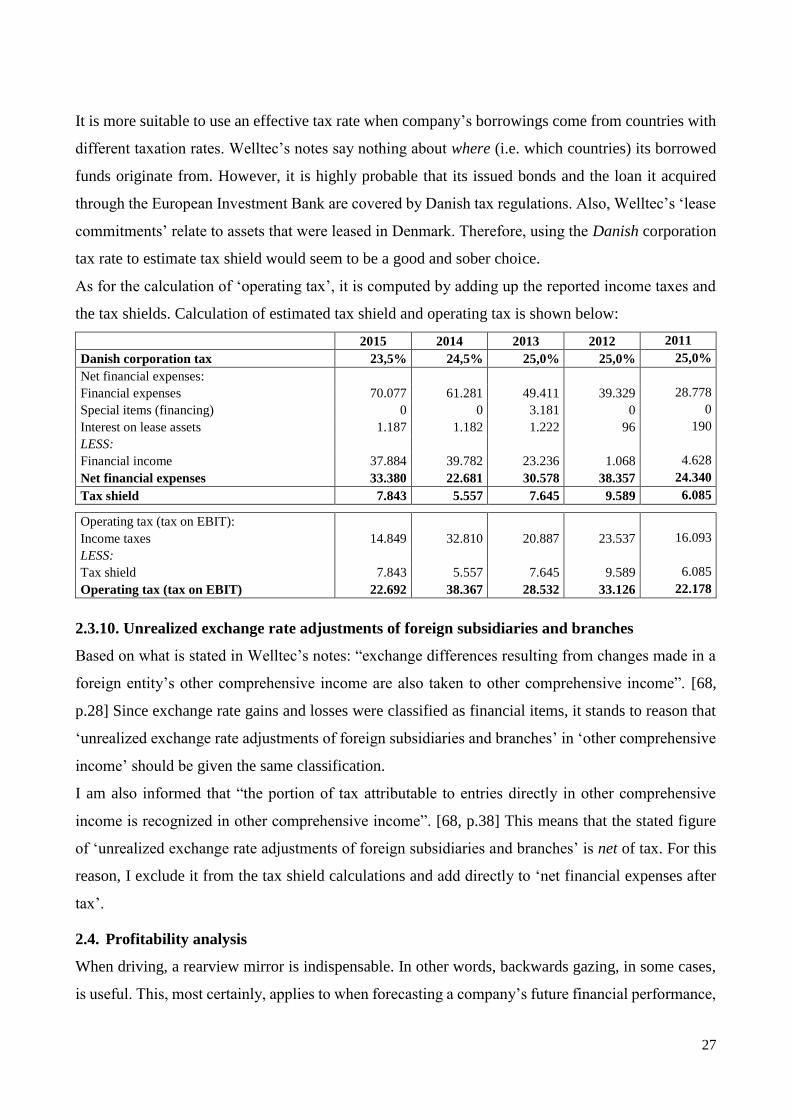
As for the calculation of ‘operating tax’, it is computed by adding up the reported income taxes and
the tax shields. Calculation of estimated tax shield and operating tax is shown below:
2015 2014 2013 2012 2011
Danish corporation tax 23,5% 24,5% 25,0% 25,0% 25,0%
Net financial expenses:
Financial expenses 70.077 61.281 49.411 39.329 28.778
Special items (financing) 0 0 3.181 0 0
Interest on lease assets 1.187 1.182 1.222 96 190
LESS:
Financial income 37.884 39.782 23.236 1.068 4.628
Net financial expenses 33.380 22.681 30.578 38.357 24.340
Tax shield 7.843 5.557 7.645 9.589 6.085
Operating tax (tax on EBIT):
Income taxes 14.849 32.810 20.887 23.537 16.093
LESS:
Tax shield 7.843 5.557 7.645 9.589 6.085
Operating tax (tax on EBIT) 22.692 38.367 28.532 33.126 22.178
2.3.10. Unrealized exchange rate adjustments of foreign subsidiaries and branches
Based on what is stated in Welltec’s notes: “exchange differences resulting from changes made in a
foreign entity’s other comprehensive income are also taken to other comprehensive income”. [68,
p.28] Since exchange rate gains and losses were classified as financial items, it stands to reason that
‘unrealized exchange rate adjustments of foreign subsidiaries and branches’ in ‘other comprehensive
income’ should be given the same classification.
I am also informed that “the portion of tax attributable to entries directly in other comprehensive
income is recognized in other comprehensive income”. [68, p.38] This means that the stated figure
of ‘unrealized exchange rate adjustments of foreign subsidiaries and branches’ is net of tax. For this
reason, I exclude it from the tax shield calculations and add directly to ‘net financial expenses after
tax’.
2.4. Profitability analysis
When driving, a rearview mirror is indispensable. In other words, backwards gazing, in some cases,
is useful. This, most certainly, applies to when forecasting a company’s future financial performance,

28
where “a critical component of valuation is the robust analysis of historical performance.” [21, p.163,
italics mine]. In short, we form our expectations of future profitability based on past profitability:
“The historical profitability is an important element in defining the future expectations for a
company”. [8, p.93]
For profitability evaluation purposes “return on invested capital (ROIC) is the overall profitability
measure for operations”. [8, p.94] ROIC figures significantly influence the evaluation “since a higher
rate of return will lead, ceteris paribus, to a higher estimated value”. [8, p.94]
Welltec had to pay additional taxes for activities that took place prior to period being analyzed.
Specifically, the additional taxes resulted from the non-recognition of credit relief of withheld foreign
taxes from before 2012. This has significantly affected ‘net operating profit after tax’ (NOPAT), and,
subsequently, ROIC after tax. Therefore, to mitigate the noise caused by the additional taxes, I include
ROIC before tax in the analysis.
In addition, ROIC is calculated with and without goodwill and acquired intangibles. ROIC with
goodwill and acquired intangibles gauges the firm’s “aggregate value creation” [21, p.165 ] abilities.
On the other hand, ROIC without goodwill and acquired intangibles measures of the firm’s in-house
ability to create value, and, by extension, the efficacy of its underlying processes. Therefore, it is
better suited for analyzing trends. [21, p.165]
In Welltec’s annual report for 2015, we read that “separable intangible assets acquired through
business combinations are brand, customer relationship and technology”. [68, p.31] Goodwill and
acquired intangibles make up more than half of ‘invested capital’. As a result, ROIC without goodwill
and acquired intangibles is much higher. The development of returns over time is presented below:
a) ROIC with goodwill and acquired intangibles b) ROIC without goodwill and acquired Intangibles
Overall, Chart X shows a declining profitability. There was a barely noticeable rise in 2012’s ROIC
but, ever since then, ROIC has been falling. In general, 2015 was a pretty bad year for the oil and gas
industry. However, Welltec’s downward performance slide started two years earlier, in 2013, which
indicates that Welltec’s declining ROIC is not the result of a generalized industry depression.
In order to evaluate ROIC, I need to assess if its level is satisfactory. This can be done by using the
ROIC of peer companies as performance benchmarks. However, because the services and products
of the OFS industry are so diverse, a comparison of this kind would be inappropriate. Therefore, I
11,2%16,1%
12,8% 13,1%
2,9%
6,7%9,7% 7,7% 6,6%
-1,0%-10%
0%
10%
20%
2011 2012 2013 2014 2015
ROIC before tax ROIC after tax
45,3% 51,9%
33,1% 29,9%
6,7%27,2% 31,4%
20,0% 15,1%
-2,4%-20%
0%
20%
40%
60%
2011 2012 2013 2014 2015
ROIC before tax ROIC after tax

29
use an alternative method that involves comparing ROIC with the weighted average cost of capital
(WACC). [8, p.96] Welltec provides WACC both before and after tax in its Annual reports.
a) ROIC before tax b) ROIC after tax
From 2012 to 2014 ROIC before tax exceeds WACC. The unsatisfactory ROIC level in 2015 was,
largely, the result of a general fatigue in the industry and the prevalence of low oil prices. However,
the inadequate ROIC level in 2011 was, wholly/almost wholly, the result of Welltec’s poor
performance, as 2011 was a quite a good year for the industry. In additions, the figures show that
ROIC after tax is constantly lower than WACC, which is unsatisfactory. ROIC’s level was
dissatisfying in 2013 and 2014 when the company was saddled with additional tax charges from
previous years. However, 2011 and 2012 ROIC levels were also unsatisfying despite not being
burdened with any additional taxation. Comparing the levels of ROIC with and without goodwill and
acquired intangibles suggests that the ROIC underperformance is not caused by malfunctioning
business processes, but rather by decisions to purchase other businesses at premiums accrued from
their past performances. Furthermore, the level of ROIC vs. WACC before and after tax in 2012-2014
suggests that Welltec’s operations are taxed at substantially higher rate than its financial activities.
WACC is the expected return on invested capital. If ROIC exceeds WACC a company creates excess
return or Economic Value Added (EVA); i.e. value for its shareholders. [8, p.97]
As Welltec’s ROIC is constantly lower than WACC, the company is ‘destroying value’:
USD in thousands 2011 2012 2013 2014 2015
EVA -22.116 -7.174 -15.928 -15.195 -64.426
Return on invested capital measures a firm’s return on capital invested in operation. ROIC, however,
is not able to explain whether profitability is driven by better revenue and expense relation or an
improved capital utilization. To be able to answer this question, it is necessary to decompose the ratio
into (a) the profit margin [both before and after tax] and (b) the turnover rate of invested capital [a.k.a.
assets turnover rate] [8, p.107]:
a) EBIT-margin and NOPAT-margin b) Assets turnover rate
11,2%
16,1%
12,8% 13,1%
2,9%
12,0%
12,0% 11,1%9,7%
11,4%
0%
10%
20%
2011 2012 2013 2014 2015
ROIC before tax WACC before tax
6,7%9,7% 7,7% 6,6%
-1,0%
11,1% 11,1% 10,6% 9,2% 10,3%
-10%
0%
10%
20%
2011 2012 2013 2014 2015
ROIC after tax WACC after tax
24,5% 28,8%22,2% 22,4%
6,7%
14,6% 17,4%13,4% 11,3%
-2,4%-20%
0%
20%
40%
2011 2012 2013 2014 2015
EBIT-margin NOPAT-margin
0,46
0,560,58 0,59
0,43
0,40
0,45
0,50
0,55
0,60
0,65
2011 2012 2013 2014 2015
Assets turnover
30
When comparing profit margin and assets turnover trends it is clear that the decline in ROIC is,
mainly, caused by shrinking profit margins that and is only slightly offset by a positive trend in the
assets turnover rate (with the exception of 2015 which was a bad year for the whole oil and gas
industry).
Although Welltec improved its capital utilization during the years 2012 to 2014, it can still only be
regarded as poor considering the level of the ‘revenue/expense relation’ for the same period. In its
best year (2014), Welltec’s asset turnover rate reached 0,59, meaning that Welltec’s invested capital
would be held captive for more than 1,5 years (610 days).
As pointed out earlier, the majority of Welltec’s assets come in the shape of goodwill and acquired
intangibles, which may explain Welltec’s poor capital utilization.
The analysis of profit margin and assets turnover rate informs us that the proportionality in
revenue/expense relation has been steadily worsening while the efficiency of capital utilization has
been improving (with the exception of 2015). Nevertheless, these ratios cannot be used to form a
conclusive opinion, as they do not offer an adequate explanation as to why revenue/expense relation
and the capital utilization efficiency have evolved as they have. Therefore, the ratios need to be broken
down further by applying indexing (trend analysis) and common-size analysis (see Appendix 21, 22).
2.5. Sub conclusion
When the market prices for oil nosedived, Welltec’s revenues plummeted and their profit margins
shrunk significantly, signifying that ‘the price of oil’ was a one of Welltec’s key value drivers and
further highlighting the importance of monitoring macro factors to understand where the industry in
general and Welltec in particular are heading.
Having said this, low oil prices seem not to be Welltec’s only problem. Even in the years when oil
prices were high, Welltec’s profitability levels were still disappointing. Moreover, the efficiency of
Welltec’s processes (measured by ROIC without goodwill and acquired intangibles) has, since 2012
(the effects of the falling oil first hit home in 2015), been falling, which may explain why falling oil
prices hit Welltec so hard; Welltec was already out of shape.
Decomposing ROIC revealed that the main problem was Welltec’s revenue/expense relation.
Indexing and common size analysis further revealed that, in 2012 and 2013, ‘cost of services provided’
were mushrooming at speed and revenue growth was struggling to catch up. Again, this was at least
a couple of years before the oil market depression. Thus, Welltec’s dwindling revenues cannot, at that
time, be solely explained by oil companies pushing OFS firms for lower rates.

31
The surge in ‘cost of services provided’, in 2012, was probably the result of Welltec first-time entry
to the ‘completion solutions segment’. In most cases, getting to grips with new markets is costly at
the start. If Welltec can learn the ropes of this new segment, and if their clients appreciate this
extension of their service repertoire, then this addition could help improve Welltec’s profitability
when oil prices again pick up.
Apart from this, to better control its costs, Welltec will need to pay close attention to ‘administrative
and sales cost’, the second largest operating expense component after ‘cost of services provided’.
In addition, the profitability analysis revealed low capital utilization efficiency. Although Welltec’s
asset turnover rate showed signs of reviving, during the good years of 2012 to 2014, it was still very
low.
A common size analysis of Welltec’s balance sheet shows where potential remedies for the problem
may be found. For instance, 19% of Welltec’s invested capital goes to receivables, which is nearly
the same as the whole of the company’s tangible assets. Within the receivables category, trade
receivables are the largest, amounting to almost 16% of invested capital. A situation where Welltec
borrows with interest and lends to its clients free of charge cannot be regarded as efficient capital
utilization. A decrease in both the value and share of trade receivables over the observed period
indicates that Welltec is aware of the need to improve its receivables collection. However, in 2015,
trade receivables share of invested capital was 13%, which suggests that there is still further room for
improvements.
CHAPTER 3. Strategic analysis
Chapter 3 will be dedicated to strategic analysis. Specifically, I will seek to identify factors
influencing Welltec’s cash flow potential and risk with the purpose of forecasting their future
behavior.
In chapter 1, I gave a concise overview of the industry that Welltec is part of, with the purpose of
acquainting the reader with the nature of Welltec’s business environment. [8, p.187]. The overview
reveals the complexity of the industry’s dynamics and that a good understanding of their workings
cannot be obtained through reliance of historical information alone: “In [Welltec’s] case it is
important to obtain a fundamental understanding about the underlying drivers of the market and the
next generation of products and services”. [8, p.187].
Using a top-down approach, I kick-start the analysis with the PESTEL framework to identify macro
factors influencing the company’s cash flow potential and risks. Also, I will attempt to prognosticate
the future developments of these macro factors.
32
Next, I use the Six Forces model to discuss industry specific factors that can affect Welltec’s cash
flow potential and risks.
Finally, I use the VRIO model to probe into factors within the company itself (i.e. internal analysis)
that influence its cash flow potential and risks.
Summary results and findings from the financial analysis in chapter 2 and the strategic analysis will
be presented in a SWOT matrix.
3.1. PESTEL Analysis
This paper uses the PESTEL model to categorize and pencil out the external factors that have a
bearing on the O&G industry in general and more specifically on the OFS industry and the company
Welltec. The objective of the PESTEL framework is to highlight the macro factors affecting Welltec’s
key value drivers. The purpose is to understand how these factors affect Welltec’s financial health
and its ability to stay in business. The findings from this analysis will be used to forecast the key
value drivers in chapter 4.
The PESTEL model, traditionally, classifies the external factors into six groups: political, economic,
social, technological, environmental and legal. [23, p.34] Guided by this classification, I have
reworded the macro factors salient to the industry being analyzed as follows:
Political (in)stability in oil producing countries;
Actions of Governments and international bodies affecting oil supply;
Economic (in)stability (or the cyclical booms and busts of the economy);
Technological capabilities;
Global warming and emissions controls;
High HSE (health, safety, environment) risks linked to O&G industry;
Regulatory systems governing the petroleum industry.
3.1.1. Political (in)stability in oil producing countries
Political instability is spurred by different societal groups vying for their interest and failing to reach
a compromise. It creates uncertain business environment that can threaten oil production and supply.
Political instability manifests itself in a variety of forms and guises that vary in their severity such as
demonstrations, protests, strikes, and civil wars. Such conflicts can lead to financial losses, damages
to physical properties, and ecological disasters. An unstable political environment makes
international O&G development cooperation more difficult to carry out. [40, p.303] It may lead to
O&G development projects being put on hold or, at the very least, to fall behind schedule.
33
News of political unrest in oil producing nations are quick to reach the oil markets and affect the
prices causing them to take an upward hike. However, oil prices, usually, drop back to more ‘normal
levels’ once potential political threats to supply subside. Thus, there seems to be a strong link between
the political statuses of the oil producing nations and the prices of oil.
There exists historical data that supports the above statement. Appendix 23, there are several
examples of how closely tied political instability and oil prices are. One of these examples is described
in more detail in the following paragraph.
At the beginning of first Gulf War (2 August 1990 – 28 February 1991) oil prices rose by 50% within
a few weeks: from $18 to $27/b (or from $34 to $50/b in current prices). Analysts believed that
Saddam would shower the Gulf area with rockets causing substantial disruptions to production and
flinging Western economies into a severe economic crisis. Prices continued to grow and had almost
doubled by October 1990 compared to pre-conflict level. However, when the military actions
commenced, it soon became clear that Saddam’s rockets were incapable of causing the predicted wide
scale disruption to oil supply. Saudi Arabia’s oil wells (the biggest oil producer) were beyond
Saddam’s reach. Moreover, the Saudis had enough excess production capacity to secure Western
supplies and to fill the supply gap caused by Kuwaiti oil wells being temporary out of business. As a
result, oil prices reverted to pre-war levels by March 1991.
Decreases in oil production also lead to a reduction in the O&G development activities that are, more
often than not, collaborated efforts of host countries and international oil conglomerates. Moreover,
if hostilities increase and armed conflict breaks out oil facilities become obvious targets. The
destruction these facilities effects both the ruling regime and the oil companies. Because they are also
responsible for the safety and welfare of its personal, they may need to operationalize emergency
plans for closing down the locations and evacuating the staff.
3.1.2. Actions of Governments and international bodies affecting oil supply
Energy prices are determined on free market basis. That being said, there is a small circle of countries
who have a huge say in what oil prices should be.
3.1.2.1. OPEC
A group of oil-exporting nations from the developed world has banded together the in the
intergovernmental Organization of Petroleum Exporting Countries (OPEC). OPEC seeks to
coordinate and unify the petroleum policies of its member countries. Its purpose being to insure “the
stabilization of oil markets in order to secure an efficient, economic and regular supply of petroleum

34
to consumers, a steady income to producers and a fair return on capital for those investing in the
petroleum industry”. [48]
OPEC was founded in Baghdad in September 1960 by four Middle Eastern governments and
Venezuela “as a defensive, and at first mainly ineffective, response to falling prices”. [11, p.20]
However, the group was not able to exercise any real leverage where oil prices were concerned till it
reached the so-called ‘Tripoli and Tehran’ agreements with foreign companies for increases in prices
and other improvements. The negotiations disintegrated in October 1973 with the start of Arab–Israeli
war (the Yom Kippur War) when OPEC’s Arab members made a total ban on oil exports to counties
supporting the Israeli side. Needless to say, prices skyrocketed and the world experienced the energy
crisis also known as ‘the first oil shock’. That war was an event that marked the OPEC’s growing
influence. From that point on, the exporters alone set the prices. [11, p.20]
Even so, OPEC control of oil prices is not absolute as it sometimes loses its grip on oil prices due to
internal disagreements between its members. For instance, in 1987 – although they did not regain the
price levels of the 1970 – OPEC once more managed to boost prices by curbing production.
Conversely, in the end of the 1990s OPEC members could not agree on quotas. Consequently, in
1998, the valves of oil pipelines were opened full throttle and the market was flooded with crude oil.
This oil deluge coincided with the economic slump in Asia in the second half of that decade. The
upshot was that prices plummeted to 12 USD/barrel (18 USD in current prices). Nevertheless, in 1999,
OPEC managed to rein in the excess production and coupled with a recovering and growing economy
oil prices were once more moving upwards.
According to Chatham house, the role of OPEC is changing. OPEC will continue to have an influence
on oil prices in the short and medium term through its ability to regulate a significant share of the
world’s oil production. However, while other factors affecting oil supply will be coming into play
and gaining more substantial share of the world trade, OPEC’s influence will be weaker. [11, p.22]
3.1.2.2. Influences of non-OPEC governments
The ability to influence oil prices is not limited to OPEC’s members. Non-OPEC nations can also
influence prices by opening up for or restricting cooperation with oil producing countries as the case
of Iran clearly demonstrates.
The first wave of economic sanctions against Iran was imposed by the United States in 1979 in the
wake of the Iranian hostage crisis. By 1981, however, most of these sanctions had been lifted. [22] In
1987, the United States, again, imposed sanctions against Iran "as a result of Iran's support for
international terrorism and its aggressive actions against non-belligerent shipping in the Persian Gulf".

35
[16] In between the years 2006 and 2010, the UN meted out four rounds of sanctions in response to
Iran’s nuclear program. [65] In June 2010 EU joined international sanctions against Iran and extended
them in 2012. The sanctions included an oil embargo and ban on "involvement with petroleum
development in Iran". [16]
At the time of these events, Iran was one of the World’s biggest exporters of oil. [6] As a result, every
time it was subjected to new sanctions or bans were introduced oil supplies would be negatively
affected and prices would rise (see Appendix 23).
In July 2015 the five permanent members of the UN Security Council, Germany and the European
Union reached the agreement with Iran on nuclear program and a plan for suspending and lifting the
sanctions was set in motion (the Joint Comprehensive Plan of Action or JCPOA); UN sanctions were
lifted on 16 January 2016. [53] These positive developments (at least as far as the Iranians were
concerned) knocked oil prices down a notch or two.
As for the U.S. sanctions against Iran, they have been extended for another 10 years. Extending these
sanctions was deemed necessary to insure that Iran would not renege on its nuclear agreements. The
understanding is that so long as Iran did not violate its nuclear agreements the extended sanctions
would remain suspended and Iran energy sector would be unaffected. [15] However, with the election
of Donald Trump one can only speculate whether harsher measures are not lying in wait for the
Iranians as both President Elect Trump and “several fellow Republicans remain vehemently opposed
to the nuclear deal and have called for its termination”. [62]
3.1.3. Economic (in)stability (or the cyclical booms and busts of the economy)
There is a closely-knit relationship between demand on oil and the health of the world’s economy.
It must come, as little surprise that a world economy in a state of ‘vigorous growth’ needs oil and lots
of it as virtually all economic sectors depend, to a greater or lesser degree, on oil-produced energy.
This global hunger for oil is unlikely to abate in near future, especially, with the “increase in number
of households and expansion of commercial sectors in developed and developing countries”. [39, p.2]
Conversely, when faced with a global economic slump demand for oil will take a dive. The adverse
effects of such a worldwide reduction in demand for fossil fuels are felt most keenly by the economies
of O&G producing nations leading them suspend investments in O&G development technology and
infrastructure. [40, p.303]
Examples of economic downturns being linked to falling oil prices are numerous as Appeendix 23
demonstrates. The recession of the early 1980s (1980 – 1985) together with the shift towards
alternative energy sources resulted in a production surplus that ended with oil prices being chopped

36
down by more than a third. [11, p.21] More recently, during the Asian financial crisis (1997 – 1998),
oil prices fell to half their normal level hitting a low of $11,35/b (or $16,68/b in current prices) at the
end of 1998. Finally, in the wake of the 2008 global financial crisis oil prices dropped by 1/4th.
Afterwards, oil prices continued to careen downwards until they reached a low of $39,09/b (or
$44,37/b in current prices) in February 2009.
In the decade that we live in, we witness a marked strengthening of ties between oil prices and the
economic fortunes of the Asia-Pacific region, in particular, the Chinese economy: “In 2011 the Asia-
Pacific region consumed 32% of world oil production. Almost half of world oil imports went to this
region.” [11, p.19]
The significance of China’s role in hauling the world out of its most recent economic recession is
hard to deny. That being said, it does seem as though the Chinese dragon is losing some of its
economic firepower:
“[Chinese] export driven growth of above 10 percent per year has already been a thing of the
past since 2007. But due to massive fiscal and monetary stimulus, the Chinese government
initially managed to keep growth high. In 2011 the government started to implement measures
to slow down the economy and change the structure of growth towards a more sustainable and
socially inclusive direction. As a result, domestic demand began to slow.” [58]
In response to the abovementioned governmental measures, China started to lift its foot off its
economic speeder. As a result, from 2012 to 2014, China’s economic growth slowed down to between
7% and 8%. [30] This downward trend has continued in 2015 and 2016 dragging with it the rest of
the world’s economy. [56]
This, relatively, sluggish Chinese economy has profoundly affected oil prices. Since the second half
of 2014, oil prices have been constantly decreasing and by February 2016 stood at just a bit over
$30/b, which is less than 1/3rd of what the price was after the economic crisis in 2008.
Worryingly, for the producers of oil, it does not look as though the Chinese economy will be reverting
to its former levels of economic growth any time soon. Moreover, China’s economy is shifting away
from being ‘the world’s factory’ towards being a more diversified, service-oriented economy, which,
obviously, is not good news for oil producer.
3.1.4. Technological capabilities
For many years, fears of running out of oil have dominated discussions about safeguarding future
energy supplies. Yet, it seems as though these fears have been unwarranted or, at least, overstated:

37
“Reserves increase as a result of new discoveries, and ‘grow’ as a result of better understanding
of known reservoirs, as well as the application of new or improved technology to increase the
proportion of the oil in the reservoir that can be economically produced ….” [11, p.29]
Appendix 24 shows a variety of oil projects that have become economically viable and technically
feasible thanks to technological advancements.
The more pressing challenge that we are facing today is not what to do when our oil wells run dry.
Rather, it is the development of technologies better suited for the more demanding oil excavating
projects: “As the traditional onshore and shallow water offshore fields are rapidly depleting, gradually
only projects that are more technically complex, and thus more costly, remain.” [38, p.7]
A combination of technological advancements and a decade of consistently high prices have resulted
in supplies from shale and non-conventional resources becoming financially feasible. [11, p.1] These
developments lead OPEC’s secretariat, in its 2011 World Oil Outlook, to make the following
announcement: “At real prices around $110/b, practically the entire non-conventional resource base
is already economic in terms of long-term supply”. [11, p.22]
OPEC’s point of view was reaffirmed the following year in a study of the industry conducted by
Citigroup. In this study, the break-even-point for all projects was under $100 (see Appendix 25).
What's more, it revealed that nearly 30Mboe/d of production will come from projects, which have a
break-even-point that is less than $70.
That being said, it must be pointed out that oil and gas extraction technologies do not appear overnight
but take years to develop and a sizable amount financial funds. For instance, it took the US oil
companies more than 60 years to fully develop the ‘hydraulic fracturing’ technique used in
development of unconventional plays; during these many years, the companies developing this
technique received scientific assistance as well as financial aid from the federal government. [11,
p.33]
3.1.4.1. Project development and oil prices
Recently, markets have been awash with oil and gas because of shale oil and gas from the United
States. Having depleted its own traditional conventional oil resources the US was, until April 2015,
the world’s largest importer of oil. However, thanks to new technologies rendering the utilization of
unconventional oil resources profitable, the US is now the world’s largest producer of oil. Following
this antipodal reversal in the US’s ‘oil fortunes’, the US is now able to cater to most of the needs of
its domestic market and, in January 2016, was able to send off its first shipment to Europe.
38
Not surprisingly, the US’s new role as an energy provider has caused some disruption to the oil
markets. Since the end of 2014, the US offloading of its excess shale oil has caused oil prices to fall
below the $50 mark where they have, for most of the time, remained. [26, p.364-365] However, it
cannot be long before market mechanisms step in and rid us of the current ‘oil glut’.
Consistently high oil prices were what made the exploitation of unconventional and costly resources
possible in the first place. If oil prices levels do not improve, there will come a point where producers
will be unable to cover the costs associated with the exploitation of these technically demanding,
expensive oil resources. Consequently, drilling will slow down and production will fall. This same
logic also applies to conventional oil resources. [11, p.21-22]
What’s more, should oil prices fail to pick up, oil producers will be reluctant to embark on any new
projects or kill current ones, which will further reduce supply:
The IEA recognizes that present investments are key to securing future energy supplies.
Investments in exploration and production are already perilous – producers face a host of risks
including geologic, market, economic, political and legal risks. However, such investments
become even more high-risk in a low-price environment. With fewer suppliers, demand is likely
to overtake supply which restarts the cyclical boom or bust afresh. [26, p.365]
3.1.4.2. Changes in the US OFS market
There are two features related to the exploitation of oil and gas from new resources that are very
likely to affect the future financial fortunes of Welltec. The first of these is that the profitable
utilization of such resources requires ‘continuous drilling’:
Many of these new [unconventional oil and gas] supplies are from [shale plays,] oil sands, tight
oil and similar sources where individual wells have low production rates which decline rapidly
if drilling is not sustained. The production technique depends on intensive drilling, which can
be accelerated or slowed down according to market conditions and expectations. [11, p.32]
Continuous drilling is required due to the low yield of unconventional wells and their relatively quick
depletion-rate compared to conventional wells. [5, p.9]
Another feature relates to the geological attributes of unconventional oil and gas wells that demand a
horizontal drilling to be used in the extraction of these resources: “The percentage of rigs drilling
horizontal wells has increased from 20% in 2007 to nearly 70% in 2014”. [10, p.3].
Moreover, one should bear in mind that horizontal drilling and hydraulic fracturing are not the only
type of oilfield services required for development and production from shale plays. Ergo, this increase
in horizontal drilling will create demand for a host of other oilfield well services related to horizontal

39
wells. This is, of course, good news for oilfield service companies like Welltec who provide services
specially tailored for horizontal wells.
3.1.5. Global warming and emissions controls
For decades now, the issue of ‘global warming’ has been perennially present in the heated and
unceasing debates about the health of the earth’s ecosystem.
Within the scientific community, there exists a, more or less, unanimous consensus that greenhouse
gases (GHG) are the main culprit responsible for the defilement of the earth’s environment. [35] In
its 2014 report on climate change, the Intergovernmental Panel on Climate Change (IPCC) informs
that more than three quarters of GHG come from burning fossils fuels for energy. (see Appendix 26 )
Amongst the biggest of these eco-sinners are oil and gas: “Oil and gas supply 57% of the commercial
energy the world consumes, and their combustion accounted for roughly the same proportion of
global CO2 emissions.” [11, p.1]
For some time now, the majority of the world’s nations have come to realize that GHG emissions
need to be reduced and that if fossil fuels cannot be banned entirely then, at least, there usage should
be curbed and not be allowed to grow exponentially.
The international community realized that weaning the world off its oil-bottle would require globally
binding legislations. A milestone step towards a less fossil-dependent world was the signing of the
Kyoto Protocol back in 1997 which was extended in December 2011. A major flaw with the extended
Kyoto agreement was that the majority of developing nations as well as some important developed
nations (e.g. the United States) refused to hop on Kyoto’s ecofriendly bandwagon. However, the
deficiencies in Kyoto’s agreement are scheduled to be fixed in the not so distant future as a new
legally binding treaty, that is supposed to encompass most of the runaways from the 1997 Kyoto
Protocol is due in 2020 [11, p.99].
Thankfully, it seems that the majority of the world’s nations are not shirkers where matters of the
environment are concerned. On the contrary, recent signs point to an increased worldwide
commitment towards a greener planet. This increased environmental awareness was evident during
the Conference of Parties (COP21) in Paris where almost 200 countries: “... agreed to a goal of
limiting global temperature increases to less than two degrees Celsius above preindustrial levels and
to reach net-zero greenhouse gas emissions in the second half of the century. This deal appears to
represent a collective commitment by nations large and small to move away from fossil fuel
production and consumption.” [33, p.9]

40
Having said this, we should not lull ourselves into a false belief that the battle for a greener earth has
been won as no one, so far, has found out how “the gap between the interests of producers and
consumers seems too wide to be bridged”. [26, p.367-368] Moreover, primacy of the environmental
agenda needs constant maintenance, as instances where “climate change policies have [again] slipped
down the agenda because so many appear to involve short term increases in costs to consumers or
taxpayers, or both [11, p.83]” are far from being a fictitious scenario.
3.1.6. High HSE (health, safety, environment) risks linked to O&G industry
In April 2010, the offshore drilling unit Deepwater Horizon exploded and sank devastating the
surrounding environment. This offshore oilrig was drilling for BP in the Gulf of Mexico south east
of the Louisianan cost. The explosion claimed the lives of eleven of the oilrig’s workers and injured
another sixteen.
As a consequence of this incident, BP is facing a torrent of law suits and compensation claims from
individuals and businesses, such as fishermen and tourism establishments, whose livelihoods have
been dealt a severe – and in some instances fatal – blow. BP expects that the total pre-tax cost of this
environmental blunder will be around $61,6 billion (or $44 billion after tax). [36]
Where this particular incident is concerned, it was, chiefly, the operator BP who was financially
thrashed for the damages caused by the massive oil spillage. The accident exposed the vulnerability
of operators. However, there have been “no clearly discernible move[s] (as of yet at least) to
[collectively] share [future] responsibilities [of this kind] between operator and service provider.” [44,
p.7]
Needless to say, the oil and gas industry received a lot of negative PR following the accident. As a
consequence, US plans for expanding offshore drilling in the area were either downsized or put on
ice for a while. [12] In Europe – especially in the UK – there were discussions on whether a similar
‘time-out’ on deep-sea oil drilling was needed. Globally, the accident resulted in the laws, regulations,
and safety standards of the oil and gas industry receiving a thorough going over. [12]
3.1.6.1. Environmental risk from developing unconventionals
Generally speaking, the benefits of fossil fuels come with a high social and environmental price tag
[40, p.304]. This is even more so where unconventional oil and gas resources are concerned. In the
first place, extracting these resources exposes workers at the sites to greater risks of injury. The second
consideration has to do with the method of extraction, hydraulic fracturing. Hydraulic fracturing
requires the injection of huge quantities of water under the earth’s crust. Additionally, the backflow
fluids resulting from this process are an unsavory mixture of toxic chemicals. And as if this were not

41
enough, the very same mixture may contain radioactive matter as shale rock, sometimes, holds natural
deposits of uranium [37, p.641]. Doubtless, a leakage or spillage of such wastewaters would spell
catastrophe for any water supplies close by.
Like offshore drilling, hydraulic fracturing is a fairly, newish, risk fraught way of extracting oil and
gas whose regulatory frameworks need further developing if we are to avoid future environmental
calamities like Deepwater Horizon. Therefore, the industry must, properly, review the processes
connected with the exploitation of unconventionals and make them safer. Should it fail to do so, then
it may find itself forced to scale back (or even permanently shut down) its operations if unfortunate
environmental accident take place.
3.1.7. Regulatory systems governing the petroleum industry
Because of the strategic importance of the oil and gas industry, their regulatory systems have, for the
most part, been devised and developed by the governments of oil producing nations. However, this
does not mean that private enterprise has been denied access to the industry only that their access (i.e.
control of oil and gas resources) has been limited to ‘economic rights’ that are granted to them
“through a wide variety of possible arrangements either directly with government or with the state-
controlled oil company” [11, p.36].
Broadly speaking, there are two main types of regulatory arrangements in the petroleum industry: the
licensing and concession system (LCS) and the contractual-based system. [25, p.37] [31, p.395-396]
LCSs are the default regulatory arrangements in the developed parts of the world where rights and
obligations enjoy the protection of well-established, fully-mature legal structures and institutions,
whereas the contractual-based systems are nearly only used by developing/emerging countries [25,
p.37]. The focus here will be on LCS systems as Europe and North America are where Welltec’s
major markets are located. For a more expansive overview of petroleum regulatory systems I refer
the reader to appendix 27.
In LCS systems, companies are granted the right to explore and/or produce petroleum in a specified
area for a limited amount of time based on the results of a suitable tendering process [25, p.40-41].
In these contracts, the state’s economic interests come in the shape of taxes, royalties, and license
fees [11, p.36].
There are two principal systems of awarding licenses within the LCS: the North American system,
with its emphasis on the bid system; and the ‘North Sea’ system that focuses on discretionary
allocation. [25, p.58] The bid or auction may include either cash bidding, where the license is sold to
the highest bidder in the form of a cash bonus or special royalty rate, or work program bidding (WPB),
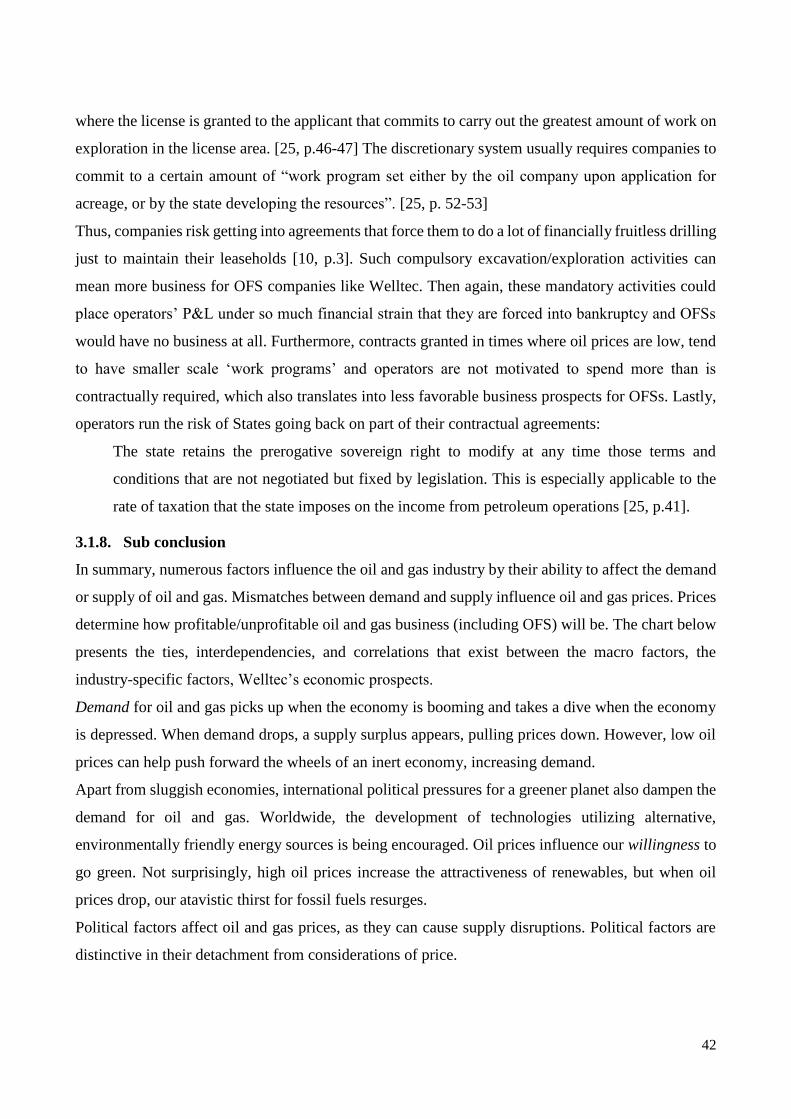
42
where the license is granted to the applicant that commits to carry out the greatest amount of work on
exploration in the license area. [25, p.46-47] The discretionary system usually requires companies to
commit to a certain amount of “work program set either by the oil company upon application for
acreage, or by the state developing the resources”. [25, p. 52-53]
Thus, companies risk getting into agreements that force them to do a lot of financially fruitless drilling
just to maintain their leaseholds [10, p.3]. Such compulsory excavation/exploration activities can
mean more business for OFS companies like Welltec. Then again, these mandatory activities could
place operators’ P&L under so much financial strain that they are forced into bankruptcy and OFSs
would have no business at all. Furthermore, contracts granted in times where oil prices are low, tend
to have smaller scale ‘work programs’ and operators are not motivated to spend more than is
contractually required, which also translates into less favorable business prospects for OFSs. Lastly,
operators run the risk of States going back on part of their contractual agreements:
The state retains the prerogative sovereign right to modify at any time those terms and
conditions that are not negotiated but fixed by legislation. This is especially applicable to the
rate of taxation that the state imposes on the income from petroleum operations [25, p.41].
3.1.8. Sub conclusion
In summary, numerous factors influence the oil and gas industry by their ability to affect the demand
or supply of oil and gas. Mismatches between demand and supply influence oil and gas prices. Prices
determine how profitable/unprofitable oil and gas business (including OFS) will be. The chart below
presents the ties, interdependencies, and correlations that exist between the macro factors, the
industry-specific factors, Welltec’s economic prospects.
Demand for oil and gas picks up when the economy is booming and takes a dive when the economy
is depressed. When demand drops, a supply surplus appears, pulling prices down. However, low oil
prices can help push forward the wheels of an inert economy, increasing demand.
Apart from sluggish economies, international political pressures for a greener planet also dampen the
demand for oil and gas. Worldwide, the development of technologies utilizing alternative,
environmentally friendly energy sources is being encouraged. Oil prices influence our willingness to
go green. Not surprisingly, high oil prices increase the attractiveness of renewables, but when oil
prices drop, our atavistic thirst for fossil fuels resurges.
Political factors affect oil and gas prices, as they can cause supply disruptions. Political factors are
distinctive in their detachment from considerations of price.

43
Own creation.
* Economic (in)stability (or the
cyclical booms and busts of the
economy)
* Global warming and
emissions controls
O&G demand
O&G supply
* Political (in)stability in oil
producing countries
* Actions of Governments
and international bodies
affecting oil supply
* Technological capabilities
* High HSE risks linked to
O&G industry
* Petroleum regulatory system
Oil prices
O&G industry
Type of project
Rig count
OFS industry
Type of
service/product
Number of
services/products
Welltec

44
Technology development flourishes when oil prices are high, and put on standby when prices are low.
Low prices erode operators’ profit margins, forcing them to put the squeeze on OFS companies,
demanding that they lower their rates. In turn, OFS companies’ profitability suffers and their R&D
expenditure is reduced. Owing to this lack of funding, technological development is delayed, and the
complex, costly projects are either postponed or permanently shelved. The dismantlement of these
projects can cause a shortage in future oil supplies. The setup times for these projects is long (very
long) and they cannot be instantaneously re-started should demand pick up. On the hand, the supply
gap will push the prices up and technology development will again flourish.
As mentioned earlier, cheap oil translates as low or no profit for oil and gas companies.
Understandably, companies resort to cost saving exercises. Unfortunately, sometimes, these cost
saving efforts extend to the HSE budgets. Taking funds from HSE, whose governing regulations, to
begin with, are not always strictly enforced, can further increase the chances of an environmental
disaster taking place. If environmental misfortune should strike, then, as the history of the industry
tells us, the response is likely to be more restrictive regulations or even a complete ban on certain
types O&G activities, which will result in O&G supplies being reduced.
Regulatory systems play a significant role in shaping the petroleum industry. State regulations of the
industry are a reflection of the government’s political convictions. For instance, if high importance is
accorded to preservation of the environment, then the government may opt not allocate acreage to
projects that are perceived to be, potentially, too hazardous to the environment.
These factors shape the oil and gas industry and determine the type(s) of projects may be developed,
which determines the services and products supplied by the OFS sector. As mentioned earlier, the
growing utilization of unconventionals has increased the need for well services suited for horizontal
wells, which is a service area where Welltec’s technologies solution are especially efficient.
Conventional oil and gas resources are not inexhaustible and will, at some point, dry out. Therefore,
provided that economic conditions are favourable, oil and gas companies will redirect their attention
towards harvesting fossil fuels from less convivial environments, such as ultra-deep-water and pre-
salt projects. Traditional technologies are, on the whole, unsuited for working in such hostile
environmental conditions. Welltec provides technological solutions that compensate for inadequacies
of conventional technologies. As the need to utilize the inhospitable oil and gas resources grows, so
will the demand for Welltec’s products/services. However, the future prosperity of Welltec is not a
sure thing, as demand for its products/services depends on the prices for oil and gas being at level
that can safeguard satisfactory profit margins for the rest of the industry’s sectors.

45
3.2. Industry Scenario
As touched upon earlier, the landscape of the global energy market is changing. These changes are
driven by several variables including, among other thing, the emergence of green, sustainable energy
sources as economically viable options, the increasing energy-efficiency of industrial machineries,
home appliances, and means of transportation, and politicians who are determined to wean us off our
fossil fuel addiction. Therefore, the future of the oil and gas industry can best be described as being
uncertain:
“How geopolitical uncertainty, sustainable development goals, the climate change challenge
and other drivers will interact and affect the global energy picture and economic development
over the next decades is impossible to gauge with any degree of certainty”. [57, p.3]
The following is a discussion of key developments within these variables may possibly affect the
future of the oil and gas industry, more specifically, its OFS subsector and the target of our analysis,
Welltec.
3.2.1. Actions of Governments and international bodies affecting oil supply
The whole world, including the oil and gas industry, is still trying to work out how they should
respond/react/adjust to Donald J. Trump’s election. Mr. Trump’s irascible character and his lack of a
political track record has left industry analysts at a loss as to what his next move might be: “Analysts
cited economic uncertainty and the President-elect’s plans to cut the ‘red-tape’ of the upstream US
oil and gas sector.”[52]
3.2.2. Economic (in)stability (or the cyclical booms and busts of the economy)
For the time being, the world’s economy (GDP) is growing (see Appendix 28). The same goes for its
population, although it does so at a much slower pace and is predicted to peak in 2050 after which it
will start declining.
World GDP and population growth is critical for the industry. According to BP, world economy
growth “is largely driven by increases in productivity (i.e. GDP per person) which would lead to
increasing global prosperity”. [66, p.11]
3.2.3. Technological capabilities
The ability of the oil and gas industry to constantly improve its technologies is vital for its survival.
Nevertheless, the industry has, traditionally, been slow to adopt new technologies. [11, p.33]
So far, it is the OFS companies who have functioned as the industry’s technological trailblazers [44,
p.1]. However, the ability of OFS companies to continue churning out technological improvements
46
is being undermined by depressed oil prices that, in turn, pressure E&P companies to lower their costs.
If this trend continues, OFS companies R&D budgets’ will suffer and employees will be laid off. This
poses a serious challenge for OFS companies, as human R&D capabilities/talents cannot be
recuperated overnight should the demand for oil and gas recover [44, p.10]. Hence, the future success
of an OFS company will depend on its ability to preserve its R&D capabilities during this time of
funding shortage: “But some companies will stand out by investing through the downturn in their
workforce and by maintaining a focus on technology — either in-house or by acquiring weaker
companies with strong technology potential” [44, p.10]
3.2.4. Global warming and emissions controls
While the R&D departments of OFS are being starved of funds, I find, conversely, that investments
in the development of alternative energy sources has been booming, spurred on by government
subsidies and oil prices that were, until fairly recently, high. This redirection of governments’
attention (and monies) toward renewables’ research has, according to IEA, resulted in the cost of
wind generated energy being reduced by more than a quarter and energy from solar PVs (photovoltaic
systems) plummeting, in 2015, to a fifth of what it used to cost in 2008 (see Appendix 29).
Thus, renewables are on a fast track towards becoming the electricity source of choice for the
environmentally as well as the cost conscious consumer:
“Lazard – a financial advisory and asset management firm – suggests a cost range of 32-77
USD/MWh for wind power, and a range of 50-70 USD/MWh for utility scale solar PV power.
In comparison, the ranges for gas combined cycle power and coal power are put at 52-78
USD/MWh and 65-150 USD/MWh respectively. [57, p.47]
Nevertheless, electric vehicles still have some way to go before they can compete on an equal footing
with their petrol and diesel driven cousins:
“Despite consumer preferences changing and technology improving, EV [Electric Vehicles]
market shares are still highly dependent on subsidies and incentives from local governments ...
EV penetration is expected to be reliant on subsidies until at least the mid-2020s, when costs
are assumed to break even with ICE [Internal Combustion Engines] vehicles.” [57, p.29]
During the years of the Obama administration, political efforts seeking to push through policies aimed
at containing adverse climatic changes have been growing in force. They culminated in the signing
and ratification of the Paris agreement in 2015.
Now that Mr. Trump is at the helm the US is likely to change course towards policies that are less
friendly to the environment: “Trump may now seek to withdraw the US from the Paris Agreement,
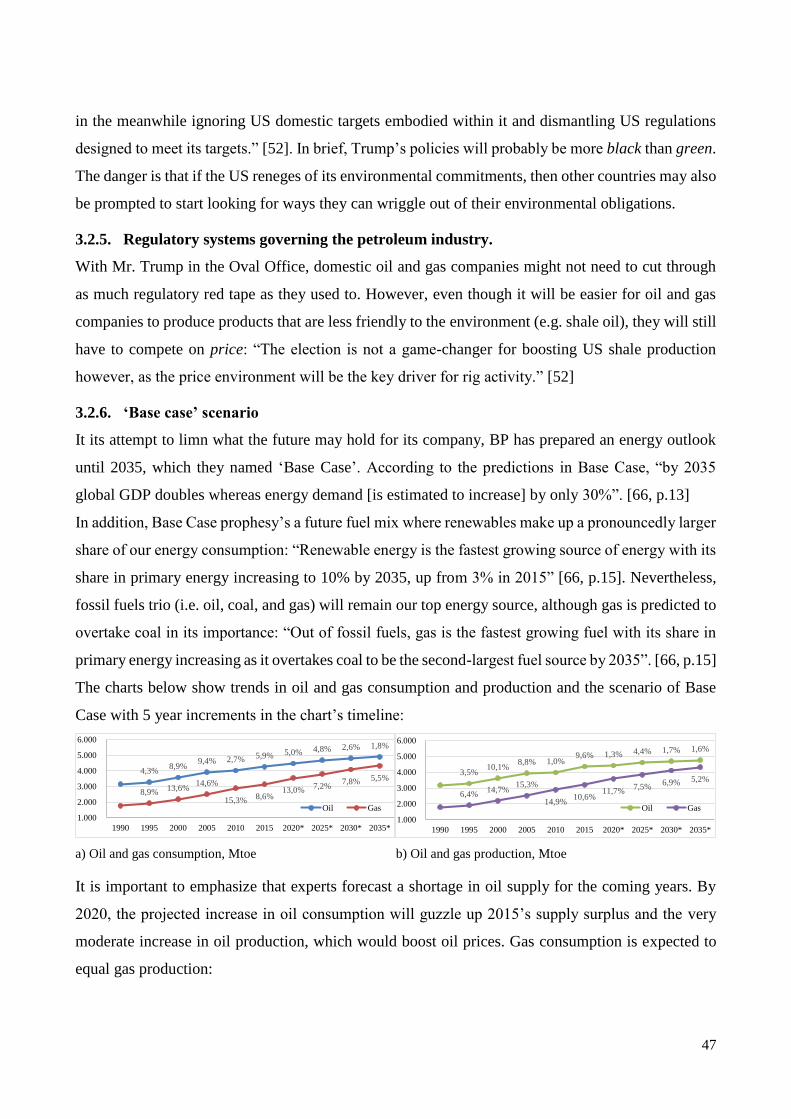
47
in the meanwhile ignoring US domestic targets embodied within it and dismantling US regulations
designed to meet its targets.” [52]. In brief, Trump’s policies will probably be more black than green.
The danger is that if the US reneges of its environmental commitments, then other countries may also
be prompted to start looking for ways they can wriggle out of their environmental obligations.
3.2.5. Regulatory systems governing the petroleum industry.
With Mr. Trump in the Oval Office, domestic oil and gas companies might not need to cut through
as much regulatory red tape as they used to. However, even though it will be easier for oil and gas
companies to produce products that are less friendly to the environment (e.g. shale oil), they will still
have to compete on price: “The election is not a game-changer for boosting US shale production
however, as the price environment will be the key driver for rig activity.” [52]
3.2.6. ‘Base case’ scenario
It its attempt to limn what the future may hold for its company, BP has prepared an energy outlook
until 2035, which they named ‘Base Case’. According to the predictions in Base Case, “by 2035
global GDP doubles whereas energy demand [is estimated to increase] by only 30%”. [66, p.13]
In addition, Base Case prophesy’s a future fuel mix where renewables make up a pronouncedly larger
share of our energy consumption: “Renewable energy is the fastest growing source of energy with its
share in primary energy increasing to 10% by 2035, up from 3% in 2015” [66, p.15]. Nevertheless,
fossil fuels trio (i.e. oil, coal, and gas) will remain our top energy source, although gas is predicted to
overtake coal in its importance: “Out of fossil fuels, gas is the fastest growing fuel with its share in
primary energy increasing as it overtakes coal to be the second-largest fuel source by 2035”. [66, p.15]
The charts below show trends in oil and gas consumption and production and the scenario of Base
Case with 5 year increments in the chart’s timeline:
a) Oil and gas consumption, Mtoe b) Oil and gas production, Mtoe
It is important to emphasize that experts forecast a shortage in oil supply for the coming years. By
2020, the projected increase in oil consumption will guzzle up 2015’s supply surplus and the very
moderate increase in oil production, which would boost oil prices. Gas consumption is expected to
equal gas production:
4,3%8,9%
9,4% 2,7% 5,9% 5,0% 4,8% 2,6% 1,8%
8,9%13,6%
14,6%
15,3% 8,6%13,0%
7,2%7,8% 5,5%
1.000
2.000
3.000
4.000
5.000
6.000
1990 1995 2000 2005 2010 2015 2020* 2025* 2030* 2035*
Oil Gas
3,5%10,1%
8,8% 1,0%9,6% 1,3% 4,4% 1,7% 1,6%
6,4%14,7%
15,3%
14,9%10,6%
11,7%7,5%
6,9% 5,2%
1.000
2.000
3.000
4.000
5.000
6.000
1990 1995 2000 2005 2010 2015 2020* 2025* 2030* 2035*
Oil Gas

48
a) Oil consumption vs. production, Mtoe b) Gas consumption vs. production, Mtoe
Oil production will be unable to satisfy future demand due to the current low price environment that
forces companies to put their plans for new excavation projects on temporary hold or indefinite
postponement: “Already, some $200 billion worth of projects have been canceled or postponed.” [33,
p.4]. In addition, existing sources are gradually drying up: “And even if demand growth is moderate,
decline from existing sources of oil and gas virtually guarantees a future gap between demand and
supply if investments do not pick up.” [57, p.7]
In contrast, gas is expected to be able to meet the increases in future because gas projects are quicker
to develop. Hence, future projections show no gap between gas production and gas consumption.
Among experts, there appears to a general opinion that oil prices, in the future, will be climbing up
the charts. For instance, in KPMG’s monthly report on oil and gas trends, oil are expected to reach
the $70 per barrel mark as early as 2018 (see Appendix 30).
Further support for this view comes the IEA who, in its World Energy Outlook 2016, informs that, in
the event that the world fail to live up to its COP21 commitments, oil prices are expected to exceed
$120 per barrel by the end of 2040. The same outlook also applies to natural gas prices that are
expected to increase enormously (see Appendix 31).
It is important to mention that BP energy outlook is not the only; quite a few future projections exist.
However, there is not much dissimilarity between their conclusions. Appendix 32 provides the
comparison of primary scenarios of other energy outlooks.
In summation, I ask what will the energy industry look like in twenty or thirty years time? It is difficult
to give any precise answer. However, if the above projections hold water and oil prices continue to
rise, then moving away from fossil fuels towards renewables will become increasingly more attractive,
both economically and environmentally. Consequently, in the future, a greater party of our energy
needs will come from renewable sources. Thus, we no longer need to fear (at least not to the same
extent as previously) that we run out of oil. It is more likely that we will run away from consuming it:
“The Stone Age did not end for lack of stone, and the Oil Age will end long before the world
runs out of oil.” So said Sheikh Ahmed Zaki Yamani, former Saudi Arabian oil minister, in an
interview in 2000. [33, p.4]
3.000
3.500
4.000
4.500
5.000
1990 1995 2000 2005 2010 2015 2020* 2025* 2030* 2035*
Oil consumption Oil production
1.000
2.000
3.000
4.000
5.000
1990 1995 2000 2005 2010 2015 2020* 2025* 2030* 2035*
Gas consumption Gas production

49
3.3. Industry analysis
The ability to generate earnings greater than (or, at the very least, equal to) the cost of capital must
be the most decisive factor in gauging an industry’s attractiveness. That being said, the formula that
determines an industry’s attractiveness has more than one component [8, p.189].
A widely used model for gauging a prospective industry’s value-generating potential is Porter’s 5-
forces model that claims that:
“... the intensity of competition determines the potential for creating abnormal profits by the
[companies] in an industry. Whether or not the potential profits are kept by the industry is
determined by the relative bargaining power of the [companies] in the industry and [that of]
their customers and suppliers.” [9, p.2-3 – 2-4; italics mine]
Yet, despite the widespread acceptance of Porter’s model, analysts have argued for the inclusion of a
sixth force, namely, “complementors” (not competitors) of organizations: “An organization is your
complementor if it enhances your business attractiveness to customers or suppliers” [23, p.49].
According to Porter’s model, the contours of an industry are shaped by the rivalry of competition.
The 6-Forces model, on the other hand, is less adversarial, for it assumes “that industries are shaped
by a balance between competition and cooperation. [13, p. 74; italics mine]. Owing to the
supplementary nature of Welltec’s business, I have opted to use the 6-Forces model for my analysis
of the industry’s attractiveness.
Because Welltec’s operations extend, geographically speaking, to all the corners of our planet, I will
adopt a global perspective when examining the industry. In other words, my analysis will have a very
high level of aggregation.
Another point worth noting is that OFS companies (such as Welltec) offer numerous
products/services at various levels of upstream integration. As a result, the industry cannot (easily)
be split into clearly demarcated segments. Still, my focus will be on ‘well services’ interspersed with
comments on the industry, as a whole, when required.
3.3.1. Rivalry among existing companies
The oilfield service industry is a large, competitive industry. [10, p.1] OFS companies provide a wide
range of products and services to E&P companies. In terms of size, OFS companies range anywhere
“from Fortune 500 companies to small local retailers” [10, p.1]. However, the four largest OFS
companies enjoy quasi-hegemonic market positions. To speak in general terms, industries that have
a small number of dominant players tend to be less rivalrous as the smaller ones shy away head-on
confrontations.
50
The OFS (as well as oil and gas) industry is one that is prone to cycles of boom and bust. Nevertheless,
despite the turbulent disposition of OFS markets, “global energy demands are predicted to increase
by 37 per cent over the next 25 years” [26, p.362] and “over the period 2011–2035, oil is predicted
by the IEA to remain the principal fuel in demand among primary energy sources (IEA, 2011)” [31,
p.395]. As a result, we can expect steady growth in Oil and gas industry and consequently in OFS
industry in the next 20 to 25 years. If these future projections hold water, it will have a mitigating
effect on the intensity of the competitive rivalry in the OFS industry:
“In situations of strong growth, an organization can grow with the market, but in situations of
low growth or decline, any growth is likely to be at the expense of a rival, and meet with fierce
resistance. Low-growth markets are therefore often associated with price competition and low
profitability.” [23, p.42, 44]
In general, the comparatively low scrap value of OFS equipment means that existing the industry is
costly [46]]. However, Welltec may be less disadvantaged by this shared limitation of OFS companies
because it uses the equipment provided by its competitors. On the hand, this strategy is not without
its risks: “Welltec is, to some extent, dependent on equipment provided by our competitors and acts
or omissions by such competitors could restrict us from accessing wells using their equipment” [68,
p.8].
When it is difficult to exit an industry rivalry between competing companies tends to increase. The
situation is further aggravated if production capacity outstrips demand, as is currently the case in the
oil and gas industry [23, p.44].
Overall, when I take into consideration current conditions and projected prospects, I see the industry
as being very competitive, which decreases its attractiveness.
3.3.2. Cooperation
Industries are not made up companies endlessly squabbling over, who gets the biggest share of the
‘market cake’. Even competing companies can, sometimes, work together/collaborate to the mutual
benefit of all parties involved: “Responsible alliance building can balance competition and preserve
profitability to be able to grow an industry where all players have the chance to thrive” [13, p. 76].
Because of the specificities of the OFS industry, the variety of its products/services, and the absence
of entities whose products/services cover the entirety of the value chain, I find that OFS companies,
commonly, work alongside one another on the same project. However, there is a growing trend, in
the OFS industry, towards gathering evermore products/services under the roof of a single company.
In short, there is a movement towards fuller integration of OFS products/services:
51
“The industrial evolution of the service sector is also characterized by integration of services.
Companies strive to offer more services across the value chain. Schlumberger has the widest
provision of services along the whole value chain, but competitors have similar strategies and
this is, for example, a driver of the BakerHughesHalliburton tie up” [44, p.3].
As an example of cooperation in the industry, I find that Welltec uses the equipment from the
competitors. Having said this, an industry where cooperation between companies is a regular
occurrence is attractive.
3.3.3. Threat of new entrants
The ability to earn abnormal profits is what lures new companies into setting up business in an
industry. Of course, if it is easy for new players to enter a market, a growing number of companies
will be sharing the ‘abnormal profits’ cake and, the point will eventually come, when entering such a
market will no longer be worth it. Therefore, in order for an industry to remain attractive, entry into
it must, to some extent, be restrained. OFS industry is an attractive industry as the fence barring entry
is high:
“... The barriers to enter this industry are enough to scare away all but the serious companies ...
oil business requires highly specialized workers to operate the equipment and to make key …
decisions. Having ample cash is another barrier - a company had better have deep pockets to
take on the existing oil companies.” [46]]
In addition, because OFS companies are regular collaborators, new pretenders may find that they
need to challenge, not a lone incumbent, but a whole alliance of established companies. Lastly, legal
barriers such as patents also help ward off a lot of unsought after competition.
Overall, there are few gaps in this industry’s ‘barriers to entry’ fence, which makes it attractive,
especially, for the companies already on the inside.
3.3.4. Threat of substitute products or services
The industry as a whole is always under the threat of substitute products or services. [13, p. 76]. It is
common knowledge that the oil and gas industry is being threatened by alternative energy sources.
However, although the threat of renewables is very much real its manifestation into more substantial
setbacks to the oil and gas industry lies, according to most opinions, several decades in the future.
Substitution also exist in OFS services. However, there is much greater diversification with this
segment of the industry. Therefore, “[OFS] Companies offering more obscure or specialized
services … are much more likely to withstand the threat of substitutes” [46]].

52
Overall, this power is judged to be medium in its strength, which somewhat detracts from the
industry’s general attractiveness.
3.3.5. Bargaining power of buyers
For several years, oil prices have been low. In response, “E&P companies have been pushing the
supply chain to aggressively lower costs which in turn is impacting margins” [44, p.1], which, in turn,
has prompted OFS’s companies to reduce the scale of their operations (i.e. remove excess capacity
from the market) and lower their rates/prices.
Companies in the OFS sector serve a limit number of powerful buyers. Such a situation is not
desirable “because [buyers] have power to dictate [their] terms” [13, p.77]
3.3.6. Bargaining power of suppliers
Suppliers are powerful when they are few in numbers, and when there are few substitutes available
to their customers [9, p.2-8]. In the OFS industry, there are many potential suppliers, and, therefore,
their ability to wield any real bargaining power is limited.
3.3.7. Sub conclusion
To conclude, what can be said about the attractiveness of the industry? As far industry attractiveness
is concerned, I am afraid that the results of the six forces analysis does not allow me to pass any
conclusive judgments in support of or against investing in the industry. For instance, ‘threats of new
entrants’ is low. This is an attractive quality, as the company is not forced to constantly fend new
pretenders off its established market territories. High entry barriers increases the company’s
possibility of maintaining its profit margins, which allows for a speedier recovery of its investments.
Expressed more colloquially, it allows them to work in peace for a, relatively, longer span of time.
On the reverse side, exiting the market is also costly, which can lead to market struggles being played
out for longer than is financially sensible.
The figure below summarizes the insight from Six Forces analysis:

53
Overall, ‘industry attractiveness’ is being pushed and pulled in different directions by the six market
forces. Therefore, in my opinion, the industry is only moderately attractive.
3.4. Internal analysis
In order for a company to have long lasting competitive advantage and above average economic
performance it must be in position of some distinctive abilities. According to the VRIO model, a
company’s capabilities are unique if they are valuable to their customers, relatively rare, difficult to
imitate, and enjoy organization-wide-backup. Of course, it is understood, that if a resource/capability
is lacking in the first attribute (i.e. the customers are apathetic towards it), then, according to the
VRIO model, it makes no sense to squander further resources on obtaining and developing it. [23,
p.76]
3.4.1. Value
The most valuable resources/capabilities that Welltec have to offer are its technological knowhow.
Welltec’s technological menu is a, fairly, long one. However, two of these technologies stand out as
being the most prominent and critical for Welltec’s future success: Welltec’s Well Tractor and
Welltec Annular Barrier.
Well Tractor
In essence, the Well Tractor (see Appendix 33) is a robotic device that makes it possible for operators
to work in horizontal and meandering oil wells [61]. Introduced in 1994, Well Tractors are used in a
Threat of new entrants
LOW:
High entry barriers such
as patents, the need for
large investment and
existing alliances
Supplier power
LOW:
Many potential suppliers
Buyer power
HIGH:
Fewer buyers sensitive to
price in low oil price
environment
Threat of substitutes
MEDIUM:
Alternative energy as a
threat for O&G industry;
some specialized services
can substitute each other
Rivalry
HIGH:
High exit barriers,
currently slow or no
growth, but expected high
growth in next 20 years
Cooperation
MEDIUM:
Requirement for
integrated services
54
large number of excavationary processes [27], but what makes Well Tractors unique is that they
facilitate access to oil wells with uncongenial geological traits. With the number of projects seeking
to exploit unconventional oil resources (e.g. shale oil and deep, offshore wells) growing, the value of
Well Tractors will, most likely, increase:
“Drilling and completing horizontal, ERD and Designer wells are common operations world
wide. These types of well will play a major role in the coming decades along with multilateral
horizontal wells.” [14]
Welltec’s Tractor has earned the approval of its clients because it has, consistently proven, that it is,
among alternatives methods, the most financially efficient. In the testimonials of Welltec’s clients, I
find corroborate evidence to this claim:
In 1996, during its maiden offshore test that was performed by Statoil Maritime Well Service
(MWS) in the North Sea, the Well Tractor “revealed considerable savings when utilising wireline
tractors for electric line type operations versus coiled tubing for the same type of operation”. [14]
In 1999-2000, when Well Tractor was used in a 3,8 km long horizontal well in the Lekhwair field
in Oman it resulted “in a significantly more cost effective and faster field development”. [17]
According to Petroleum Development Oman, it was “much more cost effective than deploying a
light rig for logging”. [17]
When “computer simulations ... [showed] that it would not be possible to reach the desired depth
using [the technologies of] coiled tubing and conventional "extended reach" techniques alone”
[7], Hydro O&E used a Well Tractor “to shut off a gas breakthrough in ... [an offshore] deviated
reservoir section … in the Njord field” [7].
“Significant cost savings” from the use of wireline tractoring technology "during the initial
completion and intervention of two extended-reach, deepwater frac pack wells and one extended-
reach, deepwater water-injection well” have been reported by Chevron Corp. [2]
Occidental De Colombia Inc reported that using tractor conveyance in a challenging High Slanted
(HS) exploratory well “saved significant time and associated rig costs over pipe conveyance to
perforate a new well , and set two Latin American regional records for tractor-conveyed tools in
one well”. [29]
A very big advantage for Welltec is the combinability of Well Tractor with various third parties tools
and systems. This is why Welltec has managed to collaborate successfully, on several projects, with
OFS industry giants like Schlumberger [17], [7] and Halliburton [29], [2].

55
Welltec Annular Barrier
The Welltec Annular Barrier is a technology used in connection with the isolation of oil and gas wells:
“[the technology is based on] an expandable, metal barrier which can be used for well integrity, zonal
isolation or cement assurance applications” [45]. The technology replaces ‘cement’ as the primary
well barrier. For almost a century, cement was the industry’s most widely used isolation material.
However, with wells, in particular horizontal wells, becoming, progressively, deeper and more
complex in their design, cement, as a material used for isolating, was, steadily, on its way towards
becoming obsolete [4]: “…some factors and conditions do enhance the attractiveness of the solution
[i.e. Welltec’s technology], such as when traditional cementing is challenged…” [34].
Despite the novelty of the Welltec Annular Barrier (WAB) technology, it has already won over
several customers:
Soon after WAB was introduced, it was used in deep and complex well design operations in the
Norwegian offshore field of Valemon, where “the ability of cement to achieve a pressure seal
across the reservoir section for the life of a well becomes ever more difficult to achieve” [32].
Statoil reported that “the final qualification process exceeds the industry-established guidelines
in ISO standard 14310” [32].
“The challenge to establish effective cement for zonal isolation (ZI) … within a subsea, deepwater,
pre-salt well in Brazil” was met by installing “a cementless liner using state-of-the-art well
annular barrier technology” [24].
In 2016, Total E&P Congo selected Welltec Annular Barrier (WAB) as a completion component
for their forthcoming, deepwater wells in the Moho Nord project. [45]
Creative human capital
Unsurprisingly, there is a human element involved in Welltec’s inventiveness. A key dynamo of
creativity in Welltec is the founder Jørgen Hallundbæk who conceived the idea behind the Well
Tractor while still a graduate student at the Technical University of Denmark. In itself, the idea was
not new, but Hallundbæk was the first who managed to produce a functioning prototype. Of course,
Welltec’s talent gene pool of inventive talent is not restricted to its founder and CEO. As an example,
they have Brian Schwanitz who, in 2016, received the SPE’s (Society of Petroleum Engineers) award
for his lifelong achievements and contributions to the profession [47].
3.4.2. Rarity
If an organization is to have long-lasting competitive advantages, it is not enough for customers to
value its resources; its resources must also be rare: “Rare capabilities … are those possessed uniquely

56
by one organization or by a few others. Here competitive advantage is longer-lasting” [23, p.77].
However, even if it has resources that are, currently, rare, a company should not assume that their
rarity is everlasting.
Having said this, all Welltec’s technologies, including Well Tractor and Welltec Annular Barrier
(WAB) are, for the moment, under patent protection. As for having brilliant, innovative staff members,
this is not the sole prerogative of Welltec: “[The] SPE serves more than worldwide 143,000 members”
[43].
3.4.3. Inimitability
Another characteristic that can bolster the competitiveness of a company’s capabilities even further
is how costly it would be for its rivals to acquire/construct/build the same (or similar) capabilities.
The more prohibitive the expenses required for this imitation exercise the better (better for the
company who already owns the sought after capabilities). A company’s competitive abilities are at
an even greater advantage if their uniqueness is difficult to pinpoint. In other words, if it is not
manifestly obvious what it is exactly that makes the company’s products/services special:
“Compared to physical assets and patents, competences, then, tend to involve more intangible
imitation barriers. In particular, they often include linkages that integrate activities, skills,
knowledge and people both inside and outside the organization in distinct and mutually
compatible ways. These linkages can make capabilities particularly difficult for competitors to
imitate…” [23, p.78].
While it would not be impossible for a competitor to copy Welltec’s inventions, it would certainly be
illegal as they are still under patent protection. As for Welltec’s human capital, they seem to exhibit
a high level of steadfastness and loyalty; Brian Schwanitz, for example, has been with the company
for 15 years.
3.4.4. Organizational support
In order for a company to be able to reap the full benefits from owning (or controlling) valuable, rare,
and inimitable capabilities “[the] organization’s structure and formal and informal management
control systems need to support and facilitate their exploitation” [23, p.80]. Put differently, the
company must also possess “supporting capabilities … [which, by themselves,] are often not enough
to provide for competitive advantage, but they are useful and effective in the exploitation of other
capabilities that can provide for competitive advantage” [23, p.80].

57
Welltec does not say much about how its organizational structure and systems support its
technological innovations. This may be because Welltec’s innovations run on tracks parallel to its
organizational structure and systems.
To backup this view, I point out that Welltec has never managed to create added value. Even in the
very best years, when high oil prices could support Welltec’s complex and costly projects, their ROIC
was, consistently, lower than their weighted average cost of capital (both before and after tax), which
means that Welltec destroyed value. If I am to judge from its financial results and the history of its
founder, I would say that Welltec is a company that is more driven by adding innovation rather than
by adding value.
Capabilities Value Rarity Inimitability Organizational support Competitive implications
Well Tractor Yes Yes Yes No Sustainable competitive advantage
Welltec Annular Barrier Yes Yes Yes No Sustainable competitive advantage
Creative human capital Yes Yes No Yes Temporary competitive advantage
Based on the findings from the VRIO framework I would say that Welltec’s competitiveness receives
its sustenance from two sources:
the first of these is its technologies;
the second of these are the individuals behind the inventions. Put differently, its creative human
capital.
With regard to the 2nd of these sources, I find that the creative temperament of Welltec’s founder
together with a mission and philosophy focused on leveraging technological innovation in the pursuit
of ever-greater industry efficiencies are all indications that Welltec is serious about
nourishing/maintaining its ‘creative genepool’.
However, the connection between Welltec’s technological innovations and its business processes are
loose and need to be strengthened. Prosaically speaking, Welltec is good at acquiring and taking care
of its talented workforce but less accomplished when it comes to making money from the inventions
they produce.

58
3.5. SWOT
The highpoints from the strategic and financial analysis are collected and poured into the SWOT
matrix below. The SWOT highlights Welltec’s internal strengths and weaknesses, as well as external
threats and opportunities. The results derived from this table are important parameters for projecting
Welltec future development.
CHAPTER 4. Forecast and valuation
A more comprehensive forecast involves prognosticating probable future behaviours of several
variables salient to business being analysed. However, for most types of businesses, sales is the key
variable whose future behaviour analysts/managers seek to predict. Future sales, together with their
projected profit margins, are foundational figures, which analysts/managers use in divining what the
figures of other items, in the company’s financial statements, can be expected to look like:
“... working capital accounts and investment in plants should track the growth in sales closely.
Most major expenses also track sales, subject to expected shifts in profit margins. By linking
forecasts of such amounts to the sales forecast, one can avoid internal inconsistencies and
unrealistic implicit assumptions” [9, p.6-2].
The pro forma statements for Welltec forecast was prepared based on the template suggested by
Petersen C.V. & Plenborg T. [8, p.176] with a few adjustments.
Firstly, taking into account that operating tax rate is different from Danish corporation tax rate used
to calculate tax shield, both of them will be included as financial drivers. Moreover, I will use
borrowing cost before tax to account for differences in tax rates.
Strength Internal technological capabilities
Creative human capital
Alliances/collaboration with other OFS companies
like Schlumberger and Halliburton
Weaknesses Low profitability
High borrowing cost
High financial leverage
Low assets turnover rate
High level of receivables
Low level of integration of services
Opportunities Estimated economic growth
Estimated growth in oil and gas consumption
Estimated oil and gas prices increase
Unconventional projects growth
Potential deepwater projects growth
Low threat of new entrants
Threats Growth in conventional oil and gas (OPEC)
Economic downturns
Low oil prices
Fossil fuels being substituted by alternative energy
sources
HSE risks linked to unconventionals and deepwater
Potential changes in regulations

59
Secondly, because Welltec’s tangible assets adjust to revenue level quicker than its intangible assets,
I will estimate them separately. Furthermore, depreciation and amortization will also be split.
And lastly, “in the template dividends are a function of the cash surplus earned during each forecast
year; i.e. the cash not consumed in operations, investments and financing”. [8, p.183] However,
Welltec is not paying out dividends. [69, p.58], [68, p.50] Therefore, in order to ensure that pro forma
statement articulate, the template will be modified as follows:
An interim item will be computed by adding ‘cash and cash equivalents’ back to ‘net interest
bearing debt’;
It is estimated based on the financial driver ‘net interest bearing debt as a percentage of invested
capital’ (adjusted for cash and cash equivalents);
‘New debt’ in cash flow statement is calculated as a change in ‘net interest bearing debt’ (adjusted
for cash and cash equivalents);
‘Cash and cash equivalents’ will serve as “a final step (‘plug’) in the template that ensures an
articulation of the pro forma statements” [8, p.183]. The value of ‘cash and cash equivalents’ at
the end of period will be equal to the value at the beginning of period (i.e. end of preceding period)
plus cash surplus;
Finally, ‘net interest bearing debt’ is equal to ‘net interest bearing debt’ (adjusted for cash and
cash equivalents) less ‘cash and cash equivalents’.
It is important to note that the financial driver ‘borrowing cost before tax (%)’ will not be affected by
this change as it is calculated as the value of ‘net financial expenses before tax’ divided by ‘net interest
bearing debt’ at the end of previous period.
4.1. Adjustments for non-recurring items
In Chapter 2, I highlighted a few non-recurring items – ‘non-recurring consultancy fees’ that was part
of special items and ‘adjustment in corporation tax previous years’ that was part of ‘income tax’. For
forecasting, I will exclude non-recurring items from income statements and adjust balance sheets
accordingly. Importantly, because ‘non-recurring consultancy fees’ is excluded from the income
statement, the value of tax shield is recalculated to account for this adjustment.
Adjustments for non-recurring items in Income statement:
USD, in thousands 2015 2014 2013 2012 2011
Reverse of Adjustment in corporation tax previous years 14 10.595 4.550 -355 55
Change in operating tax 14 10.595 4.550 -355 55

60
Special items (financing) 3.181
Tax shield on non-recurring Special items (financing) -795
Change in net financial expenses after tax 2.386
Change in net earnings 14 10.595 6.936 -355 55
Following the adjustments in income statement, the accumulated effect of excluded non-recurring
items was added to both ‘cash and cash equivalents’ and ‘retained earnings’ in the balance sheet:
USD, in thousands 2015 2014 2013 2012 2011
Change in cash and cash equivalents 17.245 17.231 6.636 -300 55
Change in retained earnings 17.245 17.231 6.636 -300 55
Welltec does not disclose income tax details in its quarterly reports. Therefore, the effect from
adjustments described above will be evenly allocated throughout the year.
Financial statement adjusted for non-recurring items presented in Appendix 34.
4.2. Forecast of Q4 2016 and full 2016
Before going ahead with forecasting Q4, the question of seasonality needs to be addressed:
“How is important seasonality? What is a useful starting point – the most recent quarter’s
performance? The comparable quarter of the prior year? Some combination of two? … Does
the … approach to forecasting used for annual data apply equally well to quarterly data?” [9,
p.6-15].
What the above quoted questions indicate is that if the aim is meticulous, reality reflecting forecasting,
then “one cannot focus only on performance of the most recent quarter as a starting point” [9, p.6-
15; italics mine].
Therefore, I will use time series forecasting based on historical data for the periods from Q1 2013
until Q3 2016 (the latest available). As a starting point, I will consider the same key drivers as for
annual forecasting. However, I will also perform a short analysis of each ‘driver’ prior to forecasting.
The forecasting method will be chosen based on the revealed ‘pattern’/’behaviour’ of the key driver.
4.2.1. Revenue
Observed sales is a combination of a systematic component and a random component. [28, p.9] Any
forecasting method seeks to filter out the random component and estimate the systematic component.
[28, p.9] A systematic component consist of:
Level (deseasonalized sales)
Trend (growth or decline in sales)
Seasonality (seasonal fluctuation). [28, p.9]
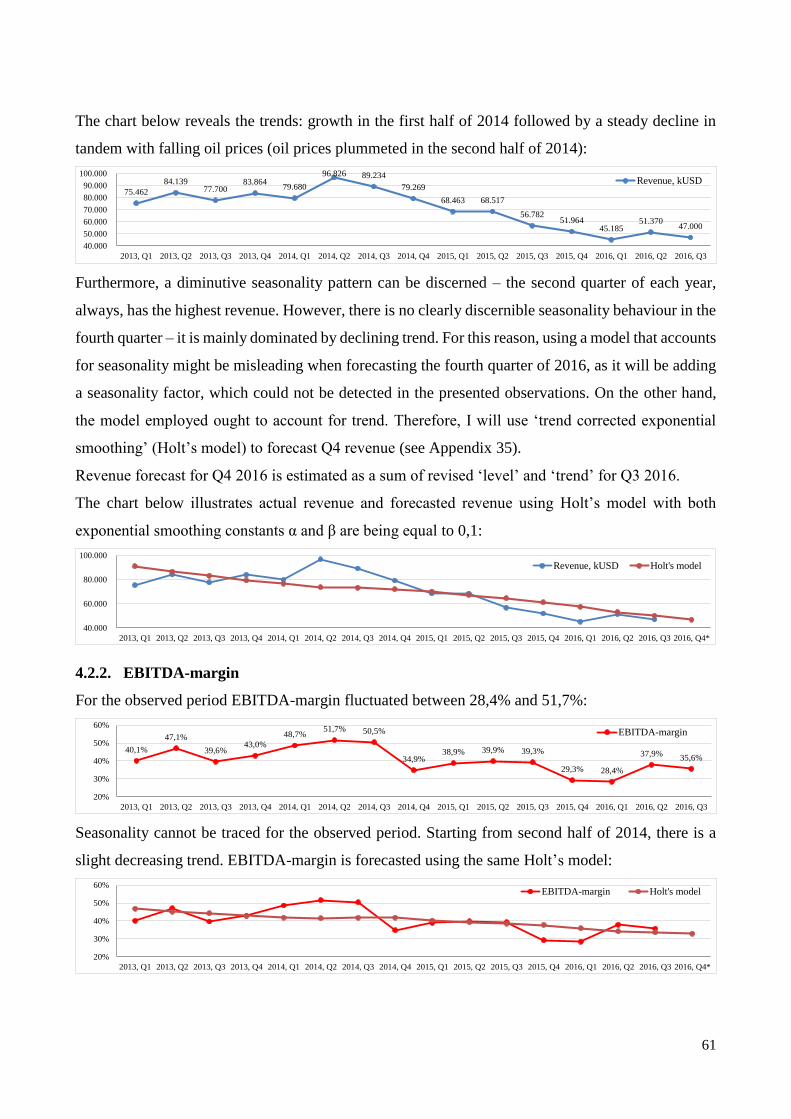
61
The chart below reveals the trends: growth in the first half of 2014 followed by a steady decline in
tandem with falling oil prices (oil prices plummeted in the second half of 2014):
Furthermore, a diminutive seasonality pattern can be discerned – the second quarter of each year,
always, has the highest revenue. However, there is no clearly discernible seasonality behaviour in the
fourth quarter – it is mainly dominated by declining trend. For this reason, using a model that accounts
for seasonality might be misleading when forecasting the fourth quarter of 2016, as it will be adding
a seasonality factor, which could not be detected in the presented observations. On the other hand,
the model employed ought to account for trend. Therefore, I will use ‘trend corrected exponential
smoothing’ (Holt’s model) to forecast Q4 revenue (see Appendix 35).
Revenue forecast for Q4 2016 is estimated as a sum of revised ‘level’ and ‘trend’ for Q3 2016.
The chart below illustrates actual revenue and forecasted revenue using Holt’s model with both
exponential smoothing constants α and β are being equal to 0,1:
4.2.2. EBITDA-margin
For the observed period EBITDA-margin fluctuated between 28,4% and 51,7%:
Seasonality cannot be traced for the observed period. Starting from second half of 2014, there is a
slight decreasing trend. EBITDA-margin is forecasted using the same Holt’s model:
75.462
84.139 77.700
83.864 79.680
96.826 89.234
79.269
68.463 68.517
56.782 51.964
45.185 51.370
47.000
40.000
50.000
60.000
70.000
80.000
90.000
100.000
2013, Q1 2013, Q2 2013, Q3 2013, Q4 2014, Q1 2014, Q2 2014, Q3 2014, Q4 2015, Q1 2015, Q2 2015, Q3 2015, Q4 2016, Q1 2016, Q2 2016, Q3
Revenue, kUSD
40.000
60.000
80.000
100.000
2013, Q1 2013, Q2 2013, Q3 2013, Q4 2014, Q1 2014, Q2 2014, Q3 2014, Q4 2015, Q1 2015, Q2 2015, Q3 2015, Q4 2016, Q1 2016, Q2 2016, Q3 2016, Q4*
Revenue, kUSD Holt's model
40,1%
47,1%
39,6%43,0%
48,7%51,7% 50,5%
34,9%38,9% 39,9% 39,3%
29,3% 28,4%
37,9%35,6%
20%
30%
40%
50%
60%
2013, Q1 2013, Q2 2013, Q3 2013, Q4 2014, Q1 2014, Q2 2014, Q3 2014, Q4 2015, Q1 2015, Q2 2015, Q3 2015, Q4 2016, Q1 2016, Q2 2016, Q3
EBITDA-margin
20%
30%
40%
50%
60%
2013, Q1 2013, Q2 2013, Q3 2013, Q4 2014, Q1 2014, Q2 2014, Q3 2014, Q4 2015, Q1 2015, Q2 2015, Q3 2015, Q4 2016, Q1 2016, Q2 2016, Q3 2016, Q4*
EBITDA-margin Holt's model

62
4.2.3. Borrowing costs before tax and net financial expenses before tax
Borrowing cost before tax is a percentage of net financial expenses before tax over NIBD at the
beginning of the period. The chart below demonstrates a seasonality factor. Even though the level of
‘annual borrowing cost before tax’ for 2013 and 2014 (right axis) did not change (13,6%), it is not,
evenly, distributed throughout the year: the highest percentage of borrowing cost before tax falls in
4th quarters (left axis):
The one could assume that the majority of Welltec interest expenses fall on the last quarter of the
year. However, the chart below does not support that assumption. Except for 2015, the value of net
financial expenses paid at the year end is not higher than the sums paid in the first three quarters:
That indicates that ‘borrowing cost before tax (%)’ is primarily driven by developments in NIBD at
the beginning of period (right axis) rather than developments in net financial expenses (left axis):
Therefore, net financial expenses before tax are estimated as a percentage of NIBD at the beginning
of period. However, to avoid the doubtful effect of ‘seasonality’ exhibited on chart above, I will
estimate the financial expenses for 2016 using the recent 2015 annual level of borrowing cost before
tax (15,4%) and the net interest bearing debt at the end of 2015. The value of net financial expenses
before tax for Q4 2016 is calculated as the difference between annual amount and expenses paid in
Q1-Q3 2016. That method was chosen to account for low net financial expenses paid in Q3 2016
which are expected to be paid in Q4 2016. Estimating borrowing cost before tax based on quarter
percentage would not capture/express the (true) value of these expenses that were, apparently,
‘underpaid’ in Q3 2016.
The estimated value for Q4 2016 accounts for a borrowing cost before tax equal to 7,9%.
3,1%2,6%
3,0%
4,2%
2,8%2,1%
3,6%
5,3%
2,5%2,9%
4,6%
5,4%
2,4%2,8%
2,2%
12,0%
14,0%
16,0%
18,0%
2%
4%
6%
8%
2013, Q1 2013, Q2 2013, Q3 2013, Q4 2014, Q1 2014, Q2 2014, Q3 2014, Q4 2015, Q1 2015, Q2 2015, Q3 2015, Q4 2016, Q1 2016, Q2 2016, Q3
Annual borrowing cost before tax (%) Quarter borrowing cost (%)
0
10.000
20.000
30.000
2013 2014 2015 2016
Q1 Q2 Q3 Q4Quarter net financial expenses, kUSD:
270.000
290.000
310.000
330.000
10.000
20.000
30.000
40.000
2013, Q1 2013, Q2 2013, Q3 2013, Q4 2014, Q1 2014, Q2 2014, Q3 2014, Q4 2015, Q1 2015, Q2 2015, Q3 2015, Q4 2016, Q1 2016, Q2 2016, Q3
NFE before tax, kUSD Net interest bearing debt (beginning of period), kUSD

63
4.2.4. Effective tax rate (operating income)
Effective tax rate for the operating income fluctuates significantly over the observed period:
Therefore, to estimate the effective rate for Q4 2016 forecast, the average rate will be calculated as a
sum of operating tax for observed period (from Q1 2013 till Q3 2016) divided by the sum of EBIT
for that same period. This would help average out any potential ‘extreme’ rates that may relate to tax
payment cash flow (i.e. tax being paid too early or being delayed). Effective tax rate for Q4 2016 is
estimated at the level of 65,7%.
4.2.5. Danish corporation tax rate (financial income)
Danish corporation tax in 2016 was 22%. [60]
4.2.6. Intangible assets
Intangible assets as a percentage of revenue can be a ‘driver’ in an annual forecast, but it is not suitable
for shorter forecasting periods. We should not expect a company to adjust its non-current assets so
frequently following minor revenue changes. Therefore, for Q4 2016 forecast we will look at absolute
numbers rather than a relative (a percentage) to reveal any trend:
The chart above reveals that intangible assets (left axis) stay almost on the same level until Q3 2015.
In Q1 2016, because of the changed market conditions, Welltec recognized impairment losses to its
technology and customer relationship assets amounting to USD 56 million [54, p.3-4] which
significantly reduced its intangible assets (right axis). After this, the value of intangible assets is
almost unchanged. Therefore, intangible assets for Q4 2016 are forecasted at the level of Q3 2016
less change in intangible assets. Change in intangible assets is estimated as -1,1% which is an average
% of change for Q2-Q3 2016.
4.2.7. Amortization as % of intangible assets
Welltec discloses details on total ‘amortization, depreciation and impairment losses’ only in the notes
to its annual report. Quarterly income statement contains ‘amortization of acquired intangibles in
20,4% 33,0% 46,9% 32,4% 19,3% 28,5% 37,0%106,2% 47,8% 48,4% 72,5%
-249,1%
17,4%170,8%
851,3%
-250%
0%
250%
500%
750%
1000%
2013, Q1 2013, Q2 2013, Q3 2013, Q4 2014, Q1 2014, Q2 2014, Q3 2014, Q4 2015, Q1 2015, Q2 2015, Q3 2015, Q4 2016, Q1 2016, Q2 2016, Q3
Effective tax rate (operating income)
433.251 432.598 433.640 435.126 433.741 433.371 433.736 430.593 431.289 431.282 428.525 413.071
353.549 350.076 345.738
40.000
60.000
80.000
100.000
300.000
350.000
400.000
450.000
2013, Q1 2013, Q2 2013, Q3 2013, Q4 2014, Q1 2014, Q2 2014, Q3 2014, Q4 2015, Q1 2015, Q2 2015, Q3 2015, Q4 2016, Q1 2016, Q2 2016, Q3
Intangible assets, kUSD Revenue, kUSD

64
business combinations’ which is only a portion of total amortization expense. Therefore, amortization
should be estimated based on annually reported data. However, Welltec recognized a substantial
impairment loss for intangibles acquired in business combination (named as ‘technology’ and
‘customer relationship’) in Q1 2016. This requires the adjustment of data from previous years. To
estimate total amortization expense for Q4 2016 we need to go through the following steps:
Firstly, we calculate the average annual amortization as % of intangible assets in 2013-2015 excluding
‘technology’ and ‘customer relationship’:
USD, in thousands 2012 2013 2014 2015 Average
Amortization and impairment loss of intangible assets (total) 26.336 30.236 41.719 36.008
LESS:
Amortization of acquired intangibles in a business combination -10.705 -10.616 -10.568 -10.264
Amortization and impairment loss (adjusted) 15.631 19.620 31.151 25.744
Intangible assets 431.412 435.126 430.593 413.071
LESS:
Technology -65.927 -61.227 -56.197 -51.501
Cusomer relationship -24.499 -18.752 -13.052 -7.476
Intangible assets (adjusted) 340.986 355.147 361.344 354.094
Amortization as % of intangible assets (excl. acquired
intangibles in a business combination) n/a 5,8% 8,8% 7,1% 7,2%
Amortization (excluding acquired intangibles in a business combination) for Q4 2016 is estimated as
1/4th of annual percentage, i.e. 1,8%.
Next step is to calculate the value of amortization expense (excluding acquired intangibles in a
business combination) for Q4 2016:
USD, in thousands 2015, Q4 2016, Q1 2016, Q2 2016, Q3 2016, Q4*
Intangible assets 413.071 353.549 350.076 345.738
LESS:
Technology -51.501 -3.247 -3.194 -2.919
Cusomer relationship -7.476 -213 -149 -84
Intangible assets (adjusted) 354.094 350.089 346.733 342.735
Amortization as % of intangible assets (excl. acquired
intangibles in a business combination) 1,8%
Amortization (excl. acquired intangibles in a business
combination) 6.183
Amortization of acquired intangibles in a business combination 3.594 55.575 198 198 198
Amortization and impairment loss (total) 6.381
After impairment loss, ‘amortization of acquired intangibles in a business combination’ is equal to
USD 198 thousand. Assuming that annual amortization expense is evenly allocated during the year,
‘amortization of acquired intangibles in a business combination’ for Q4 2016 is estimated at the same
level. The total value of amortization expense is a sum of both parts.
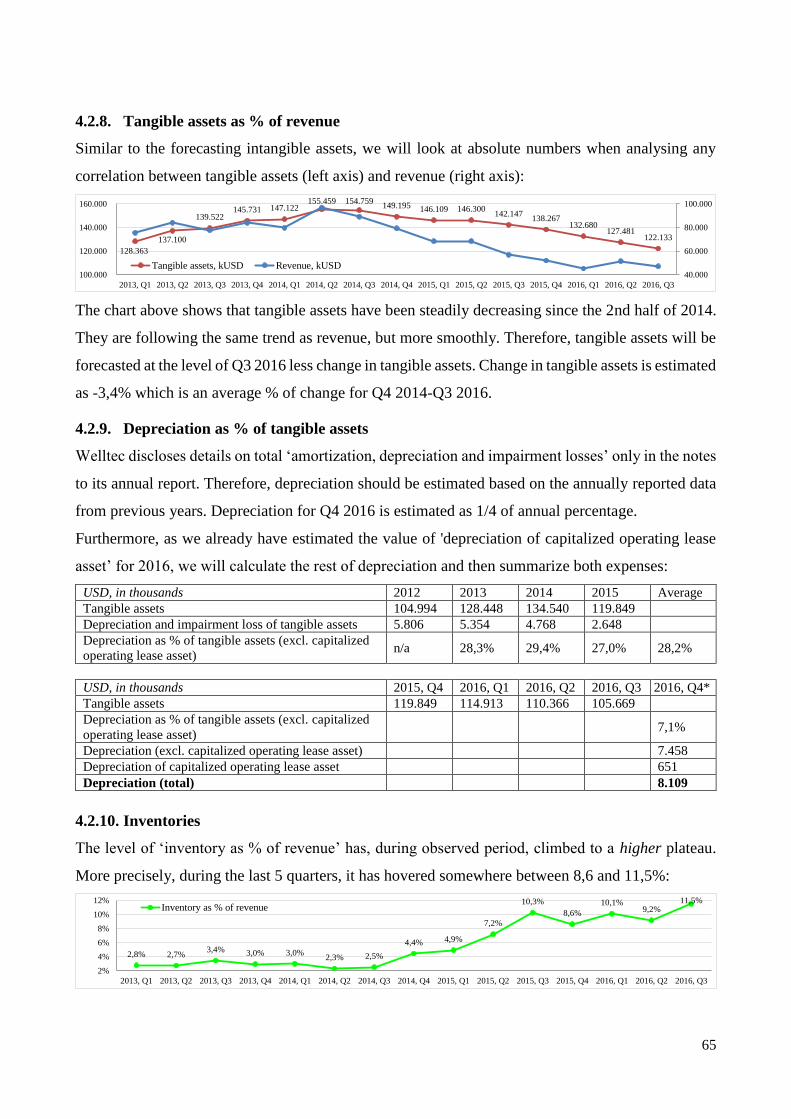
65
4.2.8. Tangible assets as % of revenue
Similar to the forecasting intangible assets, we will look at absolute numbers when analysing any
correlation between tangible assets (left axis) and revenue (right axis):
The chart above shows that tangible assets have been steadily decreasing since the 2nd half of 2014.
They are following the same trend as revenue, but more smoothly. Therefore, tangible assets will be
forecasted at the level of Q3 2016 less change in tangible assets. Change in tangible assets is estimated
as -3,4% which is an average % of change for Q4 2014-Q3 2016.
4.2.9. Depreciation as % of tangible assets
Welltec discloses details on total ‘amortization, depreciation and impairment losses’ only in the notes
to its annual report. Therefore, depreciation should be estimated based on the annually reported data
from previous years. Depreciation for Q4 2016 is estimated as 1/4 of annual percentage.
Furthermore, as we already have estimated the value of 'depreciation of capitalized operating lease
asset’ for 2016, we will calculate the rest of depreciation and then summarize both expenses:
USD, in thousands 2012 2013 2014 2015 Average
Tangible assets 104.994 128.448 134.540 119.849
Depreciation and impairment loss of tangible assets 5.806 5.354 4.768 2.648
Depreciation as % of tangible assets (excl. capitalized
operating lease asset) n/a 28,3% 29,4% 27,0% 28,2%
USD, in thousands 2015, Q4 2016, Q1 2016, Q2 2016, Q3 2016, Q4*
Tangible assets 119.849 114.913 110.366 105.669
Depreciation as % of tangible assets (excl. capitalized
operating lease asset) 7,1%
Depreciation (excl. capitalized operating lease asset) 7.458
Depreciation of capitalized operating lease asset 651
Depreciation (total) 8.109
4.2.10. Inventories
The level of ‘inventory as % of revenue’ has, during observed period, climbed to a higher plateau.
More precisely, during the last 5 quarters, it has hovered somewhere between 8,6 and 11,5%:
128.363
137.100
139.522 145.731 147.122
155.459 154.759 149.195 146.109 146.300
142.147 138.267
132.680 127.481
122.133
40.000
60.000
80.000
100.000
100.000
120.000
140.000
160.000
2013, Q1 2013, Q2 2013, Q3 2013, Q4 2014, Q1 2014, Q2 2014, Q3 2014, Q4 2015, Q1 2015, Q2 2015, Q3 2015, Q4 2016, Q1 2016, Q2 2016, Q3
Tangible assets, kUSD Revenue, kUSD
2,8% 2,7%3,4% 3,0% 3,0%
2,3% 2,5%
4,4% 4,9%
7,2%
10,3%
8,6%
10,1%9,2%
11,5%
2%
4%
6%
8%
10%
12%
2013, Q1 2013, Q2 2013, Q3 2013, Q4 2014, Q1 2014, Q2 2014, Q3 2014, Q4 2015, Q1 2015, Q2 2015, Q3 2015, Q4 2016, Q1 2016, Q2 2016, Q3
Inventory as % of revenue

66
The new level was influenced by a combination of 2 factors: lower revenue (right axis) and higher
level of inventories (left axis):
I can also observe the change in level in absolute numbers, i.e. inventories. The value of ‘inventories’
has ranged from 4,4 to 5,8 thousand USD in the last 6 quarters. The chart above does not reveal either
trend or seasonality after the level has changed.
Analysis of ‘change in inventories’ (left axis) has not revealed a ‘seasonality’ factor within a year
either:
Therefore, I will use a simple exponential smoothing model to estimate the inventories in Q4 2016.
Moreover, as the fluctuation observed on the chart above is mostly related to revenue behaviour (right
axis). Thus, I will estimate the inventories rather than their percentage of revenue.
Simple exponential smoothing is ‘an average method that weights the most recent data’. [28, p.20]
The model is described in Appendix 36. Chart below illustrates actual revenue and forecasted revenue
using simple exponential smoothing model with exponential smoothing constant α being equal to 0,5:
The value of ‘inventory as % of revenue’ based on estimated ‘inventories’ and ‘revenue’ is equal to
10,8% which lies within the range observed in last 5 quarters.
4.2.11. Receivables as % of revenue
During the observation period, we see that after climbing to a higher plateau, the item ‘receivables as
a % of revenue’ has, for the last 2 years, oscillated between 134 and 153%:
2.083 2.296 2.670 2.476 2.374 2.244 2.237
3.515 3.365 4.926
5.831
4.479 4.575 4.709 5.415
0
25.000
50.000
75.000
100.000
0
2.000
4.000
6.000
8.000
2013, Q1 2013, Q2 2013, Q3 2013, Q4 2014, Q1 2014, Q2 2014, Q3 2014, Q4 2015, Q1 2015, Q2 2015, Q3 2015, Q4 2016, Q1 2016, Q2 2016, Q3 2016, Q4*
Inventories, kUSD Revenue, kUSD
-75.000
-50.000
-25.000
0
25.000
50.000
75.000
100.000
-1.500
-1.000
-500
0
500
1.000
1.500
2.000
2013, Q1 2013, Q2 2013, Q3 2013, Q4 2014, Q1 2014, Q2 2014, Q3 2014, Q4 2015, Q1 2015, Q2 2015, Q3 2015, Q4 2016, Q1 2016, Q2 2016, Q3 2016, Q4*
Change in Inventories, kUSD Revenue, kUSD
0
2.000
4.000
6.000
2013, Q1 2013, Q2 2013, Q3 2013, Q4 2014, Q1 2014, Q2 2014, Q3 2014, Q4 2015, Q1 2015, Q2 2015, Q3 2015, Q4 2016, Q1 2016, Q2 2016, Q3 2016, Q4*
Inventories, kUSD Simple Exponential Smoothing
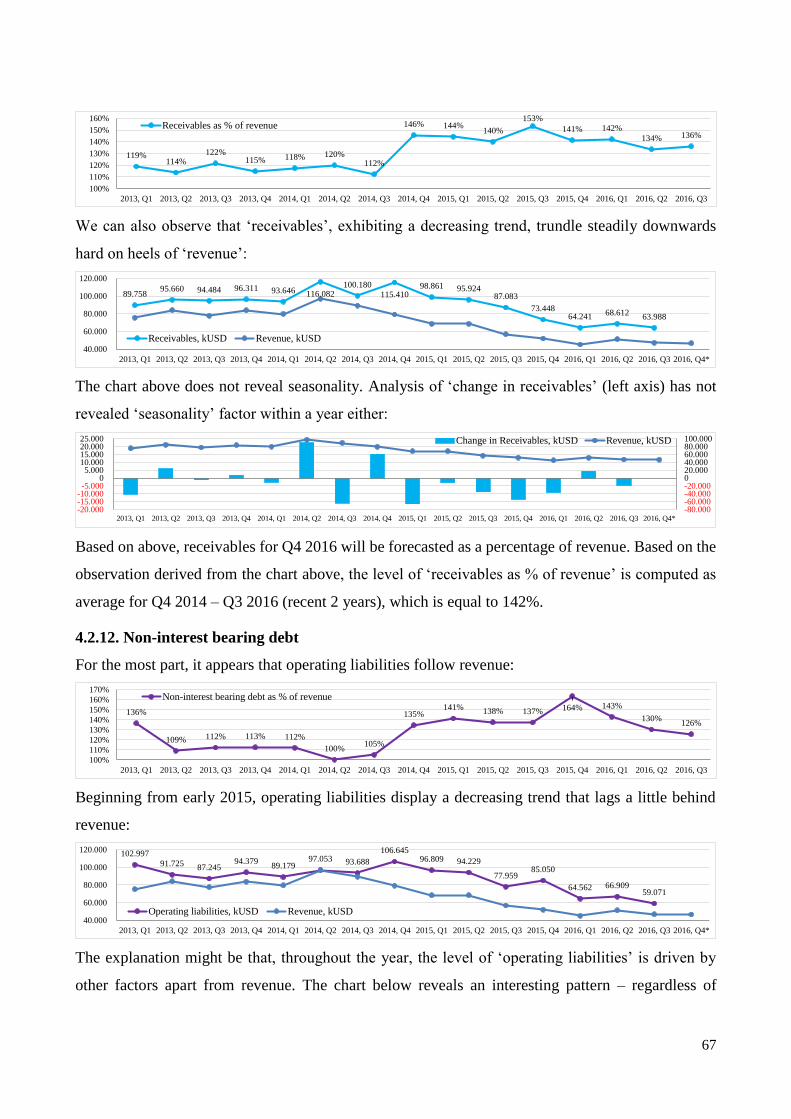
67
We can also observe that ‘receivables’, exhibiting a decreasing trend, trundle steadily downwards
hard on heels of ‘revenue’:
The chart above does not reveal seasonality. Analysis of ‘change in receivables’ (left axis) has not
revealed ‘seasonality’ factor within a year either:
Based on above, receivables for Q4 2016 will be forecasted as a percentage of revenue. Based on the
observation derived from the chart above, the level of ‘receivables as % of revenue’ is computed as
average for Q4 2014 – Q3 2016 (recent 2 years), which is equal to 142%.
4.2.12. Non-interest bearing debt
For the most part, it appears that operating liabilities follow revenue:
Beginning from early 2015, operating liabilities display a decreasing trend that lags a little behind
revenue:
The explanation might be that, throughout the year, the level of ‘operating liabilities’ is driven by
other factors apart from revenue. The chart below reveals an interesting pattern – regardless of
119%114%
122%115% 118% 120%
112%
146% 144%140%
153%
141% 142%
134% 136%
100%
110%
120%
130%
140%
150%
160%
2013, Q1 2013, Q2 2013, Q3 2013, Q4 2014, Q1 2014, Q2 2014, Q3 2014, Q4 2015, Q1 2015, Q2 2015, Q3 2015, Q4 2016, Q1 2016, Q2 2016, Q3
Receivables as % of revenue
89.758 95.660 94.484 96.311 93.646 116.082
100.180 115.410
98.861 95.924 87.083
73.448 64.241 68.612
63.988
40.000
60.000
80.000
100.000
120.000
2013, Q1 2013, Q2 2013, Q3 2013, Q4 2014, Q1 2014, Q2 2014, Q3 2014, Q4 2015, Q1 2015, Q2 2015, Q3 2015, Q4 2016, Q1 2016, Q2 2016, Q3 2016, Q4*
Receivables, kUSD Revenue, kUSD
-80.000-60.000-40.000-20.000020.00040.00060.00080.000100.000
-20.000-15.000-10.000-5.000
05.000
10.00015.00020.00025.000
2013, Q1 2013, Q2 2013, Q3 2013, Q4 2014, Q1 2014, Q2 2014, Q3 2014, Q4 2015, Q1 2015, Q2 2015, Q3 2015, Q4 2016, Q1 2016, Q2 2016, Q3 2016, Q4*
Change in Receivables, kUSD Revenue, kUSD
136%
109% 112% 113% 112%
100%105%
135%141%
138% 137% 164% 143%
130%126%
100%
110%
120%
130%
140%
150%
160%
170%
2013, Q1 2013, Q2 2013, Q3 2013, Q4 2014, Q1 2014, Q2 2014, Q3 2014, Q4 2015, Q1 2015, Q2 2015, Q3 2015, Q4 2016, Q1 2016, Q2 2016, Q3
Non-interest bearing debt as % of revenue
102.997
91.725 87.245
94.379 89.179
97.053 93.688
106.645 96.809 94.229
77.959 85.050
64.562 66.909 59.071
40.000
60.000
80.000
100.000
120.000
2013, Q1 2013, Q2 2013, Q3 2013, Q4 2014, Q1 2014, Q2 2014, Q3 2014, Q4 2015, Q1 2015, Q2 2015, Q3 2015, Q4 2016, Q1 2016, Q2 2016, Q3 2016, Q4*
Operating liabilities, kUSD Revenue, kUSD

68
revenue behaviour (right axis), operating liabilities (left axis) always increase by the end of the year.
That might be related to company’s internal processes, e.g. billing clients for all unbilled services to
close the books:
Therefore, operating liabilities at the end of Q4 2016 are forecasted at the level of Q3 2016 plus
10,4% which is an average change in operating liabilities in Q4 observed in 2013-2015. The estimated
value of operating liabilities will count for 140% of estimated revenue for Q4 2016, which is in line
with the level of non-interest bearing debt as a percent of revenue in recent years.
4.2.13. Net financial obligation (adjusted for cash and cash equivalents) as % of invested capital
‘NIBD (adjusted for cash and cash equivalents) as a percent of invested capital’, as the chart below
demonstrates, has recently increased:
There are 2 factors that have brought about this change: a decreasing trend in invested capital (right
axis) and an increased level of NIBD (adjusted for cash and cash equivalents) (left axis):
The chart above also reveals the seasonality factor in NIBD’s behaviour. Every 1st quarter NIBD
slightly decreases and every 2nd quarter NIBD increases. As for 3rd and 4th quarters, NIBD, more or
less, remains on the same level. This slight seasonality affect was caused by ‘bank debt’ and ‘finance
lease commitments’ behaviour. The presence of seasonality would suggest using Winter’s model that
enables to forecast taking into account level, trend and seasonality. However, the same chart also
reveals that, starting from second half of 2015, the trend of NIBD (adjusted for cash and cash
equivalents) is influenced by decreasing trend of ‘issued bonds’(left axis). That trend is expected to
8,2% 13,8% 9,1%
-100.000
-50.000
0
50.000
100.000
-20.000
-10.000
0
10.000
20.000
2013, Q1 2013, Q2 2013, Q3 2013, Q4 2014, Q1 2014, Q2 2014, Q3 2014, Q4 2015, Q1 2015, Q2 2015, Q3 2015, Q4 2016, Q1 2016, Q2 2016, Q3 2016, Q4*
Change in Operating liabilities, kUSD Revenue, kUSD
61,0% 61,5%60,3% 59,3%
57,7% 57,7%59,0% 59,7% 59,7%
65,5%62,7%
66,7%
72,8%
76,4%73,6%
55%
60%
65%
70%
75%
80%
2013, Q1 2013, Q2 2013, Q3 2013, Q4 2014, Q1 2014, Q2 2014, Q3 2014, Q4 2015, Q1 2015, Q2 2015, Q3 2015, Q4 2016, Q1 2016, Q2 2016, Q3
Net financial obligation (adjusted for cash and cash equivalents) as % of invested capital
335.006
353.679 350.859 346.586 338.666
351.287 351.895 353.116 347.305
382.118 366.886 362.732 356.812
369.614
351.641
400.000
500.000
600.000
700.000
270.000
310.000
350.000
390.000
2013, Q1 2013, Q2 2013, Q3 2013, Q4 2014, Q1 2014, Q2 2014, Q3 2014, Q4 2015, Q1 2015, Q2 2015, Q3 2015, Q4 2016, Q1 2016, Q2 2016, Q3 2016, Q4*
NIBD (adj. for cash and cash equivalents), kUSD Issued bonds, kUSD Invested capital, kUSD

69
overshadow seasonality pattern for the end of 2016. Therefore, NIBD (adjusted for cash and cash
equivalents) for Q4 2016 will be estimated as a percent of invested capital which would be calculated
using a simple exponential smoothing method.
It could be argued whether a model accounting for trend should be used. However, if we consider the
dominant directional dynamics of the trend to be increasing and the decrease in Q3 2016 as a random
factor, the use of Holt’s model would be justifiable. However, I tend to consider the path as a change
in level, and therefore, choose to use the model that accounts for level and disregard the trend. It is
worth mentioning that the choice of the model will not influence results significantly, as both models
produce very similar result:
4.2.14. Cash and cash equivalents and net interest bearing debt
In order to estimate cash and cash equivalents for Q4 2016, a cash flow statement for the same period
should be created (see Appendix 37). As suggested above, cash and cash equivalents for Q4 2016 is
computed as cash and cash equivalents for Q3 2016 plus cash surplus in Q4 2016.
After cash and cash equivalents for Q4 2016 has been calculated, the value of net interest bearing
debt can be calculated as estimated value of adjusted NIBD for Q4 2016 less cash and cash
equivalents for Q4 2016.
4.3. Forecast of 2017+
I will divide the forecast into five unequal lengths of time:
‘Early Convalescence’ from 2017 till 2020
From 2017 to 2020, the industry is expected to recover from the oil prices slump. In 2020, oil
production will have increased by 1,3% compared to 2015. Growth in oil and gas production will,
primarily, come from the still plentiful inland and shallow-water resources (henceforth referred to as
conventionals). After several years of banishment, Iranian oil will, once more, be permitted to enter
the market. Oil prices start to pick up, but they are still far from pre-slump levels. Oil companies’
interest in unconventional inland resources together with deepwater, ultra deepwater and pre-salt
water (henceforth referred to as unconventionals) increases. However, the interest is dampened by
relatively moderate oil prices that impede unconventionals’ complex and costly projects.
55%
60%
65%
70%
75%
80%
2013, Q1 2013, Q2 2013, Q3 2013, Q4 2014, Q1 2014, Q2 2014, Q3 2014, Q4 2015, Q1 2015, Q2 2015, Q3 2015, Q4 2016, Q1 2016, Q2 2016, Q3 2016, Q4*
Net financial obligation (adjusted for cash and cash equivalents) as % of invested capital
Holt's model
Simple Exponential Smoothing

70
‘Leaving the Sickbed’ from 2021 till 2025
Oil productions shifts into fifth gear. In 2025, annual production growth is 4,4%, a tripling of the
2020 level. The growing gap between demand and supply raise oil prices above $100/b. As a result,
unconventional projects previously regarded as being too expensive become economically attractive.
Meanwhile, conventional resources’ signs of depletion become more pronounced. As a result of the
high prices, OFS companies margins are restored to health.
‘Vigorous Growth’ from 2026 till 2045
The oil market is now feeling the effects of project postponement from the bad-old-times when oil
prices were low. Due to the relatively lengthy setup time of oil projects, oil production appears to be
slowing down despite increasing demand. In other words, oil companies are unable to scale up their
production capabilities fast enough. Consequently, during the 5-year time stretches in this period,
total production growth never exceeds 2%. Nevertheless, because of the growing gap between
demand and supply, oil prices continue their upward climb. Times are good and oil companies scurry
to mine unconventionals.
‘Growth slowdown’ from 2046 till 2056
High oil prices and supply shortages have changed preferences. It is now green renewables rather
than black oil that are fashionable. Past years consistently high oil prices encouraged further
investments in renewables’ R&D. As a result of ensuing technological improvements, renewables no
longer need government aid to be economically competitive. Backed up by the strong international
desire to go green, renewables are now steadily supplanting fossil fuels in the energy market.
‘Decline’ from 2057 (terminal period)
Alternatives are substituting fossil fuels at racing speeds. The oil market is quickly shrinking and oil
production is decreasing.
4.3.1. Sustainable growth rate
When a company’s growth ambitions exceed the ability of their core business/businesses to generate
cash, “it can issue shares, increase financial leverage (borrow) or reduce dividends payments.
Alternatively, a firm may reduce its ambitions and adjust its strategy to reflect the firm’s financial
capacity”. [8, p.128] Thus, the sustainable growth rate represents the maximum rate at which a
company can grow without additional borrowing. In other words, it is growth that allows for the
company’s risk profile to remain unaltered (i.e. sustained).
In good years (2011-2014), Welltec’s sustainable growth rate was, according to financial statements
adjusted for non-recurring items, 6,1%. In 2012, Welltec, intriguingly, dished out dividends that
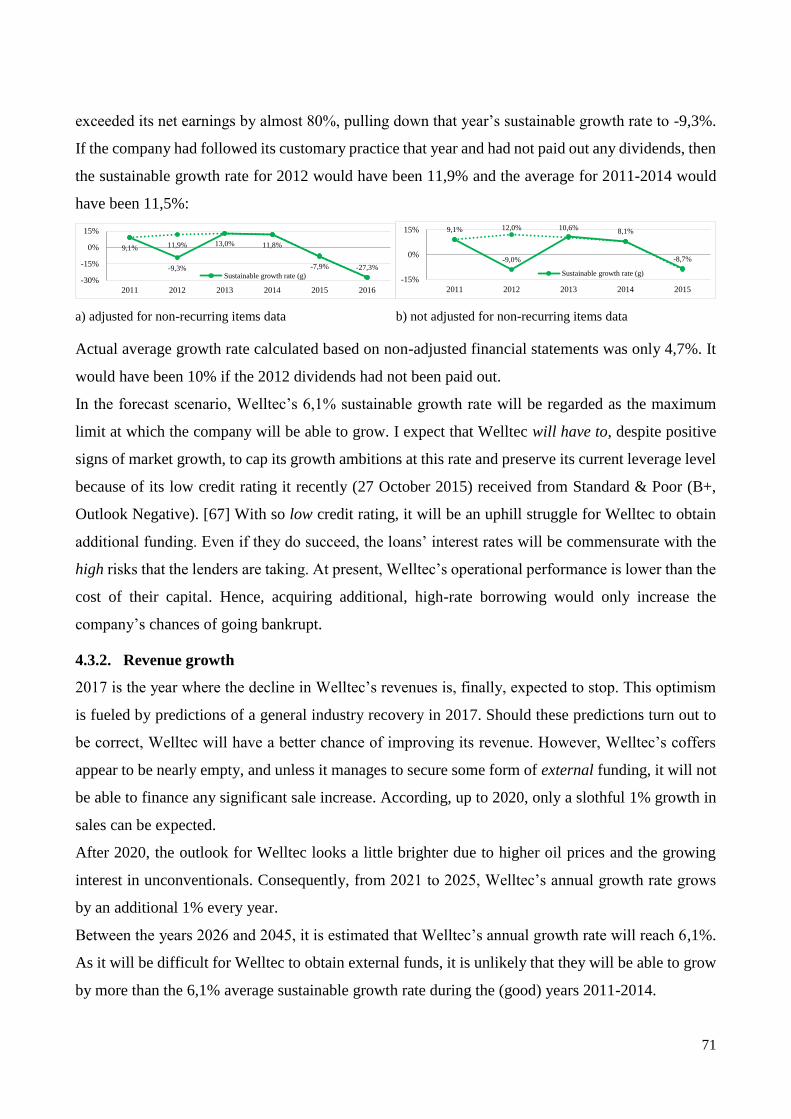
71
exceeded its net earnings by almost 80%, pulling down that year’s sustainable growth rate to -9,3%.
If the company had followed its customary practice that year and had not paid out any dividends, then
the sustainable growth rate for 2012 would have been 11,9% and the average for 2011-2014 would
have been 11,5%:
a) adjusted for non-recurring items data b) not adjusted for non-recurring items data
Actual average growth rate calculated based on non-adjusted financial statements was only 4,7%. It
would have been 10% if the 2012 dividends had not been paid out.
In the forecast scenario, Welltec’s 6,1% sustainable growth rate will be regarded as the maximum
limit at which the company will be able to grow. I expect that Welltec will have to, despite positive
signs of market growth, to cap its growth ambitions at this rate and preserve its current leverage level
because of its low credit rating it recently (27 October 2015) received from Standard & Poor (B+,
Outlook Negative). [67] With so low credit rating, it will be an uphill struggle for Welltec to obtain
additional funding. Even if they do succeed, the loans’ interest rates will be commensurate with the
high risks that the lenders are taking. At present, Welltec’s operational performance is lower than the
cost of their capital. Hence, acquiring additional, high-rate borrowing would only increase the
company’s chances of going bankrupt.
4.3.2. Revenue growth
2017 is the year where the decline in Welltec’s revenues is, finally, expected to stop. This optimism
is fueled by predictions of a general industry recovery in 2017. Should these predictions turn out to
be correct, Welltec will have a better chance of improving its revenue. However, Welltec’s coffers
appear to be nearly empty, and unless it manages to secure some form of external funding, it will not
be able to finance any significant sale increase. According, up to 2020, only a slothful 1% growth in
sales can be expected.
After 2020, the outlook for Welltec looks a little brighter due to higher oil prices and the growing
interest in unconventionals. Consequently, from 2021 to 2025, Welltec’s annual growth rate grows
by an additional 1% every year.
Between the years 2026 and 2045, it is estimated that Welltec’s annual growth rate will reach 6,1%.
As it will be difficult for Welltec to obtain external funds, it is unlikely that they will be able to grow
by more than the 6,1% average sustainable growth rate during the (good) years 2011-2014.
9,1%
-9,3%
13,0% 11,8%
-7,9% -27,3%
11,9%
-30%
-15%
0%
15%
2011 2012 2013 2014 2015 2016
Sustainable growth rate (g)
9,1%
-9,0%
10,6%8,1%
-8,7%
12,0%
-15%
0%
15%
2011 2012 2013 2014 2015
Sustainable growth rate (g)

72
In the 10 years following 2046, renewables start replacing fossil fuels at rapid speed. As a result,
Welltec’s revenue growth drops by 0,5% each year.
From 2057, Welltec enters its ‘terminal period’ with revenue declining (not growing) -0,5% each
year.
4.3.3. EBITDA-margin
In good years (2011-2014), Welltec’s EBITDA-margin averaged 46,1%. In 2015, when oil prices
started falling, Welltec’s EBITDA-margin followed, dropping to 37,2%. In 2016, with rock-bottom
oil prices, Welltec’s EBITDA-margin is expected to continue its downward descend, hitting a new
low of 33,8%. In 2017, an improvement in EBITDA-margin back to the level of 2015 is expected.
This is understandable, since oil prices, in 2017, are only expected to improve slightly. After 2017,
with oil prices improving and Welltec starting to reap the benefits of its 2015/2016 restructurings,
EBITDA-margin is expected to grow 2,2% each year, reaching 39,7% in 2020, which is still far from
what it was in 2011-2014. From 2021-2025, EBITDA-margin, galvanized by high oil prices, is
expected to grow 3% each year, reaching 46,1% in 2025, which is the same as the average in the good
old years of 2011-2014. Welltec is expected to maintain its 46,1% EBITDA-margin until the end of
budgeted period. In terminal period, with revenues declining, a 44,3% EBITDA-margin is estimated,
which equals historical average for 2011-2015.
4.3.4. Effective tax rate
From 2011-2014, the effective tax rate fluctuates between 33,3 and 39%. The average effective tax
rate for the same period is 36,9%. This average rate will be used in estimating operating tax
throughout the forecast.
4.3.5. Danish corporation tax rate
Danish corporation tax rate was decreasing over observed period and reached 22% in 2017. I will
estimate tax shield using 22% Danish corporation tax rate in both budgeting and terminal periods.
4.3.6. Amortization as a percentage of intangible assets
Amortization as a percentage of intangible assets varied between 7 and 9,6%. In 2015, amortization
was 8,4% of intangible assets, which is close to average amortization for 2013-2015 (8,3%). In my
forecast, I am applying the latest observed value (8,4%) to estimate amortization for the full period.
4.3.7. Depreciation as a percentage of tangible assets
From 2013 to 2015, depreciation as a percentage of intangible assets dropped from 30,8 to 26,1%.
Considering this decreasing trend, I use 26,1% to forecast depreciation expenses for all periods.

73
4.3.8. Intangible assets as a percentage of revenue
As was highlighted in 4.2.6., the level of intangible assets is almost constant, because they are mainly
comprised of goodwill and brand, which are not amortized. Because of falling revenues, the ratio of
intangible assets to revenue is increasing. However, from 2017 onwards, revenues are expected to
increase. As a result, I am not able to use historical data to predict current and future levels of
intangible assets. As an alternative, I use the level and trend of additional investments in intangible
assets to estimate the level of intangible assets in 2017 and onwards.
Beginning from 2015, the level of investments in intangible assets falls dramatically, -50% in 2015
and -37% in 2016. For 2017, I estimate the level of investments in intangible assets to be 73% of what
it was in 2016, corresponding to a 167,5% intangible assets to revenue ratio, which is 6,8% less than
the ratio for 2016. In the future, due to Welltec’s constrained finances, I forecast a very modest
increase in investments in intangibles. However, growth in revenue will outpace future investments
in intangibles, because intangibles are mostly goodwill and acquired intangible assets, and they will
not grow over. On the contrary, some of the intangible items will be amortized. Despite this, from
2017 to 2020, ‘intangible assets as a percentage of revenue’ is expected to fall more than 6% each
year, from 2021 to 2025, to fall 6% each year, and from 2026 and onwards, to fall 3,5% each year.
On the other hands, in the future, the level of investments in intangibles will be gradually increasing.
4.3.9. Tangible assets as a percentage of revenue
When Welltec’s revenues start falling, so do its tangible assets, nevertheless, at a slower pace. Also,
in upcoming years, a reversal in Welltec’s revenue trend is expected. The historical ‘tangible assets
as a percentage of revenue’ cannot be used in estimating the first year’s tangible assets. Therefore, to
estimate tangible assets, I use the same approach as the one I used to estimate intangibles.
Since 2015, investments in tangible assets have fallen 40%. Revenue level is expected to change in
2017, slowing down the fall in ‘investments in tangible assets’. Accordingly, for 2017, I forecast
‘investments in tangible assets’ to be 82% of their value in 2016, corresponding to 52% tangible
assets to revenue ratio (16% less than in 2016). In the future, a slow growth in the level of investments
in tangible assets is projected. At the same time, a steady -2% yearly decrease in the tangible assets
to revenue ratio is expected until 2025, where it will henceforth stabilize at 28,8%.
4.3.10. Inventory as a percentage of revenue
Every year, ‘inventory as a percentage of revenue’ increases, 1,0% in 2014, 1,8% in 2015, and in
2016, it is estimated to be 2,7%. This, unfortunate development, was caused by post-2014 falling
revenues, and a sharp increase in the level of inventories in the early months of 2015, which has not

74
fallen back to a more regular level since. Thus, as would be the case in most businesses, when sales
drop, more of what is being sold or used in production will remain behind in the company’s warehouse.
In short, ‘inventory as a percentage of revenue’ is highly dependent on revenue’s behaviour. I estimate
‘inventory as a percentage of revenue’ to be equal to its most recently observed level, 1,8% as in 2015.
From 2018 to 2020, as revenues start to increase, I estimate that ‘inventory as a percentage of revenue’
will decrease by a steady 0,3% each year. Thus, beginning from a level of 1,5% in 2018, I forecast
that ‘inventory as a percentage of revenue’ drops to 0,9% by 2020. In addition to revenues picking
up, after the two very lean years of 2015 and 2016, Welltec’s financial resources are, as one may
expect, close to being depleted. As a result, it is highly unlikely, that Welltec will use much of its
resources in building up new surplus inventories. From 2021-2025, the decrease in ‘inventory as a
percentage of revenue’ is expected to continue, but at a far slower speed than previously, reaching its
lowermost level of 0,7% in 2025. From 2026 and onwards, ‘inventory as a percentage of revenue’ to
stabilize at 0,7%.
4.3.11. Receivables as a percentage of revenue
Receivables as a percentage of revenue fluctuate between 33,9% and 29,9%, but overall have a
decreasing trend. Therefore, in 2017 receivables are estimated based on the latest observed percentage,
29,9% in 2015. From 2018 receivable to revenue ratio is expected to decline by 0,5% each year until
2025, where it will henceforth stabilize at 25,9%.
4.3.12. Non-interest bearing debt as a percentage of revenue
In 2012, ‘non-interest bearing debt as a percentage of revenue’ was 40%, then dropped to 30% in
2013, rose steadily in 2014 and 2015, and is estimated to reach 34,3% in 2016. As 2017 is a rather
sluggish year, I will estimate that the level of operating liabilities (non-interest bearing debt) will
remain the same as what it was in when last observed, 34,6% in 2015. Although revenues, in
upcoming years, are expected to improve, the bad years have almost certainly dried out Welltec’s
funds. Since Welltec does not seem to have the opportunity to replenish its depleted funds at an
affordable cost, operating liabilities might serve as temporary surrogate funding, helping Welltec to
overcome its liquidity squeeze. Therefore, from 2017 to 2020, I expect a minute 1% increase ‘non-
interest bearing debt as a percentage of revenue’, from 34,6% in 2017 to 35,7 in 2020. From 2021 to
2025, I forecast an even smaller increase of just 0,5%, from 35,9% in 2021 to 36,6% in 2025. From
2026, Welltec enters its ‘Vigorous Growth’ stage and will be able to fund revenue growth from
internally generated cash. As a result, I estimate that the level of ‘non-interest bearing debt as a
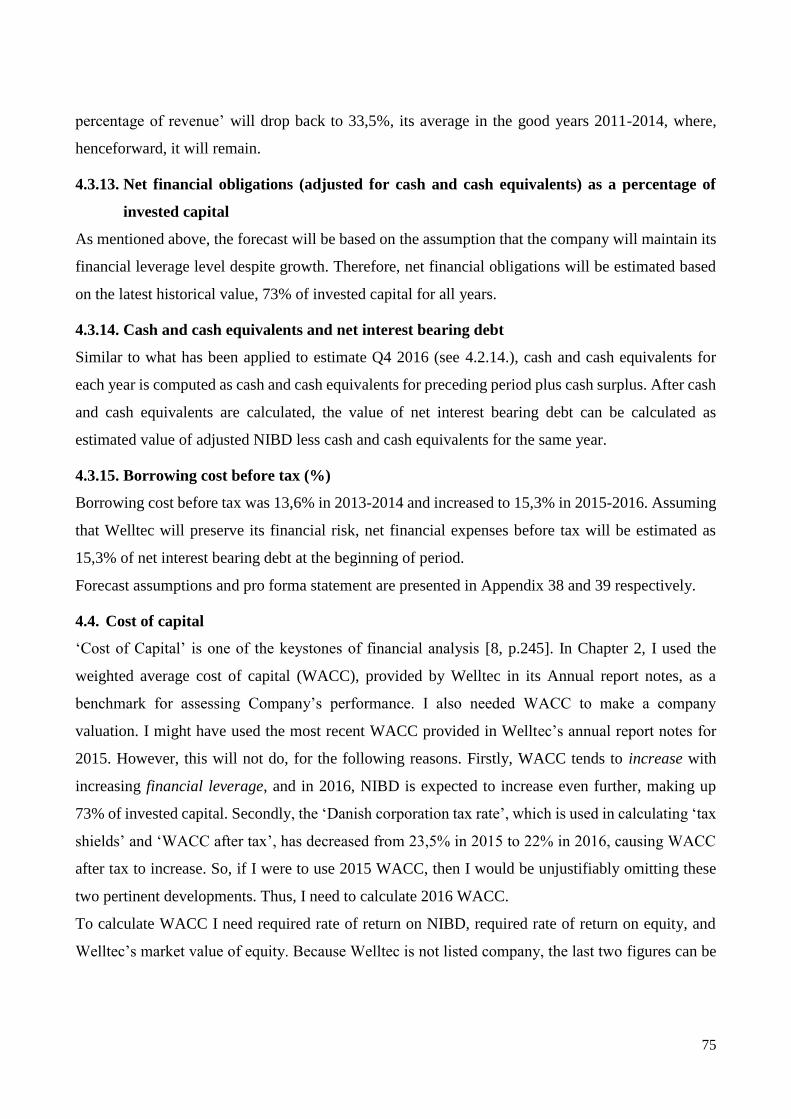
75
percentage of revenue’ will drop back to 33,5%, its average in the good years 2011-2014, where,
henceforward, it will remain.
4.3.13. Net financial obligations (adjusted for cash and cash equivalents) as a percentage of
invested capital
As mentioned above, the forecast will be based on the assumption that the company will maintain its
financial leverage level despite growth. Therefore, net financial obligations will be estimated based
on the latest historical value, 73% of invested capital for all years.
4.3.14. Cash and cash equivalents and net interest bearing debt
Similar to what has been applied to estimate Q4 2016 (see 4.2.14.), cash and cash equivalents for
each year is computed as cash and cash equivalents for preceding period plus cash surplus. After cash
and cash equivalents are calculated, the value of net interest bearing debt can be calculated as
estimated value of adjusted NIBD less cash and cash equivalents for the same year.
4.3.15. Borrowing cost before tax (%)
Borrowing cost before tax was 13,6% in 2013-2014 and increased to 15,3% in 2015-2016. Assuming
that Welltec will preserve its financial risk, net financial expenses before tax will be estimated as
15,3% of net interest bearing debt at the beginning of period.
Forecast assumptions and pro forma statement are presented in Appendix 38 and 39 respectively.
4.4. Cost of capital
‘Cost of Capital’ is one of the keystones of financial analysis [8, p.245]. In Chapter 2, I used the
weighted average cost of capital (WACC), provided by Welltec in its Annual report notes, as a
benchmark for assessing Company’s performance. I also needed WACC to make a company
valuation. I might have used the most recent WACC provided in Welltec’s annual report notes for
2015. However, this will not do, for the following reasons. Firstly, WACC tends to increase with
increasing financial leverage, and in 2016, NIBD is expected to increase even further, making up
73% of invested capital. Secondly, the ‘Danish corporation tax rate’, which is used in calculating ‘tax
shields’ and ‘WACC after tax’, has decreased from 23,5% in 2015 to 22% in 2016, causing WACC
after tax to increase. So, if I were to use 2015 WACC, then I would be unjustifiably omitting these
two pertinent developments. Thus, I need to calculate 2016 WACC.
To calculate WACC I need required rate of return on NIBD, required rate of return on equity, and
Welltec’s market value of equity. Because Welltec is not listed company, the last two figures can be

76
estimated based on comparable listed companies (peer group). The description of defining the peer
group is provided in Appendix 40.
The first step is to estimate βe from comparable companies:
βe is estimated for each comparable company by calculating the covariance of the return of an
asset and the return of the benchmark divided by the variance of the return of the benchmark over
last 5 years (from 1 January 2011 till 30 December 2016). Both the return of the asset and of the
benchmark is calculated based on data obtained from Yahoo!Finance:
Peer Group Benchmark βe Share
price*
Outstanding
shares**
MVE, in
mln*
Outstanding
debt, in mln*
Debt/
Equity βd βa
Book
Value Per
Share*
MVE/
BVE
Aker Solutions OSEAX 1,57 41,37 271,53 11.233,2 3950,0 0,35 0 1,16 23,12 1,79
Helix Energy Solutions Group S&P 500 1,97 8,82 147,66 1.302,4 626,7 0,48 0 1,33 10,63 0,83
Calfrac Well Services TSX
Composite
index
2,18 4,76 136,48 649,7 986,9 1,52 0 0,87 3,73 1,28
Trican Well Service 2,16 4,60 193,54 890,3 222,3 0,25 0 1,73 2,94 1,56
Average 1,27 1,36
* Expressed in local currency at 30 December 2016
** Outstanding shares in millions at the end of 2016
Assuming that market value of debt is equal to its book value, I will use book value of debt to
calculate Debt/Equity ratio for comparable companies. Market value of equity is calculated as
share price at 30 December 2016 multiplied by number of outstanding shares.
βd for comparable companies are equal to ZERO as their debt is not traded. Unlevered β (βa) for
each comparable company is calculated using their βe, βd and Debt/Equity ratio.
The calculation is provided in the following table:
Welltec estimated βa 1,27 The average of unlevered βs is used as a proxy for Welltec βa
Welltec βd 0,00 As Welltec withdraw the bond from Luxemburg stock exchange, Welltec βd is equal
to ZERO
Welltec NIBD
(market value),
kUSD
286.92
3
According to Welltec Annual report 2015, market value of Bond (which constitutes
for 90% of NIBD) was close to its book value. Hence, I will assume that market value
of NIBD is equal to its book value
Welltec BVE, kUSD 173.23
4 Welltec’s market value of equity is defined based on
BVE
MVE multiple calculated for
comparable companies at the end of the 2016 and its estimated book value of equity
at the end of 2016
MVE/BVE (Helix
Energy Solutions) 0,83
Welltec MVE, kUSD 143.73
7
Welltec Debt/Equity 2,00
Welltec βe 3,81 MVE
NIBDdaae [8, p.255]
The next step is to estimate the investors’ required rate of return (re) using Capital Asset Pricing
Model (CAPM) model:
Risk-free rate rf 2,38% The yield for USA 10-year Zero coupon (end of period, USD) was used as a proxy
[74]
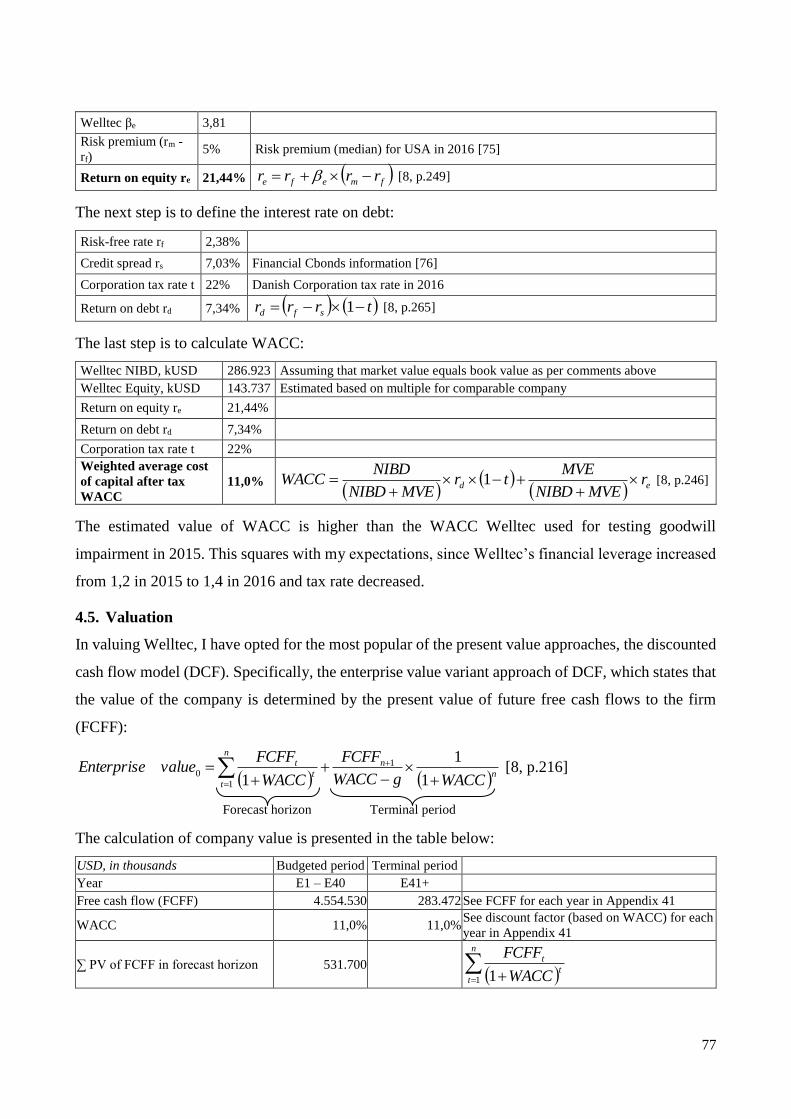
77
Welltec βe 3,81
Risk premium (rm -
rf) 5% Risk premium (median) for USA in 2016 [75]
Return on equity re 21,44% fmefe rrrr [8, p.249]
The next step is to define the interest rate on debt:
Risk-free rate rf 2,38%
Credit spread rs 7,03% Financial Cbonds information [76]
Corporation tax rate t 22% Danish Corporation tax rate in 2016
Return on debt rd 7,34% trrr sfd 1 [8, p.265]
The last step is to calculate WACC:
Welltec NIBD, kUSD 286.923 Assuming that market value equals book value as per comments above
Welltec Equity, kUSD 143.737 Estimated based on multiple for comparable company
Return on equity re 21,44%
Return on debt rd 7,34%
Corporation tax rate t 22%
Weighted average cost
of capital after tax
WACC
11,0%
ed r
MVENIBD
MVEtr
MVENIBD
NIBDWACC
1 [8, p.246]
The estimated value of WACC is higher than the WACC Welltec used for testing goodwill
impairment in 2015. This squares with my expectations, since Welltec’s financial leverage increased
from 1,2 in 2015 to 1,4 in 2016 and tax rate decreased.
4.5. Valuation
In valuing Welltec, I have opted for the most popular of the present value approaches, the discounted
cash flow model (DCF). Specifically, the enterprise value variant approach of DCF, which states that
the value of the company is determined by the present value of future free cash flows to the firm
(FCFF):
nn
n
tt
t
WACCgWACC
FCFF
WACC
FCFFvalueEnterprise
1
1
1
1
1
0 [8, p.216]
The calculation of company value is presented in the table below:
USD, in thousands Budgeted period Terminal period
Year E1 – E40 E41+
Free cash flow (FCFF) 4.554.530 283.472 See FCFF for each year in Appendix 41
WACC 11,0% 11,0% See discount factor (based on WACC) for each
year in Appendix 41
∑ PV of FCFF in forecast horizon 531.700
n
tt
t
WACC
FCFF
1 1
Forecast horizon Terminal period

78
The long-term growth rate (g) -0,5%
PV of FCFF in terminal period 37.922 n
n
WACCgWACC
FCFF
1
11
Estimated enterprise value 569.622 Sum of PV of FCFF in budgeted and terminal
period; USD in thousands
LESS: NIBD -460.158 NIBD at the end of 2016; USD in thousands
Estimated market value of equity 109.464 USD in thousands
As the budgeted period is 40 years, it would be impractical to present FCFF, discount factor, and the
present value (PV) of FCFF for each year in the main body of the thesis. Therefore, for detailed
calculations, I refer the reader to Appendix 41.
Estimated market value of company is $569.622 thousand. By subtracting NIBD at the end of 2016,
I get an estimated market value of equity equal to $109.464 thousand, which is 63% of its book value.
Estimated value calculated using DCF and EVA model (for detailed calculation under EVA model, I
refer the reader to Appendix 42), as expected, give very similar results. Market value of equity
estimated using EVA model is slightly lower ($104.356 thousand equal to 60% of book value).
For both Welltec and its closest comparable company Helix Energy Solutions Group the market value
of equity is priced lower than its book value. However, Welltec’s BVE
MVE is lower.
4.6. Sensitivity analysis
A valuation should always be accompanied by a sensitivity analysis that examines the valuation
consequences of changing some of the key value drivers. [8, p.241] Below I present the impact of
Welltec equity value estimate by changing the growth rate and the EBITDA-margin by +/- 1,0
percentage point:
kUSD Growth rate % Growth rate -1,0% 0,0% +1,0%
-1,0% 0,0% +1,0%
EB
ITD
A
-ma
rgin
-1,0% 99.357 101.775 104.224
EB
ITD
A
-ma
rgin
-1,0% 91% 93% 95%
0,0% 106.997 109.464 111.962 0,0% 98% 100% 102%
+1,0% 114.638 117.153 119.701 +1,0% 105% 107% 109%
As can be seen in the above tables, the value estimate is sensitive to both changes in the growth rate
and the EBITDA-margin. However, when it comes to bolstering Welltec’s value, improving its
EBITDA-margins has a much more potent effect compared with increasing its growth rates. Thus,
we see that changing EBITDA-margin by +1 percentage point vs. ‘Base case’ (highlighted in yellow)
increases Welltec equity value by 9%. On the other hand, changing revenue growth by +1 percentage
point increases Welltec equity value by only 2%. This squares with the insights from the profitability
analysis, showing that profitability was low, and that Welltec should therefore primary concern itself
with improving its profitability rather than any market expansionism plans.
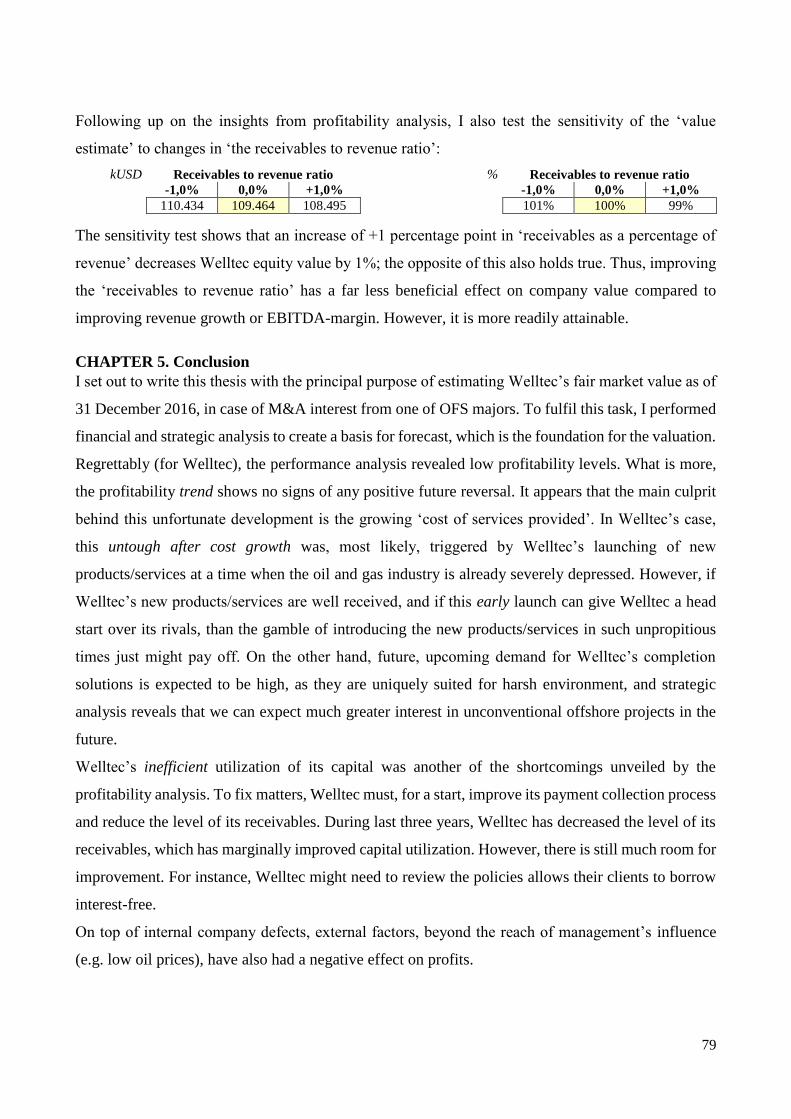
79
Following up on the insights from profitability analysis, I also test the sensitivity of the ‘value
estimate’ to changes in ‘the receivables to revenue ratio’:
kUSD Receivables to revenue ratio % Receivables to revenue ratio -1,0% 0,0% +1,0% -1,0% 0,0% +1,0% 110.434 109.464 108.495 101% 100% 99%
The sensitivity test shows that an increase of +1 percentage point in ‘receivables as a percentage of
revenue’ decreases Welltec equity value by 1%; the opposite of this also holds true. Thus, improving
the ‘receivables to revenue ratio’ has a far less beneficial effect on company value compared to
improving revenue growth or EBITDA-margin. However, it is more readily attainable.
CHAPTER 5. Conclusion
I set out to write this thesis with the principal purpose of estimating Welltec’s fair market value as of
31 December 2016, in case of M&A interest from one of OFS majors. To fulfil this task, I performed
financial and strategic analysis to create a basis for forecast, which is the foundation for the valuation.
Regrettably (for Welltec), the performance analysis revealed low profitability levels. What is more,
the profitability trend shows no signs of any positive future reversal. It appears that the main culprit
behind this unfortunate development is the growing ‘cost of services provided’. In Welltec’s case,
this untough after cost growth was, most likely, triggered by Welltec’s launching of new
products/services at a time when the oil and gas industry is already severely depressed. However, if
Welltec’s new products/services are well received, and if this early launch can give Welltec a head
start over its rivals, than the gamble of introducing the new products/services in such unpropitious
times just might pay off. On the other hand, future, upcoming demand for Welltec’s completion
solutions is expected to be high, as they are uniquely suited for harsh environment, and strategic
analysis reveals that we can expect much greater interest in unconventional offshore projects in the
future.
Welltec’s inefficient utilization of its capital was another of the shortcomings unveiled by the
profitability analysis. To fix matters, Welltec must, for a start, improve its payment collection process
and reduce the level of its receivables. During last three years, Welltec has decreased the level of its
receivables, which has marginally improved capital utilization. However, there is still much room for
improvement. For instance, Welltec might need to review the policies allows their clients to borrow
interest-free.
On top of internal company defects, external factors, beyond the reach of management’s influence
(e.g. low oil prices), have also had a negative effect on profits.

80
Currently, Welltec’s finances are in a bad shape. Nevertheless, Welltec has a genuine chance of
rebounding once oil prices recover. Whether or not it will be able to capitalize on this opportunity is
another question.
The strategic analysis foresees a growing demand for equipment designed to work unconventional
wells and rising oil prices, which is good news for Welltec. The flipside of the coin is that alternative
energy sources’ infiltration of the energy market is gaining traction.
The forecast prepared reflects prevailing professional concerns over these developments.
The forecast is split into stages of unequal length. In the first four years of this forecast (‘Early
Convalescence’), oil prices show signs of improvement, but they are still very low. Consequently, no
substantial improvements in Welltec’s revenue figures can be expected. Nevertheless, they can strive
to enhance the effectiveness of their internal process in preparation for the predicted upcoming
upsurge in demand. During the next five years (‘Leaving the Sickbed’), Welltec’s revenue growth
begins to pick up speed, markedly improving profitability and bringing back to average level attained
during the good years of 2012 to 2014.
In the third stage (‘Vigorous Growth’), which is projected to last for 20 years, Welltec steps into a
lengthy period of strong Growth, fuelled by depleting conventional resources and a growing demand
for services specifically tailored for unconventionals.
A point worth noting is that the oil and gas industry is a cyclical industry, where both oil production
and oil prices fluctuate. However, the professionals from BP and IEA preparing the scenarios, have
accounted for this fact by averaging out the figures. Nevertheless, Welltec has a history of not being
able to cope well with low oil prices. Hence, Welltec will not be able to ride out these periods of low
prices, unless it addresses the deficiencies in its internal processes.
Sadly, all good things (and bad) eventually end, and so will this prolonged third stage of ‘Vigorous
Growth’. This happens when renewable energy sources’ substitution of fossil fuels accelerates, and
companies’ interest in developing unconventionals start to sag. As a result, ten years after the
‘Vigorous Growth’ stage, Welltec enters its terminal period, slowly drifting towards the inevitable
end.
Under the abovementioned assumptions and forecast, the company value is estimated to be $569.622
thousand and market value of equity to be $109.464 thousand. Estimated market value of equity is
equal to 63% of book value. This value estimate is compared to an EVA model valuation and a
multiple valuation (however, only a single company was deemed to be comparable to Welltec), in
order to check the reliability of the result obtained from the DCF model.

81
In addition, the valuation was accompanied by a sensitivity analysis that revealed value estimate is
sensitive to changes in some of the key value drivers, especially to changes in EBITDA-margin.
Improving the EBITDA-margin has a much more potent effect compared with increasing the growth
rates. Thus, we see that changing EBITDA-margin by +1 percentage point increases Welltec equity
value by 9%. On the other hand, changing revenue growth by +1 percentage point increases Welltec
equity value by only 2%. This squares with the insights from the profitability analysis, showing that
profitability is low, and that Welltec should therefore primary concern itself with improving its
profitability rather than any market expansionism plans.
Additionally, testing the sensitivity of the value estimate to changes in the net working capital value
driver (receivables to revenue ratio) confirmed the insights from profitability analysis about the
company needing to improve its internal policies and processes, which would improve the company’s
profitability and increase its value.
In conclusion, the estimated Welltec value is the result of the author’s interpretation of the
information generated by the strategic and profitability analysis. Turbulent times bring a lot of
uncertainty to a valuation. The only thing that is certain these days is that for the oil and gas industry
business is not as usual, and no company can afford let go of the controls and switch to autopilot.
Turbulent times open up for new opportunities as well as new threats. Welltec is not an idle observer
of the developments taking place, and is responding to market changes. However, only time can tell
if their responses will prove to be successful (or even very successful).
It is also important to highlight that for the purpose of M&A the estimated value could be used as a
starting point in defining the price of acquisition. The forecast, which was the basis for the valuation,
was prepared using very moderate figures/assumptions (neither too pessimistic nor too optimistic).
At the same time, the analysis revealed that there existed good opportunities for bolstering the
company’s value if internal policies and processes were improved. Armed with such a plan for
improvement, the potential buyer would stand a good chance of profiting from his purchase. More so,
if potential benefits from synergies and economies of scale are factored into his reckoning.

82
Bibliography
[1] J. J. Wild, K. Subramanyam and R. F. Halsey, Financial statement analysis, 9th ed., New
York: McGraw-Hill, 2007.
[2] D. J. Whiteley, R. D. Pourciau and B. J. Schwanitz, "Case History: Designing and
Implementing Wireline Tractor Operations for Deepwater, Extended-Reach Sand-Control
Initial Completions and Interventions," SPE, 2005. [Online]. Available: from
https://www.onepetro.org/conference-paper/SPE-96093-
MS?sort=&start=0&q=SPE+96093%3A+CASE+HISTORY%3A+DESIGNING+AND+IMP
LEMENTING+WIRELINE+TRACTORING+APPLICATIONS+FOR+DEEPWATER%2C
+EXTENDED-REACH%2C+SAND-
CONTROL+COMPLETIONS%2C+AND+INTERVENTIONS&from_year. [Accessed 4
February 2017].
[3] J. Sullivan, "10 Everyday Things That Started Life As Oil," 23 December 2012. [Online].
Available: http://listverse.com/2012/12/23/10-everyday-things-that-started-life-as-oil/.
[Accessed 22 September 2016].
[4] B. Sidle, "Technology Update: Flexible, Single-Skin Completion Concept Meets Well
Integrity, Zonal Isolation Needs," SPE, November 2015. [Online]. Available:
https://www.onepetro.org/journal-paper/SPE-1115-0032-JPT?sort=&start=0&q=FLEX-
WELL+welltec&from_year=&peer_reviewed=&published_between=&fromSearchResults=t
rue&to_year=&rows=10#. [Accessed 4 February 2017].
[5] A. Shuen, P. F. Feiler and D. J. Teece, "Dynamic capabilities in the upstream oil and gas
sector: Managing next generation competition," Energy Strategy Reviews, vol. 3, pp. 5-13,
2014.
[6] C. Sanati, "Iran's Return to the Global Oil Market Is No Cause for Panic," 20 January 2016.
[Online]. Available: http://fortune.com/2016/01/20/iran-oil-prices-sanctions/. [Accessed 23
October 2016].
[7] T. Saelensminde, H. Schjott, H. Koldal, T. Skeie and T. Meberg, "Zonal Isolation in a U-
shaped Well using Coiled Tubing and Well Tractor®," SPE, 2004. [Online]. Available:
https://www.onepetro.org/conference-paper/SPE-89522-
MS?sort=&start=0&q=SPE+68887%3A+NEW+COILED+TUBING+WELL+TRACTOR+E

83
XTENDS+LATERAL+REACH&from_year=&peer_reviewed=&published_between=&fro
mSearchResults=true&to_year=&rows=10#. [Accessed 4 February 2017].
[8] C. V. Petersen and T. Plenborg, Financial Statement Analysis : valuation, credit analysis and
executive compensation, Harlow: Pearson, 2012.
[9] K. G. Palepu and P. M. Healy, Business Analysis and Valuation Using Financial Statements,
5th ed., South-Western, 2013.
[10] R. L. Moore and M. Springer, "Oilfield Services and Equipment Industry Transaction
Trends," 2014. [Online]. Available: http://www.srr.com/assets/pdf/oilfield-services-and-
equipment-industry-transaction-trends.pdf. [Accessed 15 September 2016].
[11] J. Mitchell, M. Valérie and B. Mitchell, "What Next for the Oil and Gas Industry?," October
2012. [Online]. Available:
https://www.chathamhouse.org/sites/files/chathamhouse/public/Research/Energy,%20Enviro
nment%20and%20Development/1012pr_oilgas.pdf. [Accessed 9 October 2016].
[12] A. Mene, "The Gulf of Mexico oil spill: consequences for the oil and gas industry," Practical
Law. A Thomson Reuters Legal Solution, [Online]. Available: http://uk.practicallaw.com/3-
504-7901?service=crossborder. [Accessed 23 November 2016].
[13] P. J. McManners, Corporate strategy in the age of responsibility, Farnham: Gower, 2014.
[14] G. McInally and J. Hallundbaek, "The Application of New Wireline Well TractorR
Technology to Horizontal Well Logging and Intervention: A review of Field Experience in
the North Sea," SPE, 1997. [Online]. Available: https://www.onepetro.org/conference-
paper/SPE-38757-
MS?sort=&start=0&q=SPE+38757%3A+THE+APPLICATION+OF+NEW+WIRELINE+W
ELL+TRACTOR+TECHNOLOGY+TO+HORIZONTAL+WELL+LOGGING+AND+INTE
RVENTION%3A+A+REVIEW+OF+FIELD+EXPERIENCE+IN+THE+NORTH+SEA&fro
m_year=&peer_review. [Accessed 4 February 2017].
[15] A. Malloy and T. Barrett, "Obama to sign Iran sanctions," CNN, 2 December 2016. [Online].
Available: http://edition.cnn.com/2016/12/02/politics/president-obama-iran-sanctions-bill/.
[Accessed 27 December 2016].
[16] J. Levs, "A summary of sanctions against Iran," CNN, 23 January 2012. [Online]. Available:
http://edition.cnn.com/2012/01/23/world/meast/iran-sanctions-facts/. [Accessed 23 October
2016].

84
[17] M. Laws and A. Al Riyami, "World's First Successful Openhole Logging Job with the Well
Tractor Enables Faster and Cheaper Field Developments," SPP, 2001. [Online]. Available:
https://www.onepetro.org/conference-paper/SPE-68080-
MS?sort=&start=0&q=SPE+68080%3A+WORLD%E2%80%99S+FIRST+SUCCESFULL+
OPENHOLE+LOGGING+JOB+WITH+THE+WELL+TRACTOR+ENABLES+FASTER+
AND+CHEAPER+FIELD+DEVELOPMENTS&from_year=&peer_reviewed=&published_
between=&from. [Accessed 4 February 2017].
[18] J. H. Larsen, "Full Year 2011 Results," 2 March 2012. [Online]. Available:
http://www.welltec.com/wp-content/uploads/2014/08/AR_2011_Investor_Presentation.pdf.
[Accessed 20 September 2016].
[19] J. H. Larsen, "2013 Full Year Results," 27 February 2014. [Online]. Available:
http://www.welltec.com/wp-
content/uploads/2014/10/Welltec_Annual_Report_2013_Investor_Presentation.pdf.
[Accessed 20 September 2016].
[20] M. Krabbe, "Welltec® 2015 Full Year Results," 25 February 2016. [Online]. Available:
http://www.welltec.com/wp-content/uploads/2016/02/Welltec-Annual-Report-2015-Investor-
Presentation.pdf. [Accessed 20 September 2016].
[21] T. Koller, M. Goedhart and D. Wessels, Valuation: Measuring and Managing the Value of
Companies, 5th ed., McKinsey & Company Inc., 2010.
[22] K. Katzman, "Iran Sanctions," 21 September 2016. [Online]. Available:
http://www.fas.org/sgp/crs/mideast/RS20871.pdf. [Accessed 23 October 2016].
[23] G. Johnson, A. Kevan, K. Scholes, D. Angwin, P. Regnér and S. Pyle, Exploring strategy,
10th ed., Harlow: Pearson, 2014.
[24] C. Jacinto, L. Nardi, M. Da Silva, M. Marques, P. Esteves, P. Maciel and R. Reves Vasques,
"World's First: Annular Barrier Installed in a Subsea, Deepwater Well without the Use of
Cement," SPE, 2015. [Online]. Available: https://www.onepetro.org/conference-paper/OTC-
26122-
MS?sort=&start=0&q=WELLTEC+ANNULAR+BARRIER+%28WAB%29&from_year=&
peer_reviewed=&published_between=&fromSearchResults=true&to_year=&rows=10#.
[Accessed 4 February 2017].

85
[25] T. Hunter, Ed., Regulation of the Upstream Petroleum Sector: A Comparative Study of
Licensing and Concession Systems (New Horizons in Environmental and Energy Law
Series), Cheltenham: Edward Elgar Publishing Limited, 2015.
[26] S. Haynes, "Supply of energy and resources: its effect on economic and political stability and
the effect of geopolitical issues on such supply," Journal of Energy & Natural Resources
Law, vol. 34, no. 3, pp. 361-368, 2016.
[27] J. Hallundbæk, "Well Tractors For Highly Deviated And Horizontal Wells," SPE, 1994.
[Online]. Available: https://www.onepetro.org/conference-paper/SPE-28871-
MS?sort=&start=0&q=SPE+28871%3A+WELL+TRACTORS+FOR+HIGHLY+DEVIATE
D+AND+HORIZONTAL+WELLS+BACKGROUND&from_year=&peer_reviewed=&publ
ished_between=&fromSearchResults=true&to_year=&rows=10#. [Accessed 4 February
2017].
[28] C. Gobbi, Handouts from ‘Applying Excel models in Operations Management’ class, 2013.
[29] W. N. Garcia, J. Arciniegas, R. Alvarez, B. Valencia, C. Villamizar, M. Goksal, R. Salom
and E. Parra, "Successful Appliction of the Electric Line Tractor Assisted
Logging/Perforating Technology Saved Significant Time and Associated Rig Costs, and Set
Two New Regional Records in Latin America: A Case Study," SPE, 2012. [Online].
Available: https://www.onepetro.org/conference-paper/SPE-159852-
MS?sort=&start=0&q=SPE+159852%3B+SUCCESSFUL+APPLICATION+OF+ELECTRI
C+LINE+TRACTOR+ASSISTED+LOGGING+AND+PERFORATING+TECHNOLOGY+
SAVED+SIGNIFICANT+TIME+AND+ASSOCIATED+RIG+COSTS%2C+AND+SET+T
WO+NEW+REGIONAL+R. [Accessed 4 February 2017].
[30] J. Frankel, "China’s slowdown and the Chinese stock market," 27 January 2016. [Online].
Available: http://voxeu.org/article/china-s-slowdown-and-chinese-stock-market. [Accessed
22 October 2016].
[31] Z. Feng, S.-B. Zhang and Y. Gao, "On oil investment and production: A comparison of
production sharing contracts and buyback contracts," Energy Economics, vol. 42, pp. 395-
402, 2014.
[32] J. R. Drechsler, O. Eikeskog, P. Hazel, R. Vasquez, B. Filev, J. J. Baardsen and O. Hjorteland,
"Qualification and Field Trial of a Metal Expandable Well Annular Barrier," SPE, 2013.
[Online]. Available: https://www.onepetro.org/conference-paper/SPE-163511-
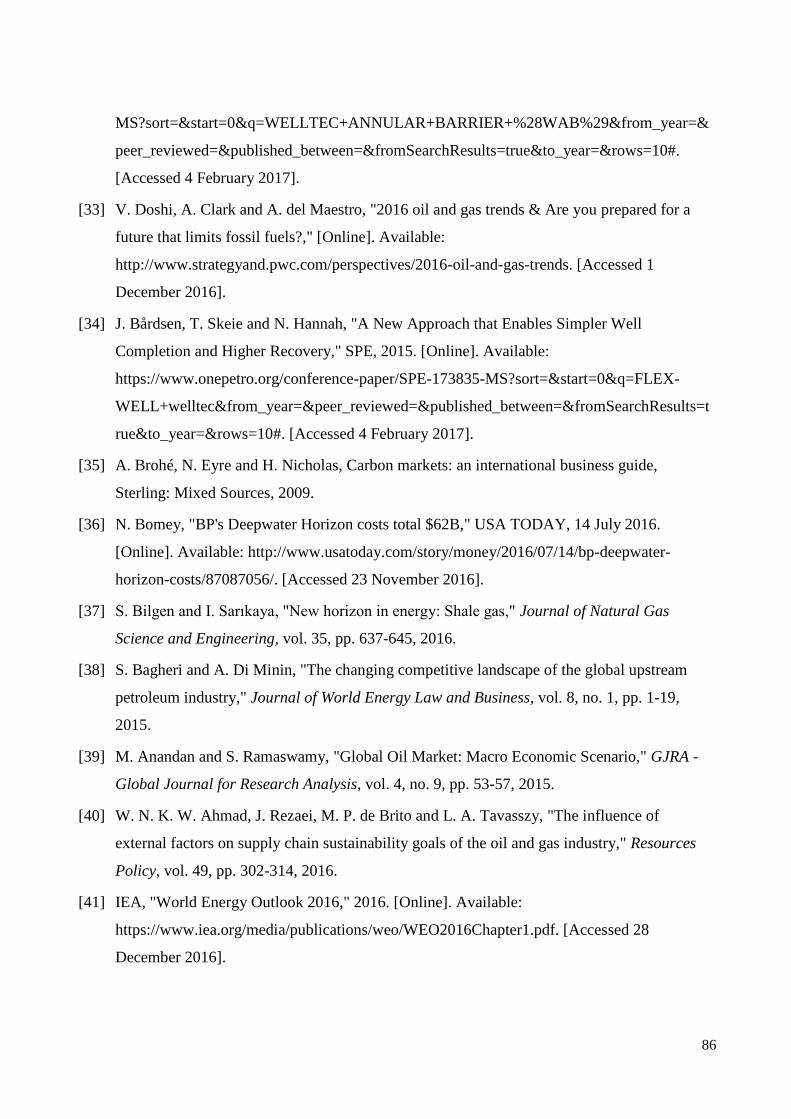
86
MS?sort=&start=0&q=WELLTEC+ANNULAR+BARRIER+%28WAB%29&from_year=&
peer_reviewed=&published_between=&fromSearchResults=true&to_year=&rows=10#.
[Accessed 4 February 2017].
[33] V. Doshi, A. Clark and A. del Maestro, "2016 oil and gas trends & Are you prepared for a
future that limits fossil fuels?," [Online]. Available:
http://www.strategyand.pwc.com/perspectives/2016-oil-and-gas-trends. [Accessed 1
December 2016].
[34] J. Bårdsen, T. Skeie and N. Hannah, "A New Approach that Enables Simpler Well
Completion and Higher Recovery," SPE, 2015. [Online]. Available:
https://www.onepetro.org/conference-paper/SPE-173835-MS?sort=&start=0&q=FLEX-
WELL+welltec&from_year=&peer_reviewed=&published_between=&fromSearchResults=t
rue&to_year=&rows=10#. [Accessed 4 February 2017].
[35] A. Brohé, N. Eyre and H. Nicholas, Carbon markets: an international business guide,
Sterling: Mixed Sources, 2009.
[36] N. Bomey, "BP's Deepwater Horizon costs total $62B," USA TODAY, 14 July 2016.
[Online]. Available: http://www.usatoday.com/story/money/2016/07/14/bp-deepwater-
horizon-costs/87087056/. [Accessed 23 November 2016].
[37] S. Bilgen and I. Sarıkaya, "New horizon in energy: Shale gas," Journal of Natural Gas
Science and Engineering, vol. 35, pp. 637-645, 2016.
[38] S. Bagheri and A. Di Minin, "The changing competitive landscape of the global upstream
petroleum industry," Journal of World Energy Law and Business, vol. 8, no. 1, pp. 1-19,
2015.
[39] M. Anandan and S. Ramaswamy, "Global Oil Market: Macro Economic Scenario," GJRA -
Global Journal for Research Analysis, vol. 4, no. 9, pp. 53-57, 2015.
[40] W. N. K. W. Ahmad, J. Rezaei, M. P. de Brito and L. A. Tavasszy, "The influence of
external factors on supply chain sustainability goals of the oil and gas industry," Resources
Policy, vol. 49, pp. 302-314, 2016.
[41] IEA, "World Energy Outlook 2016," 2016. [Online]. Available:
https://www.iea.org/media/publications/weo/WEO2016Chapter1.pdf. [Accessed 28
December 2016].

87
[42] Welltec, "Withdrawal of securities from the Luxemburg Stock Exchange, EURO MTE
Market," 19 July 2016. [Online]. Available: http://www.welltec.com/news/withdrawal-of-
securities/. [Accessed 30 January 2017].
[43] Welltec, "Welltec® Fellow Brian Schwanitz Receives Technical SPE Award: The Society of
Petroleum Engineers (SPE) Tuesday Honored Mr. Brian Schwanitz with the SPE Production
and Operations Award at Atce in Dubai, UAE," [Online]. Available:
http://www.welltec.com/news/welltec-fellow-brian-schwanitz-receives-technical-spe-award/.
[Accessed 4 February 2017].
[44] KPMG Global Energy Institute, "Unsung workhorses of the oil. Oilfield Services
Companies," 2016. [Online]. Available:
https://assets.kpmg.com/content/dam/kpmg/pdf/2016/03/oilfield-services-companies-unsung-
workhorses-oil-industry.pdf. [Accessed 15 September 2016].
[45] PRNewswire, "Total E&P Congo Purchases Welltec® Annular Barrier (WAB®)," 17
February 2016. [Online]. Available: http://www.oilandgas360.com/total-ep-congo-
purchases-welltec-annular-barrier-wab/. [Accessed 15 October 2016].
[46] "The Industry Handbook: The Oil Services Industry," Investopedia, [Online]. Available:
http://www.investopedia.com/features/industryhandbook/oil_services.asp. [Accessed 25
January 2017].
[47] The Society of Petroleum Engineers, "SPE Announces 2016 International Award Winners,"
28 June 2016. [Online]. Available: http://www.spe.org/news/article/spe-announces-2016-
international-award-winners. [Accessed 4 February 2017].
[48] "Our Mission," Organization of the Petroleum Exporting Countries, [Online]. Available:
http://www.opec.org/opec_web/en/about_us/23.htm. [Accessed 22 October 2016].
[49] Intergovernmental Panel on Climate Change, "Organization," [Online]. Available:
https://www.ipcc.ch/organization/organization.shtml. [Accessed 3 January 2017].
[50] Schlumberger, "Oilfield Glossary ERD," [Online]. Available:
http://www.glossary.oilfield.slb.com/Terms/e/erd.aspx. [Accessed 27 February 2017].
[51] Welltec, "Mechanical solutions," [Online]. Available:
http://www.welltec.com/solutions/mechanical-solutions/. [Accessed 11 September 2016].
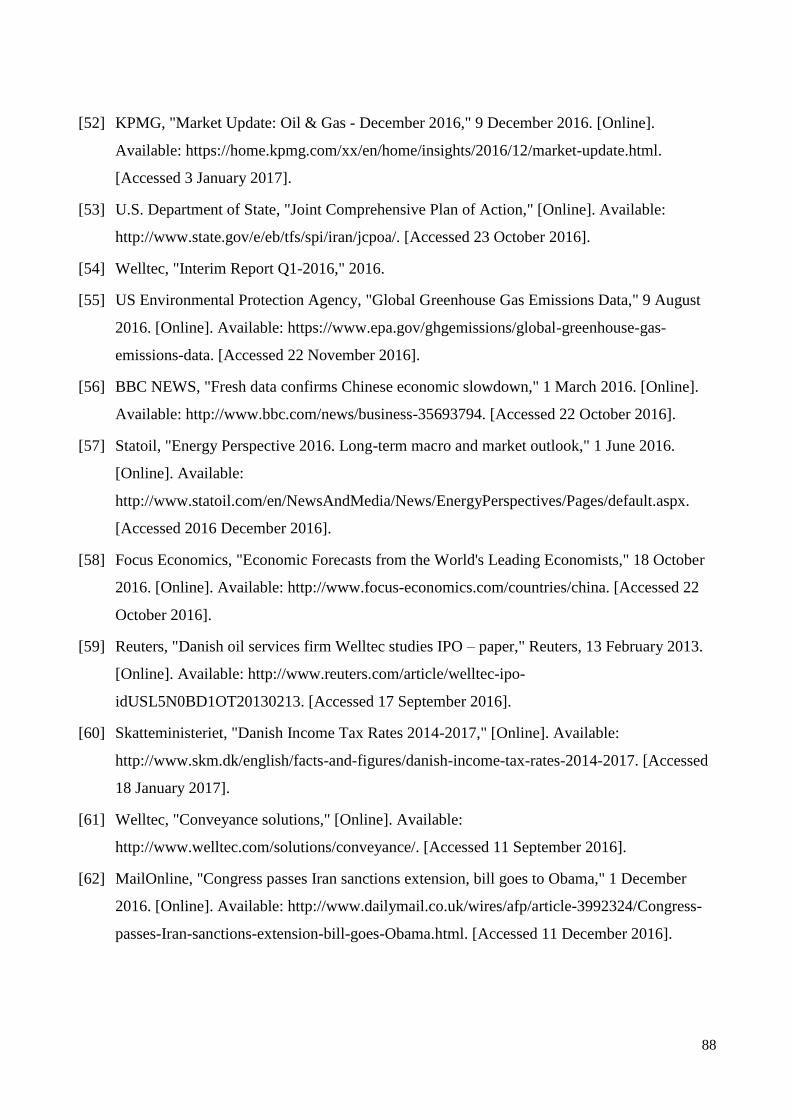
88
[52] KPMG, "Market Update: Oil & Gas - December 2016," 9 December 2016. [Online].
Available: https://home.kpmg.com/xx/en/home/insights/2016/12/market-update.html.
[Accessed 3 January 2017].
[53] U.S. Department of State, "Joint Comprehensive Plan of Action," [Online]. Available:
http://www.state.gov/e/eb/tfs/spi/iran/jcpoa/. [Accessed 23 October 2016].
[54] Welltec, "Interim Report Q1-2016," 2016.
[55] US Environmental Protection Agency, "Global Greenhouse Gas Emissions Data," 9 August
2016. [Online]. Available: https://www.epa.gov/ghgemissions/global-greenhouse-gas-
emissions-data. [Accessed 22 November 2016].
[56] BBC NEWS, "Fresh data confirms Chinese economic slowdown," 1 March 2016. [Online].
Available: http://www.bbc.com/news/business-35693794. [Accessed 22 October 2016].
[57] Statoil, "Energy Perspective 2016. Long-term macro and market outlook," 1 June 2016.
[Online]. Available:
http://www.statoil.com/en/NewsAndMedia/News/EnergyPerspectives/Pages/default.aspx.
[Accessed 2016 December 2016].
[58] Focus Economics, "Economic Forecasts from the World's Leading Economists," 18 October
2016. [Online]. Available: http://www.focus-economics.com/countries/china. [Accessed 22
October 2016].
[59] Reuters, "Danish oil services firm Welltec studies IPO – paper," Reuters, 13 February 2013.
[Online]. Available: http://www.reuters.com/article/welltec-ipo-
idUSL5N0BD1OT20130213. [Accessed 17 September 2016].
[60] Skatteministeriet, "Danish Income Tax Rates 2014-2017," [Online]. Available:
http://www.skm.dk/english/facts-and-figures/danish-income-tax-rates-2014-2017. [Accessed
18 January 2017].
[61] Welltec, "Conveyance solutions," [Online]. Available:
http://www.welltec.com/solutions/conveyance/. [Accessed 11 September 2016].
[62] MailOnline, "Congress passes Iran sanctions extension, bill goes to Obama," 1 December
2016. [Online]. Available: http://www.dailymail.co.uk/wires/afp/article-3992324/Congress-
passes-Iran-sanctions-extension-bill-goes-Obama.html. [Accessed 11 December 2016].

89
[63] Welltec, "Completions solution," [Online]. Available:
http://www.welltec.com/solutions/completion-solutions/. [Accessed 11 September 2016].
[64] Welltec, "Clean-out solutions," [Online]. Available: http://www.welltec.com/solutions/clean-
out-solutions/. [Accessed 11 September 2016].
[65] Government of Canada, "Canada and Iran. Canadian sanctions against Iran," 05 February
2016. [Online]. Available:
http://www.canadainternational.gc.ca/iran/sanctions/index.aspx?lang=eng. [Accessed 23
October 2016].
[66] BP, "BP Energy Outlook 2017 edition," 2017. [Online]. Available:
http://www.bp.com/en/global/corporate/energy-economics/energy-outlook.html. [Accessed
11 February 2017].
[67] Welltec, "Bond Programme," [Online]. Available: http://www.welltec.com/investors/bond-
programme/. [Accessed 11 February 2017].
[68] Welltec, "Annual Report 2015," 2016.
[69] Welltec, "Annual Report 2014," 2015.
[70] Welltec, "Annual Report 2013," 2014.
[71] Welltec, "Annual Report 2012," 2013.
[72] Welltec, "Annual Report 2011," 2012.
[73] Welltec, LinkedIn, [Online]. Available:
https://www.linkedin.com/company/welltec?trk=top_nav_home. [Accessed 15 September
2016].
Data sources
[74] The yield for USA 10-year Zero coupon (end of period, USD):
http://sdw.ecb.europa.eu/browseTable.do?node=qview&SERIES_KEY=143.FM.Q.US.USD.RT.BZ
.USD10YZ_R.YLDE
[75] Risk premium (median) for USA in 2016:
http://www.valuewalk.com/wp-content/uploads/2016/05/SSRN-id2776636.pdf
[76] Credit spread:
http://cbonds.com/emissions/issue/178913

90
[77] Crude Oil Prices: West Texas Intermediate (WTI) - Cushing, Oklahoma:
https://fred.stlouisfed.org/series/OILPRICE
[78] CPI:
http://inflationdata.com/Inflation/Consumer_Price_Index/HistoricalCPI.aspx?reloaded=true
[79] Long-term baseline projections:
http://www.oecd-ilibrary.org/economics/data/oecd-economic-outlook-statistics-and-
projections/long-term-baseline-projections-no-95_data-00690-en
[80] Population forecast:
http://stats.oecd.org/viewhtml.aspx?datasetcode=EO95_LTB&lang=en
[81] Crude Oil Prices: Brent – Europe:
https://fred.stlouisfed.org/series/DCOILBRENTEU/downloaddata

91
Appendix 1. Abbreviations
$/b – USD per barrel
BVE – book value of equity
COP21 – the agreement on reducing greenhouse gases emission that was reached in Paris at the
Conference of Parties
E&P – Exploration and Production
EIA – U.S. Energy Information Administration
ERD – Extended Reach Drilling the term used for drilling directional wells in which the drilled
horizontal reach (HR) attained at total depth (TD) exceeded the true vertical depth (TVD) by a factor
greater than or equal to two, i.e. very long horizontal wells. [50]
GHG – greenhouse gases
HSE – Health, Safety, Environment
IEA – International Energy Agency
IPCC – Intergovernmental Panel on Climate Change is the leading international body for the
assessment of climate change [49]
JCPOA – the Joint Comprehensive Plan of Action
LCS –licensing and concession system (one of petroleum regulatory systems)
M&A – Merges and acquisitions
Mboe – million barrel oil equivalent
Mboe/d – million barrel oil equivalent per day
Mtoe – million tonnes oil equivalent
MVE – market value of equity
NFE – net financial expenses
NIBD – net interest bearing debt
O&G – Oil and Gas
OFS – Oilfield Service
OPEC – Organization of Petroleum Exporting Countries
PESTEL – Political, Economic, Social, Technical, Environmental and Legal
SPE – Society of Petroleum Engineers
VRIO – Value, Rarity, Inimitability, Organizational support
WAB – Welltec Annular Barrier

92
Appendix 2. Services provided by OFS sector, USA, 2013
Source: SRR [10, p.1]

93
Appendix 3. The logical progression of the thesis’s research plan
SRQ 1: What are Welltec’s financial value drivers?
SRQ 2: What are the factors that influence Welltec’s
cash flow and risk?
SRQ 3: How those factors will affect Welltec’s cash
flow and risk in future?
SRQ 4: What are Welltec’s future cash flows and risk?
RQ: What is the fair market price for Welltec?

94
Appendix 4. Welltec key figures
2015 2014 2013 2012 2011 2010
Number of employees 832 1013 1055 907 793 645
Number of countries with established entities 29 29 28 25 22 21
Own creation. Source: Welltec Investor Presentation of Annual Report for 2013, 2014 and 2015. [18,
p.4], [19, p.4], [20, p.4]
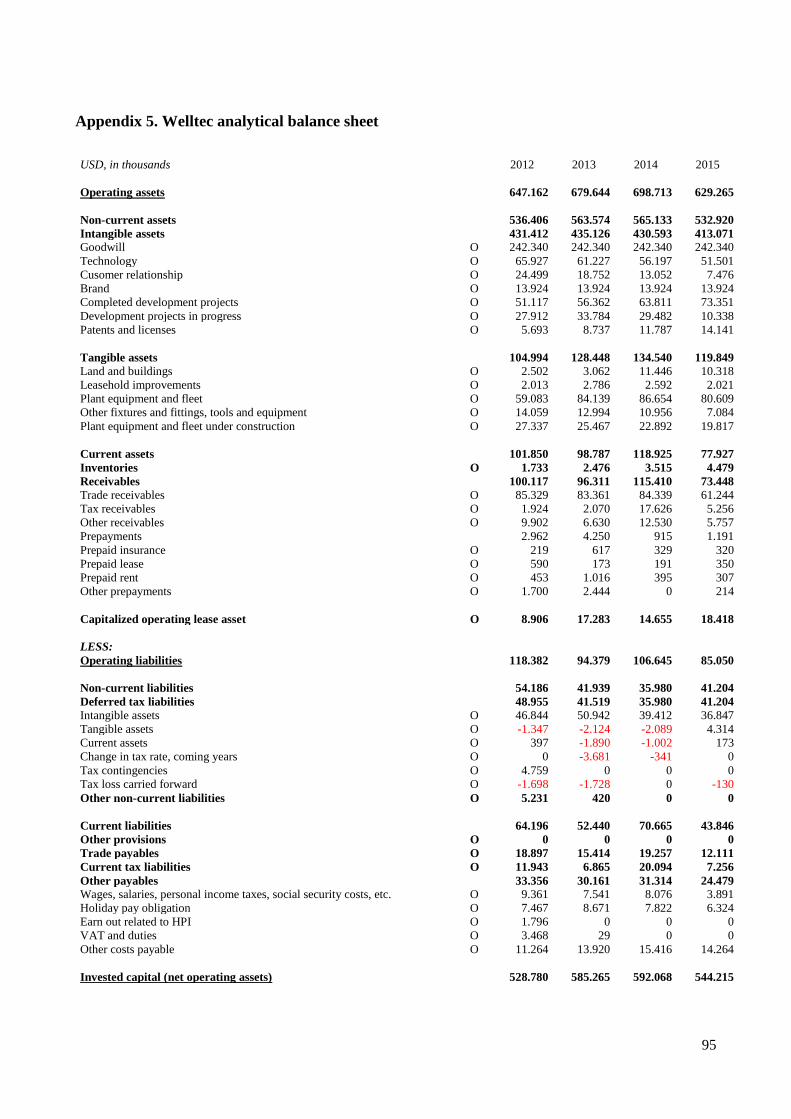
95
Appendix 5. Welltec analytical balance sheet
USD, in thousands 2012 2013 2014 2015
Operating assets 647.162 679.644 698.713 629.265
Non-current assets 536.406 563.574 565.133 532.920
Intangible assets 431.412 435.126 430.593 413.071
Goodwill O 242.340 242.340 242.340 242.340
Technology O 65.927 61.227 56.197 51.501
Cusomer relationship O 24.499 18.752 13.052 7.476
Brand O 13.924 13.924 13.924 13.924
Completed development projects O 51.117 56.362 63.811 73.351
Development projects in progress O 27.912 33.784 29.482 10.338
Patents and licenses O 5.693 8.737 11.787 14.141
Tangible assets 104.994 128.448 134.540 119.849
Land and buildings O 2.502 3.062 11.446 10.318
Leasehold improvements O 2.013 2.786 2.592 2.021
Plant equipment and fleet O 59.083 84.139 86.654 80.609
Other fixtures and fittings, tools and equipment O 14.059 12.994 10.956 7.084
Plant equipment and fleet under construction O 27.337 25.467 22.892 19.817
Current assets 101.850 98.787 118.925 77.927
Inventories O 1.733 2.476 3.515 4.479
Receivables 100.117 96.311 115.410 73.448
Trade receivables O 85.329 83.361 84.339 61.244
Tax receivables O 1.924 2.070 17.626 5.256
Other receivables O 9.902 6.630 12.530 5.757
Prepayments 2.962 4.250 915 1.191
Prepaid insurance O 219 617 329 320
Prepaid lease O 590 173 191 350
Prepaid rent O 453 1.016 395 307
Other prepayments O 1.700 2.444 0 214
Capitalized operating lease asset O 8.906 17.283 14.655 18.418
LESS: Operating liabilities 118.382 94.379 106.645 85.050
Non-current liabilities 54.186 41.939 35.980 41.204
Deferred tax liabilities 48.955 41.519 35.980 41.204
Intangible assets O 46.844 50.942 39.412 36.847
Tangible assets O -1.347 -2.124 -2.089 4.314
Current assets O 397 -1.890 -1.002 173
Change in tax rate, coming years O 0 -3.681 -341 0
Tax contingencies O 4.759 0 0 0
Tax loss carried forward O -1.698 -1.728 0 -130
Other non-current liabilities O 5.231 420 0 0
Current liabilities 64.196 52.440 70.665 43.846
Other provisions O 0 0 0 0
Trade payables O 18.897 15.414 19.257 12.111
Current tax liabilities O 11.943 6.865 20.094 7.256
Other payables 33.356 30.161 31.314 24.479
Wages, salaries, personal income taxes, social security costs, etc. O 9.361 7.541 8.076 3.891
Holiday pay obligation O 7.467 8.671 7.822 6.324
Earn out related to HPI O 1.796 0 0 0
VAT and duties O 3.468 29 0 0
Other costs payable O 11.264 13.920 15.416 14.264
Invested capital (net operating assets) 528.780 585.265 592.068 544.215

96
USD, in thousands 2012 2013 2014 2015
Equity 245.134 277.491 281.648 242.523
Share capital F 787 824 824 835
Currency translation reserve F -3.493 -12.835 -26.598 -35.591
Reserve for capitalized development projects 0 0 0 0
Retained earnings F 249.842 291.351 308.160 277.249
Retained earnings adjustment related to capitalized operating lease F -1.288 -1.124 -738 30
Non-controlling interest F -714 -725 0 0
Net interest bearing debt 283.645 307.774 310.420 301.692
Non-current liabilities 308.120 321.642 331.652 346.775
Deferred tax liabilities (adjusted) -1.015 10.295 9.126 2.003
Current and non-current liabilities F -586 10.670 9.385 2.040
Deferred tax liabilities related to capitalized operating lease F -429 -375 -259 -37
Finance lease commitments F 1.072 1.561 8.251 8.011
Issued bonds F 308.063 309.786 314.275 309.948
Bank debt F 0 0 0 26.813
Current liabilities 15.835 14.329 12.395 12.060
Current portion of non-current liabilities F 2.165 1.349 1.271 1.357
Payables to affiliates F 1.186 354 0 0
Other payables 12.484 12.626 11.124 10.703
Derivative financial instruments F 0 1.030 0 0
Accrued interests F 12.484 11.596 11.124 10.703
Capitalized operating lease liability 10.622 18.782 15.652 18.425
LESS: Financial assets 4.639 3.146 2.800 1.756
Tax receivables F 1.321 1.382 0 0
Other recievables F 3.318 1.764 2.800 1.756
LESS: Current assets 46.293 43.833 46.479 73.812
Receivables 4.308 5.021 3.783 2.132
Current portion of non-current assets F 2.120 2.120 0 0
Receivables from affiliates F 0 0 0 0
Prepayments 2.188 2.901 3.783 2.132
Prepaid creditors F 2.188 2.901 3.783 2.132
Cash and cash equivalents F 41.985 38.812 42.696 61.040
Securities F 0 0 0 10.640
Invested capital (financing) 528.780 585.265 592.068 544.215
Also provided in Excel file (on USB memory stick), tab ‘Consolidated BS’

97
Appendix 6. Welltec intangible assets
Intangible assets: structure and dynamic, USD in thousands
Own creation. Source: Welltec Annual Report for 2013, 2014 and 2015. [70, p.52-53], [69, p.52-53],
[68, p.44-45]
Goodwill
Goodwill makes up more than half of Welltec’s intangible assets (see Figure X). This goodwill was
first recognized in the balance sheet following the acquisition of Welltec Holding ApS in 2007. As
stated in Welltec’s annual report of 2105, “goodwill was [initially] measured as the difference
between cost acquired and the fair value of assets, liabilities, and contingent liabilities acquired” [68,
p.30, 46].
Goodwill is computed as cost minus accumulated write downs. Goodwill is tested, each year, for
impairment. However, ever since it was first recognized and up until its 2015 impairment test,
Welltec’s goodwill has not suffered any impairment losses [68, p.30]
Development projects
Welltec’s capitalized development projects are comprised of clearly defined service equipments and
processes that are expected to be a source of future cash flows for the group. When these development
projects are set down, for the first time, in the company’s books, Welltec records their costs.
Afterwards, they are subjected to an annual impairment test. Once completed, development projects
are amortized using a straight-line method over a period of, typically, 5 years. Nevertheless, there are
cases where the amortization period can stretch up to 20 years [68, p.30-31]
59%
18% 3%
3%
12%
2%
3%
17%
Carrying value at 31.12.2015
0
50.000
100.000
150.000
200.000
250.000
300.000
350.000
400.000
450.000
31.12.2012 31.12.2013 31.12.2014 31.12.2015
Patents and licenses
Development projects in progress
Completed development projects
Brand
Customer relationship
Technology
Goodwill

98
Patents and licenses
Patents and licenses are recorded at cost and amortized according to the duration of the patent/license
term (usually 20 years) 85, p.31].
Brands, customer relationships, and technological knowhow are the intangible assets acquired by
means of acquisitions. A brand is considered as being useful throughout the entirety of the business’s
life. Accordingly, it is not amortized. Conversely, customer relationships and technological
knowhow’s usefulness to the company is finite. Therefore, they are amortized using a straight-line
method, 10 years for customer relationships and 10 to 20 years for technological knowhow [68, p.31].
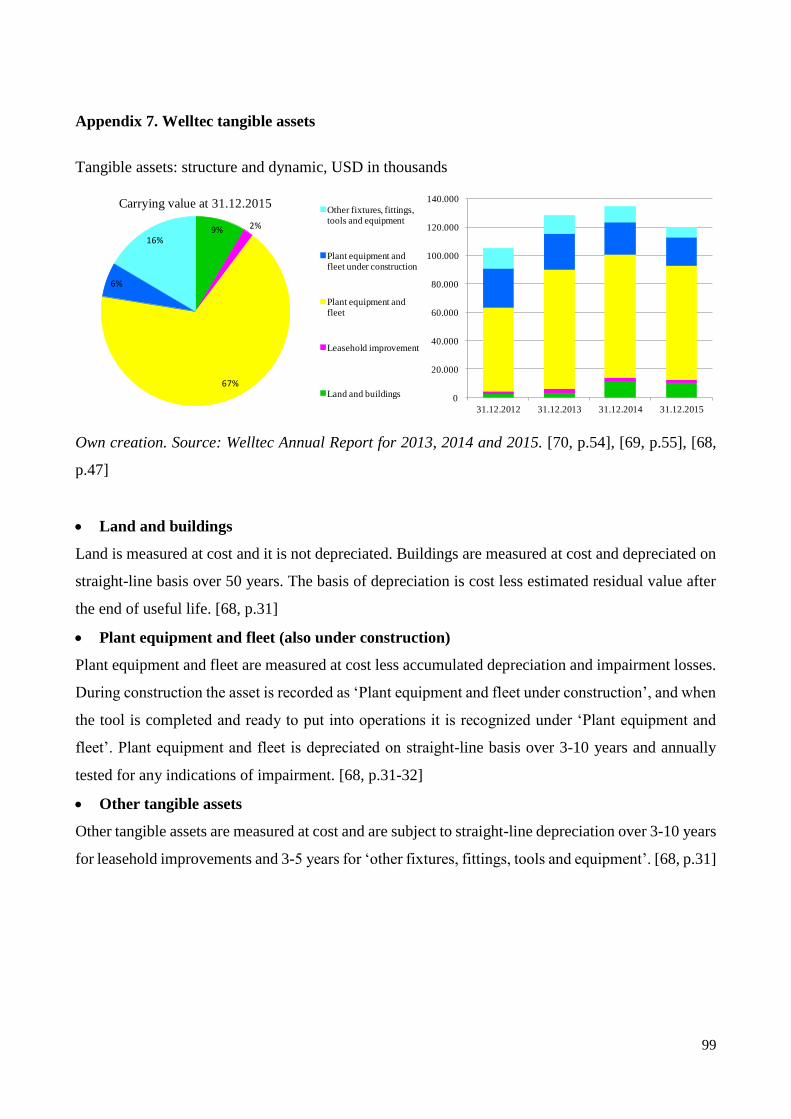
99
Appendix 7. Welltec tangible assets
Tangible assets: structure and dynamic, USD in thousands
Own creation. Source: Welltec Annual Report for 2013, 2014 and 2015. [70, p.54], [69, p.55], [68,
p.47]
Land and buildings
Land is measured at cost and it is not depreciated. Buildings are measured at cost and depreciated on
straight-line basis over 50 years. The basis of depreciation is cost less estimated residual value after
the end of useful life. [68, p.31]
Plant equipment and fleet (also under construction)
Plant equipment and fleet are measured at cost less accumulated depreciation and impairment losses.
During construction the asset is recorded as ‘Plant equipment and fleet under construction’, and when
the tool is completed and ready to put into operations it is recognized under ‘Plant equipment and
fleet’. Plant equipment and fleet is depreciated on straight-line basis over 3-10 years and annually
tested for any indications of impairment. [68, p.31-32]
Other tangible assets
Other tangible assets are measured at cost and are subject to straight-line depreciation over 3-10 years
for leasehold improvements and 3-5 years for ‘other fixtures, fittings, tools and equipment’. [68, p.31]
9% 2%
67%
6%
16%
Carrying value at 31.12.2015
0
20.000
40.000
60.000
80.000
100.000
120.000
140.000
31.12.2012 31.12.2013 31.12.2014 31.12.2015
Other fixtures, fittings, tools and equipment
Plant equipment and fleet under construction
Plant equipment and fleet
Leasehold improvement
Land and buildings
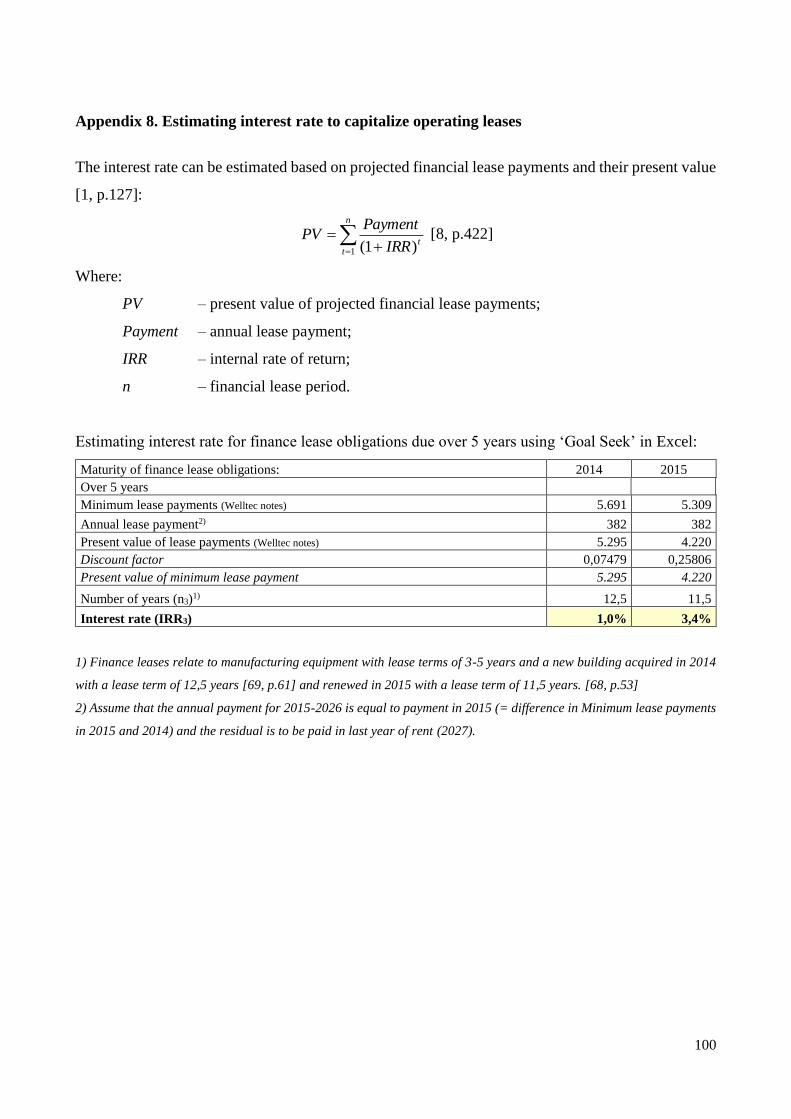
100
Appendix 8. Estimating interest rate to capitalize operating leases
The interest rate can be estimated based on projected financial lease payments and their present value
[1, p.127]:
n
ttIRR
PaymentPV
1 )1( [8, p.422]
Where:
PV – present value of projected financial lease payments;
Payment – annual lease payment;
IRR – internal rate of return;
n – financial lease period.
Estimating interest rate for finance lease obligations due over 5 years using ‘Goal Seek’ in Excel:
Maturity of finance lease obligations: 2014 2015
Over 5 years
Minimum lease payments (Welltec notes) 5.691 5.309
Annual lease payment2) 382 382
Present value of lease payments (Welltec notes) 5.295 4.220
Discount factor 0,07479 0,25806
Present value of minimum lease payment 5.295 4.220
Number of years (n3)1) 12,5 11,5
Interest rate (IRR3) 1,0% 3,4%
1) Finance leases relate to manufacturing equipment with lease terms of 3-5 years and a new building acquired in 2014
with a lease term of 12,5 years [69, p.61] and renewed in 2015 with a lease term of 11,5 years. [68, p.53]
2) Assume that the annual payment for 2015-2026 is equal to payment in 2015 (= difference in Minimum lease payments
in 2015 and 2014) and the residual is to be paid in last year of rent (2027).

101
Estimating interest rate for finance lease obligations due within 1 year and between 1 and 5 years
using ‘Solver’ in Excel:
Maturity of finance lease obligations: 2012 2013 2014 2015 Within 1 year
Minimum lease payments (Welltec notes) 2.241 1.396 1.324 1.408
Present value of minimum lease payment (Welltec notes) 2.165 1.349 1.271 1.357
Discount factor 0,03510 0,03484 0,04170 0,03758
Present value of minimum lease payment 2.165 1.350 1.271 1.358
Difference 0,5 -0,5 0,5 -0,5
Number of years (n1) 0,9 0,8 1,0 0,9
Interest rate (IR1) 4,2% 4,3% 4,2% 4,2%
Between 1 and 5 years Minimum lease payments (Welltec notes) 1.103 1.623 3.104 3.942 min max
between 1 and 2 years 1.103 1.324 1.408 299 1 2
between 2 and 3 years 299 1.397 2 3
3 and more years 299 1.397 2.246 3 5
Present value of minimum lease payment (Welltec notes) 1.072 1.561 2.956 3.791
Descount factor (1) 0,97579 0,97810 0,97585 0,97878 1 Descount factor (2) 0,95216 0,95668 0,95229 0,95801 2 Descount factor (3) 0,92911 0,93572 0,92930 0,93768 3 Descount factor (4) 0,90661 0,91523 0,90686 0,91778 4
Descount factor for t2 0,96710 0,95155 0,92930 0,94791 Present value of minimum lease payment 1.072 1.562 2.957 3.791 Difference 0,5 -0,5 -0,5 0,5
Number of years (n2) 1,4 2,2 3,0 2,5
Interest rate (IR2) 2,5% 2,2% 2,5% 2,2%
>= -0,5 -0,5 -0,5 -0,5 Difference
<= 0,5 0,5 0,5 0,5 Difference
>= 0,01% 0,01% 0,01% 0,01% IR
>= 0,1 0,1 0,1 0,1 Number of periods (n1)
<= 1,0 1,0 1,0 1,0 Number of periods (n1)
>= 1,0 1,4 2,0 2,5 Number of periods (n2)
<= 2,0 2,6 3,4 4,1 Number of periods (n2)
-0,05% 0,05% 0,00% 0,00% Calculated difference
vs. average (<1 year)
0,14% -0,10% 0,13% -0,17% Calculated difference
vs. average (1-5 years)
<= 0,05% 0,05% 0,05% 0,05% Difference vs. average
>= -0,05% -0,05% -0,05% -0,05% Difference vs. average
<= 0,10% 0,10% 0,10% 0,10% Difference vs. average
(1-5 years)
>= -0,10% -0,10% -0,10% -0,10% Difference vs. average
(1-5 years)
Total difference: -0,0
For detailed calculation, I refer the reader to #1 on the tab ‘Operating lease’ in Excel file (on USB memory stick)

102
Appendix 9. Estimating lease-payout-schedules
Lease obligations depending on lease asset and period:
a) Operational leasing agreements regarding company cars for 2007-2013. [72, p.60]
b) Operational leasing agreements regarding company cars for 2007-2015. [71, p.63]
c) Assume operational leasing agreements regarding company cars for the period 2014-2023.
d) Operational leasing agreements regarding company cars for the period 2015-2023. [69, p.63]
e) Operational leasing agreements regarding company cars for the period 2016-2023. [68, p.55]
f-h) Operational leasing agreements regarding office furniture [71, p.63] and starting from 2013 house
rental. [70, p.64] Rental obligations are running from 3 to 36 months. [68, p.55]

103
Determining the present value of the projected operating lease payments and lease amortization:
USD, in thousands Total 2023 2022 2021 2020 2019 2018 2017 2016 2015 2014 2013 2012 2011 2010 2009 2008 2007
a) Lease agreement 2007-2013
Lease payment per year (const.) 3.509 1 444 259 701 701 701 701
Number of years (na) 7 7 6 5 4 3 2 1
Discount factor 0,56493 0,61295 0,66505 0,72157 0,78291 0,84946 0,92166
Lease obligation (beginning of period) 1 410 617 1.215 1.766 2.274 2.742
Interest expense 767 0 35 52 103 150 193 233
Amortization of lease obligation 1 409 207 598 551 508 468
Lease obligation (end of period) 0 1 410 617 1.215 1.766 2.274
Depreciation expense 2.742 392 392 392 392 392 392 392
USD, in thousands Total 2023 2022 2021 2020 2019 2018 2017 2016 2015 2014 2013 2012 2011 2010 2009 2008 2007
b) Lease agreement 2007-2013 extended till 2015
Lease payment per year 1.025 951 75
Number of years (nb) 2 2 1 Discount factor 0,84946 0,92166
Lease obligation (beginning of period) 876 876
Interest expense 149 74 74 Amortization of lease obligation 876 0
Lease obligation (end of period) 0 876
Depreciation expense 876 438 438
USD, in thousands Total 2023 2022 2021 2020 2019 2018 2017 2016 2015 2014 2013 2012 2011 2010 2009 2008 2007
c) Lease agreement 2014-2023
Lease payment per year (const.) 17.193 1.064 1.882 1.882 1.882 1.882 1.882 1.955 1.881 1.878 1.004
Number of years (nc) 10 10 9 8 7 6 5 4 3 2 1 Discount factor 0,44229 0,47988 0,52067 0,56493 0,61295 0,66505 0,72157 0,78291 0,84946 0,92166
Lease obligation (beginning of period) 981 2.638 4.166 5.574 6.872 8.068 9.239 10.249 11.177 11.227
Interest expense 5.966 83 224 354 474 584 686 785 871 950 954 Amortization of lease obligation 981 1.658 1.528 1.408 1.298 1.196 1.170 1.010 928 50
Lease obligation (end of period) 0 981 2.638 4.166 5.574 6.872 8.068 9.239 10.249 11.177
Depreciation expense 11.227 1.123 1.123 1.123 1.123 1.123 1.123 1.123 1.123 1.123 1.123
For detailed calculation, I refer the reader to #5 on the tab ‘Operating lease (a-h)’ in Excel file (on USB memory stick)

104
USD, in thousands Total 2023 2022 2021 2020 2019 2018 2017 2016 2015 2014 2013 2012 2011 2010 2009 2008 2007
e) Lease agreement of 2015-2023 replaced by new
agreement 2016-2023
Lease payment per year (gradually increasing) 26.236 4.087
3.82
5
3.58
0
3.35
1
3.13
7
2.93
6
2.74
8
2.57
2 Number of years (ne) 8 8 7 6 5 4 3 2 1
Annual growth 6,8% Constrains:
Due within 1 year 2.572 < 5.058 Due within 1-5 years 12.172 < 12.257
Over 5 years 11.492
For detailed calculation using ‘Solver’, I refer the reader to #5 on the tab ‘Operating lease (e)’ in Excel file (on USB memory stick)
USD, in thousands Total 2023 2022 2021 2020 2019 2018 2017 2016 2015 2014 2013 2012 2011 2010 2009 2008 2007
e) Lease agreement for 2015-2023 replaced by
new agreement 2016-2023
Lease payment per year (gradually increasing) 26.236 4.087 3.825 3.580 3.351 3.137 2.936 2.748 2.572
Number of years (ne) 8 8 7 6 5 4 3 2 1
Discount factor
0,52067
0,56493
0,61295
0,66505
0,72157
0,78291
0,84946
0,92166
Lease obligation (beginning of period) 3.766 6.997 9.748 12.073 14.019 15.626 16.935 17.979 Interest expense 8.257 320 595 829 1.026 1.192 1.328 1.439 1.528
Amortization of lease obligation 3.766 3.230 2.752 2.325 1.945 1.608 1.309 1.044
Lease obligation (end of period) 0 3.766 6.997 9.748 12.073 14.019 15.626 16.935 Depreciation expense 17.979 2.247 2.247 2.247 2.247 2.247 2.247 2.247 2.247
For detailed calculation, I refer the reader to #5 on the tab ‘Operating lease (a-h)’ in Excel file (on USB memory stick)

105
USD, in thousands Total 2023 2022 2021 2020 2019 2018 2017 2016 2015 2014 2013 2012 2011 2010 2009 2008 2007
f) Rental obligations that running from 3
months to 1 year (are not capitalized)
Lease payment per year 19.428 5.145 4.867 4.601 1.153 2.940 722
USD, in thousands Total 2023 2022 2021 2020 2019 2018 2017 2016 2015 2014 2013 2012 2011 2010 2009 2008 2007
g) Rental obligations for 2 years
Lease payment per year (const.) #1 1.914 738 1.176
Lease payment per year (const.) #2 708 354 354 Lease payment per year (const.) #3 0 0 0
Lease payment per year (const.) #4 0 0 0
Lease payment per year (const.) #5 1.168 1.139 29 Lease payment per year (const.) #6 218 109 109
Discount factor (year 1) 0,97752 0,97752 0,97752 0,97752 0,97752 0,97752 0,97752 0,97752
Discount factor (year 2) 0,95554 0,95554 0,95554 0,95554 0,95554 0,95554 0,95554 0,95554 Lease obligation (beginning of period)n #1 721 1.855
Lease obligation (beginning of period) #2 346 684
Lease obligation (beginning of period) #3 0 0 Lease obligation (beginning of period) #4 0 0
Lease obligation (beginning of period) #5 1.114 1.117
Lease obligation (beginning of period) #6 107 211 Interest expense #1 59 17 43
Interest expense #2 24 8 16
Interest expense #3 0 0 0 Interest expense #4 0 0 0
Interest expense #5 51 26 26
Interest expense #6 7 2 5
Amortization of lease obligation #1 721 1.134
Amortization of lease obligation #2 346 338
Amortization of lease obligation #3 0 0 Amortization of lease obligation #4 0 0
Amortization of lease obligation #5 1.114 3
Amortization of lease obligation #6 107 104 Depreciation expense 3.867 106 664 559 0 342 1.269 927

106
USD, in thousands Total 2023 2022 2021 2020 2019 2018 2017 2016 2015 2014 2013 2012 2011 2010 2009 2008 2007
h) Rental obligations for 3 years Lease payment per year (const.) #1 884 0 442 442
Lease payment per year (const.) #2 351 326 13 13
Lease payment per year (const.) #3 4.459 2.399 919 1.141 Lease payment per year (const.) #4 11.204 5.165 3.417 2.622
Lease payment per year (const.) #5 0 0 0 0
Lease payment per year (const.) #6 536 179 179 179 Lease payment per year (const.) #7 255 85 85 85
Discount factor (year 1) 0,97752 0,97752 0,97752 0,97752 0,97752 0,97752 0,97752 0,97752 0,97752
Discount factor (year 2) 0,95554 0,95554 0,95554 0,95554 0,95554 0,95554 0,95554 0,95554 0,95554 Discount factor (year 3) 0,93406 0,93406 0,93406 0,93406 0,93406 0,93406 0,93406 0,93406 0,93406
Lease obligation (beginning of period) #1 0 432 854
Lease obligation (beginning of period) #2 318 323 329
Lease obligation (beginning of period) #3 2.345 3.190 4.234
Lease obligation (beginning of period) #4 5.049 8.276 10.653
Lease obligation (beginning of period) #5 0 0 0 Lease obligation (beginning of period) #6 175 345 512
Lease obligation (beginning of period) #7 83 165 244
Interest expense #1 30 0 10 20 Interest expense #2 22 7 7 8
Interest expense #3 225 54 73 97
Interest expense #4 551 116 190 245 Interest expense #5 0 0 0 0
Interest expense #6 24 4 8 12
Interest expense #7 11 2 4 6 Amortization of lease obligation #1 0 432 422
Amortization of lease obligation #2 318 5 5
Amortization of lease obligation #3 2.345 846 1.044 Amortization of lease obligation #4 5.049 3.227 2.377
Amortization of lease obligation #5 0 0 0
Amortization of lease obligation #6 175 171 167 Amortization of lease obligation #7 83 81 80
Depreciation expense 16.826 81 252 252 3.722 4.962 5.072 1.806 394 285
USD, in thousands Total 2023 2022 2021 2020 2019 2018 2017 2016 2015 2014 2013 2012 2011 2010 2009 2008 2007
Rental and leasing expenses for the year (excl. <1 years) 4.850 6.452 5.817 4.664 2.505 2.332 Rental and leasing obligations:
Due within 1 year 2.945 4.850 6.452 5.817 4.664 2.505 Due within 1-5 years 12.257 10.006 10.044 12.910 10.982 4.442
Over 5 years 11.492 6.205 8.592 10.474 0 0 Checks: Over 5 years = 0 0 0 0 0 0 0 Constrains: Rental and leasing expenses for the year <= 9.995 11.319 10.418 5.817 5.445 3.298
Rental and leasing obligations (due within 1 yr)
should be equal to or less than reported numbers 5.058 4.850 6.452 5.817 4.664 2.680
Rental and leasing obligations (due within 1-5 yrs) should match reported numbers 0,020 0,004 0,000 0,001 0,000 362,607
Rental and leasing obligations difference <= 0,49 0,49 0,49 0,49 0,49 384,4 Model deviation from reported amounts = 0
For detailed calculation, I refer the reader to #5 on the tab ‘Operating lease (a-h)’ in Excel file (on USB memory stick)
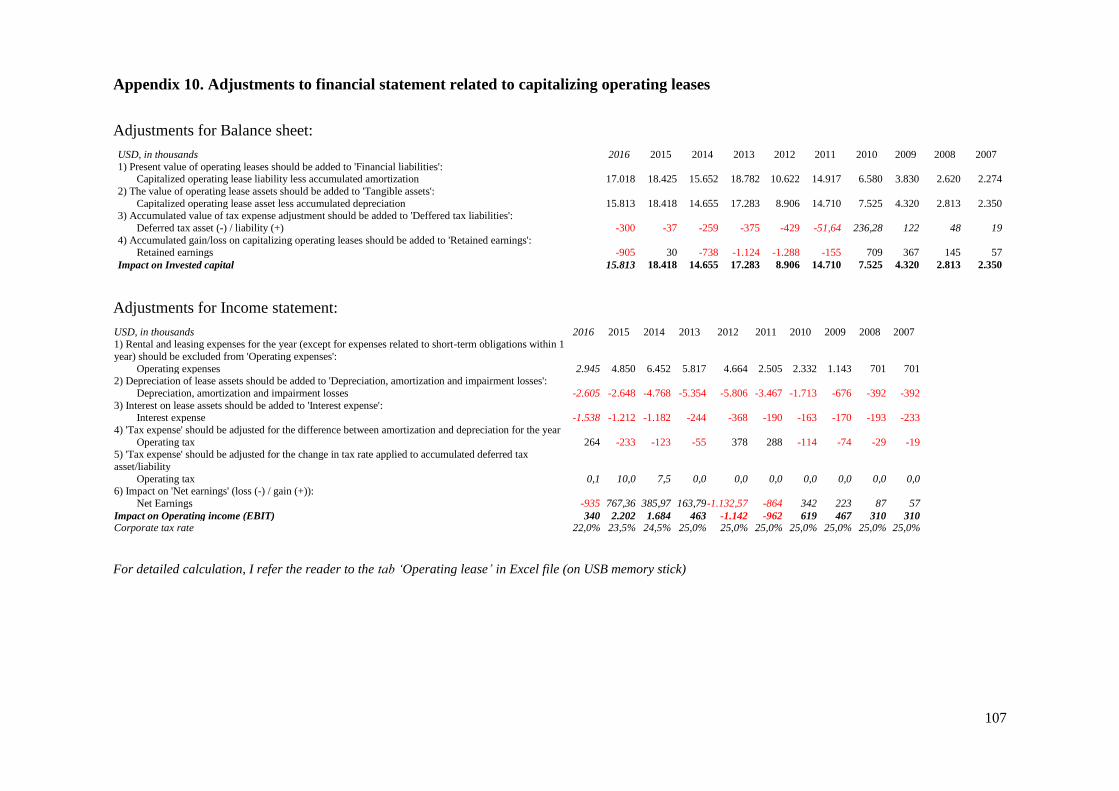
107
Appendix 10. Adjustments to financial statement related to capitalizing operating leases
Adjustments for Balance sheet:
USD, in thousands 2016 2015 2014 2013 2012 2011 2010 2009 2008 2007
1) Present value of operating leases should be added to 'Financial liabilities': Capitalized operating lease liability less accumulated amortization 17.018 18.425 15.652 18.782 10.622 14.917 6.580 3.830 2.620 2.274
2) The value of operating lease assets should be added to 'Tangible assets':
Capitalized operating lease asset less accumulated depreciation 15.813 18.418 14.655 17.283 8.906 14.710 7.525 4.320 2.813 2.350 3) Accumulated value of tax expense adjustment should be added to 'Deffered tax liabilities':
Deferred tax asset (-) / liability (+) -300 -37 -259 -375 -429 -51,64 236,28 122 48 19
4) Accumulated gain/loss on capitalizing operating leases should be added to 'Retained earnings':
Retained earnings -905 30 -738 -1.124 -1.288 -155 709 367 145 57
Impact on Invested capital 15.813 18.418 14.655 17.283 8.906 14.710 7.525 4.320 2.813 2.350
Adjustments for Income statement:
USD, in thousands 2016 2015 2014 2013 2012 2011 2010 2009 2008 2007 1) Rental and leasing expenses for the year (except for expenses related to short-term obligations within 1
year) should be excluded from 'Operating expenses':
Operating expenses 2.945 4.850 6.452 5.817 4.664 2.505 2.332 1.143 701 701 2) Depreciation of lease assets should be added to 'Depreciation, amortization and impairment losses':
Depreciation, amortization and impairment losses -2.605 -2.648 -4.768 -5.354 -5.806 -3.467 -1.713 -676 -392 -392
3) Interest on lease assets should be added to 'Interest expense':
Interest expense -1.538 -1.212 -1.182 -244 -368 -190 -163 -170 -193 -233
4) 'Tax expense' should be adjusted for the difference between amortization and depreciation for the year
Operating tax 264 -233 -123 -55 378 288 -114 -74 -29 -19 5) 'Tax expense' should be adjusted for the change in tax rate applied to accumulated deferred tax
asset/liability
Operating tax 0,1 10,0 7,5 0,0 0,0 0,0 0,0 0,0 0,0 0,0 6) Impact on 'Net earnings' (loss (-) / gain (+)):
Net Earnings -935 767,36 385,97 163,79 -1.132,57 -864 342 223 87 57
Impact on Operating income (EBIT) 340 2.202 1.684 463 -1.142 -962 619 467 310 310 Corporate tax rate 22,0% 23,5% 24,5% 25,0% 25,0% 25,0% 25,0% 25,0% 25,0% 25,0%
For detailed calculation, I refer the reader to the tab ‘Operating lease’ in Excel file (on USB memory stick)

108
Appendix 11. Welltec deferred tax assets and liabilities
Dynamic of deferred tax assets (-) / liabilities (+), USD in thousands
Own creation. Source: Welltec Annual Report for 2013, 2014 and 2015. [70, p.59], [69, p.59], [68,
p.51]
-10.000
0
10.000
20.000
30.000
40.000
50.000
60.000
70.000
2015201420132012
Tax loss carried forward
Tax contingencies
Current assets
Change in tax rate, coming years
Current and non-current liabilities
Tangible assets
Intangible assets
Lia
bil
itie
sA
sset
s

109
Appendix 12. Welltec prepayments
Prepayments: structure and dynamic, USD in thousands
Own creation. Source: Welltec Annual Report for 2013, 2014 and 2015. [70, p.58], [69, p.58], [68,
p.50]
10%
11%
9%
64%
6%
Prepayments at 31.12.2015
0
1.000
2.000
3.000
4.000
5.000
6.000
7.000
8.000
2015201420132012
Other prepayments
Prepaid creditors
Prepaid rent
Prepaid lease
Prepaid insurance

110
Appendix 13. Welltec equity
Share capital: structure and dynamic Holding own shares dynamic
Own creation. Source: Welltec Annual Report for 2013, 2014 and 2015. [70, p.58], [69, p.58-59], [68,
p. 50]
In the close of 2015, Welltec’s share capital consisted of 4.792.520 units of fully paid shares with a
nominal value of DKK 1 or USD 0,17 [68, p.50]. Until 2015, Welltec’s share capital consisted of
Class A and Class B shares with equal voting rights. Yet, Class B shares had time-limited preference
rights over Class A shares when Welltec makes its distributions.
In 2013, Class A preference shares at the value of DKK 150 thousand (USD 27 thousand) were issued.
These specific Class A shares have, with a certain timeframe and subject to certain conditions being
met, certain preference rights over the other Class A shares if Welltec does not complete an IPO [69,
p.58].
0,0%1,5%
3,8%4,1%
4,8%
0,0%
1,0%
2,0%
3,0%
4,0%
5,0%
6,0%
0
50.000
100.000
150.000
200.000
250.000
01.01.2012 01.01.2013 01.01.2014 01.01.2015 01.01.2016
Own Shares, DKK
Number of shares Share of capital
535 550 587 587
835
282 237 237 237
0
0
100
200
300
400
500
600
700
800
900
01.01.2012 01.01.2013 01.01.2014 01.01.2015 01.01.2016
Share Capital, thousand USD
Class A Shares Class B Shares
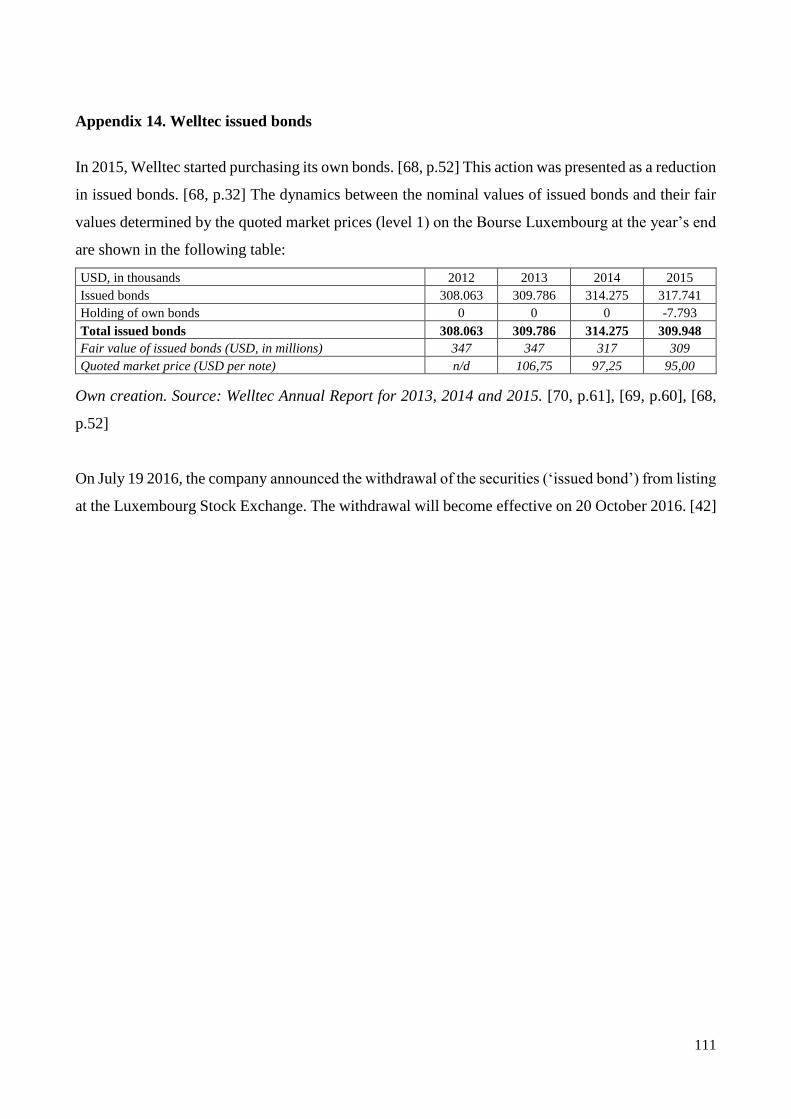
111
Appendix 14. Welltec issued bonds
In 2015, Welltec started purchasing its own bonds. [68, p.52] This action was presented as a reduction
in issued bonds. [68, p.32] The dynamics between the nominal values of issued bonds and their fair
values determined by the quoted market prices (level 1) on the Bourse Luxembourg at the year’s end
are shown in the following table:
USD, in thousands 2012 2013 2014 2015
Issued bonds 308.063 309.786 314.275 317.741
Holding of own bonds 0 0 0 -7.793
Total issued bonds 308.063 309.786 314.275 309.948
Fair value of issued bonds (USD, in millions) 347 347 317 309
Quoted market price (USD per note) n/d 106,75 97,25 95,00
Own creation. Source: Welltec Annual Report for 2013, 2014 and 2015. [70, p.61], [69, p.60], [68,
p.52]
On July 19 2016, the company announced the withdrawal of the securities (‘issued bond’) from listing
at the Luxembourg Stock Exchange. The withdrawal will become effective on 20 October 2016. [42]

112
11%
18%
30%
41%
Other payables at 31.12.2015
0
5.000
10.000
15.000
20.000
25.000
30.000
35.000
40.000
45.000
2015201420132012
Other costs payable
Accrued interests
VAT and duties
Earn out related to HPI
Derivative financial instruments
Holiday pay obligation
Wages, salaries, personal income
taxes, social security costs, etc.
Appendix 15. Welltec other payables
Other payables: structure and dynamic, USD in thousands
Own creation. Source: Welltec Annual Report for 2013, 2014 and 2015. [70, p.63], [69, p.62], [68,
p.64]

113
Appendix 16. Welltec analytical income statement
USD, in thousands 2015 2014 2013 2012 2011
Revenue 245.726 345.009 321.165 295.387 229.223
Operating expenses (adjusted) -154.256 -183.520 -184.507 -153.526 -121.404
Cost of services provided (adjusted) -89.980 -113.088 -113.353 -94.056 -66.012
Development and manufacturing cost -2.464 -297 -99 -45 -128
Reverse of Depreciation and amortization related to Development and
manufacturing cost 588 915 1.077 1.127 2.133
Administrative and sales cost (adjusted) -58.750 -77.502 -76.432 -65.216 -59.902
Special items (operating) -8.500 0 -1.517 0 0
Reverse of Rental & leasing expenses (capitalized operating lease) 4.850 6.452 5.817 4.664 2.505
EBITDA 91.470 161.489 136.658 141.861 107.819
Depreciation, amortization and impairment losses (adjusted) -74.921 -84.290 -65.309 -56.854 -51.772
Related to Cost of services provided -55.301 -56.108 -42.315 -34.270 -31.020
Related to Administrative and sales cost -6.120 -11.931 -5.947 -4.946 -4.495
Related to Development and manufacturing costs capitalized -588 -915 -1.077 -1.127 -2.133
Amortization of acquired intangibles in a business combination -10.264 -10.568 -10.616 -10.705 -10.657
Depreciation of capitalized operating lease assets -2.648 -4.768 -5.354 -5.806 -3.467
Operating income (EBIT) 16.549 77.199 71.349 85.007 56.047
Operating tax (tax on EBIT) -22.699 -38.367 -28.287 -33.194 -22.178
Tax expense adjustment for capitalized operating lease -223 -115 -55 378 288
Operating tax (tax on EBIT) (adjusted) -22.922 -38.482 -28.342 -32.817 -21.890
NOPAT -6.373 38.716 43.007 52.191 34.157
Net financial expenses -32.193 -21.499 -26.175 -38.261 -24.150
Special items (financing) 0 0 -3.181 0 0
Interest on capitalized operating lease -1.212 -1.182 -244 -368 -190
Net financial expenses (adjusted) -33.405 -22.681 -29.600 -38.629 -24.340
Tax shield 7.850 5.557 7.400 9.657 6.085
Unrealized exchange rate adjustments of foreign subsidiaries and branches -8.993 -13.763 -9.342 -3.551 62
Net financial expenses after tax -34.548 -30.887 -31.542 -32.523 -18.193
Net income (Net earnings) -40.921 7.829 11.465 19.667 15.964
Also provided in Excel file (on USB memory stick), tab ‘Consolidated IS’

114
Appendix 17. Welltec revenue
Revenue: structure and dynamic, USD in thousands
Own creation. Source: Welltec Annual Report for 2013, 2014 and 2015. [70, p.44], [69, p.44], [68,
p.35]
Whether the revenue in question is received or receivable, it is recorded at its fair value. Nevertheless,
in cases of longer than customary, interest-free, credit arrangements being made with clients, “the
fair value of [receivables] is determined by discounting future payments receivable” [68, p.29-30]
and differences between receivables’ fair values and nominal amounts will be “recognized as
financial income in profit or loss by applying the effective interest method” [68, p.29-30]. To finish,
“[all] revenue is recorded net of VAT, duties, etc. collected on behalf of a third party” [68, p.29-30].
-29%
+7%
+9%
+29%
0
50.000
100.000
150.000
200.000
250.000
300.000
350.000
20152014201320122011
Europe, Africa
and Russia/CIS
Americas
Asia Pacific
Middle East

115
Appendix 18. Welltec financial expenses and income
Financial expenses and income: structure and dynamic, USD in thousands
Own creation. Source: Welltec Annual Report for 2013, 2014 and 2015. [70, p.49], [69, p.49], [68, p.
49]
-80.000
-60.000
-40.000
-20.000
0
20.000
40.000
60.000
20152014201320122011
Exchange rate gains
Fair value adjustment of derivative financial instruments
Interest from subsidiaries and affiliates
Interest income
Fair value adjustment of derivative financial instruments
Exchange rate loss
Other financial expenses
Redemption fee
Interest expenses
Fin
anci
al inco
me
Fin
anci
al e
xp
ense
s
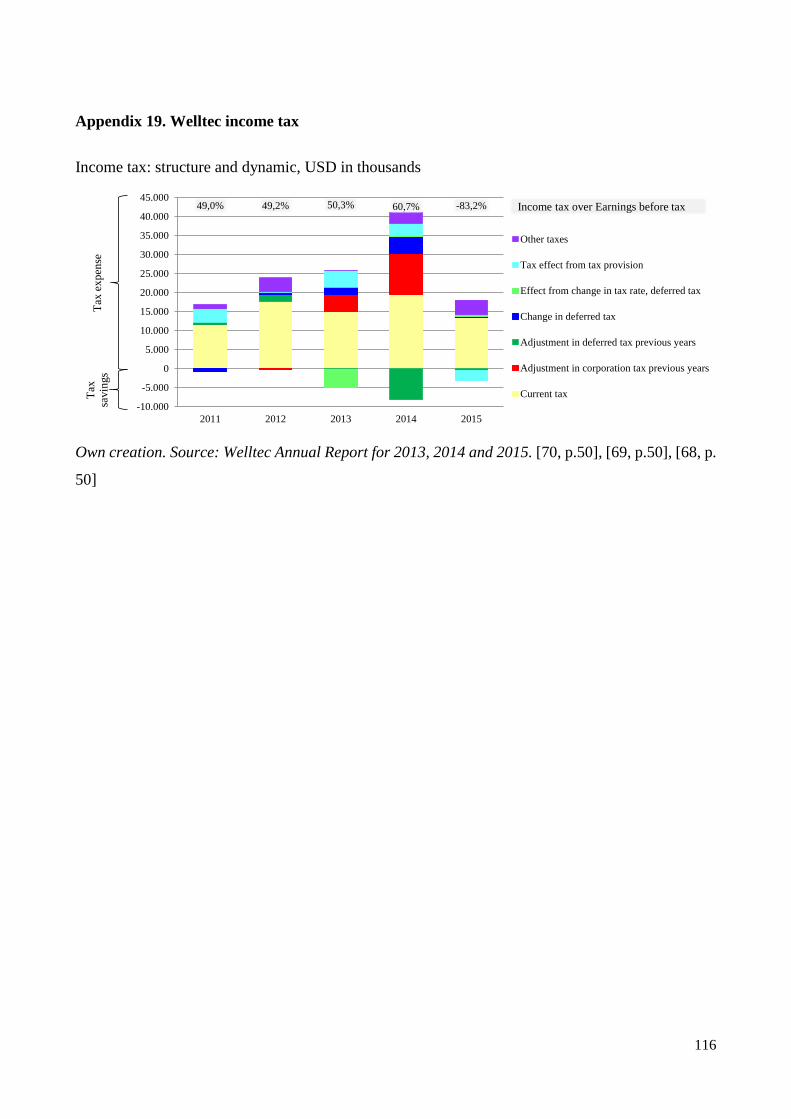
116
Appendix 19. Welltec income tax
Income tax: structure and dynamic, USD in thousands
Own creation. Source: Welltec Annual Report for 2013, 2014 and 2015. [70, p.50], [69, p.50], [68, p.
50]
-83,2%60,7%50,3%49,2%49,0%
-10.000
-5.000
0
5.000
10.000
15.000
20.000
25.000
30.000
35.000
40.000
45.000
20152014201320122011
Other taxes
Tax effect from tax provision
Effect from change in tax rate, deferred tax
Change in deferred tax
Adjustment in deferred tax previous years
Adjustment in corporation tax previous years
Current tax
Tax
ex
pen
se
Income tax over Earnings before tax
Tax
savin
gs

117
Appendix 20.
Formulas used in Profitability analysis:
%100capitalInvested
NOPATtaxafterROIC
[8, p.94]
%100capitalInvested
EBITtaxbeforeROIC
[8, p.94]
Where:
ROIC – return on investment capital;
NOPAT – net operating profit after tax;
EBIT – earning before tax;
Inv. capital – average invested capital.
capitalInvestedWACCtaxafterROICEVA [8, p.96]
Where:
EVA – economic value added;
WACC – weighted average cost of capital.
%100
Rearg
venue
EBITinmEBIT
[8, p.107]
%100
Rearg
venue
NOPATinmNOPAT
[8, p.107]
capitalInvested
venueturnoverAssets
Re
[8, p.108]

118
Appendix 21. Indexing and common-size analysis of analytical income statement
I start with the income statement to gain better understanding of profit margin development.
Operating expenses lap up a little more than half of Welltec’s revenue, with the exceptions of 2013
and 2015 where they consume 3/5 of revenue. The largest of the operating expenses is ‘cost of
services provided’ eating up more than 29% of revenue and grows over the observed period to 37%.
Second in line is the ‘administrative and sales cost’, which are less voracious, consuming between
22-26% of revenue. Although small compared to the aforementioned, the restructuring costs for 2015,
recorded under the heading ‘special items’ managed to trim away a further 3% off the revenues, which
is not insignificant when a company’s operating costs are already high.
‘Depreciation, amortization and impairment losses’ is another item that hacks away at the EBIT-
margin and NOPAT. From 2011 to 2014, it consumed 19 to 24% of revenue. However, in 2015, the
figure climbs to 30% of revenue. Not surprisingly, this sizeable increase in ‘depreciation,
amortization and impairment losses’ expenses tears off a huge chunk from Welltec’s EBIT-margin
lowering it down to just 7%, when, in previous years, it had vacillated between 22 and 29%.
Furthermore, while Welltec’s EBIT-margins continue to dwindle ‘operating tax’ constantly consumes
around 10% of revenue. In 2015, the level of ‘operating tax’ exceeds the EBIT-margin leaving
Welltec with a -2% NOPAT.
As for ‘net financial expenses after tax’, during the years 2011-2014, their level is between 8-11%.
In 2015, this increases to 14%.

119
Analytical Income Statement (not adjusted) Indexing (trend analysis) Common-size analysis
USD, in thousands 2011 2012 2013 2014 2015 2011 2012 2013 2014 2015
Revenue 100% 129% 140% 151% 107% 100% 100% 100% 100% 100%
Operating expenses (adjusted) 100% 125% 150% 149% 125% 54% 52% 58% 53% 63%
Cost of services provided (adjusted) 100% 142% 172% 171% 136% 29% 32% 35% 33% 37%
Development and manufacturing cost 100% 35% 77% 232% 1925% 0% 0% 0% 0% 1%
Administrative and sales cost (adjusted) 100% 109% 128% 129% 98% 26% 22% 24% 22% 24%
Special items (operating) n/a n/a n/a n/a n/a 0% 0% 0% 0% 3%
Reverse of Rental and leasing expenses for the year (capitalized operating
lease) 100% 186% 232% 258% 194% -1% -2% -2% -2% -2%
EBITDA 100% 133% 128% 152% 86% 46% 48% 42% 47% 37%
Depreciation, amortization and impairment losses (adjusted) 100% 112% 129% 168% 150% 22% 19% 20% 24% 30%
Related to Cost of services provided 100% 110% 136% 181% 178% 14% 12% 13% 16% 23%
Related to Administrative and sales cost 100% 110% 132% 265% 136% 2% 2% 2% 3% 2%
Amortization of acquired intangibles in a business combination 100% 100% 100% 99% 96% 5% 4% 3% 3% 4%
Depreciation of capitalized operating lease assets 100% 167% 154% 138% 76% 2% 2% 2% 1% 1%
Operating income (EBIT) 100% 152% 127% 138% 30% 24% 29% 22% 22% 7%
Operating tax (tax on EBIT) 100% 150% 128% 173% 102% 10% 11% 9% 11% 9%
Tax expense adjustment for capitalized operating lease 100% 131% -19% -40% -77% 0% 0% 0% 0% 0%
Operating tax (tax on EBIT) (adjusted) 100% 150% 129% 176% 105% 10% 11% 9% 11% 9%
NOPAT 100% 153% 126% 113% -19% 15% 18% 13% 11% -3%
Net financial expenses 100% 158% 108% 89% 133% 11% 13% 8% 6% 13%
Special items (financing) n/a n/a n/a n/a n/a 0% 0% 1% 0% 0%
Interest on capitalized operating lease 100% 194% 129% 624% 639% 0% 0% 0% 0% 0%
Net financial expenses (adjusted) 100% 159% 122% 93% 137% 11% 13% 9% 7% 14%
Tax shield 100% 159% 122% 91% 129% -3% -3% -2% -2% -3%
Unrealized exchange rate adjustments of foreign subsidiaries and branches 100% -5727% -15068% -22198% -14505% 0% 1% 3% 4% 4%
Net financial expenses after tax 100% 179% 173% 170% 190% 8% 11% 10% 9% 14%
Net income (Net earnings) 100% 123% 72% 49% -256% 7% 7% 4% 2% -17%

120
Appendix 22. Indexing and common-size analysis of analytical balance sheet
In order to gain better understanding of the development in capital utilization both index numbers and
common-size analysis will be applied to Balance sheet. For index analysis, the basis year is 2012 (the
earliest available in USD).
In 2013, the level of invested capital increased by 11%. In 2014, the level of invested capital was
increased by 1%. However, in 2015, it fell back 9%.
The level of ‘intangible assets’ scarcely changes during the observed period. They constitute almost
the entire value of invested capital. As mentioned earlier, the majority of ‘intangible assets’ is in the
form of goodwill and acquired intangible assets. Goodwill and Brand remain on the same level, while
acquired intangible assets are amortized over time.
‘Development projects’ are another component of ‘intangible assets’. The value of completed projects
have been rising, while ‘development projects in progress’ have, since 2015, been on a downward
tumble, that was triggered by the low oil prices prompting OFS companies to send their R&D budgets
on low-funds-diets. Welltec will need to raise its R&D investment if it is to maintain its technological
competitiveness.
Patents and licenses have increased significantly. Yet, in 2015, they only made up 3% of invested
capital.
In 2013 and 2014, at the expense of ‘plant equipment and fleet’, tangible assets’ share of invested
capital grew from 11 to 15 %. In contrast, ‘plant equipment and fleet under construction’ is slowly
decreasing. If this development continues, it may lead to the discontinuance (or disruption) of
completed ‘plant equipment and fleet’. Moreover, ‘other fixtures and fittings, tools and equipment’
have been halved when compared to their level in 2012. The aforementioned is evidence that fewer
investments are being allocated to equipment and tools. Stagnating investments in equipment and
tools can seriously handicap Welltec’s market responsiveness should oil prices pick up and demand
for OFS services increase.
In 2014, there was a notable addition to ‘land and buildings’ in the form of a new manufacturing
facility in Esbjerg, Denmark. Nevertheless, in 2015, ‘land and buildings’ accounted for no more than
2% of invested capital.
Receivables take up the largest share of ‘current assets’, accounting for 13-19% of invested capital.
Trade receivables, receivables’ principle subcategory have declined significantly. In opposition, tax
receivables have more than doubled, but they share is small, constituting only 1% of receivables in
2015.
121
Generally, ‘operating liabilities’ are decreasing. In 2015, they had dropped to 72% of their 2012 value.
Their share of invested capital changed from 22% to 16%. The same trend can be observed in all
operating liabilities’ subcategories.
In 2013, equity grew by 13%, remained on the same level in 2014, but backslid to its initial level in
2015. From 2012-2015, Equity share of invested capital is at an almost stable level, 45-47%. Thus,
NIBD, for that same period, was between 53-55% of invested capital.
Between 2012 and 2015, NIBD grew by 6% caused by increases in non-current liabilities.
Specifically, NIBD’s growth was the result of a small increase in ‘issued bonds’ constituting a large
share of invested capital, a significant increase in ‘finance lease commitments’ that take up a small
share of invested capital, and an increase in ‘bank loan’ to 5% of invested capital.

122
Analytical Balance Sheet (not adjusted) Indexing (trend analysis) Common-size analysis
USD, in thousands 2012 2013 2014 2015 2012 2013 2014 2015
Operating assets 100% 105% 108% 97% 122% 116% 118% 116%
Non-current assets 100% 105% 105% 99% 101% 96% 95% 98%
Intangible assets 100% 101% 100% 96% 82% 74% 73% 76%
Goodwill O 100% 100% 100% 100% 46% 41% 41% 45%
Technology O 100% 93% 85% 78% 12% 10% 9% 9%
Cusomer relationship O 100% 77% 53% 31% 5% 3% 2% 1%
Brand O 100% 100% 100% 100% 3% 2% 2% 3%
Completed development projects O 100% 110% 125% 143% 10% 10% 11% 13%
Development projects in progress O 100% 121% 106% 37% 5% 6% 5% 2%
Patents and licenses O 100% 153% 207% 248% 1% 1% 2% 3%
Tangible assets 100% 122% 128% 114% 20% 22% 23% 22%
Land and buildings O 100% 122% 457% 412% 0% 1% 2% 2%
Leasehold improvements O 100% 138% 129% 100% 0% 0% 0% 0%
Plant equipment and fleet O 100% 142% 147% 136% 11% 14% 15% 15%
Other fixtures and fittings, tools and equipment O 100% 92% 78% 50% 3% 2% 2% 1%
Plant equipment and fleet under construction O 100% 93% 84% 72% 5% 4% 4% 4%
Capitalized operating lease asset O 100% 194% 165% 207% 2% 3% 2% 3%
Current assets 100% 97% 117% 77% 19% 17% 20% 14%
Inventories O 100% 143% 203% 258% 0% 0% 1% 1%
Receivables 100% 96% 115% 73% 19% 16% 19% 13%
Trade receivables O 100% 98% 99% 72% 16% 14% 14% 11%
Tax receivables O 100% 108% 916% 273% 0% 0% 3% 1%
Other receivables O 100% 67% 127% 58% 2% 1% 2% 1%
Prepayments 100% 143% 31% 40% 1% 1% 0% 0%
Prepaid insurance O 100% 282% 150% 146% 0% 0% 0% 0%
Prepaid lease O 100% 29% 32% 59% 0% 0% 0% 0%
Prepaid rent O 100% 224% 87% 68% 0% 0% 0% 0%
Other prepayments O 100% 144% 0% 13% 0% 0% 0% 0%
LESS: Operating liabilities 100% 80% 90% 72% 22% 16% 18% 16%
Non-current liabilities 100% 77% 66% 76% 10% 7% 6% 8%
Deferred tax liabilities 100% 85% 73% 84% 9% 7% 6% 8%
Intangible assets O 100% 109% 84% 79% 9% 9% 7% 7%
Tangible assets O 100% 158% 155% -320% 0% 0% 0% 1%
Current assets O 100% -476% -252% 44% 0% 0% 0% 0%
Change in tax rate, coming years O n/a n/a n/a n/a 0% -1% 0% 0%
Tax contingencies O 100% 0% 0% 0% 1% 0% 0% 0%
Tax loss carried forward O 100% 102% 0% 8% 0% 0% 0% 0%
Other non-current liabilities O 100% 8% 0% 0% 1% 0% 0% 0%
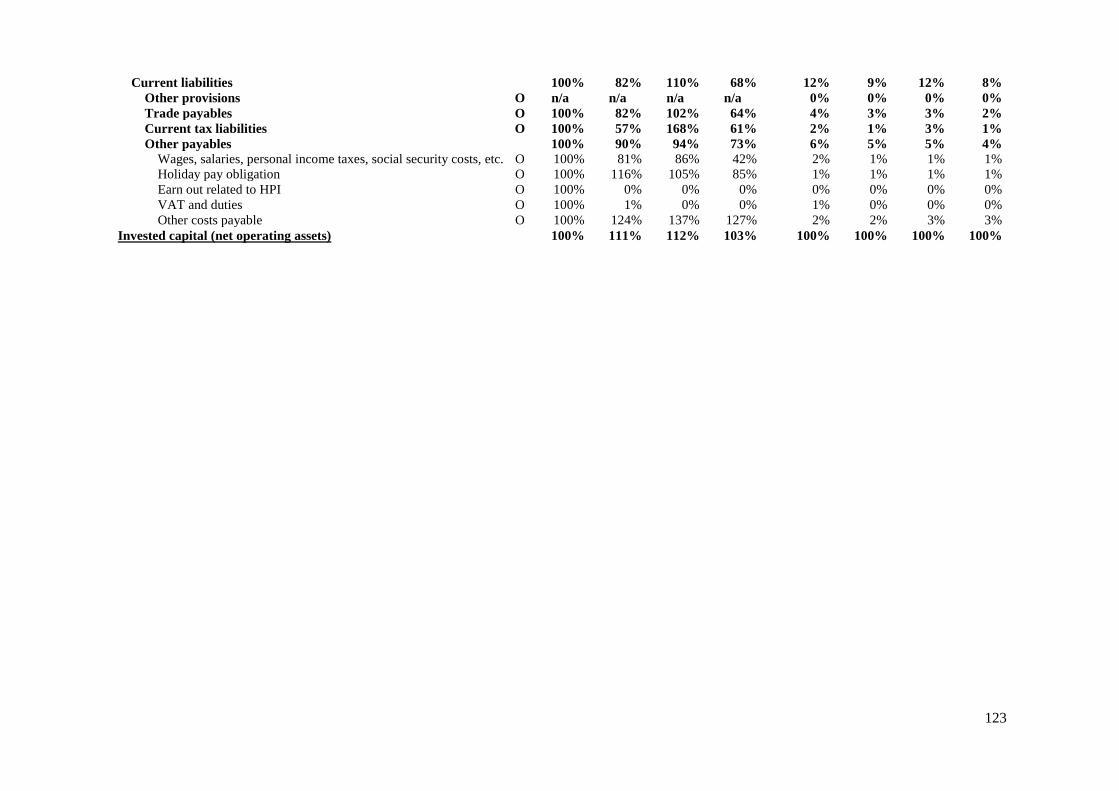
123
Current liabilities 100% 82% 110% 68% 12% 9% 12% 8%
Other provisions O n/a n/a n/a n/a 0% 0% 0% 0%
Trade payables O 100% 82% 102% 64% 4% 3% 3% 2%
Current tax liabilities O 100% 57% 168% 61% 2% 1% 3% 1%
Other payables 100% 90% 94% 73% 6% 5% 5% 4%
Wages, salaries, personal income taxes, social security costs, etc. O 100% 81% 86% 42% 2% 1% 1% 1%
Holiday pay obligation O 100% 116% 105% 85% 1% 1% 1% 1%
Earn out related to HPI O 100% 0% 0% 0% 0% 0% 0% 0%
VAT and duties O 100% 1% 0% 0% 1% 0% 0% 0%
Other costs payable O 100% 124% 137% 127% 2% 2% 3% 3%
Invested capital (net operating assets) 100% 111% 112% 103% 100% 100% 100% 100%

124
Analytical Balance Sheet (not adjusted) Indexing (trend analysis) Common-size analysis
USD, in thousands 2012 2013 2014 2015 2012 2013 2014 2015
Equity 100% 113% 115% 99% 46% 47% 48% 45%
Share capital F 100% 105% 105% 106% 0% 0% 0% 0%
Currency translation reserve F 100% 367% 761% 1019% -1% -2% -4% -7%
Reserve for capitalized development projects n/a n/a n/a n/a 0% 0% 0% 0%
Retained earnings F 100% 117% 123% 111% 47% 50% 52% 51%
Retained earnings adjustment related to capitalized operating lease F 100% 87% 57% -2% 0% 0% 0% 0%
Non-controlling interest F 100% 102% 0% 0% 0% 0% 0% 0%
Net interest bearing debt 100% 109% 109% 106% 54% 53% 52% 55%
Non-current liabilities 100% 104% 108% 113% 58% 55% 56% 64%
Deferred tax liabilities (adjusted) 100% -1014% -899% -197% 0% 2% 2% 0%
Current and non-current liabilities F 100% -1821% -1602% -348% 0% 2% 2% 0%
Deferred tax liabilities related to capitalized operating lease F 100% 87% 60% 9% 0% 0% 0% 0%
Finance lease commitments F 100% 146% 770% 747% 0% 0% 1% 1%
Issued bonds F 100% 101% 102% 101% 58% 53% 53% 57%
Bank debt F n/a n/a n/a n/a 0% 0% 0% 5%
Current liabilities 100% 90% 78% 76% 3% 2% 2% 2%
Current portion of non-current liabilities F 100% 62% 59% 63% 0% 0% 0% 0%
Payables to affiliates F 100% 30% 0% 0% 0% 0% 0% 0%
Other payables 100% 101% 89% 86% 2% 2% 2% 2%
Derivative financial instruments F n/a n/a n/a n/a 0% 0% 0% 0%
Accrued interests F 100% 93% 89% 86% 2% 2% 2% 2%
Capitalized operating lease liability 100% 177% 147% 173% 2% 3% 3% 3%
LESS: Financial assets 100% 68% 60% 38% 1% 1% 0% 0%
Tax receivables F 100% 105% 0% 0% 0% 0% 0% 0%
Other recievables F 100% 53% 84% 53% 1% 0% 0% 0%
LESS: Current assets 100% 95% 100% 159% 9% 7% 8% 14%
Receivables 100% 117% 88% 49% 1% 1% 1% 0%
Current portion of non-current assets F 100% 100% 0% 0% 0% 0% 0% 0%
Receivables from affiliates F n/a n/a n/a n/a 0% 0% 0% 0%
Prepayments 100% 133% 173% 97% 0% 0% 1% 0%
Prepaid creditors F 100% 133% 173% 97% 0% 0% 1% 0%
Cash and cash equivalents F 100% 92% 102% 145% 8% 7% 7% 11%
Securities F n/a n/a n/a n/a 0% 0% 0% 2%
Invested capital (financing) 100% 111% 112% 103% 100% 100% 100% 100%
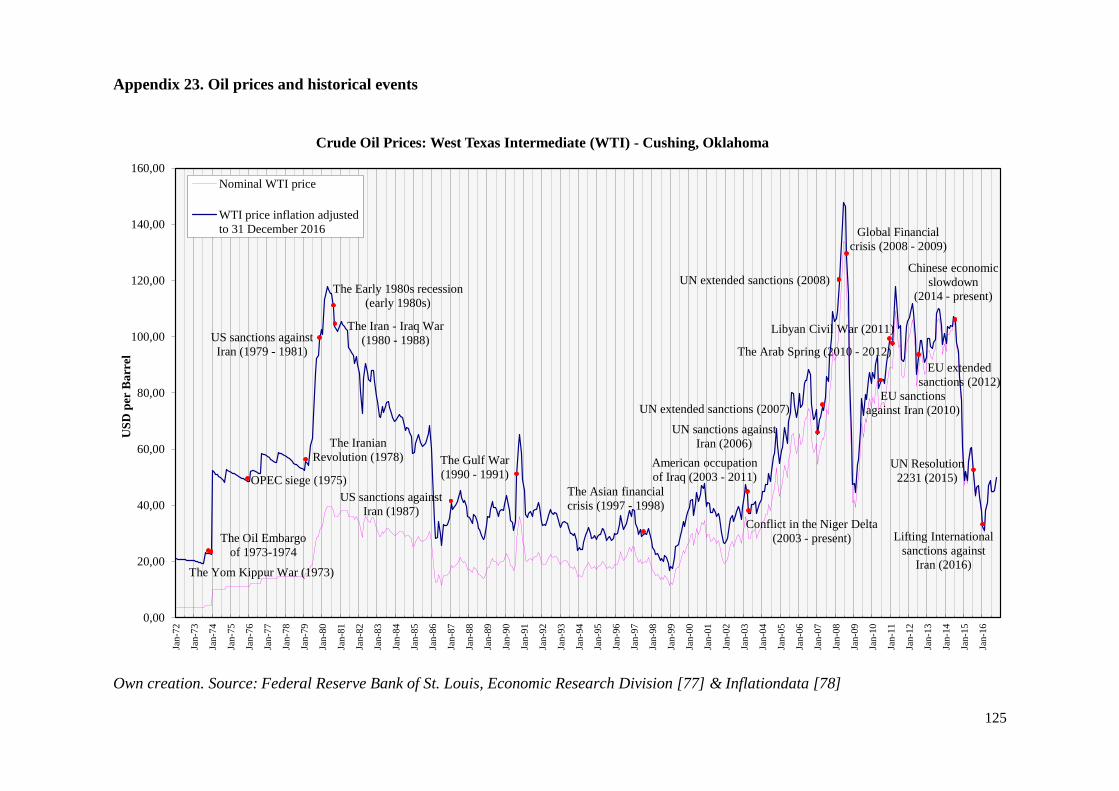
125
Appendix 23. Oil prices and historical events
Own creation. Source: Federal Reserve Bank of St. Louis, Economic Research Division [77] & Inflationdata [78]
The Yom Kippur War (1973)
The Oil Embargo
of 1973-1974
OPEC siege (1975)
The Iranian
Revolution (1978)
US sanctions against
Iran (1979 - 1981)
The Iran - Iraq War
(1980 - 1988)
The Early 1980s recession
(early 1980s)
US sanctions against
Iran (1987)
The Gulf War
(1990 - 1991)
The Asian financial
crisis (1997 - 1998)
American occupation
of Iraq (2003 - 2011)
Conflict in the Niger Delta
(2003 - present)
UN sanctions against
Iran (2006)
UN extended sanctions (2007)
UN extended sanctions (2008)
Global Financial
crisis (2008 - 2009)
EU sanctions
against Iran (2010)
The Arab Spring (2010 - 2012)
Libyan Civil War (2011)
EU extended
sanctions (2012)
Chinese economic
slowdown
(2014 - present)
UN Resolution
2231 (2015)
Lifting International
sanctions against
Iran (2016)
0,00
20,00
40,00
60,00
80,00
100,00
120,00
140,00
160,00Ja
n-7
2
Jan-7
3
Jan-7
4
Jan-7
5
Jan-7
6
Jan-7
7
Jan-7
8
Jan-7
9
Jan-8
0
Jan-8
1
Jan-8
2
Jan-8
3
Jan-8
4
Jan-8
5
Jan-8
6
Jan-8
7
Jan-8
8
Jan-8
9
Jan-9
0
Jan-9
1
Jan-9
2
Jan-9
3
Jan-9
4
Jan-9
5
Jan-9
6
Jan-9
7
Jan-9
8
Jan-9
9
Jan-0
0
Jan-0
1
Jan-0
2
Jan-0
3
Jan-0
4
Jan-0
5
Jan-0
6
Jan-0
7
Jan-0
8
Jan-0
9
Jan-1
0
Jan-1
1
Jan-1
2
Jan-1
3
Jan-1
4
Jan-1
5
Jan-1
6
US
D p
er B
arr
el
Crude Oil Prices: West Texas Intermediate (WTI) - Cushing, Oklahoma
Nominal WTI price
WTI price inflation adjusted
to 31 December 2016

126
Appendix 24. Technology development
Source: Chatham House. [11, p.63]
Arctic
EOR
HPHT
Contaminated gas
Shale oil/gas
Ultra deepwater
Heavy oil
Tight oil/gas
CBM
Pre-salt
Unconventional
Deepwater
Conventional
Shallow water
Onshore
Offshore
Today 10 years ago 20 years ago

127
Appendix 25. Estimate of breakeven price for incremental oil production projects
Source: Citigroup as presented in Chatham House [11, p.65]

128
Appendix 26. Global greenhouse gas emissions by economic sector
Source: US Environmental Protection Agency [55]
Electricity
and heat
production
25%
Agriculture,
forestry and
other land use
24%Industry
21%
Transportation
14%
Buildings
6%
Other
energy
10%

129
Appendix 27. Regulatory systems governing the petroleum industry
Own creation. Source: Hunter T. [25, p.46], Feng Zh., Zhang Sh.-B. & Gao Y. [31, p.395-396] and
Mitchell J. [11, p.36]
* The ‘discretionary’ discretionary allocation of petroleum licenses was used by the Norwegian
government prior to 1994. [25, p.54-55]
Contractual based
system
Production
sharing contracts
Pure service
contracts
Risk service
contracts
Service contracts
Cash bid Work program
bid
‘Discretionary’
discretion*
‘Objective’
discretion
Bid or auction
system
Discretionary
system
Licensing &
concession system
Petroleum
regulatory system
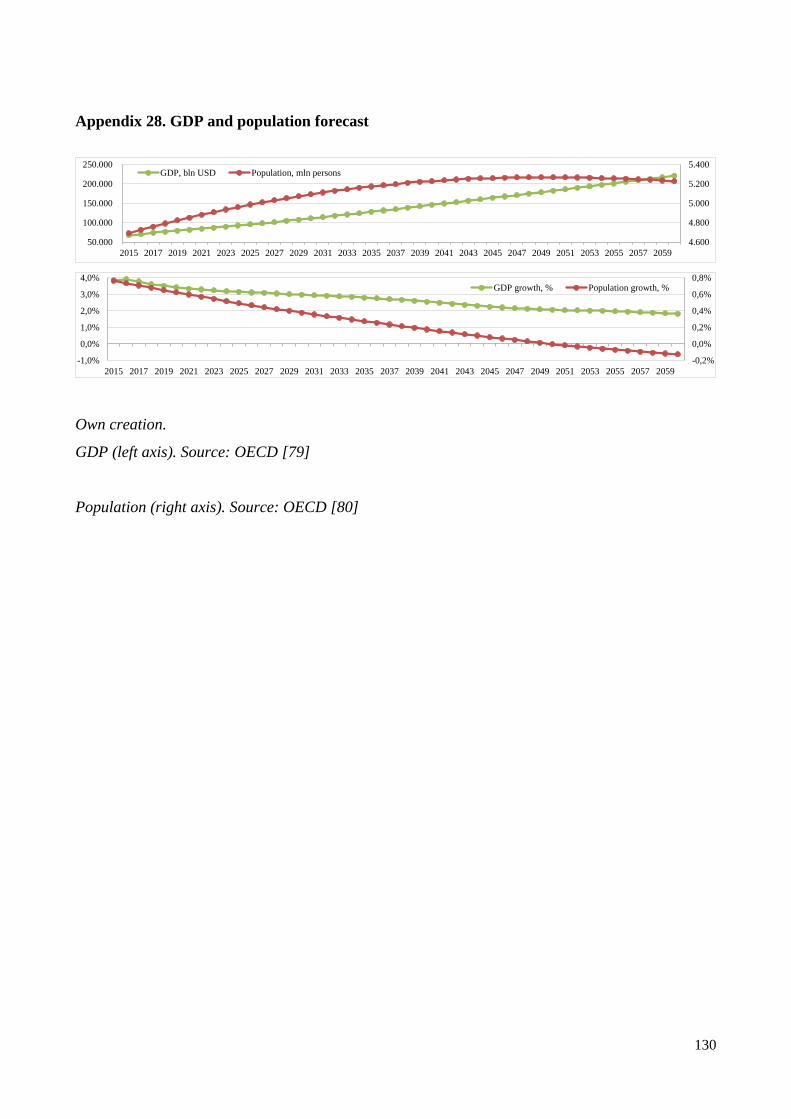
130
Appendix 28. GDP and population forecast
Own creation.
GDP (left axis). Source: OECD [79]
Population (right axis). Source: OECD [80]
4.600
4.800
5.000
5.200
5.400
50.000
100.000
150.000
200.000
250.000
2015 2017 2019 2021 2023 2025 2027 2029 2031 2033 2035 2037 2039 2041 2043 2045 2047 2049 2051 2053 2055 2057 2059
GDP, bln USD Population, mln persons
-0,2%
0,0%
0,2%
0,4%
0,6%
0,8%
-1,0%
0,0%
1,0%
2,0%
3,0%
4,0%
2015 2017 2019 2021 2023 2025 2027 2029 2031 2033 2035 2037 2039 2041 2043 2045 2047 2049 2051 2053 2055 2057 2059
GDP growth, % Population growth, %

131
Appendix 29. Recent cost trends for selected technologies
2016 is estimate
Source: IEA World Energy Outlook 2016 [41, p.53]

132
Appendix 30. Recent historical and estimated oil price
Analysts estimate oil price (Brent), median, $/barrel
Own creation.
Nominal oil price. Source: Federal Reserve Bank of St. Louis, Economic Research Division [81]
Estimate. Source: KPMG Market Update: Oil & Gas [52]
20
40
60
80
100
120
Jan
-14
Mar
-14
May
-14
Jul-
14
Sep
-14
No
v-1
4
Jan
-15
Mar
-15
May
-15
Jul-
15
Sep
-15
No
v-1
5
Jan
-16
Mar
-16
May
-16
Jul-
16
Sep
-16
No
v-1
6
Jan
-17
Mar
-17
May
-17
Jul-
17
Sep
-17
No
v-1
7
Jan
-18
Mar
-18
May
-18
Jul-
18
Sep
-18
No
v-1
8
Jan
-19
Mar
-19
May
-19
Jul-
19
Sep
-19
No
v-1
9
Nominal oil price Estimated oil price

133
Appendix 31. Fossil fuel prices according to IEA World Energy Outlook 2016
Fossil-fuel import prices by scenario:
IEA WEO 2016 2015
real terms
Current Policies Scenario New Policies Scenario*
2020 2030 2040 2020 2030 2040
Crude oil ($/barrel) 51 82 127 146 79 111 124
Natural gas ($/barrel)
United States 2,6 4,3 5,9 7,9 4,1 5,4 6,9
European Union 7,0 7,3 11,1 13,0 7,1 10,3 11,5
China 9,7 9,5 12,5 13,9 9,2 11,6 12,1
Japan 10,3 9,9 13,0 14,4 9,6 11,9 12,4
* New policy scenario based on a detailed review of existing policies and policy announcements
worldwide in relation to the Paris Agreement commitments (COP21) and includes IEA judgment on
how far and how fast the policy commitments would be met. [41, p.32]
Average IEA crude oil import price by scenario:
Source: IEA World Energy Outlook 2016 [41, p.45, 48]
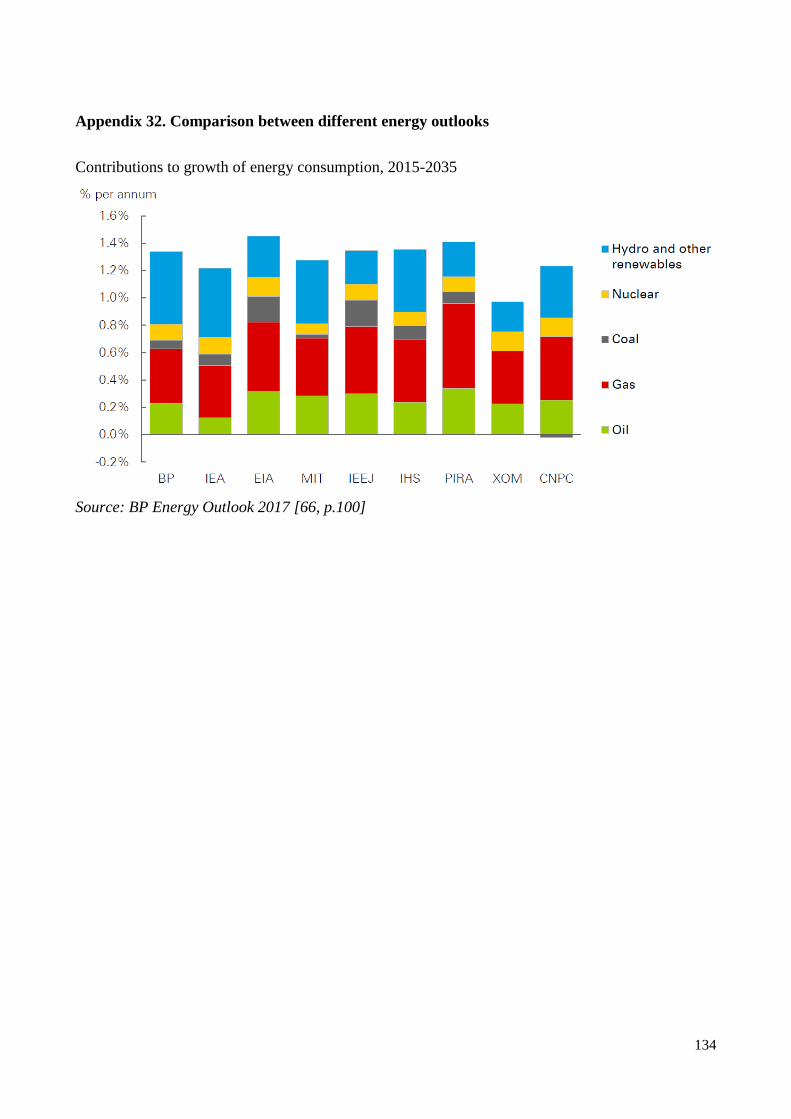
134
Appendix 32. Comparison between different energy outlooks
Contributions to growth of energy consumption, 2015-2035
Source: BP Energy Outlook 2017 [66, p.100]

135
Appendix 33. Well tractor ®
Source: Welltec [61]

136
Appendix 34. Financial statement adjusted for non-recurring items
Analytical income statement
USD in thousands 2011 2012 2013 2014 2015
Revenue 229.223 295.387 321.165 345.009 245.726
Operating expenses -121.404 -153.526 -184.507 -183.520 -154.256
Cost of services provided (adjusted) -66.012 -94.056 -113.353 -113.088 -89.980
Development and manufacturing cost -128 -45 -99 -297 -2.464
Reverse of Depreciation and amortization related to
Development and manufacturing cost 2.133 1.127 1.077 915 588
Administrative and sales cost (adjusted) -59.902 -65.216 -76.432 -77.502 -58.750
Special items (operating) 0 0 -1.517 0 -8.500
Reverse of Rental and leasing expenses for the year
(capitalized operating lease) 2.505 4.664 5.817 6.452 4.850
EBITDA 107.819 141.861 136.658 161.489 91.470
Depreciation, amortization and impairment losses -51.772 -56.854 -65.309 -84.290 -74.921
Amortization and impairment loss of intangible assets -24.079 -26.336 -30.236 -41.719 -36.008
Depreciation and impairment loss of tangible assets -24.226 -24.712 -29.719 -37.803 -36.265
Depreciation of capitalized operating lease assets -3.467 -5.806 -5.354 -4.768 -2.648
Operating income (EBIT) 56.047 85.007 71.349 77.199 16.549
Operating tax (adjusted for non-recurring items) -21.835 -33.172 -23.792 -27.887 -22.908
NOPAT 34.212 51.836 47.557 49.311 -6.359
Net financial expenses -24.150 -38.261 -26.175 -21.499 -32.193
Special items (financing) (adjusted for non-recurring items) 0 0 0 0 0
Interest on lease assets -190 -368 -244 -1.182 -1.212
Net financial expenses (adjusted) -24.340 -38.629 -26.419 -22.681 -33.405
Tax shield 6.085 9.657 6.605 5.557 7.850
Unrealized exchange rate adjustments of foreign subsidaries
and branches 62 -3.551 -9.342 -13.763
Net financial expenses after tax -18.193 -32.523 -29.157 -30.887 -34.548
Net income (Net earnings) 16.019 19.312 18.401 18.424 -40.907
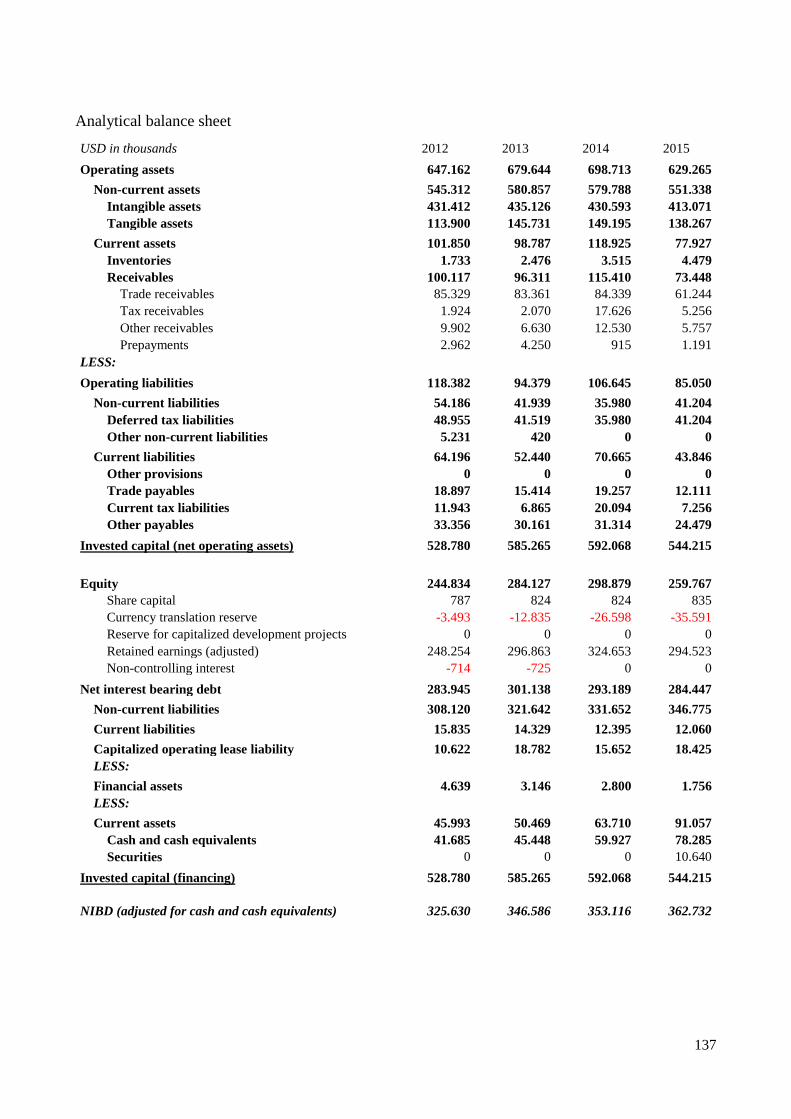
137
Analytical balance sheet
USD in thousands 2012 2013 2014 2015
Operating assets 647.162 679.644 698.713 629.265
Non-current assets 545.312 580.857 579.788 551.338
Intangible assets 431.412 435.126 430.593 413.071
Tangible assets 113.900 145.731 149.195 138.267
Current assets 101.850 98.787 118.925 77.927
Inventories 1.733 2.476 3.515 4.479
Receivables 100.117 96.311 115.410 73.448
Trade receivables 85.329 83.361 84.339 61.244
Tax receivables 1.924 2.070 17.626 5.256
Other receivables 9.902 6.630 12.530 5.757
Prepayments 2.962 4.250 915 1.191
LESS:
Operating liabilities 118.382 94.379 106.645 85.050
Non-current liabilities 54.186 41.939 35.980 41.204
Deferred tax liabilities 48.955 41.519 35.980 41.204
Other non-current liabilities 5.231 420 0 0
Current liabilities 64.196 52.440 70.665 43.846
Other provisions 0 0 0 0
Trade payables 18.897 15.414 19.257 12.111
Current tax liabilities 11.943 6.865 20.094 7.256
Other payables 33.356 30.161 31.314 24.479
Invested capital (net operating assets) 528.780 585.265 592.068 544.215
Equity 244.834 284.127 298.879 259.767
Share capital 787 824 824 835
Currency translation reserve -3.493 -12.835 -26.598 -35.591
Reserve for capitalized development projects 0 0 0 0
Retained earnings (adjusted) 248.254 296.863 324.653 294.523
Non-controlling interest -714 -725 0 0
Net interest bearing debt 283.945 301.138 293.189 284.447
Non-current liabilities 308.120 321.642 331.652 346.775
Current liabilities 15.835 14.329 12.395 12.060
Capitalized operating lease liability 10.622 18.782 15.652 18.425
LESS:
Financial assets 4.639 3.146 2.800 1.756
LESS:
Current assets 45.993 50.469 63.710 91.057
Cash and cash equivalents 41.685 45.448 59.927 78.285
Securities 0 0 0 10.640
Invested capital (financing) 528.780 585.265 592.068 544.215
NIBD (adjusted for cash and cash equivalents) 325.630 346.586 353.116 362.732

138
Cash flow statement
USD in thousands 2012 2013 2014 2015
EBITDA 141.861 136.658 161.489 91.470
LESS: Operating tax (tax on EBIT) (adjusted for non-recurring items) -33.172 -23.792 -27.887 -22.908
Cash flow from operations before changes in NWC 108.689 112.866 133.602 68.562
ADD:
Changes in inventories 115 -743 -1.039 -964
Changes in receivables n/d 3.806 -19.099 41.962
Changes in operating debt n/d -24.003 12.266 -21.595
Cash flow from operations n/a 91.926 125.730 87.965
LESS:
Investments in non-current assets n/d -100.855 -83.221 -46.471
Free cash flow n/a -8.929 42.509 41.494
LESS (-) / ADD (+):
New net interest bearing debt (adjusted for cash and cash
equivalents) n/d 20.956 6.530 9.616
Net financial expenses before tax -43.364 -38.875 -40.911 -45.160
Tax shield 10.841 9.719 10.023 10.613
Dividend paid out to shareholders -34.500 0 0 0
Sale of own shares 1.416 Purchase of own shares and warrants -33.202 -3.939 -233.799
Purchase of minority interest 0 Share-based payment to executives 2.710 13 505
Tax credit relating to share option scheme 5.887 254 52
Capital increase -30 45.965 235.724
Cost related to capital increase -1.884 -687
Free cash flow to owners n/a 3.763 14.479 18.358

139
Appendix 35. Revenue forecast using Holt’s model
Under Holt’s model, revenue is a sum of ‘level’ and ‘trend’.
The first step is to estimate initial ‘level’ and ‘trend’ (i.e. ‘level’ and ‘trend’ for period ZERO – period preceding the first observation).
Running a linear regression for ‘revenue’ observations for the full period (from Q1 2013 till Q3 2016) ‘level’ is computed as ‘intercept’ and
‘trend’ is computed as ‘slope’. [28, p.26]
‘Revenue’ forecast for the following periods is calculated as a sum of ‘level’ and ‘trend’ for previous periods:
ttt TLF 1 [28, p.27]
Where:
Ft+1 – revenue forecast;
Lt – level for previous period;
Tt – trend for previous period.
After observing ‘revenue’ in period t, ‘level and ‘trend’ are revised following the formulas:
))(1(11 tttt TLRL
[28, p.27]
tttt TLLT )1()( 11` [28, p.27]
Where:
Lt+1 – level for the following period;
Tt+1 – trend for the following period.
Rt+1 – revenue observation (actual) for the following period;
Lt – level for previous period;
Tt – trend for previous period;
α, β – exponential smoothing constants lying in the range between 0 and 1.
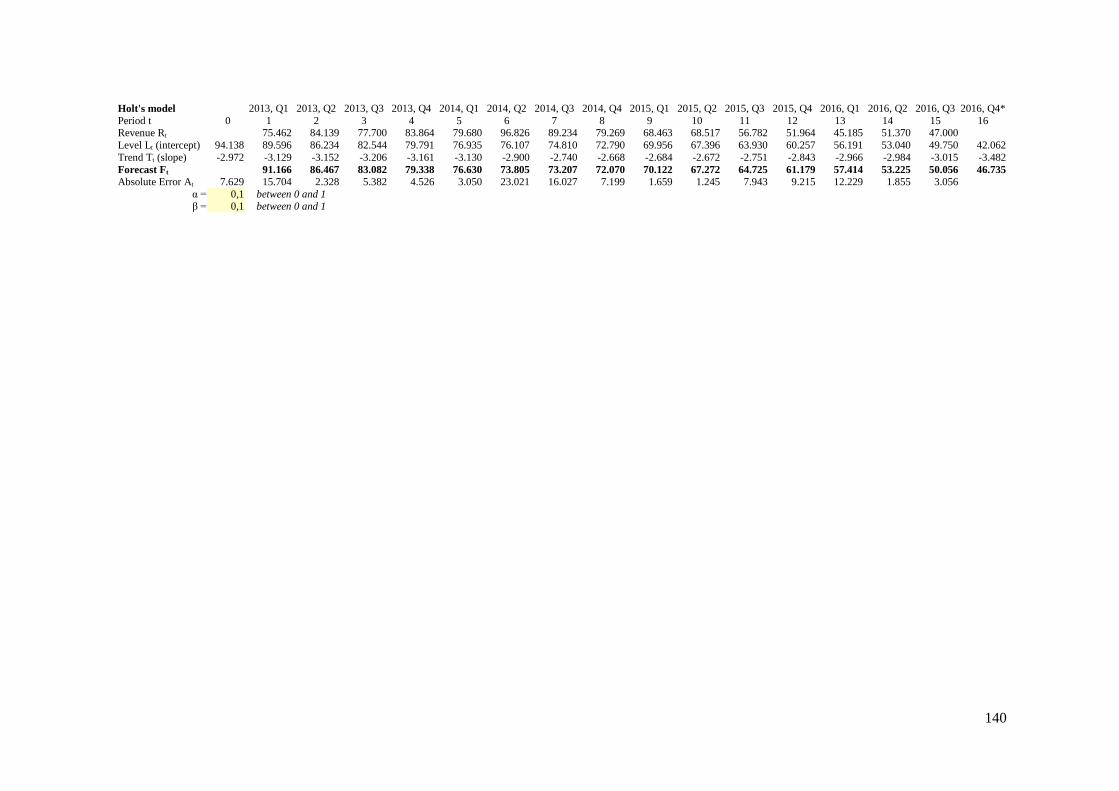
140
Holt's model 2013, Q1 2013, Q2 2013, Q3 2013, Q4 2014, Q1 2014, Q2 2014, Q3 2014, Q4 2015, Q1 2015, Q2 2015, Q3 2015, Q4 2016, Q1 2016, Q2 2016, Q3 2016, Q4*
Period t 0 1 2 3 4 5 6 7 8 9 10 11 12 13 14 15 16 Revenue Rt 75.462 84.139 77.700 83.864 79.680 96.826 89.234 79.269 68.463 68.517 56.782 51.964 45.185 51.370 47.000 Level Lt (intercept) 94.138 89.596 86.234 82.544 79.791 76.935 76.107 74.810 72.790 69.956 67.396 63.930 60.257 56.191 53.040 49.750 42.062
Trend Tt (slope) -2.972 -3.129 -3.152 -3.206 -3.161 -3.130 -2.900 -2.740 -2.668 -2.684 -2.672 -2.751 -2.843 -2.966 -2.984 -3.015 -3.482
Forecast Ft 91.166 86.467 83.082 79.338 76.630 73.805 73.207 72.070 70.122 67.272 64.725 61.179 57.414 53.225 50.056 46.735
Absolute Error At 7.629 15.704 2.328 5.382 4.526 3.050 23.021 16.027 7.199 1.659 1.245 7.943 9.215 12.229 1.855 3.056 α = 0,1 between 0 and 1 β = 0,1 between 0 and 1

141
Appendix 36. Inventory forecast using simple exponential smoothing model
Simple exponential smoothing is ‘an average method that weights the most recent data’. [28, p.20]
The first step is to estimate the initial ‘level’ which is calculated as an average for 4 months. Therefore, the earliest period for which forecasted
value could be obtained is Q4 2013 (average for Q1 – Q4 2013).
After calculating inventories forecast in Q4 2013, the inventories forecast for Q1 2014 and following quarters until Q 4 2016 can be computed
based on the formula:
ttt FIF )1(1 [28, p.20]
Where:
Ft+1 – inventories forecast for the following period;
It – actual inventories in previous period;
Ft+1 – inventories forecast for the previous period;
α – exponential smoothing constant lying in the range between 0,01 and 0,5.
Simple Exponential
Smoothing 2013, Q1 2013, Q2 2013, Q3 2013, Q4 2014, Q1 2014, Q2 2014, Q3 2014, Q4 2015, Q1 2015, Q2 2015, Q3 2015, Q4 2016, Q1 2016, Q2 2016, Q3 2016, Q4* Period t 0 1 2 3 4 5 6 7 8 9 10 11 12 13 14 15 16
Inventories It 2.083 2.296 2.670 2.476 2.374 2.244 2.237 3.515 3.365 4.926 5.831 4.479 4.575 4.709 5.415 Forecast Ft 2.381 2.429 2.401 2.323 2.280 2.897 3.131 4.029 4.930 4.704 4.640 4.674 5.045
Absolute Error At 635 55 157 86 1.235 468 1.795 1.802 451 129 69 741 α = 0,5 between 0 and 1

142
Appendix 37. Forecast of Q4 2016 and 2016
Analytical income statement
USD in thousands 2015, Q1 2015, Q2 2015, Q3 2015, Q4 2016, Q1 2016, Q2 2016, Q3 2016, Q4 2016
Revenue 68.463 68.517 56.782 51.964 45.185 51.370 47.000 46.735 190.290
Operating expenses -41.853 -41.169 -34.476 -36.757 -32.334 -31.912 -30.269 -31.365
-
125.881
Cost of services provided (adjusted) -23.422 -20.666 -19.347 -26.546 -18.906 -17.811 -16.958
Development and manufacturing cost -216 161 -180 -2.229 -1.748 -1.457 -1.581 Reverse of Depreciation and amortization related to Development and
manufacturing cost 147 147 147 147 147 147 147
Administrative and sales cost (adjusted) -16.633 -17.942 -14.587 -9.588 -11.501 -13.072 -12.129
Special items (operating) -2.942 -4.082 -1.722 246 -1.063 -456 -485
Reverse of Rental and leasing expenses for the year (capitalized operating lease) 1.212 1.212 1.212 1.212 736 736 736
EBITDA 26.610 27.348 22.306 15.207 12.851 19.458 16.731 15.370 64.409
Depreciation, amortization and impairment losses -18.385 -18.391 -18.386 -19.758 -71.728 -16.351 -16.351 -14.490
-
118.922
Amortization and impairment loss of intangible assets n/d n/d n/d n/d n/d n/d n/d -6.381 n/d
Depreciation and impairment loss of tangible assets n/d n/d n/d n/d n/d n/d n/d -7.458 n/d
Depreciation of capitalized operating lease assets1 -662 -662 -662 -662 -651 -651 -651 -651 -2.605
Operating income (EBIT) 8.224 8.956 3.919 -4.552 -58.878 3.106 379 880 -54.513
Operating tax (tax on EBIT) (adjusted for non-recurring items) -4.046 -4.452 -2.958 -11.452 10.398 -5.173 -3.095 -581 1.549
NOPAT 4.179 4.504 962 -16.004 -48.480 -2.067 -2.716 299 -52.964
Net financial expenses -3.236 -9.335 -6.112 -13.510 -10.462 -7.778 -6.287
Special items (financing) (adjusted for non-recurring items) 0 0 0 0 0 0 0
Interest on lease assets -303 -303 -303 -303 -385 -385 -385
Net financial expenses (adjusted) -3.539 -9.638 -6.415 -13.813 -10.847 -8.163 -6.672
Tax shield 832 2.265 1.508 3.246 2.386 1.796 1.468
Unrealized exchange rate adjustments of foreign subsidaries and branches -2.983 1.056 -5.091 -1.975 3.138 150 367
Net financial expenses after tax -5.690 -6.317 -9.998 -12.542 -5.322 -6.217 -4.837 -17.799 -34.175
Net income (Net earnings) -1.512 -1.813 -9.037 -28.546 -53.803 -8.284 -7.553 -17.500 -87.139
1 – Assuming depreciation expense is equally allocated during the year
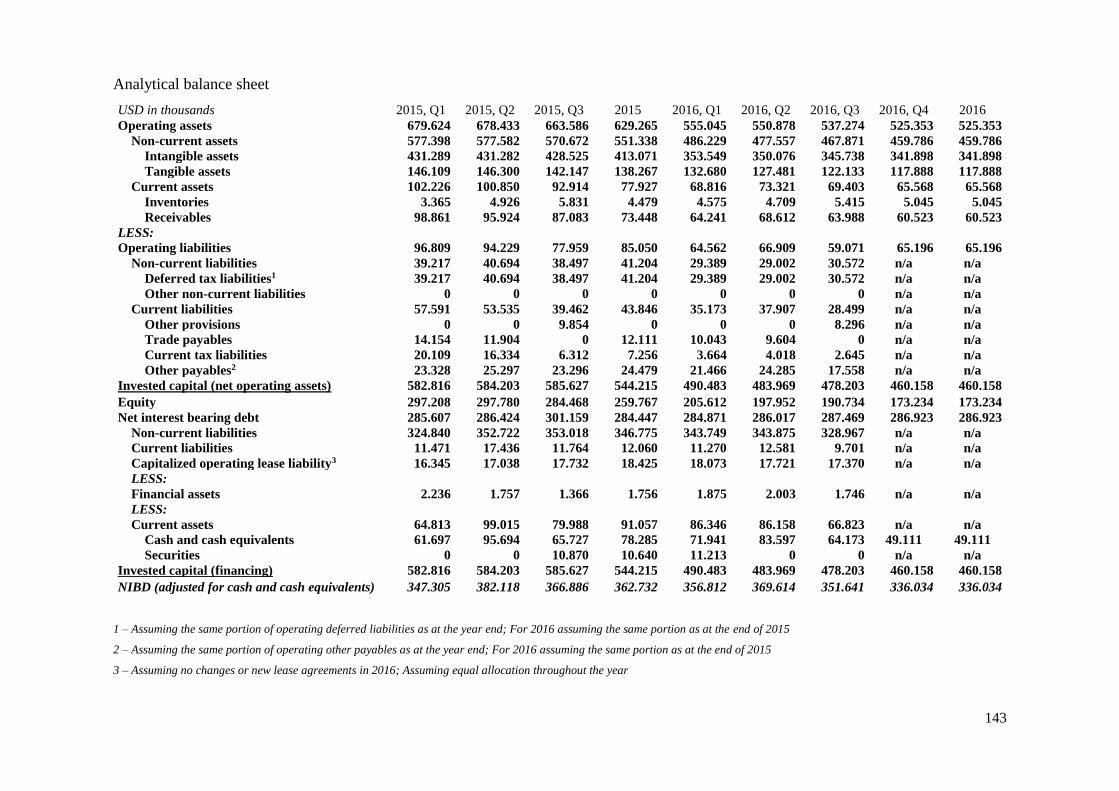
143
Analytical balance sheet
USD in thousands 2015, Q1 2015, Q2 2015, Q3 2015 2016, Q1 2016, Q2 2016, Q3 2016, Q4 2016
Operating assets 679.624 678.433 663.586 629.265 555.045 550.878 537.274 525.353 525.353
Non-current assets 577.398 577.582 570.672 551.338 486.229 477.557 467.871 459.786 459.786
Intangible assets 431.289 431.282 428.525 413.071 353.549 350.076 345.738 341.898 341.898
Tangible assets 146.109 146.300 142.147 138.267 132.680 127.481 122.133 117.888 117.888
Current assets 102.226 100.850 92.914 77.927 68.816 73.321 69.403 65.568 65.568
Inventories 3.365 4.926 5.831 4.479 4.575 4.709 5.415 5.045 5.045
Receivables 98.861 95.924 87.083 73.448 64.241 68.612 63.988 60.523 60.523
LESS: Operating liabilities 96.809 94.229 77.959 85.050 64.562 66.909 59.071 65.196 65.196
Non-current liabilities 39.217 40.694 38.497 41.204 29.389 29.002 30.572 n/a n/a
Deferred tax liabilities1 39.217 40.694 38.497 41.204 29.389 29.002 30.572 n/a n/a
Other non-current liabilities 0 0 0 0 0 0 0 n/a n/a
Current liabilities 57.591 53.535 39.462 43.846 35.173 37.907 28.499 n/a n/a
Other provisions 0 0 9.854 0 0 0 8.296 n/a n/a
Trade payables 14.154 11.904 0 12.111 10.043 9.604 0 n/a n/a
Current tax liabilities 20.109 16.334 6.312 7.256 3.664 4.018 2.645 n/a n/a
Other payables2 23.328 25.297 23.296 24.479 21.466 24.285 17.558 n/a n/a
Invested capital (net operating assets) 582.816 584.203 585.627 544.215 490.483 483.969 478.203 460.158 460.158 Equity 297.208 297.780 284.468 259.767 205.612 197.952 190.734 173.234 173.234
Net interest bearing debt 285.607 286.424 301.159 284.447 284.871 286.017 287.469 286.923 286.923
Non-current liabilities 324.840 352.722 353.018 346.775 343.749 343.875 328.967 n/a n/a
Current liabilities 11.471 17.436 11.764 12.060 11.270 12.581 9.701 n/a n/a
Capitalized operating lease liability3 16.345 17.038 17.732 18.425 18.073 17.721 17.370 n/a n/a
LESS: Financial assets 2.236 1.757 1.366 1.756 1.875 2.003 1.746 n/a n/a
LESS: Current assets 64.813 99.015 79.988 91.057 86.346 86.158 66.823 n/a n/a
Cash and cash equivalents 61.697 95.694 65.727 78.285 71.941 83.597 64.173 49.111 49.111
Securities 0 0 10.870 10.640 11.213 0 0 n/a n/a
Invested capital (financing) 582.816 584.203 585.627 544.215 490.483 483.969 478.203 460.158 460.158 NIBD (adjusted for cash and cash equivalents) 347.305 382.118 366.886 362.732 356.812 369.614 351.641 336.034 336.034
1 – Assuming the same portion of operating deferred liabilities as at the year end; For 2016 assuming the same portion as at the end of 2015
2 – Assuming the same portion of operating other payables as at the year end; For 2016 assuming the same portion as at the end of 2015
3 – Assuming no changes or new lease agreements in 2016; Assuming equal allocation throughout the year
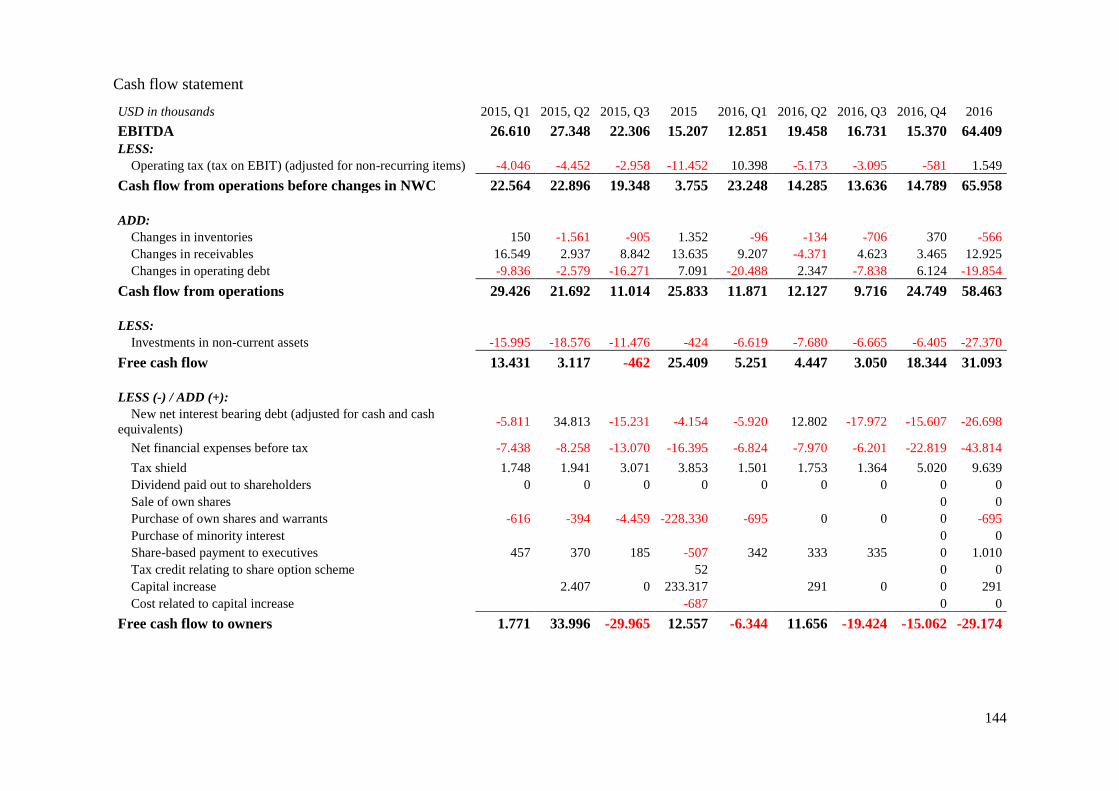
144
Cash flow statement
USD in thousands 2015, Q1 2015, Q2 2015, Q3 2015 2016, Q1 2016, Q2 2016, Q3 2016, Q4 2016
EBITDA 26.610 27.348 22.306 15.207 12.851 19.458 16.731 15.370 64.409
LESS: Operating tax (tax on EBIT) (adjusted for non-recurring items) -4.046 -4.452 -2.958 -11.452 10.398 -5.173 -3.095 -581 1.549
Cash flow from operations before changes in NWC 22.564 22.896 19.348 3.755 23.248 14.285 13.636 14.789 65.958
ADD:
Changes in inventories 150 -1.561 -905 1.352 -96 -134 -706 370 -566
Changes in receivables 16.549 2.937 8.842 13.635 9.207 -4.371 4.623 3.465 12.925
Changes in operating debt -9.836 -2.579 -16.271 7.091 -20.488 2.347 -7.838 6.124 -19.854
Cash flow from operations 29.426 21.692 11.014 25.833 11.871 12.127 9.716 24.749 58.463
LESS:
Investments in non-current assets -15.995 -18.576 -11.476 -424 -6.619 -7.680 -6.665 -6.405 -27.370
Free cash flow 13.431 3.117 -462 25.409 5.251 4.447 3.050 18.344 31.093
LESS (-) / ADD (+):
New net interest bearing debt (adjusted for cash and cash
equivalents) -5.811 34.813 -15.231 -4.154 -5.920 12.802 -17.972 -15.607 -26.698
Net financial expenses before tax -7.438 -8.258 -13.070 -16.395 -6.824 -7.970 -6.201 -22.819 -43.814
Tax shield 1.748 1.941 3.071 3.853 1.501 1.753 1.364 5.020 9.639
Dividend paid out to shareholders 0 0 0 0 0 0 0 0 0
Sale of own shares 0 0
Purchase of own shares and warrants -616 -394 -4.459 -228.330 -695 0 0 0 -695
Purchase of minority interest 0 0
Share-based payment to executives 457 370 185 -507 342 333 335 0 1.010
Tax credit relating to share option scheme 52 0 0
Capital increase 2.407 0 233.317 291 0 0 291
Cost related to capital increase -687 0 0
Free cash flow to owners 1.771 33.996 -29.965 12.557 -6.344 11.656 -19.424 -15.062 -29.174

145
Appendix 38. Forecast assumptions
Key financial drivers 2011 2012 2013 2014 2015 2016 2011-2015 2011-2016 2011-2014 2015-2016 2017 2018 2019 2020 2021 2022 2023 2024 2025
forecast average average average
’good years’ average
’bad years’ Early Convalescence Leaving the Sickbed
Organic growth 9,1% -9,3% 13,0% 11,8% -7,9% -27,3% 3,3% -1,8% 6,1% -17,6%
Revenue growth, total n/a 28,9% 8,7% 7,4% -28,8% -22,6% 4,1% -1,3% 15,0% -25,7% 1,0% 1,0% 1,0% 1,0% 2,0% 3,0% 4,0% 5,0% 6,0%
EBITDA-margin 47,0% 48,0% 42,6% 46,8% 37,2% 33,8% 44,3% 42,6% 46,1% 35,5% 37,2% 38,0% 38,9% 39,7% 40,9% 42,2% 43,4% 44,7% 46,1%
EBITDA-margin growth 2% -11% 10% -20% -9% 10,0% 2,2% 2,2% 2,2% 3,0% 3,0% 3,0% 3,0% 3,0%
Effective tax rate (operating
income) 39,0% 39,0% 33,3% 36,1% n/a 2,8% 36,9% 30,1% 36,9% 2,8% 36,9% 36,9% 36,9% 36,9% 36,9% 36,9% 36,9% 36,9% 36,9%
Danish corporation tax rate 25,0% 25,0% 25,0% 24,5% 23,5% 22,0% n/a n/a n/a n/a 22,0% 22,0% 22,0% 22,0% 22,0% 22,0% 22,0% 22,0% 22,0%
Amortization as % of intangible
assets n/a n/a 7,0% 9,6% 8,4% n/a 8,3% 8,3% 8,3% 8,4% 8,4% 8,4% 8,4% 8,4% 8,4% 8,4% 8,4% 8,4% 8,4%
Depreciation as % of tangible
assets n/a n/a 30,8% 29,2% 26,1% n/a 28,7% 28,7% 30,0% 26,1% 26,1% 26,1% 26,1% 26,1% 26,1% 26,1% 26,1% 26,1% 26,1%
Intangible assets as % of revenue n/a 146% 135% 125% 168% 180% 143,6% 150,8% 135,4% 173,9% 167,5% 156,4% 146,4% 137,3% 129,1% 121,3% 114,1% 107,2% 100,8%
Intangible assets growth -7% -8% 35% 7% -6,8% -6,6% -6,4% -6,2% -6,0% -6,0% -6,0% -6,0% -6,0%
Tangible assets as % of revenue n/a 39% 45% 43% 56% 62% 45,9% 49,1% 42,4% 59,1% 52,0% 44,8% 39,4% 35,4% 32,6% 30,7% 29,4% 28,8% 28,8%
Tangible assets growth 18% -5% 30% 10% -16,0% -14,0% -12,0% -10,0% -8,0% -6,0% -4,0% -2,0% 0,0%
Inventory as % of revenue n/a 0,6% 0,8% 1,0% 1,8% 2,7% 1,0% 1,4% 0,8% 2,2% 1,8% 1,5% 1,2% 0,9% 0,9% 0,8% 0,8% 0,7% 0,7%
Inventories growth 31% 32% 79% 45% -0,8% -0,3% -0,3% -0,3% -0,05% -0,05% -0,05% -0,05% -0,05%
Receivables as % of revenue n/a 33,9% 30,0% 33,5% 29,9% 31,8% 31,8% 31,8% 32,4% 30,8% 29,9% 29,4% 28,9% 28,4% 27,9% 27,4% 26,9% 26,4% 25,9%
Receivables growth -12% 12% -11% 6% -6,0% -0,5% -0,5% -0,5% -0,5% -0,5% -0,5% -0,5% -0,5%
Non-interest bearing debt as % of
revenue n/a 40,1% 29,4% 30,9% 34,6% 34,3% 33,7% 33,8% 33,5% 34,4% 34,6% 35,0% 35,3% 35,7% 35,9% 36,0% 36,2% 36,4% 36,6%
Operating liabilities growth -27% 5% 12% -1% 1,0% 1,0% 1,0% 1,0% 0,5% 0,5% 0,5% 0,5% 0,5%
Net financial obligation (adjusted
for cash and cash equivalents) as
% of invested capital
n/a 62% 59% 60% 67% 73% 61,8% 64,0% 60,1% 69,8% 73,0% 73,0% 73,0% 73,0% 73,0% 73,0% 73,0% 73,0% 73,0%
NIBD (adjusted for cash)
growth -4% 1% 12% 10% 0,0% 0,0% 0,0% 0,0%
Borrowing cost before tax (%) n/a n/a 13,7% 13,6% 15,4% 15,3% 14,2% 14,5% 13,6% 15,3% 15,3% 15,3% 15,3% 15,3% 15,3% 15,3% 15,3% 15,3% 15,3%
NBC growth -1% 13% -1% 0,4%
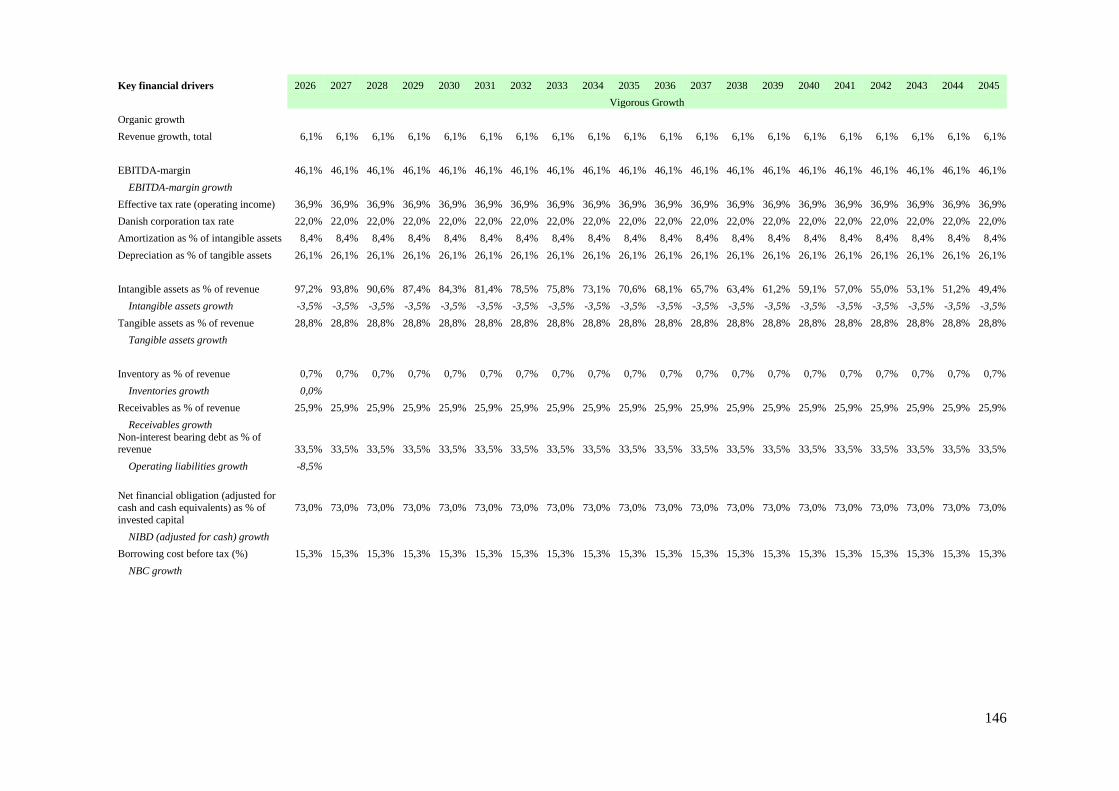
146
Key financial drivers 2026 2027 2028 2029 2030 2031 2032 2033 2034 2035 2036 2037 2038 2039 2040 2041 2042 2043 2044 2045
Vigorous Growth
Organic growth
Revenue growth, total 6,1% 6,1% 6,1% 6,1% 6,1% 6,1% 6,1% 6,1% 6,1% 6,1% 6,1% 6,1% 6,1% 6,1% 6,1% 6,1% 6,1% 6,1% 6,1% 6,1%
EBITDA-margin 46,1% 46,1% 46,1% 46,1% 46,1% 46,1% 46,1% 46,1% 46,1% 46,1% 46,1% 46,1% 46,1% 46,1% 46,1% 46,1% 46,1% 46,1% 46,1% 46,1%
EBITDA-margin growth
Effective tax rate (operating income) 36,9% 36,9% 36,9% 36,9% 36,9% 36,9% 36,9% 36,9% 36,9% 36,9% 36,9% 36,9% 36,9% 36,9% 36,9% 36,9% 36,9% 36,9% 36,9% 36,9%
Danish corporation tax rate 22,0% 22,0% 22,0% 22,0% 22,0% 22,0% 22,0% 22,0% 22,0% 22,0% 22,0% 22,0% 22,0% 22,0% 22,0% 22,0% 22,0% 22,0% 22,0% 22,0%
Amortization as % of intangible assets 8,4% 8,4% 8,4% 8,4% 8,4% 8,4% 8,4% 8,4% 8,4% 8,4% 8,4% 8,4% 8,4% 8,4% 8,4% 8,4% 8,4% 8,4% 8,4% 8,4%
Depreciation as % of tangible assets 26,1% 26,1% 26,1% 26,1% 26,1% 26,1% 26,1% 26,1% 26,1% 26,1% 26,1% 26,1% 26,1% 26,1% 26,1% 26,1% 26,1% 26,1% 26,1% 26,1%
Intangible assets as % of revenue 97,2% 93,8% 90,6% 87,4% 84,3% 81,4% 78,5% 75,8% 73,1% 70,6% 68,1% 65,7% 63,4% 61,2% 59,1% 57,0% 55,0% 53,1% 51,2% 49,4%
Intangible assets growth -3,5% -3,5% -3,5% -3,5% -3,5% -3,5% -3,5% -3,5% -3,5% -3,5% -3,5% -3,5% -3,5% -3,5% -3,5% -3,5% -3,5% -3,5% -3,5% -3,5%
Tangible assets as % of revenue 28,8% 28,8% 28,8% 28,8% 28,8% 28,8% 28,8% 28,8% 28,8% 28,8% 28,8% 28,8% 28,8% 28,8% 28,8% 28,8% 28,8% 28,8% 28,8% 28,8%
Tangible assets growth
Inventory as % of revenue 0,7% 0,7% 0,7% 0,7% 0,7% 0,7% 0,7% 0,7% 0,7% 0,7% 0,7% 0,7% 0,7% 0,7% 0,7% 0,7% 0,7% 0,7% 0,7% 0,7%
Inventories growth 0,0%
Receivables as % of revenue 25,9% 25,9% 25,9% 25,9% 25,9% 25,9% 25,9% 25,9% 25,9% 25,9% 25,9% 25,9% 25,9% 25,9% 25,9% 25,9% 25,9% 25,9% 25,9% 25,9%
Receivables growth Non-interest bearing debt as % of revenue 33,5% 33,5% 33,5% 33,5% 33,5% 33,5% 33,5% 33,5% 33,5% 33,5% 33,5% 33,5% 33,5% 33,5% 33,5% 33,5% 33,5% 33,5% 33,5% 33,5%
Operating liabilities growth -8,5%
Net financial obligation (adjusted for cash and cash equivalents) as % of
invested capital
73,0% 73,0% 73,0% 73,0% 73,0% 73,0% 73,0% 73,0% 73,0% 73,0% 73,0% 73,0% 73,0% 73,0% 73,0% 73,0% 73,0% 73,0% 73,0% 73,0%
NIBD (adjusted for cash) growth
Borrowing cost before tax (%) 15,3% 15,3% 15,3% 15,3% 15,3% 15,3% 15,3% 15,3% 15,3% 15,3% 15,3% 15,3% 15,3% 15,3% 15,3% 15,3% 15,3% 15,3% 15,3% 15,3%
NBC growth
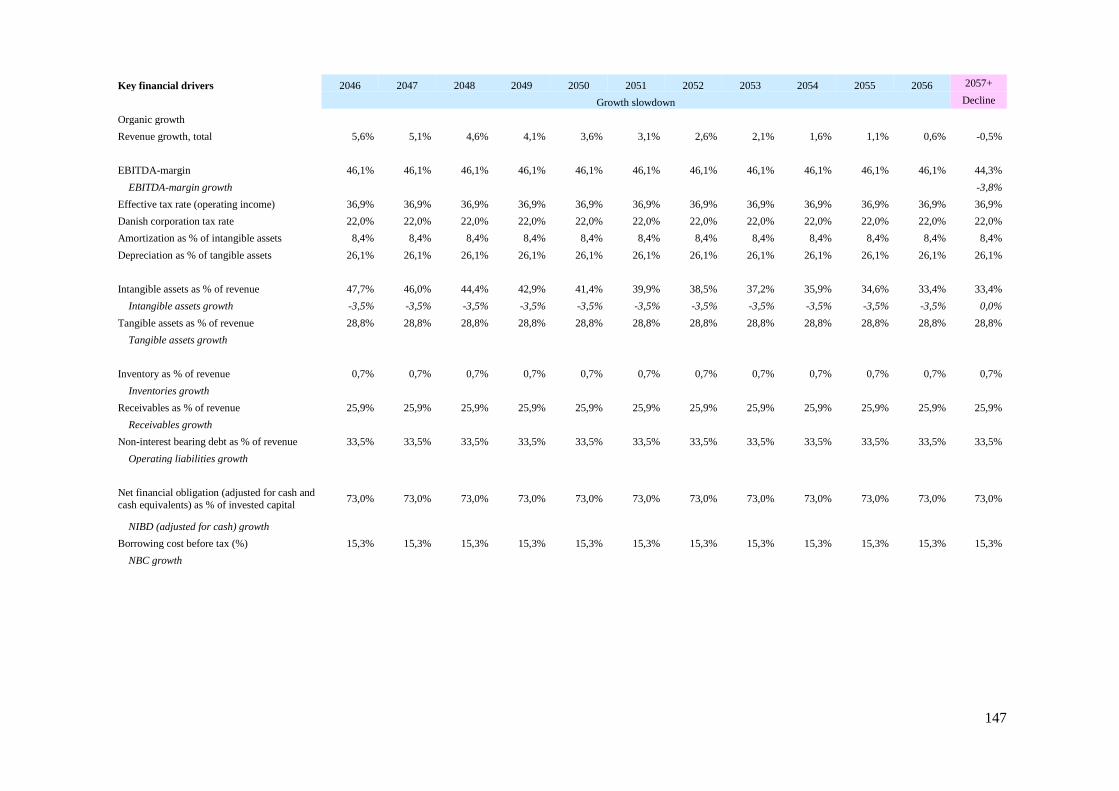
147
Key financial drivers 2046 2047 2048 2049 2050 2051 2052 2053 2054 2055 2056 2057+
Growth slowdown Decline
Organic growth
Revenue growth, total 5,6% 5,1% 4,6% 4,1% 3,6% 3,1% 2,6% 2,1% 1,6% 1,1% 0,6% -0,5%
EBITDA-margin 46,1% 46,1% 46,1% 46,1% 46,1% 46,1% 46,1% 46,1% 46,1% 46,1% 46,1% 44,3%
EBITDA-margin growth -3,8%
Effective tax rate (operating income) 36,9% 36,9% 36,9% 36,9% 36,9% 36,9% 36,9% 36,9% 36,9% 36,9% 36,9% 36,9%
Danish corporation tax rate 22,0% 22,0% 22,0% 22,0% 22,0% 22,0% 22,0% 22,0% 22,0% 22,0% 22,0% 22,0%
Amortization as % of intangible assets 8,4% 8,4% 8,4% 8,4% 8,4% 8,4% 8,4% 8,4% 8,4% 8,4% 8,4% 8,4%
Depreciation as % of tangible assets 26,1% 26,1% 26,1% 26,1% 26,1% 26,1% 26,1% 26,1% 26,1% 26,1% 26,1% 26,1%
Intangible assets as % of revenue 47,7% 46,0% 44,4% 42,9% 41,4% 39,9% 38,5% 37,2% 35,9% 34,6% 33,4% 33,4%
Intangible assets growth -3,5% -3,5% -3,5% -3,5% -3,5% -3,5% -3,5% -3,5% -3,5% -3,5% -3,5% 0,0%
Tangible assets as % of revenue 28,8% 28,8% 28,8% 28,8% 28,8% 28,8% 28,8% 28,8% 28,8% 28,8% 28,8% 28,8%
Tangible assets growth
Inventory as % of revenue 0,7% 0,7% 0,7% 0,7% 0,7% 0,7% 0,7% 0,7% 0,7% 0,7% 0,7% 0,7%
Inventories growth
Receivables as % of revenue 25,9% 25,9% 25,9% 25,9% 25,9% 25,9% 25,9% 25,9% 25,9% 25,9% 25,9% 25,9%
Receivables growth
Non-interest bearing debt as % of revenue 33,5% 33,5% 33,5% 33,5% 33,5% 33,5% 33,5% 33,5% 33,5% 33,5% 33,5% 33,5%
Operating liabilities growth
Net financial obligation (adjusted for cash and
cash equivalents) as % of invested capital 73,0% 73,0% 73,0% 73,0% 73,0% 73,0% 73,0% 73,0% 73,0% 73,0% 73,0% 73,0%
NIBD (adjusted for cash) growth
Borrowing cost before tax (%) 15,3% 15,3% 15,3% 15,3% 15,3% 15,3% 15,3% 15,3% 15,3% 15,3% 15,3% 15,3%
NBC growth

148
Appendix 39. Forecast of 2017+
Analytical income statement
USD in thousands 2017 2018 2019 2020 2021 2022 2023 2024 2025
Stage Early Convalescence Leaving the Sickbed
Revenue 192.193 194.115 196.056 198.017 201.977 208.036 216.358 227.176 240.806
Operating expenses -120.650 -120.267 -119.829 -119.334 -119.312 -120.338 -122.415 -125.576 -129.880
EBITDA 71.543 73.848 76.227 78.683 82.665 87.699 93.943 101.599 110.926
Depreciation, amortization and impairment losses -59.339 -52.999 -48.047 -44.140 -41.044 -38.980 -37.740 -37.241 -37.454
Amortization and impairment loss of intangible assets -28.591 -26.913 -25.388 -24.001 -22.738 -21.801 -21.108 -20.635 -20.367
Depreciation and impairment loss of tangible assets -30.748 -26.086 -22.659 -20.139 -18.306 -17.179 -16.632 -16.606 -17.087
Operating income (EBIT) 12.204 20.848 28.180 34.543 41.620 48.719 56.203 64.358 73.472
Operating tax (adjusted for non-recurring items) -4.499 -7.685 -10.388 -12.734 -15.342 -17.959 -20.718 -23.724 -27.084
NOPAT 7.705 13.163 17.792 21.810 26.278 30.760 35.485 40.634 46.388
Net financial expenses after tax -34.324 -36.365 -33.424 -30.926 -28.783 -27.276 -26.198 -25.501 -25.156
Net income (Net earnings) -26.618 -23.202 -15.631 -9.116 -2.505 3.484 9.287 15.134 21.233
USD in thousands 2026 2027 2028 2029 2030 2031 2032 2033 2034 2035 2036 2037 2038 2039 2040 2041 2042 2043 2044 2045
Stage Vigorous Growth
Revenue 255.496 271.081 287.617 305.161 323.776 343.526 364.482 386.715 410.305 435.333 461.888 490.064 519.958 551.675 585.327 621.032 658.915 699.109 741.754 787.001
Operating expenses -137.803 -146.209 -155.127 -164.590 -174.630 -185.283 -196.585 -208.577 -221.300 -234.799 -249.122 -264.318 -280.442 -297.549 -315.699 -334.957 -355.389 -377.068 -400.069 -424.473
EBITDA 117.693 124.872 132.489 140.571 149.146 158.244 167.897 178.138 189.005 200.534 212.767 225.745 239.516 254.126 269.628 286.075 303.526 322.041 341.685 362.528
Depreciation, amortization and impairment losses -38.406 -39.995 -41.663 -43.415 -45.254 -47.187 -49.217 -51.351 -53.595 -55.954 -58.435 -61.046 -63.793 -66.684 -69.728 -72.933 -76.308 -79.864 -83.610 -87.559
Amortization and
impairment loss of intangible assets -20.294 -20.778 -21.274 -21.782 -22.301 -22.834 -23.378 -23.936 -24.508 -25.093 -25.691 -26.305 -26.932 -27.575 -28.233 -28.907 -29.597 -30.303 -31.026 -31.767
Depreciation and
impairment loss of tangible
assets -18.113 -19.217 -20.390 -21.633 -22.953 -24.353 -25.839 -27.415 -29.087 -30.862 -32.744 -34.741 -36.861 -39.109 -41.495 -44.026 -46.712 -49.561 -52.584 -55.792
Operating income (EBIT) 79.287 84.877 90.826 97.156 103.891 111.057 118.679 126.787 135.410 144.580 154.331 164.699 175.723 187.442 199.900 213.142 227.218 242.177 258.075 274.970
Operating tax (adjusted for
non-recurring items) -29.227 -31.288 -33.481 -35.814 -38.297 -40.938 -43.748 -46.737 -49.916 -53.296 -56.890 -60.712 -64.776 -69.096 -73.688 -78.570 -83.758 -89.273 -95.133 -101.361
NOPAT 50.059 53.589 57.345 61.342 65.594 70.119 74.931 80.050 85.494 91.284 97.441 103.987 110.947 118.346 126.212 134.573 143.459 152.904 162.942 173.609
Net financial expenses after
tax -25.158 -26.603 -27.420 -28.267 -29.147 -30.060 -31.007 -31.992 -33.015 -34.078 -35.183 -36.333 -37.529 -38.773 -40.069 -41.418 -42.823 -44.287 -45.813 -47.404
Net income (Net earnings) 24.902 26.986 29.925 33.074 36.448 40.059 43.924 48.058 52.479 57.206 62.257 67.654 73.418 79.573 86.143 93.155 100.636 108.617 117.129 126.205

149
USD in thousands 2046 2047 2048 2049 2050 2051 2052 2053 2054 2055 2056 Terminal period
Stage Growth slowdown Decline
Revenue 831.074 873.458 913.637 951.097 985.336 1.015.881 1.042.294 1.064.183 1.081.209 1.093.103 1.099.661 1.094.163
Operating expenses -448.244 -471.104 -492.775 -512.979 -531.446 -547.921 -562.167 -573.972 -583.156 -589.570 -593.108 -609.133
EBITDA 382.830 402.354 420.863 438.118 453.890 467.961 480.128 490.210 498.054 503.532 506.554 485.030
Depreciation, amortization and
impairment losses -91.720 -95.654 -99.313 -102.651 -105.623 -108.190 -110.314 -111.965 -113.117 -113.750 -113.854 -113.424
Amortization and impairment loss of intangible assets -32.525 -33.144 -33.615 -33.931 -34.086 -34.077 -33.904 -33.568 -33.073 -32.426 -31.635 -30.711
Depreciation and impairment
loss of tangible assets -59.195 -62.510 -65.698 -68.720 -71.538 -74.113 -76.411 -78.397 -80.044 -81.324 -82.219 -82.712
Operating income (EBIT) 291.110 306.700 321.549 335.467 348.267 359.771 369.813 378.245 384.937 389.782 392.699 371.607
Operating tax (tax on EBIT) (adjusted for non-recurring items) -107.311 -113.058 -118.531 -123.662 -128.380 -132.621 -136.323 -139.431 -141.898 -143.684 -144.759 -136.984
NOPAT 183.799 193.642 203.018 211.805 219.887 227.150 233.491 238.814 243.039 246.098 247.940 234.623
Net financial expenses after tax -49.063 -50.555 -51.860 -52.959 -53.839 -54.486 -54.891 -55.046 -54.949 -54.600 -54.002 -35.183
Net income (Net earnings) 134.736 143.088 151.158 158.846 166.047 172.664 178.600 183.768 188.090 191.498 193.938 199.439
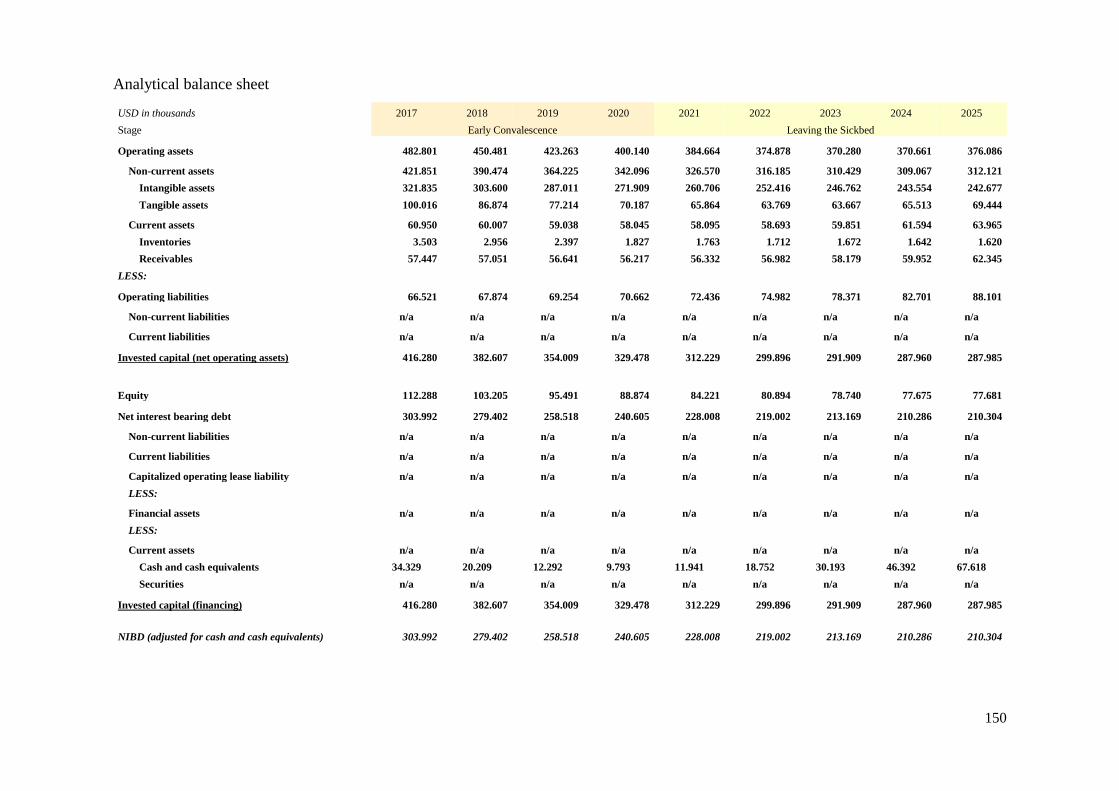
150
Analytical balance sheet
USD in thousands 2017 2018 2019 2020 2021 2022 2023 2024 2025
Stage Early Convalescence Leaving the Sickbed
Operating assets 482.801 450.481 423.263 400.140 384.664 374.878 370.280 370.661 376.086
Non-current assets 421.851 390.474 364.225 342.096 326.570 316.185 310.429 309.067 312.121
Intangible assets 321.835 303.600 287.011 271.909 260.706 252.416 246.762 243.554 242.677
Tangible assets 100.016 86.874 77.214 70.187 65.864 63.769 63.667 65.513 69.444
Current assets 60.950 60.007 59.038 58.045 58.095 58.693 59.851 61.594 63.965
Inventories 3.503 2.956 2.397 1.827 1.763 1.712 1.672 1.642 1.620
Receivables 57.447 57.051 56.641 56.217 56.332 56.982 58.179 59.952 62.345
LESS:
Operating liabilities 66.521 67.874 69.254 70.662 72.436 74.982 78.371 82.701 88.101
Non-current liabilities n/a n/a n/a n/a n/a n/a n/a n/a n/a
Current liabilities n/a n/a n/a n/a n/a n/a n/a n/a n/a
Invested capital (net operating assets) 416.280 382.607 354.009 329.478 312.229 299.896 291.909 287.960 287.985
Equity 112.288 103.205 95.491 88.874 84.221 80.894 78.740 77.675 77.681
Net interest bearing debt 303.992 279.402 258.518 240.605 228.008 219.002 213.169 210.286 210.304
Non-current liabilities n/a n/a n/a n/a n/a n/a n/a n/a n/a
Current liabilities n/a n/a n/a n/a n/a n/a n/a n/a n/a
Capitalized operating lease liability n/a n/a n/a n/a n/a n/a n/a n/a n/a
LESS:
Financial assets n/a n/a n/a n/a n/a n/a n/a n/a n/a
LESS:
Current assets n/a n/a n/a n/a n/a n/a n/a n/a n/a
Cash and cash equivalents 34.329 20.209 12.292 9.793 11.941 18.752 30.193 46.392 67.618
Securities n/a n/a n/a n/a n/a n/a n/a n/a n/a
Invested capital (financing) 416.280 382.607 354.009 329.478 312.229 299.896 291.909 287.960 287.985
NIBD (adjusted for cash and cash equivalents) 303.992 279.402 258.518 240.605 228.008 219.002 213.169 210.286 210.304
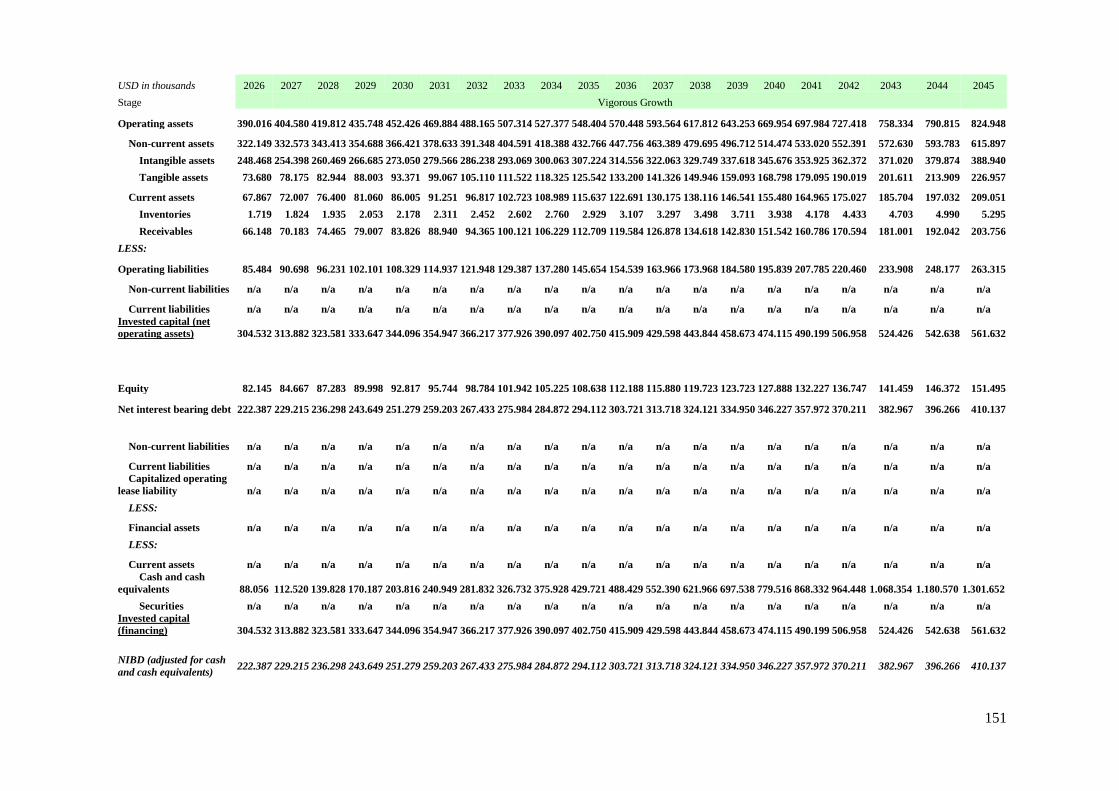
151
USD in thousands 2026 2027 2028 2029 2030 2031 2032 2033 2034 2035 2036 2037 2038 2039 2040 2041 2042 2043 2044 2045
Stage Vigorous Growth
Operating assets 390.016 404.580 419.812 435.748 452.426 469.884 488.165 507.314 527.377 548.404 570.448 593.564 617.812 643.253 669.954 697.984 727.418 758.334 790.815 824.948
Non-current assets 322.149 332.573 343.413 354.688 366.421 378.633 391.348 404.591 418.388 432.766 447.756 463.389 479.695 496.712 514.474 533.020 552.391 572.630 593.783 615.897
Intangible assets 248.468 254.398 260.469 266.685 273.050 279.566 286.238 293.069 300.063 307.224 314.556 322.063 329.749 337.618 345.676 353.925 362.372 371.020 379.874 388.940
Tangible assets 73.680 78.175 82.944 88.003 93.371 99.067 105.110 111.522 118.325 125.542 133.200 141.326 149.946 159.093 168.798 179.095 190.019 201.611 213.909 226.957
Current assets 67.867 72.007 76.400 81.060 86.005 91.251 96.817 102.723 108.989 115.637 122.691 130.175 138.116 146.541 155.480 164.965 175.027 185.704 197.032 209.051
Inventories 1.719 1.824 1.935 2.053 2.178 2.311 2.452 2.602 2.760 2.929 3.107 3.297 3.498 3.711 3.938 4.178 4.433 4.703 4.990 5.295
Receivables 66.148 70.183 74.465 79.007 83.826 88.940 94.365 100.121 106.229 112.709 119.584 126.878 134.618 142.830 151.542 160.786 170.594 181.001 192.042 203.756
LESS:
Operating liabilities 85.484 90.698 96.231 102.101 108.329 114.937 121.948 129.387 137.280 145.654 154.539 163.966 173.968 184.580 195.839 207.785 220.460 233.908 248.177 263.315
Non-current liabilities n/a n/a n/a n/a n/a n/a n/a n/a n/a n/a n/a n/a n/a n/a n/a n/a n/a n/a n/a n/a
Current liabilities n/a n/a n/a n/a n/a n/a n/a n/a n/a n/a n/a n/a n/a n/a n/a n/a n/a n/a n/a n/a
Invested capital (net
operating assets) 304.532 313.882 323.581 333.647 344.096 354.947 366.217 377.926 390.097 402.750 415.909 429.598 443.844 458.673 474.115 490.199 506.958 524.426 542.638 561.632
Equity 82.145 84.667 87.283 89.998 92.817 95.744 98.784 101.942 105.225 108.638 112.188 115.880 119.723 123.723 127.888 132.227 136.747 141.459 146.372 151.495
Net interest bearing debt 222.387 229.215 236.298 243.649 251.279 259.203 267.433 275.984 284.872 294.112 303.721 313.718 324.121 334.950 346.227 357.972 370.211 382.967 396.266 410.137
Non-current liabilities n/a n/a n/a n/a n/a n/a n/a n/a n/a n/a n/a n/a n/a n/a n/a n/a n/a n/a n/a n/a
Current liabilities n/a n/a n/a n/a n/a n/a n/a n/a n/a n/a n/a n/a n/a n/a n/a n/a n/a n/a n/a n/a
Capitalized operating
lease liability n/a n/a n/a n/a n/a n/a n/a n/a n/a n/a n/a n/a n/a n/a n/a n/a n/a n/a n/a n/a
LESS:
Financial assets n/a n/a n/a n/a n/a n/a n/a n/a n/a n/a n/a n/a n/a n/a n/a n/a n/a n/a n/a n/a
LESS:
Current assets n/a n/a n/a n/a n/a n/a n/a n/a n/a n/a n/a n/a n/a n/a n/a n/a n/a n/a n/a n/a
Cash and cash
equivalents 88.056 112.520 139.828 170.187 203.816 240.949 281.832 326.732 375.928 429.721 488.429 552.390 621.966 697.538 779.516 868.332 964.448 1.068.354 1.180.570 1.301.652
Securities n/a n/a n/a n/a n/a n/a n/a n/a n/a n/a n/a n/a n/a n/a n/a n/a n/a n/a n/a n/a
Invested capital
(financing) 304.532 313.882 323.581 333.647 344.096 354.947 366.217 377.926 390.097 402.750 415.909 429.598 443.844 458.673 474.115 490.199 506.958 524.426 542.638 561.632
NIBD (adjusted for cash
and cash equivalents) 222.387 229.215 236.298 243.649 251.279 259.203 267.433 275.984 284.872 294.112 303.721 313.718 324.121 334.950 346.227 357.972 370.211 382.967 396.266 410.137

152
USD in thousands 2046 2047 2048 2049 2050 2051 2052 2053 2054 2055 2056 Terminal period
Stage Growth slowdown Decline
Operating assets 856.770 885.885 911.920 934.525 953.388 968.238 978.854 985.065 986.762 983.896 976.479 971.597
Non-current assets 636.012 653.869 669.231 681.885 691.653 698.390 701.989 702.387 699.561 693.535 684.376 680.955
Intangible assets 396.345 401.979 405.754 407.606 407.500 405.428 401.410 395.495 387.759 378.304 367.254 365.417
Tangible assets 239.667 251.890 263.477 274.279 284.153 292.962 300.579 306.891 311.802 315.231 317.123 315.537
Current assets 220.758 232.016 242.689 252.639 261.734 269.848 276.864 282.678 287.201 290.361 292.103 290.642
Inventories 5.591 5.876 6.147 6.399 6.629 6.834 7.012 7.159 7.274 7.354 7.398 7.361
Receivables 215.167 226.140 236.543 246.241 255.105 263.014 269.852 275.519 279.927 283.007 284.705 283.281
LESS:
Operating liabilities 278.061 292.242 305.685 318.218 329.674 339.894 348.731 356.055 361.752 365.731 367.925 366.086
Non-current liabilities n/a n/a n/a n/a n/a n/a n/a n/a n/a n/a n/a n/a
Current liabilities n/a n/a n/a n/a n/a n/a n/a n/a n/a n/a n/a n/a
Invested capital (net operating assets) 578.709 593.643 606.234 616.306 623.714 628.344 630.122 629.010 625.011 618.165 608.554 605.511
Equity 156.101 160.130 163.526 166.243 168.241 169.490 169.970 169.670 168.591 166.744 164.152 163.331
Net interest bearing debt 422.607 433.513 442.708 450.063 455.472 458.854 460.152 459.340 456.420 451.420 444.402 442.180
Non-current liabilities n/a n/a n/a n/a n/a n/a n/a n/a n/a n/a n/a n/a
Current liabilities n/a n/a n/a n/a n/a n/a n/a n/a n/a n/a n/a n/a
Capitalized operating lease liability n/a n/a n/a n/a n/a n/a n/a n/a n/a n/a n/a n/a
LESS:
Financial assets n/a n/a n/a n/a n/a n/a n/a n/a n/a n/a n/a n/a
LESS:
Current assets n/a n/a n/a n/a n/a n/a n/a n/a n/a n/a n/a n/a
Cash and cash equivalents 1.431.782 1.570.841 1.718.603 1.874.732 2.038.781 2.210.195 2.388.316 2.572.384 2.761.553 2.954.898 3.151.429 826.078
Securities n/a n/a n/a n/a n/a n/a n/a n/a n/a n/a n/a n/a
Invested capital (financing) 578.709 593.643 606.234 616.306 623.714 628.344 630.122 629.010 625.011 618.165 608.554 605.511
NIBD (adjusted for cash and cash
equivalents) 422.607 433.513 442.708 450.063 455.472 458.854 460.152 459.340 456.420 451.420 444.402 442.180

153
Cash flow statement
USD in thousands 2017 2018 2019 2020 2021 2022 2023 2024 2025
Stage Early Convalescence Leaving the Sickbed
EBITDA 71.543 73.848 76.227 78.683 82.665 87.699 93.943 101.599 110.926
LESS:
Operating tax (tax on EBIT) (adjusted for non-recurring items) -4.499 -7.685 -10.388 -12.734 -15.342 -17.959 -20.718 -23.724 -27.084
Cash flow from operations before changes in NWC 67.044 66.163 65.839 65.950 67.322 69.740 73.225 77.875 83.843
ADD:
Changes in inventories 1.541 547 559 570 64 51 40 30 22
Changes in receivables 3.076 396 410 424 -114 -650 -1.197 -1.773 -2.393
Changes in operating debt 1.326 1.353 1.380 1.408 1.774 2.546 3.389 4.330 5.400
Cash flow from operations 72.987 68.459 68.188 68.352 69.046 71.687 75.457 80.462 86.872
LESS:
Investments in non-current assets -21.404 -21.622 -21.798 -22.011 -25.518 -28.595 -31.984 -35.879 -40.508
Free cash flow 51.583 46.836 46.390 46.341 43.528 43.092 43.472 44.583 46.363
LESS (-) / ADD (+): New net interest bearing debt (adjusted for cash and cash equivalents) -32.042 -24.590 -20.884 -17.914 -12.597 -9.006 -5.833 -2.883 18
Net financial expenses before tax -44.004 -46.622 -42.851 -39.648 -36.901 -34.969 -33.588 -32.693 -32.251
Tax shield 9.681 10.257 9.427 8.723 8.118 7.693 7.389 7.192 7.095
Free cash flow to owners -14.782 -14.119 -7.918 -2.499 2.148 6.811 11.441 16.199 21.226
Investments, intangible and tangible assets
Intangible and tangible assets, end of period 421.851 390.474 364.225 342.096 326.570 316.185 310.429 309.067 312.121
ADD:
Depreciation, amortization and impairment losses 59.339 52.999 48.047 44.140 41.044 38.980 37.740 37.241 37.454
LESS:
Intangible and tangible assets, beginning of period -459.786 -421.851 -390.474 -364.225 -342.096 -326.570 -316.185 -310.429 -309.067
Investments, intangible and tangible assets 21.404 21.622 21.798 22.011 25.518 28.595 31.984 35.879 40.508

154
USD in thousands 2026 2027 2028 2029 2030 2031 2032 2033 2034 2035 2036 2037 2038 2039 2040 2041 2042 2043 2044 2045
Stage Vigorous Growth
EBITDA 117.693 124.872 132.489 140.571 149.146 158.244 167.897 178.138 189.005 200.534 212.767 225.745 239.516 254.126 269.628 286.075 303.526 322.041 341.685 362.528
LESS: Operating tax (tax on
EBIT) (adjusted for non-
recurring items) -29.227 -31.288 -33.481 -35.814 -38.297 -40.938 -43.748 -46.737 -49.916 -53.296 -56.890 -60.712 -64.776 -69.096 -73.688 -78.570 -83.758 -89.273 -95.133 -101.361
Cash flow from operations
before changes in NWC 88.466 93.584 99.008 104.757 110.849 117.305 124.148 131.401 139.089 147.238 155.876 165.033 174.740 185.030 195.940 207.505 219.768 232.768 246.552 261.167
ADD:
Changes in inventories -99 -105 -111 -118 -125 -133 -141 -150 -159 -168 -179 -190 -201 -213 -226 -240 -255 -270 -287 -304
Changes in receivables -3.803 -4.035 -4.281 -4.542 -4.819 -5.113 -5.425 -5.756 -6.107 -6.480 -6.875 -7.295 -7.740 -8.212 -8.713 -9.244 -9.808 -10.406 -11.041 -11.715
Changes in operating debt -2.617 5.215 5.533 5.870 6.228 6.608 7.011 7.439 7.893 8.374 8.885 9.427 10.002 10.612 11.259 11.946 12.675 13.448 14.268 15.139
Cash flow from operations 81.946 94.659 100.149 105.966 112.132 118.667 125.593 132.934 140.716 148.964 157.707 166.976 176.801 187.217 198.260 209.967 222.380 235.540 249.493 264.287
LESS: Investments in non-current
assets -48.434 -50.420 -52.503 -54.691 -56.987 -59.399 -61.932 -64.594 -67.392 -70.333 -73.425 -76.678 -80.100 -83.700 -87.490 -91.479 -95.680 -100.103 -104.763 -109.673
Free cash flow 33.513 44.239 47.645 51.276 55.145 59.268 63.661 68.340 73.324 78.631 84.282 90.298 96.701 103.517 110.770 118.488 126.700 135.436 144.730 154.614
LESS (-) / ADD (+): New net interest bearing
debt (adjusted for cash and
cash equivalents) 12.083 6.828 7.083 7.351 7.631 7.923 8.230 8.551 8.888 9.240 9.609 9.997 10.403 10.829 11.276 11.746 12.239 12.756 13.300 13.871 Net financial expenses
before tax -32.254 -34.107 -35.154 -36.240 -37.368 -38.538 -39.753 -41.015 -42.327 -43.690 -45.107 -46.581 -48.114 -49.709 -51.370 -53.100 -54.901 -56.778 -58.734 -60.774
Tax shield 7.096 7.504 7.734 7.973 8.221 8.478 8.746 9.023 9.312 9.612 9.924 10.248 10.585 10.936 11.301 11.682 12.078 12.491 12.922 13.370
Free cash flow to owners 20.438 24.464 27.309 30.359 33.629 37.132 40.884 44.899 49.197 53.793 58.708 63.961 69.575 75.573 81.978 88.816 96.116 103.906 112.216 121.081
Investments, intangible and
tangible assets
Intangible and tangible assets, end of period 322.149 332.573 343.413 354.688 366.421 378.633 391.348 404.591 418.388 432.766 447.756 463.389 479.695 496.712 514.474 533.020 552.391 572.630 593.783 615.897
ADD: Depreciation, amortization
andimpairment losses 38.406 39.995 41.663 43.415 45.254 47.187 49.217 51.351 53.595 55.954 58.435 61.046 63.793 66.684 69.728 72.933 76.308 79.864 83.610 87.559
LESS:
Intangible and tangible
assets, beginning of period -312.121 -322.149 -332.573 -343.413 -354.688 -366.421 -378.633 -391.348 -404.591 -418.388 -432.766 -447.756 -463.389 -479.695 -496.712 -514.474 -533.020 -552.391 -572.630 -593.783
Investments, intangible and
tangible assets 48.434 50.420 52.503 54.691 56.987 59.399 61.932 64.594 67.392 70.333 73.425 76.678 80.100 83.700 87.490 91.479 95.680 100.103 104.763 109.673

155
USD in thousands 2046 2047 2048 2049 2050 2051 2052 2053 2054 2055 2056 Terminal period
Stage Growth slowdown Decline
EBITDA 382.830 402.354 420.863 438.118 453.890 467.961 480.128 490.210 498.054 503.532 506.554 485.030
LESS:
Operating tax (tax on EBIT) (adjusted for non-recurring items) -107.311 -113.058 -118.531 -123.662 -128.380 -132.621 -136.323 -139.431 -141.898 -143.684 -144.759 -136.984
Cash flow from operations before changes in NWC 275.519 289.297 302.331 314.456 325.510 335.340 343.805 350.779 356.156 359.849 361.794 348.046
ADD:
Changes in inventories -297 -285 -270 -252 -230 -205 -178 -147 -115 -80 -44 -4.432
Changes in receivables -11.410 -10.973 -10.402 -9.698 -8.865 -7.908 -6.838 -5.667 -4.408 -3.079 -1.698 -170.572
Changes in operating debt 14.746 14.181 13.443 12.533 11.456 10.220 8.837 7.323 5.697 3.979 2.194 220.432
Cash flow from operations 278.558 292.219 305.102 317.039 327.871 337.446 345.626 352.289 357.330 360.669 362.247 393.473
LESS:
Investments in non-current assets -111.835 -113.511 -114.675 -115.306 -115.392 -114.927 -113.913 -112.362 -110.291 -107.725 -104.695 -110.002
Free cash flow 166.723 178.708 190.427 201.733 212.479 222.519 231.713 239.926 247.039 252.944 257.551 283.472
LESS (-) / ADD (+): New net interest bearing debt (adjusted for cash and cash
equivalents) 12.470 10.906 9.195 7.355 5.409 3.381 1.298 -812 -2.921 -4.999 -7.019 148.068
Net financial expenses before tax -62.901 -64.814 -66.487 -67.897 -69.025 -69.854 -70.373 -70.572 -70.448 -70.000 -69.233 -45.107
Tax shield 13.838 14.259 14.627 14.937 15.185 15.368 15.482 15.526 15.498 15.400 15.231 9.924
Free cash flow to owners 130.130 139.059 147.762 156.129 164.049 171.414 178.120 184.068 189.169 193.345 196.531 396.356
Investments, intangible and tangible assets
Intangible and tangible assets, end of period 636.012 653.869 669.231 681.885 691.653 698.390 701.989 702.387 699.561 693.535 684.376 680.955
ADD:
Depreciation, amortization and impairment losses 91.720 95.654 99.313 102.651 105.623 108.190 110.314 111.965 113.117 113.750 113.854 113.424
LESS:
Intangible and tangible assets, beginning of period -615.897 -636.012 -653.869 -669.231 -681.885 -691.653 -698.390 -701.989 -702.387 -699.561 -693.535 -684.376
Investments, intangible and tangible assets 111.835 113.511 114.675 115.306 115.392 114.927 113.913 112.362 110.291 107.725 104.695 110.002

156
Appendix 40. Comparable listed companies
As mentioned earlier, OFS is a highly diversified sector. As a result, Welltec has no doppelgangers
or lookalikes in the industry. Nevertheless, to select a peer group, I first draw up a list of 100 OFS
company. Next, I exclude the privately held companies (38 companies) as well as OFS’s major
players and their subsidies (26). Having whittled down my initial list to 36 company, I go through
their lists of products/services to find out whose service range includes ‘well intervention operations
and completions’ (services similar to what Welltec provides). This last criteria narrows my list down
to 5 companies:
Company Services Traded as Company website
Aker Solutions Subsea (technology), engineering OSE: AKSO www.akersolutions.com
Helix Energy
Solutions Group
Well intervention operations, remotely operated vehicle
operations, oil exploration and production, offshore
production facilities
NYSE: HLX www.helixesg.com
Key Energy
Services
Well services, fishing and rental services, coiled tubing,
fluid management NYSE: KEG www.keyenergy.com
Calfrac Well
Services
Fracturing, coiled tubing, acidizing, carbon dioxide,
nitrogen, cementing, customized stimulation programs,
electronic tools and databases, well performance analysis
and forward planning, service-line-equipment
TSX: CFW www.calfrac.com
Trican Well
Service
Acidizing, coiled tubing, fracturing, nitrogen pumping,
cementing, microseismic, and industrial services TSX: TCW www.trican.ca
From this list of five, Key Energy Services is excluded as it has only recently emerged from
bankruptcy and relisted on NYSE. In other words, it doesn’t have consistent historical data to
calculate βe. Also, in this list there is one company whose services are closely resemble what Welltec
provides. This is Helix Energy Solutions Group whose service repertoire includes ‘remotely operated
vehicle operations’.
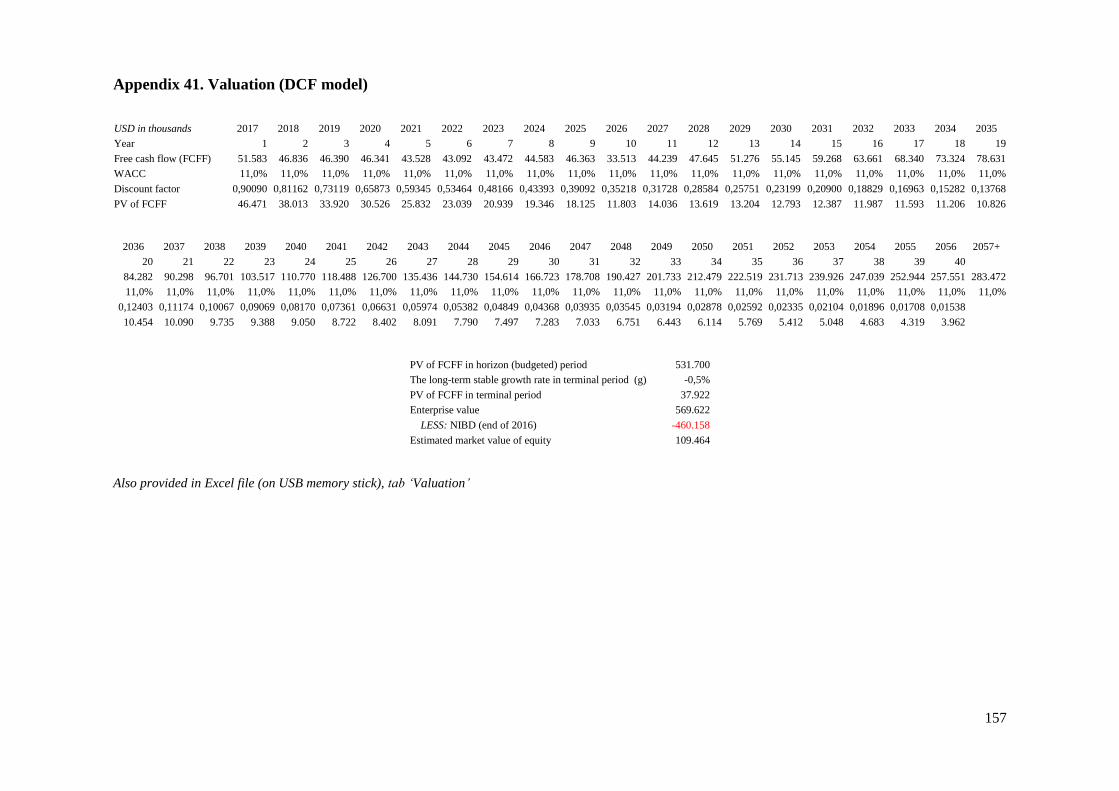
157
Appendix 41. Valuation (DCF model)
USD in thousands 2017 2018 2019 2020 2021 2022 2023 2024 2025 2026 2027 2028 2029 2030 2031 2032 2033 2034 2035
Year 1 2 3 4 5 6 7 8 9 10 11 12 13 14 15 16 17 18 19
Free cash flow (FCFF) 51.583 46.836 46.390 46.341 43.528 43.092 43.472 44.583 46.363 33.513 44.239 47.645 51.276 55.145 59.268 63.661 68.340 73.324 78.631
WACC 11,0% 11,0% 11,0% 11,0% 11,0% 11,0% 11,0% 11,0% 11,0% 11,0% 11,0% 11,0% 11,0% 11,0% 11,0% 11,0% 11,0% 11,0% 11,0%
Discount factor 0,90090 0,81162 0,73119 0,65873 0,59345 0,53464 0,48166 0,43393 0,39092 0,35218 0,31728 0,28584 0,25751 0,23199 0,20900 0,18829 0,16963 0,15282 0,13768
PV of FCFF 46.471 38.013 33.920 30.526 25.832 23.039 20.939 19.346 18.125 11.803 14.036 13.619 13.204 12.793 12.387 11.987 11.593 11.206 10.826
2036 2037 2038 2039 2040 2041 2042 2043 2044 2045 2046 2047 2048 2049 2050 2051 2052 2053 2054 2055 2056 2057+
20 21 22 23 24 25 26 27 28 29 30 31 32 33 34 35 36 37 38 39 40
84.282 90.298 96.701 103.517 110.770 118.488 126.700 135.436 144.730 154.614 166.723 178.708 190.427 201.733 212.479 222.519 231.713 239.926 247.039 252.944 257.551 283.472
11,0% 11,0% 11,0% 11,0% 11,0% 11,0% 11,0% 11,0% 11,0% 11,0% 11,0% 11,0% 11,0% 11,0% 11,0% 11,0% 11,0% 11,0% 11,0% 11,0% 11,0% 11,0%
0,12403 0,11174 0,10067 0,09069 0,08170 0,07361 0,06631 0,05974 0,05382 0,04849 0,04368 0,03935 0,03545 0,03194 0,02878 0,02592 0,02335 0,02104 0,01896 0,01708 0,01538
10.454 10.090 9.735 9.388 9.050 8.722 8.402 8.091 7.790 7.497 7.283 7.033 6.751 6.443 6.114 5.769 5.412 5.048 4.683 4.319 3.962
PV of FCFF in horizon (budgeted) period 531.700
The long-term stable growth rate in terminal period (g) -0,5%
PV of FCFF in terminal period 37.922
Enterprise value 569.622
LESS: NIBD (end of 2016) -460.158
Estimated market value of equity 109.464
Also provided in Excel file (on USB memory stick), tab ‘Valuation’
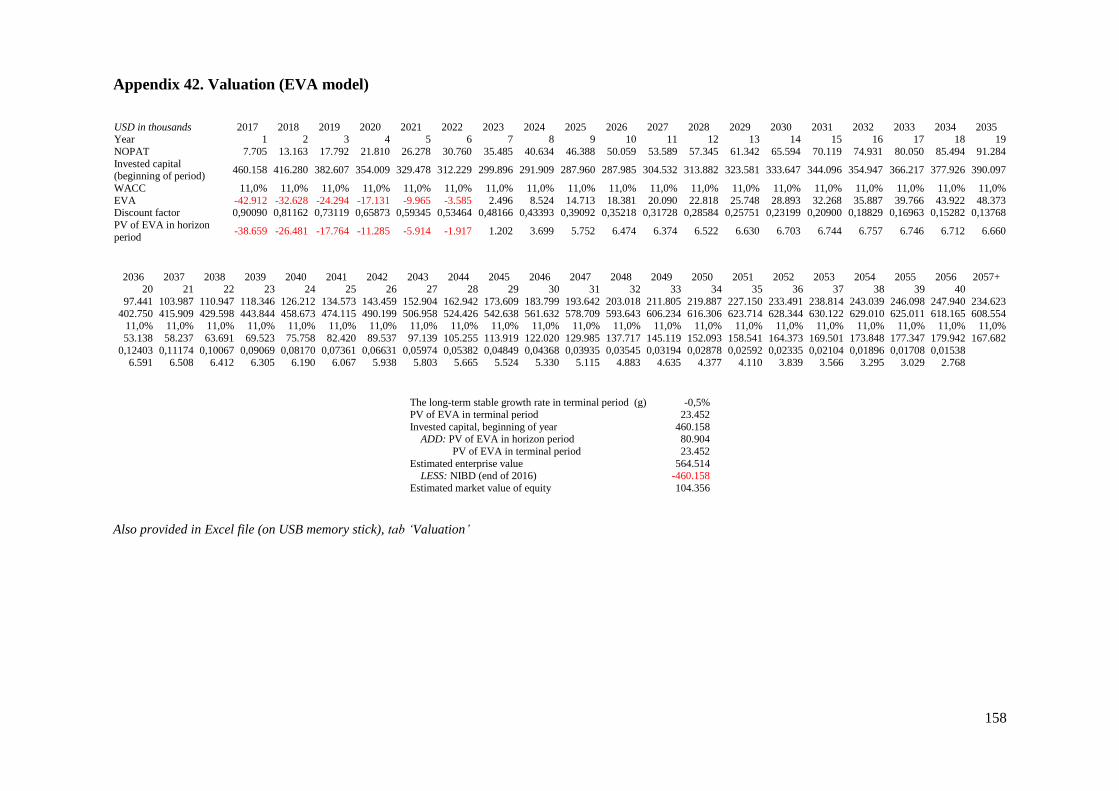
158
Appendix 42. Valuation (EVA model)
USD in thousands 2017 2018 2019 2020 2021 2022 2023 2024 2025 2026 2027 2028 2029 2030 2031 2032 2033 2034 2035 Year 1 2 3 4 5 6 7 8 9 10 11 12 13 14 15 16 17 18 19
NOPAT 7.705 13.163 17.792 21.810 26.278 30.760 35.485 40.634 46.388 50.059 53.589 57.345 61.342 65.594 70.119 74.931 80.050 85.494 91.284
Invested capital (beginning of period)
460.158 416.280 382.607 354.009 329.478 312.229 299.896 291.909 287.960 287.985 304.532 313.882 323.581 333.647 344.096 354.947 366.217 377.926 390.097
WACC 11,0% 11,0% 11,0% 11,0% 11,0% 11,0% 11,0% 11,0% 11,0% 11,0% 11,0% 11,0% 11,0% 11,0% 11,0% 11,0% 11,0% 11,0% 11,0%
EVA -42.912 -32.628 -24.294 -17.131 -9.965 -3.585 2.496 8.524 14.713 18.381 20.090 22.818 25.748 28.893 32.268 35.887 39.766 43.922 48.373 Discount factor 0,90090 0,81162 0,73119 0,65873 0,59345 0,53464 0,48166 0,43393 0,39092 0,35218 0,31728 0,28584 0,25751 0,23199 0,20900 0,18829 0,16963 0,15282 0,13768
PV of EVA in horizon
period -38.659 -26.481 -17.764 -11.285 -5.914 -1.917 1.202 3.699 5.752 6.474 6.374 6.522 6.630 6.703 6.744 6.757 6.746 6.712 6.660
2036 2037 2038 2039 2040 2041 2042 2043 2044 2045 2046 2047 2048 2049 2050 2051 2052 2053 2054 2055 2056 2057+ 20 21 22 23 24 25 26 27 28 29 30 31 32 33 34 35 36 37 38 39 40
97.441 103.987 110.947 118.346 126.212 134.573 143.459 152.904 162.942 173.609 183.799 193.642 203.018 211.805 219.887 227.150 233.491 238.814 243.039 246.098 247.940 234.623
402.750 415.909 429.598 443.844 458.673 474.115 490.199 506.958 524.426 542.638 561.632 578.709 593.643 606.234 616.306 623.714 628.344 630.122 629.010 625.011 618.165 608.554 11,0% 11,0% 11,0% 11,0% 11,0% 11,0% 11,0% 11,0% 11,0% 11,0% 11,0% 11,0% 11,0% 11,0% 11,0% 11,0% 11,0% 11,0% 11,0% 11,0% 11,0% 11,0%
53.138 58.237 63.691 69.523 75.758 82.420 89.537 97.139 105.255 113.919 122.020 129.985 137.717 145.119 152.093 158.541 164.373 169.501 173.848 177.347 179.942 167.682
0,12403 0,11174 0,10067 0,09069 0,08170 0,07361 0,06631 0,05974 0,05382 0,04849 0,04368 0,03935 0,03545 0,03194 0,02878 0,02592 0,02335 0,02104 0,01896 0,01708 0,01538
6.591 6.508 6.412 6.305 6.190 6.067 5.938 5.803 5.665 5.524 5.330 5.115 4.883 4.635 4.377 4.110 3.839 3.566 3.295 3.029 2.768
The long-term stable growth rate in terminal period (g) -0,5% PV of EVA in terminal period 23.452
Invested capital, beginning of year 460.158 ADD: PV of EVA in horizon period 80.904
PV of EVA in terminal period 23.452
Estimated enterprise value 564.514 LESS: NIBD (end of 2016) -460.158
Estimated market value of equity 104.356
Also provided in Excel file (on USB memory stick), tab ‘Valuation’