Embed Size (px)
Citation preview

Valuation forFinancial ReportingIntangible Assets, Goodwill, andImpairment Analysis, SFAS 141 and 142
Michael J. Mard, CPA/ABV, ASAJames R. Hitchner, CPA/ABV, ASASteven D. Hyden, CPA, ASAMark L. Zyla, CPA/ABV, ASA, CFA
John Wiley & Sons, Inc.


Valuation for Financial Reporting

Valuation forFinancial ReportingIntangible Assets, Goodwill, andImpairment Analysis, SFAS 141 and 142
Michael J. Mard, CPA/ABV, ASAJames R. Hitchner, CPA/ABV, ASASteven D. Hyden, CPA, ASAMark L. Zyla, CPA/ABV, ASA, CFA
John Wiley & Sons, Inc.
Copyright © 2002 by John Wiley & Sons, Inc. All rights reserved.
Published simultaneously in Canada.
No part of this publication may be reproduced, stored in a retrieval system or transmittedin any form or by any means, electronic, mechanical, photocopying, recording, scanningor otherwise, except as permitted under Sections 107 or 108 of the 1976 United StatesCopyright Act, without either the prior written permission of the Publisher, orauthorization through payment of the appropriate per-copy fee to the CopyrightClearance Center, 222 Rosewood Drive, Danvers, MA 01923, (978) 750-8400, fax (978)750-4744. Requests to the Publisher for permission should be addressed to thePermissions Department, John Wiley & Sons, Inc., 605 Third Avenue, New York, NY10158-0012, (212) 850-6011, fax (212) 850-6008, E-Mail: [email protected].
This publication is designed to provide accurate and authoritative information in regardto the subject matter covered. It is sold with the understanding that the publisher is notengaged in rendering legal, accounting, or other professional services. If legal advice orother expert assistance is required, the services of a competent professional personshould be sought.
Wiley also publishes its books in a variety of electronic formats. Some content thatappears in print may not be available in electronic books. For more information aboutWiley products visit our Web site at www.wiley.com.
ISBN 0-471-23753-1
Printed in the United States of America
10 9 8 7 6 5 4 3 2 1
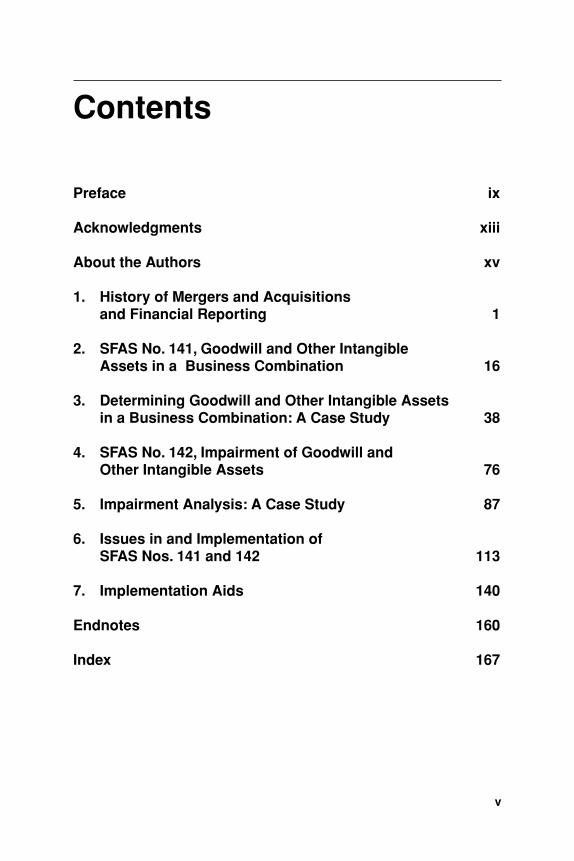
Contents
Preface ix
Acknowledgments xiii
About the Authors xv
1. History of Mergers and Acquisitions and Financial Reporting 1
2. SFAS No. 141, Goodwill and Other Intangible Assets in a Business Combination 16
3. Determining Goodwill and Other Intangible Assets in a Business Combination: A Case Study 38
4. SFAS No. 142, Impairment of Goodwill and Other Intangible Assets 76
5. Impairment Analysis: A Case Study 87
6. Issues in and Implementation of SFAS Nos. 141 and 142 113
7. Implementation Aids 140
Endnotes 160
Index 167
v


To our families—near and far;
young and old;those who have come to us recently;
those who have gone before us;we love you and thank you.
It is with your supportall things, including this book,
are possible.

Preface
We have written this book to provide guidance and insight in the identifi-cation, measurement, and management of intangible assets and goodwillpursuant to the Financial Accounting Standards Board (FASB) Statementof Financial Accounting Standards (SFAS) No. 141, Business Combina-tions, and SFAS No. 142, Goodwill and Other Intangible Assets.
Case studies are provided presenting the application of purchase ac-counting under SFAS No. 141 and a goodwill impairment study underSFAS No. 142. Related issues such as the American Institute of CertifiedPublic Accountants (AICPA) Practice Aid Series, Assets Acquired in aBusiness Combination to Be Used in Research and Development Activi-ties: A Focus of Software, Electronic Devices, and Pharmaceutical In-dustries (IPR&D Practice Aid), are covered.
SFAS Nos. 141 and 142 require financial statements of a survivingcompany to reflect the true financial impact of a merger or acquisition andmandate the use of the purchase method of accounting by eliminating thepooling of interests method for all business combinations. Application ofthe purchase method requires identification of all assets of the acquiringenterprise, tangible and intangible. In addition, any excess of the cost ofan acquired entity over the net amounts assigned to the tangible and intan-gible assets acquired, and the liabilities assumed, is classified as goodwill.
This book is designed to bring clarity to what will be a challenge for fi-nancial executives, certified public accountants (CPAs), and valuation ana-lysts. Because of the new requirements of reporting intangible assets andgoodwill, they will not only have to focus on determining fair value of theassets acquired, but also must assess on at least an annual basis whether im-pairment of those assets has occurred. This book explains the valuation as-pects of the new financial reporting requirements, including how to identifythe characteristics of goodwill and intangible assets, determine if impair-ment has occurred, and employ specific methods to assess the financial im-pact of such impairment.
Readers are provided an example of a business combination in whichtangible and intangible assets are identified and measured, starting withthe determination of the purchase price and development of a businessenterprise analysis. These preliminary steps establish the magnitude of
ix
the total value to be allocated (if you will, the size of the whole pie). Theallocation of fair value to the individual assets (determining the size ofeach slice) will require identifying and quantifying the various types ofintangible assets acquired including: technology-based, customer-related,marketing-related, contract-based, and goodwill.
The cost approach to valuation will be demonstrated for software,customer relationships, and assembled workforce. Various methods of theincome approach will be used to determine value of a noncompete agree-ment, trade name, technology, and in-process research and development.Goodwill arises if there is any residual value after deducting the value ofall other assets from the purchase price.
A detailed example of an impairment analysis is also provided. Thecase study covers determination of fair value for reporting units and theeffect on the first step of an impairment analysis. Step two determines theextent of goodwill impairment and is calculated by subtracting from thenew fair value of the reporting unit the new fair values of the tangible andintangible assets.
Significant issues related to SFAS No. 142 are addressed including:treatment of previously identified but unbooked intangible assets sub-sumed in goodwill, determination of what constitutes a reporting unit,and treatment and allocation of synergies resulting from the businesscombination and subsequent impairment.
Also, included in Chapter 7 are a checklist for data gathering and awork program designed to guide the public or private practitioner throughthe maze of methodologies which may be employed in the determinationof the value of intangibles. In-process research and development (IPR&D)receives special attention with the inclusion of the AICPA Best PracticesAudit Program delineating procedures to be considered when auditing abusiness combination transaction that may involve IPR&D.
We have presented a limited discussion on disclosure in the appen-dix to Chapter 4 only. We have not presented detailed disclosure dis-cussions; we believe such matters to be corporate and audit decisionsunique to each company’s financial statement presentation. Nor havewe presented time lines for implementation; the Statements are effec-tive now. Excluding these two areas allowed a more concise and in-depth review of the regulations’ impact. Our goal has been to provide aconcise and understandable explanation of the regulatory and concep-tual issues underlying SFAS Nos. 141 and 142. Due to the highly tech-nical nature of this area and the importance of the phrasing asoriginally presented in the standards and their interpretation, we de-cided to extract much of the text as is. We are grateful to those who
x Preface

recognized the regulatory importance of this and granted permission toquote their materials.
While numerous articles and commentaries on the subject have ap-peared dating back to the time the FASB began considering the issue, webelieve our book is the first to provide real world examples of the valua-tion techniques and methodologies required to perform a purchase priceallocation under SFAS No. 141 and an impairment study under SFAS No.142. The authors hope that Valuation for Financial Reporting will helplift the veil of mystery surrounding these two important pronouncementsand provide a practical guide for their implementation.
Preface xi

Acknowledgments
To Faye Danger and Deanna Muraki: Faye, thank you for your diligentediting and your tenacity in rooting out virtually every glitch. Thanks foryour perseverance and keeping us on the straight and narrow. Deanna,without your information processing skills, Faye wouldn’t have anythingto edit. Thanks for taking our rambling, disjointed squiggles and turningthem into a finished product.
We also thank Robert R. Dunne, for his strategic perspective and in-sight, and his lovely wife, Linda, who made his insights readable. Wethank our editor, John DeRemigis, for getting Wiley’s formidable supportand our partners and staff for keeping the wheels turning while we wereelsewhere engaged.
We wish to thank our reviewers for their many comments and sug-gestions for improving this first edition. From the Financial ConsultingGroup, they are recognized Specialists in Financial Reporting: Neil J.Beaton, CPA/ABV, CFA, ASA; Darren S. Cordier, CFA; Robert E. Duffy,CPA/ABV, CFA, ASA; William I. Nickles, ASA; James S. Rigby,CPA/ABV, ASA; and Thomas A. Yermack, CFA.
From the national accounting firms, those firms that most directlycarry the burden of self-regulating the accurate implementation of SFASNos. 141 and 142, we thank R. Gregory Morris, CPA of KPMG Consult-ing, Inc. and James Alerding, CPA/ABV, ASA, CVA, with Clifton Gun-derson, LLP
From academia, we thank Joseph E. McCann, III, Ph.D., Dean ofSykes College of Business at the University of Tampa, for his commentsand support, and particularly for his energy in spearheading the recogni-tion, measurement, and management of intangible assets specific to hi-tech companies in Florida.
Special thanks is given to the American Institute of Certified PublicAccountants (AICPA) and the Financial Accounting Standards Board(FASB). Portions of various documents, copyrighted by the AICPA,Harborside Financial Center, 201 Plaza Three, Jersey City, NJ 07311-3881, are reprinted with permission. Portions of various documents,copyrighted by the Financial Accounting Standards Board, 401 Merritt7, P.O. Box 5116, Norwalk, Connecticut 06856-5116, are reprinted with
xiii

permission. Complete copies of the documents are available from theAICPA and the FASB.
The subject matter is difficult, complex, and interwoven. That is our at-tempt at setting the stage for excusing any and all mistakes which, despiteeveryone else’s formidable attempts, are universally our burden to carry.
xiv Acknowledgments
About the Authors
Michael J. Mard, CPA/ABV, ASA is a managing director of The Finan-cial Valuation Group (FVG) in Tampa, Florida. FVG is a financial advi-sory services firm specializing in valuation and litigation services. Hewas founding president of The Financial Consulting Group L.C. (FCG), anational association of professional service firms dedicated to excellencein valuation, litigation, and financial consulting.
Mr. Mard is an FCG recognized specialist for “Financial Reporting inIntangible Assets and Goodwill Impairment.” He was ad hoc advisor tothe FASB on their deliberations concerning SFAS Nos. 141 and 142 andpresented them a session on valuing and lifing intangible assets. Mr.Mard has coauthored 20 courses, published over 60 articles, taught 30courses and been a presenter and speaker on more than 40 occasions.
Mr. Mard has been a full-time business appraiser and expert witnessfor over 18 years, specializing in intangible assets, specifically intellectualproperty. He has developed analyses that have been reviewed and ac-cepted by the Securities and Exchange Commission, numerous accountingfirms (including the Big Five), the IRS, and the courts.
Mr. Mard is very active at state and national levels with emphasis onbusiness valuation standards and intellectual property valuations. He co-authored the AICPA Consulting Services Practice Aid 99-2, “ValuingIntellectual Property and Calculating Infringement Damages” and hasserved on numerous committees and task forces of the AICPA, FICPA,FASB, and ASA. He has received the AICPA Business Volunteer of theYear award and has been inducted into the AICPA Business ValuationHall of Fame.
James R. Hitchner, CPA/ABV, ASA is a shareholder and co-CEO withPhillips Hitchner (PH) in Atlanta, Georgia, which is a financial advisoryservices firm that specializes in valuation and litigation services and is afounding member of the Financial Consulting Group, L.C. (FCG). FCGis a national association of professional services firms dedicated to excel-lence in valuation, financial, and litigation consulting.
Mr. Hitchner is an FCG recognized specialist for “Financial Re-porting in Intangible Assets and Goodwill Impairment.” He has been
xv
involved in hundreds of intangible asset valuations and has presentedhis work to the SEC on numerous occasions. He was ad hoc advisor tothe FASB on their deliberations concerning SFAS Nos. 141 and 142and presented them a session on valuing and lifing intangible assets.
Mr. Hitchner has more than 23 years of professional experience, in-cluding 21 years in valuation services and two years in real estate devel-opment. Prior to forming PH in 1995, he was partner-in-charge ofvaluation services for the Southern Region of Coopers & Lybrand (nowPriceWaterhouseCoopers), where he spent more than nine years. He hasbeen recognized as a qualified expert witness, and has provided testi-mony on valuations in Florida, Georgia, Indiana, New Jersey, North Car-olina, Ohio, Tennessee, and Virginia.
Mr. Hitchner has coauthored 10 courses, taught over 30 courses, pub-lished over 20 articles, and has made over 70 conference presentations.He is also an inductee in the AICPA Business Valuation Hall of Fame. Heis past chairman of the Business Valuation Committee of the Georgia So-ciety of CPAs, past member of the AICPA Business Valuation Subcom-mittee, and current member of the AICPA task force on BusinessValuation Standards.
Steven D. Hyden, CPA, ASA is a managing director of The FinancialValuation Group (FVG) in Tampa, Florida. Mr. Hyden is also president ofHyden Capital, Inc., an affiliate firm providing merger and acquisitionadvisory services.
Mr. Hyden is an FCG recognized specialist for “Financial Reporting inIntangible Assets and Goodwill Impairment.” He has coauthored and taught10 valuation courses. He was guest expert for the AICPA Continuing Profes-sional Education video course series, “Valuation of Intellectual Property.”
Mr. Hyden has been a full-time business appraiser and expert witnessfor over 17 years, specializing in intangible assets, including intellectualproperty. He has developed analyses that have been reviewed and ac-cepted by the Securities and Exchange Commission, numerous account-ing firms (including the Big Five), the IRS, and the courts.
Mark L. Zyla, CPA/ABV, CFA, ASA, is a shareholder with PhillipsHitchner (PH), a financial advisory firm located in Atlanta, Georgia. Mr.Zyla has more than 15 years of financial advisory and valuation experi-ence. He has provided financial advisory services for closely held busi-nesses for the purposes of mergers and acquisitions, gift and estate taxplanning, corporate recapitalizations, as well as many other purposes.He has also been involved in the allocation of purchase price for finan-
xvi About the Authors

cial and tax reporting purposes including the valuation of such intangi-ble assets as patents, trademarks, software, noncompete agreements, andother proprietary technology. Prior to joining PH, he was with PriceWa-terhouseCoopers where he was the practice leader for Coopers & Ly-brand’s Corporate Finance Consulting Group for the SoutheasternUnited States. He is also an FCG recognized specialist for “FinancialReporting in Intangible Assets and Goodwill Impairment.”
Mr. Zyla is a member of the American Institute of Certified PublicAccountants (AICPA), the Association for Investment Management andResearch, and the Atlanta Society of Financial Analysts. Mr. Zyla is aformer member of the Business Valuations Committee of the AICPA. Heis a current member of the Business Valuation Committee of the GeorgiaSociety of CPAs. He is also a member of the Atlanta Venture Forum, aprofessional organization of the venture capital community.
About the Authors xvii
©2001. The Financial Valuation Group, L.C. Used with permission.
xviii

Chapter 1
History of Mergers and Acquisitions and Financial Reporting
The accounting rules for mergers and acquisitions changed dramaticallyon June 29, 2001, with the issuance by the Financial Accounting Stan-dards Board (FASB or Board) of Statement of Financial AccountingStandards (SFAS) No. 141, Business Combinations and SFAS No. 142,Goodwill and Other Intangible Assets. Collectively, the two Statementsended pooling of interests and goodwill amortization, and substituted aframework for analyzing goodwill for impairment.
The evolution of purchase accounting rules in general, and the recog-nition and amortization of intangible assets in particular, were motivatedby ever-increasing merger and acquisition activity in the second half ofthe twentieth century. Accounting rule-makers definitively addressed theissue in 1970, with the issuance of Accounting Principles Board (APB,the predecessor organization to the FASB) Opinion No. 16, BusinessCombinations. APB Opinion No. 16 provided stricter requirements forrecognizing a business combination as a pooling of interests than had ex-isted up to that point.
Purchase accounting required that the cost of an acquisition, that is,the fair value of the assets acquired in a transaction, be reflected on thebooks of the surviving entity. A purchase price that exceeded the fairvalue of the recorded assets of the enterprise meant recognizing the exis-tence and value of acquired intangible assets and amortizing them as ap-propriate. Pooling of interests was an exception; then the balance sheetsof combining entities were merged.
Prior to the release in 1970 of APB Opinion No. 17, Intangible Assets,generally accepted accounting principles (GAAP) recognized intangible
1
assets as having either a limited or indefinite life; the former were amor-tized over their remaining useful lives and the latter were not amortized atall. APB Opinion No. 17 states that “the value of intangible assets at anyone date eventually disappears and that the recorded costs of intangible as-sets should be amortized.”1 This required that all intangible assets beamortized over a period not to exceed 40 years.2 With SFAS No. 142, thetreatment of indefinitely lived intangible assets has come full circle.
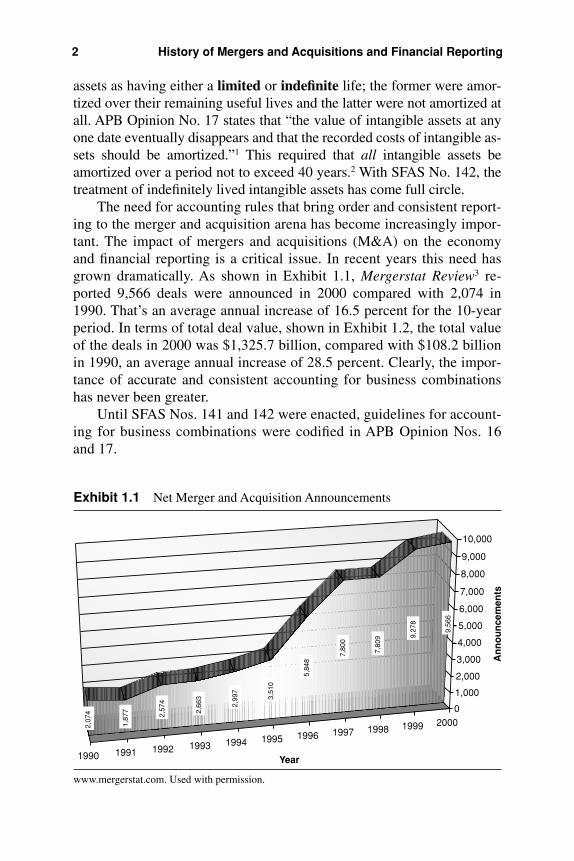
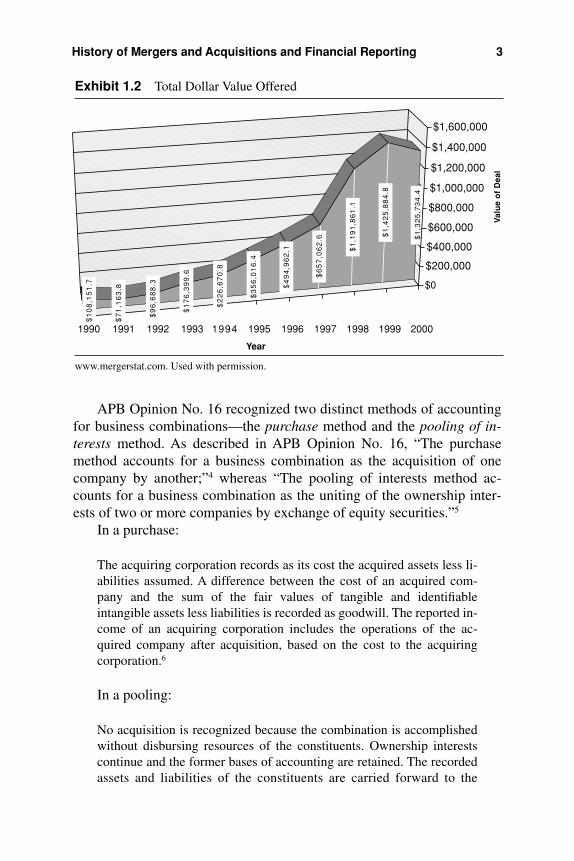
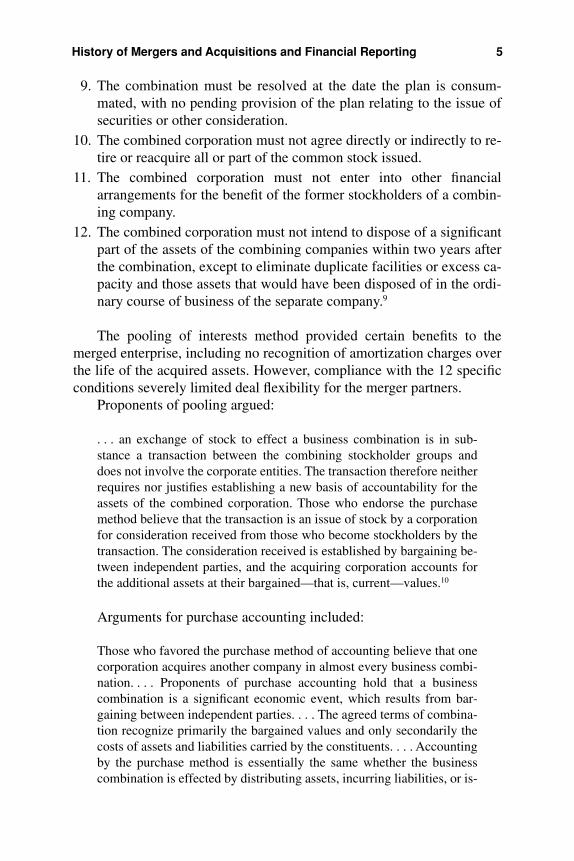
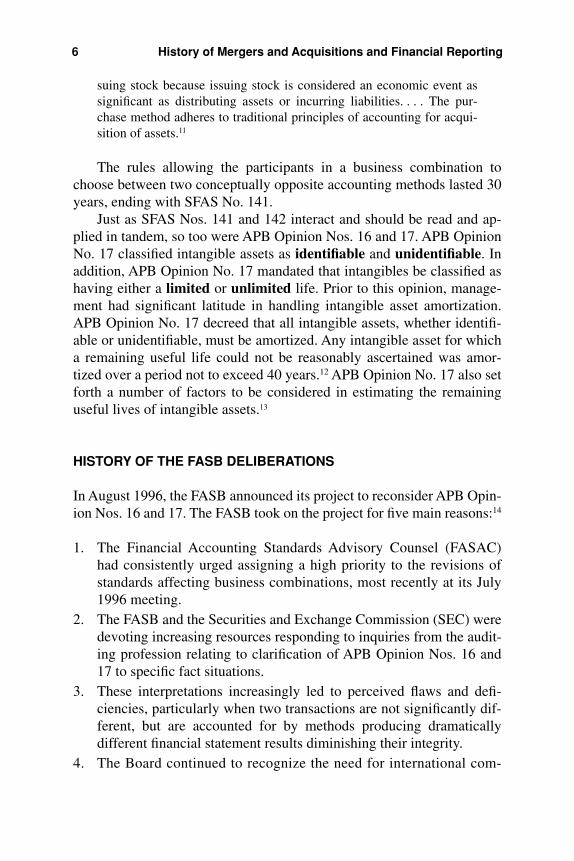
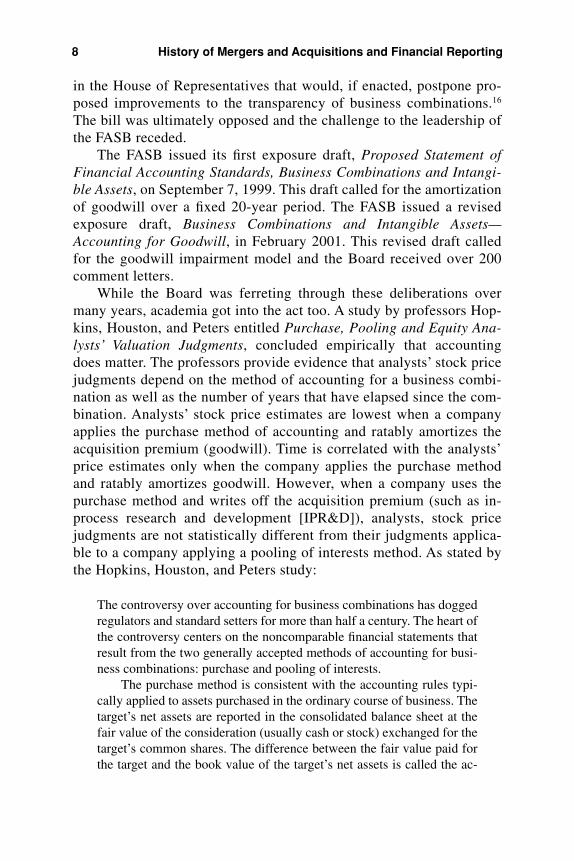
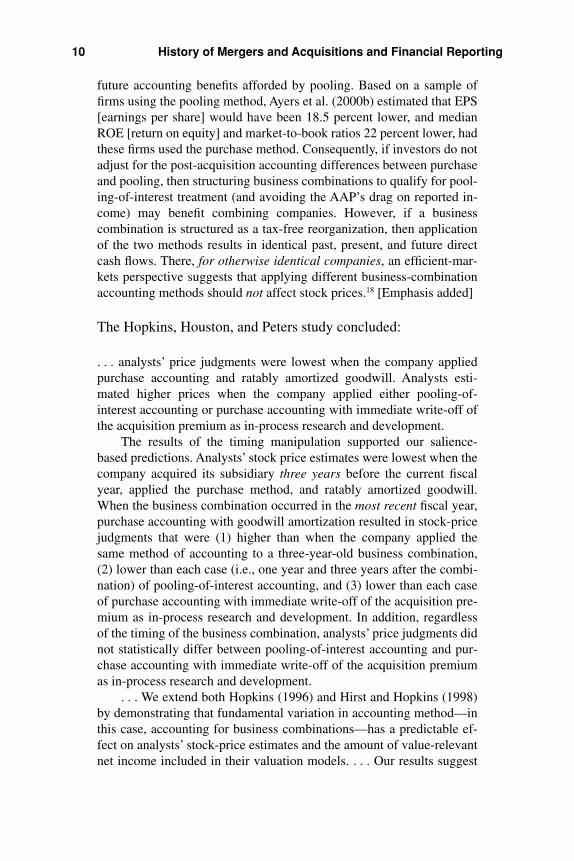
The need for accounting rules that bring order and consistent report-ing to the merger and acquisition arena has become increasingly impor-tant. The impact of mergers and acquisitions (M&A) on the economyand financial reporting is a critical issue. In recent years this need hasgrown dramatically. As shown in Exhibit 1.1, Mergerstat Review3 re-ported 9,566 deals were announced in 2000 compared with 2,074 in1990. That’s an average annual increase of 16.5 percent for the 10-yearperiod. In terms of total deal value, shown in Exhibit 1.2, the total valueof the deals in 2000 was $1,325.7 billion, compared with $108.2 billionin 1990, an average annual increase of 28.5 percent. Clearly, the impor-tance of accurate and consistent accounting for business combinationshas never been greater.
Until SFAS Nos. 141 and 142 were enacted, guidelines for account-ing for business combinations were codified in APB Opinion Nos. 16and 17.
2 History of Mergers and Acquisitions and Financial Reporting
1990 1991 1992 1993 1994 1995 1996 1997 1998 1999 2000
9,56
6
9,27
8
7,80
9
7,80
0
5,84
8
3,51
0
2,99
7
2,66
3
2,57
4
1,87
7
2,07
4 0
1,000
2,000
3,000
4,000
5,000
6,000
7,000
8,000
9,000
10,000
An
no
un
cem
ents
Year
Exhibit 1.1 Net Merger and Acquisition Announcements
www.mergerstat.com. Used with permission.
APB Opinion No. 16 recognized two distinct methods of accountingfor business combinations—the purchase method and the pooling of in-terests method. As described in APB Opinion No. 16, “The purchasemethod accounts for a business combination as the acquisition of onecompany by another;”4 whereas “The pooling of interests method ac-counts for a business combination as the uniting of the ownership inter-ests of two or more companies by exchange of equity securities.”5
In a purchase:
The acquiring corporation records as its cost the acquired assets less li-abilities assumed. A difference between the cost of an acquired com-pany and the sum of the fair values of tangible and identifiableintangible assets less liabilities is recorded as goodwill. The reported in-come of an acquiring corporation includes the operations of the ac-quired company after acquisition, based on the cost to the acquiringcorporation.6
In a pooling:
No acquisition is recognized because the combination is accomplishedwithout disbursing resources of the constituents. Ownership interestscontinue and the former bases of accounting are retained. The recordedassets and liabilities of the constituents are carried forward to the
History of Mergers and Acquisitions and Financial Reporting 3
$1
,32
5,7
34
.4
$1
,42
5,8
84
.8
$1
,19
1,8
61
.1
$6
57
,06
2.6
$4
94
,96
2.1
$3
56
,01
6.4
$2
26
,67
0.8
$1
76
,39
9.6
$9
6,6
88
.3
$7
1,1
63
.8 $0
$200,000
$400,000
$600,000
$800,000
$1,000,000
$1,200,000
$1,400,000
$1,600,000
Val
ue
of
Dea
l
19941990 1991 1992 1993 1995 1996 1997 1998 1999 2000
Year
$1
08
,15
1.7
Exhibit 1.2 Total Dollar Value Offered
www.mergerstat.com. Used with permission.
combined corporation at their recorded amounts. Income of the com-bined corporation includes income of the constituents for the entire fis-cal period in which the combination occurs. The reported income of theconstituents for prior periods is combined and restated as income of thecombined corporation.7
The principle distinction in the accounting treatment of a purchasecompared with a pooling is that in a purchase the fair values of the assets of the acquired corporation were recorded on the books of thepurchaser, while in a pooling, no step-up of assets to fair value wasrecognized. Further, the fair values of assets recognized under pur-chase accounting were subject to periodic amortization under APBOpinion No. 17.8
The pooling of interests method was applied only to business combi-nations involving the exchange of stock. Importantly, APB Opinion No.16 set forth 12 specific conditions, all of which had to be met for a busi-ness combination to be classified as a pooling of interests:
1. Each of the combining companies must be autonomous and must nothave been a subsidiary or division of another corporation during thetwo-year period prior to the initiation of the combination plan.
2. Each of the combining companies is independent of the other com-bining companies.
3. The combination is effected in a single transaction or is completedin accordance with a specific plan within one year after the plan isinitiated.
4. The surviving (or resultant parent) corporation must issue only com-mon stock with rights identical to those of the majority of its out-standing voting common stock, in exchange for “substantially all”(90 percent or more) of the voting common stock of the other (com-bining) companies outstanding.
5. Each of the combining companies must maintain substantially thesame voting common stock interest.
6. The combining companies may reacquire shares of voting commonstock only for purposes other than business combinations.
7. The ratio of the interest of an individual common stockholder tothose of other common stockholders in a combining company mustremain the same.
8. The voting rights of the common stock interests must be exercisableby the stockholders.
4 History of Mergers and Acquisitions and Financial Reporting
9. The combination must be resolved at the date the plan is consum-mated, with no pending provision of the plan relating to the issue ofsecurities or other consideration.
10. The combined corporation must not agree directly or indirectly to re-tire or reacquire all or part of the common stock issued.
11. The combined corporation must not enter into other financialarrangements for the benefit of the former stockholders of a combin-ing company.
12. The combined corporation must not intend to dispose of a significantpart of the assets of the combining companies within two years afterthe combination, except to eliminate duplicate facilities or excess ca-pacity and those assets that would have been disposed of in the ordi-nary course of business of the separate company.9
The pooling of interests method provided certain benefits to themerged enterprise, including no recognition of amortization charges overthe life of the acquired assets. However, compliance with the 12 specificconditions severely limited deal flexibility for the merger partners.
Proponents of pooling argued:
. . . an exchange of stock to effect a business combination is in sub-stance a transaction between the combining stockholder groups anddoes not involve the corporate entities. The transaction therefore neitherrequires nor justifies establishing a new basis of accountability for theassets of the combined corporation. Those who endorse the purchasemethod believe that the transaction is an issue of stock by a corporationfor consideration received from those who become stockholders by thetransaction. The consideration received is established by bargaining be-tween independent parties, and the acquiring corporation accounts forthe additional assets at their bargained—that is, current—values.10
Arguments for purchase accounting included:
Those who favored the purchase method of accounting believe that onecorporation acquires another company in almost every business combi-nation. . . . Proponents of purchase accounting hold that a businesscombination is a significant economic event, which results from bar-gaining between independent parties. . . . The agreed terms of combina-tion recognize primarily the bargained values and only secondarily thecosts of assets and liabilities carried by the constituents. . . . Accountingby the purchase method is essentially the same whether the businesscombination is effected by distributing assets, incurring liabilities, or is-
History of Mergers and Acquisitions and Financial Reporting 5
suing stock because issuing stock is considered an economic event assignificant as distributing assets or incurring liabilities. . . . The pur-chase method adheres to traditional principles of accounting for acqui-sition of assets.11
The rules allowing the participants in a business combination tochoose between two conceptually opposite accounting methods lasted 30years, ending with SFAS No. 141.
Just as SFAS Nos. 141 and 142 interact and should be read and ap-plied in tandem, so too were APB Opinion Nos. 16 and 17. APB OpinionNo. 17 classified intangible assets as identifiable and unidentifiable. Inaddition, APB Opinion No. 17 mandated that intangibles be classified ashaving either a limited or unlimited life. Prior to this opinion, manage-ment had significant latitude in handling intangible asset amortization.APB Opinion No. 17 decreed that all intangible assets, whether identifi-able or unidentifiable, must be amortized. Any intangible asset for whicha remaining useful life could not be reasonably ascertained was amor-tized over a period not to exceed 40 years.12 APB Opinion No. 17 also setforth a number of factors to be considered in estimating the remaininguseful lives of intangible assets.13
HISTORY OF THE FASB DELIBERATIONS
In August 1996, the FASB announced its project to reconsider APB Opin-ion Nos. 16 and 17. The FASB took on the project for five main reasons:14
1. The Financial Accounting Standards Advisory Counsel (FASAC)had consistently urged assigning a high priority to the revisions ofstandards affecting business combinations, most recently at its July1996 meeting.
2. The FASB and the Securities and Exchange Commission (SEC) weredevoting increasing resources responding to inquiries from the audit-ing profession relating to clarification of APB Opinion Nos. 16 and17 to specific fact situations.
3. These interpretations increasingly led to perceived flaws and defi-ciencies, particularly when two transactions are not significantly dif-ferent, but are accounted for by methods producing dramaticallydifferent financial statement results diminishing their integrity.
4. The Board continued to recognize the need for international com-
6 History of Mergers and Acquisitions and Financial Reporting
parability of accounting standards that would enhance the move-ment of capital flows globally. The FASB had been working withthe Australian Accounting Standards Board, The New Zealand Fi-nancial Standards Board, the United Kingdom Accounting Stan-dards Board, the Canadian Institute of Chartered Accountants, andthe International Accounting Standards Committee with the goalof achieving international convergence with respect to the methodsof accounting for business combinations. As part of this coopera-tion, the FASB issued a position paper, Methods of Accounting for Business Combinations: Recommendations of the G4+1 forAchieving Convergence, on December 15, 1998. They received267 responses.
5. The Board had come to believe that the pooling of interests methodcreated an unlevel playing field domestically and internationally foracquirers who may or may not be able to apply that method.
Over the period of deliberation, there was much activity with manypresentations invited by the FASB. Ed Jenkins, Chairman, testified be-fore Congress on this project three times in the year 2000. Further, heparticipated in oversight hearings before and round table discussionsheld by the Senate Committee on Banking, Housing and Urban Affairs.In September 2000, the Board met with a team of representatives fromthe American Business Conference (including representatives fromCisco Systems, Merrill Lynch and Co., TechNet, and the United ParcelService) to discuss a proposed impairment test that would apply topurchased goodwill. In May 2000, the Board met with a team of repre-sentatives from the investment banking community and several publicaccounting firms to discuss the residual income valuation model (tech-nically known as the Multi-Period Excess Earnings Model) to measureand account for goodwill. In January 1999, the Board and staff metwith representatives of the AICPA Business Valuation subcommittee,authors Michael J. Mard, CPA/ABV, ASA and James R. Hitchner,CPA/ABV, ASA for an educational meeting on identifying, valuing,and lifing purchased intangible assets. Methodologies were presentedalong with over 500 legal case citations in which the central issue wasthe valuation of intangibles. This included the U.S. Supreme Courtcase, Newark Morning Ledger Co. v. U.S.15
With all of this activity and the international reach created by theFASB leadership, Congress had to get into the act. On October 3,2000, representative Christopher Cox (R-California) introduced a bill
History of the FASB Deliberations 7
in the House of Representatives that would, if enacted, postpone pro-posed improvements to the transparency of business combinations.16
The bill was ultimately opposed and the challenge to the leadership ofthe FASB receded.
The FASB issued its first exposure draft, Proposed Statement ofFinancial Accounting Standards, Business Combinations and Intangi-ble Assets, on September 7, 1999. This draft called for the amortizationof goodwill over a fixed 20-year period. The FASB issued a revised exposure draft, Business Combinations and Intangible Assets—Accounting for Goodwill, in February 2001. This revised draft calledfor the goodwill impairment model and the Board received over 200comment letters.
While the Board was ferreting through these deliberations overmany years, academia got into the act too. A study by professors Hop-kins, Houston, and Peters entitled Purchase, Pooling and Equity Ana-lysts’ Valuation Judgments, concluded empirically that accountingdoes matter. The professors provide evidence that analysts’ stock pricejudgments depend on the method of accounting for a business combi-nation as well as the number of years that have elapsed since the com-bination. Analysts’ stock price estimates are lowest when a companyapplies the purchase method of accounting and ratably amortizes theacquisition premium (goodwill). Time is correlated with the analysts’price estimates only when the company applies the purchase methodand ratably amortizes goodwill. However, when a company uses thepurchase method and writes off the acquisition premium (such as in-process research and development [IPR&D]), analysts, stock pricejudgments are not statistically different from their judgments applica-ble to a company applying a pooling of interests method. As stated bythe Hopkins, Houston, and Peters study:
The controversy over accounting for business combinations has doggedregulators and standard setters for more than half a century. The heart ofthe controversy centers on the noncomparable financial statements thatresult from the two generally accepted methods of accounting for busi-ness combinations: purchase and pooling of interests.
The purchase method is consistent with the accounting rules typi-cally applied to assets purchased in the ordinary course of business. Thetarget’s net assets are reported in the consolidated balance sheet at thefair value of the consideration (usually cash or stock) exchanged for thetarget’s common shares. The difference between the fair value paid forthe target and the book value of the target’s net assets is called the ac-
8 History of Mergers and Acquisitions and Financial Reporting

counting acquisition premium (AAP). The AAP is first allocated to thefair values of the target’s identifiable net assets. Any remaining (unallo-cated) AAP is classified as goodwill and amortized over a period not toexceed 40 years.
In contrast, pooling requires the acquirer to record the historicalbook values of the target’s net assets. The AAP is not recorded incombinations that qualify for pooling treatment; therefore, they gen-erally report higher net income relative to otherwise identical combi-nations that apply the purchase method. In addition, pooling requiresthe acquirer to recognize the target’s net income for the entire year inwhich the business combination occurred, regardless of the actualtransaction date. Under pooling, prior years’ financial statements arerestated to combine the financial statements of the two companies as if they have always been a single economic unit. This unusualmixture of book-value recognition and prior-period restatement orig-inated almost a century ago “for combinations in which a strong degree of affiliation existed between the combining entities prior to the combination” (FASB 1998, Appendix p. 3). Since that time,this treatment has been extended to combinations of entities withoutprior affiliation.17
The impact of the accounting method on earnings per share can bedramatic and may lead to perceived distortions, not necessarily becauseof the method of accounting, but rather because different players are in-volved. As Hopkins, Houston, and Peters state:
Although the use of the purchase or pooling accounting is not a choice,per se, companies that otherwise would be required to use purchase ac-counting appear to be willing to incur significant direct and indirectcosts to qualify for pooling treatment. Empirical and anecdotal evi-dence suggests that companies incur significant costs to meet APB 16’spooling criteria. For example, while Nathan (1988) did not find higheracquisition premia for firms applying the pooling method, Robinsonand Shane (1990), David (1990), Vincent (1997), and Ayers et al.(2000a) suggest that poolings result in higher acquisition premia thanpurchases. Ayers et al. (2000a) estimate that 15 percent of the acquisi-tion premium in poolings is attributable to the cost of obtaining poolingtreatment. Similarly, Lys and Vincent (1995) suggest that ATT, in its ac-quisition of NCR, incurred approximately $50 million of incrementalcosts to qualify for pooling treatment.
These higher premia suggest that either fundamental differencesexist between the companies that qualify for pooling versus purchaseaccounting, or acquirers are willing to pay an additional amount for the
History of the FASB Deliberations 9
future accounting benefits afforded by pooling. Based on a sample offirms using the pooling method, Ayers et al. (2000b) estimated that EPS[earnings per share] would have been 18.5 percent lower, and medianROE [return on equity] and market-to-book ratios 22 percent lower, hadthese firms used the purchase method. Consequently, if investors do notadjust for the post-acquisition accounting differences between purchaseand pooling, then structuring business combinations to qualify for pool-ing-of-interest treatment (and avoiding the AAP’s drag on reported in-come) may benefit combining companies. However, if a businesscombination is structured as a tax-free reorganization, then applicationof the two methods results in identical past, present, and future directcash flows. There, for otherwise identical companies, an efficient-mar-kets perspective suggests that applying different business-combinationaccounting methods should not affect stock prices.18 [Emphasis added]
The Hopkins, Houston, and Peters study concluded:
. . . analysts’ price judgments were lowest when the company appliedpurchase accounting and ratably amortized goodwill. Analysts esti-mated higher prices when the company applied either pooling-of-interest accounting or purchase accounting with immediate write-off ofthe acquisition premium as in-process research and development.
The results of the timing manipulation supported our salience-based predictions. Analysts’ stock price estimates were lowest when thecompany acquired its subsidiary three years before the current fiscalyear, applied the purchase method, and ratably amortized goodwill.When the business combination occurred in the most recent fiscal year,purchase accounting with goodwill amortization resulted in stock-pricejudgments that were (1) higher than when the company applied thesame method of accounting to a three-year-old business combination,(2) lower than each case (i.e., one year and three years after the combi-nation) of pooling-of-interest accounting, and (3) lower than each caseof purchase accounting with immediate write-off of the acquisition pre-mium as in-process research and development. In addition, regardlessof the timing of the business combination, analysts’ price judgments didnot statistically differ between pooling-of-interest accounting and pur-chase accounting with immediate write-off of the acquisition premiumas in-process research and development.
. . . We extend both Hopkins (1996) and Hirst and Hopkins (1998)by demonstrating that fundamental variation in accounting method—inthis case, accounting for business combinations—has a predictable ef-fect on analysts’ stock-price estimates and the amount of value-relevantnet income included in their valuation models. . . . Our results suggest
10 History of Mergers and Acquisitions and Financial Reporting

that analysts are more likely to remove from reported net income the ef-fects of large, one-time charges. . . . Compared to ratable amortizationthat causes prolonged reduction of reported earnings, analysts are morelikely to discount the effects of a non-cash charge if it is presented as aone-time item.19
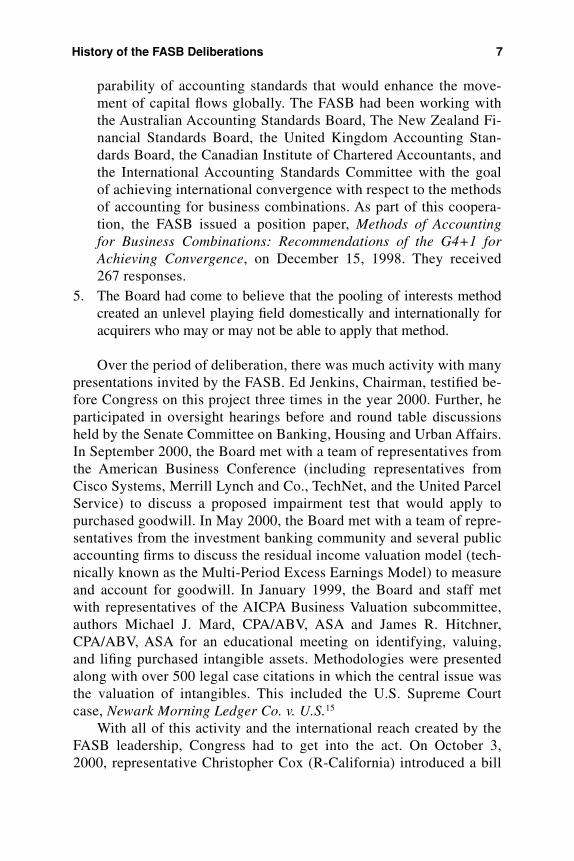
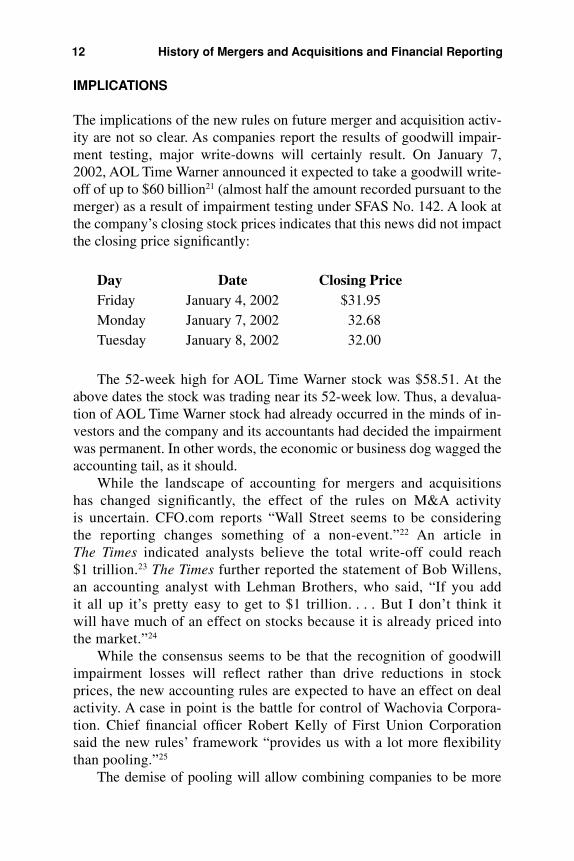
The result of the Hopkins, Houston, and Peters study is demonstratedin Exhibit 1.3.
History of the FASB Deliberations 11
PAST(c)
RECENT(c)
PAST/FASB-GW(d)
8
10
12
14
16
18
POOL PURCH-GW PURCH-RD
Accounting Method (b)
Sto
ck P
rice
Pre
dict
ion
(a)
Exhibit 1.3 Analysts’ Common Stock Price Judgments by Business-Combination Accounting Method and Business-CombinationTiming Conditions20
(a) Analysts estimated the price of a company’s common stock (PRICE) after receivinginformation about the company and its industry, including an income statement, bal-ance sheet, statement of cash flows, statement of changes in owner’s equity, and asummary of significant accounting policies. We held constant all information, exceptthe information directly related to the two independent variables.
(b) The method of accounting for the business combination varied between subjectsas (1) pooling of interests (“POOL”), (2) purchase with the accounting acquisitionpremium (AAP) capitalized as goodwill and amortized over six years (“PURCH-GW”), or (3) purchase with the AAP expensed as in-process research and develop-ment (“PURCH-RD”). Because the business combination was consummated via atax-free exchange of common shares, cash flows were identical across accountingmethods.
(c) The business combination occurred either at the beginning of the most recent fiscalyear (“RECENT”) or at the beginning of the three-years-prior fiscal year (“PAST”).
(d) We also constructed a set of PURCH-GW materials that incorporated the FASB’s pro-posed reporting format for presentation of goodwill amortization (i.e., PAST/FASB-GW). Except for modifying the income statement location of goodwill (i.e., immediatelypreceding net income) and providing a per-share amount for pre-amortization income,the materials were identical to those presented to PAST/PURCH-GW analysts.
© Copyright 2000, The Accounting Review. Used with permission.
IMPLICATIONS
The implications of the new rules on future merger and acquisition activ-ity are not so clear. As companies report the results of goodwill impair-ment testing, major write-downs will certainly result. On January 7,2002, AOL Time Warner announced it expected to take a goodwill write-off of up to $60 billion21 (almost half the amount recorded pursuant to themerger) as a result of impairment testing under SFAS No. 142. A look atthe company’s closing stock prices indicates that this news did not impactthe closing price significantly:
Day Date Closing PriceFriday January 4, 2002 $31.95Monday January 7, 2002 32.68Tuesday January 8, 2002 32.00
The 52-week high for AOL Time Warner stock was $58.51. At theabove dates the stock was trading near its 52-week low. Thus, a devalua-tion of AOL Time Warner stock had already occurred in the minds of in-vestors and the company and its accountants had decided the impairmentwas permanent. In other words, the economic or business dog wagged theaccounting tail, as it should.
While the landscape of accounting for mergers and acquisitionshas changed significantly, the effect of the rules on M&A activity is uncertain. CFO.com reports “Wall Street seems to be consideringthe reporting changes something of a non-event.”22 An article in The Times indicated analysts believe the total write-off could reach $1 trillion.23 The Times further reported the statement of Bob Willens,an accounting analyst with Lehman Brothers, who said, “If you add it all up it’s pretty easy to get to $1 trillion. . . . But I don’t think it will have much of an effect on stocks because it is already priced intothe market.”24
While the consensus seems to be that the recognition of goodwillimpairment losses will reflect rather than drive reductions in stockprices, the new accounting rules are expected to have an effect on dealactivity. A case in point is the battle for control of Wachovia Corpora-tion. Chief financial officer Robert Kelly of First Union Corporationsaid the new rules’ framework “provides us with a lot more flexibilitythan pooling.”25
The demise of pooling will allow combining companies to be more
12 History of Mergers and Acquisitions and Financial Reporting
creative in structuring deals. PriceWaterhouseCoopers predicted that thedisappearance of pooling will have the following impact on future deals:
• Flexibility to sell noncore assets—pooling rules contained restrictionson the disposal of acquired assets
• Increased use of cash in deals—pooling rules forbade cash consid-eration
• Treasury stock repurchases will become more popular—the old pool-ing rules restricted the reacquisition of stock
• Greater flexibility in structuring compensation programs—the poolingrules restricting a company’s ability to cash out, alter, or grant new eq-uity awards are no longer relevant
• More contingent consideration—the old pooling rules prohibitedearnouts26
Bear Stearns has predicted:
We also expect to see an increase in M&A activity, particularly in in-dustries that have been sensitive to earnings dilution. While not pro-ducing the same financial reporting results as a pooling, purchase ac-counting without goodwill amortization will greatly level the playingfield for both acquirers and targets.27
Bear Stearns further explains:
With the elimination of pooling and its 12 criteria, there will also bemore flexibility to structure transactions efficiently. Not only will com-panies that are, or had been, a subsidiary or a division of another com-pany any time in the last two years become more attractive, companieswill no longer be compelled to buy all or retain all of the target. In addi-tion, it eliminates a barrier to “hostile” transactions.28
The following chapters explain and illustrate the accounting rules ingreater detail. But what can we expect of their impact on the world thatcreates the need for such rules? Is there any consensus on the future ef-fect of the two Statements on M&A activity?
As mentioned earlier, the AOL impairment example would suggestthat investors are not greatly swayed by impairment charges in earningsannouncements of companies that had combined under the old rules.Observers are already cautioning that, “The facts and circumstances
Implications 13
surrounding each goodwill impairment charge will need to be evalu-ated for their investment significance.”29 Ms. McConnell of BearStearns writes:
In the past, a goodwill impairment charge was often considered thesign of a bad acquisition, a miscalculation of the value of the target(i.e., the acquirer overpaid), or an unexpected deterioration in the fun-damentals of the business acquired. Under the new rules, a goodwillimpairment charge within a few years of the acquisition date may bean indication of any of these as well. However, as time goes by, it isless likely that an impairment is an indication of a bad acquisition oran overpayment. In fact, it is possible that the investment may havebeen recovered with an appropriate return but, because there has beenno amortization, the goodwill remains on the balance sheet. A good-will impairment many years after an acquisition is more likely to bean indication of the third condition, deterioration in the fundamentalsof the business. As noted above, if the market has already anticipatedthis, the actual recognition of the loss will not have an additional im-pact on the stock price.30
Many think fears of a major impact are overblown. Sophisticated in-vestors should easily grasp the earnings impact of the new pronounce-ments. Those who hold this view further argue that the effect of the newrules for GAAP will be blunted since more and more investors increas-ingly evaluate companies on measures based on cashflow or operatingearnings. To the extent that earnings dilution still worries companies, theelimination of goodwill amortization charges will ease the fears of man-agement that have been holding back from acquisitions because of thespectre of future accounting charges.
The Hopkins, Houston, and Peters study found that the accountingmethod did matter. But their study was completed in 1999, well beforeSFAS Nos. 141 and 142 were released, and acquirers still had a choice.Indeed, they had the prescience to test the proposed goodwill amortiza-tion-reporting protocol described in FASB’s business combinations ex-posure draft.31 When analysts were provided income statements that con-tained the improved disclosure, they generally provided higher stockprice judgments than analysts who received income statements with tra-ditional goodwill amortization.32
It does not appear that many commentators are predicting a generaldecline in stock prices due to the new reporting rules. It seems to be gen-erally accepted that investors will adjust to the new reporting, especially
14 History of Mergers and Acquisitions and Financial Reporting

in industries that are valued using price/earnings ratios. Investors willmake the necessary adjustments to more or less maintain stock prices. Onthe other hand, many observers believe that the elimination of poolingand its restrictions combined with a leveling of the playing field in termsof financial reporting will actually have a positive effect on future M&Aactivity. No one has a crystal ball and it is safe to say that the implemen-tation of the new rules will not be problem-free. However, SFAS Nos.141 and 142 are law, so financial executives and their advisors must ob-tain a clear understanding of them.
Implications 15

Chapter 2
SFAS No. 141, Goodwill and Other Intangible Assetsin a Business Combination
Recent changes in regulatory requirements leading to the identificationand measurement of intangible assets are discussed in this chapter. Wewill discuss at length SFAS No. 141 and the new in-process research anddevelopment (IPR&D) Practice Aid. Chapter 3 will augment this discus-sion by providing a detailed example of a purchase price allocation, illus-trated with the valuation of seven distinct identifiable intangible assetsacquired in a business combination.
WHAT ARE INTANGIBLE ASSETS?
It seems everyone believes he knows what an intangible asset is until itcomes time to actually write a precise definition. The Report of theBrookings Task Force on Intangibles (Brookings Task Force) defined in-tangibles as:
. . . nonphysical factors that contribute to or are used in producing goodsor providing services, or that are expected to generate future productivebenefits for the individuals or firms that control the use of those factors.1
The International Valuation Standards Committee was, perhaps moreprecise in defining intangible assets as:
. . . assets that manifest themselves by their economic properties, theydo not have physical substance, they grant rights and privileges to their
16

owner; and usually generate income for their owner. Intangible Assetscan be categorized as arising from Rights, Relationships, Grouped In-tangibles, or Intellectual Property.2
The International Valuation Standards Committee goes on to defineeach category.
Probably the briefest definition was provided by the FASB:
. . . assets (not including financial assets) that lack physical substance.3
Per the FASB, intangible assets are distinguished from goodwill. TheFASB provides specific guidance for the identification of intangible as-sets such that any asset not so identified would fall into the catch-all cate-gory of goodwill.
Each of these definitions are correct and, in their venue, appropriate.But the nature of intangible assets requires more explanation. Intangibleassets are a subset of human capital, which is a collection of education,experience, and skill of a company’s employees. Structural capital is dis-tinguished from human capital but also includes intangible assets such asprocess documentation and the organizational structure itself, which isthe supportive infrastructure provided for human capital. This encourageshuman capital to create and leverage its knowledge. Intangible assets arethe codified physical descriptions of specific knowledge that can beowned and readily traded. Separability and transferability (specific to theasset or attached to another) are fundamental prerequisites to the mean-ingful codification and measurement of intangible assets. Further, intan-gible assets receiving legal protection become intellectual property,which is generally categorized into five types: patents, copyrights, trade-names (-marks and -dress), trade secrets, and know-how.
WHY ARE INTANGIBLE ASSETS SO DIFFICULT TO MEASURE?
Traditional accounting rests on the foundation of historical cost: If there isan invoice, there is an asset and it can be measured. The corollary, however,invites ridicule: If there is no invoice, there is no asset. The Brookings TaskForce was succinct regarding measurement difficulties when it said:
Because one cannot see, or touch, or weigh intangibles, one cannotmeasure them directly but must instead rely on proxies, or indirect mea-sures, to say something about their impact on some other variable thatcan be measured.4
Why Are Intangible Assets So Difficult to Measure? 17
Over the years, the FASB has sought to change the historical cost focusof measurement. In fact, the FASB has increasingly required fair value de-termination as applicable to specific Statements of Financial Accounting.There are approximately three dozen Statements that require considerationof fair value.5 As of this writing, the scope of a new FASB project, “Disclo-sure of Information about Intangible Assets not Recognized in FinancialStatements,”6 focuses on the disclosure of internally generated intangibleassets that are not recognized in financial statements. One of the authors ofthis book, Michael J. Mard, serves on this project’s working group, whichwill study how the identification and measurement of internally generatedintangible assets should be reported in the financial statements. Such poten-tial reporting ranges from footnote disclosure to full financial statementdisclosure.7 Clearly, the identification and measurement of intangible assetsis becoming recognized and accepted by the market. How is this done?
THE NATURE OF INTANGIBLE ASSETS
Opportunity cost is a mainstay of finance. Many finance courses focus onthe opportunities available to utilize tangible assets, with the goal of ap-plying those tangible assets to the opportunity with the highest return. Op-portunities not selected can be viewed as returns foregone or opportunitycost. The physical reality is that tangible assets can only be in one place atone time. Professor Baruch Lev, New York University, Stern School ofBusiness, looked at the physical, human, and financial assets (all consid-ered tangible) as competing for the opportunity. In a sense, these assets arerival or scarce assets “. . . in which the scarcity is reflected by the cost ofusing the assets (the opportunity foregone).”8
Such assets distinguish themselves from intangible assets in that in-tangible assets do not rival each other for incremental returns. In fact, in-tangible assets can be applied to multiple uses for multiple returns. AsProfessor Lev says:
The non-rivalry (or non-scarcity) attribute of intangibles—the ability touse such assets in simultaneous and repetitive applications without di-minishing their usefulness—is a major value driver at the business enter-prise level as well as at the national level. Whereas physical and financialassets can be leveraged to a limited degree by exploiting economies ofscale or scope in production (a plant can be used for at most three shifts aday), the leveraging of intangibles to generate benefits—the scalability ofthese assets—is generally limited only by the size of the market. The use-fulness of the ideas, knowledge, and research embedded in a new drug ora computer operating system is not limited by the diminishing returns to
18 Goodwill and Other Intangible Assets in a Business Combination

scale typical of physical assets (as production expands from two to threeshifts, returns decrease due, for example, to the wage premium paid forthe third shift and to employee fatigue). In fact, intangibles are often char-acterized by increasing returns to scale. An investment in the develop-ment of a drug or a financial instrument (a risk-hedging mechanism, forexample), is often leveraged in the development of successor drugs andfinancial instruments. Information is cumulative, goes the saying.9
IDENTIFICATION AND CLASSIFICATION
Identification of intangible assets is as broad as the business mind is cre-ative. There are the well-accepted intangibles such as customer base, in-process research and development, and technology, as well as intellectualproperty such as patents, copyrights, trademarks, trade secrets, andknow-how. The value of these assets typically account for a vast majorityof an enterprise’s total intangible value, depending on the industry. Thereare also unique intangible assets peculiar to an industry or enterprise suchas deposits in a bank.
In an attempt to provide some structure to the recognition of identifi-able intangible assets and to enhance the longevity of its financial model,the FASB has classified intangibles into five categories:
1. Marketing-related intangible assets2. Customer-related intangible assets3. Artistic-related intangible assets4. Contract-based intangible assets5. Technology-based intangible assets10
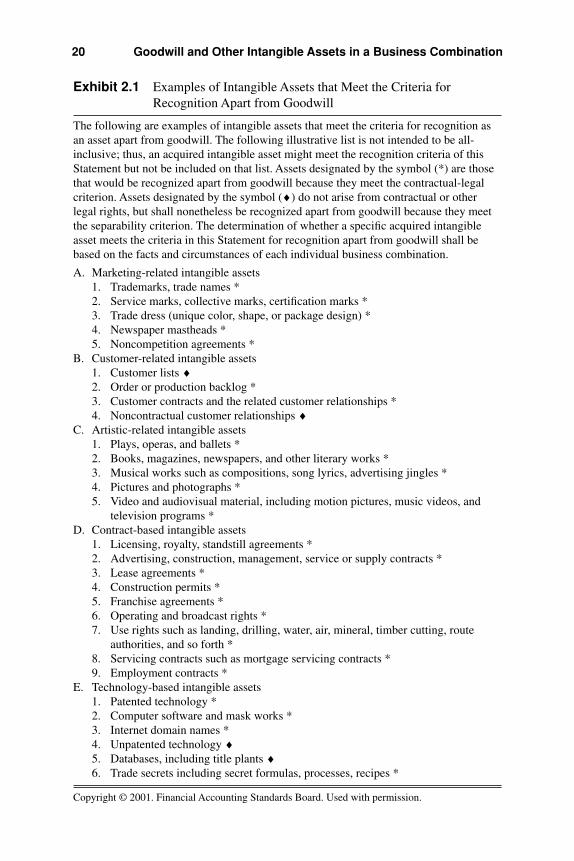
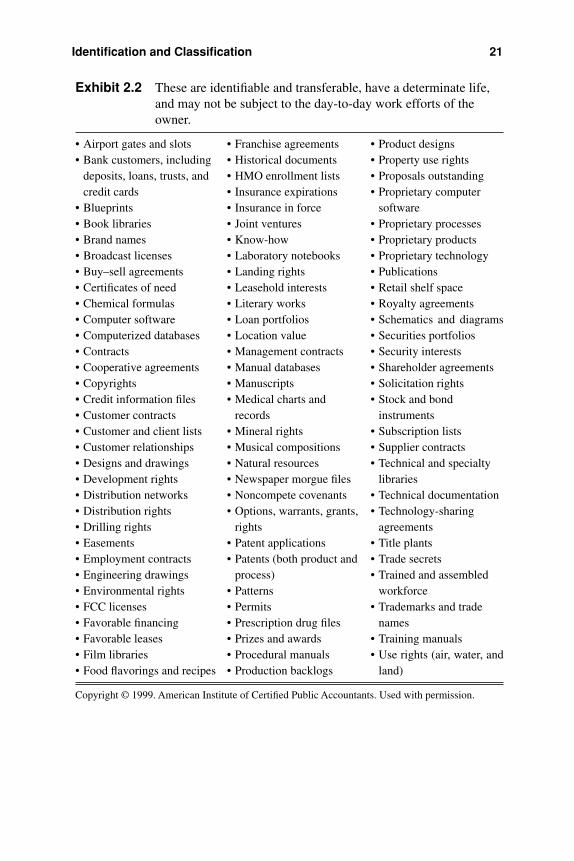
The FASB goes on to provide an explanation and examples for eachof the categories (Exhibit 2.1).11 Notably, assembled workforce is ex-cluded because it fails the separability and transferability test. A companymay have the best employees of the highest value in the world, but theyhave no value if separated from the business. Further, the Board was notconfident of the reliability of the measurement tools most often used forassembled workforce and its associated intellectual capital. The FASB in-stead chose to categorize assembled workforce within the components ofgoodwill.12 Exhibit 2.213 provides an expanded but unclassified list of in-tangibles culled from numerous tax court cases over the years and mostrecently presented in the AICPA’s Consulting Services Practice Aid 99-2,Valuing Intellectual Property and Calculating Infringement Damages.
Identification and Classification 19
20 Goodwill and Other Intangible Assets in a Business Combination
Exhibit 2.1 Examples of Intangible Assets that Meet the Criteria forRecognition Apart from Goodwill
The following are examples of intangible assets that meet the criteria for recognition asan asset apart from goodwill. The following illustrative list is not intended to be all-inclusive; thus, an acquired intangible asset might meet the recognition criteria of thisStatement but not be included on that list. Assets designated by the symbol (*) are thosethat would be recognized apart from goodwill because they meet the contractual-legalcriterion. Assets designated by the symbol (♦) do not arise from contractual or otherlegal rights, but shall nonetheless be recognized apart from goodwill because they meetthe separability criterion. The determination of whether a specific acquired intangibleasset meets the criteria in this Statement for recognition apart from goodwill shall bebased on the facts and circumstances of each individual business combination.
A. Marketing-related intangible assets1. Trademarks, trade names *2. Service marks, collective marks, certification marks *3. Trade dress (unique color, shape, or package design) *4. Newspaper mastheads *5. Noncompetition agreements *
B. Customer-related intangible assets1. Customer lists ♦2. Order or production backlog *3. Customer contracts and the related customer relationships *4. Noncontractual customer relationships ♦
C. Artistic-related intangible assets1. Plays, operas, and ballets *2. Books, magazines, newspapers, and other literary works *3. Musical works such as compositions, song lyrics, advertising jingles *4. Pictures and photographs *5. Video and audiovisual material, including motion pictures, music videos, and
television programs *D. Contract-based intangible assets
1. Licensing, royalty, standstill agreements *2. Advertising, construction, management, service or supply contracts *3. Lease agreements *4. Construction permits *5. Franchise agreements *6. Operating and broadcast rights *7. Use rights such as landing, drilling, water, air, mineral, timber cutting, route
authorities, and so forth *8. Servicing contracts such as mortgage servicing contracts *9. Employment contracts *
E. Technology-based intangible assets1. Patented technology *2. Computer software and mask works *3. Internet domain names *4. Unpatented technology ♦5. Databases, including title plants ♦6. Trade secrets including secret formulas, processes, recipes *
Copyright © 2001. Financial Accounting Standards Board. Used with permission.
Identification and Classification 21
Exhibit 2.2 These are identifiable and transferable, have a determinate life,and may not be subject to the day-to-day work efforts of theowner.
• Airport gates and slots • Franchise agreements • Product designs• Bank customers, including • Historical documents • Property use rights
deposits, loans, trusts, and • HMO enrollment lists • Proposals outstandingcredit cards • Insurance expirations • Proprietary computer
• Blueprints • Insurance in force software• Book libraries • Joint ventures • Proprietary processes• Brand names • Know-how • Proprietary products• Broadcast licenses • Laboratory notebooks • Proprietary technology• Buy–sell agreements • Landing rights • Publications• Certificates of need • Leasehold interests • Retail shelf space• Chemical formulas • Literary works • Royalty agreements• Computer software • Loan portfolios • Schematics and diagrams• Computerized databases • Location value • Securities portfolios• Contracts • Management contracts • Security interests• Cooperative agreements • Manual databases • Shareholder agreements• Copyrights • Manuscripts • Solicitation rights• Credit information files • Medical charts and • Stock and bond• Customer contracts records instruments• Customer and client lists • Mineral rights • Subscription lists• Customer relationships • Musical compositions • Supplier contracts• Designs and drawings • Natural resources • Technical and specialty• Development rights • Newspaper morgue files libraries• Distribution networks • Noncompete covenants • Technical documentation• Distribution rights • Options, warrants, grants, • Technology-sharing• Drilling rights rights agreements• Easements • Patent applications • Title plants• Employment contracts • Patents (both product and • Trade secrets• Engineering drawings process) • Trained and assembled• Environmental rights • Patterns workforce• FCC licenses • Permits • Trademarks and trade• Favorable financing • Prescription drug files names• Favorable leases • Prizes and awards • Training manuals• Film libraries • Procedural manuals • Use rights (air, water, and• Food flavorings and recipes • Production backlogs land)
Copyright © 1999. American Institute of Certified Public Accountants. Used with permission.

THE MEASUREMENT OF INTANGIBLE ASSETS
The International Valuation Standards (IVS) Guidance Note No. 6, Busi-ness Valuation, addresses factors to be considered in valuing intangibleassets.14 Further, in its delineation of applicable methodology, IVS Guid-ance Note No. 6 provides the basic economic approaches (the cost ap-proach, the income approach, and the market approach) to valuingintangible assets.15
A key fundamental underlying the valuation of intangible assets is theconcept of the tension between risk and return. As Professor Lev states:
Assuredly, all investments and assets are risky in an uncertain busi-ness environment. Yet the riskiness of intangibles is, in general, sub-stantially higher than that of physical and even financial assets. Forone, the prospects of a total loss common to many innovative activi-ties, such as a new drug development or an internet initiative, are veryrare for physical or financial assets. Even highly risky physical pro-jects, such as commercial property, rarely end up as a loss. . . . A com-parative study of the uncertainty associated with R&D and that ofproperty, plant, and equipment confirms the large risk differentials:the earnings volatility (a measurement of risk) associated with R&Dis, on average, three times larger than the earnings volatility associ-ated with physical investment.16
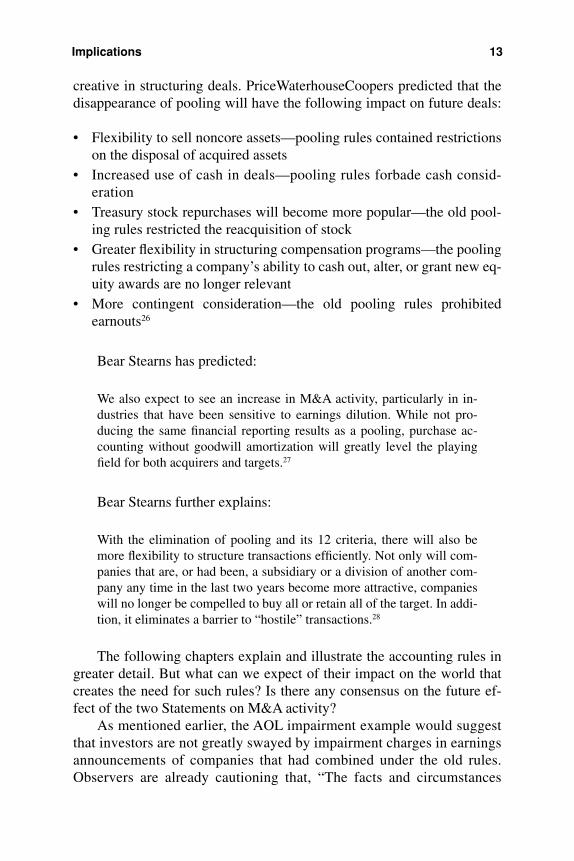
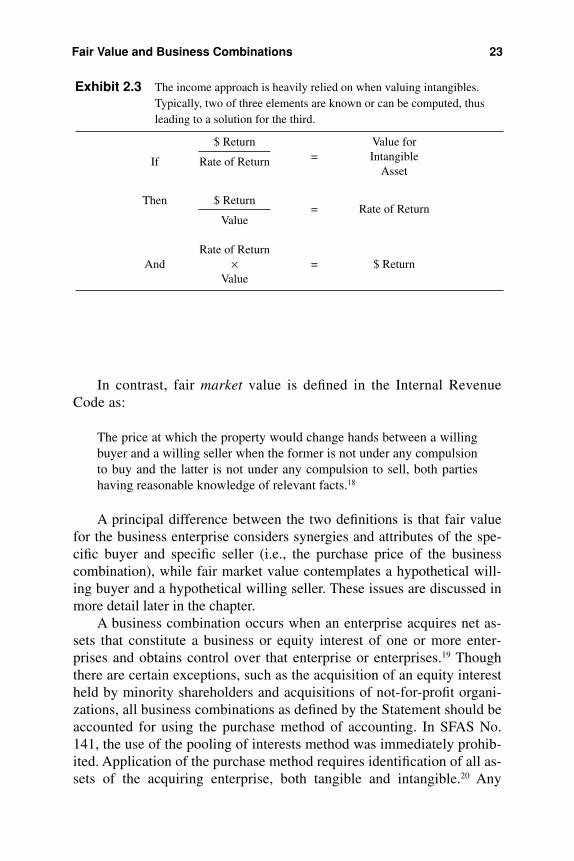
A fundamental tenet of economics holds that return requirementsincrease as risk increases with intangible assets inherently more riskythan tangible assets. It is reasonable to conclude that the returns ex-pected on intangible assets typically will be at or above the averagerate of return (discount rate) for the company as a whole. The relation-ship of the amount of return, the rate of return (including risk), and thevalue of the asset creates a mathematical formula used in analysis (seeExhibit 2.3).
The following sections discuss recent regulatory changes affectingintangible assets and goodwill including the standard of value.
FAIR VALUE AND BUSINESS COMBINATIONS
The definition of fair value as stated in SFAS No. 141 is:
The amount at which that asset (or liability) could be bought (or in-curred) or sold (or settled) in a current transaction between willing par-ties, that is, other than in a forced or liquidation sale.17
22 Goodwill and Other Intangible Assets in a Business Combination
In contrast, fair market value is defined in the Internal RevenueCode as:
The price at which the property would change hands between a willingbuyer and a willing seller when the former is not under any compulsionto buy and the latter is not under any compulsion to sell, both partieshaving reasonable knowledge of relevant facts.18
A principal difference between the two definitions is that fair valuefor the business enterprise considers synergies and attributes of the spe-cific buyer and specific seller (i.e., the purchase price of the businesscombination), while fair market value contemplates a hypothetical will-ing buyer and a hypothetical willing seller. These issues are discussed inmore detail later in the chapter.
A business combination occurs when an enterprise acquires net as-sets that constitute a business or equity interest of one or more enter-prises and obtains control over that enterprise or enterprises.19 Thoughthere are certain exceptions, such as the acquisition of an equity interestheld by minority shareholders and acquisitions of not-for-profit organi-zations, all business combinations as defined by the Statement should beaccounted for using the purchase method of accounting. In SFAS No.141, the use of the pooling of interests method was immediately prohib-ited. Application of the purchase method requires identification of all as-sets of the acquiring enterprise, both tangible and intangible.20 Any
Fair Value and Business Combinations 23
Exhibit 2.3 The income approach is heavily relied on when valuing intangibles.Typically, two of three elements are known or can be computed, thusleading to a solution for the third.
$ Return Value for
If Rate of Return = Intangible Asset
Then $ Return= Rate of Return
Value
Rate of Return And × = $ Return
Value
excess of the cost of an acquired entity over the net amounts assigned tothe tangible and intangible assets acquired and liabilities assumed willbe classified as goodwill.21
RECOGNITION OF INTANGIBLE ASSETS
As stated earlier, the definition of intangible assets includes current andnoncurrent assets (not including financial instruments) that lack physicalsubstance.22 An acquired intangible asset shall be recognized apart fromgoodwill if that asset arises from contractual or other legal rights. If anintangible asset does not arise from contractual or other legal rights, itshall be recognized apart from goodwill only if it is separable. That is, itmust be capable of being separated or divided from the acquired enter-prise and sold, transferred, licensed, rented, or exchanged (regardless ofwhether there is an intent to do so). An intangible asset that cannot besold, transferred, licensed, rented, or exchanged individually is still con-sidered separable if it can be paired with a related contract, asset or liabil-ity and sold, transferred, licensed, rented, or exchanged. An importantexception to the individual recognition of intangible assets is the value ofan assembled workforce of “at will” employees. Thus, a group of em-ployees acquired in a business combination who are not bound by an em-ployment agreement will be recorded as goodwill regardless of whetherthe asset meets the criteria for recognition apart from goodwill.23
Residual value should factor into determining the amount of an intan-gible asset to be amortized and is defined as the estimated fair value of anintangible asset at the end of its useful life less any disposal costs. A rec-ognized intangible asset with an indefinite useful life may not be amor-tized until its life is determined to be no longer indefinite. If no legal,regulatory, contractual, competitive, economic, or other factors limit theuseful life of an intangible asset, the useful life of that asset should beconsidered indefinite. The term indefinite does not mean infinite. A recog-nized intangible asset that is not amortized must be tested for impairmentannually, and on an interim basis if an event or circumstance occurringbetween annual tests indicates that the asset might be impaired.24
TAX EFFECTS
Intangible assets are valued after tax. Tax effects include providing for in-come taxes in any forecast of cash flow, providing for tax amortization of
24 Goodwill and Other Intangible Assets in a Business Combination

intangible assets over a 15-year period per Internal Revenue Code Sec-tion 197. Fair value should also capture “amortization benefit,” that is,the incremental value attributable to an intangible by virtue of its tax de-ductibility. Including the tax effects in the valuation process is commonin the income and cost approaches, but not typical in the market ap-proach, since any tax effect is routinely factored into the quoted marketprice (such as the price to net earnings multiple).
CONTRIBUTORY CHARGES (RETURNS ON AND OF)
Imbedded in the concept that the fair value of an identifiable intangibleasset is equal to the present value of the net cash flows attributable tothat asset is the notion that the net cash flows attributable to the subjectasset must recognize the support of many other assets, tangible and in-tangible, which contribute to the realization of the cash flows. The con-tributory asset charges (of cash flow) are based on the fair value of thecontributing assets. After-tax cash flows for certain identifiable intangi-ble assets are assessed charges representing a “return on” and a “returnof” the contributory assets based on their fair values. The return on theasset refers to a hypothetical assumption whereby the project pays theowner of the contributory assets a fair return on the fair value of the hy-pothetically rented assets (in other words, return on is the payment forusing the asset). For self-developed assets (such as assembled work-force or customer base), the cost to replace these assets is already fac-tored into the cash flow analysis as part of the operating cost structurein the form of ongoing development expenses. Similarly, the return offixed assets is included in the cost structure as depreciation. Return of isthe cost to replace the asset and is deducted from the subject revenues(see Exhibit 2.4).
PRESENT VALUE CONSIDERATIONS FOR INTANGIBLE ASSETS
The FASB concludes that fair value is the objective when using presentvalue in measurements at the initial recognition and fresh-start measure-ments of assets. Two approaches are specifically recognized: the ex-pected cash flow approach and the traditional approach.25 The expectedcash flow approach focuses on the variations in the amount and timing ofestimated cash flows and their relative probability of occurrence. The tra-ditional approach attempts to capture those same factors by focusing on
Present Value Considerations for Intangible Assets 25

the selection of an interest rate that is commensurate with the risk. TheStatement notes five elements of a present value measurement, whichtaken together capture the economic differences among assets:
1. An estimate of the future cash flow, or in more complex cases, seriesof future cash flows at different times
2. Expectations about possible variations in the amount or timing ofthose cash flows
3. The time value of money, represented by the risk-free rate of interest4. The price for bearing the uncertainty inherent in the asset or liability
26 Goodwill and Other Intangible Assets in a Business Combination
Risk/Return Distribution
5%
7%8%
16% 16%
18% 18%
16%
25%
28%
0%
5%
10%
15%
20%
25%
30%
Wor
king
Cap
ital
Land
and
Bui
ldin
g
Mac
hine
ry a
nd
Equ
ipm
ent
Trad
e N
ame
Non
com
pete
Agr
eem
ent
Tech
nolo
gy
Sof
twar
e
Cus
tom
er B
ase
Ass
embl
edW
orkf
orce
IPR
&D
Goo
dwill
18%
Exhibit 2.4 A company’s tangible and intangible rates of return can bepresented as:
Where:1. The midline of the distribution represents the company’s discount rate,2. Items below the midline represent returns on tangible assets (such as working capital: 5% and land
and buildings: 7%),3. Items above the midline represent returns on intangible assets (such as IPR&D: 25% and customer
base: 18%), and4. The highest rate of return represents the riskiest asset, goodwill.© 2002. The Financial Valuation Group, LC. Used with permission.
5. Other, sometimes unidentifiable, factors including illiquidity andmarket imperfections26
Estimates of future cash flows are subject to a variety of risks and un-certainties, especially related to new product launches, such as:
• The time to bring the product to market• The market and customer acceptance• The viability of the technology• Regulatory approval• Competitor response• The price and performance characteristics of the product27
The risk premium assessed in a discount rate should decrease as aproject successfully proceeds through its continuum of development,since the uncertainty about accomplishing the necessary first step andeach subsequent step diminishes.
IN-PROCESS RESEARCH AND DEVELOPMENT
In this technological age, as research and development (R&D) activitiesbecome an increasingly larger part of industrial activity, the financial re-porting of assets to be used in R&D activities, especially specific in-process research and development (IPR&D) projects, has becomeincreasingly controversial.
Acquired IPR&D is particularly prevalent in the pharmaceutical,software, and devices industries. The subject of IPR&D has been comprehensively addressed in the AICPA Practice Aid Series, AssetsAcquired in a Business Combination to Be Used in Research and De-velopment Activities: A Focus on Software, Electronic Devices, andPharmaceutical Industries (the IPR&D Practice Aid). The IPR&DPractice Aid states, “This Practice Aid identifies what the Task Forcemembers perceive as best practices related to defining and accountingfor, disclosing, valuing, and auditing assets acquired to be used inR&D activities, including specific IPR&D projects.”28 Those readerswishing a more detailed analysis of the subject should refer to theIPR&D Practice Aid.
In-process research and development can be generally defined as a research and development project that has not yet been completed.
In-Process Research and Development 27
Acquired IPR&D is a subset of an intangible asset to be used in R&D ac-tivities. Costs to be allocated to assets acquired to be used in R&D activi-ties should possess the characteristics of control and expected economicbenefit, with fair value being estimable with reasonable reliability. If anasset to be used in R&D activities is a specific IPR&D project, that proj-ect should have both substance and be incomplete.29
SFAS No. 2, Accounting for Research and Development Costs, de-fines R&D and sets forth broad guidelines as to the activities that consti-tute R&D activities. Assets to be used in R&D activities subsequently areaccounted for under FASB Interpretation No. 4, Applicability of SFASNo. 2 to Business Combinations Accounted for by the Purchase Method.GAAP generally requires that the fair value of acquired IPR&D be imme-diately charged to income, but may be amortized if an alternative futureuse exists for the asset. Separately identifiable assets include both tangi-ble and intangible assets.
An acquiring company’s interest in such assets is controllable by thecombined enterprise such that it can obtain benefit from the asset andcontrol others’ access to the asset. Acquired IPR&D has economic benefitwhen the acquiring company can demonstrate that each such asset, eithersingly or in combination with other assets, will be used in postcombina-tion R&D activities.30
The IPR&D Practice Aid is consistent with FASB Statement of Fi-nancial Accounting Concepts 6, Elements of Financial Statements,which states:
Assets are probable future economic benefits obtained or controlled bya particular entity as a result of past transactions or events. . . . An assethas three essential characteristics: (a) it embodies a probable future eco-nomic benefit that involves a capacity, singly or in combination withother assets, to contribute directly or indirectly to future net cash flows,(b) a particular entity can obtain the benefit and control others’ access toit, and (c) the transaction or other event giving rise to the entity’s rightto or control of the benefit has already occurred.31
Examples of control include:
• The combined enterprise has the ability to sell, lease, license, fran-chise, or use its rights to the R&D asset acquired; or
• The combined enterprise has proprietary intellectual property rights,which it believes could be successfully defended if its ownership werechallenged.32
28 Goodwill and Other Intangible Assets in a Business Combination

The fair value of acquired IPR&D must be measurable, that is, itmust be able to be estimated with reasonable reliability. The economicbenefit of the product, service, or process that is expected from theIPR&D effort must be sufficiently determinable such that a reasonablyreliable estimate of the future expected net cash flows can be made basedon assumptions that are verifiable. For example, a reasonably reliable es-timate of fair value may be determinable if the following seven compo-nents of IPR&D can be estimated with confidence:
1. A market for the product2. Time needed to commercialize and market the product3. Potential customers and market penetration4. The effects of competitors’ existing or potential products5. The combined enterprise’s share of the market6. The selling price7. Production and related costs for the product33
The basic form of an IPR&D life cycle will at some point lead to theacquiring company likely being able to estimate fair value with reason-able reliability. This basic form includes:
• Conceptualization, which is an idea, thought, or plan for a new prod-uct and includes an initial assessment of the potential market, cost,and technical issues for such concepts.
• Applied research, which is the planned search or critical investigationaimed at the discovery of new knowledge including assessing the fea-sibility of successfully completing the project.
• Development, which translates the research into a detailed plan or de-sign for a new product, service, or process.
• Preproduction, which represents the business activities necessary tocommercialize the asset.34
To be recognized as an asset, specific IPR&D projects must havesubstance, which is the recognition of sufficient cost and effort thatwould enable the project’s fair value to be estimated with reasonable reli-ability.35 Further, the IPR&D must be incomplete in that there are remain-ing technological, engineering, or regulatory risks.36
Recommended financial statement disclosure includes but is not lim-ited to the identification of the following by the acquiring company:
In-Process Research and Development 29
• A description of the projects to which value was ascribed, includingthe status of the project
• The values assigned to each of the assets acquired including theamount of the in-process R&D charge
• The techniques used in each acquisition to value assets acquired to beused in R&D activities
• The key assumptions used in valuing the assets acquired to be used inR&D activities, such as:a. The time frame for cash flows expected to be realized, andb. The weighted average discount rates used in determining present
values37
Cost should be assigned to all identifiable tangible and intangible as-sets, including any resulting from R&D activities of the acquired com-pany or to be used in R&D activities of the combined enterprise. Theacquiring company should allocate a portion of the purchase price to eachacquired identifiable intangible asset that possesses either of the follow-ing characteristics:
• Produces cash flows that are largely independent of cash flows gener-ated by other assets
• Could realistically be licensed, sold, transferred, exchanged or dis-posed of in a transaction in which it is the only asset.38
For the purpose of valuation, cash flows should be allocated to each in-tangible asset on an as-if-separated basis, representing the typical cash flowcarve-outs and returns on and of charges in the multiperiod excess earningsmodel. Importantly, synergistic value may not be attributed to an acquiredidentifiable asset. Thus, synergistic value falls into goodwill, which is cal-culated on a residual basis. As stated in the IPR&D Practice Aid:
A willing buyer may factor into the amount that it would pay to acquirethe seller’s business a portion of the incremental cash flows that are ex-pected to inure to the benefit of that buyer. The incremental cash flowsmay include those resulting from strategic or synergistic components.If the buyer pays the seller any significant consideration for strategicor synergistic benefits in excess of those expected to be realized bymarket participants, the valuation specialist would identify those ex-cess benefits and remove them from the valuation of assets acquired.Thus, the cost of the acquired company may include an element of
30 Goodwill and Other Intangible Assets in a Business Combination
synergistic value (i.e., investment value). However, for purposes of as-signing cost to the assets acquired in accordance with FASB StatementNo. 141, the amount of the purchase price allocated to an acquired as-set would not include any entity-specific synergistic value. Fair valuedoes not include strategic or synergistic value resulting from expecta-tions about future events that are specific to a particular buyer becausethe value associated with those components is unique to the buyer andseller and would not reflect market-based assumptions. Therefore, en-tity-specific value associated with strategic or synergistic componentswould be included in goodwill. Fair value would incorporate expecta-tions about future events that affect market participants. If the acquir-ing company concludes that the discounted cash flow method bestapproximates the fair value of an acquired asset, the discounted cashflows would incorporate assumptions that market participants woulduse in their estimates of fair values, future revenues, future expenses,and discount rates (if applicable).39
Although the determination of fair value revolves around the threeclassic approaches to valuation, cost, market, and income, the relieffrom royalties method and the multiperiod excess earnings method areparticularly relied on.
The analyst should review certain information in order to properlyevaluate management’s identification and classification of assets acquired(including IPR&D intangibles). At a minimum, this would include:
• Presentations to the board of directors• Offering memoranda• Due diligence reports• Press releases (both of the acquiring and the acquired companies)• Web site materials• Analysts reports• Industry reports40
Prospective Financial Information (PFI) is provided by management,but the sources, methodologies, procedures, adjustments, and applicationmust be tested by the analyst. The IPR&D Practice Aid states:
. . . PFI provided by management that is accepted by the valuationspecialist without having been subjected to validating procedures bythe valuation specialist would contradict the performance of bestpractices. . . .41
In-Process Research and Development 31
Further, the IPR&D Practice Aid states:
The valuation specialist does not simply accept PFI from managementwithout investigating its suitability for use in the valuation analysis. Thevaluation specialist is responsible for evaluating the methodology andassumptions used by management in preparing the PFI and concludingwhether the PFI is appropriate for use in valuing the assets acquired.42
As stated above, the analyst should determine and document that aparticular R&D project has substance. In addition to the consideration ofthe information reviewed to properly evaluate management’s identifica-tion and classification of assets acquired, the basis for such documenta-tion should include:
• Stage of completion of the project• Treatment and emphasis given to the project in the company’s product
road-map for the technology• Acquired company’s R&D budget• Acquired company’s R&D planning documents and related status
reports• R&D costs incurred by project and estimated costs to complete the
project43
Further, the analyst must conclude that the R&D project is incom-plete as of the acquisition date based on the following:
• Stage of development as indicated by the development milestones at-tained and yet to be reached
• Remaining technological, engineering, or regulatory risks to beovercome
• Remaining development costs to be incurred• Remaining time to be spent to reach completion• Probability of successful completion44
Finally, the analyst should conclude and document whether the assetsacquired to be used in R&D activities have an alternative future use. Ifso, the value of that asset would be capitalized and amortized pursuant toSFAS Nos. 141 and 142. If the assets acquired to be used in R&D activi-ties do not have an alternative use, those costs would be charged to ex-pense as of the date of acquisition.45
32 Goodwill and Other Intangible Assets in a Business Combination
Appendix 2.1
INTELLECTUAL PROPERTY
One of the major difficulties in valuing intellectual property is determin-ing the context of licensor/licensee negotiations. All too often this contextis assumed or simplified, resulting in market royalty rates being appliedout of context. Most valuation analysts traditionally develop royalty ratesfrom three traditional sources:
1. Negotiated licensing agreements2. Surveys performed by various professionals, generally in coopera-
tion with trade associations3. Judicial opinions, which vary greatly depending on individual fact
patterns
These traditional tools can now be augmented by databases of licens-ing agreements extracted from publicly available sources. Such directmarket data is some of the most compelling evidence available to deter-mine the appropriate royalty rate in a valuation.
The market comparison–transaction method approach is used to valueintellectual property. This approach initially has four steps to derive an over-all value estimate: (1) research the appropriate market for comparable intel-lectual property transactions; (2) verify the information by confirming thatthe market data obtained is factually accurate and that the license exchangetransactions reflect arm’s-length market considerations; (3) compare andapply the guideline license transactions’ financial and operational aspects tothe subject intellectual property; and (4) reconcile the various value indica-tions into a single value indication or range of values.
EMPIRICAL RESEARCH AND VERIFICATION OF ROYALTY RATES
Proprietary research of intangible assets and intellectual properties is im-portant in business valuation. The value the market perceives in intellec-tual property-intensive companies is associated with their intangible
Financial Reporting Disclosures 33

assets and intellectual properties. Valuation of such companies is often anexercise in intangible asset valuation methods rather than traditionalbusiness valuation methods. Emphasis should be placed on proprietarystudies (industry research, industry pricing metrics, and comparable in-tellectual property transactions). Research and verification of comparabledata can be a time-consuming process. Recently, advances in informationtechnology and the availability of online public records have made re-search of intellectual property transactions a realistic endeavor.
Databases that gather and organize comparative intellectual propertytransactions are rapidly becoming the tool of the future to those analystswho specialize in intellectual property valuation. At the time of publica-tion, there are three known Internet sites that have collated data or pro-vide information for a fee:
• RoyaltySource (www.royaltysource.com)• Consor® (www.consor.com)• The Financial Valuation Group (www.fvginternational.com)
COMPARING AND APPLYING THE DATA
Intellectual property transactions should be compared to the subject com-pany using the following guidelines:
• The specific legal rights of intellectual property ownership conveyedin the guideline transaction
• The existence of any special financing terms or other arrangements• Whether the elements of arm’s length existed for the sale or license
conditions• The economic conditions that existed in the appropriate secondary
market at the time of the sale or license transaction• The industry in which the guideline intellectual property was or will
be used• The financial and operational characteristics of the guideline proper-
ties, compared with the subject company’s intellectual property
RECONCILIATION
The last phase of the market approach valuation analysis is the reconcili-ation. The strengths and weaknesses of each comparable transaction areconsidered; the reliability and appropriateness of the market data exam-
34 Goodwill and Other Intangible Assets in a Business Combination
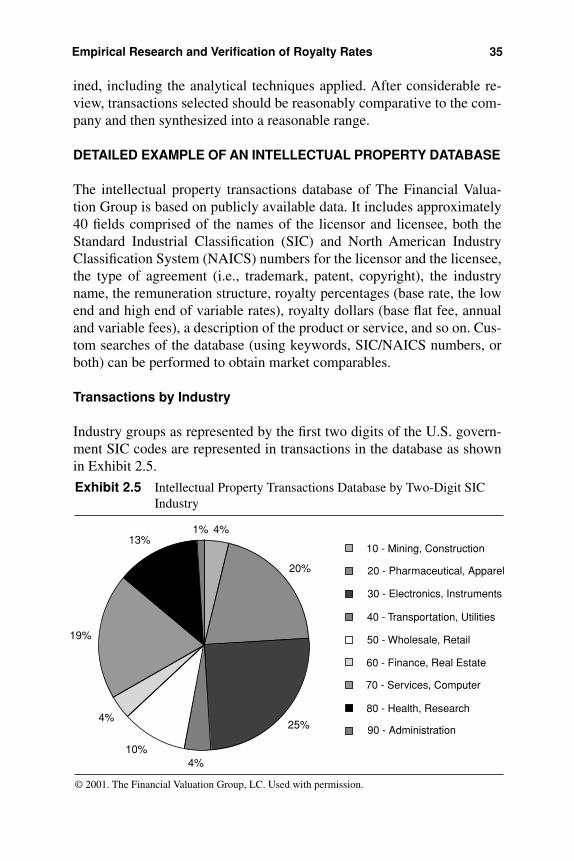
ined, including the analytical techniques applied. After considerable re-view, transactions selected should be reasonably comparative to the com-pany and then synthesized into a reasonable range.
DETAILED EXAMPLE OF AN INTELLECTUAL PROPERTY DATABASE
The intellectual property transactions database of The Financial Valua-tion Group is based on publicly available data. It includes approximately40 fields comprised of the names of the licensor and licensee, both theStandard Industrial Classification (SIC) and North American IndustryClassification System (NAICS) numbers for the licensor and the licensee,the type of agreement (i.e., trademark, patent, copyright), the industryname, the remuneration structure, royalty percentages (base rate, the lowend and high end of variable rates), royalty dollars (base flat fee, annualand variable fees), a description of the product or service, and so on. Cus-tom searches of the database (using keywords, SIC/NAICS numbers, orboth) can be performed to obtain market comparables.
Transactions by Industry
Industry groups as represented by the first two digits of the U.S. govern-ment SIC codes are represented in transactions in the database as shownin Exhibit 2.5.
Empirical Research and Verification of Royalty Rates 35
20%
25%
4%10%
4%
19%
13%10 - Mining, Construction
20 - Pharmaceutical, Apparel
30 - Electronics, Instruments
40 - Transportation, Utilities
50 - Wholesale, Retail
60 - Finance, Real Estate
70 - Services, Computer
80 - Health, Research
90 - Administration
4%1%
Exhibit 2.5 Intellectual Property Transactions Database by Two-Digit SICIndustry
© 2001. The Financial Valuation Group, LC. Used with permission.
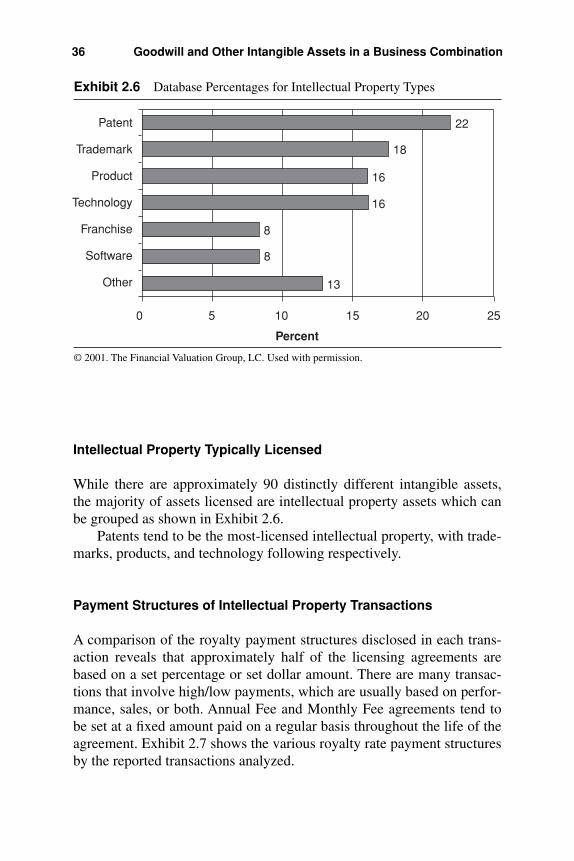
Intellectual Property Typically Licensed
While there are approximately 90 distinctly different intangible assets,the majority of assets licensed are intellectual property assets which canbe grouped as shown in Exhibit 2.6.
Patents tend to be the most-licensed intellectual property, with trade-marks, products, and technology following respectively.
Payment Structures of Intellectual Property Transactions
A comparison of the royalty payment structures disclosed in each trans-action reveals that approximately half of the licensing agreements arebased on a set percentage or set dollar amount. There are many transac-tions that involve high/low payments, which are usually based on perfor-mance, sales, or both. Annual Fee and Monthly Fee agreements tend tobe set at a fixed amount paid on a regular basis throughout the life of theagreement. Exhibit 2.7 shows the various royalty rate payment structuresby the reported transactions analyzed.
36 Goodwill and Other Intangible Assets in a Business Combination
Patent
Trademark
Product
Technology
Franchise
Software
Other
0 5 10 15 20 25
Percent
22
18
16
16
8
8
13
Exhibit 2.6 Database Percentages for Intellectual Property Types
© 2001. The Financial Valuation Group, LC. Used with permission.

Reasons to Use the Database
The database is used to support:
• Damages in an intellectual property litigation case• Reasonable royalty percentage rates• Accurate valuation conclusions• Rebuttal of unreasonable value estimates put forth by others• Transfer pricing opinions
Because royalty rates derived from transactions take so many eco-nomic structures, it is difficult to interpret them in a manner that is usefulfor a particular need. Analysis of licensing transactions similar to a par-ticular fact situation would be necessary to determine a market royaltyrate applicable to that situation. The analyst with requisite skill, educa-tion, and experience will be able to draw upon the data to form well-founded and defensible conclusions and opinions.
Detailed Example of an Intellectual Property Database 37
12%
25%14%
7%
8%
5%
4%
25%
Fixed Dollars and FixedPercent Combined
Fixed Percent
Percent Variable
Percent and Dollar Combined, Variable
Dollar Variable
Fixed Dollars
Undisclosed/Unknown
Royalty Fee
Exhibit 2.7 Payment Structure of Database Transactions
© 2001. The Financial Valuation Group, LC. Used with permission.
Chapter 3
Determining Goodwill and Other Intangible Assetsin a Business Combination:A Case Study
Under generally accepted accounting principles (GAAP), an acquiringcompany must record the fair value of the assets acquired in a businesscombination. SFAS No. 141 mandates such purchase accounting for allacquisitions.1 At face value, purchase accounting is a simple process—determine the total purchase price paid for an entity and allocate that pur-chase price to the various assets acquired. However, the valuation ofintangibles is more complex. This section presents an example of a pur-chase price allocation.
There are numerous complexities in a purchase price allocationand there are various challenges to be met along the way. These chal-lenges include:
• Determining the purchase price—the purchase price is more thanjust the cash and/or publicly traded stock paid for an acquisi-tion; notes issued and/or liabilities assumed increase the purchaseprice. Contingent considerations muddy the waters (e.g., contingentevents, earnouts, restricted or nonmarketable securities tendered,etc.).
• Performing a valuation of the acquirer to determine the value of itsstock if the purchase price includes the payment of stock of a privatelyheld acquirer.
• Identifying all acquired assets, tangible and intangible.• Identifying if the sum of the fair values of the assets may exceed the
purchase price.
38
• Dealing with situations where data for valuing or estimating the usefullife of certain assets may be limited or not available.
The example presented in the following pages is of an acquisitionof the assets of a privately held corporation, and may differ in thetreatment of certain issues compared with an acquisition of stock orpublic company acquisition. While the numerous steps and processesare presented sequentially, in reality the various activities are per-formed simultaneously over a period of weeks, often by a staff of sev-eral analysts.
SFAS No. 141 states that the cost of an acquired entity should bemeasured with reference to cash payments, fair values of other assets dis-tributed as consideration, and the fair values of liabilities incurred by anacquiring entity.2 This adjusted purchase price may be alternatively de-fined as the sum of all cash and stock paid, debt incurred, and liabilitiesassumed. In this example, the adjusted purchase price is assumed to be$209,000,000 based on the following assumptions:
Cash paid* $150,000,000Liabilities assumed
Current liabilities** 25,000,000Current maturities of long-term debt 4,000,000Long-term debt 30,000,000
Adjusted purchase price $209,000,000*Including capitalized acquisition costs**Excluding externally funded debt
As used here, the term adjusted purchase price equals the totalpaid for all of the acquired company’s assets, and includes all pay-ments and liabilities assumed. It is important to distinguish this mea-surement from the concept of invested capital, which is defined as thesum of debt and equity in an enterprise on a long-term basis,3 shownhere as $184,000,000.
At this point, it is useful for the analyst to understand the overallmagnitude of the intangible assets. This can be easily achieved by sub-tracting from the adjusted purchase price (or total asset value) the esti-mated fair value of the current and tangible assets. An analysis of thecompany’s balance sheet and asset records as of the valuation date re-veals the recorded or carrying value of the assets is $67,500,000, whichconsists of:
Determining Goodwill and Other Intangible Assets in Business 39

Carrying ValueCash $ 1,500,000Marketable securities 4,000,000Accounts receivable 17,000,000Inventory 12,000,000Prepaid expenses 3,000,000Land and building 10,000,000Machinery and equipment 15,000,000Organization costs and
other intangibles 5,000,000Total current and tangible assets $67,500,000
The next step is to adjust recorded values to fair values, including finalaudited amounts if available. In reality, separate valuations may be under-taken of material tangible assets. For example, a machinery and equipmentappraiser may be brought in to independently value the fixed assets if it isdetermined that (a) the fixed assets are material, and (b) the book values donot represent fair value. Similarly, the valued receivables and other currentassets may not be reflected by their carrying value and require adjustmentto fair value. For purposes of this analysis, it is assumed that adjustmentsare required to certain asset accounts. After the adjustments, the fair valuesof the tangible assets are:
Carrying Value Fair ValueCash $ 1,500,000 $ 1,500,000Marketable securities 4,000,000 8,000,000a
Accounts receivable 17,000,000 17,000,000Inventory 12,000,000 12,000,000Prepaid expenses 3,000,000 3,000,000Land and building 10,000,000 22,000,000b
Machinery and equipment 15,000,000 19,000,000c
Organization costs and other intangibles 5,000,000 0d
Total current and tangible assets $67,500,000 $82,500,000
a. Fair value of marketable securities, as marked to market.b. Fair value per real estate appraisal.c. Fair value per machinery and equipment appraisal.d. Written off (see “Valuation of Current Assets” section later in this chapter).
40 Determining Goodwill and Other Intangible Assets in Business
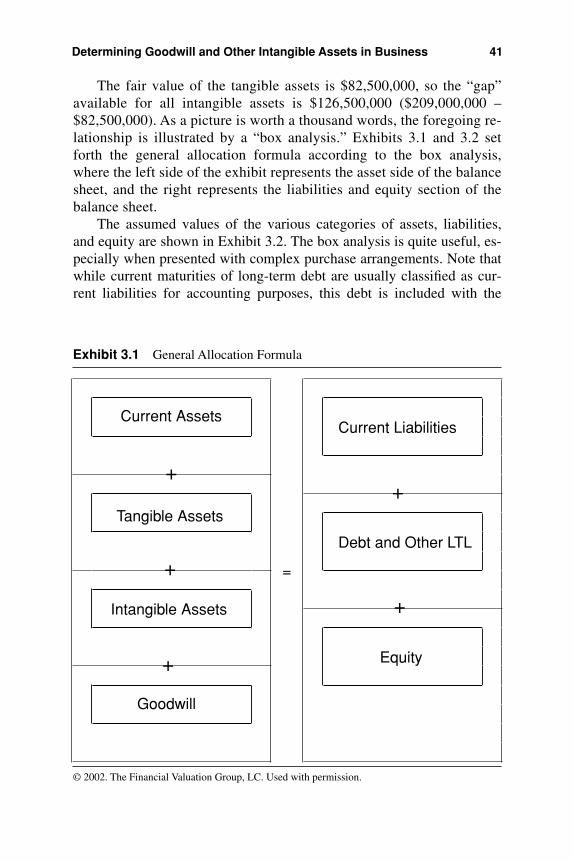
The fair value of the tangible assets is $82,500,000, so the “gap”available for all intangible assets is $126,500,000 ($209,000,000 –$82,500,000). As a picture is worth a thousand words, the foregoing re-lationship is illustrated by a “box analysis.” Exhibits 3.1 and 3.2 setforth the general allocation formula according to the box analysis,where the left side of the exhibit represents the asset side of the balancesheet, and the right represents the liabilities and equity section of thebalance sheet.
The assumed values of the various categories of assets, liabilities,and equity are shown in Exhibit 3.2. The box analysis is quite useful, es-pecially when presented with complex purchase arrangements. Note thatwhile current maturities of long-term debt are usually classified as cur-rent liabilities for accounting purposes, this debt is included with the
Determining Goodwill and Other Intangible Assets in Business 41
Equity
Intangible Assets
Goodwill
Current Liabilities
Debt and Other LTL
Tangible Assets
=
+
+
+
+
+
Current Assets
Exhibit 3.1 General Allocation Formula
© 2002. The Financial Valuation Group, LC. Used with permission.
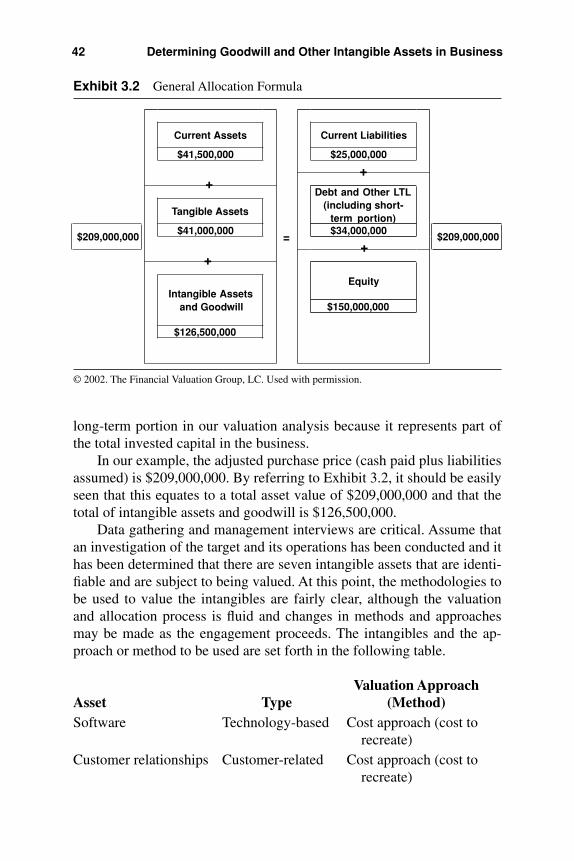
long-term portion in our valuation analysis because it represents part ofthe total invested capital in the business.
In our example, the adjusted purchase price (cash paid plus liabilitiesassumed) is $209,000,000. By referring to Exhibit 3.2, it should be easilyseen that this equates to a total asset value of $209,000,000 and that thetotal of intangible assets and goodwill is $126,500,000.
Data gathering and management interviews are critical. Assume thatan investigation of the target and its operations has been conducted and ithas been determined that there are seven intangible assets that are identi-fiable and are subject to being valued. At this point, the methodologies tobe used to value the intangibles are fairly clear, although the valuationand allocation process is fluid and changes in methods and approachesmay be made as the engagement proceeds. The intangibles and the ap-proach or method to be used are set forth in the following table.
Valuation ApproachAsset Type (Method)Software Technology-based Cost approach (cost to
recreate)Customer relationships Customer-related Cost approach (cost to
recreate)
42 Determining Goodwill and Other Intangible Assets in Business
$41,500,000 $25,000,000
$41,000,000 $34,000,000
$150,000,000
$126,500,000
Intangible Assets and Goodwill
Tangible Assets
$209,000,000
Debt and Other LTL (including short-
term portion)
Equity
=
Current Assets Current Liabilities
$209,000,000
+
+
+
+
Exhibit 3.2 General Allocation Formula
© 2002. The Financial Valuation Group, LC. Used with permission.
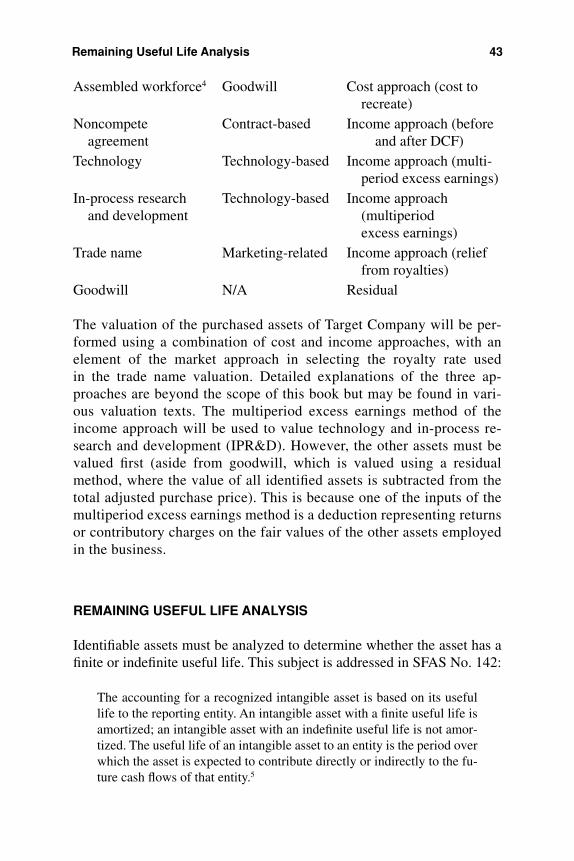
Assembled workforce4 Goodwill Cost approach (cost to recreate)
Noncompete Contract-based Income approach (before agreement and after DCF)
Technology Technology-based Income approach (multi-period excess earnings)
In-process research Technology-based Income approach and development (multiperiod
excess earnings)Trade name Marketing-related Income approach (relief
from royalties)Goodwill N/A Residual
The valuation of the purchased assets of Target Company will be per-formed using a combination of cost and income approaches, with anelement of the market approach in selecting the royalty rate used in the trade name valuation. Detailed explanations of the three ap-proaches are beyond the scope of this book but may be found in vari-ous valuation texts. The multiperiod excess earnings method of theincome approach will be used to value technology and in-process re-search and development (IPR&D). However, the other assets must bevalued first (aside from goodwill, which is valued using a residualmethod, where the value of all identified assets is subtracted from thetotal adjusted purchase price). This is because one of the inputs of themultiperiod excess earnings method is a deduction representing returnsor contributory charges on the fair values of the other assets employedin the business.
REMAINING USEFUL LIFE ANALYSIS
Identifiable assets must be analyzed to determine whether the asset has afinite or indefinite useful life. This subject is addressed in SFAS No. 142:
The accounting for a recognized intangible asset is based on its usefullife to the reporting entity. An intangible asset with a finite useful life isamortized; an intangible asset with an indefinite useful life is not amor-tized. The useful life of an intangible asset to an entity is the period overwhich the asset is expected to contribute directly or indirectly to the fu-ture cash flows of that entity.5
Remaining Useful Life Analysis 43

SFAS No. 142 mentions a number of pertinent factors that should betaken into account:6
• Expected use of the asset• Expected use of similar assets• Legal, regulatory, and contractual provisions that may limit the useful
life or enable renewal or extension• The effects of obsolescence, demand, competition, and other eco-
nomic factors• Required future maintenance expenditures
Analysts also rely on statistically based predictions of future behav-ior by developing survivor curves using tools such as Iowa-type curvesand the Weibull Distribution. The subject of “lifing” is very complexand beyond the scope of this book. There is no shortage of writings onthe topic; for a start, Chapter 11 of Valuing Intangible Assets by RobertF. Reilly and Robert P. Schweihs (New York: McGraw-Hill, 1999) isrecommended.
In the following example, it is assumed that various analyses and tech-niques have been performed to determine the remaining useful lives of theamortizable intangible assets, but those machinations will not be described.
BUSINESS ENTERPRISE VALUE
Our analysis will proceed with the development of a business enterprisevaluation (BEV) using a discounted cash flow (DCF) methodology. Per-forming the BEV using a DCF requires a number of assumptions includ-ing: sales and expense forecasts, working capital requirements, andcapital expenditure requirements. The nature and underlying rationale forthese assumptions will be discussed throughout the chapter.
In this example, the adjusted purchase price comprises invested capi-tal (as previously defined) plus current liabilities. The adjusted purchaseprice is equivalent to current assets plus tangible assets, intangible assets,and goodwill. The value of a business enterprise is equivalent to the valueof the total invested capital of that business. A company’s invested capitalis equivalent to net working capital (determined by deducting the amountof current liabilities from current assets) plus tangible assets, intangibleassets, and goodwill. Again, the box analysis is helpful (see Exhibit 3.3).
Performing a BEV and DCF are important in three major respects.
44 Determining Goodwill and Other Intangible Assets in Business
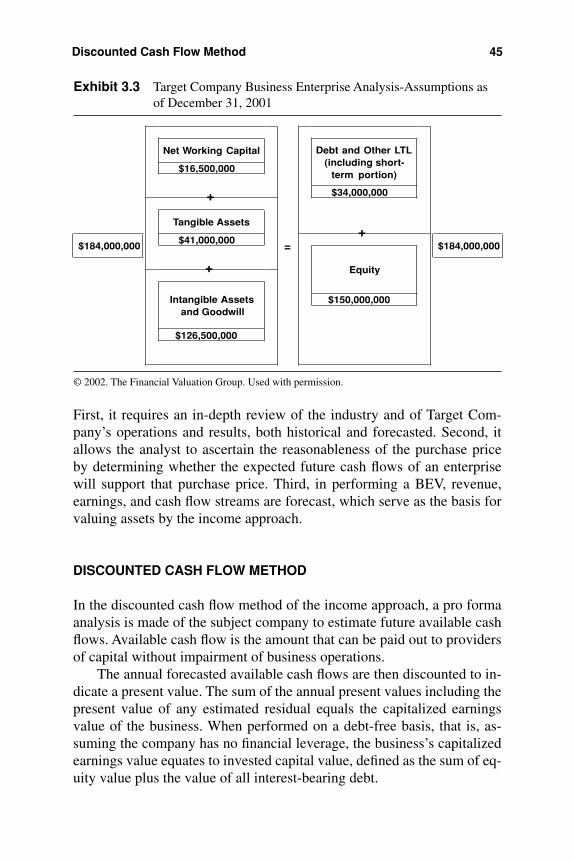
First, it requires an in-depth review of the industry and of Target Com-pany’s operations and results, both historical and forecasted. Second, itallows the analyst to ascertain the reasonableness of the purchase priceby determining whether the expected future cash flows of an enterprisewill support that purchase price. Third, in performing a BEV, revenue,earnings, and cash flow streams are forecast, which serve as the basis forvaluing assets by the income approach.
DISCOUNTED CASH FLOW METHOD
In the discounted cash flow method of the income approach, a pro formaanalysis is made of the subject company to estimate future available cashflows. Available cash flow is the amount that can be paid out to providersof capital without impairment of business operations.
The annual forecasted available cash flows are then discounted to in-dicate a present value. The sum of the annual present values including thepresent value of any estimated residual equals the capitalized earningsvalue of the business. When performed on a debt-free basis, that is, as-suming the company has no financial leverage, the business’s capitalizedearnings value equates to invested capital value, defined as the sum of eq-uity value plus the value of all interest-bearing debt.
Discounted Cash Flow Method 45
$16,500,000
$34,000,000
$41,000,000
$150,000,000
$126,500,000
Net Working Capital
Equity
Debt and Other LTL (including short-
term portion)
$184,000,000 $184,000,000=
Intangible Assets and Goodwill
Tangible Assets
+
+
+
Exhibit 3.3 Target Company Business Enterprise Analysis-Assumptions asof December 31, 2001
© 2002. The Financial Valuation Group. Used with permission.
Assumptions should generally be prepared by the client. The ana-lyst might guide a client to producing a meaningful forecast, but, justas historical financial statements are the responsibility of management,not the auditor, the company should take responsibility for prospectivefinancial information (defined as a forecast of expected future cashflows, or PFI).7 Assumptions were made on the basis of internal com-pany PFI as presented to us. Amounts also forecast are: sales growth,product cost, operating expenses, and depreciation. As shown in Ex-hibit 3.4, principal assumptions utilized in developing the estimates ofcash flow are:
• Sales are forecast to increase from $60,000,000 in 2001 to$69,000,000 in 2002, growth of 15 percent, due to conversions, upgrades, new customers, and price increases. This increase isbased largely on estimated growth in one of its key markets of 20percent. However, the growth rate of the key market is expected todecline after 2003. The 10-year compound annual growth rate is9.96 percent.
• Cost of sales (40 percent of sales in 2002, improving to 39 percentthereafter) and operating expenses (30 percent in 2002, improving to29 percent thereafter) excluding depreciation (tax basis—separatelyforecast using IRS MACRS tables) and amortization are also forecast.The PFI is in line with Target Company’s historical averages and withmanagement’s expectations at the time of the acquisition, and werefelt to represent the best estimate of these costs. These assumptionsare also in line with growth rates and margins expected by similarproducts from similar companies in the marketplace.
• Working capital requirements (debt free) were forecast at 15 percentof sales, based on the company’s historical working capital position,expected needs, and industry benchmarks.
• Capital expenditures are forecast at 1 percent of net sales. This levelof capital expenditures is considered adequate to support future levelsof sales.
• Tax amortization of total intangible asset value is based on Section197 of the Internal Revenue Code, which provides for such amortiza-tion over a 15-year period.8 The amortization acts as a tax shield andis added back to cash flow. Annual amortization is $8,433,000($126,500,000 ÷ 15, rounded). The reader should note that this exam-ple is of an asset purchase. In a stock purchase, the intangible assetsgenerally would not be amortizable for tax purposes.
46 Determining Goodwill and Other Intangible Assets in Business
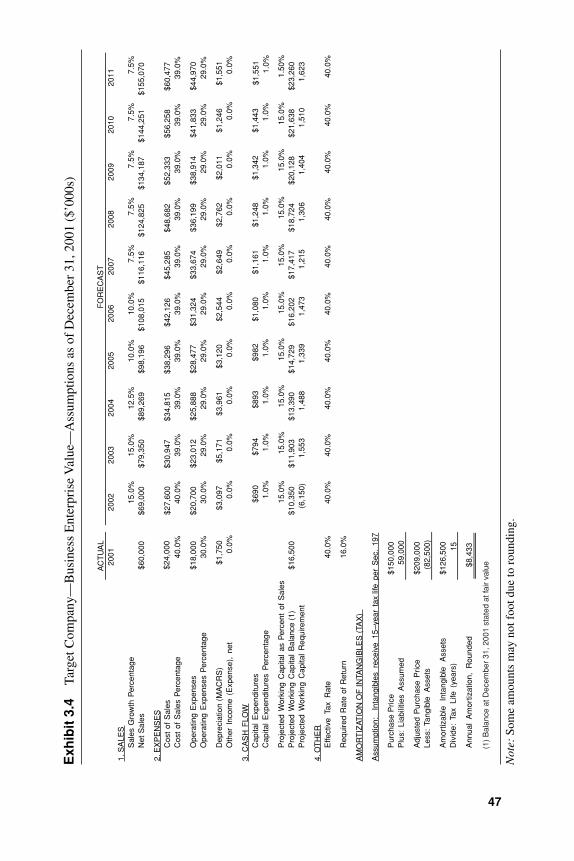
AC
TU
AL
2001
2002
2003
2004
2005
2006
2007
2008
2009
2010
2011
1. S
ALE
SS
ales
Gro
wth
Per
cent
age
15.0
%15
.0%
12.5
%10
.0%
10.0
%7.
5%7.
5%7.
5%7.
5%7.
5%N
et S
ales
$60,
000
$69,
000
$79,
350
$89,
269
$98,
196
$108
,015
$116
,116
$124
,825
$134
,187
$144
,251
$155
,070
2. E
XP
EN
SE
SC
ost
of S
ales
$24,
000
$27,
600
$30,
947
$34,
815
$38,
296
$42,
126
$45,
285
$48,
682
$52,
333
$56,
258
$60,
477
Cos
t of
Sal
es P
erce
ntag
e40
.0%
40.0
%39
.0%
39.0
%39
.0%
39.0
%39
.0%
39.0
%39
.0%
39.0
%39
.0%
Ope
ratin
g E
xpen
ses
$18,
000
$20,
700
$23,
012
$25,
888
$28,
477
$31,
324
$33,
674
$36,
199
$38,
914
$41,
833
$44,
970
Ope
ratin
g E
xpen
ses
Per
cent
age
30.0
%30
.0%
29.0
%29
.0%
29.0
%29
.0%
29.0
%29
.0%
29.0
%29
.0%
29.0
%
Dep
reci
atio
n (M
AC
RS
)$1
,750
$3,0
97$5
,171
$3,9
61$3
,120
$2,5
44$2
,649
$2,7
62$2
,011
$1,2
46$1
,551
Oth
er I
ncom
e (E
xpen
se),
net
0.0%
0.0%
0.0%
0.0%
0.0%
0.0%
0.0%
0.0%
0.0%
0.0%
0.0%
3. C
AS
H F
LOW
Cap
ital
Exp
endi
ture
s$6
90$7
94$8
93$9
82$1
,080
$1,1
61$1
,248
$1,3
42$1
,443
$1,5
51C
apita
l E
xpen
ditu
res
Per
cent
age
1.0%
1.0%
1.0%
1.0%
1.0%
1.0%
1.0%
1.0%
1.0%
1.0%
Pro
ject
ed W
orki
ng C
apita
l as
Per
cent
of
Sal
es15
.0%
15.0
%15
.0%
15.0
%15
.0%
15.0
%15
.0%
15.0
%
15.
0%1.
50%
Pro
ject
ed W
orki
ng C
apita
l B
alan
ce (
1)$1
6,50
0$1
0,35
0$1
1,90
3$1
3,39
0$1
4,72
9$1
6,20
2$1
7,41
7$1
8,72
4$2
0,12
8$2
1,63
8$2
3,26
0P
roje
cted
Wor
king
Cap
ital
Req
uire
men
t(6
,150
)1,
553
1,48
81,
339
1,47
31,
215
1,30
61,
404
1,51
01,
623
4. O
TH
ER
Effe
ctiv
e Ta
x R
ate
40.0
%40
.0%
40.0
%40
.0%
40.0
%40
.0%
40.0
%40
.0%
40.0
%40
.0%
40.0
%
Req
uire
d R
ate
of R
etur
n16
.0%
AM
OR
TIZ
ATIO
N O
F IN
TAN
GIB
LES
(TA
X)
Ass
umpt
ion:
In
tang
ible
s re
ceiv
e 15
–ye
ar t
ax li
fe p
er S
ec.
197
Pur
chas
e P
rice
$150
,000
Plu
s: L
iabi
litie
s A
ssum
ed59
,000
Adj
uste
d P
urch
ase
Pric
e$2
09,0
00Le
ss:
Tang
ible
Ass
ets
(82,
500)
Am
ortiz
able
In
tang
ible
A
sset
s$1
26,5
00D
ivid
e: T
ax L
ife (
year
s)15
Ann
ual
Am
ortiz
atio
n, R
ound
ed$8
,433
FO
RE
CA
ST
(1)
Bal
ance
at D
ecem
ber
31, 2
001
stat
ed a
t fai
r va
lue
Exh
ibit
3.4
Targ
et C
ompa
ny—
Bus
ines
s E
nter
pris
e V
alue
—A
ssum
ptio
ns a
s of
Dec
embe
r 31
, 200
1 ($
’000
s)
Not
e:So
me
amou
nts
may
not
foo
t due
to r
ound
ing.
47
Other assumptions:
Required rate of return (discount rate)* 16.00%Residual perpetual growth rate 5.00%Tax rate 40.00%*Discussed more fully in the next section, entitled “Discount Rate.”
Assumptions are summarized in Exhibit 3.4, which presents the PFI for aperiod of 10 years.
Cash flows in year 11 are increased by the residual growth rate and then capitalized into perpetuity by dividing by the capitalizationrate, defined as the difference between the discount rate and the resid-ual growth rate. This residual value was then discounted to presentvalue to provide the net present value of the residual cash flow. Theresidual cash flow represents the anticipated cash flow for years 11 toperpetuity.
Since the Section 197 amortization has a finite amortization periodof 15 years, the residual calculation must be adjusted so the amortizationis not capitalized into perpetuity. First, the tax benefit of the amortiza-tion of $3,373,000 (amortization of $8,433,000 multiplied by the tax rateof 40 percent, rounded) is added back to year 11 cash flow. Thus, cashflow to be capitalized ignores any amortization benefit after year 10.Then, the present value of the remaining five years of tax amortization isadded to the residual calculation. This amount is $2,697,000. After theadjustments, the amortization of intangibles reflects a benefit period of15 years.
The present value of the net cash flows, plus the present value of theresidual, provides the total capitalized cash flow. The BEV is presented inExhibit 3.5.
DISCOUNT RATE
The appropriate rate of return for valuing the enterprise is the weightedaverage cost of capital, the weighted average of the return on equity capi-tal, and the return on debt capital. The weights represent percentages ofdebt to total capital and equity to total capital. The rate of return on debtcapital is adjusted to reflect the fact that interest payments are tax de-ductible to the corporation.
48 Determining Goodwill and Other Intangible Assets in Business
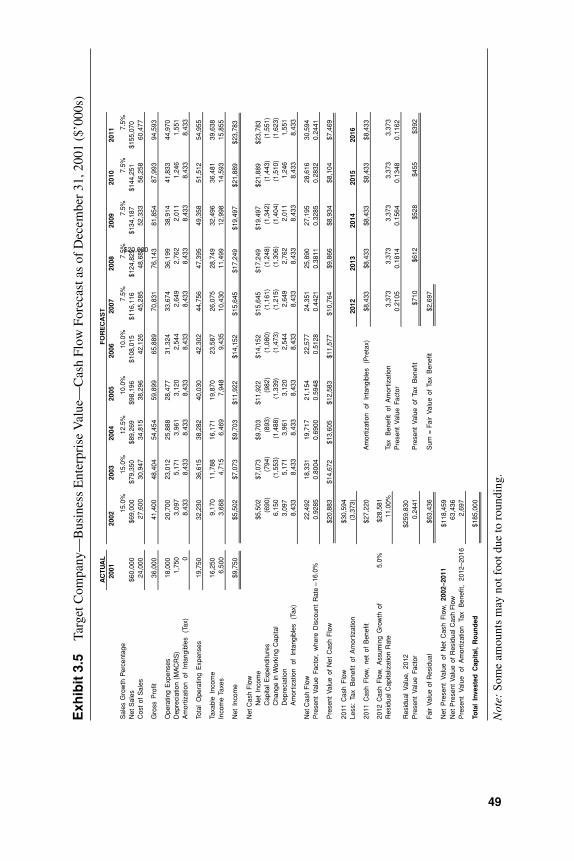
AC
TU
AL
2001
2002
2003
2004
2005
2006
2007
2008
2009
2010
2011
Sal
es G
row
th P
erce
ntag
e15
.0%
15.0
%12
.5%
10.0
%10
.0%
7.5%
7.5%
7.5%
7.5%
7.5%
Net
Sal
es$6
9,00
0$7
9,35
0$8
9,26
9$9
8,19
6$1
08,0
15$1
16,1
16$1
24,8
25$1
34,1
87$1
44,2
51$1
55,0
70C
ost
of S
ales
24,0
00
27
,600
30,9
47
34
,815
38,2
96
42
,126
45,2
85
48,6
82
52,3
33
56,2
58
60,4
77
Gro
ss P
rofit
36,0
0041
,400
48,4
04
54
,454
59,8
99
65
,889
70,8
31
76,1
43
81,8
54
87,9
93
94,5
93
Ope
ratin
g E
xpen
ses
18,0
00
20
,700
23,0
12
25
,888
28,4
77
31
,324
33,6
74
36,1
99
38,9
14
41,8
33
44,9
70D
epre
ciat
ion
(MA
CR
S)
1,75
0
3,09
7
5,17
1
3,96
1
3,12
0
2,54
4
2,64
9
2,
762
2,01
1
1,
246
1,55
1A
mor
tizat
ion
of I
ntan
gibl
es
(Tax
)0
8,43
3
8,43
3
8,43
3
8,43
3
8,43
3
8,43
3
8,
433
8,43
3
8,
433
8,43
3
Tota
l O
pera
ting
Exp
ense
s19
,750
32,2
30
36
,615
38,2
82
40
,030
42,3
02
44
,756
47
,395
49
,358
51
,512
54
,955
Taxa
ble
Inco
me
16,2
50
9,
170
11
,788
16,1
71
19
,870
23,5
87
26
,075
28,7
49
32,4
96
36,4
8139
,638
Inco
me
Taxe
s6,
500
3,
668
4,
715
6,
469
7,
948
9,
435
10
,430
11
,499
12
,998
14
,593
15
,855
Net
Inc
ome
$9,7
50$5
,502
$7,0
73$9
,703
$11,
922
$14,
152
$15,
645
$17,
249
$19,
497
$21,
889
$23,
783
Net
Cas
h F
low
Net
Inc
ome
$5,5
02$7
,073
$9,7
03$1
1,92
2$1
4,15
2$1
5,64
5$1
7,24
9$1
9,49
7$2
1,88
9$2
3,78
3C
apita
l E
xpen
ditu
res
(690
)(7
94)
(893
)(9
82)
(1,0
80)
(1,1
61)
(1,2
48)
(1,3
42)
(1,4
43)
(1,5
51)
Cha
nge
in W
orki
ng C
apita
l6,
150
(1,5
53)
(1,4
88)
(1,3
39)
(1,4
73)
(1,2
15)
(1,3
06)
(1,4
04)
(1,5
10)
(1,6
23)
Dep
reci
atio
n3,
097
5,17
13,
961
3,12
02,
544
2,64
92,
762
2,01
11,
246
1,55
1A
mor
tizat
ion
of I
ntan
gibl
es
(Tax
)8,
433
8,43
38,
433
8,43
38,
433
8,43
38,
433
8,43
38,
433
8,43
3
Net
Cas
h F
low
22,4
92
18
,331
19,7
17
21
,154
22,5
77
24
,351
25
,890
27
,195
28
,616
30
,594
Pre
sent
Val
ue F
acto
r, w
here
Dis
coun
t R
ate
–16
.0%
0.92
850.
8004
0.69
000.
5948
0.51
280.
4421
0.38
110.
3285
0.28
320.
2441
Pre
sent
Val
ue o
f N
et C
ash
Flo
w$2
0,88
3$1
4,67
2$1
3,60
5$1
2,58
3$1
1,57
7$1
0,76
4$9
,866
$8,9
34$8
,104
$7,4
69
2011
Cas
h F
low
$30,
594
Less
: Ta
x B
enef
it of
Am
ortiz
atio
n(3
,373
)
2012
2013
2014
2015
2016
2011
Cas
h F
low
, ne
t of
Ben
efit
$27,
220
Am
ortiz
atio
n of
Int
angi
bles
(P
reta
x)$8
,433
$8,4
33$8
,433
$8,4
33$8
,433
2012
Cas
h F
low
, A
ssum
ing
Gro
wth
of
5.0%
$28,
581
Res
idua
l Cap
italiz
atio
n R
ate
11.0
0%Ta
x B
enef
it of
Am
ortiz
atio
n3,
373
3,37
3
3,
373
3,37
3
3,
373
Pre
sent
Val
ue F
acto
r0.
2105
0.18
140.
1564
0.13
480.
1162
Res
idua
l V
alue
, 20
12$2
59,8
30P
rese
nt V
alue
Fac
tor
0.24
41P
rese
nt V
alue
of
Tax
Ben
efit
$710
$612
$528
$455
$392
Fair
Val
ue o
f Res
idua
l$6
3,43
6S
um =
Fai
r V
alue
of
Tax
Ben
efit
$2,6
97
Net
Pre
sent
Val
ue o
f N
et C
ash
Flo
w,
2002
–201
1$1
18,4
59N
et P
rese
nt V
alue
of
Res
idua
l Cas
h F
low
63,4
36P
rese
nt V
alue
of
Am
ortiz
atio
n Ta
x B
enef
it,
2012
–201
62,
697
Tota
l In
vest
ed C
apit
al,
Ro
un
ded
$185
,000
FO
RE
CA
ST
$60,
000
$20,000
Exh
ibit
3.5
Targ
et C
ompa
ny—
Bus
ines
s E
nter
pris
e V
alue
—C
ash
Flow
For
ecas
t as
of D
ecem
ber
31, 2
001
($’0
00s)
Not
e:So
me
amou
nts
may
not
foo
t due
to r
ound
ing.
49

The weighted average cost of capital is expressed in the followingformula:
WACC = (ke × We) + (kp × Wp) + (kd(pt)[1 – t] × Wd)
Where: WACC = Weighted average cost of capitalke = Cost of common equity capital
We = Percentage of common equity in the capitalstructure, at market value
kp = Cost of preferred equityWp = Percentage of preferred equity in the capital
structure, at market valuekd(pt) = Cost of debt (pretax)
t = Tax rateWd = Percentage of debt in the capital structure, at
market value9
The weighted average cost of capital represents the average rate of returninvestors require to induce them to supply all forms of long-term capital(debt and equity) to a company.
It is beyond the scope of this book to provide a detailed explanationof rates of return, and the reader is encouraged to seek reference books orother sources that provide detailed explanations of rates of return.10 As-sume an equity discount rate (which in a corporate acquisition is oftencalculated using the Capital Asset Pricing Model) of 20 percent and apretax cost of debt of 6.50 percent. Further, assume a capital structure of25 percent debt and 75 percent equity. Theoretically, an “optimal” capitalstructure should be used to estimate a company’s WACC in the case of anacquisition. Analysts typically rely on the capital structures of publiccompanies as a proxy for “optimal.” A target capital structure of approxi-mately 25 percent debt and 75 percent equity was estimated for TargetCompany, based on a review of publicly traded companies. Target Com-pany has no preferred equity. Substituting these values into the WACCformula described previously provides the following:
WACC = (20.00% × 75.00%) + (6.50%[1–40.00%] × 25.00%)= (15.00%) + (3.90% × 25.00%)= 15.00% + 0.97%= 15.97%
Rounded to 16%
Applying the Cost of Capital to cash flows estimated earlier indi-cates the fair value of the invested capital of the target company was
50 Determining Goodwill and Other Intangible Assets in Business
$185,000,000 on the valuation date (see Exhibit 3.5). Actual investedcapital is $184,000,000 (cash paid plus interest-bearing debt assumed,including current maturities), so we are confident that the discountedcash flow model reasonably reflects the value of the business and thatthe discount rate is reasonable as well.
VALUATION OF CURRENT ASSETS
It is very important that the valuation analyst and the auditor have openlines of communication. Certain financial and other current assets are theprovince of the auditor and the purchase price allocation must rely in parton audit conclusions for certain assets, such as cash and receivables.Marketable securities must be marked to market, often by simply obtain-ing brokerage statements. Previously recognized intangibles that repre-sent capitalized historic expenditures, such as organization costs, aretypically written off. The actual cash flow associated with these assets oc-curred in the past and these assets typically cannot be separated or soldapart from the acquired entity as required under SFAS No. 141. Anyother previously recorded intangible value is subsumed in the currentpurchase price allocation and is to be reallocated.
VALUATION OF TANGIBLE ASSETS
Few valuation analysts have the experience and training to operate out-side their discipline to render valuation opinions on fixed assets. If mater-ial and/or complicated, the real estate and personal property must beindependently appraised. In this example, it is assumed that a real estateappraiser determined the fair value of the land and improvements to be$22,000,000 and a personal property appraiser determined the value ofthe machinery and equipment to be $19,000,000.
VALUATION OF INTANGIBLE ASSETS
Discount Rates
For each asset valued in the following sections a discount rate must be se-lected. For assets valued using the income approach, the discount rate isused to reduce future benefit streams to present value. For those assets
Valuation of Intangible Assets 51
and for assets valued using the cost approach, the discount rate is an im-portant input for calculating the amortization benefit (see “DiscountRate” section earlier in this chapter). That rate was employed in approxi-mating the purchase price in the BEV and also for those assets judged tobe about as risky overall as the business (trade name and noncompeteagreement). Discount rates for the other intangible assets were selectedbased on our judgment of relative risk and approximate rates of returnsinvestors in the subject assets might require. For example, the IPR&D isincomplete and commercially unproven. Competitors likely are develop-ing their own technologies, that will compete. Thus, the rate of return onthis asset is substantially higher than the WACC.
The rates of return on the other intangibles are similarly selected withreference to the WACC. The rates for the intangible assets are:
Software 18%Customer base 18%Assembled workforce 16%Trade name 16%Noncompete agreement 16%Existing technology 18%In-process research and development 25%
Software
Target Company employs a sophisticated array of computer programs tomanage its product and production processes (Exhibit 3.6). All productsoftware was developed in-house and is not commercially available. Acost approach was applied to value the software, as this asset is a support-ing or contributory asset with no directly attributable revenue or incomestreams. However, if a revenue or income stream could be attributed tothis asset, and if the software had salable commercial applications, an in-come approach would have been considered, as that approach is oftenused in the valuation of software.
The company’s software system comprises 20 modules, each madeup of a number of programs written in C++ programming language. Toapply this form of the cost approach, it is necessary to obtain a reliableindication of the cost to recreate the program. A line count (a manage-ment report detailing the number of lines of code per program and/ormodule) was obtained.
52 Determining Goodwill and Other Intangible Assets in Business

Next, it is necessary to determine the productivity with which the hy-pothetical recreation effort would take place. Here, management assesseda productivity rating of 1 to 3, noting that software rated 1 could be pro-grammed at four lines of code per hour; software rated at 2 could be pro-grammed at three lines of code per hour; and software rated 3, the mostcomplex and difficult, could be programmed at two lines of code perhour. The coding rates encompass completely debugged program state-ments including requirements definition, systems design, debugging anddocumentation, testing, and so forth. In performing this purchase price al-location, it was fortunate that management had maintained detailedrecords of programmer productivity and supplied their metrics for suchdevelopment activity.
By dividing the lines of code for each module by the coding rate, thenumber of hours to recreate was developed, totaling 112,507 hours forthe entire system. The sum of hours was then multiplied by the blendedhourly rate of $119 per hour.
In estimating the hourly rate, it was hypothesized that if the softwarewere to be recreated today, a project team of 10 individuals would have tobe assembled. The team would include one project manager, two systemsanalysts, one technical writer, four programmers, and two support per-sons. Using their fully burdened rates, the weighted average rate was cal-culated for the team at $119 per hour. These rates include employeebenefits, facilities and overhead charges, and approximate the rates thatwould be charged by a software consulting firm.
Reproduction cost of the software system was determined by multi-plying the total number of hours to recreate by the blended hourly rate.Reproduction cost is defined as:
. . . the estimated cost to construct, at current prices as of the date of theanalysis, an exact duplicate or replica of the subject intangible asset, us-ing the same materials, production standards, design, layout, and qual-ity of workmanship as the subject intangible asset. The reproductionintangible asset will include the same inadequacies, superadequacies,and obsolescence as the subject intangible asset.11
In this example, reproduction cost totals $13,388,333. Since reproduc-tion cost equates to brand-new software, an obsolescence factor is ap-plied to recognize the fact that the acquired software is not brand-new.Rather, it may have redundant or extraneous code and likely has beenpatched over the years and contains other inefficiencies that brand-newsoftware presumably would not have. For this application, after dis-
Valuation of Intangible Assets 53
cussing the capabilities of the software with management, it was esti-mated that an obsolescence factor of 25 percent was warranted, reducingthe reproduction cost to its replacement cost of $10,041,250.
Replacement cost is defined as:
. . . the estimated cost to construct, at current prices as of the date of theanalysis, an intangible asset with equivalent utility to the subject intan-gible, using modern materials, production standards, design, layout, andquality of workmanship. The replacement intangible asset will excludeall curable inadequacies, superadequacies, and obsolescence that arepresent in the subject intangible asset.12
Replacement cost is then adjusted for taxes to recognize the deductibilityof such expenses. The after-tax value is $6,024,750.
Amortization Benefit
Added to the after-tax value is an amortization benefit, which reflects theadditional value accruing to the asset brought about by the ability todeduct the amortization of the asset over its 15-year tax life. The amortiza-tion benefit is an element of the fair value of all intangible assets that aredeductible for tax purposes.
The formula for the amortization benefit is:
AB = PVCF × [n/(n – {[PV(Dr,n,–1) × (1 + Dr)^0.5] × T})–1]Where:
AB = Amortization benefitPVCF = Present value of cash flows from
the assetn = 15-year amortization period
Dr = Asset specific discount ratePV(Dr,n,–1) × (1 + Dr)^0.5 = Present value of an annuity
of $1 over 15 years, at thediscount rate
T = Tax rate
Based on the cost approach, and after adjusting for taxes and amortiza-tion benefit, it was concluded that the fair value of the software as of De-cember 31, 2001 was $7,070,000 (rounded) (Exhibit 3.6). The remaininguseful life is four years.
54 Determining Goodwill and Other Intangible Assets in Business

Valuation of Intangible Assets 55
LINES OF HOURS TOIN PLACE CODE RATING (1) RATE (1) RECREATEModule 1 26,400 2 3.0 8,800Module 2 32,600 3 2.0 16,300Module 3 46,000 1 4.0 11,500Module 4 8,480 3 2.0 4,240Module 5 12,000 3 2.0 6,000Module 6 12,500 2 3.0 4,167Module 7 2,000 2 3.0 667Module 8 32,000 2 3.0 10,667Module 9 3,000 2 3.0 1,000Module 10 3,000 2 3.0 1,000Module 11 3,000 2 3.0 1,000Module 12 13,000 2 3.0 4,333Module 13 6,000 2 3.0 2,000Module 14 10,000 2 3.0 3,333Module 15 5,000 2 3.0 1,667Module 16 6,000 2 3.0 2,000Module 17 5,000 3 2.0 2,500Module 18 8,000 1 4.0 2,000Module 19 7,000 2 3.0 2,333Module 20 54,000 3 2.0 27,000
Total Number of Lines 294,980Total Number of Hours to Recreate 112,507Times: Blended Hourly Rate (see below) $119
Reproduction Cost $13,388,333Less: Obsolescence (2) 25.0% (3,347,083)
Replacement Cost $10,041,250Less: Taxes @ 40.0% (4,016,500)
After Tax Value Before Amortization Benefit $6,024,750
Amortization BenefitDiscount Rate 18.0%Tax Rate 40.0%Tax Amortization Period 1 5
Amortization Benefit 1,042,321
Fair Value of Software, Rounded $7,070,000
remaining economic lives of system.
SOFTWARE DEVELOPMENT COSTS - ESTIMATED PROJECT TEAMBURDENED
FUNCTION NUMBER HOURLY RATEProject Manager 1 $200.00Systems Analyst 2 150.00Technical Writer 1 125.00Programmer 4 115.00Support 2 50.00
Blended Hourly Rate, Rounded $119.00
(1) Lines of code per hour, based on productivity assessment for average module of programming.(2) Estimate based on number of lines of redundant/extraneous code and effective age and
All software was developed internally by Company for its own use. Rights to software were transferred at acquisition.
The software is written in C++ programming language.
Valuation is based on cost to replace less obsolescence. Costs are based on internally developed Company metrics for software development productivity.
Source: Leonard Riles, Director of Product Development
PRODUCTIVITY
Exhibit 3.6 Target Company—Valuation of Acquired Software as ofDecember 31, 2001
Note: Some amounts may not foot due to rounding.

Customer Base
The company sells virtually all of its products through a network ofdistributors and large and midsize retail outlets. Many of these cus-tomers have done business with the company for a number of years ofuninterrupted service. As part of the acquisition of Target Company,the buyer acquired this customer base and avoided the cost of havingto build a customer base through years of expenditures. One measureof the value of the customer base is represented by the sales and mar-keting costs avoided, and the cost approach was selected as the valua-tion approach to value this asset, as shown in Exhibit 3.7. In manycases, the valuation of a customer base is performed using a form ofincome approach known as the multiperiod excess earnings method.This method is generally reserved for the intangibles with the most direct relationship to the revenue and cash flow streams. In this company, revenues are driven primarily by the technology, both exist-ing and in-process, and the multiperiod excess earnings approach wasused to value those assets.
Valuation of a Customer Base: Cost versus Income
Valuation of a customer base using the cost approach requires the iden-tification of the selling costs associated with the generation of new cus-tomers. In this example, management indicated that the split in sellingcosts was roughly equivalent to the revenue split between new and ex-isting customers. Thus, the valuation is based on that split. Dependingon the nature of the business, this split between new and existing cus-tomers may vary greatly. Thus, the valuation analyst will need to ap-propriately identify the costs associated with generating the new cus-tomers. This is probably most easily done based on an allocation of thesales team’s time, such as 40 percent spent on finding new customers,60 percent to handle existing ones. Or, there may be certain sales ormarketing people or departments that are devoted entirely to servicingexisting accounts, while others spend all of their time finding new ones.In such cases, the costs can be broken out on a departmental or individ-ual level. For many smaller businesses, top executives also spend alarge amount of time in the generation of new customers, so these costsmust also be considered in the analysis.
Use of the cost approach also assumes that the customers and sell-ing effort required to obtain them are all relatively equivalent. If thecompany has a few customers that make up the majority of its business,then the cost approach may not be appropriate to determine the value ofthe customer base.
56 Determining Goodwill and Other Intangible Assets in Business
It should be noted that the income approach is often recommendedfor valuing a customer base. For many consumer products and “oldeconomy” businesses, the customer relationship may have much highervalue than the technology associated with the products being sold, sincethese products are often a commodity or near commodity that may beeasily substituted with products from another vendor. The customer re-lationship may allow the sale of multiple products and services throughthe same sales channels. An income approach may be more appropriatein these cases.
To estimate the replacement cost of the customer base, total sellingcosts for the years ended December 31, 1999 to December 31, 2001 werecalculated, based on internally prepared financial statements and sales de-partment detail. In each year, the percentage of time and thus expensesfrom prospecting for new customers was determined. This percentagewas applied to the company’s total selling costs for each year to deter-mine total new customer selling costs. These expenses were $123,246 in2001, $119,938 in 2000, and $216,221 in 1999, for a total of $459,405 forthe three years, during which 13 new customers were obtained. The totalafter-tax selling costs were $275,643, or $21,203 per customer, deter-mined by dividing after-tax selling costs by the 13 new customers ob-tained during the period. Multiplying the replacement cost per newcustomer times the total of 261 customers in the acquired customer baseprovides a replacement cost of the customer base of $5,533,983. No ob-solescence is recognized for this asset. The amortization benefit is$957,415. Thus, the fair value of the customer base as of December 31,2001 was $6,490,000 (rounded) (Exhibit 3.7). The remaining useful lifeis five years.
Assembled Workforce
The buyer of Target Company obtained an assembled and trained work-force. Considerable expenditures for recruiting, selecting, and trainingwould be required to replace these employees with individuals of compa-rable skills and expertise. By acquiring fully trained personnel, the buyeravoided the expenditures associated with hiring and training equivalentpersonnel. The value of the assembled workforce is represented by theassemblage cost avoided. Therefore, the cost approach is the most applic-able valuation approach to value this asset. Using this approach, the costsassociated with employee recruitment, selection, and training provide themeasurement of value.
Valuation of Intangible Assets 57
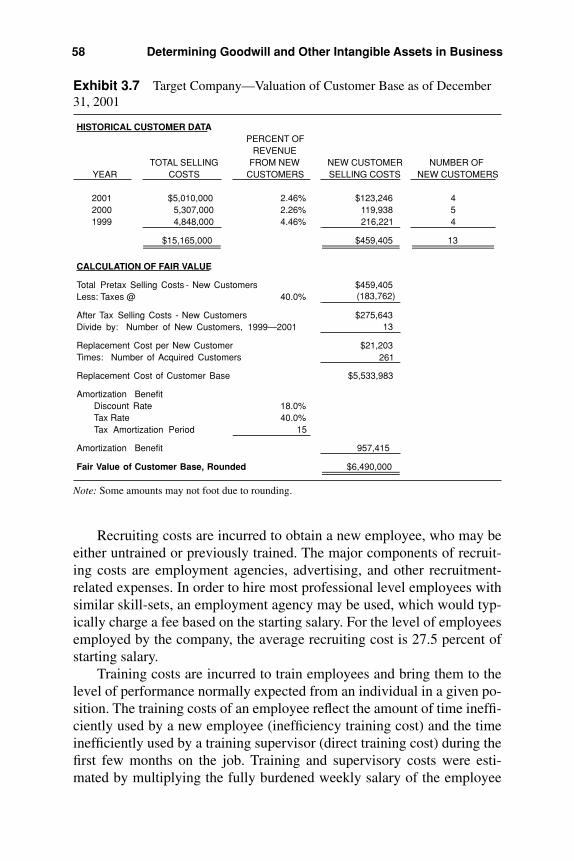
Recruiting costs are incurred to obtain a new employee, who may beeither untrained or previously trained. The major components of recruit-ing costs are employment agencies, advertising, and other recruitment-related expenses. In order to hire most professional level employees withsimilar skill-sets, an employment agency may be used, which would typ-ically charge a fee based on the starting salary. For the level of employeesemployed by the company, the average recruiting cost is 27.5 percent ofstarting salary.
Training costs are incurred to train employees and bring them to thelevel of performance normally expected from an individual in a given po-sition. The training costs of an employee reflect the amount of time ineffi-ciently used by a new employee (inefficiency training cost) and the timeinefficiently used by a training supervisor (direct training cost) during thefirst few months on the job. Training and supervisory costs were esti-mated by multiplying the fully burdened weekly salary of the employee
58 Determining Goodwill and Other Intangible Assets in Business
HISTORICAL CUSTOMER DATAPERCENT OF
REVENUETOTAL SELLING FROM NEW NEW CUSTOMER NUMBER OF
YEAR COSTS CUSTOMERS SELLING COSTS NEW CUSTOMERS
2001 $5,010,000 2.46% $123,246 42000 5,307,000 2.26% 119,938 51999 4,848,000 4.46% 216,221 4
$15,165,000 $459,405 13
CALCULATION OF FAIR VALUE
Total Pretax Selling Costs - New Customers $459,405Less: Taxes @ 40.0% (183,762)
After Tax Selling Costs - New Customers $275,643Divide by: Number of New Customers, 1999—2001 13
Replacement Cost per New Customer $21,203Times: Number of Acquired Customers 261
Replacement Cost of Customer Base $5,533,983
Amortization BenefitDiscount Rate 18.0%Tax Rate 40.0%Tax Amortization Period 15
Amortization Benefit 957,415
Fair Value of Customer Base, Rounded $6,490,000
Exhibit 3.7 Target Company—Valuation of Customer Base as of December31, 2001
Note: Some amounts may not foot due to rounding.
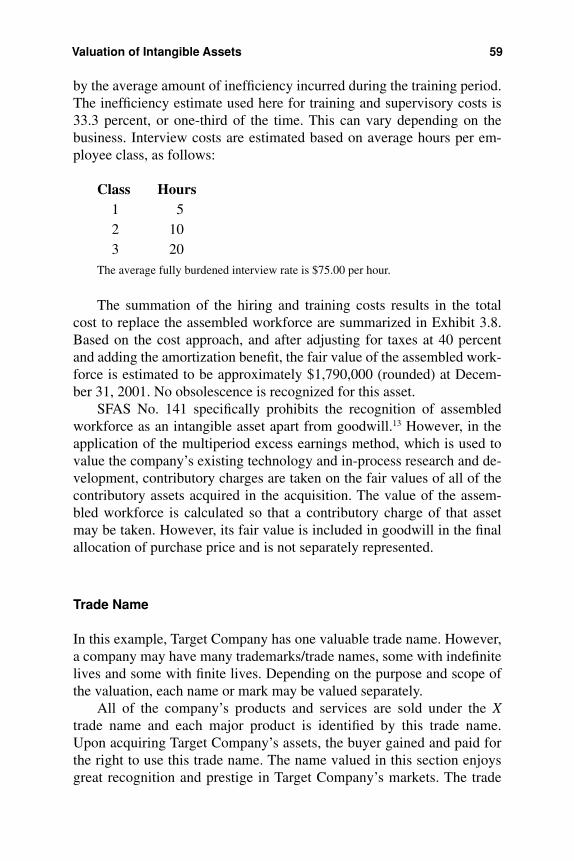
by the average amount of inefficiency incurred during the training period.The inefficiency estimate used here for training and supervisory costs is33.3 percent, or one-third of the time. This can vary depending on thebusiness. Interview costs are estimated based on average hours per em-ployee class, as follows:
Class Hours1 52 103 20
The average fully burdened interview rate is $75.00 per hour.
The summation of the hiring and training costs results in the totalcost to replace the assembled workforce are summarized in Exhibit 3.8.Based on the cost approach, and after adjusting for taxes at 40 percentand adding the amortization benefit, the fair value of the assembled work-force is estimated to be approximately $1,790,000 (rounded) at Decem-ber 31, 2001. No obsolescence is recognized for this asset.
SFAS No. 141 specifically prohibits the recognition of assembledworkforce as an intangible asset apart from goodwill.13 However, in theapplication of the multiperiod excess earnings method, which is used tovalue the company’s existing technology and in-process research and de-velopment, contributory charges are taken on the fair values of all of thecontributory assets acquired in the acquisition. The value of the assem-bled workforce is calculated so that a contributory charge of that assetmay be taken. However, its fair value is included in goodwill in the finalallocation of purchase price and is not separately represented.
Trade Name
In this example, Target Company has one valuable trade name. However,a company may have many trademarks/trade names, some with indefinitelives and some with finite lives. Depending on the purpose and scope ofthe valuation, each name or mark may be valued separately.
All of the company’s products and services are sold under the Xtrade name and each major product is identified by this trade name.Upon acquiring Target Company’s assets, the buyer gained and paid forthe right to use this trade name. The name valued in this section enjoysgreat recognition and prestige in Target Company’s markets. The trade
Valuation of Intangible Assets 59
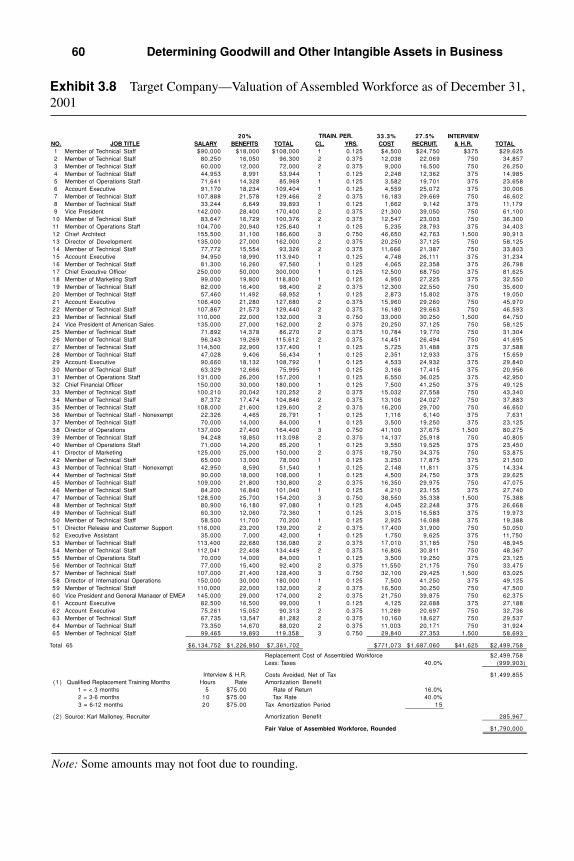
60 Determining Goodwill and Other Intangible Assets in Business
20% 33.3% 27.5% INTERVIEWNO. JOB TITLE SALARY BENEFITS TOTAL CL. YRS. COST RECRUIT. & H.R. TOTAL1 Member of Technical Staff $90,000 $18,000 $108,000 1 0.125 $4,500 $24,750 $375 $29,6252 Member of Technical Staff 80,250 16,050 96,300 2 0.375 12,038 22,069 750 34,8573 Member of Technical Staff 60,000 12,000 72,000 2 0.375 9,000 16,500 750 26,2504 Member of Technical Staff 44,953 8,991 53,944 1 0.125 2,248 12,362 375 14,9855 Member of Operations Staff 71,641 14,328 85,969 1 0.125 3,582 19,701 375 23,6586 Account Executive 91,170 18,234 109,404 1 0.125 4,559 25,072 375 30,0067 Member of Technical Staff 107,888 21,578 129,466 2 0.375 16,183 29,669 750 46,6028 Member of Technical Staff 33,244 6,649 39,893 1 0.125 1,662 9,142 375 11,1799 Vice President 142,000 28,400 170,400 2 0.375 21,300 39,050 750 61,100
10 Member of Technical Staff 83,647 16,729 100,376 2 0.375 12,547 23,003 750 36,30011 Member of Operations Staff 104,700 20,940 125,640 1 0.125 5,235 28,793 375 34,40312 Chief Architect 155,500 31,100 186,600 3 0.750 46,650 42,763 1,500 90,91313 Director of Development 135,000 27,000 162,000 2 0.375 20,250 37,125 750 58,12514 Member of Technical Staff 77,772 15,554 93,326 2 0.375 11,666 21,387 750 33,80315 Account Executive 94,950 18,990 113,940 1 0.125 4,748 26,111 375 31,23416 Member of Technical Staff 81,300 16,260 97,560 1 0.125 4,065 22,358 375 26,79817 Chief Executive Officer 250,000 50,000 300,000 1 0.125 12,500 68,750 375 81,62518 Member Marketing Staff 99,000 19,800 118,800 1 0.125 4,950 27,225 375 32,55019 Member of Technical Staff 82,000 16,400 98,400 2 0.375 12,300 22,550 750 35,60020 Member of Technical Staff 57,460 11,492 68,952 1 0.125 2,873 15,802 375 19,05021 Account Executive 106,400 21,280 127,680 2 0.375 15,960 29,260 750 45,97022 Member of Technical Staff 107,867 21,573 129,440 2 0.375 16,180 29,663 750 46,59323 Member of Technical Staff 110,000 22,000 132,000 3 0.750 33,000 30,250 1,500 64,75024 Vice President of American Sales 135,000 27,000 162,000 2 0.375 20,250 37,125 750 58,12525 Member of Technical Staff 71,892 14,378 86,270 2 0.375 10,784 19,770 750 31,30426 Member of Technical Staff 96,343 19,269 115,612 2 0.375 14,451 26,494 750 41,69527 Member of Technical Staff 114,500 22,900 137,400 1 0.125 5,725 31,488 375 37,58828 Member of Technical Staff 47,028 9,406 56,434 1 0.125 2,351 12,933 375 15,65929 Account Executive 90,660 18,132 108,792 1 0.125 4,533 24,932 375 29,84030 Member of Technical Staff 63,329 12,666 75,995 1 0.125 3,166 17,415 375 20,95631 Member of Operations Staff 131,000 26,200 157,200 1 0.125 6,550 36,025 375 42,95032 Chief Financial Officer 150,000 30,000 180,000 1 0.125 7,500 41,250 375 49,12533 Member of Technical Staff 100,210 20,042 120,252 2 0.375 15,032 27,558 750 43,34034 Member of Technical Staff 87,372 17,474 104,846 2 0.375 13,106 24,027 750 37,88335 Member of Technical Staff 108,000 21,600 129,600 2 0.375 16,200 29,700 750 46,65036 Member of Technical Staff - Nonexempt 22,326 4,465 26,791 1 0.125 1,116 6,140 375 7,63137 Member of Technical Staff 70,000 14,000 84,000 1 0.125 3,500 19,250 375 23,12538 Director of Operations 137,000 27,400 164,400 3 0.750 41,100 37,675 1,500 80,27539 Member of Technical Staff 94,248 18,850 113,098 2 0.375 14,137 25,918 750 40,80540 Member of Operations Staff 71,000 14,200 85,200 1 0.125 3,550 19,525 375 23,45041 Director of Marketing 125,000 25,000 150,000 2 0.375 18,750 34,375 750 53,87542 Member of Technical Staff 65,000 13,000 78,000 1 0.125 3,250 17,875 375 21,50043 Member of Technical Staff - Nonexempt 42,950 8,590 51,540 1 0.125 2,148 11,811 375 14,33444 Member of Technical Staff 90,000 18,000 108,000 1 0.125 4,500 24,750 375 29,62545 Member of Technical Staff 109,000 21,800 130,800 2 0.375 16,350 29,975 750 47,07546 Member of Technical Staff 84,200 16,840 101,040 1 0.125 4,210 23,155 375 27,74047 Member of Technical Staff 128,500 25,700 154,200 3 0.750 38,550 35,338 1,500 75,38848 Member of Technical Staff 80,900 16,180 97,080 1 0.125 4,045 22,248 375 26,66849 Member of Technical Staff 60,300 12,060 72,360 1 0.125 3,015 16,583 375 19,97350 Member of Technical Staff 58,500 11,700 70,200 1 0.125 2,925 16,088 375 19,38851 Director Release and Customer Support 116,000 23,200 139,200 2 0.375 17,400 31,900 750 50,05052 Executive Assistant 35,000 7,000 42,000 1 0.125 1,750 9,625 375 11,75053 Member of Technical Staff 113,400 22,680 136,080 2 0.375 17,010 31,185 750 48,94554 Member of Technical Staff 112,041 22,408 134,449 2 0.375 16,806 30,811 750 48,36755 Member of Operations Staff 70,000 14,000 84,000 1 0.125 3,500 19,250 375 23,12556 Member of Technical Staff 77,000 15,400 92,400 2 0.375 11,550 21,175 750 33,47557 Member of Technical Staff 107,000 21,400 128,400 3 0.750 32,100 29,425 1,500 63,02558 Director of International Operations 150,000 30,000 180,000 1 0.125 7,500 41,250 375 49,12559 Member of Technical Staff 110,000 22,000 132,000 2 0.375 16,500 30,250 750 47,50060 Vice President and General Manager of EMEA 145,000 29,000 174,000 2 0.375 21,750 39,875 750 62,37561 Account Executive 82,500 16,500 99,000 1 0.125 4,125 22,688 375 27,18862 Account Executive 75,261 15,052 90,313 2 0.375 11,289 20,697 750 32,73663 Member of Technical Staff 67,735 13,547 81,282 2 0.375 10,160 18,627 750 29,53764 Member of Technical Staff 73,350 14,670 88,020 2 0.375 11,003 20,171 750 31,92465 Member of Technical Staff 99,465 19,893 119,358 3 0.750 29,840 27,353 1,500 58,693
Total 65 $6,134,752 $1,226,950 $7,361,702 $771,073 $1,687,060 $41,625 $2,499,758
Replacement Cost of Assembled Workforce $2,499,758Less: Taxes 40.0% (999,903)
Costs Avoided, Net of Tax $1,499,855(1 ) Qualified Replacement Training Months Hours Rate Amortization Benefit
1 = < 3 months 5 $75.00 Rate of Return 16.0% 2 = 3-6 months 10 $75.00 Tax Rate 40.0% 3 = 6-12 months 20 $75.00 Tax Amortization Period 15
(2 ) Source: Karl Malloney, Recruiter Amortization Benefit 285,967
Fair Value of Assembled Workforce, Rounded $1,790,000
TRAIN. PER.
Interview & H.R.
of
Exhibit 3.8 Target Company—Valuation of Assembled Workforce as of December 31,2001
Note: Some amounts may not foot due to rounding.
name X is recognized as representing one of the premier companies inthe industry. In most cases, the trade name identifies the top productsavailable in the marketplace. The use of this trade name is consideredcritical to the continued success of the company and provides for aseamless and invisible ownership change by maintaining continuity inthe minds of customers.
Trade names and trademarks must be considered individually to deter-mine their remaining useful life. Trade names and trademarks that areassociated with a company name or logo (e.g., McDonald’s) typicallyhave indefinite lives. Many product trade names and trademarks alsowill have an indefinite life if no reasonable estimate can be made of theend of the product life (e.g., Coca-Cola). However, the analyst must becareful to find out whether there is a planned phaseout of a product orascertain whether it can be estimated with reasonable certainty that aname will lose value or be abandoned over time. In such a case, a finitelife is suggested and therefore an amortization period is warranted. Re-member, for tax purposes generally all intangibles are amortizable overa 15-year life.
To value the trade name, the cost approach and the market approachwere both considered and then rejected as not being feasible methods ofvaluation. It is difficult to accurately identify all the costs related to recre-ating the trade name and building recognition, a factor required to use thecost approach. Trademarks and trade names rarely sell in the market-place; thus, information required to perform a market approach is rarelyavailable. The most comprehensive method to value the trade name is avariant of the income approach known as the relief from royalty method.The premise of this valuation methodology is the assumption that anowner/operator of a company would be compelled to pay the rightfulowner of the intangible asset (such as a trade name) if the owner/operatordid not have the legal right to utilize the subject intellectual property.Since ownership of a trade name relieves a company from making suchpayments (royalties), the financial performance of the company is en-hanced to the extent that such royalty payments are avoided. The royaltyis usually expressed as a percentage of pretax revenues.
The relief from royalty method equates the value of a trademark ortrade name to the portion of the company’s earnings that represents thepretax royalty that may have been paid for using the trade name. For thename valued, it was determined that a royalty rate of 4 percent is applica-ble, stated as a percentage of sales.
Valuation of Intangible Assets 61

This pretax royalty rate was selected based on observed royalty ratesin the market and on an analysis of the rate that the company’s marginscould support. Market data was observed in The Financial ValuationGroup’s proprietary database documenting the range of royalty rates fortrademarks to be 1 percent to 10 percent, with the average at 4 percent.
Thus, based largely on a review of publicly available data on trade-mark/trade name licensing transactions and a comparison of the namerecognition between X and the guideline royalties, a 4 percent averageroyalty rate was selected to value the trade name. The BEV (shown inExhibit 3.5) indicates that there are ample earnings to allow for thislevel of royalty payments and still earn a fair return on sales. TargetCompany could easily pay these royalties if it did not own the right touse the trade name. In management interviews and research, it was de-termined that the technology was primarily responsible for the com-pany’s superior profitability.
The rights to use the trade name transfer to the buyer in perpetuity,giving it an indefinite life. The fair value of the trade name is the presentvalue of the royalties projected for the five-year period of 2002 to 2006,plus the present value of the residual at the end of the five-year period,plus the amortization benefit. A 16 percent rate of return was chosen toreflect a risk assessment that the trade name was approximately as riskyas the business overall.
Based on the analysis as presented in Exhibit 3.9, it was concludedthat the fair value of the trade name as of the valuation date was$23,760,000 (rounded). This asset has an indefinite life.
Noncompete Agreement
Article X, paragraph 10.1 of the purchase agreement identifies a separateagreement not to compete. The purchase agreement specifies that, for aperiod of five years commencing at the date of the purchase transaction,the sellers will not engage in any activity that competes with Target Com-pany. One of several accepted methodologies for the valuation of non-compete agreements is to prepare a second BEV analysis, one thatassumes that the noncompete agreement is not in place. Presumably, inthe absence of such an agreement, the sellers would be free to competeand take business away from Target Company and perhaps cause thecompany to spend more to defend its position, thus reducing its marginsas well. The value of having the noncompete agreement, then, is the dif-ference in the two BEVs, as shown in Exhibit 3.10.
62 Determining Goodwill and Other Intangible Assets in Business

In the interest of brevity and because a full BEV analysis has beenpresented as an example, explanations of the assumptions will not be re-peated, except those assumptions that change. Under the assumption ofcompetition, sellers could negatively impact Target Company, affectingthe growth of sales (i.e., the seller, if not under a noncompete agreementcould theoretically go to work for a competitor or start a new companyand cause Target Company to grow more slowly than otherwise pro-jected) and cause it to incur more marketing and other expenses. Thus,the changed assumptions are:
BEV BEVWithout Competition With Competition
Exhibit 3.5 Exhibit 3.10Net sales growth rate
Year one 15% 10%Year two 15% 10%
Operating expensesYear one 30% 32%Year two 29% 30%
Valuation of Intangible Assets 63
2 0 0 2 2 0 0 3 2 0 0 4 2 0 0 5 2 0 0 6
Net Sales from Business Enterprise Valuation (1) $69,000 $79,350 $89,269 $98,196 $108,015
Pretax Relief from Royalty 4.0% $2,760 $3,174 $3,571 $3,928 $4,321Income Tax Liability 40.0% 1,104 1,270 1,428 1,571 1,728
After-Tax Royalty 1,656 1,904 2,142 2,357 2,592Present Value Income Factor 16.0% 0.9285 0.8004 0.6900 0.5948 0.5128
Present Value Relief from Royalty $1,538 $1,524 $1,478 $1,402 $1,329
Sum of Present Value Relief from Royalty, 2002—2006 $7,271Residual Calculation:2006 After-Tax Royalty $2,592
2007 After-Tax Royalty, Assuming Growth of 5.0% $2,722Residual Capitalization Rate 11.0%
Residual Value, 2007 $24,742Present Value Factor 0.5128
Fair Market Value of Residual 12,687
Present Value of Trade Name Royalty Flows $19,959
Amortization Benefit Discount Rate 16.0% Tax Rate 40.0% Tax Amortization Period 1 5
Amortization Benefit 3,805
Fair Value of Trade Name, Rounded $23,760
( 1 ) Figures shown from Business Enterprise Valuation (Exhibit 3.5)
Exhibit 3.9 Target Company—Valuation of Trade Name as of December 31,2001 ($’000s)
Note: Some amounts may not foot due to rounding.
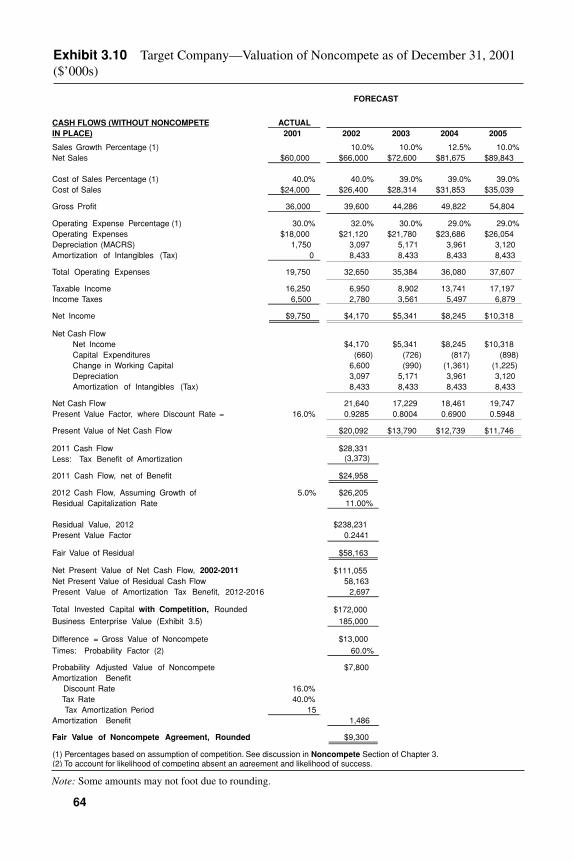
64
CASH FLOWS (WITHOUT NONCOMPETE ACTUALIN PLACE) 2001 2002 2003 2004 2005
Sales Growth Percentage (1) 10.0% 10.0% 12.5% 10.0%Net Sales $60,000 $66,000 $72,600 $81,675 $89,843
Cost of Sales Percentage (1) 40.0% 40.0% 39.0% 39.0% 39.0%Cost of Sales $24,000 $26,400 $28,314 $31,853 $35,039
Gross Profit 36,000 39,600 44,286 49,822 54,804
Operating Expense Percentage (1) 30.0% 32.0% 30.0% 29.0% 29.0%Operating Expenses $18,000 $21,120 $21,780 $23,686 $26,054Depreciation (MACRS) 1,750 3,097 5,171 3,961 3,120Amortization of Intangibles (Tax) 0 8,433 8,433 8,433 8,433
Total Operating Expenses 19,750 32,650 35,384 36,080 37,607
Taxable Income 16,250 6,950 8,902 13,741 17,197Income Taxes 6,500 2,780 3,561 5,497 6,879
Net Income $9,750 $4,170 $5,341 $8,245 $10,318
Net Cash FlowNet Income $4,170 $5,341 $8,245 $10,318Capital Expenditures (660) (726) (817) (898)Change in Working Capital 6,600 (990) (1,361) (1,225)Depreciation 3,097 5,171 3,961 3,120Amortization of Intangibles (Tax) 8,433 8,433 8,433 8,433
Net Cash Flow 21,640 17,229 18,461 19,747Present Value Factor, where Discount Rate = 16.0% 0.9285 0.8004 0.6900 0.5948
Present Value of Net Cash Flow $20,092 $13,790 $12,739 $11,746
2011 Cash Flow $28,331Less: Tax Benefit of Amortization (3,373)
2011 Cash Flow, net of Benefit $24,958
2012 Cash Flow, Assuming Growth of 5.0% $26,205Residual Capitalization Rate 11.00%
Residual Value, 2012 $238,231Present Value Factor 0.2441
Fair Value of Residual $58,163
Net Present Value of Net Cash Flow, 2002-2011 $111,055Net Present Value of Residual Cash Flow 58,163Present Value of Amortization Tax Benefit, 2012-2016 2,697
Total Invested Capital with Competition, Rounded $172,000Business Enterprise Value (Exhibit 3.5) 185,000
Difference = Gross Value of Noncompete $13,000Times: Probability Factor (2) 60.0%
Probability Adjusted Value of Noncompete $7,800Amortization Benefit Discount Rate 16.0% Tax Rate 40.0% Tax Amortization Period 15Amortization Benefit 1,486
Fair Value of Noncompete Agreement, Rounded $9,300
(1) Percentages based on assumption of competition. See discussion in Noncompete Section of Chapter 3.(2) To account for likelihood of competing absent an agreement and likelihood of success.
FORECAST
Exhibit 3.10 Target Company—Valuation of Noncompete as of December 31, 2001($’000s)
Note: Some amounts may not foot due to rounding.
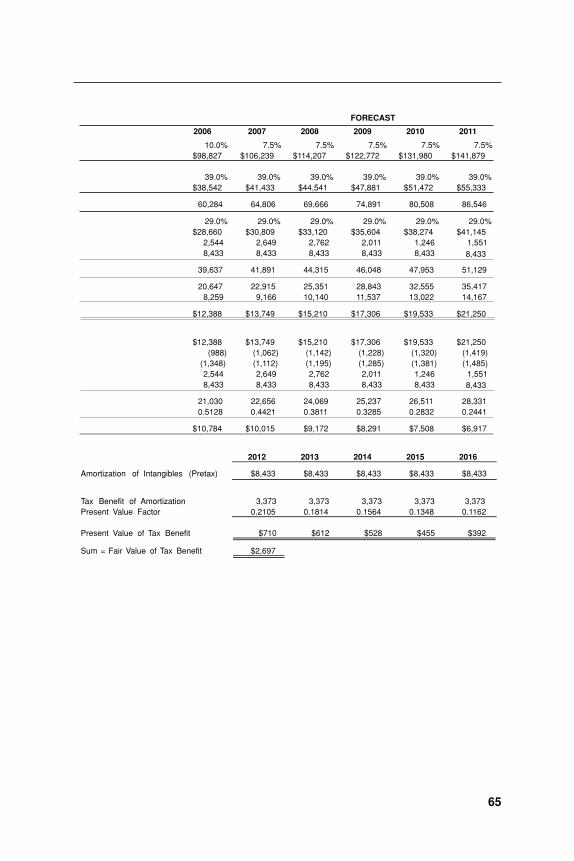
2006 2007 2008 2009 2010 2011
10.0% 7.5% 7.5% 7.5% 7.5% 7.5%$98,827 $106,239 $114,207 $122,772 $131,980 $141,879
39.0% 39.0% 39.0% 39.0% 39.0% 39.0%$38,542 $41,433 $44,541 $47,881 $51,472 $55,333
60,284 64,806 69,666 74,891 80,508 86,546
29.0% 29.0% 29.0% 29.0% 29.0% 29.0%$28,660 $30,809 $33,120 $35,604 $38,274 $41,145
2,544 2,649 2,762 2,011 1,246 1,5518,433 8,433 8,433 8,433 8,433 8,433
39,637 41,891 44,315 46,048 47,953 51,129
20,647 22,915 25,351 28,843 32,555 35,4178,259 9,166 10,140 11,537 13,022 14,167
$12,388 $13,749 $15,210 $17,306 $19,533 $21,250
$12,388 $13,749 $15,210 $17,306 $19,533 $21,250(988) (1,062) (1,142) (1,228) (1,320) (1,419)
(1,348) (1,112) (1,195) (1,285) (1,381) (1,485)2,544 2,649 2,762 2,011 1,246 1,5518,433 8,433 8,433 8,433 8,433 8,433
21,030 22,656 24,069 25,237 26,511 28,3310.5128 0.4421 0.3811 0.3285 0.2832 0.2441
$10,784 $10,015 $9,172 $8,291 $7,508 $6,917
2012 2013 2014 2015 2016
Amortization of Intangibles (Pretax) $8,433 $8,433 $8,433 $8,433 $8,433
Tax Benefit of Amortization 3,373 3,373 3,373 3,373 3,373Present Value Factor 0.2105 0.1814 0.1564 0.1348 0.1162
Present Value of Tax Benefit $710 $612 $528 $455 $392
Sum = Fair Value of Tax Benefit $2,697
FORECAST
65
The resulting BEV (with competition) is $172,000,000 (rounded).The value of the noncompete agreement under these assumptions is:
Invested CapitalBEV with agreement in place (rounded) $185,000,000BEV without agreement in place (rounded) 172,000,000
Difference equals gross value of agreement $ 13,000,000
The gross value of the noncompete agreement calculated above rep-resents the difference in value of the BEV without competition and theBEV with competition. Implicit in the analysis to this point is that, absenta noncompete agreement, the sellers would compete immediately withTarget Company, either by joining a competitor or starting a new com-pany, and would be successful in their effort. In fact, there is at least someprobability that the sellers would not compete and a probability that evenif they did, they would not be successful. Thus, the gross value of theagreement is reduced to account for these probabilities. The probabilityfactor is somewhat judgmental and is developed by discussing the issuewith the individuals under the noncompete, as well as company manage-ment. After due consideration of these issues, the probability factor wasestimated to be 60 percent.
The gross value of the noncompete agreement is multiplied by the 60percent probability factor. The result is the probability-adjusted value ofthe noncompete agreement, $7,800,000. After adding the amortizationbenefit, the fair value of the noncompete agreement is $9,300,000(rounded). The remaining useful life is five years.
Technology
The value of the company’s developed technology was determined us-ing a form of the income approach known as the multi-period excessearnings method. This method measures the present value of the futureearnings to be generated during the remaining lives of the assets. Us-ing the BEV as a starting point, pretax cash flows attributable to thetechnology that existed at the valuation date were calculated. This wasaccomplished by utilizing management’s forecast of sales attributableto the existing technology. These sales were estimated at 2001 levelsplus a growth rate commensurate with inflation, or 3 percent per year.As with the BEV, deductions are made for cost of goods sold (40 per-
66 Determining Goodwill and Other Intangible Assets in Business
______________________
cent of sales attributable to existing technology in 2002, and 39 per-cent after 2002) and operating expenses (20 percent of sales in 2002,then 19 percent, after deducting estimated development expenses of 10percent from the operating expense base to reflect the fact that the de-veloped technology should not be burdened by expenses of developingnew technology). Contributory charges on the other identified assetswere taken.
Returns on and of or contributory charges represent charges for theuse of contributory assets employed to support the technology-based as-sets and help generate revenue. The cash flows from the technology-based assets must support charges for replacement of assets employedand provide a fair return to the owners of capital. The respective rates ofreturn, while subjective, are directly related to the analyst’s assessment ofthe risk inherent in each asset.
The following table from the IPR&D Practice Aid provides examplesof assets typically treated as contributory assets, and suggested bases fordetermining the fair return. Generally, it is presumed that the return of theasset is reflected in the operating costs when applicable (for example, de-preciation expense). The contributory asset charge is “the product of theasset’s fair value and the required rate of return on the asset.”14
Asset Basis of ChargeWorking capital Short-term lending rates for market participants
(e.g., working capital lines or short-term revolver rates)
Fixed assets Financing rate for similar assets for market (e.g., participants (e.g., terms offered by property, vendor financing), or rates implied by operating plant, and leases, capital leases, or both, typically equipment) segregated between returns of (i.e.,
recapture of investment) and returns on.Workforce Weighted average cost of capital (WACC) (which is not for young, single-product companies (may recognized be lower than discount rate applicable to separately from a particular project).goodwill),customer lists, trademarks, and trade names
Valuation of Intangible Assets 67
Patents WACC for young, single-product companies (may be lower than discount rate applicable to a particular project). In cases where risk of realizing economic value of patent is close to or the same as risk of realizing a project, rates would be equivalent to that of the project.
Other intangibles, Rates appropriate to the risk of the subject including base intangible. When market evidence is available, (or core) it should be used. In other cases, rates should be technology consistent with the relative risk of other assets in
the analysis and should be higher for riskier assets.15
It is important to note that the assumed fair value of the contributoryasset is not necessarily static over time. Working capital and tangible as-sets may fluctuate throughout the forecast period, and returns are typi-cally taken on estimated average balances in each year. Average balancesof tangible assets subject to accelerated depreciation (as is the case here)may decline as the depreciation outstrips capital expenditures in the earlyyears of the forecast. While the carrying value of amortizable intangibleassets declines over time, there is a presumption that such assets are re-plenished each year, so the contributory charge usually takes the form ofa fixed charge each year. An exception to this rule is a noncompete agree-ment, which is not replenished and does not function as a supporting as-set past its expiration period.
The return requirements used here are after-tax and are:
Contributory Asset ChargesWorking capital 5.0%Land and building 7.0%Machinery and equipment 8.0%Software 18.0%Trade name 16.0%Noncompete agreement 16.0%Assembled workforce 16.0%Customer base 18.0%
Those guidelines are generally followed here, although it should be notedthat some practitioners use a specific “mini-WACC” for fixed assets (the
68 Determining Goodwill and Other Intangible Assets in Business
weights reflecting the percentage financed [debt] and the percentagedown [equity]). Lease rates are also sometimes used.
Required returns were deducted from the cash flows. Returns onworking capital and fixed assets are taken on the average book balancesfor each year in the projection period, as determined in the development ofthe BEV. The return of is satisfied through the replenishment of the assetthrough ongoing expenditures. Contributory charges on the intangible as-sets are taken on the fair value at acquisition. The returns of these assetsare satisfied by that portion of operating expenses that relate to the replen-ishment of the various intangibles. Total returns are allocated among theintangibles valued using the multiperiod excess earnings method (here,developed technology and in-process research and development), usuallyon the basis of relative revenues, as presented in Exhibit 3.11.
We then performed a study related to the expected life of the tech-nology, which produced a four-year remaining useful life, during whichthe asset is projected to function at 100 percent (i.e., no economic deteri-oration) in 2002, 90 percent in 2003, 80 percent in 2004, and 50 percentproductivity in year four. Such a study may be performed in several dif-ferent ways, depending on the intangible.16 Here, the “survivor curve”was developed through detailed discussions with technical and market-ing managers. It should be noted that some practitioners prefer to ac-count for declining productivity of the asset by use of a decliningrevenue curve. The surviving cash flows (the excess cash flows multi-plied by the projected survivorship of the technology in each year), afterproviding for returns on the other assets, are attributable to the technol-ogy. The discount rate of 18 percent reflects the higher relative risk ofthis asset compared with the business overall and the other intangibles.
Based on our analysis, we concluded that the fair value of the acquiredtechnology on the valuation date was $13,500,000 (rounded), as shown inExhibit 3.12. As with the other intangible assets, the value is determined af-ter deducting an income tax charge and adding an amortization benefit. Theasset’s remaining useful life is four years, but the survivor curve provides ameans to record future amortization consistent with the contribution to cashflows in each year, rather than by the straight-line method.
In-Process Research and Development
The value of the in-process research and development was also esti-mated using the multiperiod excess earnings method. Similar to themethodology for valuing the technology, the discounted cash flow
Valuation of Intangible Assets 69

model was constructed starting with expected sales based on the tech-nology that was in process at the valuation date. For simplicity, it is as-sumed that the IPR&D will be completed in early 2002 and is projectedto produce sales of $7,200,000. Sales are further projected to increaserapidly in subsequent years. Similar to the technology valuation, cost ofsales (40 percent of sales in 2002, 39 percent thereafter) and operatingexpenses (20 percent of sales [excluding any synergies] in 2002, 19percent thereafter, and net of development costs, which will no longeroccur relative to this technology) are forecast, as is the cost to complete
70 Determining Goodwill and Other Intangible Assets in Business
CALCULATION OF CONTRIBUTORY ASSET CHARGES
Contributory Asset
A. Asset Balances 2 0 0 2 2 0 0 3 2 0 0 4 2 0 0 5 2 0 0 6Net Working Capital $13,425 $11,126 $12,646 $14,060 $15,466Land and Buildings 21,934 21,815 21,718 21,640 21,580Machinery and Equipment, net 17,849 14,551 10,900 8,348 6,582Software 7,070 7,070 7,070 7,070 7,070Trade Name 23,760 23,760 23,760 23,760 23,760Noncompete Agreement 9,300 9,300 9,300 9,300 9,300Assembled Workforce 1,790 1,790 1,790 1,790 1,790Customer Base 6,490 6,490 6,490 6,490 6,490
B. Total Returns Rate 2 0 0 2 2 0 0 3 2 0 0 4 2 0 0 5 2 0 0 6Net Working Capital 5.0% $671 $556 $632 $703 $773Land and Buildings 7.0% 1,535 1,527 1,520 1,515 1,511Machinery and Equipment, net 8.0% 1,428 1,164 872 668 527Software 18.0% 1,273 1,273 1,273 1,273 1,273Trade Name 16.0% 3,802 3,802 3,802 3,802 3,802Noncompete Agreement 16.0% 1,488 1,488 1,488 1,488 1,488Assembled Workforce 16.0% 286 286 286 286 286Customer Base 18.0% 1,168 1,168 1,168 1,168 1,168
C. Distribution of Revenues 2 0 0 2 2 0 0 3 2 0 0 4 2 0 0 5 2 0 0 6Technology $61,800 $63,654 $65,564 $67,531 $69,556IPR&D 7,200 15,696 23,705 30,665 38,459
Total DCF Revenues $69,000 $79,350 $89,269 $98,196 $108,015
Technology Percent 89.57% 80.22% 73.45% 68.77% 64.40%IPR&D Percent 10.43% 19.78% 26.55% 31.23% 35.60%
Total 100.00% 100.00% 100.00% 100.00% 100.00%
D. Allocated Returns—Technology 2 0 0 2 2 0 0 3 2 0 0 4 2 0 0 5Net Working Capital $601 $446 $464 $483Land and Buildings 1,375 1,225 1,117 1,042Machinery and Equipment, net 1,279 934 640 459Software 1,140 1,021 935 875Trade Name 3,405 3,050 2,792 2,614Noncompete Agreement 1,333 1,194 1,093 1,023Assembled Workforce 257 230 210 197Customer Base 1,046 937 858 803
Total $10,436 $9,036 $8,109 $7,498
E. Allocated Returns—IPR&D 2 0 0 2 2 0 0 3 2 0 0 4 2 0 0 5 2 0 0 6Net Working Capital $70 $110 $168 $220 $275Land and Buildings 160 302 404 473 538Machinery and Equipment, net 149 230 232 209 187Software 133 252 338 397 453Trade Name 397 752 1,010 1,187 1,354Noncompete Agreement 155 294 395 465 530Assembled Workforce 3 0 5 7 7 6 8 9 102Customer Base 122 231 310 365 416
Total $1,216 $2,228 $2,932 $3,405 $3,855
Exhibit 3.11 Target Company—Valuation of Technology as of December 31,2001 ($’000s)
Note: Some amounts may not foot due to rounding.

the project. The useful life of the IPR&D was estimated to be five years,during which the technology is projected to function at 100 percent forthe first year, then decline in productivity to 85 percent in 2003, 75 per-cent in 2004, 60 percent in 2005, and 50 percent in 2006. In addition,estimated required returns on and of the assets (see previous section)were taken.
It is assumed for purposes of this example that the IPR&D is abrand-new, stand-alone technology not supported by the base or coretechnology, defined as technology that has value through its use orcontinued reuse within a product family.17 If an IPR&D project is
Valuation of Intangible Assets 71
ACTUAL2001 2002 2003 2004 2005
Net Sales—ExistingTechnology (1) $60,000 $61,800 $63,654 $65,564 $67,531Cost of Sales 24,000 24,720 24,825 25,570 26,337
Gross Profit 36,000 37,080 38,829 39,994 41,194
Operating Expenses (2) 12,000 12,360 12,094 12,457 12,831Depreciation 1,750 2,774 4,148 2,909 2,145
Total Operating Expenses 13,750 15,134 16,242 15,366 14,976
Taxable Income 22,250 21,946 22,587 24,627 26,217Income Taxes 8,900 8,778 9,035 9,851 10,487
Net Income $13,350 $13,168 $13,552 $14,776 $15,730
Residual Cash Flow Attributable to Technology
Less Returns on16,500 Net Working Capital 5.0% $601 $446 $464 $48322,000 Land and Buildings 7.0% 1,375 1,225 1,117 1,04219,000 Machinery and Equipment, net 8.0% 1,279 934 640 459
7,070 Software 18.0% 1,140 1,021 935 87523,760 Trade Name 16.0% 3,405 3,050 2,792 2,614
9,300 Noncompete Agreement 16.0% 1,333 1,194 1,093 1,0231,790 Assembled Workforce 16.0% 257 230 210 1976,490 Customer Base 18.0% 1,046 937 858 803
Sum of Returns $10,436 $9,036 $8,109 $7,498
After-Tax Residual Cash Flows $2,732 $4,516 $6,667 $8,233Survivorship of Technology (3) 100.0% 90.0% 80.0% 50.0%
Surviving Residual Cash Flows $2,732 $4,064 $5,334 $4,11618.00% Present Value Factor for Residual Cash Flow 0.9206 0.7801 0.6611 0.5603
Present Value of Surviving Residual Cash Flows $2,515 $3,171 $3,526 $2,306
Sum of Present Values, 2002–2005 $11,519Amortization Benefit Discount Rate 18.0% Tax Rate 40.0% Tax Amortization Period 15
Amortization Benefit 1,993
Fair Value of Technology, Rounded $13,500
(1) Based on 2001 actual sales, with growth attritubutable to existing technology.(2) Excludes development expenses of 10 percent to reflect that developed technology should not be burdened by the expenses of developing new technology.(3) Assumes 4 year life.
FORECAST
Exhibit 3.12 Target Company—Valuation of Technology as of December 31,2001 ($’000s)
Note: Some amounts may not foot due to rounding.
supported by a core or base technology, a contributory charge must be assessed.
The sum of the present values is $3,833,000. A discount rate of 25percent was selected to reflect the additional risk of the unproven tech-nology.18 After accounting for the amortization benefit, it was concludedthat the fair value of the IPR&D as of December 31, 2001, was$4,330,000 (Exhibit 3.13). This asset’s estimated remaining useful life isfive years, but, as with existing technology, the survivor curve provides ameans to record future amortization consistent with the contribution tocash flows in each year.
Valuation of Goodwill
In the valuation of a successful business enterprise, there are often in-tangible assets that cannot be separately identified. These intangibleassets are generally referred to as goodwill. The term goodwill, how-ever, is sometimes used to describe the aggregate of all of the intangi-ble assets of a business. In a more restricted sense, goodwill is the sumtotal of only the imponderable qualities that attract future new cus-tomers to the business.
In the final analysis, goodwill equates with the residual intangible as-set that generates earnings in excess of a normal return on all the other tan-gible and intangible assets. The present value of future cash flowscontributing to goodwill at the time of acquisition can be calculated bysumming the future excess earnings, then discounting to present value.Assuming all of the tangible and intangible assets have been identified andvalued at the acquisition date, this process is simplified by use of the resid-ual method. Under the residual method, the present value of the future ex-cess earnings, or goodwill, is calculated by subtracting from the adjustedpurchase price the fair value of all the identified tangible and intangibleassets. The remainder or residual amount equates with goodwill. Keep inmind that under GAAP goodwill includes assembled workforce, but as-sembled workforce was separately valued to obtain a contributory returnfor IPR&D and technology. As a result and pursuant to SFAS No. 141, theindicated value of assembled workforce must be added to the indicatedvalue of goodwill to arrive at the fair value of goodwill for financial state-ment reporting purposes.19
For financial reporting purposes, included in the goodwill value is thefair value of the assembled workforce of $1,790,000. Based on this
72 Determining Goodwill and Other Intangible Assets in Business
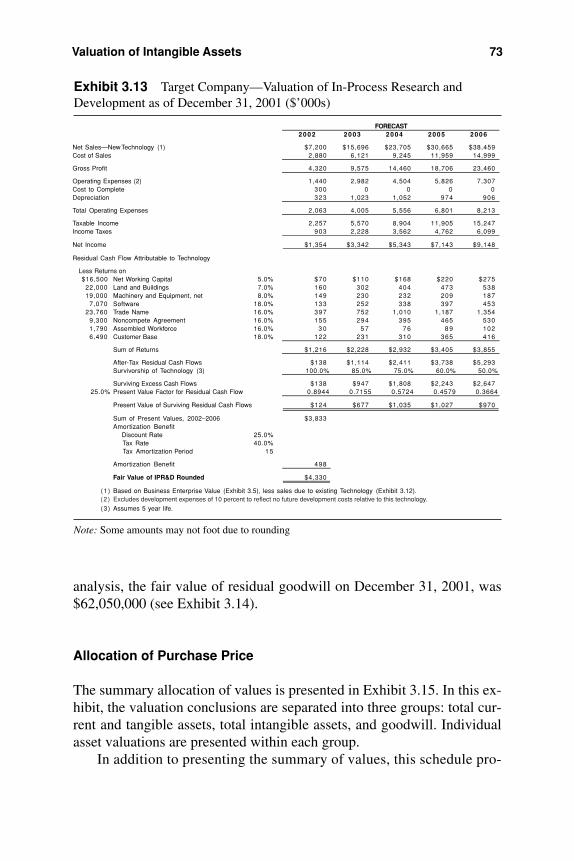
analysis, the fair value of residual goodwill on December 31, 2001, was$62,050,000 (see Exhibit 3.14).
Allocation of Purchase Price
The summary allocation of values is presented in Exhibit 3.15. In this ex-hibit, the valuation conclusions are separated into three groups: total cur-rent and tangible assets, total intangible assets, and goodwill. Individualasset valuations are presented within each group.
In addition to presenting the summary of values, this schedule pro-
Valuation of Intangible Assets 73
2 0 0 2 2 0 0 3 2 0 0 4 2 0 0 5 2 0 0 6
Net Sales—New Technology (1) $7,200 $15,696 $23,705 $30,665 $38,459Cost of Sales 2,880 6,121 9,245 11,959 14,999
Gross Profit 4,320 9,575 14,460 18,706 23,460
Operating Expenses (2) 1,440 2,982 4,504 5,826 7,307Cost to Complete 300 0 0 0 0Depreciation 323 1,023 1,052 974 906
Total Operating Expenses 2,063 4,005 5,556 6,801 8,213
Taxable Income 2,257 5,570 8,904 11,905 15,247Income Taxes 903 2,228 3,562 4,762 6,099
Net Income $1,354 $3,342 $5,343 $7,143 $9,148
Residual Cash Flow Attributable to Technology
Less Returns on$16,500 Net Working Capital 5.0% $70 $110 $168 $220 $275
22,000 Land and Buildings 7.0% 160 302 404 473 53819,000 Machinery and Equipment, net 8.0% 149 230 232 209 187
7,070 Software 18.0% 133 252 338 397 45323,760 Trade Name 16.0% 397 752 1,010 1,187 1,354
9,300 Noncompete Agreement 16.0% 155 294 395 465 5301,790 Assembled Workforce 16.0% 3 0 5 7 7 6 8 9 1026,490 Customer Base 18.0% 122 231 310 365 416
Sum of Returns $1,216 $2,228 $2,932 $3,405 $3,855
After-Tax Residual Cash Flows $138 $1,114 $2,411 $3,738 $5,293 Survivorship of Technology (3) 100.0% 85.0% 75.0% 60.0% 50.0%
Surviving Excess Cash Flows $138 $947 $1,808 $2,243 $2,64725.0% Present Value Factor for Residual Cash Flow 0.8944 0.7155 0.5724 0.4579 0.3664
Present Value of Surviving Residual Cash Flows $124 $677 $1,035 $1,027 $970
Sum of Present Values, 2002–2006 $3,833Amortization Benefit Discount Rate 25.0% Tax Rate 40.0% Tax Amortization Period 1 5
Amortization Benefit 498
Fair Value of IPR&D Rounded $4,330
(1 ) Based on Business Enterprise Value (Exhibit 3.5), less sales due to existing Technology (Exhibit 3.12).
(3 ) Assumes 5 year life.
FORECAST
(2 ) Excludes development expenses of 10 percent to reflect no future development costs relative to this technology.
Exhibit 3.13 Target Company—Valuation of In-Process Research andDevelopment as of December 31, 2001 ($’000s)
Note: Some amounts may not foot due to rounding
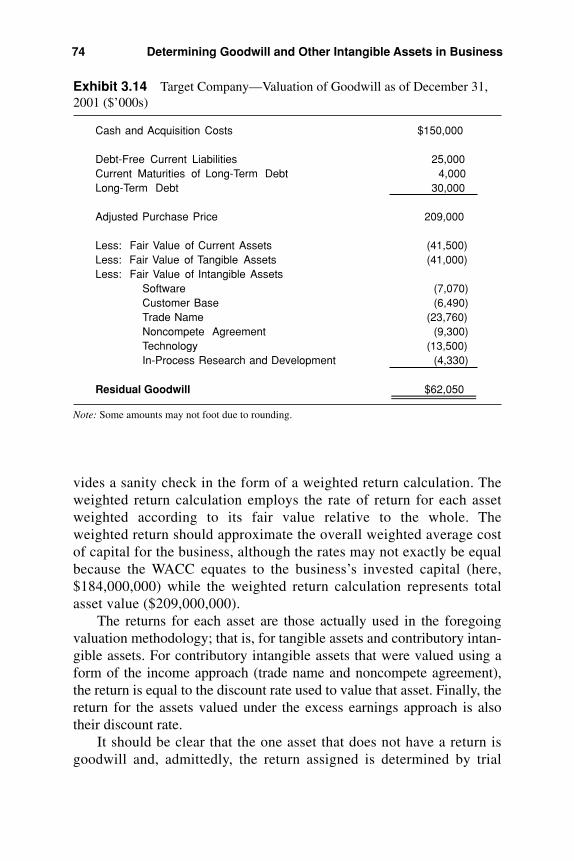
vides a sanity check in the form of a weighted return calculation. Theweighted return calculation employs the rate of return for each assetweighted according to its fair value relative to the whole. Theweighted return should approximate the overall weighted average costof capital for the business, although the rates may not exactly be equalbecause the WACC equates to the business’s invested capital (here,$184,000,000) while the weighted return calculation represents totalasset value ($209,000,000).
The returns for each asset are those actually used in the foregoingvaluation methodology; that is, for tangible assets and contributory intan-gible assets. For contributory intangible assets that were valued using aform of the income approach (trade name and noncompete agreement),the return is equal to the discount rate used to value that asset. Finally, thereturn for the assets valued under the excess earnings approach is alsotheir discount rate.
It should be clear that the one asset that does not have a return isgoodwill and, admittedly, the return assigned is determined by trial
74 Determining Goodwill and Other Intangible Assets in Business
Cash and Acquisition Costs $150,000
Debt-Free Current Liabilities 25,000Current Maturities of Long-Term Debt 4,000Long-Term Debt 30,000
Adjusted Purchase Price 209,000
Less: Fair Value of Current Assets (41,500)Less: Fair Value of Tangible Assets (41,000)Less: Fair Value of Intangible Assets
Software (7,070)Customer Base (6,490)Trade Name (23,760)Noncompete Agreement (9,300)Technology (13,500)In-Process Research and Development (4,330)
Residual Goodwill $62,050
Exhibit 3.14 Target Company—Valuation of Goodwill as of December 31,2001 ($’000s)
Note: Some amounts may not foot due to rounding.
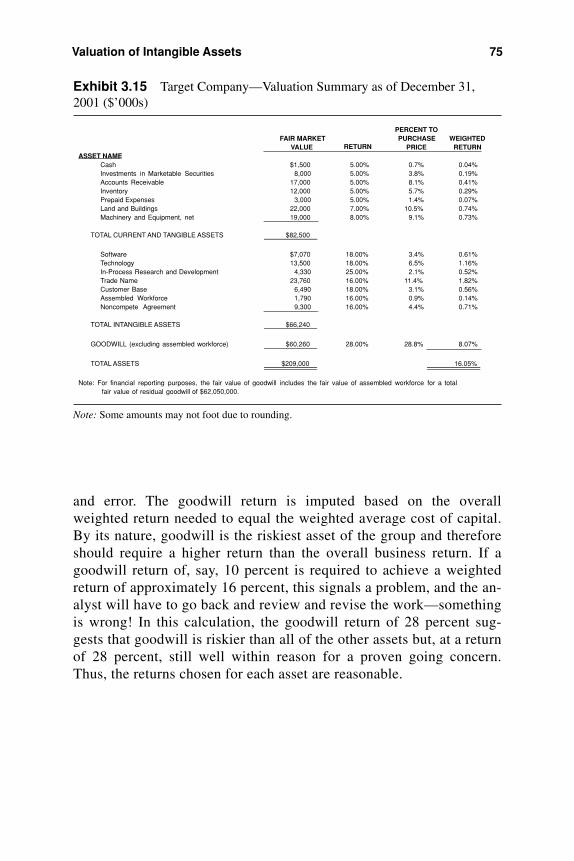
and error. The goodwill return is imputed based on the overallweighted return needed to equal the weighted average cost of capital.By its nature, goodwill is the riskiest asset of the group and thereforeshould require a higher return than the overall business return. If agoodwill return of, say, 10 percent is required to achieve a weightedreturn of approximately 16 percent, this signals a problem, and the an-alyst will have to go back and review and revise the work—somethingis wrong! In this calculation, the goodwill return of 28 percent sug-gests that goodwill is riskier than all of the other assets but, at a returnof 28 percent, still well within reason for a proven going concern.Thus, the returns chosen for each asset are reasonable.
Valuation of Intangible Assets 75
PERCENT TOFAIR MARKET PURCHASE WEIGHTED
VALUE RETURN PRICE RETURNASSET NAME
Cash $1,500 5.00% 0.7% 0.04%Investments in Marketable Securities 8,000 5.00% 3.8% 0.19%Accounts Receivable 17,000 5.00% 8.1% 0.41%Inventory 12,000 5.00% 5.7% 0.29%Prepaid Expenses 3,000 5.00% 1.4% 0.07%Land and Buildings 22,000 7.00% 10.5% 0.74%Machinery and Equipment, net 19,000 8.00% 9.1% 0.73%
TOTAL CURRENT AND TANGIBLE ASSETS $82,500
Software $7,070 18.00% 3.4% 0.61%Technology 13,500 18.00% 6.5% 1.16%In-Process Research and Development 4,330 25.00% 2.1% 0.52%Trade Name 23,760 16.00% 11.4% 1.82%Customer Base 6,490 18.00% 3.1% 0.56%Assembled Workforce 1,790 16.00% 0.9% 0.14%Noncompete Agreement 9,300 16.00% 4.4% 0.71%
TOTAL INTANGIBLE ASSETS $66,240
GOODWILL (excluding assembled workforce) $60,260 28.00% 28.8% 8.07%
TOTAL ASSETS $209,000 16.05%
Note: For financial reporting purposes, the fair value of goodwill includes the fair value of assembled workforce for a total fair value of residual goodwill of $62,050,000.
Exhibit 3.15 Target Company—Valuation Summary as of December 31,2001 ($’000s)
Note: Some amounts may not foot due to rounding.
Chapter 4
SFAS No. 142, Impairmentof Goodwill and OtherIntangible Assets
SFAS No. 142 applies to all acquired intangible assets, whether acquiredsingly, as part of a group, or in a business combination. The Statementmandates that goodwill and intangible assets without a defined life shallnot be amortized over a defined period; rather, they must be tested for im-pairment at least annually at the “reporting unit” level. Although the Fi-nancial Accounting Standards Board (FASB) already had addressed assetimpairment (originally SFAS No. 121, Accounting for the Impairment ofLong-Lived Assets and for Long-Lived Assets to Be Disposed Of, now su-perceded by SFAS No. 144, Accounting for the Impairment or Disposalof Long-Lived Assets), goodwill and intangible assets with an indefinitelife must be tested for impairment exclusively under the guidelines ofSFAS No. 142.1
All goodwill reported in the financial statements of a reporting unitshould be tested for impairment as if the reporting unit were a stand-alone entity. A reporting unit is an operating segment (see SFAS No. 131,Disclosures About Segments of an Enterprise and Related Information)or one level below an operating segment (called a component). A compo-nent of an operating segment is a reporting unit if the component consti-tutes a business for which discrete financial information is available andsegment management regularly reviews the operating results of that com-ponent. Goodwill must be defined and allocated at this component level.Entities that are not required to report segment information in accordancewith SFAS No. 131 are nevertheless required to test goodwill for impair-ment at the reporting unit level.2
The nature of fair value of a reporting unit is that the synergies of
76
operating in a combined entity, especially for shared overhead costs,are a fundamental part of the fair value of a reporting unit. SFAS No.142 states:
Substantial value may arise from the ability to take advantage of syner-gies and other benefits that flow from control over another entity. Conse-quently, measuring the fair value of a collection of assets and liabilitiesthat operate together in a controlled entity is different from measuringthe fair value of that entity’s individual equity securities.3
Additionally, if you could not take into account the synergies of beingpart of a combined entity, there would be an immediate impairment,since such economy of scale synergies are a typical part of a controltransaction.
All acquired goodwill should be assigned to reporting units. This willcritically depend on the assignment of other acquired assets and assumedliabilities. These assets and liabilities will be assigned to reporting unitsbased on the following criteria:
• The asset will be employed in or the liability relates to the operationsof a reporting unit
• The asset or liability will be considered in determining the fair valueof the reporting unit4
Goodwill is the excess of cost over the assets acquired and liabilitiesassumed, but this definition is deceptively simple. The amount of good-will allocated to a reporting unit is contingent upon the expected benefitsfrom the synergies of the combination.5 This goodwill allocation is re-quired even though other assets or liabilities of the acquired entity maynot be assigned to that reporting unit, that is, they may be assigned toother reporting units. A relative fair value allocation approach similar tothat used when a portion of a reporting unit is disposed of (see SFAS No.144) should be used to determine how goodwill should be allocated whenan entity reorganizes its reporting structure in a manner that changes thecomposition of one or more of its reporting units. Otherwise, SFAS No.144 should not be followed. Rather, goodwill should be tested for impair-ment pursuant to SFAS No. 142.6
The measurement of the fair value of intangibles and goodwill can beperformed at any time during the fiscal year as long as the timing is con-sistent from year to year. Although different measurement dates can beused for different reporting units, whichever date is selected for a report-
SFAS No. 142, Impairment of Goodwill and Other Intangible Assets 77
ing unit must be consistent from year to year. A detailed determination ofthe fair value of a reporting unit may be carried forward from one year tothe next (i.e., no further impairment analysis is required) if all of the fol-lowing criteria are met:
• The assets and liabilities that comprise the reporting unit have notchanged significantly since the most recent fair value determination.
• The most recent fair value determination results in an amount thatexceeds the carrying amount of the reporting unit by a substantialmargin.
• Based on an analysis of events, it is determined that the possibility isremote that a fair value determination will be less than the current car-rying amount of the reporting unit.7
However, the annual impairment test is to be accelerated and good-will of a reporting unit should be tested for impairment on an interim ba-sis if an event occurs that would more likely than not reduce the fairvalue of a reporting unit below its carrying value. Examples of suchevents are:
• A significant adverse change in legal factors or in the business climate• An adverse action or assessment by a regulator• Unanticipated competition• A loss of key personnel• A more-likely-than-not expectation that a reporting unit or a signifi-
cant portion of a reporting unit will be sold or otherwise disposed of• The testing for recoverability under SFAS No. 144 of a significant as-
set group within a reporting unit• Recognition of a goodwill impairment loss in the financial statements
of a subsidiary that is a component of a reporting unit8
NATURE OF GOODWILL
The definition of goodwill warrants repeating: Goodwill is the excess ofthe cost of an acquired entity over the net of amounts assigned to assets ac-quired and liabilities assumed.9 For GAAP purposes, goodwill includes allamounts that fail the criteria of an identified intangible asset. Importantly,
78 SFAS No. 142, Impairment of Goodwill and Other Intangible Assets

the practitioner must understand that the nature of goodwill for financial re-porting is different from that used in a legal setting. Such “legal goodwill”is generally considered to be all value above tangible asset value. For finan-cial reporting, it helps to consider the elements of goodwill as:
• The excess of the fair values over the book values of the acquired en-tity’s net assets at the date of acquisition.
• The fair values of other net assets that had not been recognized by theacquired entity at the date of acquisition.
• The fair value of the going-concern element of the acquired entity’sexisting business. The going-concern element represents the ability ofthe established business to earn a higher rate of return on an assem-bled collection of net assets than would be expected if those net assetshad to be acquired separately.
• The fair value of the expected synergies and other benefits from com-bining the acquiring entity’s and acquired entity’s net assets and busi-nesses; those synergies and other benefits are unique to eachcombination, and different combinations would produce different syn-ergies and, hence, different values.
• Overvaluation of the consideration paid by the acquiring entity stem-ming from errors in valuing the consideration tendered.
• Overpayment or underpayment by the acquiring entity. Overpaymentmight occur, for example, if the price is driven up in the course of bid-ding for the acquired entity, while underpayment may occur in thecase of a distress sale or fire sale.10
The FASB explained its rationale for including the above elementsthis way:
• The Board continues to believe that the following analysis of thosecomponents is useful in understanding the nature of goodwill. Thefirst two components, both of which relate to the acquired entity,conceptually are not part of goodwill. The first component is not an asset in and of itself but instead reflects gains that were not rec-ognized by the acquired entity on its net assets. As such, that com-ponent is part of those assets rather than part of goodwill. Thesecond component also is not part of goodwill conceptually; it pri-marily reflects intangible assets that might be recognized as indi-vidual assets.
Nature of Goodwill 79
• As the Board noted in both the 1999 Exposure Draft and the 2001 Ex-posure Draft, the third and fourth components are conceptually part ofgoodwill. The third component relates to the acquired entity and re-flects the excess assembled value of the acquired entity’s net assets. Itrepresents the preexisting goodwill that was either internally gener-ated by the acquired entity or acquired by it in prior business combi-nations. The fourth component relates to the acquired entity andacquiring entity jointly and reflects the excess assembled value that iscreated by the combination—the synergies that are expected fromcombining those businesses. The Board described the third and fourthcomponents collectively as “core goodwill.”
• The fifth and sixth components, both of which relate to the acquiringentity, also are not conceptually part of goodwill. The fifth componentis not an asset in and of itself or even part of an asset but, rather, is ameasurement error. The sixth component also is not an asset; concep-tually it represents a loss (in the case of overpayment) or a gain (in thecase of underpayment) to the acquiring entity. Thus, neither of thosecomponents is conceptually part of goodwill.11
GOODWILL, INDEFINITE-LIVED INTANGIBLE ASSETS, AND THE IMPAIRMENT TEST
A recognized intangible asset shall be amortized over its useful life to thereporting entity unless that life is determined to be indefinite.12 If no le-gal, regulatory, contractual, competitive, economic, or other factors limitthe useful life of the asset of an intangible asset to the reporting entity, theuseful life of the asset shall be considered to be indefinite. The term in-definite does not mean infinite.13 An intangible asset that is not subject toamortization (an indefinite life intangible) shall be tested for impairmentin the same manner as goodwill. Such intangibles are tested annually orupon triggering events.14
Under SFAS No. 142, amortization of goodwill and indefinite-lived intangible assets is not allowed—such goodwill and intangibleassets are tested annually for impairment. The impairment test is atwo-step process. First, the fair value of the reporting unit is deter-mined and compared with the carrying value of the reporting unit, in-cluding goodwill.
The fair value of a reporting unit refers to the amount at which theunit as a whole could be bought or sold in a current transaction between
80 SFAS No. 142, Impairment of Goodwill and Other Intangible Assets
willing parties. Quoted market prices in active markets are consideredthe best evidence of fair value and should be used as the basis for themeasurement, if available. However, the market price of an individualshare of stock (and thus the market capitalization of a reporting unit withpublicly traded stock) may not be representative of the fair value of thereporting unit as a whole. Certainly, stock prices rise and fall over timeand a stock price that is comparatively low at a certain date may not beindicative of impairment, which has a connotation of permanence.Therefore, the quoted market price of an individual share of stock neednot be the sole measurement basis of the fair value of a reporting unit. Ifa quoted market price of the shares of a reporting unit is not available,the estimate of fair value should be based on the best information avail-able, including prices for similar assets and liabilities and the results ofother valuation techniques. A valuation technique based on multiples ofearnings, revenue, or a similar performance measure may be used to es-timate the fair value of a reporting unit if that technique is consistentwith the objective of measuring fair value. Such measures may be ap-propriate, for example, when the fair value of an entity that has compa-rable operations and economic characteristics is observable and therelevant multiples of a comparable entity are known. Conversely, use ofmultiples would not be appropriate in situations in which the operationsor activities of an entity for which the multiples are known are not of acomparable nature, scope, or size as the reporting unit for which fairvalue is being estimated.15
SFAS No. 142 states:
A present value technique is often the best available technique withwhich to estimate the fair value of a group of net assets (such as a report-ing unit). If a present value technique is used to measure fair value, esti-mates of future cash flows . . . shall be consistent with the objective ofmeasuring fair value. Those cash flow estimates shall incorporate as-sumptions that marketplace participants would use in their estimates offair value. If that information is not available without undue cost and ef-fort, an entity may use its own assumptions. Those cash flow estimatesshall be based on reasonable and supportable assumptions and shall con-sider all available evidence. The weight given to the evidence shall becommensurate with the extent to which the evidence can be verified ob-jectively. If a range is estimated for the amounts or timing of possiblecash flows, the likelihood of possible outcomes shall be considered. [seeFASB Statement of Financial Concepts 7 [Conc. 7], Using Cash FlowInformation and Present Value in Accounting Measurements].16
Goodwill, Indefinite-Lived Intangible Assets and the Impairment Test 81
Goodwill impairment exists if the carrying value of the reportingunit, including goodwill, exceeds the fair value of the reporting unit. In such a case, the second step of the goodwill impairment test is triggered.
The second step of the goodwill impairment test requires perform-ing what amounts to a new purchase price allocation as of the date ofthe impairment test—as if a business combination were consummatedon the date of the impairment test. The new valuation work should in-clude determining the new fair values of both the originally recognizedassets and any new assets that may have been unrecognized at the valuation date but were developed between the acquisition date andthe test date. At the test date the fair values of the assets are deductedfrom the fair value of the reporting unit to determine the implied fairvalue of goodwill. If the implied fair value of goodwill at the test date is lower than its carrying amount, goodwill impairment is indi-cated and goodwill is written down to its implied fair value.17 Perform-ing the new asset allocation answers the implied question, “Whatexactly is impaired: specifically identifiable tangible assets, specifi-cally identifiable intangible assets, or goodwill?” This is where SFASNo. 144 controls.
As stated in SFAS No. 142:
If goodwill and another asset (or asset group) of a reporting unit aretested for impairment at the same time, the other asset (or asset group)shall be tested for impairment before goodwill. For example, if a sig-nificant asset group is to be tested for impairment under Statement121 [now 144] (thus potentially requiring a goodwill impairmenttest), the impairment test for the significant asset group would be per-formed before the goodwill impairment test. If the asset group wasimpaired, the impairment loss would be recognized prior to goodwillbeing tested for impairment.18
This means that impairment of other assets must also be recog-nized. Thus, the asset values recognized on the balance sheet as of thedate of the impairment test will be the lower of the carrying value orfair value for each previously recognized tangible asset. For example,assume a company has a reporting unit with a fair value of $80,000,000including goodwill of $35,000,000. Further assume that the relative fairvalues of the assets have been valued and recorded on the books of theacquirer as:
82 SFAS No. 142, Impairment of Goodwill and Other Intangible Assets
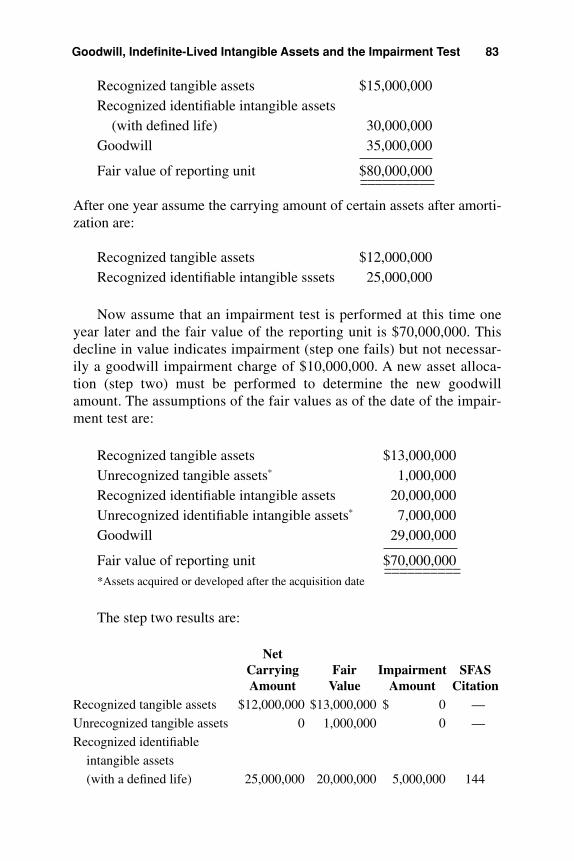
Recognized tangible assets $15,000,000Recognized identifiable intangible assets
(with defined life) 30,000,000Goodwill 35,000,000
Fair value of reporting unit $80,000,000
After one year assume the carrying amount of certain assets after amorti-zation are:
Recognized tangible assets $12,000,000Recognized identifiable intangible sssets 25,000,000
Now assume that an impairment test is performed at this time oneyear later and the fair value of the reporting unit is $70,000,000. Thisdecline in value indicates impairment (step one fails) but not necessar-ily a goodwill impairment charge of $10,000,000. A new asset alloca-tion (step two) must be performed to determine the new goodwillamount. The assumptions of the fair values as of the date of the impair-ment test are:
Recognized tangible assets $13,000,000Unrecognized tangible assets* 1,000,000Recognized identifiable intangible assets 20,000,000Unrecognized identifiable intangible assets* 7,000,000Goodwill 29,000,000
Fair value of reporting unit $70,000,000*Assets acquired or developed after the acquisition date
The step two results are:
NetCarrying Fair Impairment SFASAmount Value Amount Citation
Recognized tangible assets $12,000,000 $13,000,000 $ 0 —
Unrecognized tangible assets 0 1,000,000 0 —
Recognized identifiable
intangible assets
(with a defined life) 25,000,000 20,000,000 5,000,000 144
Goodwill, Indefinite-Lived Intangible Assets and the Impairment Test 83
____________________
____________________
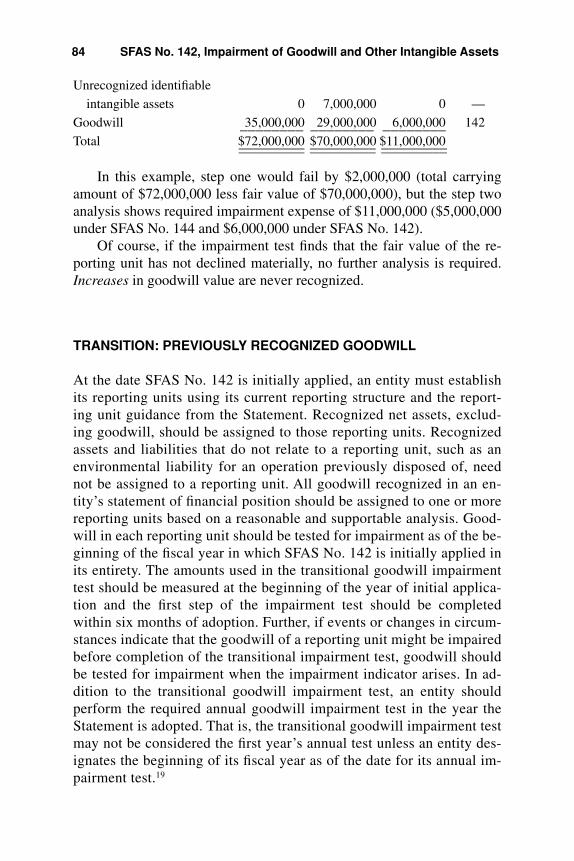
Unrecognized identifiable
intangible assets 0 7,000,000 0 —
Goodwill 35,000,000 29,000,000 6,000,000 142
Total $72,000,000 $70,000,000 $11,000,000
In this example, step one would fail by $2,000,000 (total carryingamount of $72,000,000 less fair value of $70,000,000), but the step twoanalysis shows required impairment expense of $11,000,000 ($5,000,000under SFAS No. 144 and $6,000,000 under SFAS No. 142).
Of course, if the impairment test finds that the fair value of the re-porting unit has not declined materially, no further analysis is required.Increases in goodwill value are never recognized.
TRANSITION: PREVIOUSLY RECOGNIZED GOODWILL
At the date SFAS No. 142 is initially applied, an entity must establishits reporting units using its current reporting structure and the report-ing unit guidance from the Statement. Recognized net assets, exclud-ing goodwill, should be assigned to those reporting units. Recognizedassets and liabilities that do not relate to a reporting unit, such as anenvironmental liability for an operation previously disposed of, neednot be assigned to a reporting unit. All goodwill recognized in an en-tity’s statement of financial position should be assigned to one or morereporting units based on a reasonable and supportable analysis. Good-will in each reporting unit should be tested for impairment as of the be-ginning of the fiscal year in which SFAS No. 142 is initially applied inits entirety. The amounts used in the transitional goodwill impairmenttest should be measured at the beginning of the year of initial applica-tion and the first step of the impairment test should be completedwithin six months of adoption. Further, if events or changes in circum-stances indicate that the goodwill of a reporting unit might be impairedbefore completion of the transitional impairment test, goodwill shouldbe tested for impairment when the impairment indicator arises. In ad-dition to the transitional goodwill impairment test, an entity shouldperform the required annual goodwill impairment test in the year theStatement is adopted. That is, the transitional goodwill impairment testmay not be considered the first year’s annual test unless an entity des-ignates the beginning of its fiscal year as of the date for its annual im-pairment test.19
84 SFAS No. 142, Impairment of Goodwill and Other Intangible Assets
________ ________ __________________________ __________________ __________________

Appendix 4.1
FINANCIAL REPORTING DISCLOSURES
The valuer must be aware of significant audit disclosures. For intangibleassets subject to amortization the disclosures will include:
• The total amount assigned and the amount assigned to any major in-tangible asset class (see Exhibit 2.1)
• The amount of any significant residual value, in total and by major in-tangible assets class
• The weighted average amortization period, in total and by major in-tangible assets class20
For intangible assets not subject to amortization, the total amount as-signed and the amount assigned to any major intangible asset class mustbe disclosed. Further, the amount of purchased in-process research anddevelopment assets acquired and written off in the period and the lineitem in the income statement in which the amount is written off or aggre-gated must be disclosed.21
For each period for which a statement of financial position is presented(i.e., each subsequent period to the acquisition) disclosure should include:
• The total gross carrying amount and accumulated amortization by ma-jor class for intangible assets subject to amortization
• Total amortization expense for the period• The estimated aggregate amortization expense for each of the five
succeeding fiscal years presented.22
For intangible assets not subject to amortization, the total carryingamount and the carrying amount for each major intangible asset classmust be disclosed. Further, the changes in the carrying amount of good-will during the period include:
• The aggregate amount of goodwill acquired• The aggregate amount of impairment loss recognized
Financial Reporting Disclosures 85

• The amount of goodwill included in the gain or loss on disposal of allor a portion of reporting unit23
Disclosure is more involved when an impairment loss is recognized.In such a situation, the following disclosures are required:
• A description of the facts and circumstances leading to the impairment• The amount of the impairment loss and the method of determining the
fair value of the associated reporting unit (whether based on quotedmarket prices, prices of comparable businesses, or a present value orother valuation technique)
• If a recognized impairment loss is an estimate that has not yet beenfinalized, that fact and the reasons for it should be disclosed. Fur-ther, in subsequent periods the nature and amounts of any signifi-cant adjustments made to the initial estimate of the impairment lossmust be disclosed24
For goodwill, disclosures are required for the total amount of ac-quired goodwill and the amount that is expected to be deductible fortax purposes.25 Further, the amount of goodwill allocated by reportingsegment pursuant to FASB (SFAS No. 131, Disclosures about Seg-ments of Enterprise and Related Information), should also be dis-closed.26 There are many other requirements for disclosure and theanalyst is urged to work closely with the auditor in defining the scopeof the valuation to assure all the elements of disclosure are included inthe valuation report. Analysts must make sure their report and work pa-pers provide the client and auditor the information necessary for thesedisclosures.
86 SFAS No. 142, Impairment of Goodwill and Other Intangible Assets
Chapter 5
Impairment Analysis:A Case Study
As described in the preceding chapter, under SFAS No. 142 goodwill isno longer amortized. Instead, goodwill is tested at least annually for im-pairment. The first step of the two-step impairment test, used to identifypotential impairment, compares the fair value of the reporting unit withits carrying amount, including goodwill.1 If the carrying value of the re-porting unit exceeds its fair value, step two is triggered. The second stepof the goodwill impairment test requires determining the amount ofgoodwill impairment associated with the impairment of the fair value ofthe reporting unit.2 These two amounts will rarely be the same. All long-lived assets must be tested for impairment before the goodwill impair-ment test. This essentially implies a new purchase price allocation and itis likely that, if the fair value of the reporting unit is impaired, some ofthe recorded asset fair values may also be impaired.
In this chapter an impairment test is presented, assumed to be oneyear later, of the entity valued in Chapter 3. In this example, the reportingunit and the business enterprise are one and the same; thus the impair-ment test is done at the enterprise level. Larger companies will have mul-tiple reporting units that must be separately analyzed. Our samplecompany is private, and we have determined that the best tool available isa discounted cash flow (DCF).
Obviously, the universe of acquired and acquirees is not limited toprivate companies. If the acquiring entity is public, the first thing man-agement is going to look at is the stock price. Indeed, some managementshave been criticized for spending too much time looking at their stockprice! Certainly, a material decline in a company’s stock price may indi-
87
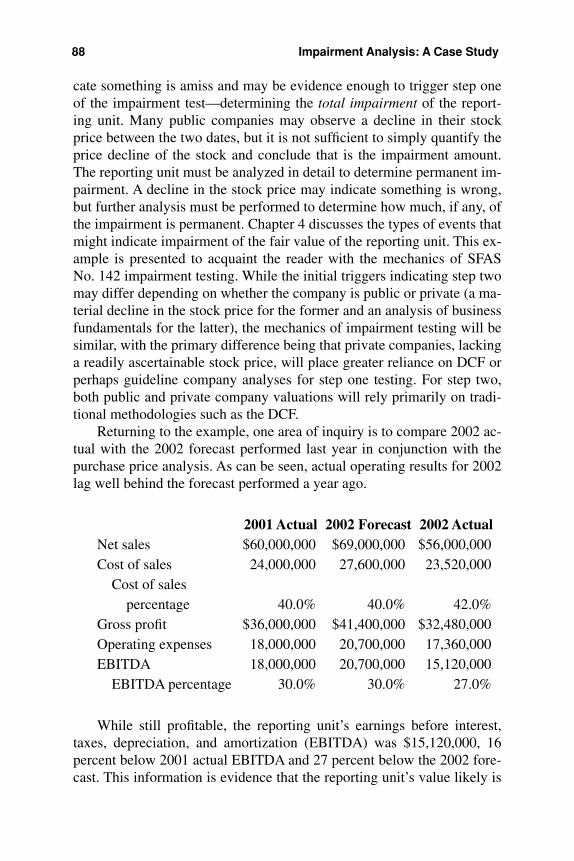
cate something is amiss and may be evidence enough to trigger step oneof the impairment test—determining the total impairment of the report-ing unit. Many public companies may observe a decline in their stockprice between the two dates, but it is not sufficient to simply quantify theprice decline of the stock and conclude that is the impairment amount.The reporting unit must be analyzed in detail to determine permanent im-pairment. A decline in the stock price may indicate something is wrong,but further analysis must be performed to determine how much, if any, ofthe impairment is permanent. Chapter 4 discusses the types of events thatmight indicate impairment of the fair value of the reporting unit. This ex-ample is presented to acquaint the reader with the mechanics of SFASNo. 142 impairment testing. While the initial triggers indicating step twomay differ depending on whether the company is public or private (a ma-terial decline in the stock price for the former and an analysis of businessfundamentals for the latter), the mechanics of impairment testing will besimilar, with the primary difference being that private companies, lackinga readily ascertainable stock price, will place greater reliance on DCF orperhaps guideline company analyses for step one testing. For step two,both public and private company valuations will rely primarily on tradi-tional methodologies such as the DCF.
Returning to the example, one area of inquiry is to compare 2002 ac-tual with the 2002 forecast performed last year in conjunction with thepurchase price analysis. As can be seen, actual operating results for 2002lag well behind the forecast performed a year ago.
2001 Actual 2002 Forecast 2002 ActualNet sales $60,000,000 $69,000,000 $56,000,000Cost of sales 24,000,000 27,600,000 23,520,000
Cost of sales percentage 40.0% 40.0% 42.0%
Gross profit $36,000,000 $41,400,000 $32,480,000Operating expenses 18,000,000 20,700,000 17,360,000EBITDA 18,000,000 20,700,000 15,120,000
EBITDA percentage 30.0% 30.0% 27.0%
While still profitable, the reporting unit’s earnings before interest,taxes, depreciation, and amortization (EBITDA) was $15,120,000, 16percent below 2001 actual EBITDA and 27 percent below the 2002 fore-cast. This information is evidence that the reporting unit’s value likely is
88 Impairment Analysis: A Case Study
impaired, triggering step one of the impairment study—determining thefair value of the reporting unit and comparing that value with its carryingamount. If the carrying amount of a reporting unit exceeds its fair value,the second step of the goodwill impairment test is performed to measurethe amount of goodwill impairment loss, if any.3
Now that we suspect that impairment exists, the challenge is to deter-mine the fair value of the reporting unit as of the current date, December31, 2002. Quoted market prices in active markets are considered the bestevidence of fair value,4 but the Statement allows that present value tech-niques are often the best. In our example, the carrying value of the report-ing unit exceeds its fair value, triggering step two.
If a reporting unit fails step one, the interrelationship between SFASNos. 142 and 144, Accounting for the Impairment or Disposal of Long-Lived Assets, can be a little confusing and warrants comment. SFAS No.144 states:
An impairment loss shall be recognized only if the carrying amount of along-lived asset (asset group) is not recoverable and exceeds its fairvalue. The carrying amount of a long-lived asset (asset group) is not re-coverable if it exceeds the sum of the undiscounted cash flows expectedto result from the use and eventual disposition of the asset (asset group).5
SFAS No. 144 provides guidance as to when to test for recoverability:
A long-lived asset (asset group) shall be tested for recoverability when-ever events or changes in circumstances indicate that its carryingamount may not be recoverable.6
If goodwill and other assets are tested for impairment at the same time,the other assets are to be tested for impairment before goodwill.7
The relatively poor financial performance described in our examplewould probably be reason enough to test the recoverability of long-lived as-sets under paragraphs 7 and 8 of SFAS No. 144. As will be seen later, thenoncompete asset would pass and the technology asset would fail the recov-erability test, which compares the asset’s undiscounted cash flows with car-rying values.
SFAS No. 144 contains similar language as SFAS No. 142 regardingthe determination of fair value, stating a preference for quoted marketprices but allowing other valuation techniques.8 And in our example, andsurely most other situations, quoted market prices for intangibles will notbe available, requiring other techniques as would be developed in a SFASNo. 142 step two analysis.
Impairment Analysis: A Case Study 89
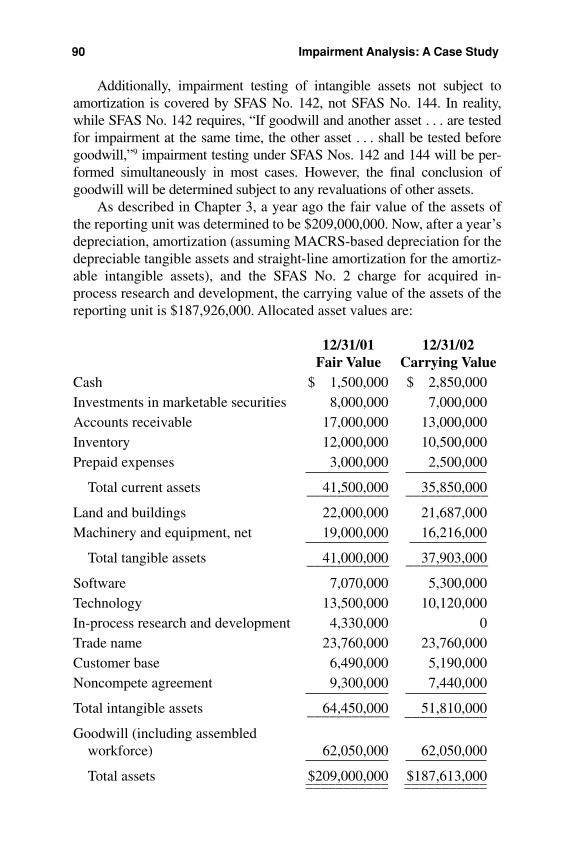
Additionally, impairment testing of intangible assets not subject toamortization is covered by SFAS No. 142, not SFAS No. 144. In reality,while SFAS No. 142 requires, “If goodwill and another asset . . . are testedfor impairment at the same time, the other asset . . . shall be tested beforegoodwill,”9 impairment testing under SFAS Nos. 142 and 144 will be per-formed simultaneously in most cases. However, the final conclusion ofgoodwill will be determined subject to any revaluations of other assets.
As described in Chapter 3, a year ago the fair value of the assets ofthe reporting unit was determined to be $209,000,000. Now, after a year’sdepreciation, amortization (assuming MACRS-based depreciation for thedepreciable tangible assets and straight-line amortization for the amortiz-able intangible assets), and the SFAS No. 2 charge for acquired in-process research and development, the carrying value of the assets of thereporting unit is $187,926,000. Allocated asset values are:
12/31/01 12/31/02Fair Value Carrying Value
Cash $ 1,500,000 $ 2,850,000Investments in marketable securities 8,000,000 7,000,000Accounts receivable 17,000,000 13,000,000Inventory 12,000,000 10,500,000Prepaid expenses 3,000,000 2,500,000
Total current assets 41,500,000 35,850,000
Land and buildings 22,000,000 21,687,000Machinery and equipment, net 19,000,000 16,216,000
Total tangible assets 41,000,000 37,903,000
Software 7,070,000 5,300,000Technology 13,500,000 10,120,000In-process research and development 4,330,000 0Trade name 23,760,000 23,760,000Customer base 6,490,000 5,190,000Noncompete agreement 9,300,000 7,440,000
Total intangible assets 64,450,000 51,810,000
Goodwill (including assembled workforce) 62,050,000 62,050,000
Total assets $209,000,000 $187,613,000
90 Impairment Analysis: A Case Study
___________ ___________
___________ ___________
___________ ___________
______________________ ______________________

To recap, for the impairment study, step one is to determine the over-all fair value of the reporting unit and compare that value with its carry-ing value. If the carrying value of the reporting unit exceeds the new(current) fair value, impairment is indicated and we must then proceed tostep two and determine the fair value of goodwill and other intangible as-sets (under SFAS Nos. 142 and 144).
BUSINESS ENTERPRISE VALUE
SFAS No. 142 requires that an analyst determine fair value first by look-ing at actual market prices of a company’s stock. In this example, thecompany and reporting unit are the same. Since Target Company is pri-vately held, no market prices or multiples are readily available. If thecompany were public, a material decline in the stock price would at leastprovide the rationale for performing further analysis in the step one test.But, as noted earlier, a decline in the stock price, while an indicator of thepotential existence of impairment, likely will not by itself provide an ac-curate measure of permanent impairment. So, for public or private com-panies, further analysis will be necessary.
The next phase of the analysis is the performance of a businessenterprise value (BEV) analysis as of December 31, 2002. The totalfair value of the assets of the reporting unit comprises invested capital(as previously defined), plus current liabilities. Total assets of the re-porting unit include current assets, tangible assets, intangible assets,and goodwill. The purpose of the new BEV is to determine the newfair values of invested capital and thus total assets (after adding non-interest-bearing liabilities) and to provide a framework for the revalua-tion of the other assets. SFAS No. 142 requires that the fair value of allof the assets of the reporting unit be determined as of the date of theimpairment test. However, the only impairment adjustments actuallyrecognized in the financial records are impairment of goodwill and ofindefinitely lived intangible assets under SFAS No. 142 and impair-ment of other long-lived assets under SFAS No. 144. The excess fairvalue over the carrying value of recognized intangibles and the fairvalues of previously unrecognized intangibles, while employed in thecalculation of goodwill impairment, are not recorded in the final year-end accounting adjustments. You can go down, but not up. We beginwith a new DCF analysis as of December 31, 2002. The nature and un-derlying rationale for the DCF assumptions will be discussed through-out the chapter.
Business Enterprise Value 91
DISCOUNTED CASH FLOW APPROACH
In the discounted cash flow approach, a pro forma analysis is made of thesubject company to estimate future available cash flows. Available cashflow is the amount that could be paid out to providers of capital withoutimpairment of business operations.
Principal assumptions utilized in developing the estimates of cashflow are:
• As of December 31, 2002, the outlook is less bullish than a yearago. Sales are now forecast to increase from $56,000,000 in 2002 to$58,800,000 in 2003, representing growth of 5 percent, basedlargely on a decline in the growth rate in one of its key markets anda delay in completing the IPR&D project that was in process as ofDecember 31, 2001. A year ago we were expecting double-digitgrowth for five years. The 10-year compound annual growth rate isforecast at 6.48 percent, down approximately 35 percent from the10-year growth rate forecast a year ago.
• Operating margins before depreciation and amortization are forecastto decline to 27.5 percent in 2003, based on increased costs in 2002.Costs and expenses are expected to be brought back in line with lastyear’s forecast by 2006. In this forecast, cost of sales and operatingexpenses exclude depreciation (tax—separately forecast usingMACRS tables) and amortization.
• Working capital requirements (debt free) are still forecast at 15 per-cent of sales, based on the company’s historical working capital posi-tion and projected needs.
• Capital expenditures are forecast at one percent of net sales. This levelof capital expenditures is considered adequate to support future levelsof sales.
• The tax amortization of total intangible asset value is a knownquantity and remains the same as forecast last year. Section 197 ofthe Internal Revenue Code provides for such amortization over a15-year period. The amortization acts as a tax shield and is addedback to cash flow. Annual amortization is $8,433,000($126,500,000 ÷ 15, rounded). One year later, intangible assetamortization has a 14-year-remaining life, and the residual is ad-justed accordingly (see Chapter 3 for a full discussion).10 Remem-ber, the example in Chapter 3 was of an asset purchase. In a stock
92 Impairment Analysis: A Case Study
purchase, the intangible assets generally would not be amortizablefor tax purposes.
Other assumptions:
Required rate of return (discount rate)* 16.00%Residual perpetual growth rate 5.00%Tax rate 40.00%*Discussed more fully in the “Discount Rate” section of this chapter.
Assumptions, as of December 31, 2002, are summarized in Exhibit 5.1,which presents the forecast cash flows for a period of 10 years.
Cash flows in 2012 were increased by the residual growth rate andthen capitalized into perpetuity by the difference between the discountrate and the residual growth rate. This residual value was then discountedto present value to provide the net present value of the residual cash flow.The residual cash flow represents the expected cash flow for 2013 to per-petuity. The present value of the net cash flows, plus the present value ofthe residual growth rate, provides the total capitalized earnings. TheBEV, as of December 31, 2002, is presented in Exhibit 5.2.
DISCOUNT RATE
The appropriate rate of return in valuing the enterprise is the weightedaverage cost of capital. This rate is typically the weighted average of thereturn on equity capital and the return on debt capital. The weights repre-sent percentages of debt to total capital and equity to total capital. Therate of return on debt capital is adjusted to reflect the fact that interestpayments are tax deductible to the corporation.
At December 31, 2002, the equity discount rate is assumed to be 20percent, rounded, the same as last year (due to the rounding) and the pre-tax cost of debt 6 percent (borrowing rates generally have gone down).Substituting these values into the WACC formula described in Chapter 3provides the following:
WACC = (20.00% × 75.00%) +(6.00%[1 – 40.00%] × 25.00%)= (15.00%) + (3.60% × 25.00%)= 15.00% + 0.90%= 15.90%
Rounded to, 16%
Discount Rate 93
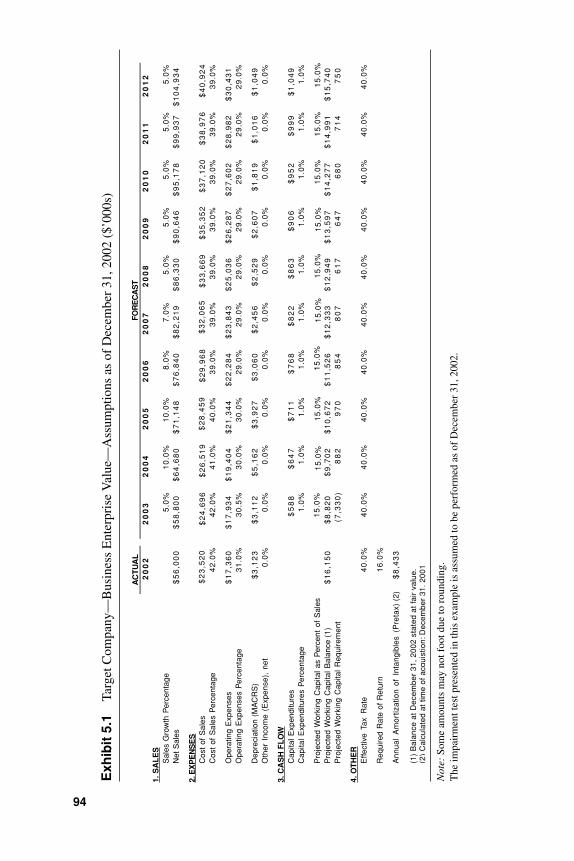
AC
TU
AL
20
02
20
03
20
04
20
05
20
06
20
07
20
08
20
09
20
10
20
11
20
12
1. S
AL
ES
Sal
es G
row
th P
erce
ntag
e5
.0%
10
.0%
10
.0%
8.0
%7
.0%
5.0
%5
.0%
5.0
%5
.0%
5.0
%N
et S
ales
$5
6,0
00
$5
8,8
00
$6
4,6
80
$7
1,1
48
$7
6,8
40
$8
2,2
19
$8
6,3
30
$9
0,6
46
$9
5,1
78
$9
9,9
37
$1
04
,93
4
2. E
XP
EN
SE
SC
ost
of S
ales
$2
3,5
20
$2
4,6
96
$2
6,5
19
$2
8,4
59
$2
9,9
68
$3
2,0
65
$3
3,6
69
$3
5,3
52
$3
7,1
20
$3
8,9
76
$4
0,9
24
Cos
t of
Sal
es P
erce
ntag
e4
2.0
%4
2.0
%4
1.0
%4
0.0
%3
9.0
%3
9.0
%3
9.0
%3
9.0
%3
9.0
%3
9.0
%3
9.0
%
Ope
ratin
g E
xpen
ses
$1
7,3
60
$1
7,9
34
$1
9,4
04
$2
1,3
44
$2
2,2
84
$2
3,8
43
$2
5,0
36
$2
6,2
87
$2
7,6
02
$2
8,9
82
$3
0,4
31
Ope
ratin
g E
xpen
ses
Per
cent
age
31
.0%
30
.5%
30
.0%
30
.0%
29
.0%
29
.0%
29
.0%
29
.0%
29
.0%
29
.0%
29
.0%
Dep
reci
atio
n (M
AC
RS
)$
3,1
23
$3
,11
2$
5,1
62
$3
,92
7$
3,0
60
$2
,45
6$
2,5
29
$2
,60
7$
1,8
19
$1
,01
6$
1,0
49
Oth
er I
ncom
e (E
xpen
se),
net
0.0
%0
.0%
0.0
%0
.0%
0.0
%0
.0%
0.0
%0
.0%
0.0
%0
.0%
0.0
%
3. C
AS
H F
LO
WC
apita
l E
xpen
ditu
res
$5
88
$6
47
$7
11
$7
68
$8
22
$8
63
$9
06
$9
52
$9
99
$1
,04
9C
apita
l E
xpen
ditu
res
Per
cent
age
1
.0%
1.0
%1
.0%
1.0
%1
.0%
1.0
%1
.0%
1.0
%1
.0%
1.0
%
Pro
ject
ed W
orki
ng C
apita
l as
Per
cent
of
Sal
es1
5.0
%P
roje
cted
Wor
king
Cap
ital B
alan
ce (
1)$
16
,15
0$
8,8
20
$9
,70
2$
10
,67
2$
11
,52
6$
12
,33
3$
12
,94
9$
13
,59
7$
14
,27
7$
14
,99
1$
15
,74
0P
roje
cted
Wor
king
Cap
ital
Req
uire
men
t(7
,33
0)
88
29
70
85
48
07
61
76
47
68
07
14
75
0
4. O
TH
ER
Effe
ctiv
e Ta
x R
ate
40
.0%
40
.0%
40
.0%
40
.0%
40
.0%
40
.0%
40
.0%
40
.0%
40
.0%
40
.0%
40
.0%
Req
uire
d R
ate
of R
etur
n1
6.0
%
Ann
ual
Am
ortiz
atio
n of
Int
angi
bles
(P
reta
x) (
2)$
8,4
33
(1)
Bal
ance
at
Dec
embe
r 31
, 20
02 s
tate
d at
fair
val
ue.
(2)
Cal
cula
ted
at t
ime
of a
cqui
stio
n: D
ecem
ber
31,
2001
FOR
EC
AS
T
15
.0%
15
.0%
15
.0%
15
.0%
15
.0%
15
.0%
15
.0%
15
.0%
15
.0%
Exh
ibit
5.1
Targ
et C
ompa
ny—
Bus
ines
s E
nter
pris
e V
alue
—A
ssum
ptio
ns a
s of
Dec
embe
r 31
, 200
2 ($
’000
s)
Not
e:So
me
amou
nts
may
not
foo
t due
to r
ound
ing.
The
impa
irm
ent t
est p
rese
nted
in th
is e
xam
ple
is a
ssum
ed to
be
perf
orm
ed a
s of
Dec
embe
r 31
, 200
2.
94
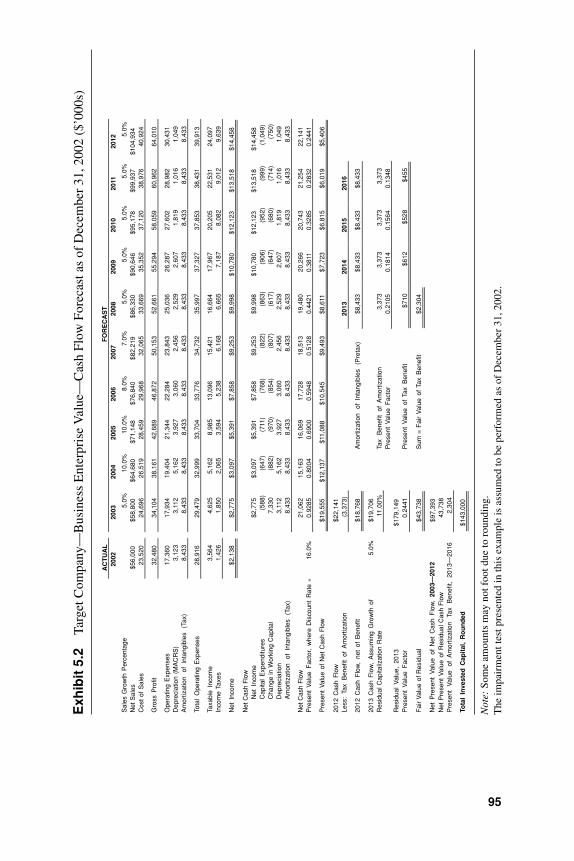
AC
TU
AL
2002
2003
2004
2005
2006
2007
2008
2009
2010
2011
2012
Sal
es G
row
th P
erce
ntag
e5.
0%10
.0%
10.0
%8.
0%7.
0%5.
0%5.
0%5.
0%5.
0%5.
0%N
et S
ales
$56,
000
$58,
800
$64,
680
$71,
148
$76,
840
$82,
219
$86,
330
$90,
646
$95,
178
$99,
937
$104
,934
Cos
t of
Sal
es23
,520
24
,696
26
,519
28
,459
29,9
68
32
,065
33,6
69
35,3
52
37,1
20
38,9
76
40,9
24
Gro
ss P
rofit
32,4
80
34,1
04
38,1
61
42,6
89
46
,872
50,1
53
52
,661
55
,294
58
,059
60
,962
64
,010
Ope
ratin
g E
xpen
ses
17,3
60
17,9
34
19,4
04
21,3
44
22
,284
23,8
43
25
,036
26
,287
27
,602
28
,982
30
,431
Dep
reci
atio
n (M
AC
RS
)3,
123
3,11
2
5,
162
3,92
7
3,06
0
2,45
6
2,52
9
2,
607
1,81
9
1,
016
1,04
9A
mor
tizat
ion
of I
ntan
gibl
es
(Tax
)8,
433
8,43
3
8,
433
8,43
3
8,43
3
8,43
3
8,43
3
8,
433
8,43
3
8,
433
8,43
3
Tota
l O
pera
ting
Exp
ense
s28
,916
29
,479
32
,999
33
,704
33,7
76
34
,732
35,9
97
37,3
27
37,8
53
38,4
31
39,9
13
Taxa
ble
Inco
me
3,56
4
4,
625
5,16
2
8,
985
13
,096
15,4
21
16
,664
17
,967
20
,205
22
,531
24
,097
Inco
me
Taxe
s1,
426
1,85
0
2,
065
3,59
4
5,23
8
6,16
8
6,66
5
7,
187
8,08
2
9,
012
9,63
9
Net
Inc
ome
$2,1
38$2
,775
$3,0
97$5
,391
$7,8
58$9
,253
$9,9
98$1
0,78
0$1
2,12
3$1
3,51
8$1
4,45
8
Net
Cas
h F
low
Net
Inc
ome
$2,7
75$3
,097
$5,3
91$7
,858
$9,2
53$9
,998
$10,
780
$12,
123
$13,
518
$14,
458
Cap
ital
Exp
endi
ture
s(5
88)
(647
)(7
11)
(768
)(8
22)
(863
)(9
06)
(952
)(9
99)
(1,0
49)
Cha
nge
in W
orki
ng C
apita
l7,
330
(882
)(9
70)
(854
)(8
07)
(617
)(6
47)
(680
)(7
14)
(750
)D
epre
ciat
ion
3,11
25,
162
3,92
73,
060
2,45
62,
529
2,60
71,
819
1,01
61,
049
Am
ortiz
atio
n of
Int
angi
bles
(T
ax)
8,43
38,
433
8,43
38,
433
8,43
38,
433
8,43
38,
433
8,43
38,
433
Net
Cas
h F
low
21,0
62
15,1
63
16,0
69
17
,728
18,5
13
19
,480
20
,266
20
,743
21
,254
22
,141
Pre
sent
Val
ue F
acto
r, w
here
Dis
coun
t R
ate
=16
.0%
0.92
850.
8004
0.69
000.
5948
0.51
280.
4421
0.38
110.
3285
0.28
320.
2441
Pre
sent
Val
ue o
f N
et C
ash
Flo
w$1
9,55
5$1
2,13
7$1
1,08
8$1
0,54
5$9
,493
$8,6
11$7
,723
$6,8
15$6
,019
$5,4
06
2012
Cas
h F
low
$22,
141
Less
: Ta
x B
enef
it of
Am
ortiz
atio
n(3
,373
)20
1320
1420
1520
16
2012
Cas
h F
low
, ne
t of
Ben
efit
$18,
768
Am
ortiz
atio
n of
Int
angi
bles
(P
reta
x)$8
,433
$8,4
33$8
,433
$8,4
33
2013
Cas
h F
low
, A
ssum
ing
Gro
wth
of
5.0%
$19,
706
Res
idua
l Cap
italiz
atio
n R
ate
11.0
0%Ta
x B
enef
it of
Am
ortiz
atio
n3,
373
3,37
3
3,
373
3,37
3P
rese
nt V
alue
Fac
tor
0.21
050.
1814
0.15
640.
1348
Res
idua
l V
alue
, 20
13$1
79,1
49P
rese
nt V
alue
Fac
tor
0.24
41P
rese
nt V
alue
of
Tax
Ben
efit
$710
$612
$528
$455
Fai
r V
alue
of R
esid
ual
$43,
738
Sum
= F
air
Val
ue o
f Ta
x B
enef
it$2
,304
Net
Pre
sent
Val
ue o
f N
et C
ash
Flo
w,
2003
—20
12$9
7,39
3N
et P
rese
nt V
alue
of
Res
idua
l Cas
h F
low
43,7
38P
rese
nt
Val
ue
of A
mor
tizat
ion
Tax
Ben
efit,
20
13—
2016
2,30
4
Tota
l In
vest
ed C
apit
al,
Ro
un
ded
$143
,000
FO
RE
CA
ST
Exh
ibit
5.2
Targ
et C
ompa
ny—
Bus
ines
s E
nter
pris
e V
alue
—C
ash
Flow
For
ecas
t as
of D
ecem
ber
31, 2
002
($’0
00s)
Not
e:So
me
amou
nts
may
not
foo
t due
to r
ound
ing.
The
impa
irm
ent t
est p
rese
nted
in th
is e
xam
ple
is a
ssum
ed to
be
perf
orm
ed a
s of
Dec
embe
r 31
, 200
2.
95
Applying the cost of capital to cash flows estimated earlier indicatesthe fair value of the invested capital of Target Company on the valuationdate was $143,000,000 (Exhibit 5.2).
VALUATION OF CURRENT AND TANGIBLE ASSETS
Current Assets
As discussed in Chapter 3, the valuation of current assets requires coop-eration between the analyst and auditor. Certain financial and other cur-rent assets are the province of the auditor, and the purchase priceallocation should rely in part on audit conclusions for certain assets, suchas cash and receivables. Marketable securities must be marked to market,often by simply obtaining brokerage statements. Previously recognizedintangibles that represent capitalized historic expenditures, such as orga-nization costs, are typically written off. The actual cash flow associatedwith these assets occurred in the past, and these assets typically cannot beseparated or sold apart from the acquired entity as required under SFASNo. 141. Any other previously recorded intangible value is again sub-sumed in the current purchase price allocation.
The carrying values of the current assets as of December 31, 2002,are:
Asset Carrying ValueCash $ 2,850,000Marketable securities 7,000,000Accounts receivable 13,000,000Inventory 10,500,000Prepaid expenses 2,500,000
Total current asset carrying value $35,850,000
Fixed Assets
As has already been pointed out, very few business analysts have the ex-perience and training to operate outside their disciplines to render valua-tion opinions on fixed assets. Usually, the real estate and personalproperty must be independently appraised. In this example, it is assumedthat the real estate appraiser who determined the fair value of the land
96 Impairment Analysis: A Case Study
____________________
and improvements to be $22,000,000 performed an update and the fairvalue as of December 31, 2002 is $23,000,000. The fair value of the ma-chinery and equipment is assumed to remain unchanged at $19,000,000.
VALUATION OF INTANGIBLE ASSETS
Software
In reviewing the company’s software system, there were two new mod-ules developed in 2002, changing the total to 22 modules, each made upof a number of programs written in C++ programming language. Thenew line count is 332,980, up from 294,980 at December 31, 2001.
The next step is to determine the productivity with which the hypo-thetical recreation effort would take place. Again, management assessed aproductivity rating of 1 to 3, with the same rates: Software rated 1 couldbe programmed at four lines of code per hour; software rated at 2 couldbe programmed at three lines of code per hour; and software rated 3, themost complex and difficult, could be programmed at two lines of codeper hour.
Coding rates were assigned to the new modules and the calculationdone as before. By dividing the lines of code by the coding rate, the num-ber of hours to recreate totaled 126,840 hours for the entire system, upfrom 112,507 a year ago. The sum of hours was then multiplied by theblended hourly rate (fully burdened) of $125 per hour, an increase overthe cost of $119 per hour calculated last year. Reproduction cost of thesoftware system was determined by multiplying the total number ofhours to recreate by the blended hourly rate. This amount totals$15,855,000.
If the software had been new as of the valuation date, the reproduc-tion cost equates to brand-new software. As before, an obsolescence fac-tor was applied to the reproduction cost to recognize the fact that theacquired software is not brand-new. Rather, it may have redundant or ex-traneous code and likely has been patched over the years and containsother inefficiencies that brand-new software presumably would not have.This year the obsolescence factor is estimated at 30 percent, as the con-tinued aging of the old modules more than offsets the addition of the new modules. The obsolescence factor brings the replacement cost to$11,098,500. This value is then adjusted for taxes to recognize the de-ductibility of such expenses. The after-tax value is $6,659,100. Added tothis amount is an amortization benefit, which reflects the additional value
Valuation of Intangible Assets 97
of the ability to deduct the amortization of the asset over its 15-year taxlife (for fair value it is assumed the asset is bought in a current transac-tion11 and amortized over a new 15-year period). Based on the cost ap-proach, and after adjusting for taxes and amortization benefit, it wasconcluded that the fair value of the software as of December 31, 2002,was $7,810,000 (rounded) (Exhibit 5.3). One year later, the remaininguseful life of the asset is three years.
Asset appreciation that may be determined during the course of an im-pairment analysis goes unrecognized. The fair value of Target Company’ssoftware is $7,810,000, which exceeds the carrying value of $5,300,000($7,070,000 less one year of straight-line amortization over a four-year life,rounded [see Exhibit 5.12] later in the chapter). The excess of the asset’sfair value over its carrying value is not recognized. However, the currentamount will be used internally to represent the fair value of the asset for thepurpose of assessing contributory asset charges, which represent rentalcharges on certain intangible assets valued using the income approach.
Customer Base
To revalue the customer base as of December 31, 2002, the same cost ap-proach methodology was used as employed last year (see Chapter 3 for adiscussion of the cost and income approaches as they pertain to valuing acustomer base). The total selling costs for the years ended December 31,1999 to December 31, 2002 (there was an additional year’s informationas of the date of the impairment study) were calculated based on inter-nally prepared financial statements and sales department detail, whichwas provided by management. In each year, the percentage of total rev-enue from new customers was determined. That percentage was appliedto the company’s total selling costs for each year to determine new cus-tomer selling cost.
These expenses were $61,100 in 2002, $123,246 in 2001,$119,938 in 2000, and $216,221 in 1999 for a total of $520,505 for thefour years, during which 16 new customers were obtained. The after-tax selling costs were $312,303, or $19,519 per customer, determinedby dividing after-tax selling costs by the 16 new customers obtainedduring the period. Multiplying the replacement cost per new customertimes the 254 customers (a net decline of seven compared to last year)in the acquired customer base as of the date of the impairment studyprovides a replacement cost of the customer base of $4,957,826. Noobsolescence is recognized for this asset. The amortization benefit is
98 Impairment Analysis: A Case Study

Valuation of Intangible Assets 99
LINES OF HOURS TOIN PLACE CODE RATING (1) RATE (1) RECREATEModule 1 26,400 2 3.0 8,800Module 2 32,600 3 2.0 16,300Module 3 46,000 1 4.0 11,500Module 4 8,480 3 2.0 4,240Module 5 12,000 3 2.0 6,000Module 6 12,500 2 3.0 4,167Module 7 2,000 2 3.0 6 6 7Module 8 32,000 2 3.0 10,667Module 9 3,000 2 3.0 1,000Module 10 3,000 2 3.0 1,000Module 11 3,000 2 3.0 1,000Module 12 13,000 2 3.0 4,333Module 13 6,000 2 3.0 2,000Module 14 10,000 2 3.0 3,333Module 15 5,000 2 3.0 1,667Module 16 6,000 2 3.0 2,000Module 17 5,000 3 2.0 2,500Module 18 8,000 1 4.0 2,000Module 19 7,000 2 3.0 2,333Module 20 54,000 3 2.0 27,000Module 21 10,000 3 2.0 5,000Module 22 28,000 2 3.0 9,333
Total Number of Lines 332,980Total Number of Hours to Recreate 126,840Times: Blended Hourly Rate (see below) $125
Reproduction Cost $15,855,000Less: Obsolescence (2) 30.0% (4,756,500)
Replacement Cost $11,098,500Less: Taxes @ 40.0% (4,439,400)
After-Tax Value Before Amortization Benefit $6,659,100
Amortization BenefitDiscount Rate 18.0%Tax Rate 40.0%Tax Amortization Period 15
Amortization Benefit 1,152,068
Fair Value of Software, Rounded $7,810,000
remaining economic lives of system.
SOFTWARE DEVELOPMENT COSTS - ESTIMATED PROJECT TEAMBURDENED
FUNCTION NUMBER HOURLY RATEProject Manager 1 210.00$ Systems Analyst 2 160.00Technical Writer 1 130.00Programmer 4 120.00Support 2 55.00
Blended Hourly Rate, Rounded $125.00
(1) Lines of code per hour, based on productivity assessment for average module of programming.(2) Estimate based on number of lines of redundant/extraneous code and effective age and
All software was developed internally by Company for its own use. Rights to software were transferred at acquisition.
The software is written in C++ programming language.
Valuation is based on cost to replace less obsolescence. Costs are based on internally developed Company metrics for software development productivity.
Source: Leonard Riles, Director of Product Development
PRODUCTIVITY
Exhibit 5.3 Target Company—Valuation of Acquired Software as ofDecember 31, 2002 ($’000s)
Note: Some amounts may not foot due to rounding.The impairment test presented in this example is assumed to be performed as of December 31, 2002.
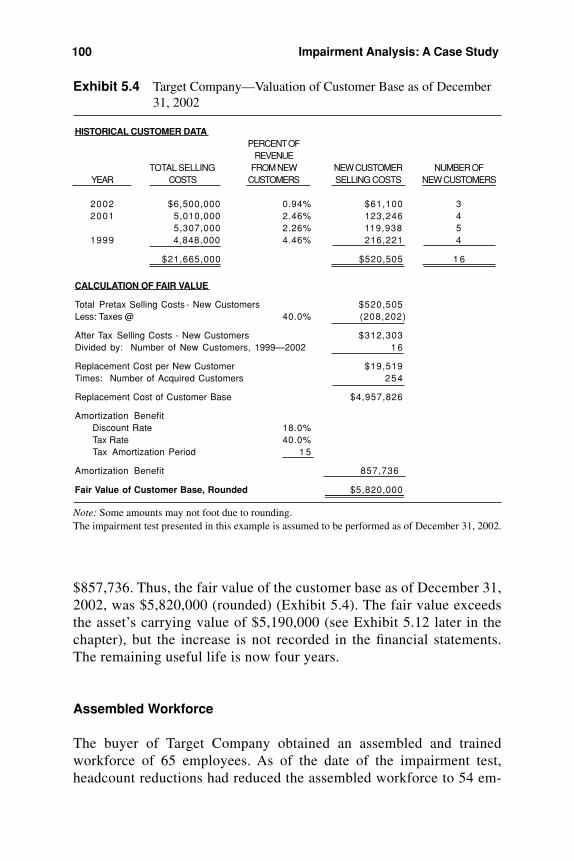
$857,736. Thus, the fair value of the customer base as of December 31,2002, was $5,820,000 (rounded) (Exhibit 5.4). The fair value exceedsthe asset’s carrying value of $5,190,000 (see Exhibit 5.12 later in thechapter), but the increase is not recorded in the financial statements.The remaining useful life is now four years.
Assembled Workforce
The buyer of Target Company obtained an assembled and trainedworkforce of 65 employees. As of the date of the impairment test,headcount reductions had reduced the assembled workforce to 54 em-
100 Impairment Analysis: A Case Study
HISTORICAL CUSTOMER DATAPERCENT OF
REVENUETOTAL SELLING FROM NEW NEW CUSTOMER NUMBER OF
YEAR COSTS CUSTOMERS SELLING COSTS NEW CUSTOMERS
2002 $6,500,000 0.94% $61,100 32001 5,010,000 2.46% 123,246 4
5,307,000 2.26% 119,938 51999 4,848,000 4.46% 216,221 4
$21,665,000 $520,505 1 6
CALCULATION OF FAIR VALUE
Total Pretax Selling Costs - New Customers $520,505Less: Taxes @ 40.0% (208,202)
After Tax Selling Costs - New Customers $312,303Divided by: Number of New Customers, 1999—2002 1 6
Replacement Cost per New Customer $19,519Times: Number of Acquired Customers 254
Replacement Cost of Customer Base $4,957,826
Amortization BenefitDiscount Rate 18.0%Tax Rate 40.0%Tax Amortization Period 1 5
Amortization Benefit 857,736
Fair Value of Customer Base, Rounded $5,820,000
Exhibit 5.4 Target Company—Valuation of Customer Base as of December31, 2002
Note: Some amounts may not foot due to rounding.The impairment test presented in this example is assumed to be performed as of December 31, 2002.
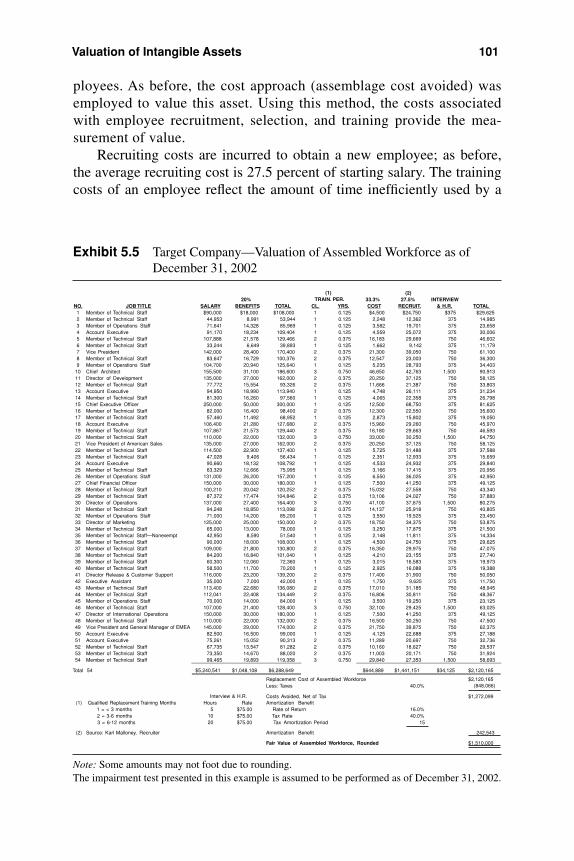
ployees. As before, the cost approach (assemblage cost avoided) wasemployed to value this asset. Using this method, the costs associatedwith employee recruitment, selection, and training provide the mea-surement of value.
Recruiting costs are incurred to obtain a new employee; as before,the average recruiting cost is 27.5 percent of starting salary. The trainingcosts of an employee reflect the amount of time inefficiently used by a
Valuation of Intangible Assets 101
(2)20% 33.3% 27.5% INTERVIEW
NO. JOB TITLE SALARY BENEFITS TOTAL CL. YRS. COST RECRUIT. & H.R. TOTAL1 Member of Technical Staff $90,000 $18,000 $108,000 1 0.125 $4,500 $24,750 $375 $29,6252 Member of Technical Staff 44,953 8,991 53,944 1 0.125 2,248 12,362 375 14,9853 Member of Operations Staff 71,641 14,328 85,969 1 0.125 3,582 19,701 375 23,6584 Account Executive 91,170 18,234 109,404 1 0.125 4,559 25,072 375 30,0065 Member of Technical Staff 107,888 21,578 129,466 2 0.375 16,183 29,669 750 46,6026 Member of Technical Staff 33,244 6,649 39,893 1 0.125 1,662 9,142 375 11,1797 Vice President 142,000 28,400 170,400 2 0.375 21,300 39,050 750 61,1008 Member of Technical Staff 83,647 16,729 100,376 2 0.375 12,547 23,003 750 36,3009 Member of Operations Staff 104,700 20,940 125,640 1 0.125 5,235 28,793 375 34,403
10 Chief Architect 155,500 31,100 186,600 3 0.750 46,650 42,763 1,500 90,91311 Director of Development 135,000 27,000 162,000 2 0.375 20,250 37,125 750 58,12512 Member of Technical Staff 77,772 15,554 93,326 2 0.375 11,666 21,387 750 33,80313 Account Executive 94,950 18,990 113,940 1 0.125 4,748 26,111 375 31,23414 Member of Technical Staff 81,300 16,260 97,560 1 0.125 4,065 22,358 375 26,79815 Chief Executive Officer 250,000 50,000 300,000 1 0.125 12,500 68,750 375 81,62516 Member of Technical Staff 82,000 16,400 98,400 2 0.375 12,300 22,550 750 35,60017 Member of Technical Staff 57,460 11,492 68,952 1 0.125 2,873 15,802 375 19,05018 Account Executive 106,400 21,280 127,680 2 0.375 15,960 29,260 750 45,97019 Member of Technical Staff 107,867 21,573 129,440 2 0.375 16,180 29,663 750 46,59320 Member of Technical Staff 110,000 22,000 132,000 3 0.750 33,000 30,250 1,500 64,75021 Vice President of American Sales 135,000 27,000 162,000 2 0.375 20,250 37,125 750 58,12522 Member of Technical Staff 114,500 22,900 137,400 1 0.125 5,725 31,488 375 37,58823 Member of Technical Staff 47,028 9,406 56,434 1 0.125 2,351 12,933 375 15,65924 Account Executive 90,660 18,132 108,792 1 0.125 4,533 24,932 375 29,84025 Member of Technical Staff 63,329 12,666 75,995 1 0.125 3,166 17,415 375 20,95626 Member of Operations Staff 131,000 26,200 157,200 1 0.125 6,550 36,025 375 42,95027 Chief Financial Officer 150,000 30,000 180,000 1 0.125 7,500 41,250 375 49,12528 Member of Technical Staff 100,210 20,042 120,252 2 0.375 15,032 27,558 750 43,34029 Member of Technical Staff 87,372 17,474 104,846 2 0.375 13,106 24,027 750 37,88330 Director of Operations 137,000 27,400 164,400 3 0.750 41,100 37,675 1,500 80,27531 Member of Technical Staff 94,248 18,850 113,098 2 0.375 14,137 25,918 750 40,80532 Member of Operations Staff 71,000 14,200 85,200 1 0.125 3,550 19,525 375 23,45033 Director of Marketing 125,000 25,000 150,000 2 0.375 18,750 34,375 750 53,87534 Member of Technical Staff 65,000 13,000 78,000 1 0.125 3,250 17,875 375 21,50035 Member of Technical Staff—Nonexempt 42,950 8,590 51,540 1 0.125 2,148 11,811 375 14,33436 Member of Technical Staff 90,000 18,000 108,000 1 0.125 4,500 24,750 375 29,62537 Member of Technical Staff 109,000 21,800 130,800 2 0.375 16,350 29,975 750 47,07538 Member of Technical Staff 84,200 16,840 101,040 1 0.125 4,210 23,155 375 27,74039 Member of Technical Staff 60,300 12,060 72,360 1 0.125 3,015 16,583 375 19,97340 Member of Technical Staff 58,500 11,700 70,200 1 0.125 2,925 16,088 375 19,38841 Director Release & Customer Support 116,000 23,200 139,200 2 0.375 17,400 31,900 750 50,05042 Executive Assistant 35,000 7,000 42,000 1 0.125 1,750 9,625 375 11,75043 Member of Technical Staff 113,400 22,680 136,080 2 0.375 17,010 31,185 750 48,94544 Member of Technical Staff 112,041 22,408 134,449 2 0.375 16,806 30,811 750 48,36745 Member of Operations Staff 70,000 14,000 84,000 1 0.125 3,500 19,250 375 23,12546 Member of Technical Staff 107,000 21,400 128,400 3 0.750 32,100 29,425 1,500 63,02547 Director of International Operations 150,000 30,000 180,000 1 0.125 7,500 41,250 375 49,12548 Member of Technical Staff 110,000 22,000 132,000 2 0.375 16,500 30,250 750 47,50049 Vice President and General Manager of EMEA 145,000 29,000 174,000 2 0.375 21,750 39,875 750 62,37550 Account Executive 82,500 16,500 99,000 1 0.125 4,125 22,688 375 27,18851 Account Executive 75,261 15,052 90,313 2 0.375 11,289 20,697 750 32,73652 Member of Technical Staff 67,735 13,547 81,282 2 0.375 10,160 18,627 750 29,53753 Member of Technical Staff 73,350 14,670 88,020 2 0.375 11,003 20,171 750 31,92454 Member of Technical Staff 99,465 19,893 119,358 3 0.750 29,840 27,353 1,500 58,693
Total 54 $5,240,541 $1,048,108 $6,288,649 $644,889 $1,441,151 $34,125 $2,120,165
Replacement Cost of Assembled Workforce $2,120,165Less: Taxes 40.0% (848,066)
Costs Avoided, Net of Tax $1,272,099(1) Qualified Replacement Training Months Hours Rate Amortization Benefit
1 = < 3 months 5 $75.00 Rate of Return 16.0% 2 = 3-6 months 10 $75.00 Tax Rate 40.0% 3 = 6-12 months 20 $75.00 Tax Amortization Period 15
(2) Source: Karl Malloney, Recruiter Amortization Benefit 242,543
Fair Value of Assembled Workforce, Rounded $1,510,000
TRAIN. PER.(1)
Interview & H.R.
Exhibit 5.5 Target Company—Valuation of Assembled Workforce as ofDecember 31, 2002
Note: Some amounts may not foot due to rounding.The impairment test presented in this example is assumed to be performed as of December 31, 2002.
new employee (inefficiency training cost) and the time inefficiently usedby a training supervisor (direct training cost) during the first few monthson the job. Training costs were estimated by multiplying the fully bur-dened weekly salary of the employee or supervisor by the averageamount of inefficiency incurred during the training period. The ineffi-ciency estimate remains at 33.3 percent. Interview costs were estimatedin the same manner as last year’s analysis (shown in Chapter 3).
The summation of the hiring and training costs results in the totalcost to replace the assembled workforce are summarized in Exhibit 5.5.Based on the cost approach, and after adjusting for taxes at 40 percentand adding an amortization benefit, the fair value of the assembled work-force is estimated to be $1,510,000 (rounded) at December 31, 2002. Noobsolescence is recognized for this asset (Exhibit 5.5).
SFAS No. 141 specifically prohibits the recognition of assembledworkforce as an intangible asset apart from goodwill. However, in the ap-plication of the excess earnings approach, which is used to value TargetCompany’s technology and in-process research and development, “re-turns on” are taken on the fair values of all of the contributory assets ac-quired in the acquisition. The value of the assembled workforce iscalculated so that such a return may be taken. However, its fair value isincluded in goodwill in the final allocation of purchase price.
Trade Name
As discussed earlier, Target Company has one valuable trade name. All ofthe company’s products and services are sold under the X trade name, andeach major product is identified by this trade name.
The relief from royalty method was employed. A royalty rate of fourpercent is again applicable, stated as a percentage of sales. Applying thissame rate to a lower sales forecast obviously results in a lower fair valueas of December 31, 2002.
The rights to use the trade name transfer to the buyer in perpetuity,giving it an indefinite life. The fair value of the trade name is the presentvalue of the royalties forecast for the five-year period of 2003 to 2007,plus the present value of the residual at the end of the five-year period,plus the amortization benefit. A 16 percent rate of return was again cho-sen to reflect a risk assessment that the trade name was about as risky asthe business overall. Based on the analysis as presented in Exhibit 5.6,the fair value of the trade name as of the valuation date was$18,450,000. The carrying value is $23,760,000 (see Exhibit 5.12 later
102 Impairment Analysis: A Case Study
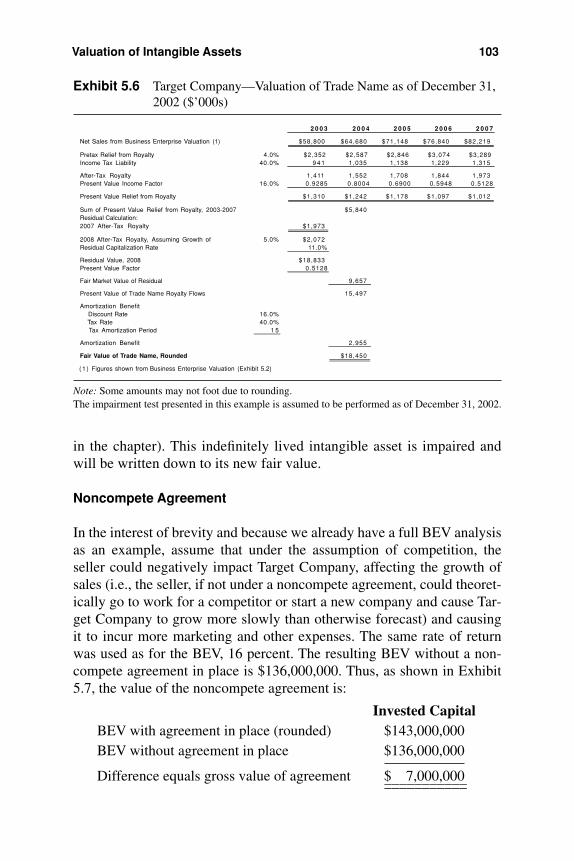
in the chapter). This indefinitely lived intangible asset is impaired andwill be written down to its new fair value.
Noncompete Agreement
In the interest of brevity and because we already have a full BEV analysisas an example, assume that under the assumption of competition, theseller could negatively impact Target Company, affecting the growth ofsales (i.e., the seller, if not under a noncompete agreement, could theoret-ically go to work for a competitor or start a new company and cause Tar-get Company to grow more slowly than otherwise forecast) and causingit to incur more marketing and other expenses. The same rate of returnwas used as for the BEV, 16 percent. The resulting BEV without a non-compete agreement in place is $136,000,000. Thus, as shown in Exhibit5.7, the value of the noncompete agreement is:
Invested CapitalBEV with agreement in place (rounded) $143,000,000BEV without agreement in place $136,000,000
Difference equals gross value of agreement $ 7,000,000
Valuation of Intangible Assets 103
2 0 0 3 2 0 0 4 2 0 0 5 2 0 0 6 2 0 0 7
Net Sales from Business Enterprise Valuation (1) $58,800 $64,680 $71,148 $76,840 $82,219
Pretax Relief from Royalty 4.0% $2,352 $2,587 $2,846 $3,074 $3,289Income Tax Liability 40.0% 9 4 1 1,035 1,138 1,229 1,315
After-Tax Royalty 1,411 1,552 1,708 1,844 1,973Present Value Income Factor 16.0% 0.9285 0.8004 0.6900 0.5948 0.5128
Present Value Relief from Royalty $1,310 $1,242 $1,178 $1,097 $1,012
Sum of Present Value Relief from Royalty, 2003-2007 $5,840Residual Calculation:2007 After-Tax Royalty $1,973
2008 After-Tax Royalty, Assuming Growth of 5.0% $2,072Residual Capitalization Rate 11.0%
Residual Value, 2008 $18,833Present Value Factor 0.5128
Fair Market Value of Residual 9,657
Present Value of Trade Name Royalty Flows 15,497
Amortization Benefit Discount Rate 16.0% Tax Rate 40.0% Tax Amortization Period 1 5
Amortization Benefit 2,955
Fair Value of Trade Name, Rounded $18,450
( 1 ) Figures shown from Business Enterprise Valuation (Exhibit 5.2)
Exhibit 5.6 Target Company—Valuation of Trade Name as of December 31,2002 ($’000s)
Note: Some amounts may not foot due to rounding.The impairment test presented in this example is assumed to be performed as of December 31, 2002.
______________________
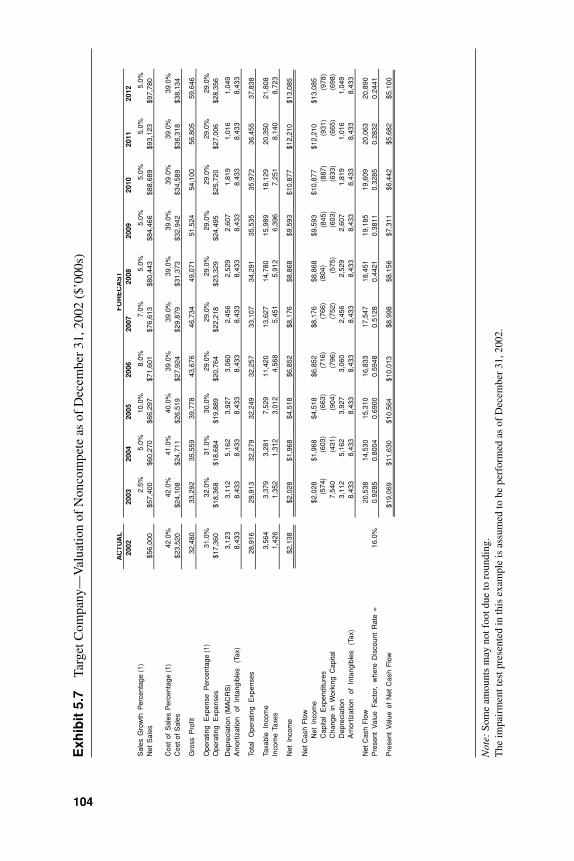
AC
TU
AL
2002
2003
2004
2005
2006
2007
2008
2009
2010
2011
2012
Sal
es G
row
th P
erce
ntag
e (1
)2.
5%5.
0%10
.0%
8.0%
7.0%
5.0%
5.0%
5.0%
5.0%
5.0%
Net
Sal
es$5
6,00
0$5
7,40
0$6
0,27
0$6
6,29
7$7
1,60
1$7
6,61
3$8
0,44
3$8
4,46
6$8
8,68
9$9
3,12
3$9
7,78
0
Cos
t of
Sal
es P
erce
ntag
e (1
)42
.0%
42.0
%41
.0%
40.0
%39
.0%
39.0
%39
.0%
39.0
%39
.0%
39.0
%39
.0%
Cos
t of
Sal
es$2
3,52
0$2
4,10
8$2
4,71
1$2
6,51
9$2
7,92
4$2
9,87
9$3
1,37
3$3
2,94
2$3
4,58
9$3
6,31
8$3
8,13
4
Gro
ss P
rofit
32,4
80
33,2
92
35,5
59
39,7
78
43,6
76
46,7
34
49
,071
51
,524
54
,100
56
,805
59
,646
Ope
ratin
g E
xpen
se P
erce
ntag
e (1
)31
.0%
32.0
%31
.0%
30.0
%29
.0%
29.0
%29
.0%
29.0
%29
.0%
29.0
%29
.0%
Ope
ratin
g E
xpen
ses
$17,
360
$18,
368
$18,
684
$19,
889
$20,
764
$22,
218
$23,
329
$24,
495
$25,
720
$27,
006
$28,
356
Dep
reci
atio
n (M
AC
RS
)3,
123
3,11
2
5,
162
3,92
7
3,
060
2,45
6
2,52
9
2,
607
1,81
9
1,
016
1,04
9A
mor
tizat
ion
of I
ntan
gibl
es
(Tax
)8,
433
8,43
3
8,
433
8,43
3
8,
433
8,43
3
8,43
3
8,
433
8,43
3
8,
433
8,43
3
Tota
l O
pera
ting
Exp
ense
s28
,916
29
,913
32
,279
32
,249
32
,257
33
,107
34,2
91
35,5
35
35,9
72
36,4
55
37,8
38
Taxa
ble
Inco
me
3,56
4
3,
379
3,28
1
7,
529
11,4
20
13,6
27
14
,780
15
,989
18
,129
20
,350
21
,808
Inco
me
Taxe
s1,
426
1,35
2
1,
312
3,01
2
4,
568
5,45
1
5,91
2
6,
396
7,25
1
8,
140
8,72
3
Net
Inc
ome
$2,1
38$2
,028
$1,9
68$4
,518
$6,8
52$8
,176
$8,8
68$9
,593
$10,
877
$12,
210
$13,
085
Net
Cas
h F
low
Net
Inc
ome
$2,0
28$1
,968
$4,5
18$6
,852
$8,1
76$8
,868
$9,5
93$1
0,87
7$1
2,21
0$1
3,08
5C
apita
l E
xpen
ditu
res
(574
)(6
03)
(663
)(7
16)
(766
)(8
04)
(845
)(8
87)
(931
)(9
78)
Cha
nge
in W
orki
ng C
apita
l7,
540
(431
)(9
04)
(796
)(7
52)
(575
)(6
03)
(633
)(6
65)
(698
)D
epre
ciat
ion
3,11
25,
162
3,92
73,
060
2,45
62,
529
2,60
71,
819
1,01
61,
049
Am
ortiz
atio
n of
Int
angi
bles
(T
ax)
8,43
38,
433
8,43
38,
433
8,43
38,
433
8,43
38,
433
8,43
38,
433
Net
Cas
h F
low
20,5
38
14,5
30
15,3
10
16,8
33
17,5
47
18
,451
19
,185
19
,609
20
,063
20
,890
Pre
sent
Val
ue F
acto
r, w
here
Dis
coun
t R
ate
=16
.0%
0.92
850.
8004
0.69
000.
5948
0.51
280.
4421
0.38
110.
3285
0.28
320.
2441
Pre
sent
Val
ue o
f N
et C
ash
Flo
w$1
9,06
9$1
1,63
0$1
0,56
4$1
0,01
3$8
,998
$8,1
56$7
,311
$6,4
42$5
,682
$5,1
00
FO
RE
CA
ST
Exh
ibit
5.7
Targ
et C
ompa
ny—
Val
uatio
n of
Non
com
pete
as
of D
ecem
ber
31, 2
002
($’0
00s)
Not
e:So
me
amou
nts
may
not
foo
t due
to r
ound
ing.
The
impa
irm
ent t
est p
rese
nted
in th
is e
xam
ple
is a
ssum
ed to
be
perf
orm
ed a
s of
Dec
embe
r 31
, 200
2.
104
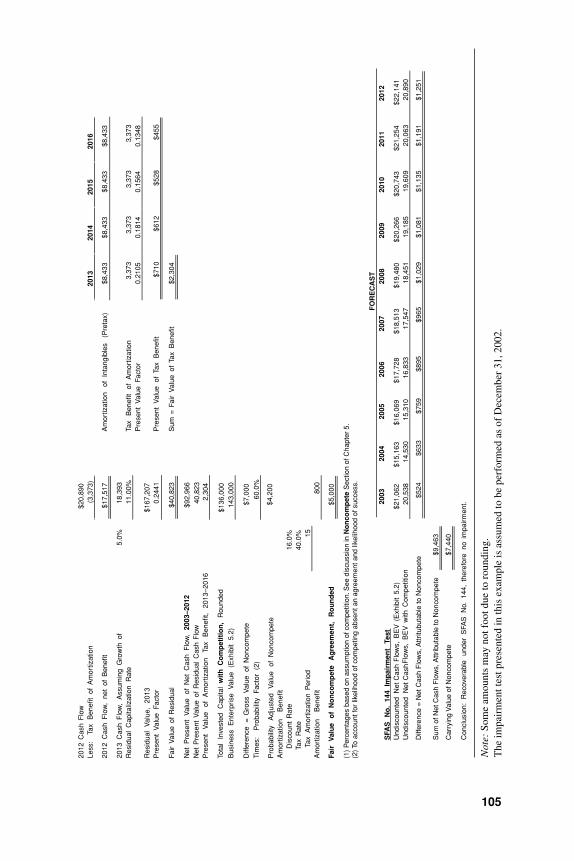
2012
Cas
h F
low
$20,
890
Less
: T
ax
Ben
efit
of A
mor
tizat
ion
(3,3
73)
20
1320
1420
1520
16
2012
Cas
h F
low
, ne
t of
Ben
efit
$17,
517
Am
ortiz
atio
n of
Int
angi
bles
(P
reta
x)$8
,433
$8,4
33$8
,433
$8,4
33
2013
Cas
h F
low
, A
ssum
ing
Gro
wth
of
5.0%
18,3
93R
esid
ual
Cap
italiz
atio
n R
ate
11.0
0%Ta
x B
enef
it of
Am
ortiz
atio
n3,
373
3,37
3
3,
373
3,37
3P
rese
nt V
alue
Fac
tor
0.21
050.
1814
0.15
640.
1348
Res
idua
l V
alue
, 20
13$1
67,2
07P
rese
nt V
alue
Fac
tor
0.24
41P
rese
nt V
alue
of
Tax
Ben
efit
$710
$612
$528
$455
Fair
Val
ue o
f R
esid
ual
$40,
823
Sum
= F
air
Val
ue o
f Ta
x B
enef
it$2
,304
Net
Pre
sent
Val
ue
of N
et C
ash
Flo
w,
2003
–201
2$9
2,96
6N
et P
rese
nt V
alue
of
Res
idua
l C
ash
Flo
w40
,823
Pre
sent
V
alue
of
Am
ortiz
atio
n Ta
x B
enef
it,
2013
–201
62,
304
Tota
l In
vest
ed
Cap
ital
wit
h C
om
pet
itio
n,
Rou
nded
$136
,000
Bus
ines
s E
nter
pris
e V
alue
(E
xhib
it 5.
2)14
3,00
0
Diff
eren
ce =
Gro
ss V
alue
of
Non
com
pete
$7,0
00T
imes
: P
roba
bilit
y Fa
ctor
(2)
60.0
%
Pro
babi
lity
Adj
uste
d V
alue
of
Non
com
pete
$4,2
00
Am
ortiz
atio
n B
enef
it
D
isco
unt
Rat
e16
.0%
Tax
Rat
e40
.0%
Tax
Am
ortiz
atio
n P
erio
d15
Am
ortiz
atio
n B
enef
it80
0
Fair
V
alu
e o
f N
on
com
pet
e A
gre
emen
t, R
ou
nd
ed$5
,000
(1)
Per
cent
ages
bas
ed o
n as
sum
ptio
n of
com
petit
ion.
See
dis
cuss
ion
in N
on
com
pet
eS
ectio
n of
Cha
pter
5.
(2) T
o ac
coun
t for
like
lihoo
d of
com
petin
g ab
sent
an
agre
emen
t and
like
lihoo
d of
suc
cess
.
SFA
S
No
. 14
4 Im
pai
rmen
t Te
stU
ndis
coun
ted
Net
Cas
h F
low
s, B
EV
(E
xhib
it 5.
2)$2
1,06
2$1
5,16
3$1
6,06
9$1
7,72
8$1
8,51
3$1
9,48
0$2
0,26
6$2
0,74
3$2
1,25
4$2
2,14
1U
ndis
coun
ted
Net
Cas
h F
low
s, B
EV
with
Com
petit
ion
20,5
38
14,5
30
15,3
10
16,8
33
17,5
47
18
,451
19
,185
19
,609
20
,063
20
,890
Diff
eren
ce =
Net
Cas
h F
low
s, A
ttritu
buta
ble
to N
onco
mpe
te$5
24$6
33$7
59$8
95$9
65$1
,029
$1,0
81$1
,135
$1,1
91$1
,251
Sum
of N
et C
ash
Flo
ws,
Attr
ibut
able
to N
onco
mpe
te
Car
ryin
g V
alue
of N
onco
mpe
te
$9,4
63
$7,4
40
Con
clus
ion:
R
ecov
erab
le
unde
r S
FAS
No.
144
, th
eref
ore
no i
mpa
irm
ent.
2003
2004
2005
2006
2007
2008
2009
2010
2011
2012
FO
RE
CA
ST
Not
e:So
me
amou
nts
may
not
foo
t due
to r
ound
ing.
The
impa
irm
ent t
est p
rese
nted
in th
is e
xam
ple
is a
ssum
ed to
be
perf
orm
ed a
s of
Dec
embe
r 31
, 200
2.
105

The probability of the covenantor’s competing and succeeding is stillassessed at 60 percent. After reducing the gross value by the probabilityfactor and adding an amortization benefit, the fair value of the noncom-pete agreement is determined to be $5,000,000.
The recoverability test of SFAS No. 144 indicates that the sum of theundiscounted cash flows (here, for 10 years, ignoring the residual) ex-ceeds the carrying value. Thus, no impairment is recognized. The remain-ing useful life is now four years.
Technology
As was done last year, the fair value of the company’s developed technol-ogy was determined using an income approach, which measures the pres-ent value of the future earnings to be generated during the remaining livesof the assets. Using the BEV as a starting point, pretax cash flows attribut-able to the technology that existed at the valuation date were calculated.This was accomplished by management’s forecasting sales attributable tothe existing technology. These sales were estimated to decline in 2003, re-main flat in 2004, increase two percent in 2005, and grow at three percentper year thereafter. As with the BEV, deductions are made for cost ofgoods sold (42 percent of sales attributable to existing technology in 2003,41 percent in 2004, and 40 percent thereafter) and operating expenses(normalized at 19 percent in 2006, after deducting development expenses[again, 10 percent] from the base to reflect the fact that the developedtechnology should not be burdened by expenses of developing new tech-nology). We then adjusted for returns on the other identified assets. Con-tributory asset charges (discussed more fully in Chapter 3) are as follows:
Return onWorking capital 5.0%Land and building 7.0%Machinery and equipment 8.0%Software 18.0%Trade name 16.0%Noncompete agreement 16.0%Assembled workforce 16.0%Customer base 18.0%
Required returns were deducted from the cash flows from the BEV. Thecontributory charges are presented in Exhibit 5.8.
106 Impairment Analysis: A Case Study
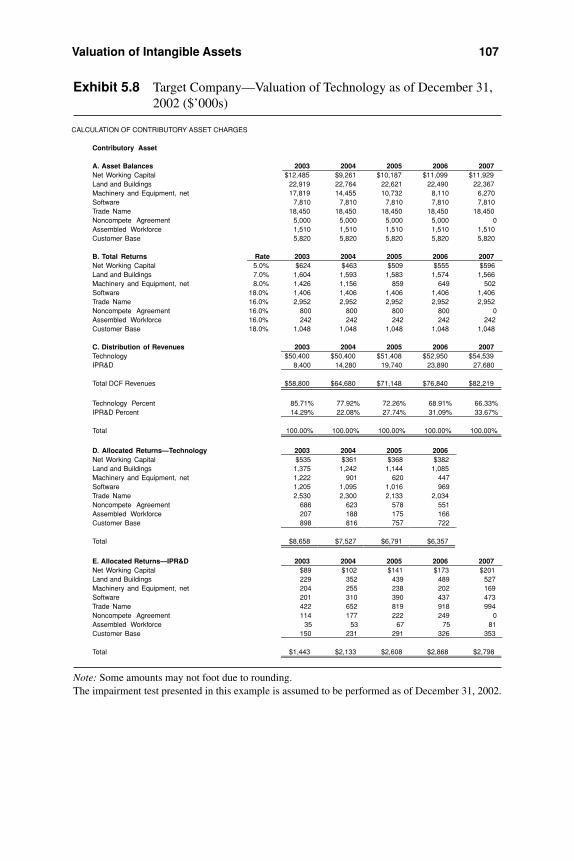
Valuation of Intangible Assets 107
CALCULATION OF CONTRIBUTORY ASSET CHARGES
Contributory Asset
A. Asset Balances 2003 2004 2005 2006 2007Net Working Capital $12,485 $9,261 $10,187 $11,099 $11,929Land and Buildings 22,919 22,764 22,621 22,490 22,367Machinery and Equipment, net 17,819 14,455 10,732 8,110 6,270Software 7,810 7,810 7,810 7,810 7,810Trade Name 18,450 18,450 18,450 18,450 18,450Noncompete Agreement 5,000 5,000 5,000 5,000 0Assembled Workforce 1,510 1,510 1,510 1,510 1,510Customer Base 5,820 5,820 5,820 5,820 5,820
B. Total Returns Rate 2003 2004 2005 2006 2007Net Working Capital 5.0% $624 $463 $509 $555 $596Land and Buildings 7.0% 1,604 1,593 1,583 1,574 1,566Machinery and Equipment, net 8.0% 1,426 1,156 859 649 502Software 18.0% 1,406 1,406 1,406 1,406 1,406Trade Name 16.0% 2,952 2,952 2,952 2,952 2,952Noncompete Agreement 16.0% 800 800 800 800 0Assembled Workforce 16.0% 242 242 242 242 242Customer Base 18.0% 1,048 1,048 1,048 1,048 1,048
C. Distribution of Revenues 2003 2004 2005 2006 2007Technology $50,400 $50,400 $51,408 $52,950 $54,539IPR&D 8,400 14,280 19,740 23,890 27,680
Total DCF Revenues $58,800 $64,680 $71,148 $76,840 $82,219
Technology Percent 85.71% 77.92% 72.26% 68.91% 66.33%IPR&D Percent 14.29% 22.08% 27.74% 31.09% 33.67%
Total 100.00% 100.00% 100.00% 100.00% 100.00%
D. Allocated Returns—Technology 2003 2004 2005 2006Net Working Capital $535 $361 $368 $382Land and Buildings 1,375 1,242 1,144 1,085Machinery and Equipment, net 1,222 901 620 447Software 1,205 1,095 1,016 969Trade Name 2,530 2,300 2,133 2,034Noncompete Agreement 686 623 578 551Assembled Workforce 207 188 175 166Customer Base 898 816 757 722
Total $8,658 $7,527 $6,791 $6,357
E. Allocated Returns—IPR&D 2003 2004 2005 2006 2007Net Working Capital $89 $102 $141 $173 $201Land and Buildings 229 352 439 489 527Machinery and Equipment, net 204 255 238 202 169Software 201 310 390 437 473Trade Name 422 652 819 918 994Noncompete Agreement 114 177 222 249 0Assembled Workforce 35 53 67 75 81Customer Base 150 231 291 326 353
Total $1,443 $2,133 $2,608 $2,868 $2,798
Exhibit 5.8 Target Company—Valuation of Technology as of December 31,2002 ($’000s)
Note: Some amounts may not foot due to rounding.The impairment test presented in this example is assumed to be performed as of December 31, 2002.
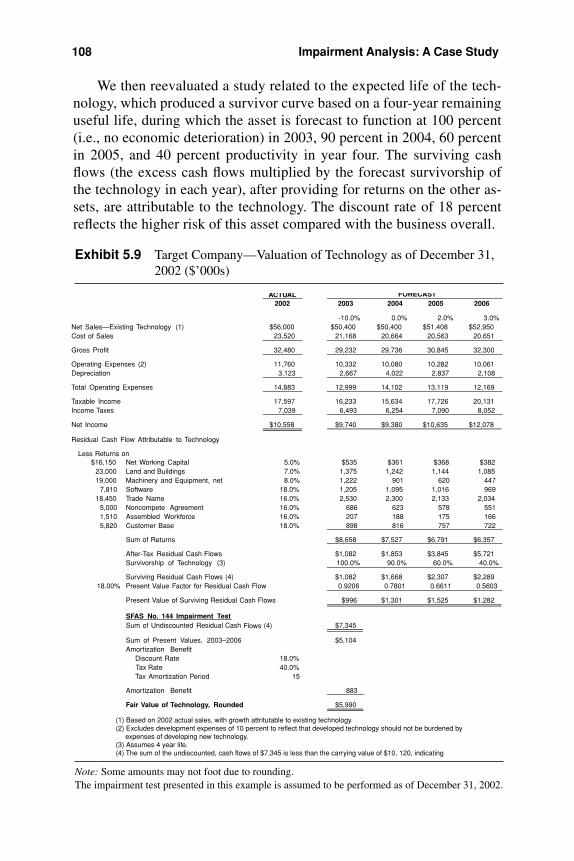
We then reevaluated a study related to the expected life of the tech-nology, which produced a survivor curve based on a four-year remaininguseful life, during which the asset is forecast to function at 100 percent(i.e., no economic deterioration) in 2003, 90 percent in 2004, 60 percentin 2005, and 40 percent productivity in year four. The surviving cashflows (the excess cash flows multiplied by the forecast survivorship ofthe technology in each year), after providing for returns on the other as-sets, are attributable to the technology. The discount rate of 18 percentreflects the higher risk of this asset compared with the business overall.
108 Impairment Analysis: A Case Study
ACTUAL2002 2003 2004 2005 2006
-10.0% 0.0% 2.0% 3.0%Net Sales—Existing Technology (1) $56,000 $50,400 $50,400 $51,408 $52,950Cost of Sales 23,520 21,168 20,664 20,563 20,651
Gross Profit 32,480 29,232 29,736 30,845 32,300
Operating Expenses (2) 11,760 10,332 10,080 10,282 10,061Depreciation 3,123 2,667 4,022 2,837 2,108
Total Operating Expenses 14,883 12,999 14,102 13,119 12,169
Taxable Income 17,597 16,233 15,634 17,726 20,131Income Taxes 7,039 6,493 6,254 7,090 8,052
Net Income $10,558 $9,740 $9,380 $10,635 $12,078
Residual Cash Flow Attributable to Technology
Less Returns on$16,150 Net Working Capital 5.0% $535 $361 $368 $382
23,000 Land and Buildings 7.0% 1,375 1,242 1,144 1,08519,000 Machinery and Equipment, net 8.0% 1,222 901 620 447
7,810 Software 18.0% 1,205 1,095 1,016 96918,450 Trade Name 16.0% 2,530 2,300 2,133 2,034
5,000 Noncompete Agreement 16.0% 686 623 578 5511,510 Assembled Workforce 16.0% 207 188 175 1665,820 Customer Base 18.0% 898 816 757 722
Sum of Returns $8,658 $7,527 $6,791 $6,357
After-Tax Residual Cash Flows $1,082 $1,853 $3,845 $5,721 Survivorship of Technology (3) 100.0% 90.0% 60.0% 40.0%
Surviving Residual Cash Flows (4) $1,082 $1,668 $2,307 $2,28918.00% Present Value Factor for Residual Cash Flow 0.9206 0.7801 0.6611 0.5603
Present Value of Surviving Residual Cash Flows $996 $1,301 $1,525 $1,282
SFAS No. 144 Impairment TestSum of Undiscounted Residual Cash Flows (4) $7,345
Sum of Present Values, 2003–2006 $5,104Amortization Benefit Discount Rate 18.0% Tax Rate 40.0% Tax Amortization Period 15
Amortization Benefit 883
Fair Value of Technology, Rounded $5,990
(1) Based on 2002 actual sales, with growth attritutable to existing technology.(2) Excludes development expenses of 10 percent to reflect that developed technology should not be burdened by expenses of developing new technology.(3) Assumes 4 year life.(4) The sum of the undiscounted, cash flows of $7,345 is less than the carrying value of $10, 120, indicating
FORECAST
Exhibit 5.9 Target Company—Valuation of Technology as of December 31,2002 ($’000s)
Note: Some amounts may not foot due to rounding.The impairment test presented in this example is assumed to be performed as of December 31, 2002.
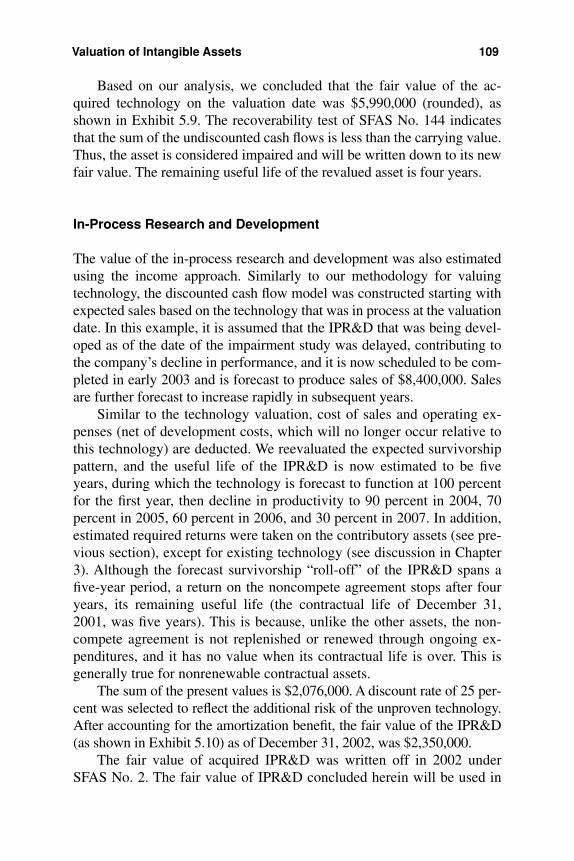
Based on our analysis, we concluded that the fair value of the ac-quired technology on the valuation date was $5,990,000 (rounded), asshown in Exhibit 5.9. The recoverability test of SFAS No. 144 indicatesthat the sum of the undiscounted cash flows is less than the carrying value.Thus, the asset is considered impaired and will be written down to its newfair value. The remaining useful life of the revalued asset is four years.
In-Process Research and Development
The value of the in-process research and development was also estimatedusing the income approach. Similarly to our methodology for valuingtechnology, the discounted cash flow model was constructed starting withexpected sales based on the technology that was in process at the valuationdate. In this example, it is assumed that the IPR&D that was being devel-oped as of the date of the impairment study was delayed, contributing tothe company’s decline in performance, and it is now scheduled to be com-pleted in early 2003 and is forecast to produce sales of $8,400,000. Salesare further forecast to increase rapidly in subsequent years.
Similar to the technology valuation, cost of sales and operating ex-penses (net of development costs, which will no longer occur relative tothis technology) are deducted. We reevaluated the expected survivorshippattern, and the useful life of the IPR&D is now estimated to be fiveyears, during which the technology is forecast to function at 100 percentfor the first year, then decline in productivity to 90 percent in 2004, 70percent in 2005, 60 percent in 2006, and 30 percent in 2007. In addition,estimated required returns were taken on the contributory assets (see pre-vious section), except for existing technology (see discussion in Chapter3). Although the forecast survivorship “roll-off” of the IPR&D spans afive-year period, a return on the noncompete agreement stops after fouryears, its remaining useful life (the contractual life of December 31,2001, was five years). This is because, unlike the other assets, the non-compete agreement is not replenished or renewed through ongoing ex-penditures, and it has no value when its contractual life is over. This isgenerally true for nonrenewable contractual assets.
The sum of the present values is $2,076,000. A discount rate of 25 per-cent was selected to reflect the additional risk of the unproven technology.After accounting for the amortization benefit, the fair value of the IPR&D(as shown in Exhibit 5.10) as of December 31, 2002, was $2,350,000.
The fair value of acquired IPR&D was written off in 2002 underSFAS No. 2. The fair value of IPR&D concluded herein will be used in
Valuation of Intangible Assets 109
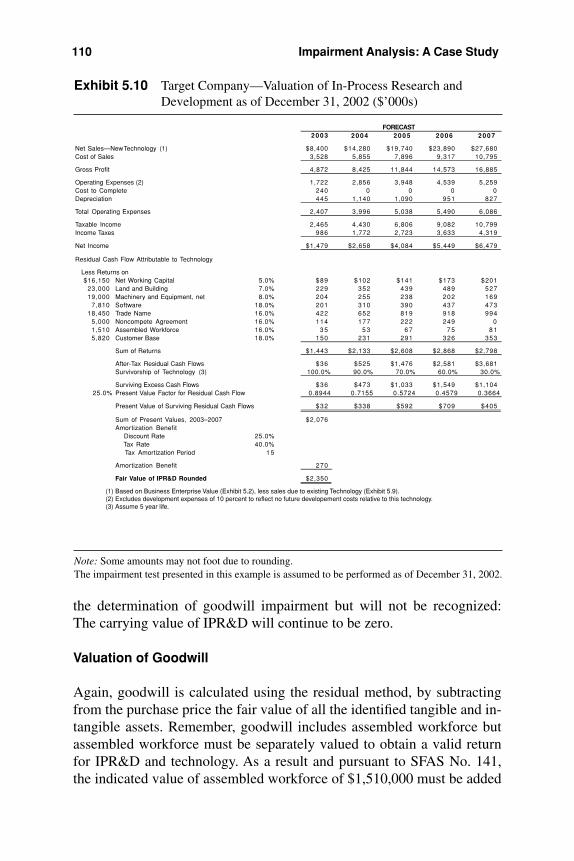
the determination of goodwill impairment but will not be recognized:The carrying value of IPR&D will continue to be zero.
Valuation of Goodwill
Again, goodwill is calculated using the residual method, by subtractingfrom the purchase price the fair value of all the identified tangible and in-tangible assets. Remember, goodwill includes assembled workforce butassembled workforce must be separately valued to obtain a valid returnfor IPR&D and technology. As a result and pursuant to SFAS No. 141,the indicated value of assembled workforce of $1,510,000 must be added
110 Impairment Analysis: A Case Study
2 0 0 3 2 0 0 4 2 0 0 5 2 0 0 6 2 0 0 7
Net Sales—New Technology (1) $8,400 $14,280 $19,740 $23,890 $27,680Cost of Sales 3,528 5,855 7,896 9,317 10,795
Gross Profit 4,872 8,425 11,844 14,573 16,885
Operating Expenses (2) 1,722 2,856 3,948 4,539 5,259Cost to Complete 240 0 0 0 0Depreciation 445 1,140 1,090 951 827
Total Operating Expenses 2,407 3,996 5,038 5,490 6,086
Taxable Income 2,465 4,430 6,806 9,082 10,799Income Taxes 986 1,772 2,723 3,633 4,319
Net Income $1,479 $2,658 $4,084 $5,449 $6,479
Residual Cash Flow Attributable to Technology
Less Returns on$16,150 Net Working Capital 5.0% $89 $102 $141 $173 $201
23,000 Land and Building 7.0% 229 352 439 489 52719,000 Machinery and Equipment, net 8.0% 204 255 238 202 169
7,810 Software 18.0% 201 310 390 437 47318,450 Trade Name 16.0% 422 652 819 918 994
5,000 Noncompete Agreement 16.0% 114 177 222 249 01,510 Assembled Workforce 16.0% 3 5 5 3 6 7 7 5 8 15,820 Customer Base 18.0% 150 231 291 326 353
Sum of Returns $1,443 $2,133 $2,608 $2,868 $2,798
After-Tax Residual Cash Flows $36 $525 $1,476 $2,581 $3,681 Survivorship of Technology (3) 100.0% 90.0% 70.0% 60.0% 30.0%
Surviving Excess Cash Flows $36 $473 $1,033 $1,549 $1,10425.0% Present Value Factor for Residual Cash Flow 0.8944 0.7155 0.5724 0.4579 0.3664
Present Value of Surviving Residual Cash Flows $32 $338 $592 $709 $405
Sum of Present Values, 2003–2007 $2,076Amortization Benefit Discount Rate 25.0% Tax Rate 40.0% Tax Amortization Period 1 5
Amortization Benefit 270
Fair Value of IPR&D Rounded $2,350
(1) Based on Business Enterprise Value (Exhibit 5.2), less sales due to existing Technology (Exhibit 5.9).(2) Excludes development expenses of 10 percent to reflect no future developement costs relative to this technology.(3) Assume 5 year life.
FORECAST
Exhibit 5.10 Target Company—Valuation of In-Process Research andDevelopment as of December 31, 2002 ($’000s)
Note: Some amounts may not foot due to rounding.The impairment test presented in this example is assumed to be performed as of December 31, 2002.
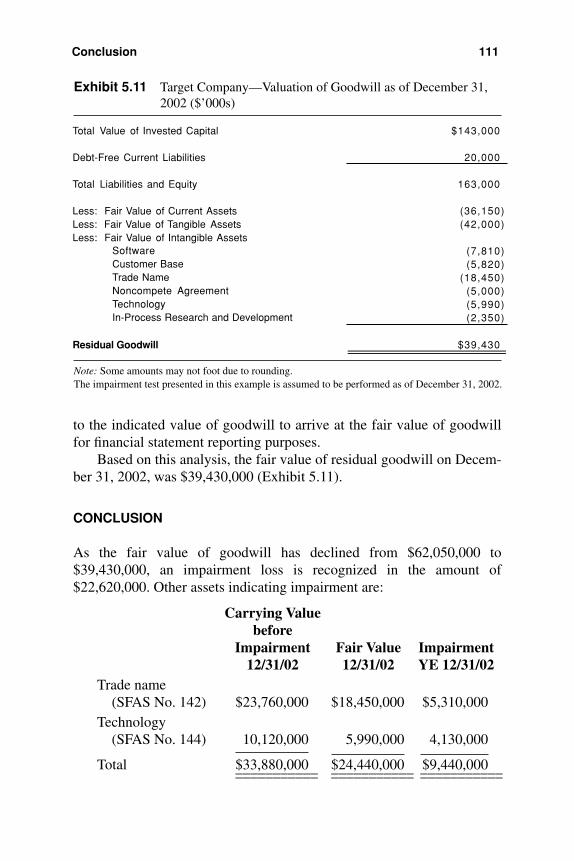
to the indicated value of goodwill to arrive at the fair value of goodwillfor financial statement reporting purposes.
Based on this analysis, the fair value of residual goodwill on Decem-ber 31, 2002, was $39,430,000 (Exhibit 5.11).
CONCLUSION
As the fair value of goodwill has declined from $62,050,000 to$39,430,000, an impairment loss is recognized in the amount of$22,620,000. Other assets indicating impairment are:
Carrying Valuebefore
Impairment Fair Value Impairment12/31/02 12/31/02 YE 12/31/02
Trade name (SFAS No. 142) $23,760,000 $18,450,000 $5,310,000
Technology (SFAS No. 144) 10,120,000 5,990,000 4,130,000
Total $33,880,000 $24,440,000 $9,440,000
Conclusion 111
Total Value of Invested Capital $143,000
Debt-Free Current Liabilities 20,000
Total Liabilities and Equity 163,000
Less: Fair Value of Current Assets (36,150)Less: Fair Value of Tangible Assets (42,000)Less: Fair Value of Intangible Assets
Software (7,810)Customer Base (5,820)Trade Name (18,450)Noncompete Agreement (5,000)Technology (5,990)In-Process Research and Development (2,350)
Residual Goodwill $39,430
Exhibit 5.11 Target Company—Valuation of Goodwill as of December 31,2002 ($’000s)
Note: Some amounts may not foot due to rounding.The impairment test presented in this example is assumed to be performed as of December 31, 2002.
______________________ ______________________ ______________________

The short-lived assets are not subject to impairment review. In thecase of software, customer base, and in-process research and develop-ment, the fair values as of December 31, 2002, exceed their carrying val-ues. No adjustments are made to reflect valuation differences. A summaryof the impairment study is presented in Exhibit 5.12. Total impairmentlosses for 2002 are $32,060,000.
112 SFAS No. 142, Impairment of Goodwill and Other Intangible Assets
CARRYING VALUE CARRYING VALUEBEFORE AFTER
FAIR VALUE IMPAIRMENT FAIR VALUE IMPAIRMENT IMPAIRMENT1 2 / 3 1 / 0 1 1 2 / 3 1 / 0 2 1 2 / 3 1 / 0 2 1 2 / 3 1 / 0 2 1 2 / 3 1 / 0 2
Cash $1,500 $2,850 $2,850 $2,850 naInvestments in Marketable Securities 8,000 7,000 7,300 7,000 naAccounts Receivable 17,000 13,000 13,000 13,000 naInventory 12,000 10,500 10,500 10,500 naPrepaid Expenses 3,000 2,500 2,500 2,500 na
TOTAL CURRENT ASSETS 41,500 35,850 36,150 35,850 0
Land and Buildings 22,000 21,687 23,000 21,687 0Machinery and Equipment, net 19,000 16,216 19,000 16,216 0
TOTAL LONG-LIVED TANGIBLE ASSETS 41,000 37,903 42,000 37,903 0
TOTAL CURRENT AND TANGIBLE ASSETS 82,500 73,753 78,150 73,753 0
Software 7,070 5,300 7,810 5,300 0Technology 13,500 10,120 5,990 5,990 (4,130)In-Process Research and Development 4,330 0 2,350 0 0Trade Name 23,760 23,760 18,450 18,450 (5,310)Customer Base 6,490 5,190 5,820 5,190 0Noncompete Agreement 9,300 7,440 5,000 7,440 0
TOTAL IDENTIFIED INTANGIBLE ASSETS 64,450 51,810 45,420 42,370 (9,440)
GOODWILL (including assembled workforce) 62,050 62,050 39,430 39,430 (22,620)
TOTAL ASSETS $209,000 $187,613 $163,000 $155,553 ($32,060)
Exhibit 5.12 Target Company—Summary of Fair Values and ImpairmentLosses as of December 31, 2002 ($’000s)
Note: Some amounts may not foot due to rounding.The impairment test presented in this example is assumed to be performed as of December 31, 2002.
Chapter 6
Issues in andImplementation of SFAS Nos. 141 and 142
The FASB’s issuance of SFAS Nos. 141 and 142 initiates a movement to-ward consistency in financial statement reporting that will take time tofully implement. The FASB recognizes this and has scheduled a numberof clarifications and projects designed to provide additional clarity. Forexample, the Board declared that the phrase accounting records havebeen maintained as used in footnote 25 to paragraph 61(b) of SFAS No.141 is intended to mean that an entity is accounting for an acquired intan-gible asset separately from goodwill as evidenced by the maintenance ofseparate general ledger accounts, subsidiary ledgers, or spreadsheets forthat intangible asset to which it posted periodic amortization charges, im-pairment charges, and any other accounting entries related to that asset.1
In addition, the Board stated that, except for the amount recognizedas an excess reorganization in accordance with AICPA Statement of Posi-tion 90-7, Financial Reporting by Entities in Reorganization Under theBankruptcy Code, SFAS No. 142 does not change the accounting for spe-cific intangible assets provided by GAAP. For example, SFAS No. 142does not change the requirement to amortize recognized film cost assets(whether acquired in a business combination or by other means) in accor-dance with AICPA Statement of Position 00-2, Accounting by Producersor Distributors of Films.2
A number of other issues are being addressed by formal projects un-der the Board’s authority. The issues fall into seven topics:
1. Purchase method procedures2. Treatment of intangible asset value subsumed
113
3. Defining reporting units4. Negative goodwill (equity method)5. New basis accounting6. Disclosure of internally generated intangible assets7. Business combinations of not-for-profit organizations
PURCHASE METHOD PROCEDURES
The treatment for preacquisition contingencies is essentially grand-fathered from APB Opinion No. 16 (paragraph 88) and shall govern thepurchase price allocation if the contingency can be resolved during the al-location period. If the contingency cannot be clearly resolved, then it willstill be included in the allocation to the degree the contingency can be rea-sonably estimated. Preacquisition contingencies are a hotbed of contro-versy, particularly with regard to the determination of the cost of anacquisition, the determination of direct versus indirect acquisition costs,contingent compensation for services, as well as others. The FASB has an-nounced a project to address the purchase method, specifically preacquisi-tion contingencies. Until such a project results in a new Statement, thepractitioner needs to consider the following guidance (not all inclusive):
• SFAS No. 5, Accounting for Contingencies• FASB Interpretation No. 14, Reasonable Estimation of the Amount
of Loss• Emerging Issues Task Force (EITF) Issue No. 95-8, Accounting for
Contingent Consideration Paid to the Shareholders of an AcquiredEnterprise in a Purchase Business Combination
• EITF Issue No. 97-8, Accounting for Contingent Consideration Issuedin a Purchase Business Combination
• EITF Issue No. 97-15, Accounting for Contingency ArrangementsBased on Security Prices in a Purchase Business Combination
• EITF Issue No. 99-12, Determination of the Measurement Date forthe Market Price of Acquirer Securities Issued in a Purchase BusinessCombination
• EITF Topic No. D-87, Determination of the Measurement Date forConsideration Given by the Acquirer in a Business CombinationWhen That Consideration Is Securities Other Than Those Issued bythe Acquirer
114 Issues in and Implementation of SFAS Nos. 141 and 142
The FASB project, Business Combinations: Purchase Method Proce-dures (the Project), is a joint project with the International AccountingStandards Board (IASB) and will broadly reconsider aspects of the pur-chase method of accounting, including measuring the value of the busi-ness combination, and recognition and measurement of identifiable assetsand liabilities (including such issues as contingencies and liabilities forterminating activities of an acquired entity). As reported by the FASB,some of the decisions tentatively agreed upon are:
1. The accounting for a business combination is based on the assump-tion that the transaction is an exchange of equal values; the totalamount to be recognized should be measured based on the fair valueof the consideration paid or the fair value of the net assets acquired,whichever is more clearly evident.• If the consideration paid is cash or other assets (or liabilities in-
curred) of the acquiring entity, the fair value of the considerationpaid determines the total amount to be recognized in the financialstatements of the acquiring entity.
• If the consideration is in the form of equity instruments, the fairvalue of the equity instruments ordinarily is more clearly evidentthan the fair value of the net assets acquired and, thus, will deter-mine the total amount to be recognized by the acquiring entity.
2. In a business combination, the acquiring entity obtains control overthe acquired entity and is therefore responsible for the assets and lia-bilities of the acquired entity. An amount equal to the fair value, onthe date control is obtained, should be assigned to the identifiable as-sets acquired and liabilities assumed.• If the total fair value exchanged in the purchase transaction ex-
ceeds the amounts recognized for identifiable net assets, thatamount is the implied fair value of goodwill.
• If the total fair value exchanged in the purchase transaction is lessthan the amounts recognized for identifiable net assets, that amountshould be recognized as a gain in the income statement.
3. In the acquisition of less than 100 percent of the acquired entity, theidentifiable assets and liabilities of the acquired entity should berecorded at full fair value. The current practice of considering thesubsidiaries’ carryover basis to the extent of the noncontrolling inter-est should be eliminated.
4. If negative goodwill is present in a business combination, the acquir-ing entity should review the procedures used to identify and measure
Purchase Method Procedures 115
the net assets of the subsidiary; however, no asset acquired should bemeasured at an amount that is known to be less than its fair value, norshould any liability assumed or incurred be measured at an amountknown to be higher than its fair value. If negative goodwill remains,the acquiring entity should recognize the amount in the income state-ment (recognized as an extraordinary item under Statement 141).
5. Preacquisition contingencies of the acquired entity that are assets orliabilities should be recognized and should be initially measured atfair value. The Board agreed to eliminate the alternative described inparagraph 40(b) of Statement 141 that allows for recognition underan approach consistent with FASB Statement No. 5, Accounting forContingencies. The issue of measuring preacquisition contingenciessubsequent to the acquisition date will be addressed in the project at alater date.3
At its March 6, 2002, meeting, the Board continued deliberations onthe Project on Business Combinations—Purchase Method Procedures. TheBoard discussed the accounting for contingent consideration in a businesscombination. The Board reached the following tentative decisions:
• Contingent consideration issued in a business combination is an obli-gation of the acquirer as of the acquisition date and therefore shouldbe recognized as part of the purchase price on that date. Consistentwith the working principle, the initial measurement of contingent con-sideration should be at fair value.
• Some contingent consideration arrangements obligate the acquirer todeliver its equity securities if specified future events occur. Presumingthat the Board issues a standard on accounting for financial instru-ments with the characteristics of liabilities, equity, or both, prior to theissuance of guidance in this project, the guidance in that standardwould apply to contingent consideration arrangements.
• The exception in paragraph 11(c) of FASB Statement No. 133, Ac-counting for Derivative Instruments and Hedging Activities, should beeliminated in order that contingent consideration arrangements thatotherwise meet the definition of a derivative would be subject to therequirements of Statement 133.
• Subsequent remeasurement (after the acquisition date) of contingentconsideration liabilities does not result in a change to the purchaseprice of the business combination. These amounts therefore should berecorded in the income statement.4
116 Issues in and Implementation of SFAS Nos. 141 and 142
TREATMENT OF SUBSUMED INTANGIBLE ASSET VALUE
In an impairment study, if original goodwill includes identified but pre-viously unrecorded intangible assets, an important question arises. Arepreviously unrecorded intangibles to be valued so they may provide anappropriate contributory charge? It would seem this step is necessary toensure all of the intangibles are properly valued and the residual valueapplicable to goodwill is accurate. Or, should previously unrecorded in-tangibles not be valued based on the argument that the goodwill that wascalculated in prior periods considered only recorded assets? Such an ap-proach would result in no allocation of contributory charges, therebyoverstating certain assets. Such overstatement would be offset by ignor-ing the previously unrecorded assets in calculating the residual valuethat equates to goodwill. In any event, goodwill would likely be incor-rect as a result.
The Board has taken the position that, in determining the amountof goodwill impairment, all economic assets should be valued and ap-propriate returns assessed, regardless of whether these assets arerecorded as of the date of the impairment study. The reader is cau-tioned that this procedure is specific to the calculation of goodwill forthe impairment measurement. In no circumstances are previously un-recorded intangibles to be later recorded in the financial statements.This conclusion follows from the requirement that sufficient recordsexist for the accurate valuation of the intangible asset. Absent the exis-tence of such records, it would not be possible to value such intangibleassets. These conclusions are addressed in an FASB Staff Announce-ment, Topic No. D-100, which is reprinted in its entirety in Exhibit 6.1at the end of this chapter.
DEFINING REPORTING UNITS
What are the criteria for defining a component of an operating segment asa reporting unit? Should there be geographic distinction, even though theeconomic purpose of the component is similar? Should the Board allowthe maximization of rollups of reporting units? The staff of the FASB hasaddressed these issues by focusing on:
• Whether the component constitutes a business• Availability of discrete financial information
Defining Reporting Units 117
• Accountability of segment management• Existence of similar economic characteristics
As stated in the FASB staff announcement (Topic No. D-101, re-produced in its entirety in Exhibit 6.2 at the end of this chapter),
Components that share similar economic characteristics but relate todifferent operating segments may not be combined into a single re-porting unit. For example, an entity might have organized its operat-ing segments on a geographic basis. If its three operating segments(Americas, Europe, and Asia) each have two components (A & B)that are dissimilar to each other but similar to the correspondingcomponents in the other operating segment, the entity would not bepermitted to combine component A from each of the operating seg-ments to make reporting unit A.5
NEGATIVE GOODWILL (EQUITY METHOD)
What has come to be known as negative goodwill (a popular oxymoron,but preferable to badwill) is to be eliminated through an exercise that ap-plies a pro-rata reduction of the negative goodwill amount to the previ-ously determined asset values. SFAS No. 141 states:
In some cases, the sum of the amount assigned to assets acquired and li-abilities assumed will exceed the cost of the acquired entity (excessover cost or excess). That excess shall be allocated as a pro-rata reduc-tion of the amounts that otherwise would have been assigned to all ofthe acquired assets except (a) financial assets other than investments ac-counted for by the equity method, (b) assets to be disposed of by sale,(c) deferred tax assets, (d) prepaid assets relating to pension or otherpostretirement benefit plans, and (e) any other current assets.
If any excess remains after reducing to zero the amounts thatotherwise would have been assigned to those assets, that remainingexcess shall be recognized as an extraordinary gain as described inparagraph 11 of APB Opinion No. 30, Reporting the Results of Oper-ations—Reporting the Effects of Disposal of a Segment of a Business,and Extraordinary, Unusual and Infrequently Occurring Events andTransactions.6
Goodwill resulting from the equity method is to be grandfathered. AsSFAS No. 142 states:
118 Issues in and Implementation of SFAS Nos. 141 and 142
The portion of the difference between the cost of an investment and theamount of underlying equity in that asset of an equity method investeethat is recognized as goodwill in accordance with paragraph 19(b) ofAPB Opinion No. 18, The Equity Method of Accounting for Investmentsand Common Stock (equity method goodwill) shall not be amortized.However, equity method goodwill shall not be tested for impairment inaccordance with this statement [SFAS No. 142]. Equity method invest-ment shall continue to be reviewed for impairment in accordance withparagraph 19(h) of Opinion 18.7
Paragraph 19(h) of APB Opinion No. 18, The Equity Method of Ac-counting for Investments in Common Stock, states:
A loss in value of an investment that is other than a temporary declineshould be recognized the same as a loss in value of other long-term as-sets. Evidence of a loss in value might include, but would not necessar-ily be limited to, absence of an ability to recover the carrying amount ofthe investment or inability of the investee to sustain earnings capacity,which would justify the carrying amount of the investment. A currentfair value of an investment that is less than its carrying amount may in-dicate a loss in value of the investment. However, a decline in thequoted market price below the carrying amount or the existence of op-erating losses is not necessarily indicative of a loss in value that is otherthan temporary. All are factors to be evaluated.8
Following the logic of APB Opinion No. 18 and SFAS No. 142,goodwill on the investee’s balance sheet will be subject to the new ruleswhile the investor will be required under the equity method to recognizeits share of impairment losses recognized by the investee. Further, if theinvestee subsequently recognizes goodwill impairment, the investor un-der the equity method should consider whether its carrying value of theinvestee is likewise impaired.
NEW BASIS ACCOUNTING
The FASB (in cooperation with the IASB) has announced a separate proj-ect which:
. . . focuses on those situations in which fresh-start (a new basis at fairvalue) recognition and measurement of all of an entity’s assets and li-abilities would be appropriate. One commonly identified candidate
New Basis Accounting 119
for application of this approach would be a multiparty business combination or other new entity formation in which no single pre-existing entity obtains majority ownership and control of the result-ing new entity. Similarly, joint venture formations also are candi-dates for this accounting treatment. Related issues include therecognition and measurement of goodwill and other intangibles incombinations or other transactions accounted for by the fresh-startmethod.
Prior to its designation as a potential IASB/FASB joint project,the Board, at its September 13, 2000 meeting, formally approved theinitial focus of Business Combinations: Phase 2 on new basis ac-counting issues. The Board also approved a draft working principleto be utilized in the determination of the appropriateness of recogniz-ing a new basis of accounting. The Board decided that the scope ofthe project should include the issue of gain recognition in the finan-cial statements of the entity that has transferred control over net as-sets to a joint venture.
During the fourth quarter 2000, the Board discussed the recogni-tion of a new basis of accounting in connection with the formation ofa joint venture. The Board decided that a change in control over netassets from unilateral control by one entity to joint or shared controlby that entity and one or more other entities should result in a newbasis of accounting for those net assets in the financial statements ofthe jointly controlled entity. The Board also discussed gain recogni-tion, as of the date of formation of a joint venture, in the financialstatements of an investor that transfers an appreciated (or previouslyunrecognized) asset to the joint venture. The Board decided that anentity that exchanges appreciated (or previously unrecognized) assetsfor an equity interest in a joint venture should recognize a gain on theassets exchanged.9
INTERNALLY GENERATED INTANGIBLE ASSETS
The FASB is currently undertaking a project that will review the disclo-sure of intangible assets that are not recognized in statements of financialposition, but would have been recognized if acquired either separately orin a business combination. Generally known as internally generatedgoodwill, the subjects of the project will include in-process research anddevelopment and focus on qualitative as well as quantitative issues. Theproject is ongoing, with an exposure draft expected in the third quarter of2002. The project proposal is reproduced in its entirety in Exhibit 6.3 atthe end of this chapter.
120 Issues in and Implementation of SFAS Nos. 141 and 142
BUSINESS COMBINATIONS FOR NOT-FOR-PROFIT ORGANIZATIONS
The FASB is studying the application of SFAS Nos. 141 and 142 to not-for-profit (NFP) organizations, which were originally excluded fromthose Statements. The project will follow an approach that presumes thatStatement No. 141 should apply to combinations of NFP organizationsunless a circumstance unique to those combinations is identified thatwould justify a different accounting treatment. That approach is beingreferred to as the differences-based approach. The definition of NFPoriginally and in SFAS No. 116, Accounting for Contributions Receivedand Contributions Made (June 1993), continue while the scope of theproject will include combinations between two or more NFP organiza-tions and the acquisition of a for-profit business enterprise by an NFP or-ganization. The acquisition of an NFP organization by a businessenterprise is within the scope of SFAS No. 141. The project analyzingNFPs will also include accounting for combinations of two or more mu-tual enterprises.
As part of the project, the Board has made tentative decisions regard-ing the accounting for a combination of two NFP organizations in whichthe acquiring organization can be identified and no cash or other assetsare exchanged as consideration:
• A combination of that type should be accounted for by the acquir-ing organization in a manner similar to a contribution under SFASNo. 116. The contribution should be measured as the sum of the fairvalues of the identifiable assets acquired and the liabilities as-sumed. The assets acquired and liabilities assumed should initiallybe recognized at their fair values, and the excess of the sum of thefair values of the identifiable assets acquired over the sum of thefair values of the liabilities assumed should be recognized as a con-tribution received.
• In those rare cases in which the sum of the fair values of the liabilitiesassumed exceeds the sum of the fair values of the identifiable assetsacquired, the acquiring organization should initially recognize that ex-cess as an unidentifiable intangible asset (goodwill).10
The Board made the following decisions regarding the accountingfor a combination of NFP organizations in which cash or other assets areexchanged as consideration. The decisions apply to both combinations
Business Combinations for Not-for-Profit Organizations 121

between two or more NFP organizations as well as the acquisition of abusiness enterprise by an NFP organization:
• The combination should be accounted for by the acquiring organiza-tion in accordance with Statement 141. However, the facts and cir-cumstances surrounding the combination should be reviewed toassess whether the combination is a transaction that is in part an ex-change and in part a contribution. If the facts and circumstances pro-vide clear evidence that there is a contribution inherent in thetransaction, that contribution received should be recognized by theacquiring organization in accordance with Statement 116. The fol-lowing are examples of facts and circumstances that provide evi-dence that the combination is one that is in part an exchange and inpart a contribution:a. The sum of the fair values of the assets acquired and liabilities as-
sumed exceeds the fair value of the consideration exchanged (theexcess), particularly if the amount of that excess is substantial in re-lation to the fair value of the net assets acquired, and no unstatedrights or privileges are involved.
b. A review of the facts and circumstances surrounding the combina-tion, including careful study of the negotiations, provides evidencethat the participants were acting as a donor and a donee and asbuyer and a seller.
• Organizations should be provided with the following list of examplesof facts and circumstances that indicate a combination is a bargainedexchange:a. The organization or business enterprise is acquired through a com-
petitive bidding process involving multiple potential acquirers.b. The amount of consideration offered by the acquiring organization
was developed in consultation with acquisition advisors, was basedon an estimate of the acquired entity’s fair value, or both. That esti-mate of the acquired entity’s fair value may have been developedinternally by the acquiring organization or by independent valua-tion experts.
c. The acquired entity’s former parent or predecessor board of direc-tors retained outside specialists to assist in negotiating the combi-nation, used estimates of the organization’s fair value to evaluatethe adequacy of the offers received, or both.
d. One or both parties to the combination retained consultants to pro-vide an opinion on the fairness of the transaction.
122 Issues in and Implementation of SFAS Nos. 141 and 142
e. The provisions of NFP corporation law or involvement on the partof a state attorney general or other regulatory body influenced theterms or structure of the combination transaction.
• If the acquired entity is an NFP organization, the contribution inherentin a combination should be measured as the excess of the sum of thefair values of the identifiable assets acquired and the liabilities as-sumed (following the guidance in paragraph 37 of Statement 141)over the fair value of the consideration exchanged.
• If the acquired entity is a business enterprise, the contribution in-herent in a combination should be measured as the excess of the fairvalue of the acquired business enterprise over the cost of that busi-ness enterprise.
• Contingent consideration in a combination should be accounted for inaccordance with the guidance in Statement 141.
• In general, assets transferred or liabilities incurred by the acquiringorganization as a requirement of a combination should be ac-counted for as consideration paid for the acquired entity unless theacquiring organization retains control over the future economicbenefits of the transferred assets. If control over the future eco-nomic benefits of the transferred assets is retained by the acquiringorganization, the asset transfer should be reported as an asset-for-asset exchange. Examples of conditions that would result in the ac-quiring organization retaining control over the future economicbenefit or the transferred assets include:a. The asset transfer is repayable or refundable.b. The assets are transferred to a recipient that is controlled by the ac-
quiring organization.c. The assets are transferred with the stipulation that they be used on
behalf of, or for the benefit of, the acquired organization, the ac-quiring organization, or its affiliates.
• An acquiring NFP organization should account for a regulatory-required asset transfer as consideration paid for the acquired orga-nization.
• Communities neither own nor control NFP organizations and, there-fore, a community’s relationship with an NFP organization shouldhave no effect on the method of accounting for a combination of NFPorganizations.11
Business Combinations for Not-for-Profit Organizations 123

CONCLUSION
As can be seen, the FASB is grappling with a number of correlary is-sues. We believe the subsequent development of the decision will re-sult in the completion of the logical framework. It is imperative thatthe practitioner closely monitor the development and resolution ofsubsequent decisions.
124 Issues in and Implementation of SFAS Nos. 141 and 142

Conclusion 125
Exhibit 6.1 FASB Staff Announcement—Topic No. D-100
Topic: Clarification of Paragraph 61(b) of FASB Statement No. 141 and Paragraph49(b) of FASB Statement No. 142
Date Discussed: November 14–15, 2001
An FASB representative announced that the staff has received inquiries about the applica-tion of paragraph 61(b) of FASB Statement No. 141, Business Combinations, and para-graph 49(b) of FASB Statement No. 142, Goodwill and Other Intangible Assets. Theinterpretative guidance provided by this staff announcement was formally cleared by theBoard at its October 10, 2001 meeting.
Paragraph 61 of Statement 141 includes the following transition provisions:
The following transition provisions apply to business combinations for which the ac-quisition date was before July 1, 2001, that were accounted for using the purchasemethod:
a. The carrying amount of acquired intangible assets that do not meet the criteria inparagraph 39 for recognition apart from goodwill (and any related deferred tax lia-bilities if the intangible asset is not deductible for tax purposes) shall be reclassi-fied as goodwill as of the date Statement 142 is initially applied in its entirety.
b. The carrying amount of (1) any recognized intangible assets that meet the recogni-tion criteria in paragraph 39 or (2) any unidentifiable intangible assets recognizedin accordance with paragraph 5 of FASB Statement No. 72, Accounting for CertainAcquisitions of Banking or Thrift Institutions, that have been included in theamount reported as goodwill (or as goodwill and intangible assets) shall be reclas-sified and accounted for as an asset apart from goodwill as of the date Statement142 is initially applied in its entirety.25
c. Other than as set forth in (a) and (b), an entity shall not change the amount of thepurchase price assigned to the assets acquired and liabilities assumed in a businesscombination for which the acquisition date was before July 1, 2001. [Footnote 26omitted.]
25For example, when a business combination was initially recorded, a portion of the [cost ofthe] acquired entity was assigned to intangible assets that meet the recognition criteria inparagraph 39. Those intangible assets have been included in the amount reported on the state-ment of financial position as goodwill (or as goodwill and other intangible assets), however,separate general ledger or other accounting records have been maintained for those assets.
November 14–15, 2001 EITF Meeting Minutes, p. 1 Administrative Matters
© 2001. Financial Accounting Standards Board. Used with permission.
126 Issues in and Implementation of SFAS Nos. 141 and 142
Exhibit 6.1 (Continued)
The FASB staff has received inquiries about the application of subparagraph 61(b) (theTransition Provision), in particular, the meaning of assigned to and accounting recordshave been maintained for those assets as those phrases are used in the footnote to theTransition Provision. The following paragraphs summarize the FASB staffs understand-ing of the Board’s intent with respect to the Transition Provision and provide examples toillustrate its application.
During the development of the Transition Provision, the Board noted that “entities mightnot have adhered strictly to the purchase price allocation requirements in Opinion 16 be-cause Opinion 17 required amortization of all acquired intangible assets and limited themaximum amortization period for both goodwill and other intangible assets to 40 years”(footnote 36 to paragraph B220 of Statement 141). The Board believes that many entitiesconcluded that their financial statements were prepared in accordance with generally ac-cepted accounting principles, in all material respects, even though intangible assets ac-quired in a business combination were not recognized and accounted for separately fromgoodwill. In those cases, the FASB staff believes that the Transition Provision does not al-low those entities to “carveout” from goodwill any intangible assets they had not identi-fied and measured at fair value in the initial recording of a business combination andsubsequently accounted for separately from goodwill. Rather, the FASB staff believes itwas the Board’s intent to require reclassification of the carrying amount of a previouslyacquired intangible asset only if (a) the asset meets the recognition criteria in paragraph39 of Statement 141, (b) the asset had been assigned an amount equal to its estimated fairvalue at the date that the business combination was initially recorded, and (c) the assetwas accounted for separately from goodwill as evidenced by the maintenance of account-ing records for that asset, such as a separate general ledger or other subsidiary ledgers(such as a spreadsheet or similar ledger account) to which periodic amortization charges,impairment charges, and other accounting entries were posted.
The following examples illustrate the staffs understanding of how the Transition Provi-sion should be applied.
Case AIn recording the acquisition of a bank, the acquiring entity identified the core deposit in-tangible (CDI) asset as an acquired intangible asset, estimated its fair value at date of ac-quisition, determined its useful life, and recognized deferred taxes related to that asset.The acquiring entity combined the CDI asset and goodwill into a single amount for exter-nal reporting purposes and that combined amount was recorded in a single general ledgeraccount labeled goodwill and other intangible assets. However, separate subsidiaryledgers (in the form of spreadsheets) were maintained for goodwill and for the CDI assetto which periodic amortization and impairment charges were posted.
The FASB staff believes that the acquirer is required by the Transition Provision to reclas-sify the carrying amount of the CDI asset to an account other than goodwill as of the dateStatement 142 is adopted in its entirety. The CDI asset meets the recognition criteria inparagraph 39 of Statement 141, its fair value was measured at the date [of] acquisition,and separate accounting records were maintained for the asset. The FASB staff believesthat after adoption of Statement 142, the separate CDI asset should continue to be amor-tized over its remaining useful life.
November 14–15, 2001 EITF Meeting Minutes, p. 2 Administrative Matters
© 2001. Financial Accounting Standards Board. Used with permission.
Conclusion 127
Exhibit 6.1 (Continued)
Case BIn recording the acquisition of a bank, the acquiring entity identified a CDI asset as an ac-quired intangible asset and estimated its fair value at date of acquisition. The acquiring en-tity decided, however, to recognize the CDI asset and goodwill as a single asset labeledgoodwill and to amortize that combined asset over its estimated composite useful life of 15years. The acquiring entity reasonably concluded that the financial reporting results pro-duced by amortizing the combined amount recognized as goodwill over its composite use-ful life would not be materially different from the results that would have been producedhad the CDI asset been recognized and accounted for separately from goodwill. At the datethe combination was completed, the acquiring entity recorded the amounts assigned togoodwill and to the CDI asset in a single general ledger account. In subsequent periods, ac-counting records were maintained only for the combined asset. The acquiring entity has,however, retained in its accounting records documentation supporting the initial recordingof the business combination that includes information about the estimated fair value of theacquired CDI asset and its useful life.
The FASB staff believes that the Transition Provision does not permit the acquiring entityto change the amount of the purchase price assigned to goodwill because, in this case,while the acquirer had identified and estimated the fair value of the CDI asset at the datethat the business combination was initially recorded, separate accounting records (suchas a separate general ledger account or spreadsheet) were not maintained for the asset.
Additional Observations
While the above examples refer to a particular type of intangible asset, a core deposit intangi-ble asset of an acquired financial institution, the FASB staff believes that the interpretativeguidance in this staff announcement applies to all intangible assets acquired in past businesscombinations, including those with indefinite useful lives.
The FASB staff believes that for a business combination completed after June 30, 2001,the approach described in Case B (that is, subsuming an acquired CDI asset into theamount recognized as goodwill when recording a business combination) would be incon-sistent with the requirements of Statement 141. That is because the staff believes that aCDI asset meets the criteria in paragraph 39 of Statement 141 for recognition as an assetapart from goodwill.
The FASB staff also observes that the amount of future goodwill impairment losses rec-ognized might be affected if an acquired intangible asset is not reclassified and accountedfor apart from goodwill on transition to Statement 142. That is because the goodwill im-pairment loss would be measured as the excess of the carrying amount of goodwill (whichwould include the carrying amount of the acquired intangible asset) over the implied fairvalue of goodwill (which would exclude the fair value of the acquired intangible asset).(Paragraph 21 of Statement 141 requires that a portion of the fair value of the reportingunit be allocated to all of the assets of a reporting unit [including unrecognized intangibleassets] in measuring the implied fair value of goodwill). For example, in Case B, a good-will impairment loss would be measured by comparing the carrying amount of goodwill(which includes the carrying amount of the CDI asset) to the implied fair value of good-will (which would not include the fair value of the CDI asset). Thus, a measured goodwillimpairment loss might be larger than it would have been had an acquired intangible assetbeen recognized apart from goodwill.
November 14–15, 2001 EITF Meeting Minutes, p. 3 Administrative Matters
© 2001. Financial Accounting Standards Board. Used with permission.
128 Issues in and Implementation of SFAS Nos. 141 and 142
Exhibit 6.1 (Continued)
The FASB staff also notes that Statement 141 does not change the requirement to recog-nize an unidentifiable intangible asset pursuant to paragraph 5 of FASB Statement No.72, Accounting for Certain Acquisitions of Banking or Thrift Institutions. The staff notesthat Statement 72 applies to the acquisition of a commercial bank, a savings and loan as-sociation, a mutual savings bank, a credit union, other depository institutions having as-sets and liabilities of the same types as those institutions, and branches of such entities,regardless of whether the acquired entity or branch is considered to be “financially trou-bled.” However, paragraph 5 of that Statement applies only to those acquisitions inwhich the fair value of the liabilities assumed by the acquiring entity exceeds the fairvalue of the tangible and recognized intangible assets acquired. Paragraph 5 requires thatany excess of the fair value of the liabilities assumed over the fair value of the tangibleand recognized intangible assets acquired be recognized as an unidentifiable intangibleasset. For example, assume that on January 1, 20XI, a bank acquired a branch of anotherbank. The fair value of the liabilities assumed in that branch acquisition ($100) exceedsthe fair value of the tangible and recognized intangible assets acquired ($80) by $20.Statement 141 does not change the requirement in Statement 72 to recognize that $20excess as an unidentifiable intangible asset. Moreover, Statement 142 does not changethe requirement to amortize that intangible asset in accordance with the method pre-scribed in paragraph 5 of Statement 72.
November 14–15, 2001 EITF Meeting Minutes, p. 4 Administrative Matters
© 2001. Financial Accounting Standards Board. Used with permission.
Conclusion 129
Exhibit 6.2 FASB Staff Announcement—Topic No. D-101
Topic: Clarification of Reporting Unit Guidance in Paragraph 30 of FASB StatementNo. 142
Date Discussed: November 14–15, 2001
An FASB representative announced that the staff has received inquiries about the applica-tion of paragraph 30 of FASB Statement No. 142, Goodwill and Other Intangible Assets.In particular, the inquiries have focused on the meaning of the phrase discrete financialinformation.
Paragraph 30 of Statement No. 142 includes the following guidance for determining re-porting units:
A reporting unit is an operating segment or one level below an operating seg-ment (referred to as a component).17 A component of an operating segment is a re-porting unit if the component constitutes a business18 for which discrete financialinformation is available and segment management19 regularly reviews the operat-ing results of that component. However, two or more components of an operatingsegment shall be aggregated and deemed a single reporting unit if the componentshave similar economic characteristics.20 An operating segment shall be deemed tobe a reporting unit if all of its components are similar, if none of its components isa reporting unit, or if it comprises only a single component. The relevant provi-sions of Statement 131 and related interpretative literature shall be used to deter-mine the reports of an entity.
This staff announcement summarizes the FASB staff’s understanding of the Board’s in-tent with respect to the determination of whether a component of an operating segment isa reporting unit.
Determining whether a component of an operating segment is a reporting unit is a matterof judgment based on an entity’s individual facts and circumstances. Although paragraph30 of Statement 142 includes a number of characteristics that must be present for a com-ponent of an operating segment to be a reporting unit, no single factor or characteristic isdeterminative. The FASB staff believes that how an entity manages its operations and how an acquired entity is integrated with acquiring entity are key to determining the re-
17 For purposes of determining reporting units, an operating segment is defined inparagraph 10 of FASB Statement No. 131, Disclosures about Segments of an En-terprise and Related Information.18 Emerging Issues Task Force Issue No. 98-3, “Determining Whether a Nonmone-tary Transaction Involves Receipt of Productive Assets or of a Business,” includesguidance on determining whether an asset group constitutes a business.19 Segment management consists of one or more segment managers, as that term isdefined in paragraph 14 of Statement 131.20 Paragraph 17 of Statement 131 shall be considered in determining if the compo-nents of an operating segment have similar economic characteristics.
November 14–15, 2001 EITF Meeting Minutes, p. 1 Administrative Matters
© 2001. Financial Accounting Standards Board. Used with permission.
130 Issues in and Implementation of SFAS Nos. 141 and 142
Exhibit 6.2 (Continued)
porting units of the entity. As noted in the basis for conclusions of Statement 142, “TheBoard’s intent was that a reporting unit would be the level of internal reporting that re-flects the way an entity manages its business or operations and to which goodwill natu-rally would be associated” (paragraph B102). “That approach reflects the Board’s beliefthat the information an entity reports for its internal use will reflect the way the overall en-tity is managed (paragraph B103).”
The characteristics identified in paragraph 30 of Statement 142 that must be present for acomponent to be a reporting unit are discussed below.
The Component Constitutes a BusinessThe determination of whether a component constitutes a business requires judgmentbased on specific facts and circumstances. The guidance in EITF Issue No. 98-3 “Deter-mining Whether a Nonmonetary Transaction Involves Receipt of Productive Assets or ofa Business,” should be considered in determining whether a group of assets constitutes abusiness. That guidance states that, among other things, “for a transferred set of activitiesand assets to be a business, it must contain all of the inputs and processes necessary for itto continue to conduct normal operations after the transferred set is separated from thetransferor.” The fact that operating information (revenues and expenses) exists for a com-ponent of an operating segment does not mean that the component constitutes a business.For example, a component for which operating information is prepared might be a prod-uct line or a brand that is part of a business rather than a business itself.
Discrete Financial InformationThe term discrete financial information should be applied in the same manner that it is ap-plied in determining operating segments in accordance with paragraph 10 of Statement131. The Statement 131 implementation guidance indicates that it is not necessary that as-sets be allocated for a component to be considered an operating segment (that is, no bal-ance sheet is required). Thus, discrete financial information can constitute as little asoperating information. Therefore, in order to test goodwill for impairment in accordancewith Statement 142, an entity may be required to assign assets and liabilities to reportingunits (consistent with the guidance in paragraphs 32 and 33 of Statement 142).
Reviewed by Segment ManagementSegment management, as defined in paragraph 14 of Statement 131, is either a level be-low or the same level as the chief operating decision maker. According to Statement 131,a segment manager is “directly accountable to and maintains regular contact with thechief operating decision maker to discuss operating activities, financial results, forecasts,or plans for the segment.” The approach used in Statement 142 to determine reportingunits is similar to the one used to determine operating segments in Statement 131; how-ever, Statement 142 focuses on how operating segments are managed rather than how theentity as a whole is managed. The approach in Statement 142 is consistent with theBoard’s intent that reporting units should reflect the way an entity manages its operations.
November 14–15, 2001 EITF Meeting Minutes, p. 2 Administrative Matters
© 2001. Financial Accounting Standards Board. Used with permission.
Conclusion 131
Exhibit 6.2 (Continued)
Similar Economic CharacteristicsEvaluating whether two components have similar economic characteristics is a matter ofjudgment that depends on specific facts and circumstances. That assessment should bemore qualitative than quantitative.
In determining whether the components of an operating segment have similar economiccharacteristics, footnote 20 to paragraph 30 of Statement 142 states that the guidance inparagraph 17 of Statement 131 should be considered. The Board intended that all of the fac-tors in paragraph 17 of Statement 131 be considered in making that determination. How-ever, the Board did not intend that every factor must be met in order for two components tobe considered economically similar. In addition the Board did not intend that the determina-tion of whether two components economically similar be limited to consideration of the fac-tors described in paragraph 17 of Statement 131. In determining whether componentsshould be combined into one reporting unit based on their economic similarities, factors thatshould be considered in addition to those in paragraph 17 include but are not limited to:
• The manner in which an entity operates its business and the nature of those operations.• Whether goodwill is recoverable from the separate operations of each component
business or from two or more component businesses working in concert (whichmight be the case if the components are economically interdependent).
• The extent to which the component businesses share assets and other resources, asmight be evidenced by extensive transfer pricing mechanisms.
• Whether the components support and benefit from common research and develop-ment projects.
The fact that a component extensively shares assets and other resources with other com-ponents of the operating segment may be an indication that the component either is not abusiness or may be economically similar to those other components.
Components that share similar economic characteristics but relate to different operatingsegments may not be combined into a single reporting unit. For example, an entity mighthave organized its operating segments on a geographic basis. If its three operating seg-ments (Americas, Europe, and Asia) each have two components (A and B) that are dis-similar to each other but similar to the corresponding components in the other operatingsegments, the entity would not be permitted to combine component A from each of theoperating segments to make reporting unit A.
Additional ObservationsSome constituents have noted that two operating segments may have been aggregatedinto a reportable segment by applying the aggregation criteria in paragraph 17 of State-ment 131, and have inquired about whether one or more of the components of those oper-ating segments can be reporting units under Statement 142. The FASB staff believes itwould be possible for one or more of those components to be economically dissimilarfrom the other components and thus be a reporting unit for the purposes of testing good-
November 14–15, 2001 EITF Meeting Minutes, p. 3 Administrative Matters
© 2001. Financial Accounting Standards Board. Used with permission.
132 Issues in and Implementation of SFAS Nos. 141 and 142
Exhibit 6.2 (Continued).
will for impairment. In particular, the FASB staff believes that that situation might occurwhen an entity’s operating segments are based on geographic areas. The following pointsneed to be considered in addressing this question:
The determination of reporting units under Statement 142 begins with the definition of anoperating segment in paragraph 10 of Statement 131 and considers disaggregating thatoperating segment into economically dissimilar components for the purpose of testinggoodwill for impairment. The determination of reportable segments under Statement 131also begins with a paragraph 10 operating segment, but considers whether certain eco-nomically similar operating segments should be aggregated into a single operating seg-ment or a reportable segment.
• The level at which operating performance is reviewed differs between the twoStatements—it is the chief operating decision maker who reviews operating seg-ments and the segment manager who reviews reporting units (components of oper-ating segments). Therefore, a component of an operating segment would not beconsidered an operating segment for Statement 131 purposes unless the chief oper-ating decision maker regularly reviews its operating performance; however, thatsame component might be a reporting unit under Statement 142 if a segment man-ager regularly reviews its operating performance (and if other reporting unit criteriaare met).
November 14–15, 2001 EITF Meeting Minutes, p. 4 Administrative Matters
© 2001. Financial Accounting Standards Board. Used with permission.
Conclusion 133
Exhibit 6.3 FASB Proposal for a New Agenda Project
FINANCIAL ACCOUNTING STANDARDS BOARD
Proposal for a New Agenda Project
DISCLOSURE OF INFORMATION ABOUT INTANGIBLE ASSETSNOT RECOGNIZED IN FINANCIAL STATEMENTS
This Proposal discusses a proposed FASB project to establish standards for improvingdisclosure of information about intangible assets that are not recognized in financial state-ments. This Proposal is part of an August 17, 2001 request for comments about the objec-tive and scope of this project, as well as a proposed project on reporting financialperformance.1 Comments are requested by September 19, 2001.
DESCRIPTION OF THE PROPOSED PROJECT
This potential FASB project on disclosure about intangibles would focus on improvinginformation about intangible assets that are seen by many as increasingly important tobusiness success but are not currently recognized as assets in financial statements. Intan-gible assets are generally recognized only if acquired, either separately or as part of abusiness combination. Intangible assets that are generated internally, and some acquiredassets that are written off immediately after being acquired, are not reflected in financialstatements, and little quantitative or qualitative information about them is reported in thenotes to the financial statements.
The principal goals of the project would be to make new information available to in-vestors and creditors and to improve the quality of information currently being pro-vided—information vital to well-reasoned investment and credit resource allocationdecisions. A secondary goal of the project would be to take a first step in what might be-come an evolution toward recognition in an entity’s financial statements of internally gen-erated intangible assets.
The balance of this Proposal discusses the problem to be addressed, the scope of the proj-ect, the issues that would have to be resolved, how practice might change, and the FASBagenda criteria. It concludes with a request for comments and several questions for con-stituents.
1 Further information about that request, including the Proposal for the project on report-ing financial performance, is available at www.fasb.org/project/proposals.html.
© 2001. Financial Accounting Standards Board. Used with permission.
FABS

134 Issues in and Implementation of SFAS Nos. 141 and 142
Exhibit 6.3 (Continued)
THE PROBLEM
Hundreds of recent articles, studies, and consultants’ reports have decried what they con-sider accounting’s failures to respond to recent fundamental changes in the economy.Some suggest that the important value drivers in the new economy are largely nonfinan-cial, and that a set of measures could and should be developed that would allow investorsand creditors to better evaluate entities and compare them with one another. Others sug-gest that the importance of intangibles is the distinguishing feature of the new economy,that intangible assets are recognized in financial statements only when acquired from oth-ers, and that accounting standard setters should require information about internally gen-erated intangible assets. This proposed project would respond to those suggestions.
One aspect of the problem is comparability. Intangible assets are generally recognized infinancial statements if they are acquired, either by themselves or as part of a businesscombination. However, otherwise identical intangible assets generally are not recognizedif developed internally. It is therefore difficult to compare the financial statements of anentity that has built up substantial intangible assets internally with those of another entitythat has purchased most of its intangible assets. Disclosure can help diligent investors inmaking such a comparison, but quantitative disclosures are currently required only aboutthe recognized intangible assets.2 Therefore, the comparative procedure available now isto subtract all recognized intangibles, which allows investors to compare adjustedamounts that ignore all intangible assets. In view of the increasing importance of intangi-bles, that approach is suboptimal. Disclosures about unrecognized intangibles would po-tentially allow investors to make a more complete comparison.
Without the leadership of the FASB, the IASB, or other standard-setting or regulatorybodies, it is unlikely that companies will consistently provide financial statement userswith reasonably comparable information about intangible assets. Users of financial re-ports will continue to find relatively little information in the financial statements aboutkey value drivers, and to have little confidence in what information they do receive.
2 FASB Statement No. 142, Goodwill and Other Intangible Assets, issued in June 2001,improves disclosures about recognized intangible assets and about research and develop-ment assets in the year they are written off immediately after being acquired, but it doesnot address unrecognized intangibles.
© 2001. Financial Accounting Standards Board. Used with permission.
Conclusion 135
Exhibit 6.3 (Continued)
THE SCOPE
The principal source material for this Proposal is the April 2001 Special Report, Businessand Financial Reporting, Challenges from the New Economy, by former FASB staff mem-ber Wayne S. Upton Jr. (the New Economy Report), which is available on the FASB website(www.fasb.org/new_economy.html) or in print from the FASB order department. The NewEconomy Report suggested four possible FASB projects. This potential FASB project ondisclosure about intangibles would take on one of those suggestions, to address the formatand content of disclosure about unrecognized intangible assets. That might be a first step inan evolution toward recognition of some internally generated intangible assets, or the dis-closure project might be undertaken without any presumption about eventual recognition.Either way, it would stimulate companies to identify intangible assets and other value driv-ers and to collect some information about intangibles not previously captured in manage-ment reporting systems. It would also allow standard setters to refine the definition of an in-tangible asset and, most importantly, would provide investors, creditors, and other users offinancial reports with additional information to assess an entity’s intangible assets.
This Proposal suggests a project scope focused on disclosure about intangible assets thatare not recognized in statements of financial position, but would have been recognized ifacquired either separately or in a business combination. It would also include in-processresearch and development assets that, under FASB Interpretation No. 4, Applicability ofFASB Statement No. 2 to Business Combinations Accounted for by the Purchase Method,are written off to expense on the day they are acquired.
Other project scopes have been suggested. One would be disclosure of nonfinancial indi-cators about intangible factors, such as market size and share, customer satisfaction lev-els, new product success rates, and employee retention rates. Another would berecognition and measurement, in statements of financial position, of research and devel-opment and other project-related intangible assets. A third would be separate recognitionand measurement of intangible assets or liabilities embedded in tangible or financial as-sets, for example, banks’ core deposit intangibles and insurers’ claim-handling obliga-tions.3 The Board does not propose to include those matters in this potential project butwelcomes comments from constituents on that conclusion.
3 The New Economy Report identified that possible project on recognition of embeddedintangibles and service obligations. The proposed project on disclosure about intangibleswould not touch on those issues, many of which are closely related to and may be insepa-rable from issues under active consideration in the Board’s project on measuring financialassets and liabilities at fair value.
© 2001. Financial Accounting Standards Board. Used with permission.
136 Issues in and Implementation of SFAS Nos. 141 and 142
Exhibit 6.3 (Continued)
RELEVANT RESEARCH, ISSUES, AND CONCERNS
The project would include considering matters raised in, and comments received by theFASB and other standard-setting bodies on the recommendations of the:
1. November 1993 report of the Association for Investment Management and Research(AIMR), Financial Reporting in the 1990s and Beyond
2. December 1994 report of the American Institute of Certified Public Accountants(AICPA) Special Committee on Financial Reporting, Improving Business Reporting—A Customer Focus
3. January 2001 report of the Business Reporting Research Project, Improving BusinessReporting: Insights into Enhancing Voluntary Disclosures
The substantial body of research by Professor Baruch Lev of New York University andothers summarized in the New Economy Report also should be of considerable assistancein resolving the principal issues in this project.
The initial phase of the project would build on those and other earlier efforts. A first stepwould be to establish a working group of outside experts to assist the FASB, especially inidentifying the relevant issues and possible solutions and in refining user surveys.
After Board deliberations, an Exposure Draft, and consideration of comments from con-stituents, the project would result in a final Statement calling for disclosures. The projectis expected to take about two years.
The Principal Issues
The first issue, alluded to in the discussion of scope, is what intangible assets are to becovered by the Statement. The proposed scope is intangible assets that are not recognized,but would have been recognized had they been acquired from others, as well as in-processresearch and development assets written off after acquisition. The project would considerwhether existing guidance4 is adequate for preparers and practitioners to determine whatis and is not included, or whether additional guidance is needed. The conceptual analysisin Chapter 4 of the New Economy Report should be useful in resolving that scope issue.5
4 For example, in FASB Statements No. 141, Business Combinations, and No. 142, Good-will and Other Intangible Assets.5 Part 2 of Chapter 4 of the New Economy Report presents a list of intangible assets, clas-sified according to whether they are separable from the entity and whether they are basedon contractual or other legal rights. The list includes agreements with suppliers and cus-tomers, rights to scarce resources, permits, franchises, patents and copyrights, computerprograms, secret formulas and processes, databases, and research and development,among others.
© 2001. Financial Accounting Standards Board. Used with permission.
Conclusion 137
Exhibit 6.3 (Continued)
The second principal issue is what information should be disclosed about intangible as-sets. Possible quantitative and qualitative disclosures about unrecognized intangible as-sets might include:
• Major classes of intangible assets and their characteristics
• Expenditures to develop and maintain them
• Values of those assets6
• Significant events that change the anticipated future benefits arising from intangible as-sets.
The time gap and the correlation gap between expenditures and values of resulting intan-gible assets, noted on page ix of the New Economy Report, will present challenges in re-solving what information should be disclosed.
The FASB conceptual framework contains only general guidance about disclosure,mainly focused on qualitative characteristics, which will be of limited help to the Board inselecting from the alternatives those that will best improve financial reporting. A secondconcern is that it may not be feasible to develop and verify some of the information aboutintangibles that is desired by some investors, creditors, and other users of financial re-ports.
Other Issues
Should the Disclosures Be Voluntary or Required?
The Business Reporting Steering Committee and others suggest that, in view of such fac-tors as the variations between and even within industries, disclosures should be voluntary.That would certainly reduce resistance to the proposed Statement. However, the potentialparticipation level in response to encouraging voluntary disclosures may not be accept-able.7
Should the Disclosures Be Made Annually or More Frequently?
Most FASB requirements for disclosure effectively apply only to the full sets of financialstatements and notes commonly presented in annual financial reports. Some informationis required to be disclosed in interim financial information, and the Board could requirethat for information about intangibles.
6 While the main emphasis of this project would be on unrecognized intangible assets, theproject might also consider disclosures about values of recognized intangible assets.7 For example, FASB Statement 119, Disclosure about Derivative Financial Instrumentsand Fair Value [of] Financial Instruments, encouraged disclosure of quantitative infor-mation about market risks of derivative instruments in 1994, but few entities reportedsuch information until the SEC mandated it in 1997. FASB Statement No. 89, FinancialReporting and Changing Prices, encouraged continued disclosure of current-cost andconstant-purchasing-power information, but very few entities provide it.
© 2001. Financial Accounting Standards Board. Used with permission.
138 Issues in and Implementation of SFAS Nos. 141 and 142
Exhibit 6.3 (Continued)
Concerns Likely to Be Raised
Users of financial reports will likely support improvements in information about unrecog-nized intangibles. On the other hand, preparers of financial reports and their auditors mayhave concerns regarding competitive harm, fears of failure to meet expectations, lack ofexpertise, and preparations costs.
However, not taking on such a project may mean that financial reports continue to fall toprovide information about what many argue are increasingly the main drivers of values inthe capital markets. Chapter 1 of the New Economy Report discusses those arguments.
AGENDA CRITERIA
This Proposal is one of several means by which the Board seeks to obtain advice from itsconstituents about possible additions to its technical agenda. After receiving input fromconstituents, the Board must make its own decisions regarding its technical agenda. Toaid in the decision-making process, the Board has developed a list of factors to which itrefers in evaluating proposed topics. Those factors, which are more fully discussed inFacts about FASB include consideration of (a) the pervasiveness of the issue, (b) alterna-tive solutions, (c) technical feasibility, and (d) practical consequences. At this time, theBoard believes that this proposed project on disclosures about intangibles satisfies each ofthose factors. However, the Board’s resources are limited and it is aware of other potentialprojects suggested by constituents that also satisfy those factors.
In addition, the Board has determined that all topics under consideration for theFASB’s agenda should be assessed to determine whether they provide opportunitiesfor cooperative efforts with the IASB or other national standard setters. More specifi-cally, that assessment is to include consideration of (a) the possibility that resolutionof the issues addressed would increase convergence of standards worldwide, (b) theopportunities the topic presents for cooperation with the IASB or other standard set-ters, and (c) whether appropriate and sufficient resources are available for a joint proj-ect or other cooperative effort. In contrast to some other proposed projects, it seemsless likely, given their other priorities and resource constraints, that the IASB or othernational standard setters will address information about intangibles in the near term.Therefore, the FASB would likely be working separately on this proposed project.However, the same concerns that have been noted in the United States will likely beheard in other countries.
© 2001. Financial Accounting Standards Board. Used with permission.
Conclusion 139
Exhibit 6.3 (Continued)
REQUEST FOR COMMENTS
The Board has not decided whether to add a project on reporting information about intan-gibles to its agenda or about the scope of such a project. The Board is seeking commentsfrom its constituents on this Proposal, particularly on the following major questions:
1. Is there a need for the FASB or others to comprehensively address the reporting ofinformation about intangibles of a business enterprise? If yes, should the FASB takeon such an effort or defer to others? If so, to whom?
2. Is the proposed scope of such a project as described in this Proposal insufficient, ap-propriate, or too ambitious? One alternative would be a broader scope that might en-compass other constituent recommendations, for example, (a) disclosure aboutnonfinancial indicators, management’s key goals for them, and related risks, strate-gies, efforts, and accomplishments in meeting its goals or (b) recognition and mea-surement of certain internally generated intangible assets. Another alternative wouldbe a limited-scope project that focuses solely on, for example, disclosure of expendi-tures to develop and maintain unrecognized intangible assets or on disclosure of in-formation about research and development activities.
3. Should specific issues identified above be excluded from the scope of the proposedproject on reporting information about intangibles? If yes, for each specific issue,please indicate whether it should be addressed as part of another FASB project, byothers, or not at all and why.
4. Should specific issues not identified above be addressed as part of the proposed proj-ect on reporting information about intangibles? If yes, please describe the specific is-sue and indicate why it is sufficiently crucial that it should be addressed as part of theproposed project.
© 2001. Financial Accounting Standards Board. Used with permission.
Chapter 7
Implementation Aids
The Securities and Exchange Commission is concerned that financialstatements properly reflect acquired assets at their fair values. It is safeto assume that they will place a similar level of emphasis on nonamor-tizable assets as they have on in-process research and development,and will be looking for instances of overvaluation of nonamortizableintangible assets. Management should be aware that the overvaluationof nonamortizable assets increases the potential of later having to rec-ognize impairment charges on such assets. If impairment losses be-come commonplace, investors may begin to question management’sability to make successful acquisitions. Therefore, it is vital that pur-chase price allocations and impairment testing be done by a qualifiedprofessional.
Management may conduct impairment testing internally only if com-pany personnel can meet the criteria of Statement on Auditing Standards(SAS) 73, Using the Work of a Specialist. Auditors will be reviewingmanagement’s qualifications and work product to ensure that the require-ments of SAS 73 and SFAS Nos. 141 and 142 are met. Most auditors areinterpreting the new independence standards as not allowing the auditorto perform SFAS Nos. 141 and 142 services.
The services of an independent valuation specialist are usually re-quired in estimating the fair value of assets acquired in a business combi-nation. Some entities employ valuation specialists in their organizations;others will find it necessary to engage the services of an external valua-tion specialist. Regardless of who performs the valuation, the auditor
140
should determine that the specialist has the requisite skills and expertiseto develop a valuation of the acquired assets in conformity with generallyaccepted accounting principles.
A review of the qualifications of the appraiser should be at the samehigh level of any critical professional. These qualifications should focuson the appraiser’s skill, education, and experience and may include:
• Specialized training in business valuation• Specialized training in valuing intangible assets• Audit experience or exposure to comprehend the audit environment
for the valuation• Recognized business valuation designations• Postgraduate education• Professional leadership activities at the state or national level• Unique professional activity such as serving on task forces or commit-
tees for organizations like the SEC, FASB, or AICPA on these issues• Knowledge of the elements of SFAS Nos. 141 and 142 including crit-
ically related SFAS as 121 (impairment) and 131 (segment reporting)as well as others
• Experience in rendering opinions related to intangible assets• Experience defending valuation opinions (e.g., SEC)
So, what steps should companies take when faced with implementingSFAS Nos. 141 and 142? We recommend that the company:
• Consider creating new accounts to capture adjustments that may beneeded to effectively provide the information necessary for goodwillimpairment testing
• Clarify management’s role in data gathering• Get the auditors involved as soon as possible• Select appraisers and involve them as soon as possible• Clearly define the scope of the engagement and the responsibilities
and expectations of each of the involved parties (company manage-ment, auditors, and appraisers)
• Promptly complete financial statements before the due dates
The steps outlined in Procedures for the Valuation of Intangible As-sets (Exhibit 7.1 at the end of the chapter), are provided to assist auditors,
Implementation Aids 141
management, and valuation analysts in compiling operational informa-tion that will aid in assigning values to intangible assets acquired in abusiness combination. These procedures will also assist in determiningthe appropriate valuation approach for each intangible asset (i.e., cost,market, income). The Intangible Asset Data Request (Exhibit 7.2 at theend of the chapter) should be used with the above procedures to assist ingathering necessary information.
A portion of the purchase price in a purchase business combinationmay be allocated to in-process research and development (IPR&D), butIPR&D is particularly common in acquisitions of software, electronicdevices, and pharmaceutical companies. The Model Audit Program (Ex-hibit 7.3) outlines audit procedures that should be considered when anentity has consummated a purchase business combination that may in-volve IPR&D.
The Model Audit Program procedures focus on the software, elec-tronic devices, and pharmaceutical industries. Further tailoring of the rec-ommended procedures may be necessary upon review of the specificcircumstances of each acquisition. These modifications may be influ-enced by the business, legal, and regulatory environments of both the ac-quiring company and the acquiree. Hence, in tailoring the recommendedprocedures to each acquisition, the auditors should apply their profes-sional judgment in correlation with the knowledge of the environments ofthe acquiring company and the acquiree.
142 Implementation Aids

Implementation Aids 143
Exhibit 7.1 Procedures for the Valuation of Intangible Assets
BUSINESS NAME: ______________________________________________________
VALUATION DATE:_____________________________________________________
The definition of intangible asset should include current and non-current assets (excluding fi-nancial instruments) that lack physical substance. An intangible asset acquired in a businesscombination shall be recognized as an asset apart from goodwill if that asset arises from con-tractual or other legal rights. If an intangible asset does not arise from contractual or other le-gal rights, it shall be recognized as an asset apart from goodwill only if it is separable; that is,if it is capable of being separated or divided from the acquired enterprise and sold, trans-ferred, licensed, rented, or exchanged (regardless of whether there is an intent to do so). ForGAAP purposes, an intangible asset that cannot be sold, transferred, licensed, rented, or ex-changed individually is considered separable if it can be sold, transferred, licensed, rented, orexchanged with a related contract, asset, or liability. However, the value of an assembledworkforce of at-will employees acquired in a business combination shall be included in theamount recorded as goodwill regardless of whether it meets the criteria for recognition apartfrom goodwill.
Please complete the following to the best of your ability:
1. Determine the standard of value:a. Fair market valueb. Fair valuec. Investment valued. Intrinsic value or fundamental valuee. _________________________________________________
2. State the purpose of the valuation:____________________________________________________
3. Determine the premise of value:a. Value in use, as part of a going concern (This premise contemplates the contribu-
tory value to an income-producing enterprise of the intangible asset as part of amass assemblage of tangible and intangible assets.)
b. Value in place, as part of an assemblage of assets (This premise contemplatesthat the intangible asset is fully functional, is part of an assemblage of assets thatis ready for use but is not currently engaged in the production of income.)
c. Value in exchange, in an orderly disposition (This premise contemplates that theintangible asset will be sold in its current condition, with normal exposure to itsappropriate secondary market, but without the contributory value of any associ-ated tangible or intangible assets.)
d. Value in exchange, in a forced liquidation (This premise contemplates that the in-tangible asset is sold piecemeal, in an auction environment, with an artificiallyabbreviated exposure to its secondary market.)
Disclaimer Excluding Any Warranties: This checklist is designed to provide guidance to analysts, audi-tors, and management, but is not to be used as a substitute for professional judgment. These proceduresmust be altered to fit each assignment. The practitioner takes sole responsibility for implementation ofthis guide. The implied warranties of merchantability and fitness of purpose and all other warranties,whether expressed or implied, are excluded from this transaction and shall not apply to this guide. TheFinancial Valuation Group shall not be liable for any indirect, special, or consequential damages.
© 2002. The Financial Valuation Group, LC. Used with permission.
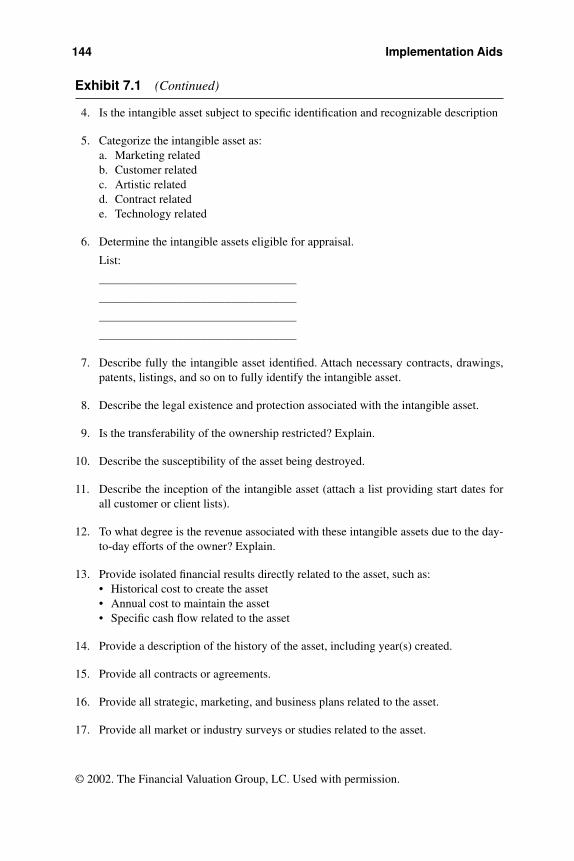
144 Implementation Aids
Exhibit 7.1 (Continued)
4. Is the intangible asset subject to specific identification and recognizable description
5. Categorize the intangible asset as:a. Marketing relatedb. Customer relatedc. Artistic relatedd. Contract relatede. Technology related
6. Determine the intangible assets eligible for appraisal.
List:
_________________________________
_________________________________
_________________________________
_________________________________
7. Describe fully the intangible asset identified. Attach necessary contracts, drawings,patents, listings, and so on to fully identify the intangible asset.
8. Describe the legal existence and protection associated with the intangible asset.
9. Is the transferability of the ownership restricted? Explain.
10. Describe the susceptibility of the asset being destroyed.
11. Describe the inception of the intangible asset (attach a list providing start dates forall customer or client lists).
12. To what degree is the revenue associated with these intangible assets due to the day-to-day efforts of the owner? Explain.
13. Provide isolated financial results directly related to the asset, such as:• Historical cost to create the asset• Annual cost to maintain the asset• Specific cash flow related to the asset
14. Provide a description of the history of the asset, including year(s) created.
15. Provide all contracts or agreements.
16. Provide all strategic, marketing, and business plans related to the asset.
17. Provide all market or industry surveys or studies related to the asset.
© 2002. The Financial Valuation Group, LC. Used with permission.
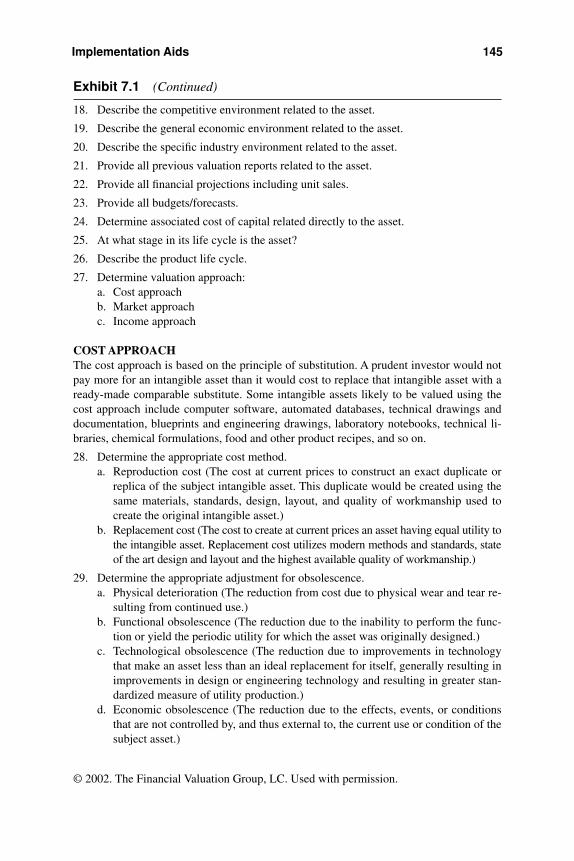
Implementation Aids 145
Exhibit 7.1 (Continued)
18. Describe the competitive environment related to the asset.
19. Describe the general economic environment related to the asset.
20. Describe the specific industry environment related to the asset.
21. Provide all previous valuation reports related to the asset.
22. Provide all financial projections including unit sales.
23. Provide all budgets/forecasts.
24. Determine associated cost of capital related directly to the asset.
25. At what stage in its life cycle is the asset?
26. Describe the product life cycle.
27. Determine valuation approach:a. Cost approachb. Market approachc. Income approach
COST APPROACHThe cost approach is based on the principle of substitution. A prudent investor would notpay more for an intangible asset than it would cost to replace that intangible asset with aready-made comparable substitute. Some intangible assets likely to be valued using thecost approach include computer software, automated databases, technical drawings anddocumentation, blueprints and engineering drawings, laboratory notebooks, technical li-braries, chemical formulations, food and other product recipes, and so on.
28. Determine the appropriate cost method.a. Reproduction cost (The cost at current prices to construct an exact duplicate or
replica of the subject intangible asset. This duplicate would be created using thesame materials, standards, design, layout, and quality of workmanship used tocreate the original intangible asset.)
b. Replacement cost (The cost to create at current prices an asset having equal utility tothe intangible asset. Replacement cost utilizes modern methods and standards, stateof the art design and layout and the highest available quality of workmanship.)
29. Determine the appropriate adjustment for obsolescence.a. Physical deterioration (The reduction from cost due to physical wear and tear re-
sulting from continued use.)b. Functional obsolescence (The reduction due to the inability to perform the func-
tion or yield the periodic utility for which the asset was originally designed.)c. Technological obsolescence (The reduction due to improvements in technology
that make an asset less than an ideal replacement for itself, generally resulting inimprovements in design or engineering technology and resulting in greater stan-dardized measure of utility production.)
d. Economic obsolescence (The reduction due to the effects, events, or conditionsthat are not controlled by, and thus external to, the current use or condition of thesubject asset.)
© 2002. The Financial Valuation Group, LC. Used with permission.

146 Implementation Aids
Exhibit 7.1 (Continued)
30. Determine the number of employees involved in creating the intangible asset.
31. Categorize the employees by salary level.
32. Capture the associated employer cost related to each hour of salary level.
33. Determine the number of hours per employee salary level utilized to develop the as-set.
34. Extend the number of hours per salary level by the salary and associated employercost for an estimate of reproduction costs new.
35. Adjust reproduction cost new for associated deterioration or obsolescence.
36. Compare net result of reproduction cost with replacement cost new.
37. Complete the cost approach analysis.
MARKET APPROACHThe market approach compares the subject intangible asset with similar or comparable in-tangible assets that have been sold or listed for sale in the appropriate primary or sec-ondary market. Correlations must be extrapolated.
38. Determine the market served by the guideline or comparable asset.
39. Complete a primary and secondary market search for similar guideline assets, in-cluding an analysis of available public data specific to royalty rates and intellectualproperty transactions.
40. Determine the historical return on the investment earned by the subject intangible as-set.
41. Determine the income generating capacity of the subject intangible asset.
42. Determine the expected prospective return on the investment earned by the guidelineasset.
43. Determine the expected prospective return by the subject intangible asset.
44. Determine the historical age and expected remaining useful life of the guideline orcomparable intangible asset.
45. Determine the historical age and the remaining useful life of the subject intangibleasset.
46. Analyze the terms of the sale of the guideline or the comparable intangible asset in-cluding:• The time of the sale• The price paid• The payout terms• Other related terms (including special seller financing and earn-out agreement,
non-compete agreement, and so on)
© 2002. The Financial Valuation Group, LC. Used with permission.
Implementation Aids 147
Exhibit 7.1 (Continued)
47. Determine the degree of adjustment necessary to the guideline or comparable intan-gible asset related to:
a. Physical deterioration
b. Functional obsolescence
c. Technological obsolescence
d. Economic obsolescence
48. Determine the degree of adjustment necessary to the subject intangible asset relatedto:
a. Physical deterioration
b. Functional obsolescence
c. Technological obsolescence
d. Economic obsolescence
49. Complete extrapolation of market approach correlation.
INCOME APPROACH
50. Determine the economic income related to the identified intangible asset for the fol-lowing:
a. Net income before tax
b. Net income after tax
c. Net operating income
d. Gross rental income
e. Gross royalty or license income (actual or hypothetical if a relief from royaltiesmethod is employed, in which case should include an analysis of available publicdata specific to royalty rates and intellectual property transactions)
f. Gross or operating cash flow
g. Net or free cash flow
51. Determine the direct cost associated with maintaining the identified intangible asset.These costs should include cost of operating the asset, storing the asset (facilities),and managing a return from the asset (staff expenses). Pay particular attention to anyanticipated unusual costs (such as renewing a patent).
52. Determine specific cash flow to the intangible asset by taking an economic return oncontributory assets that are part of the initial cash flow stream. Contributory assetsinclude:
• Working capital
• Fixed assets
• Other intangible assets
© 2002. The Financial Valuation Group, LC. Used with permission.

148 Implementation Aids
Exhibit 7.1 (Continued)
53. Determine an appropriate discount rate reflecting a fair return on the investment byconsidering:
a. The opportunity cost of capital
b. The term period of the investment (including consideration of the expected re-maining life of the subject intangible asset)
c. The systematic risk of the investment
d. The unsystematic risk of the investment
e. The time value of money
f. Growth (utilized for computing terminal value)
54. Obtain the necessary data to complete the actuarial retirement rate methodology in-cluding:
• Inception dates for all active files
• Inception dates and retirement dates for all inactive files comprising the subjectintangible asset (5-year history desirable)
55. In absence of hard data for No. 54 above, obtain management’s representations as to:
• Average age of all active files
• Average remaining life of all active files
• “Estimate the number of visits per file”
56. Complete the actuarial retirement rate methodology by:
• Observing the data
• Determine the curve fitting using appropriate statistical tools
• S-curve
• O-curve
• L-curve
• R-curve
57. Match the actuarial retirement rate curve with the actual data.
58. Determine the probable life curve.
59. Determine the remaining useful life and survivorship percentages.
60. Apply the survivorship percentages to the discounted cash flow.
61. Complete income approach methodology.
RELIEF FROM ROYALTIES METHOD
62. How is the licensed product unique? What are the competitive advantages of the li-censed product including the scope and remaining life of any patents related to theproducts?
© 2002. The Financial Valuation Group, LC. Used with permission.
Implementation Aids 149
Exhibit 7.1 (Continued)
63. Analyze the markets in which the licensee will sell the licensed products, including:
a. Market size
b. Growth rates
c. Extent of competition
d. Recent developments
64. Determine the degree of complexity in the sale of the licensed product.
65. Determine the extent of customization in customer-specific applications. (Note:Royalty rates are generally inversely related to the level of complexity and licenseecustomization.)
66. Determine the size of the licensed territory, including any restrictions or exclusivity.(Note: Exclusivity is directly correlated to higher royalty rates.)
67. Determine the length of the initial license term and provisions for renewal. (Note:Royalty rates will increase if the provisions for renewal are favorable for licensing.)
68. What are the provisions for termination? (Note: The conditions for unilateral licensetermination generally protect the licensor from a material breach committed by thelicensee. These terms should be identified.)
69. Does a minimum royalty rate exist?
70. Analyze the licensee’s ability to assign the license to a third party, either directly orindirectly (for instance through the purchase of stock ownership).
71. What is the licensor’s presence within its own markets?
72. What is the licensor’s financial viability?
73. What is the licensor’s size and market share?
74. What is the licensor’s depth of senior management and stability?
75. What is the licensor’s depth of technical knowledge?
76. What is the licensor’s business plan related to the licensed products, including R&Dfunding and market analysis?
77. To what extent and timeliness does the licensor offer to support the licensee includ-ing:
a. Technical product advice
b. Assisting the licensee with sales
c. Assisting the licensee with marketing efforts in the defined territory
© 2002. The Financial Valuation Group, LC. Used with permission.

150 Implementation Aids
Exhibit 7.1 (Continued)
78. Determine the licensee’s available profit percentage available for the royalty (25%?,50%?) dependent upon the following:
a. Available profitability as compared with the industry
b. The nature of the long-term competitive advantage of the product
c. The degree the license terms are favorable to the licensee
d. The degree of support and market share offered by the licensor
e. The degree of any noncash value offered by the licensee to the licensor
f. The degree the licensee is required to purchase certain components used in themanufacturing of licensed products from the licensor (mandatory supply arrange-ment)
g. The degree of foreign exchange risk borne by either the licensee or the licensor(the risk of future devaluation).
© 2002. The Financial Valuation Group, LC. Used with permission.
Implementation Aids 151
Exhibit 7.2 Intangible Asset Data Request
BUSINESS NAME:______________________________________________________
VALUATION DATE:_____________________________________________________
This is a generalized information request. Some items may not pertain to your company,and some items may not be readily available to you. In such cases, please indicate N/A ornotify us if other arrangements can be made to obtain the data. Items already providedhave been marked with an “X.” If you have any questions on the development of this in-formation, please call.A. Patents____ 1. Provide a summary of patents held by the Company.____ 2. Provide copies of patent applications and patent abstracts.____ 3. Distinguish which patents have commercial applications (i.e., are producing
or are reasonably forecast to produce revenue in the future).____ 4. Provide historical cost records documenting development of the patent(s):
a. Person hours to developb. Various technical levels of persons working on the assignmentc. Pay scales for individuals in 4bd. Information to determine overhead rate
____ 5. Identify patents and associated products that now have or are expected tohave commercial viability.a. Prepare forecast or projection of revenues related to patent over the life
of the patentb. Project direct expenses associated with producing revenue in 5a
____ 6. Comment on the possibility of extending patent protection beyond statutory lifeof patent.
____ 7. Provide details of any patents you are licensing in or out.B. Copyrights____ 8. Provide a list of all copyrighted registrations.____ 9. Provide a list of works (articles, books, painting, etc.).
10. Identify copyright names that are associated with products and/or services(such as software or report templates).
11. Identify historical sale of products and/or services employing the works forthe last five years.
12. Provide projection of products and/or services that will employ the works forthe next five years.
13. Provide details of any copyrighted works you are licensing in or out.
Disclaimer Excluding Any Warranties: This checklist is designed to provide guidance to analysts,auditors, and management, but is not to be used as a substitute for professional judgment. These pro-cedures must be altered to fit each assignment. The practitioner takes sole responsibility for imple-mentation of this guide. The implied warranties of merchantability and fitness of purpose and allother warranties, whether expressed or implied, are excluded from this transaction and shall not ap-ply to this guide. The Financial Valuation Group shall not be liable for any indirect, special, or conse-quential damages.
© 2002. The Financial Valuation Group, LC. Used with permission.
152 Implementation Aids
Exhibit 7.2 (Continued)
C. Trademarks and Trade Names____ 14. Provide a list of all trademark/trade name registrations.
____ 15. Provide a list of trademark/trade names that are not registered.
____ 16. Identify trademarks/trade names that are associated with products and/orservices.
____ 17. Identify historical sale of products and/or services employing trademarks/tradenames for the last five years.
____ 18. Provide projection of products and/or services that employ the trademarks/tradenames for the next five years.
____ 19. Provide details of any trademarks/trade names you are licensing in or out.
D. Proprietary Processes/Products Technology
____ 20. Describe the proprietary process/product technology.
____ 21. Describe competitive advantages and disadvantages of the proprietaryprocess/product technology.
____ 22. Describe industry trends and competitive pressures that may affect the usefullife of the proprietary process/product technology.
____ 23. In light of 21 and 22 above, estimate the useful life of the proprietaryprocess/product technology support.
____ 24. Describe products or services that employ the proprietary process/producttechnology.
____ 25. If available, provide historical cost records documenting development of theprocess/product technology:
a. Person hours to develop
b. Various technical levels of persons working on the assignment
c. Pay scales for individuals in 25b
d. Information to determine overhead rate
____ 26. In the absence of historical cost records, estimate effort to recreate theprocess/product technology if it were to be developed from scratch:
a. Who would work on the assignment (employees and consultants)
b. Pay rates for individuals in 26a
c. Information to determine overhead rate
____ 27. Identify historical sale of products and/or services employing process/prod-uct technology for the last five years.
____ 28. Provide projection of products and/or services that employ the process/prod-uct technology for the next five years.
____ 29. Project revenues including licensing income for the lifespan of process/prod-uct technology.
© 2002. The Financial Valuation Group, LC. Used with permission.
Implementation Aids 153
Exhibit 7.2 (Continued)
____ 30. Project direct expenses associated with producing revenue in 29.____ 31. Obtain or develop indirect expenses (i.e., overhead).
____ 32. Provide details of any technology you are licensing in or out.
E. Know-How
____ 33. Describe know-how, including competitive advantages and disadvantages.
____ 34. Describe industry trends and competitive pressures that may affect the usefullife of the know-how.
____ 35. In light of 33 and 34 above, estimate the useful life of the know-how.
____ 36. List products or services that employ the know-how.
____ 37. If available, provide historical cost records documenting development of theknow-how:a. Person hours to developb. Various technical levels of persons working on the assignmentc. Pay scales for individuals in 37bd. Information to determine overhead rate
____ 38. In the absence of historical cost records, estimate corporate effort to recreatethe know-how if it were to be developed from scratch:a. Who would work on the assignment (employees and consultants)b. Pay rates for individuals in 38ac. Information to determine overhead rate
39. Identify historical sale of revenues for products and/or services employingknow-how for the last five years.
____ 40. Know-how associated with products and/or services:a. Provide projection of products and/or services that employ the know-how
for the next five yearsb. Project direct expenses associated with producing revenue in 40ac. Obtain or develop indirect expenses (i.e., overhead)
____ 41. Provide details of any know-how you are licensing in or out.
F. Software
____ 42. Describe the function of the software.
____ 43. For cost approach:a. If available, provide historical cost records documenting development of
the software:(1) Person hours to develop(2) Various technical levels of persons working on the assignment(3) Pay scales for individuals in 43a(2)(4) Information to determine overhead rate
b. In the absence of historical cost records, estimate effort to recreate thesoftware if it were to be developed from scratch:(1) Who would work on the assignment (employees and consultants)
© 2002. The Financial Valuation Group, LC. Used with permission.
154 Implementation Aids
Exhibit 7.2 (Continued)
(2) Pay rates for individuals in 43b(1)(3) Information to determine overhead rate
____ 44. Lifing/obsolescence:a. Expected useful life at inception and at valuation date. Obtain support for
estimateb. Date software actually placed in usec. Describe internal development that may extend lifed. Describe internal development of replacement software that might
shorten lifee. Describe external factors that may affect life
____ 45. For income approach:a. Obtain historical revenues applicable to softwareb. Project revenues including licensing income for lifespan of softwarec. Project direct expenses associated with producing revenue in 45bd. Obtain or develop indirect expenses (i.e., overhead)e. Identify expenses, direct and indirect, not associated with acquired soft-
ware
G. Customer Relationships____ 46. Provide customer sales history for the last five years for the top ten cus-
tomers.____ 47. Provide complete customer history for the last five years (this would be for
lifing).____ 48. Provide financial data representing annual costs for the last five years associ-
ated with developing/soliciting new customers.____ 49. Provide schedule of new customers gained in each of the last five years with
sales.____ 50. For the last five years, number of customers in a given year that failed to pur-
chase in the following year. Provide those customers’ sales for the prior year.
H. General Information____ 51. Financial statements for fiscal years ending FIVE YEARS.____ 52. Interim financial statements for the year-to-date DATE OF VALUATION
AND ONE YEAR PRIOR.____ 53. Financial projections, if any, for the current year and the next three years. In-
clude any prepared budgets and/or business plans.____ 54. Federal and State Corporate Income Tax Returns and supporting schedules
for fiscal years ending FIVE YEARS.____ 55. Explanation of significant non-recurring and/or non-operating items appear-
ing on the financial statements in any fiscal year if not detailed in footnotes.____ 56. Provide copies of any appraisals of the stock of the Company made during
the last three years.____ 57. Provide copies of any appraisals of real estate or personal property owned by
the Company.
© 2002. The Financial Valuation Group, LC. Used with permission.

Implementation Aids 155
Exhibit 7.2 (Continued)
____ 58. Provide a summary of major covenants or agreements binding on the Com-pany, e.g., union contracts, capital leases, employment contracts, service con-tracts, product warranties, etc.
____ 59. List all subsidiary companies and the percentage ownership in each.
____ 60. Name any “related” companies (common ownership, common shareholders,etc.) and briefly describe the relationship(s).
_____ 61. Provide all closing statements and purchase agreements related to all pur-chases of the Company’s stock over the history of the Company.
____ 62. Provide all closing statements and purchase agreements related to all mergersor acquisitions by the Company up to the valuation date.
____ 63. Provide terms of any offers to purchase the Company.
© 2002. The Financial Valuation Group, LC. Used with permission.
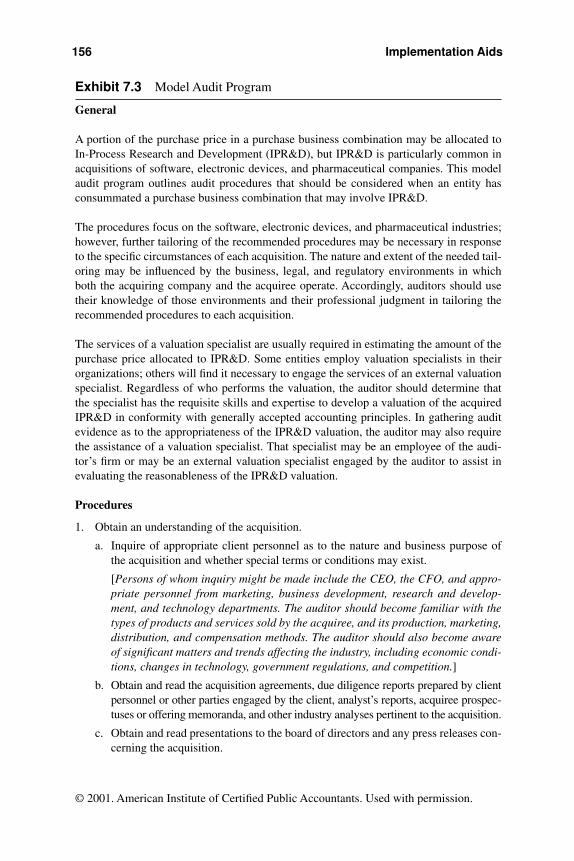
156 Implementation Aids
Exhibit 7.3 Model Audit Program
General
A portion of the purchase price in a purchase business combination may be allocated toIn-Process Research and Development (IPR&D), but IPR&D is particularly common inacquisitions of software, electronic devices, and pharmaceutical companies. This modelaudit program outlines audit procedures that should be considered when an entity hasconsummated a purchase business combination that may involve IPR&D.
The procedures focus on the software, electronic devices, and pharmaceutical industries;however, further tailoring of the recommended procedures may be necessary in responseto the specific circumstances of each acquisition. The nature and extent of the needed tail-oring may be influenced by the business, legal, and regulatory environments in whichboth the acquiring company and the acquiree operate. Accordingly, auditors should usetheir knowledge of those environments and their professional judgment in tailoring therecommended procedures to each acquisition.
The services of a valuation specialist are usually required in estimating the amount of thepurchase price allocated to IPR&D. Some entities employ valuation specialists in theirorganizations; others will find it necessary to engage the services of an external valuationspecialist. Regardless of who performs the valuation, the auditor should determine thatthe specialist has the requisite skills and expertise to develop a valuation of the acquiredIPR&D in conformity with generally accepted accounting principles. In gathering auditevidence as to the appropriateness of the IPR&D valuation, the auditor may also requirethe assistance of a valuation specialist. That specialist may be an employee of the audi-tor’s firm or may be an external valuation specialist engaged by the auditor to assist inevaluating the reasonableness of the IPR&D valuation.
Procedures
1. Obtain an understanding of the acquisition.
a. Inquire of appropriate client personnel as to the nature and business purpose ofthe acquisition and whether special terms or conditions may exist.
[Persons of whom inquiry might be made include the CEO, the CFO, and appro-priate personnel from marketing, business development, research and develop-ment, and technology departments. The auditor should become familiar with thetypes of products and services sold by the acquiree, and its production, marketing,distribution, and compensation methods. The auditor should also become awareof significant matters and trends affecting the industry, including economic condi-tions, changes in technology, government regulations, and competition.]
b. Obtain and read the acquisition agreements, due diligence reports prepared by clientpersonnel or other parties engaged by the client, analyst’s reports, acquiree prospec-tuses or offering memoranda, and other industry analyses pertinent to the acquisition.
c. Obtain and read presentations to the board of directors and any press releases con-cerning the acquisition.
© 2001. American Institute of Certified Public Accountants. Used with permission.
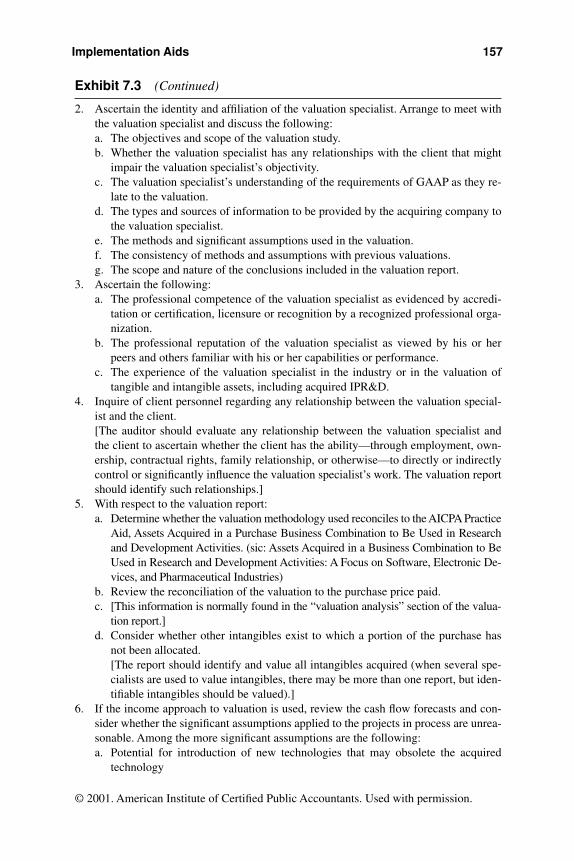
Implementation Aids 157
Exhibit 7.3 (Continued)
2. Ascertain the identity and affiliation of the valuation specialist. Arrange to meet withthe valuation specialist and discuss the following:a. The objectives and scope of the valuation study.b. Whether the valuation specialist has any relationships with the client that might
impair the valuation specialist’s objectivity.c. The valuation specialist’s understanding of the requirements of GAAP as they re-
late to the valuation.d. The types and sources of information to be provided by the acquiring company to
the valuation specialist.e. The methods and significant assumptions used in the valuation.f. The consistency of methods and assumptions with previous valuations.g. The scope and nature of the conclusions included in the valuation report.
3. Ascertain the following:a. The professional competence of the valuation specialist as evidenced by accredi-
tation or certification, licensure or recognition by a recognized professional orga-nization.
b. The professional reputation of the valuation specialist as viewed by his or herpeers and others familiar with his or her capabilities or performance.
c. The experience of the valuation specialist in the industry or in the valuation oftangible and intangible assets, including acquired IPR&D.
4. Inquire of client personnel regarding any relationship between the valuation special-ist and the client.[The auditor should evaluate any relationship between the valuation specialist andthe client to ascertain whether the client has the ability—through employment, own-ership, contractual rights, family relationship, or otherwise—to directly or indirectlycontrol or significantly influence the valuation specialist’s work. The valuation reportshould identify such relationships.]
5. With respect to the valuation report:a. Determine whether the valuation methodology used reconciles to the AICPA Practice
Aid, Assets Acquired in a Purchase Business Combination to Be Used in Researchand Development Activities. (sic: Assets Acquired in a Business Combination to BeUsed in Research and Development Activities: A Focus on Software, Electronic De-vices, and Pharmaceutical Industries)
b. Review the reconciliation of the valuation to the purchase price paid.c. [This information is normally found in the “valuation analysis” section of the valua-
tion report.]d. Consider whether other intangibles exist to which a portion of the purchase has
not been allocated.[The report should identify and value all intangibles acquired (when several spe-cialists are used to value intangibles, there may be more than one report, but iden-tifiable intangibles should be valued).]
6. If the income approach to valuation is used, review the cash flow forecasts and con-sider whether the significant assumptions applied to the projects in process are unrea-sonable. Among the more significant assumptions are the following:a. Potential for introduction of new technologies that may obsolete the acquired
technology
© 2001. American Institute of Certified Public Accountants. Used with permission.
158 Implementation Aids
Exhibit 7.3 (Continued)
b. Likelihood of project completionc. Estimates of stage of completion and time to completiond. Cost to completee. Product life cycle and technology development strategiesf. Expected sales volumes, product pricing, and expected revenues (exclusive of
amounts attributable to contributory assets and core technology)g. Production and other costs (exclusive of the effects of buyer synergies)h. Discount ratesi. Competitors’ expected prices
7. Test the data furnished to the valuation specialist as follows:a. Assess the relative importance of IPR&D to the acquisition by considering the
materials reviewed during the planning procedures as well as other materials,such as presentations to the Board, white papers, and due diligence working pa-pers.
b. Test the mathematical accuracy of the forecasts furnished to the specialist.c. Determine whether cash flow estimated were developed using “market partici-
pant” assumptions. With respect to “market participant” assumptions, paragraph1.1.16 of the AICPA Practice Aid states:. . . For purposes of assigning cost to the assets acquired in accordance with APBOpinion 16, the amount of the purchase price allocated to an acquired identifiable in-tangible asset would not include any entity-specific synergistic value. Fair value doesnot include strategic or synergistic value resulting from expectations about futureevents that are specific to a particular buyer because the value associated with thosecomponents are unique to the buyer and seller and would not constitute market-based assumptions. As such, entity-specific value associated with strategic or syner-gistic components would be included in goodwill. Fair value would incorporateexpectations about future events that affect market participants. If the acquiring com-pany concludes that the discounted cash flow method best approximates the fairvalue of an acquired identifiable intangible asset, the discounted cash flows wouldincorporate assumptions that market participants would use in their estimates of fu-ture revenues and future expenses. (sic)[A footnote to paragraph 1.1.16 refers readers to current developments in ac-counting related to market participant assumptions.]
d. Consider the amounts of R&D costs expended to date and estimated remainingcompletion costs for reasonableness.
e. Review descriptions of the milestones achieved and compare the status with theactual costs incurred and projected remaining costs.
f. Consider whether IPR&D is related to products that will be marketed externally.g. Inquire of appropriate client personnel whether IPR&D has achieved technologi-
cal feasibility (or the equivalent) and has no alternative future use.8. Evaluate the overall results of the valuation. Consider:
a. Whether the size of the IPR&D charge is consistent with the overall nature of thebusiness and management’s purchase rationale.
b. The size of the existing base (or core) technology value relative to the IPR&Dvalue is reasonable.
© 2001. American Institute of Certified Public Accountants. Used with permission.
Implementation Aids 159
Exhibit 7.3 (Continued)
c. The reasonableness of the IPR&D value with respect to the extent of completionefforts remaining.
d. Whether the IPR&D value will be realizable and whether both the buyer andseller are compensated considering the risks.
e. Major milestones achieved in the IPR&D project as of the purchase date and theirconsistency with the valuation.
f. The entire purchase price allocation reflects the acquiring company’s technology,industry position, age, reputation, and strategic plan.
9. Obtain a representation letter from the client that includes the following:a. Management agrees with the findings of the valuation specialist.b. The IPR&D assets have substance, are incomplete, and have no alternative future
use.c. The historical financial data provided to the valuation specialist was prepared on a
basis consistent with the audited financial statements.d. Forecasts and other estimates provided to the valuation specialist are consistent
with those developed for other parties or for internal use. The forecasts of futurecash flows used in the valuation represent management’s best estimate of futureconditions consistent with the assumptions specified in the specialist’s valuationusing market participant assumptions rather that those that are entity specific (seethe footnote to paragraph 1.1.16 of the AICPA Practice Aid).
e. Under the traditional approach, the discount rate applied to estimated future netcash flows appropriately reflects the nature and complexity of the remaining de-velopment effort and the amount and timing of estimated expenditures necessaryto complete the development of the IPR&D projects.
10. Determine that information requiring separate disclosure in the financial statementsis properly identified in the working papers and presented in the financial statements,including the disclosures identified in paragraph 4.2 of the AICPA Practice Aid.
Conclusion
Based on the procedures performed, we are satisfied that our working papers appropri-ately document that acquired IPR&D does not contain any material misstatements, in re-lation to the financial statements taken as a whole. Exceptions are attached or statedbelow.
______________________________________________________________________
______________________________________________________________________
© 2001. American Institute of Certified Public Accountants. Used with permission.
Endnotes
Chapter 1 History of Mergers and Acquisitions and FinancialReporting
1. Accounting Principles Board, APB Opinion No. 17, Intangible Assets (Au-gust 1970) at 27.
2. Ibid, at 9.3. Applied Financial Information, LP, Mergerstat® Review 2001 (Los Angeles,
CA: 2001), p. 9.4. Accounting Principles Board, APB Opinion No. 16, Business Combinations
(August 1970), at 11.5. Ibid., at 12.6. Ibid., at 11.7. Ibid., at 12.8. Accounting Principles Board, APB Opinion No. 17, Intangible Assets (Au-
gust 1970), at 27–31.9. Accounting Principles Board, APB Opinion No. 16, Business Combinations
(August 1970), at 46–48.10. Ibid., at 16.11. Ibid., at 18–21.12. Accounting Principles Board, APB Opinion No. 17, Intangible Assets (Au-
gust 1970), at 1–9.13. Ibid., at 27.14. Financial Accounting Standards Board, Statement of Financial Accounting
Standards No. 141, Business Combinations (June 2001), Appendix B.15. Newark Morning Ledger Co. v. U.S., 734 F Supp. 176 (D.N.J. 1990) cited in
Consulting Services Practice Aid 99-2, Valuing Intellectual Property andCalculating Infringement Damages, AICPA p. 99.
16. House of Representatives, H.R. 5365 IH, “Financial Accounting for Intangi-bles Reexamination (FAIR) Act,” 106th Congress, 2d Session, (October 3,2000).
17. Hopkins, et al., “Purchase, Pooling, and Equity Analysts’ Valuation Judg-ments,” The Accounting Review, Vol. 75, No. 3 (July 2000), pp. 260–261.
18. Ibid., pp. 261–262.19. Ibid., pp. 276–277.20. Ibid., p. 270.
160
21. Stephen Taub, AOL: You’ve Got Impairment, CFO.com, (January 8, 2002).22. Roy Harris and Jennifer Caplan, The Perils of Impairment, CFO.com, (Jan-
uary 1, 2002).23. Chris Ayres, “US Set for $1 Trillion of Internet Writeoffs,” The Times, (Jan-
uary 10, 2002), http://www.thetimes.co.uk.24. Ibid.25. Craig Schneider, Pool’s Closed, CFO.com, (June 29, 2001).26. PriceWaterhouseCoopers, Shedding Light on the New Business Combina-
tion Rules—A Guide for Deal Makers, Executive Summary.27. Bear Stearns, Goodbye, Goodwill (June 2001), p. 9.28. Ibid.29. Ibid.30. Ibid.31. Financial Accounting Standards Board, Exposure Draft, Business Combina-
tions and Intangible Assets (September 1999), at 52.32. Hopkins et al., “Purchase, Pooling, and Equity Analysts’ Valuation Judg-
ments,” The Accounting Review, Vol. 75, No. 3 (July 2000) p. 276.
Chapter 2 Goodwill and Other Intangible Assets in a Business Combination
1. Margaret Blair and Steven Wallman, Unseen Wealth: Report of the Brook-ings Task Force on Intangibles (Washington, DC: Brookings InstitutionPress, 2001), p. 3.
2. International Valuation Standards, Guidance Note No. 4, Intangible Assets(2001), at 3.15.
3. Financial Accounting Standards Board, Statement of Financial StandardsNo. 141: Business Combinations (June 2001), p. 124.
4. Margaret Blair and Steven Wallman, Unseen Wealth: Report of the Brook-ings Task Force on Intangibles (Washington, DC: Brookings InstitutionPress, 2001), p. 15.
5. Michael Mard, Task Force Report to Business Valuation Subcommittee(2000).
6. FASB Proposal for a New Agenda Project, Disclosure of Information aboutIntangible Assets Not Recognized in Financial Statements (2001).
7. Ibid.8. Baruch Lev, Intangibles: Management, Measurement and Reporting (Wash-
ington, DC: Brookings Institution Press, 2001), p. 22.9. Ibid., p. 23.
10. Financial Accounting Standards Board, Statement of Financial AccountingStandards, No. 141: Business Combinations (June 2001), at 14.
11. Ibid., at A14.12. Ibid., at 39.
Endnotes 161
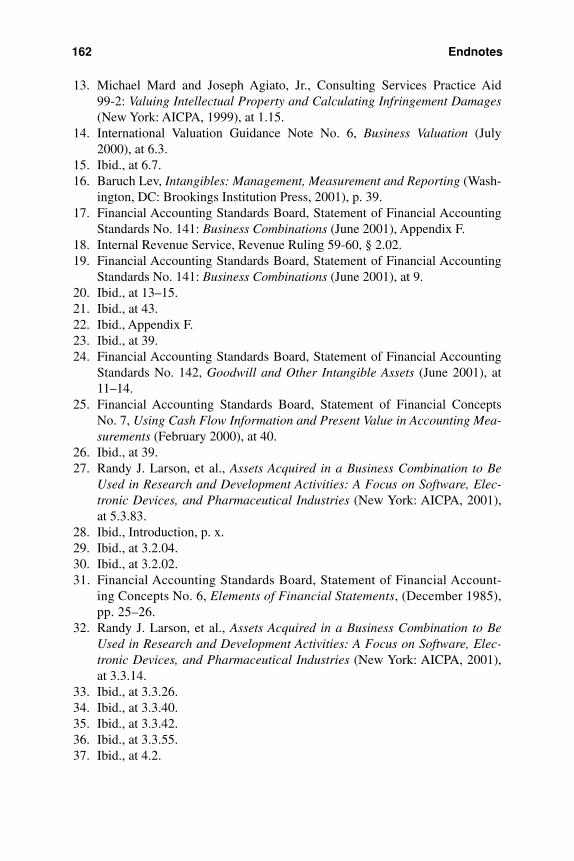
13. Michael Mard and Joseph Agiato, Jr., Consulting Services Practice Aid 99-2: Valuing Intellectual Property and Calculating Infringement Damages(New York: AICPA, 1999), at 1.15.
14. International Valuation Guidance Note No. 6, Business Valuation (July2000), at 6.3.
15. Ibid., at 6.7.16. Baruch Lev, Intangibles: Management, Measurement and Reporting (Wash-
ington, DC: Brookings Institution Press, 2001), p. 39.17. Financial Accounting Standards Board, Statement of Financial Accounting
Standards No. 141: Business Combinations (June 2001), Appendix F.18. Internal Revenue Service, Revenue Ruling 59-60, § 2.02.19. Financial Accounting Standards Board, Statement of Financial Accounting
Standards No. 141: Business Combinations (June 2001), at 9.20. Ibid., at 13–15.21. Ibid., at 43.22. Ibid., Appendix F.23. Ibid., at 39.24. Financial Accounting Standards Board, Statement of Financial Accounting
Standards No. 142, Goodwill and Other Intangible Assets (June 2001), at11–14.
25. Financial Accounting Standards Board, Statement of Financial ConceptsNo. 7, Using Cash Flow Information and Present Value in Accounting Mea-surements (February 2000), at 40.
26. Ibid., at 39.27. Randy J. Larson, et al., Assets Acquired in a Business Combination to Be
Used in Research and Development Activities: A Focus on Software, Elec-tronic Devices, and Pharmaceutical Industries (New York: AICPA, 2001),at 5.3.83.
28. Ibid., Introduction, p. x.29. Ibid., at 3.2.04.30. Ibid., at 3.2.02.31. Financial Accounting Standards Board, Statement of Financial Account-
ing Concepts No. 6, Elements of Financial Statements, (December 1985),pp. 25–26.
32. Randy J. Larson, et al., Assets Acquired in a Business Combination to BeUsed in Research and Development Activities: A Focus on Software, Elec-tronic Devices, and Pharmaceutical Industries (New York: AICPA, 2001),at 3.3.14.
33. Ibid., at 3.3.26.34. Ibid., at 3.3.40.35. Ibid., at 3.3.42.36. Ibid., at 3.3.55.37. Ibid., at 4.2.
162 Endnotes
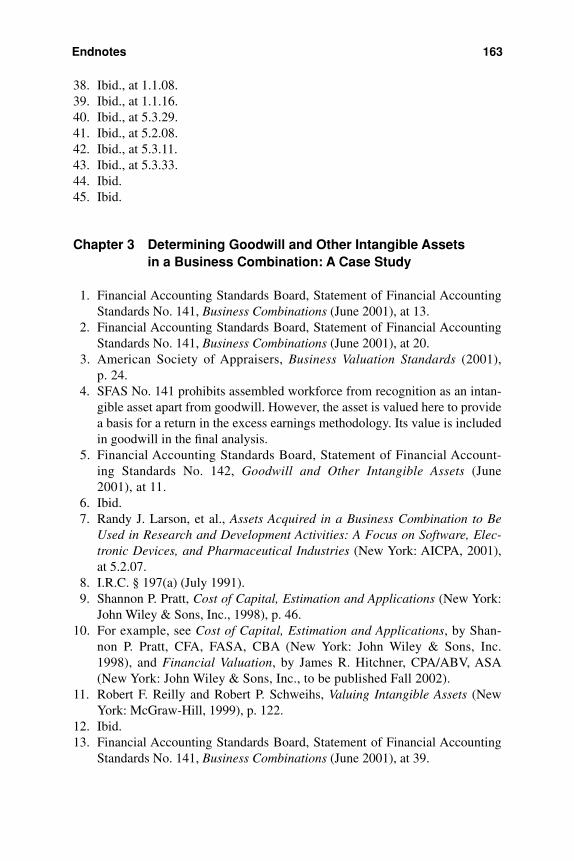
38. Ibid., at 1.1.08.39. Ibid., at 1.1.16.40. Ibid., at 5.3.29.41. Ibid., at 5.2.08.42. Ibid., at 5.3.11.43. Ibid., at 5.3.33.44. Ibid.45. Ibid.
Chapter 3 Determining Goodwill and Other Intangible Assets in a Business Combination: A Case Study
1. Financial Accounting Standards Board, Statement of Financial AccountingStandards No. 141, Business Combinations (June 2001), at 13.
2. Financial Accounting Standards Board, Statement of Financial AccountingStandards No. 141, Business Combinations (June 2001), at 20.
3. American Society of Appraisers, Business Valuation Standards (2001),p. 24.
4. SFAS No. 141 prohibits assembled workforce from recognition as an intan-gible asset apart from goodwill. However, the asset is valued here to providea basis for a return in the excess earnings methodology. Its value is includedin goodwill in the final analysis.
5. Financial Accounting Standards Board, Statement of Financial Account-ing Standards No. 142, Goodwill and Other Intangible Assets (June2001), at 11.
6. Ibid.7. Randy J. Larson, et al., Assets Acquired in a Business Combination to Be
Used in Research and Development Activities: A Focus on Software, Elec-tronic Devices, and Pharmaceutical Industries (New York: AICPA, 2001),at 5.2.07.
8. I.R.C. § 197(a) (July 1991).9. Shannon P. Pratt, Cost of Capital, Estimation and Applications (New York:
John Wiley & Sons, Inc., 1998), p. 46.10. For example, see Cost of Capital, Estimation and Applications, by Shan-
non P. Pratt, CFA, FASA, CBA (New York: John Wiley & Sons, Inc.1998), and Financial Valuation, by James R. Hitchner, CPA/ABV, ASA(New York: John Wiley & Sons, Inc., to be published Fall 2002).
11. Robert F. Reilly and Robert P. Schweihs, Valuing Intangible Assets (NewYork: McGraw-Hill, 1999), p. 122.
12. Ibid.13. Financial Accounting Standards Board, Statement of Financial Accounting
Standards No. 141, Business Combinations (June 2001), at 39.
Endnotes 163
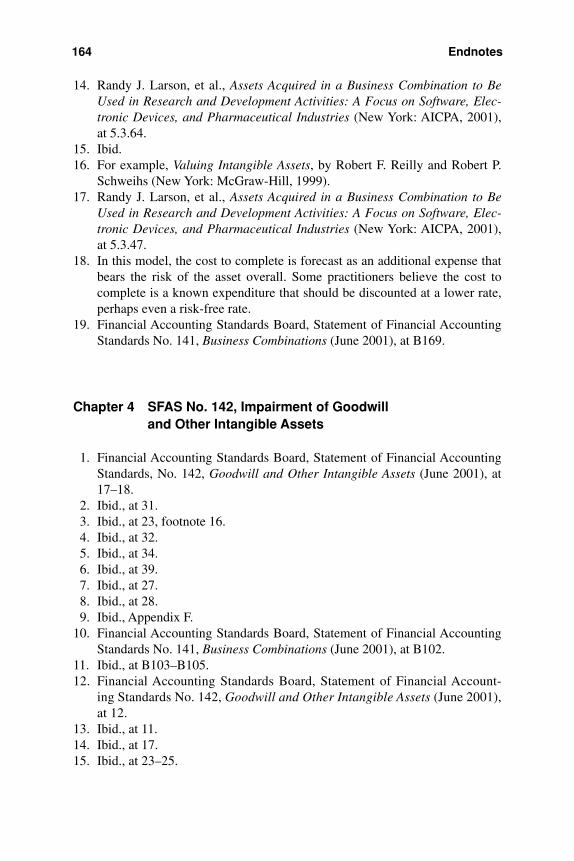
14. Randy J. Larson, et al., Assets Acquired in a Business Combination to BeUsed in Research and Development Activities: A Focus on Software, Elec-tronic Devices, and Pharmaceutical Industries (New York: AICPA, 2001),at 5.3.64.
15. Ibid.16. For example, Valuing Intangible Assets, by Robert F. Reilly and Robert P.
Schweihs (New York: McGraw-Hill, 1999).17. Randy J. Larson, et al., Assets Acquired in a Business Combination to Be
Used in Research and Development Activities: A Focus on Software, Elec-tronic Devices, and Pharmaceutical Industries (New York: AICPA, 2001),at 5.3.47.
18. In this model, the cost to complete is forecast as an additional expense thatbears the risk of the asset overall. Some practitioners believe the cost tocomplete is a known expenditure that should be discounted at a lower rate,perhaps even a risk-free rate.
19. Financial Accounting Standards Board, Statement of Financial AccountingStandards No. 141, Business Combinations (June 2001), at B169.
Chapter 4 SFAS No. 142, Impairment of Goodwill and Other Intangible Assets
1. Financial Accounting Standards Board, Statement of Financial AccountingStandards, No. 142, Goodwill and Other Intangible Assets (June 2001), at17–18.
2. Ibid., at 31.3. Ibid., at 23, footnote 16.4. Ibid., at 32.5. Ibid., at 34.6. Ibid., at 39.7. Ibid., at 27.8. Ibid., at 28.9. Ibid., Appendix F.
10. Financial Accounting Standards Board, Statement of Financial AccountingStandards No. 141, Business Combinations (June 2001), at B102.
11. Ibid., at B103–B105.12. Financial Accounting Standards Board, Statement of Financial Account-
ing Standards No. 142, Goodwill and Other Intangible Assets (June 2001),at 12.
13. Ibid., at 11.14. Ibid., at 17.15. Ibid., at 23–25.
164 Endnotes
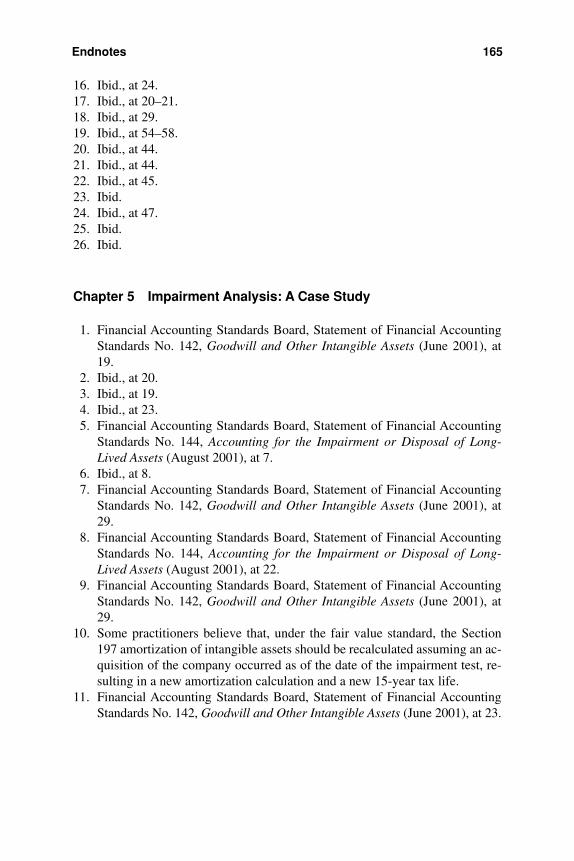
16. Ibid., at 24.17. Ibid., at 20–21.18. Ibid., at 29.19. Ibid., at 54–58.20. Ibid., at 44.21. Ibid., at 44.22. Ibid., at 45.23. Ibid.24. Ibid., at 47.25. Ibid.26. Ibid.
Chapter 5 Impairment Analysis: A Case Study
1. Financial Accounting Standards Board, Statement of Financial AccountingStandards No. 142, Goodwill and Other Intangible Assets (June 2001), at19.
2. Ibid., at 20.3. Ibid., at 19.4. Ibid., at 23.5. Financial Accounting Standards Board, Statement of Financial Accounting
Standards No. 144, Accounting for the Impairment or Disposal of Long-Lived Assets (August 2001), at 7.
6. Ibid., at 8.7. Financial Accounting Standards Board, Statement of Financial Accounting
Standards No. 142, Goodwill and Other Intangible Assets (June 2001), at29.
8. Financial Accounting Standards Board, Statement of Financial AccountingStandards No. 144, Accounting for the Impairment or Disposal of Long-Lived Assets (August 2001), at 22.
9. Financial Accounting Standards Board, Statement of Financial AccountingStandards No. 142, Goodwill and Other Intangible Assets (June 2001), at29.
10. Some practitioners believe that, under the fair value standard, the Section197 amortization of intangible assets should be recalculated assuming an ac-quisition of the company occurred as of the date of the impairment test, re-sulting in a new amortization calculation and a new 15-year tax life.
11. Financial Accounting Standards Board, Statement of Financial AccountingStandards No. 142, Goodwill and Other Intangible Assets (June 2001), at 23.
Endnotes 165
Chapter 6 Issues in and Implementation of SFAS Nos. 141 and 142
1. Financial Accounting Standards Board, Discussion of Agenda Projects as ofJanuary 1, 2002, Business Combinations, http://www.fasb.org/tech/bus-comb.html.
2. Ibid.3. Financial Accounting Standards Board, Business Combinations: Purchase
Method Procedures, March 27, 2002, http://www.fasb.org/project/bc_pur-chasemethod.html.
4. Ibid.5. Financial Accounting Standards Board, FASB Staff Announcement, Topic
No. D-100.6. Financial Accounting Standards Board, Statement of Financial Accounting
Standards No. 141, Business Combinations (June 2001), at 44–45.7. Financial Accounting Standards Board, Statement of Financial Account-
ing Standards No. 142, Goodwill and Other Intangible Assets (June2001), at 40.
8. Accounting Principles Board, APB Opinion No. 18, The Equity Method ofAccounting for Investments in Common Stock (March 1971), at 19(h).
9. Financial Accounting Standards Board, Business Combinations: New Busi-ness Accounting, February 7, 2002, http://www.fasb.org/project/bc_newba-sis.html.
10. Financial Accounting Standards Board, Combinations of Not-for-Profit Or-ganizations, January 23, 2002, http://www.fasb.org/project/nfp.html.
11. Ibid.
166 Endnotes
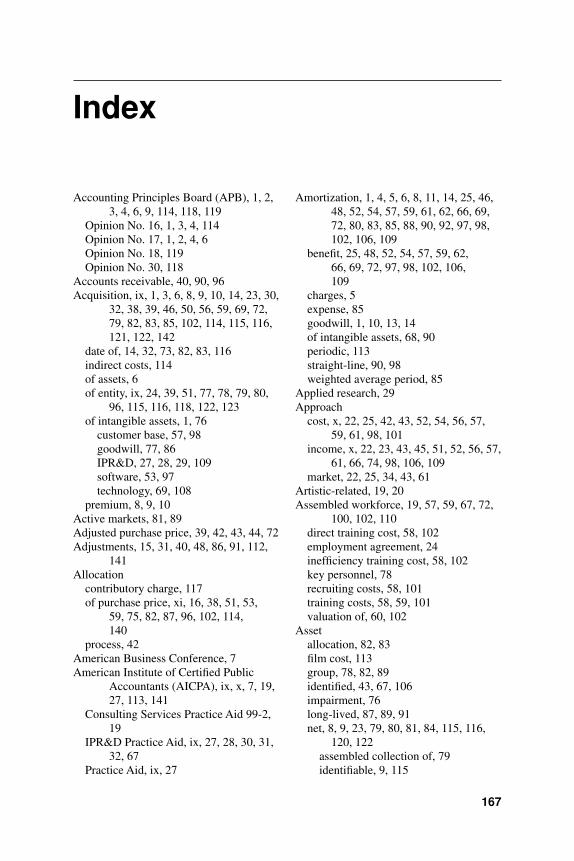
Index
Accounting Principles Board (APB), 1, 2,3, 4, 6, 9, 114, 118, 119
Opinion No. 16, 1, 3, 4, 114Opinion No. 17, 1, 2, 4, 6Opinion No. 18, 119Opinion No. 30, 118
Accounts receivable, 40, 90, 96Acquisition, ix, 1, 3, 6, 8, 9, 10, 14, 23, 30,
32, 38, 39, 46, 50, 56, 59, 69, 72,79, 82, 83, 85, 102, 114, 115, 116,121, 122, 142
date of, 14, 32, 73, 82, 83, 116indirect costs, 114of assets, 6of entity, ix, 24, 39, 51, 77, 78, 79, 80,
96, 115, 116, 118, 122, 123of intangible assets, 1, 76
customer base, 57, 98goodwill, 77, 86IPR&D, 27, 28, 29, 109software, 53, 97technology, 69, 108
premium, 8, 9, 10Active markets, 81, 89Adjusted purchase price, 39, 42, 43, 44, 72Adjustments, 15, 31, 40, 48, 86, 91, 112,
141Allocation
contributory charge, 117of purchase price, xi, 16, 38, 51, 53,
59, 75, 82, 87, 96, 102, 114, 140
process, 42American Business Conference, 7American Institute of Certified Public
Accountants (AICPA), ix, x, 7, 19,27, 113, 141
Consulting Services Practice Aid 99-2,19
IPR&D Practice Aid, ix, 27, 28, 30, 31,32, 67
Practice Aid, ix, 27
Amortization, 1, 4, 5, 6, 8, 11, 14, 25, 46,48, 52, 54, 57, 59, 61, 62, 66, 69,72, 80, 83, 85, 88, 90, 92, 97, 98,102, 106, 109
benefit, 25, 48, 52, 54, 57, 59, 62, 66, 69, 72, 97, 98, 102, 106, 109
charges, 5expense, 85goodwill, 1, 10, 13, 14of intangible assets, 68, 90periodic, 113straight-line, 90, 98weighted average period, 85
Applied research, 29Approach
cost, x, 22, 25, 42, 43, 52, 54, 56, 57,59, 61, 98, 101
income, x, 22, 23, 43, 45, 51, 52, 56, 57,61, 66, 74, 98, 106, 109
market, 22, 25, 34, 43, 61Artistic-related, 19, 20Assembled workforce, 19, 57, 59, 67, 72,
100, 102, 110direct training cost, 58, 102employment agreement, 24inefficiency training cost, 58, 102key personnel, 78recruiting costs, 58, 101training costs, 58, 59, 101valuation of, 60, 102
Assetallocation, 82, 83film cost, 113group, 78, 82, 89identified, 43, 67, 106impairment, 76long-lived, 87, 89, 91net, 8, 9, 23, 79, 80, 81, 84, 115, 116,
120, 122assembled collection of, 79identifiable, 9, 115
167
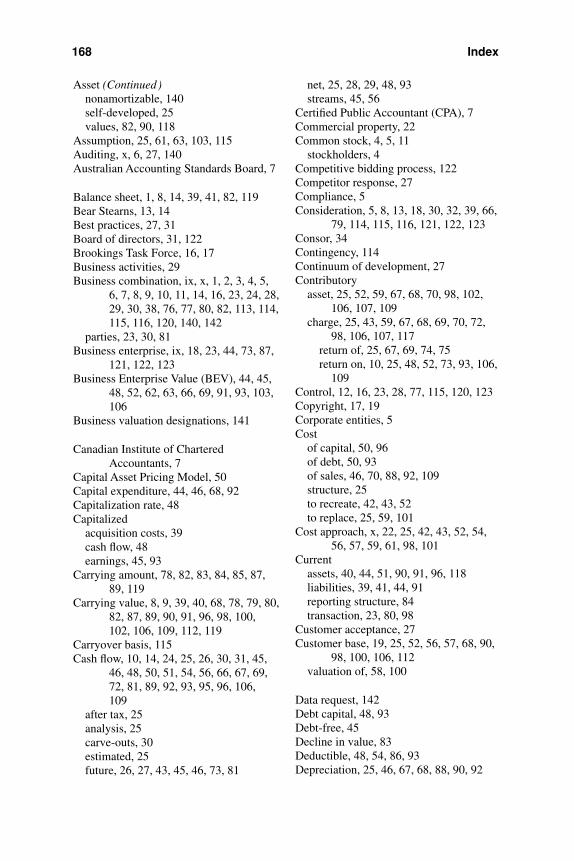
Asset (Continued)nonamortizable, 140self-developed, 25values, 82, 90, 118
Assumption, 25, 61, 63, 103, 115Auditing, x, 6, 27, 140Australian Accounting Standards Board, 7
Balance sheet, 1, 8, 14, 39, 41, 82, 119Bear Stearns, 13, 14Best practices, 27, 31Board of directors, 31, 122Brookings Task Force, 16, 17Business activities, 29Business combination, ix, x, 1, 2, 3, 4, 5,
6, 7, 8, 9, 10, 11, 14, 16, 23, 24, 28,29, 30, 38, 76, 77, 80, 82, 113, 114,115, 116, 120, 140, 142
parties, 23, 30, 81Business enterprise, ix, 18, 23, 44, 73, 87,
121, 122, 123Business Enterprise Value (BEV), 44, 45,
48, 52, 62, 63, 66, 69, 91, 93, 103,106
Business valuation designations, 141
Canadian Institute of CharteredAccountants, 7
Capital Asset Pricing Model, 50Capital expenditure, 44, 46, 68, 92Capitalization rate, 48Capitalized
acquisition costs, 39cash flow, 48earnings, 45, 93
Carrying amount, 78, 82, 83, 84, 85, 87,89, 119
Carrying value, 8, 9, 39, 40, 68, 78, 79, 80,82, 87, 89, 90, 91, 96, 98, 100,102, 106, 109, 112, 119
Carryover basis, 115Cash flow, 10, 14, 24, 25, 26, 30, 31, 45,
46, 48, 50, 51, 54, 56, 66, 67, 69,72, 81, 89, 92, 93, 95, 96, 106, 109
after tax, 25analysis, 25carve-outs, 30estimated, 25future, 26, 27, 43, 45, 46, 73, 81
net, 25, 28, 29, 48, 93streams, 45, 56
Certified Public Accountant (CPA), 7Commercial property, 22Common stock, 4, 5, 11
stockholders, 4Competitive bidding process, 122Competitor response, 27Compliance, 5Consideration, 5, 8, 13, 18, 30, 32, 39, 66,
79, 114, 115, 116, 121, 122, 123Consor, 34Contingency, 114Continuum of development, 27Contributory
asset, 25, 52, 59, 67, 68, 70, 98, 102,106, 107, 109
charge, 25, 43, 59, 67, 68, 69, 70, 72,98, 106, 107, 117
return of, 25, 67, 69, 74, 75return on, 10, 25, 48, 52, 73, 93, 106,
109Control, 12, 16, 23, 28, 77, 115, 120, 123Copyright, 17, 19Corporate entities, 5Cost
of capital, 50, 96of debt, 50, 93of sales, 46, 70, 88, 92, 109structure, 25to recreate, 42, 43, 52to replace, 25, 59, 101
Cost approach, x, 22, 25, 42, 43, 52, 54,56, 57, 59, 61, 98, 101
Currentassets, 40, 44, 51, 90, 91, 96, 118liabilities, 39, 41, 44, 91reporting structure, 84transaction, 23, 80, 98
Customer acceptance, 27Customer base, 19, 25, 52, 56, 57, 68, 90,
98, 100, 106, 112valuation of, 58, 100
Data request, 142Debt capital, 48, 93Debt-free, 45Decline in value, 83Deductible, 48, 54, 86, 93Depreciation, 25, 46, 67, 68, 88, 90, 92
168 Index
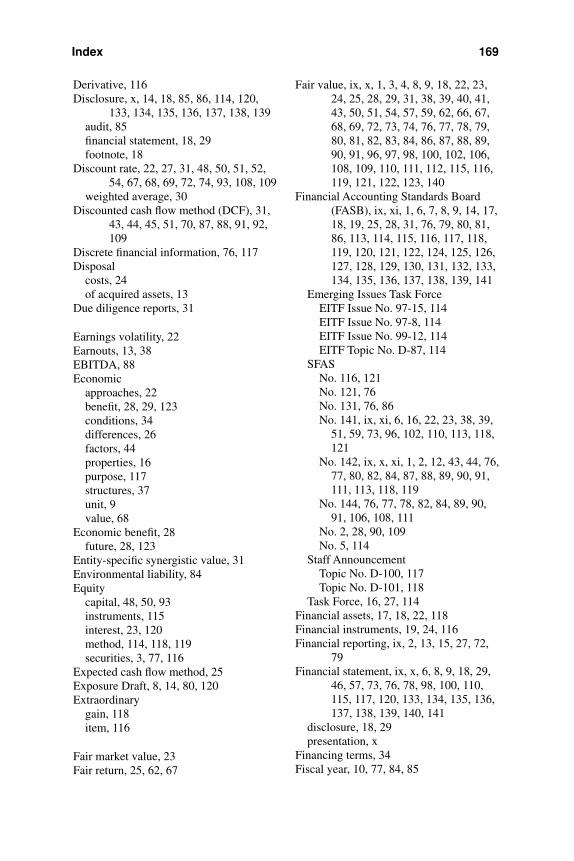
Derivative, 116Disclosure, x, 14, 18, 85, 86, 114, 120,
133, 134, 135, 136, 137, 138, 139audit, 85financial statement, 18, 29footnote, 18
Discount rate, 22, 27, 31, 48, 50, 51, 52,54, 67, 68, 69, 72, 74, 93, 108, 109
weighted average, 30Discounted cash flow method (DCF), 31,
43, 44, 45, 51, 70, 87, 88, 91, 92,109
Discrete financial information, 76, 117Disposal
costs, 24of acquired assets, 13
Due diligence reports, 31
Earnings volatility, 22Earnouts, 13, 38EBITDA, 88Economic
approaches, 22benefit, 28, 29, 123conditions, 34differences, 26factors, 44properties, 16purpose, 117structures, 37unit, 9value, 68
Economic benefit, 28future, 28, 123
Entity-specific synergistic value, 31Environmental liability, 84Equity
capital, 48, 50, 93instruments, 115interest, 23, 120method, 114, 118, 119securities, 3, 77, 116
Expected cash flow method, 25Exposure Draft, 8, 14, 80, 120Extraordinary
gain, 118item, 116
Fair market value, 23Fair return, 25, 62, 67
Fair value, ix, x, 1, 3, 4, 8, 9, 18, 22, 23,24, 25, 28, 29, 31, 38, 39, 40, 41,43, 50, 51, 54, 57, 59, 62, 66, 67,68, 69, 72, 73, 74, 76, 77, 78, 79,80, 81, 82, 83, 84, 86, 87, 88, 89,90, 91, 96, 97, 98, 100, 102, 106,108, 109, 110, 111, 112, 115, 116,119, 121, 122, 123, 140
Financial Accounting Standards Board(FASB), ix, xi, 1, 6, 7, 8, 9, 14, 17,18, 19, 25, 28, 31, 76, 79, 80, 81,86, 113, 114, 115, 116, 117, 118,119, 120, 121, 122, 124, 125, 126,127, 128, 129, 130, 131, 132, 133,134, 135, 136, 137, 138, 139, 141
Emerging Issues Task ForceEITF Issue No. 97-15, 114EITF Issue No. 97-8, 114EITF Issue No. 99-12, 114EITF Topic No. D-87, 114
SFASNo. 116, 121No. 121, 76No. 131, 76, 86No. 141, ix, xi, 6, 16, 22, 23, 38, 39,
51, 59, 73, 96, 102, 110, 113, 118,121
No. 142, ix, x, xi, 1, 2, 12, 43, 44, 76,77, 80, 82, 84, 87, 88, 89, 90, 91,111, 113, 118, 119
No. 144, 76, 77, 78, 82, 84, 89, 90,91, 106, 108, 111
No. 2, 28, 90, 109No. 5, 114
Staff AnnouncementTopic No. D-100, 117Topic No. D-101, 118
Task Force, 16, 27, 114Financial assets, 17, 18, 22, 118Financial instruments, 19, 24, 116Financial reporting, ix, 2, 13, 15, 27, 72,
79Financial statement, ix, x, 6, 8, 9, 18, 29,
46, 57, 73, 76, 78, 98, 100, 110,115, 117, 120, 133, 134, 135, 136,137, 138, 139, 140, 141
disclosure, 18, 29presentation, x
Financing terms, 34Fiscal year, 10, 77, 84, 85
Index 169

Fixed assets, 25, 40, 51, 67, 68, 69, 96Forecast, 24, 45, 46, 66, 68, 71, 88, 92, 93,
95, 102, 103, 106, 109For-profit, 121Funded debt, 39
General ledger, 113Generally accepted accounting principles
(GAAP), 1, 14, 28, 38, 72, 78, 113,141
Going concern, 79Goodwill, ix, x, 1, 3, 7, 8, 9, 10, 12, 13,
14, 16, 17, 19, 22, 24, 30, 31, 38,43, 44, 59, 67, 72, 73, 74, 75, 76,77, 78, 79, 80, 82, 83, 84, 85, 86,87, 89, 90, 91, 102, 109, 110, 111,113, 115, 117, 118, 119, 120, 121,141
amortization, 1, 10, 13, 14core, 80elements of, 79impairment, ix, x, 8, 12, 14, 78, 82, 83,
84, 87, 89, 91, 109, 117, 119, 141charge, 14, 83loss, 12, 78, 89model, 8study, ixtest, 12, 82, 84, 87, 89, 141
internally generated, 120negative, 114, 115, 116, 118previously recognized, 51, 82, 84, 96valuation of, 74, 111
Gross value, 66, 103, 106Growth rates, 46
Hopkins, Patrick E., 8, 9, 10, 11, 14Houston, Richard W., 8, 9, 10, 11, 14
Illiquidity, 27Impairment, ix, x, xi, 1, 7, 12, 13, 14, 24,
45, 76, 77, 78, 80, 81, 82, 83, 84,85, 86, 87, 88, 89, 90, 91, 92, 98,100, 106, 109, 111, 112, 113, 117,119, 140, 141
analysis, x, 78, 98, 112charge, 13, 14, 83, 113, 140expense, 84goodwill, ix, x, 8, 12, 14, 78, 82, 83, 84,
87, 89, 91, 109, 117, 119, 141indicator, 84
loss, 12, 78, 82, 85, 86, 89, 111, 112,119, 140
model, 8study, ix, xi, 89, 91, 98, 109, 112, 117test, 7, 12, 80, 82, 83, 84, 87, 88, 89, 90,
91, 100, 140, 141Impairment test, 78, 84
date of, 82step one, 83, 84, 88, 89, 91step two, x, 83, 84, 87, 88, 89, 91transition, 84transitional, 84Triggering event, 80
Implementation, x, xi, 15, 113, 140Income
net, 9, 10, 11statement, 14, 85, 115, 116taxes, 24
Income approach, x, 22, 23, 43, 45, 51, 52,56, 57, 61, 66, 74, 98, 106, 109
Incrementalcash flows, 30returns, 18value, 25
Indefinite life, 2, 24, 43, 61, 62, 76, 80,101
Independence, 140Industry pricing metrics, 34Infrastructure, 17Initial
assessment, 29measurement, 116
In-process research and development, ix,x, 8, 10, 16, 19, 27, 28, 29, 30, 31,32, 43, 52, 59, 67, 69, 70, 71, 72,73, 90, 92, 102, 109, 110, 112, 120,140, 142
alternative future use, 28, 32development costs, 32, 70, 109development expenses, 25, 67, 106development milestones, 32estimated costs to complete, 32life cycle, 29purchased, 85stage of development, 32valuation of, 72, 110
Intangible assets, ix, x, 1, 2, 6, 7, 16, 17,18, 19, 22, 24, 25, 28, 30, 33, 36,39, 41, 42, 44, 46, 52, 54, 69, 73,74, 76, 79, 80, 83, 84, 85, 90, 91,
170 Index
93, 98, 110, 113, 114, 117, 120,133, 134, 135, 136, 137, 138, 139,140, 141, 142
artistic-related, 19, 20assembled workforce, x, 19, 24, 43, 52,
57, 59, 68, 73, 90, 100, 102, 106,110
attribute, 18categories, 17characteristics, ix, 27, 28, 30, 34, 81,
116, 118class, 85classification of, 20, 85contract-based, 19, 20, 44, 109customer base, 19, 25, 52, 56, 57, 68,
90, 98, 100, 106, 112customer-related, x, 19, 20, 42, 67goodwill, ix, x, 1, 3, 7, 8, 9, 10, 12, 13,
14, 16, 17, 19, 22, 24, 30, 31, 38,43, 44, 59, 67, 72, 73, 74, 75, 76,77, 78, 79, 80, 82, 83, 84, 85, 86,87, 89, 90, 91, 102, 109, 110, 111,113, 115, 117, 118, 119, 120, 121,141
Grouped, 17identifiable, 3, 16, 19, 25, 82, 83indefinitely-lived, 2, 91in-process research and development, x,
8, 10, 16, 19, 27, 43, 52, 59, 69,90, 102, 109, 112, 120, 140, 142
internally generated, 18, 80, 114, 120noncompete agreement, x, 43, 52, 62,
63, 66, 68, 74, 90, 103, 104, 106,109
separability, 17, 19software, ix, x, 27, 42, 52, 53, 54, 68,
90, 97, 98, 106, 112, 142technology, x, 19, 20, 27, 32, 34, 36, 42,
43, 52, 56, 57, 59, 62, 66, 67, 68,69, 70, 71, 72, 73, 89, 90, 102,106, 108, 109, 110, 111
technology-based, x, 19, 20, 42, 43, 67trade name, x, 17, 43, 52, 59, 61, 62, 67,
68, 74, 90, 101, 102, 106, 111unclassified, 19unidentifiable, 6, 27, 121unrecognized, 83unrecorded, 117
Intangible value, 19, 51, 96Intellectual capital, 19
Intellectual property, 17, 19, 33, 34, 35,36, 37, 61
human capital, 17licensing, 33, 34, 35, 36litigation, 37ownership, 34rights, 28transactions, 34, 35, 36, 37transactions database, 35, 36, 37
Intellectual Property TransactionsDatabase, 33, 34
custom search, 35market data, 33
Intellectual property-intensive companies,33
Interest rate, 26Interest-bearing debt, 45, 51Interim basis, 24, 78Internal Revenue Code, 23, 25, 46, 92
Section 197, 25, 46, 48, 92International Accounting Standards Board
(IASB), 115, 119, 120International Valuation Standards
Committee, 16, 17Guidance Note No. 6, 22
Invested capital, 39, 42, 44, 45, 50, 51, 74,91, 96
Investee, 119Investment banking community, 7Investment value, 31Investor, 119, 120
Joint venture, 120Judicial opinions, 33
Know-how, 17, 19
Legalgoodwill, 79protection, 17rights, 24, 34
Lev, Baruch, 18Leverage, 17, 45Liability, 22, 24, 26, 41, 77, 116Life of asset, 112
finite, 43, 61unlimited, 6useful life, 6, 24, 39, 43, 44, 54, 57, 61,
66, 69, 71, 72, 80, 98, 100, 106,109
Index 171

Lifing, 7, 44Long-term
capital, 50debt, 39, 41
Maintenance expenditures, 44Market
price, 81, 89, 91value, 50
Market approach, 22, 25, 34, 43, 61comparable transactions, 33, 34guideline license transaction, 33market capitalization, 81market comparable, 35market data, 33, 34, 62market imperfections, 27market penetration, 29market royalty rates, 33market-based assumption, 31
Marketable securities, 40, 51, 90, 96Marketing-related, x, 19, 20, 43Market-to-book, 10McConnell, Patricia, 14Measurement tools, 19Mergers and acquisitions, ix, 1, 2, 3, 5, 12,
13, 15partners, 5
Mergerstat Review, 2Method, x, xi, 7, 22, 31, 32, 42, 44, 61, 62,
70, 74, 88, 98, 109comparison-transaction method, 33expected cash flow, 25fresh-start, 120multi-period excess earnings, 30, 31,
43, 56, 59, 66, 69pooling of interests, ix, 3, 4, 7, 8, 23purchase, ix, 3, 5, 6, 8, 9, 10, 23, 113,
114, 115relief from royalties, 31residual, 43, 72, 110traditional, 25
Model Audit Program, 142Multi-period excess earnings
method, 31, 43, 56, 59, 66, 69model, 30
Negative Goodwill (Equity Method), 118New basis accounting, 114, 120New product launches, 27New York University, 18
New Zealand Financial Standards Board, 7
Noncompete agreement, x, 43, 52, 62, 63,66, 68, 74, 89, 90, 103, 106, 109
valuation of, 62, 64, 65, 106Noncontrolling interest, 115Noncurrent assets, 24Nonmarketable securities, 38North American Industry Classification
System (NAICS), 35Not-for-profit (NFP), 23, 121, 122, 123
Obsolescence, 44, 53, 54, 57, 59, 97, 98,102
Offering memoranda, 31Operating
cost, 25, 67expenses, 46, 67, 69, 70, 88, 92, 106,
109segment, 76, 117, 118
Operation previously disposed of, 84Operational information, 142Organization costs
costs, 40, 51, 96Organizational structure, 17Overpayment, 14, 79, 80Overvaluation, 79, 140Ownership interests, 3
Parent, 4, 122Patents, 17, 19, 36, 68Pension, 118Performance measure, 81Perpetual growth rate, 48, 93Perpetuity, 48, 62, 93, 102Peters, Michael F., 8, 9, 10, 11, 14Physical
assets, 19descriptions, 17investment, 22projects, 22substance, 16, 17, 24
Pooling of interestmethod, ix, 3, 4, 7, 8, 23
Post-acquisition accounting, 10Preexisting
entity, 120goodwill, 80
Preferred equity, 50Premium, 8, 10, 19
172 Index
Prepaidassets, 118expenses, 40, 90, 96
Present value, 25, 26, 30, 45, 48, 51, 54,62, 66, 72, 73, 81, 86, 89, 93, 102,106, 109
considerations, 25technique, 81, 89
Pretax, 50, 61, 62, 66, 93, 106royalty rate, 62
Price to net earningsmultiple, 25ratios, 15
PriceWaterhouseCoopers, 13Prior-period restatement, 9Privately held corporation, 39Probability factor, 66, 104Process documentation, 17Pro-rata reduction, 118Prospective Financial Information (PFI),
31, 32, 46, 48Proxies, 17Public company, 39Publicly traded stock, 38, 81Purchase
accounting, ix, 1, 4, 5, 9, 10, 13, 38Purchase price, ix, x, xi, 1, 16, 23, 30, 31,
38, 39, 44, 45, 51, 52, 53, 82, 87,88, 96, 110, 114, 116, 140, 142
allocation, xi, 16, 38, 51, 53, 82, 87, 96,114, 140
Quoted market price, 25, 81, 86, 89, 119
Rate of return, 18, 22, 23, 26, 48, 50, 52,62, 67, 74, 79, 93, 102, 103
Recapture of investment, 67Recoverability, 78, 89, 106, 108
test, 89, 106, 108Regulatory
approval, 27requirement, 16risk, 29, 32
Reilly, Robert F., 44Relief from royalties, 31, 43Rented assets, 25Reorganization, 10, 113Replacement cost, 54, 57, 97, 98Reported income, 3, 4, 10
Reporting unit, x, 76, 77, 78, 80, 81, 82,83, 84, 86, 87, 88, 89, 90, 91, 114,117, 118
component, 76, 78, 79, 80, 117, 118management, 76, 118segment, 86
Reproduction cost, 53, 54, 97Research and development (R&D), 10, 22,
27, 28, 30, 32activities, 27, 28, 30, 32budget, 32costs, 32postcombination activities, 28projects, 27
Residual, x, 7, 24, 30, 43, 45, 48, 62, 73,85, 92, 93, 102, 106, 110, 111, 117
basis, 30cash flow, 48, 93value, x, 24, 48, 85, 93, 117
Residual income valuation model, 7Return requirements, 22, 68Revenue, 45, 52, 56, 67, 69, 81, 98Risk
differentials, 22-free rate, 26premium, 27
Royalty rate, 33, 36, 37, 43, 61, 62, 102RoyaltySource, 34
Salesgrowth, 46net, 46, 88, 92
Schweihs, Robert P., 44Secondary market, 34Securities, 5, 6, 114, 140Securities and Exchange Commission
(SEC), 6, 140, 141Software, ix, x, 27, 42, 52, 53, 54, 68, 90,
97, 98, 106, 112, 142computer operating system, 18valuation of, 55, 99
Standard Industrial Classification (SIC), 35Standard of value, 22Statement of financial position, 84, 85Statements of Financial Accounting
Standards (SFAS), ixStock
price, 8, 10, 12, 14, 15, 81, 87, 88, 91purchase, 46, 93voting, 4
Index 173
Structural capital, 17Survivorship, 69, 108, 109
survivor curve, 44, 69, 72, 106Iowa-type, 44Weibull Distribution, 44
Synergycomponent, 30, 31
Tangible assetscapacity, 5, 28, 119inventory, 40, 90, 96land and buildings, 40, 68, 90, 106machinery and equipment, 40, 51, 68,
90, 97, 106recognized, 83unrecognized, 83value, 79
Taxamortization, 24, 46, 48, 92court cases, 19deferred assets, 118effects, 24rate, 48, 50, 54, 93
Technology, x, 19, 20, 27, 32, 34, 36, 42,43, 52, 56, 57, 59, 62, 66, 67, 68,69, 70, 71, 72, 89, 90, 102, 106,108, 109, 110, 111
valuation of, 70, 71, 107, 108Technology-based, x, 19, 20, 42, 43, 67The Financial Valuation Group, 34, 35,
62Trade name, x, 17, 43, 52, 59, 61, 62, 67,
68, 74, 90, 102, 106, 111-dress, 17-marks, 17, 19, 36, 59, 61, 62, 67
-secrets, 17, 19valuation of, 63, 103
Traditional method, 25Transferability, 17, 19
U.S. Supreme Court, 7Underpayment, 79, 80United Kingdom Accounting Standards
Board, 7
Valuationanalysis, 32, 34, 42conclusions, 37, 73date, 39, 51, 62, 66, 69, 70, 82, 96, 97,
102, 106, 108, 109of intangible assets, 7, 22, 38, 143, 144,
145, 146, 147, 148, 149, 150report, 86techniques, xi, 81, 89
Valueassembled, 80driver, 18estimates, 37indications, 33subsumed, 113synergistic, 30, 31
Weighted Average Cost of Capital(WACC), 48, 50, 52, 67, 68, 74, 93
Workpapers, 86program, x
Working capital, 44, 46, 67, 68, 69, 92,106
Write-off, 10, 12
174 Index