Embed Size (px)
Citation preview
Valuation Case Study on
Noble Group Ltd
Valuation Case Study on
Noble Group Ltd
Disclaimer and Declaration
The objective of the presentation is for educationalpurposes. The full content of the presentation is for
illustration purposes only and should not be used as
investment recommendations. AB Maximus and itspresenters are not responsible for all investment activitiesconducted by the participants and cannot be held liablefor any investment loss.
The company and presenters may have personal interestin the particular shares presented.
Agenda
Company Background1
Industry Overview2
Research Report Comparison3
Risk4
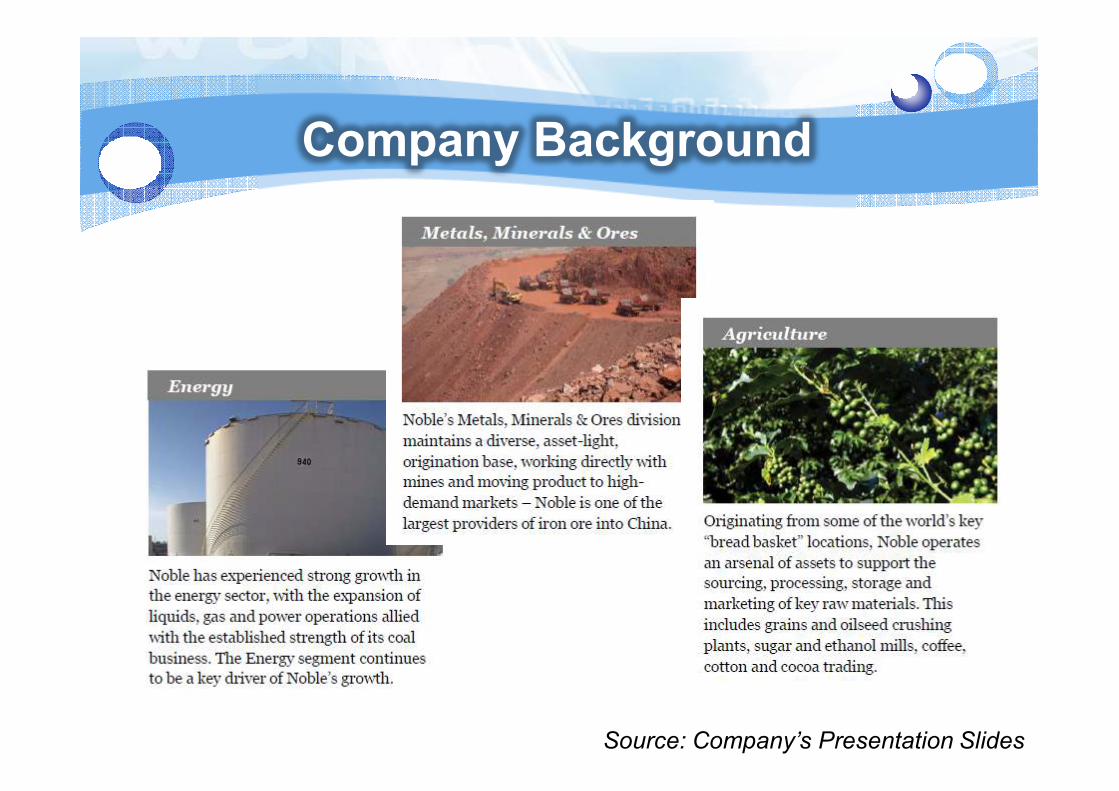
Company Background
Noble Group Ltd manages a global portfolio of Supply Chains covering Agriculture, Energy, Minerals and Ores, originating
product from low cost producingcountries and delivering to high growth
demand markets
Company Background
Source: Company’s Presentation Slides

Company Background
Source: Company’s Presentation Slides

Company Background
Source: Company’s Presentation Slides

Company Background
Source: Company’s Presentation Slides

Company Background
Source: Company’s Presentation Slides

Business Model Analysis
Source: Company’s Presentation Slides

Business Model Analysis
Source: Company’s Presentation Slides

Business Model Analysis
Source: Company’s Presentation Slides

Business Model Analysis
Noble Group
Production
Processing
Logistics/
Shipping
Delivery
Biggest risk for Noble would be Decreasing commodities price
And rise in interest rate

Business Model Analysis
Source: Citi Research
Steel consumption likely to normalize in coming years

Business Model Analysis
Source: Citi Research
Global Mining Capex is expected to slow down

Company Financials
Source: Company’s 3Q results
Due to US$79 Million loss From Yan Coal Australia

Company Financials
Source: Company’s 3Q results
4197, 17%
17470, 68%
3928, 15%
Agriculture
Energy
MMO

Industry Overview
Source: Company’s Presentation Slides

Industry Overview
Source: Company’s Presentation Slides

Industry Overview
Source: Company’s Presentation Slides

Industry Overview
Source: Company’s Presentation Slides

Company Financials
Source: JP Morgan Research

Company Financials
Ratio Analysis FY2007 FY2008 FY2009 FY2010 FY2011 FY2012
Growth rate (%YoY)
Revenue 53.59% -13.60% 81.82% 42.39% 16.49%
EBIT 120.30% -8.26% 16.57% 20.33% -10.73%
Net proft 123.65% -3.68% 8.91% -28.77% 9.26%
Profitability
Gross Profit Margin 3.51% 3.73% 3.54% 2.88% 1.83% 1.60%
Net Profit Margin 1.10% 1.60% 1.78% 1.07% 0.53% 0.50%
Return on Asset 7.77% 5.91% 4.33% 2.31% 2.38%
Return on Equity 11.54% 8.17% 5.68% 3.52% 3.79%
Liquidity
Current Ratio 1.63 1.58 1.87 1.54 1.74 1.42
Quick Ratio 0.87 0.93 0.63 0.72 1.01 0.97
Cash Ratio 0.21 0.32 0.14 0.11 0.14 0.06
Solvency
Debt to Equity 0.38 0.31 0.33 0.35 0.31 0.29
Interest Coverage -86.02 NA NA NA 2.37 2.28
Solvency 0.10 0.23 0.16 0.10 0.07 0.08
Efficiency
Asset Turnover 3.50 4.43 2.93 3.27 4.05 4.77
Payable Days 39.38 36.85 29.52 24.29 17.72 18.72
Account Receivables Days 34.75 25.31 26.38 31.60 34.80 34.67
Inventories Days 28.97 18.46 41.44 26.30 13.13 13.42
Cash Conversion Cycle 24.34 6.92 38.30 33.61 30.21 29.36
Very tight gross profit margin
Have to depend onCredit facilities

Company Financials

Research Reports Comparison
�Methodology
� Compared the various research reports from different broker houses

Research Reports Comparison
Source: CIMB, May Bank, JP Morgan,OCBC

Research Reports Comparison
Source: CIMB, May Bank, JP Morgan,OCBC

Research Reports Comparison
Source: CIMB, May Bank, JP Morgan,OCBC

Research Reports Comparison
Source: CIMB

Research Reports Comparison
Source: May Bank

Research Reports Comparison
Source: JP Morgan

Research Reports Comparison
Source: OCBC

Research Reports Comparison
Source: CIMB, May Bank, JP Morgan,OCBC

Research Reports Comparison
Source: CIMB
Low Valuations for both PE and P/B

Research Reports Comparison
Source: Company’s Presentation Slides
Low Valuations for both PE and P/B

Research Reports Comparison
Source: CIMB, May Bank, JP Morgan,OCBC
�Noble has lowest operating margins as compared to its global industry peers (EBITDA margin of Glencore: 2.1%, Archer-Daniels-Midland: 2.8%, Bunge: 2.6%, WimarInternational: 4.9%, and Olam:5.3%)..
�Tapering would have impact on Noble operations due to increase in interest rate
�Remain Neutral on this counter

Trading Data
52 Weeks Trading Range $0.79-$1.27
Avg Volume (3 mths) 28 mil
Market Cap 6.93 bil

Main Risks
�Agriculture business more vulnerable to changes in weather conditions, harvest seasons, natural calamities, and agricultural pests and diseases.
�Sharp decrease in raw material prices which cannot be effectively hedged
�Foreign Currency risk

Main Risks
�Noble has thin operating margins and have declined considerably over the last three years this could increase its business risk.
�Default Risk – Medium to High
� Current ratio = 1.42 x
� Interest coverage = 2.38 x
� D/E ratio = 0.29
� Loans maturing this year = $2 bil
� Cash = $604 mil in cash and S/T investments