Embed Size (px)
Citation preview

LUND UNIVERSITY
PO Box 117221 00 Lund+46 46-222 00 00
Valorisation of fish waste biomass through recovery of nutritional lipids and biogas
Mbatia, Betty
Published: 2011-01-01
Link to publication
Citation for published version (APA):Mbatia, B. (2011). Valorisation of fish waste biomass through recovery of nutritional lipids and biogas
General rightsCopyright and moral rights for the publications made accessible in the public portal are retained by the authorsand/or other copyright owners and it is a condition of accessing publications that users recognise and abide by thelegal requirements associated with these rights.
• Users may download and print one copy of any publication from the public portal for the purpose of privatestudy or research. • You may not further distribute the material or use it for any profit-making activity or commercial gain • You may freely distribute the URL identifying the publication in the public portalTake down policyIf you believe that this document breaches copyright please contact us providing details, and we will removeaccess to the work immediately and investigate your claim.

Valorisation of fish waste biomass through
recovery of nutritional lipids and biogas
Betty Nyambura Mbatia
Department of Biotechnology
Doctoral Thesis
April 2011
Academic thesis which, by due permission of the Faculty of Engineering of Lund University will be publicly defended on Wednesday, April 13 at 10.30 a.m. in Lecture Hall B, at the Centre for Chemistry and Chemical Engineering, Sölvegatan 39, Lund, for the degree of Doctor of philosophy in Engineering.
Faculty opponent: Suzana Ferreira-Dias, Assistant professor with habilitation Instituto Superior de Agronomia, Technical University of Lisbon, CEER-Biosystems Engineering,Tapada da Ajuda, 1349-017 Lisboa, Portugal
Doctoral thesis, 2011

Doctoral thesis, 2011
Department of Biotechnology
Lund University
P.O. Box 124, SE-221 00
Sweden
© Betty Nyambura Mbatia
ISBN 978-91-89627-72-7
ISRN LUTKDH/TKBT--11/1126—SE
Printed by Media-Tryck, Lund University, Sweden, 2011

137


Dedicated to dad, mum and my twin sister

i
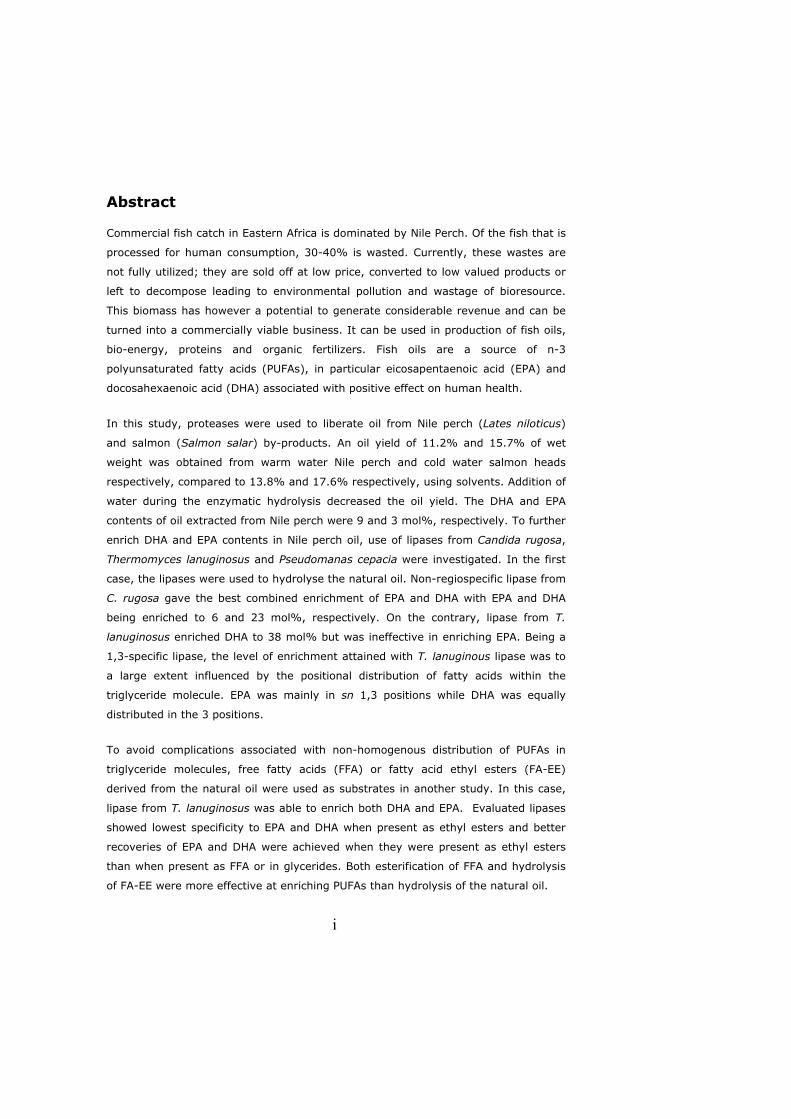
Abstract
Commercial fish catch in Eastern Africa is dominated by Nile Perch. Of the fish that is
processed for human consumption, 30-40% is wasted. Currently, these wastes are
not fully utilized; they are sold off at low price, converted to low valued products or
left to decompose leading to environmental pollution and wastage of bioresource.
This biomass has however a potential to generate considerable revenue and can be
turned into a commercially viable business. It can be used in production of fish oils,
bio-energy, proteins and organic fertilizers. Fish oils are a source of n-3
polyunsaturated fatty acids (PUFAs), in particular eicosapentaenoic acid (EPA) and
docosahexaenoic acid (DHA) associated with positive effect on human health.
In this study, proteases were used to liberate oil from Nile perch (Lates niloticus)
and salmon (Salmon salar) by-products. An oil yield of 11.2% and 15.7% of wet
weight was obtained from warm water Nile perch and cold water salmon heads
respectively, compared to 13.8% and 17.6% respectively, using solvents. Addition of
water during the enzymatic hydrolysis decreased the oil yield. The DHA and EPA
contents of oil extracted from Nile perch were 9 and 3 mol%, respectively. To further
enrich DHA and EPA contents in Nile perch oil, use of lipases from Candida rugosa,
Thermomyces lanuginosus and Pseudomanas cepacia were investigated. In the first
case, the lipases were used to hydrolyse the natural oil. Non-regiospecific lipase from
C. rugosa gave the best combined enrichment of EPA and DHA with EPA and DHA
being enriched to 6 and 23 mol%, respectively. On the contrary, lipase from T.
lanuginosus enriched DHA to 38 mol% but was ineffective in enriching EPA. Being a
1,3-specific lipase, the level of enrichment attained with T. lanuginous lipase was to
a large extent influenced by the positional distribution of fatty acids within the
triglyceride molecule. EPA was mainly in sn 1,3 positions while DHA was equally
distributed in the 3 positions.
To avoid complications associated with non-homogenous distribution of PUFAs in
triglyceride molecules, free fatty acids (FFA) or fatty acid ethyl esters (FA-EE)
derived from the natural oil were used as substrates in another study. In this case,
lipase from T. lanuginosus was able to enrich both DHA and EPA. Evaluated lipases
showed lowest specificity to EPA and DHA when present as ethyl esters and better
recoveries of EPA and DHA were achieved when they were present as ethyl esters
than when present as FFA or in glycerides. Both esterification of FFA and hydrolysis
of FA-EE were more effective at enriching PUFAs than hydrolysis of the natural oil.
ii
In an attempt to add more value to fish oil, PUFA concentrate obtained from salmon
heads by urea fractionation was used to lipophilize hydrophilic phenolic derivatives
(vanillyl alcohol or rutin) which are natural antioxidants. Lipase from Candida
antarctica was used to catalyse the esterification reaction. The synthesized lipophilic
derivatives showed antioxidant activities with rutin esters showing more activity in
the 2, 2-Diphenyl-1-Picrylhydrazyl (DPPH) radical assay than the vanillyl esters and
on the contrary in the lipophilic medium, the vanillyl esters were found to be superior
to the rutin esters. In bulk oil system, the antioxidant activities of rutin and vanillyl
derivatives was lower than that of BHT and α-tocopherol but in emulsion, they
showed better activity than α-tocopherol. The PUFA-phenolic molecules carry
combined health beneficial properties associated with PUFAs and phenolics. In
addition, the PUFAs are protected against oxidation by the phenolic moiety while
PUFA makes the antioxidant more lipophilic which may enhance its function in lipid
systems.
To make maximum utilisation of the fish by-products, the insoluble fraction that
remained after oil extraction was used for biogas production through anaerobic
digestion. Methane yields before and after oil extractions were 828 and 742 m3
CH4/ton of volatile solids (VS) added, respectively. Despite the high methane yields,
fish sludge/fish waste cannot be digested alone in a continuous anaerobic digester
due to high content of proteins, lipids and light metals (sodium, potassium and
calcium) that are inhibitory to methanogenesis. Co-digestion of the sludge with
residues from crop cultivation was thus evaluated. Methane yields were 531 and 403
m3 CH4/ton of VS added when the ratio of Jerusalem artichoke residues: sludge was
1:1 or 3:1, respectively while that of JA alone was 283 m3 CH4/ton of VS.
In conclusion, enzyme technology represents valuable tools that can be used in fish
processing industries to convert fish waste into products with a higher market value.
The use of proteases for the hydrolysis of the by-products results in maximum
utilisation of the by-products since the intermediate hydrolysis products can be
processed further for valorisation. Lipid fraction can be used for recovery of omega-
3 fatty acids and biodiesel. The soluble protein fraction has several applications e.g.
in food industries or in microbiological media and the sludge fraction can be used in
anaerobic digestion for biogas production. Due to its high protein content, sludge
fraction can also be used as animal feed or as biofertilizer due to high content of
plant nutrients such as nitrogen, phosphorous and potassium.

iii
1. List of publications
This thesis is based on the work contained in the following papers, referred to by
their Roman numerals in the text. The papers are attached as appendices at the end
of the thesis.
Paper I. Betty Mbatia, Dietlind Adlercreutz, Patrick Adlercreutz, Ally Mahadhy,
Francis Mulaa, Bo Mattiasson. Enzymatic oil extraction and positional analysis of ω-3
fatty acids in Nile perch and salmon heads (2010). Process Biochemistry 45(5)815-
819.
Paper II. Betty Mbatia, Patrick Adlercreutz, Francis Mulaa, Bo Mattiasson.
Enzymatic enrichment of n-3 polyunsaturated fatty acids in Nile perch (Lates
niloticus) viscera oil. European journal of lipid science and technology
(2010), 112, (9), 977-984.
Paper III. Betty Mbatia, Patrick Adlercreutz, Francis Mulaa, Bo Mattiasson.
Strategies for the enzymatic enrichment of polyunsaturated fatty acids from fish oil.
Accepted for publication in European journal of lipid science and technology.
DOI: 10.1002/ejlt.201000560.
Paper IV. Betty Mbatia, K. Shiva Shanker, B. Mattiasson, F. Mulaa, P. Adlercreutz.
Enzymatic Synthesis of Lipophilic Rutin and Vanillyl Esters From Fish By Products.
Manuscript.
Paper V. Nges Ivo Achu, Betty Mbatia and Lovisa Björnsson. Improved utilization
of fish waste by anaerobic digestion following omega-3 fatty acids extraction.
Submitted.

iv
2. My contribution to the papers
All the work presented in this thesis was performed under the supervision of
Professors Bo Mattiasson and Patrick Adlercreutz. For work presented in Paper I, Dr.
Ditelind Adlercreutz was also a supervisor.
Paper I: I performed the experimental work with Ally and wrote the paper along
with the co-authors.
Paper II: I performed the experimental work and wrote the first draft of the
manuscript. I was responsible for correcting it after comments from the co-authors
Paper III: I performed the experimental work and wrote the first draft of the
manuscript. I was responsible for correcting it after comments from the co-authors.
Paper IV: I performed the experimental work with Shiva. I wrote the first draft of
the manuscript and was responsible for correcting it after comments from the co-
authors.
Paper V: I performed the experimental work with Ivo. I contributed to the
manuscript.

v
Table of contents Abstract........................................................................................................ i 1. List of publications ................................................................................. iii 2. My contribution to the papers................................................................. iv 3.0 Introduction ..........................................................................................1
3.1 Fish by-products ................................................................................... 1 3.1.1 Social-economic impact on valorisation of fish by-products in Eastern Africa.................................................................................................... 2
3.2 Marine lipids......................................................................................... 3 3.2.1 Synthesis of PUFAs in human .......................................................... 3
3.3 Health aspects of marine lipids ............................................................... 5 3.4 Scope of this work ................................................................................ 6
4.0 Production of fish oil..............................................................................7 4.1 Hydrolysis of fish by-products with commercial enzymes ........................... 8
4.1.1 Up scaled hydrolysis of salmon by-products with Protex 30L.............. 11 5.0 Lipids...................................................................................................11
5.1 Determination of fatty acids distribution in triacylglycerols ....................... 11 6.0 Lipases ................................................................................................13
6.1 General structure of lipases.................................................................. 15 6.1.1 Catalytic mechanism of lipases ...................................................... 15
6.2 Lipase specificity................................................................................. 16 6.2.1 Competitive factor........................................................................ 17
6.3 Enrichment of long chain polyunsaturated fatty acids (PUFAs) in fish oils.............................................................................................................19
6.3.1 Enrichment of PUFAs in fish oil glycerides by lipase catalysed hydrolysis . 19 6.3.1.1 Separation of acylglycerols and free fatty acids after enzymatic hydrolysis............................................................................................ 22
6.3.2 Enrichment of PUFAs in fish oil as free fatty acids or fatty acid esters. .... 23 6.3.2.2 Enrichment of PUFAs as free fatty acids ....................................... 23 6.3.2.3 Enrichment of PUFAs as fatty acid methyl/ethyl esters ................... 24 6.3.2.4 Enrichment of PUFAs by urea complexation .................................. 25
7.0 Lipid oxidation .....................................................................................26 7.1 Free radical autoxidation...................................................................... 26
7.1.1 Initiation ..................................................................................... 26 7.1.2 Propagation................................................................................. 26 7.1.3 Termination................................................................................. 27
7.2 Photosensitized oxidation..................................................................... 27 7.3 Antioxidants and lipid autoxidation .....................................................28
7.3.1 Antioxidants .................................................................................... 28 7.3.1.1 Lipophilization of phenolic acids and flavonoids ................................. 28
8.0 Integration of omega 3-fatty acids and bio-fuel recovery from fish wastes. ......................................................................................................31
8.1 Limitations of using fish residues as substrate for biogas production.......... 32 8.1.1 Co-digestion of fish waste for biogas production............................... 33
9.0 Conclusions and future perspectives ...................................................33 10.0 Acknowledgements............................................................................36 11.0 References.........................................................................................37


1
Figure 1. Products and by-products from Nile perch processing.
Skin6%
Fats2%
Scales3%
Offals(stomach contents)
5%
Fillet40%
Head,skeleton,
fins44%
3.0 Introduction
3.1 Fish by-products
The amount of by-products from fish varies with fish species, size, season and
fishing ground [1]. The by-products are generated when the fish is gutted, headed
and further processed into fillets. Depending on the efficiency of the production
process, only 50-60% of total fish catch goes for human consumption [2]. The by-
products include heads, viscera, skin, trimmings and fish rejects [3]. They are often
dumped, used as animal feed or as fertilizer [2, 4]. Due to the worldwide decline of
fish stocks, a better use of by-catch and by-products is important. These biomasses
have great potential as a source of high valued products due to their high protein
content, high levels of essential nutrients such as vitamins, minerals, and in
particular, fish oils which are the subject of investigation in the current thesis.
By-products from farmed salmon are used to produce fish oil of a quality that is well
suited for human consumption [5]. Besides salmon, by-products from other fish
species such as herring, cod, mackerel and sardine are used [6, 7]. By-products
from warm water fatty fish such as Nile perch, present in East African Lakes and
rivers could also be used as a source of raw material for marine oils, enzymes,
proteins and other valuable products [8]. Nile perch makes 60% of the total
commercial fish catch and it is mainly processed into chilled fish fillet for export [9].
The processing leads to high volume of by-products (Figure 1), with an annual solid
waste of 36,000 tonnes being generated by fish processing industries along Lake
Victoria [10]. A further increase in fish processing wastes is expected with the
identification of aquaculture as a means to eradicate poverty and hunger in the
region [11].

2
3.1.1 Social-economic impact on valorisation of fish by-products in Eastern Africa
The current use of by-products from Nile perch processing is shown in Table 1.
Products obtained from Nile perch processing waste currently have a low market
value. For example, 20 litres of unrefined Nile perch oil costs 25 Euro [12], while
heads, skin and frames costs 54, 40 and 30 Euro/ton, respectively [10].
Table 1. Current uses of Nile perch processing by-products and alternative more valued products By-product Current use[10,
12] High added value compounds
Mean market value of selected high valued products [4]
Frames (heads, skeleton & fins)
Food , fish meal for animal feed
Fish protein hydrolysate, peptone, amino acids, fish oils, omega-3 PUFAs concentrates, biodiesel
Purified cod liver oil with 23 % omega-3 PUFAs (24 Euro/Kg)
Trimmings Food Fish protein hydrolysate, Peptone, amino acids
Roe/eggs Food Phospholipids
Skin Fuel, tanned to leather at small scale
Collagen , gelatin, gelatine peptides
Collagen and gelatin (9-14 Euro/Kg )
Fat pads Unrefined oil for frying other fish products
Fish oils, Omega-3 PUFAs concentrates, fat soluble antioxidants, biodiesel
Factory rejects and by-catches
Food Fish protein hydrolysate , peptone, Fish oils,omega-3 PUFAs concentrates, biodiesel
Viscera Discarded Enzymes, fish oils, biodiesel Cod proteases (14,400 Euro/Kg)
Integration of Nile perch processing with better utilisation of the by-products through
recovery of high value end-products presents an opportunity to open new business
ventures and thus create new employments in East Africa. Three major groups of
products: (1) plant fertilisers, (2) livestock feeds, and (3) human value-added foods
and speciality foods can be derived from fish by-products [13]. Conversion of these
by-products to fertilisers and animal feeds results in the least value addition. Better
profitability is achieved in making useful products for human consumption. The

3
highest profitability is achieved in extracting and purifying bioactive compounds such
as omega-3 PUFAs, enzymes and bioactive peptides for biotechnological or
pharmaceutical applications [2]. These products are present in highest
concentrations in the by-products [14].
Increase in returns from the sale of value added products would boost national
income and enhance food security in the region. Fish proteins would serve as
valuable nutritional supplements in diets with low amount of protein in developing
countries fighting malnutrition. On the other hand, omega-3 PUFAs are widely
accepted as food supplements due to their positive effect on health [15], and could
be used to enrich everyday food products like bread and margarine.
Development and establishment of a technology for recovery and purification of high
valued end-products from the fish biomass would result in maximum utilization of
the by-products thus ensuring sustainability of East Africa fishing activities. It would
also reduce environmental pollution resulting from damping of such waste.
3.2 Marine lipids
Lipids found in fish, especially cold water fish, and other marine organisms such as
phytoplankton are called marine lipids. High levels of long chain omega-3
polyunsaturated fatty acids (PUFAs); docosahexaenoic acid (DHA) and
eicosapentaenoic acid (EPA), makes marine lipids unique compared to other lipid
sources. Due to their well known health benefits, the market for these lipids is
expected to grow further [16]. This makes new sources valuable in particular if these
sources are presently underutilised. It is reported that oil content of fish waste
ranges between 1.4 and 40.1% depending on the species and tissue [17], with
PUFAs content up to 30% of total fatty acids [18]. Cold water fish have been
reported to have high contents of PUFAs. Due to presence of double bonds, PUFAs
remain liquid at low temperatures and thus important in keeping the cell membrane
fluid which allows movement of membrane components even at low temperatures.
Interestingly, Nile perch, a warm water fish has also been reported to contain
considerable amounts of PUFAs [9, 19].
3.2.1 Synthesis of PUFAs in human
Most fatty acids can be synthesised in the body, but humans lack the enzymes
required to produce two essential fatty acids (EFA); the n-3 PUFA α-linolenic acid
(C18:3, ALA), and the n-6 PUFA linoleic acid (C18:2n-6, LA). These fatty acids must

4
be acquired from the diet. Linoleic acid is abundant in oils from most vegetable seeds
such as corn and safflower while α-linolenic acid is found in the chloroplasts of green
leafy vegetables and seed oils such as walnut, rapeseeds and soybeans. The n-3 and
n-6 fatty acid families are derived from these EFA through a series of enzyme
catalyzed desaturation and elongation reactions that take place in the cell cytosol or
in the mitochondria [20]. Docosahexaenoic acid is synthesised from ALA via EPA and
docosapentanoic acid (DPA; 22:5 n- 3), whereas arachidonic acid (AA; 20:4n-6) is
synthesised from LA via gamma (γ) linolenic acid (GLA; 18:3n-6) (Figure 2).
Since both n-6 and n-3 PUFA are synthesised through the same
desaturation/elongation pathway, there exists potential for competition between
these two families of fatty acids. The initial conversion of ALA to 18:4n-3 by the
action of Δ6-desaturase is the rate limiting reaction of the pathway. Despite the
higher affinity of Δ6-desaturase for ALA than for LA [21], the typically higher
concentrations of LA than of ALA in cellular pools results in greater conversion of n-6
PUFA. It has also been reported that the pathway for conversion of ALA to EPA and
DHA in human is limited and less than 8% of ALA is synthesised to EPA, while only
between 0.02% and 4% of ALA is synthesized to DHA, with women having a higher
capacity to synthesize DHA than men [22-24]. Since the capacity to synthesize EPA
and DHA from the ALA is very limited, direct intake of the former two is the easiest
way to increase the amounts of these fatty acids in human tissues. They can be
obtained from marine mammals' oils (e.g., seal and whale blubber), fish and fish oils
(e.g., menhaden, salmon, tuna and Nile perch), as well as marine algae [25].

5
Eicosatetraenoic acid (20:4)
Eicosapentaenoic acid (EPA, 20:5)
COOH
CH3
COOH
CH3
CH3
COOH
CH3
COOH
CH3
COOH
CH3
COOH
COOH
CH3
COOH
CH3
CH3
COOH
CH
COOH
CH3
COOH
CH3
COOH
Linolenic acid (ALA, 18:3)
Octadecatetraenoic acid (18:4)
Docosapentaenoic acid (22:5)
Docosahexaenoic acid (DHA, 22:6)
del-6 desaturase
del-6 elongase
del-5 desaturase
del-5 elongase
del-4 desaturase
COOH
CH3
COOH
CH3
CH3
COOH
CH3
COOH
COOH
CH3
COOH
CH3
CH3
COOH
CH3
COOH
Linoleic acid (18 : 2 )
Linolenic acid (GLA 18:3)
Arachidonic acid (20:4)
Dihomo GLA (20:3)
del-6 desaturase
del-6 elongase
del-5 desaturase
n-3 route n-6 route
Eicosatetraenoic acid (20:4)
Eicosapentaenoic acid (EPA, 20:5)
COOH
CH3
COOH
CH3
CH3
COOH
CH3
COOH
CH3
COOH
CH3
COOH
COOH
CH3
COOH
CH3
CH3
COOH
CH
COOH
CH3
COOH
CH3
COOH
Linolenic acid (ALA, 18:3)
Octadecatetraenoic acid (18:4)
Docosapentaenoic acid (22:5)
Docosahexaenoic acid (DHA, 22:6)
del-6 desaturase
del-6 elongase
del-5 desaturase
del-5 elongase
del-4 desaturase
COOH
CH3
COOH
CH3
CH3
COOH
CH3
COOH
COOH
CH3
COOH
CH3
CH3
COOH
CH3
COOH
Linoleic acid (18 : 2 )
Linolenic acid (GLA 18:3)
Arachidonic acid (20:4)
Dihomo GLA (20:3)
del-6 desaturase
del-6 elongase
del-5 desaturase
Eicosatetraenoic acid (20:4)
Eicosapentaenoic acid (EPA, 20:5)
COOH
CH3
COOH
CH3
CH3
COOH
CH3
COOH
CH3
COOH
CH3
COOH
COOH
CH3
COOH
CH3
CH3
COOH
CH
COOH
CH3
COOH
CH3
COOH
Linolenic acid (ALA, 18:3)
Octadecatetraenoic acid (18:4)
Docosapentaenoic acid (22:5)
Docosahexaenoic acid (DHA, 22:6)
del-6 desaturase
del-6 elongase
del-5 desaturase
del-5 elongase
del-4 desaturase
COOH
CH3
COOH
CH3
CH3
COOH
CH3
COOH
CH3
COOH
CH3
COOH
COOH
CH3
COOH
CH3
CH3
COOH
CH
COOH
CH3
COOH
CH3
COOH
Linolenic acid (ALA, 18:3)
Octadecatetraenoic acid (18:4)
Docosapentaenoic acid (22:5)
Docosahexaenoic acid (DHA, 22:6)
del-6 desaturase
del-6 elongase
del-5 desaturase
del-5 elongase
del-4 desaturase
COOH
CH3
COOH
CH3
CH3
COOH
CH3
COOH
COOH
CH3
COOH
CH3
CH3
COOH
CH3
COOH
Linoleic acid (18 : 2 )
Linolenic acid (GLA 18:3)
Arachidonic acid (20:4)
Dihomo GLA (20:3)
del-6 desaturase
del-6 elongase
del-5 desaturase
COOH
CH3
COOH
CH3
CH3
COOH
CH3
COOH
COOH
CH3
COOH
CH3
CH3
COOH
CH3
COOH
Linoleic acid (18 : 2 )
Linolenic acid (GLA 18:3)
Arachidonic acid (20:4)
Dihomo GLA (20:3)
del-6 desaturase
del-6 elongase
del-5 desaturase
n-3 route n-6 route
3.3 Health aspects of marine lipids
The recommendation for dietary consumption of at least two servings of fish per
week [26], is based on the many health promoting properties of long chain omega-3
PUFAs. The role of n-3 PUFAs in protecting against atherosclerosis, the pathological
process leading to cardiovascular diseases is well documented [27]. The fatty acids
favourably affect a number of factors involved in atherosclerosis development for
example, they reduce production of inflammatory eicosanoids, lower blood pressure,
Figure 2. Synthesis of n-3 and n-6 PUFAs in mammals (Adapted from Napier & Sayanova [20].

6
serum triacylglycerol and cholesterol levels as well as prevent thrombosis and
cardiac arrhythmias [27].
DHA is required in the development of the nervous system, brain and eyesight of
both foetus and infant [25, 28], while in adults, it is essential in the maintenance of
the normal functions of the nervous system and the brain [28]. Deficiency of DHA is
associated with several disorders such as foetal alcohol syndrome, attention deficit/
hyperactivity, depression and Alzheimer disease. EPA is the precursor of eicosanoids
that provide anti-inflammatory effect [29].
Eicosanoids are mediators and regulators of inflammation derived from 20 carbon
PUFAs, dihomo γ -linolenic acid, AA and EPA [30]. Usually, inflammatory cells contain
high proportions of AA and low proportions of other 20-carbon PUFAs thus AA is the
major substrate of eicosanoid synthesis [29]. Synthesis begins with release of PUFAs
from membrane phospholipids through phospholipase hydrolysis followed by the
conversion of PUFA to eicosanoids by the action of cylcooxygenase, lipoxygenase and
cytochrome P-450 pathways [31, 32]. Cylooxyganese is responsible for oxidation of
AA to prostaglandins (which regulate muscle contraction, reduce blood pressure and
inhibit blood clotting) and thromboxane (induce blood clotting) [30], while
lipooxygenase catalyses synthesis of leukotrienes that are involved in allergic
responses. Omega-3 fatty acids obtained from the diet affect AA metabolism since
they displace AA from membranes and also compete with AA for the enzymes that
catalyze the biosynthesis of thromboxanes, prostaglandins and leukotrienes [29].
Metabolism of AA produces 2-series prostanoids (prostaglandins and thromboxanes)
and 4-series leukotrines while metabolism of EPA induces production of different
eicosanoids such as 3-series prostanoids and 5-series leukotrienes, which have lower
activity (e.g. less pro-inflammatory) than AA metabolites [33]. Since eicosanoid
formation from AA and EPA share a common set of enzymes, the ratio of n-3 to n-6
PUFAs in the diet determines which pathway is most active [31].
3.4 Scope of this work
The purpose of the work presented in this thesis was to valorise waste from fish
filleting industries through recovery of valued products. In Paper I, oil was
extracted from fish by-products using proteolytic enzymes. Effects of hydrolysis
time, enzyme concentration and water content on oil yields were evaluated. To add
more value to the extracted oils, DHA and EPA contents in the extracted oils were
enriched using lipases or urea crystallisation [Paper II, III and IV]. In Paper II,
EPA and DHA were enriched in the glyceride fraction using different lipases. The

7
effect of temperature on level of enrichment was also investigated. In Paper III,
EPA and DHA were enriched as free fatty acids or fatty acid ethyl esters using
lipases. Specificity of lipases towards EPA and DHA was investigated in Paper II and
III. An HPLC-ELSD method for simultaneous analysis and quantification of fatty
acids and fatty acid esters from fish oil was also developed [Paper II]. The method
allowed analysis of most predominant fatty acids and fatty acid esters from fish oil
without prior separation and/or derivatization.
Another study was aimed at the synthesis of PUFA-phenolic derivatives which could
serve as antioxidants in bulk oil or emulsion systems [Paper IV]. PUFA concentrate
obtained by urea crystallisation was thus esterified with rutin or vanillyl alcohol using
Candida antarctica lipase. The potential of the synthesised derivatives to scavenge
2,2-diphenyl-1-picrylhydrazyl (DPPH˙) radical as well as to stabilise fish oil PUFA
concentrate against oxidation was evaluated [Paper IV]. Finally, anaerobic digestion
of the insoluble fraction that remained after recovery of oil and soluble fraction was
evaluated in Paper V for methane production. Feasibility of co-digestion of this
fraction with a carbohydrate-rich leafy biomass was also studied.
4.0 Production of fish oil
Production of fish oil entails the separation of fatty substances (lipids) from other
constituents of the fish. Fish oil extraction methods include;
(i) Cooking by steam under pressure with or without the presence of water
followed by pressing and centrifugation and/ or filtration to recover the oil is the
most common procedure [34]. The drastic conditions of temperature and pressure
involved may partially modify the natural all cis n-3 PUFAs [35]. Heating also results
in protein coagulation.
(ii) Use of solvents for oil extraction. This is a well developed technology.
Extraction of oil with organic solvents however causes denaturation of proteins in
addition to loss of functional properties [36]. Organic solvents are also harmful to
human health as well as the environment.
(iii) Supercritical fluid oil extraction. At or above critical temperature (31.1 ˚C)
and pressure (7.39 MPa), carbon dioxide turns into a fluid state. This liquid is an
inert and safe solvent that has been used in oil extraction [36, 37]. The main
advantage with this method is that no solvent remains in the product. At room
temperature and pressure, the CO2 returns to gas phase and evaporates.

8
Supercritical fluids have lower viscosities and higher diffusivities than conventional
solvents which improve mass transfer from solid and liquid matrices and thus
decreases overall time needed for extraction [38]. Relatively high capital cost of the
high pressure extraction equipment is the major draw back to this technique.
(iv) Enzymatic tissue disruption is another promising alternative technique. A
range of products for human and animal consumption can be obtained using this
method [39]. Large protein molecules are broken down to a range of smaller
peptides and amino acids which facilitates oil release. The main advantage for
enzymatic oil extraction is that it can be carried out under mild conditions such as,
low temperatures ( ≤ 55 ˚C ) thus minimising PUFA oxidation, no use of solvents
and hydrolysis is performed for a short period of time [35]. In addition, the
functional properties of the protein are maintained [40], while the unhydrolysed
residue (sludge) present a high quality protein meal. The resulting hydrolysate also
provides a good source of soluble fish proteins and phospholipids [41]. Enzymatic
hydrolysis could thus result in recovery of multiple products leading to maximum
utilisation of waste from fish processing.
4.1 Hydrolysis of fish by-products with commercial enzymes
Solubilisation of fish muscle proteins can be achieved through an autolytic process
using endogenous proteolytic enzymes [40]. Autolysis of fish muscle is usually
performed to produce fish sauce or fish silage. In the process, an aqueous solution
rich in small peptides and free amino acids is formed. The enzymes also promote
release of oil [40]. The disadvantage of using endogenous enzymes for the
hydrolysis is that the process is time consuming and lasts over several days [40,
42]. In addition, it is difficult to control the process since the presence of digestive
enzymes and their concentration may be highly seasonal, gender and age specific,
and can vary tremendously within and between species [40].
Use of exogenous (added) enzymes makes the hydrolysis process highly controllable
and hydrolysis time is also reduced [43]. Use of suitable enzyme/substrate ratios
and reaction times permits the production of hydrolysates with different molecular
structures and different functional properties that could find applications in various
food formulations [44]. In addition, added enzymes have also been reported to
improve oil yields [45-47]. Approximately 80% of total lipids can be isolated from
fish by-products after enzymatic hydrolysis [42, Paper I]. A wide-spectrum of
commercial proteases [Table 2], have been used for hydrolysis of fish by-products
with the aim of recovery of fish oils or proteins.

9
Table 2. Commercial enzymes used in hydrolysis of fish by-products
Protease used By-product source Reference
Protex 30L Nile perch and salmon Paper I and II
Bromelain Salmon Paper I
Flavourzyme, Protamex, and Alcalase Sardine [45]
Alcalase Cod [7]
Alcalase, Neutrase, Protamex, Papain, Bromelain, Actinidin and a plant protease mix
Cod [48]
Protamex Salmon [42]
Alcalase, Neutrase, and Flavourzyme Salmon [35]
Enzyme concentration has been reported to be the most influential factor for
enhanced release of lipids and phospholipids from fish by-products [41]. In Paper I,
increasing enzyme amount resulted in increased oil yield upto a given concentration
beyond which a further increase did not improve the yields (Figure 3). An optimum
enzyme substrate ratio is thus important in maximising oil yield.
Hydrolysis time is another factor that influences oil yield. According to [35, 41 and
Paper I], longer hydrolysis time does not result in increased oil yields. Tissue
hydrolysis achieved at the initial stage of hydrolysis (1-2 h), could be sufficient
enough to release the lipids. This is due to exposure of more hydrophobic amino
acids with increased degree of hydrolysis which interact with released lipid molecules
forming lipid–proteins complexes.

10
(a)
0
2
4
6
8
10
12
14
C 0.2 0.5 0.8 1 1.5% Bromelain (w/w), wet weight
oil
yei
ld (
g l
ipid
s/1
00
g w
et w
eig
ht)
(b)
0
2
4
6
8
10
12
14
16
18
C 0.03 0.05 0.08 0.16 0.32
% Protex 30L (v/w), wet weight
oil
yei
ld (
g l
ipid
s/1
00
g w
et w
eig
ht)
Figure 3. Effect of enzyme concentration: (a) Bromelain, (b) Protex 30L on oil yield on oil yield from 50 g of salmon heads homogenate incubated with different amounts of enzyme at 55 ˚C without water addition or pH adjustment. C is the oil yield from control (Paper I).
Another critical factor in enzymatic hydrolysis of fish by-products for lipid recovery is
the water content. Fish by-products constitute above 60% water [45]. A further
dilution of the by-products prior to hydrolysis results in decreased oil yields [7, 49,
Paper I]. This has been attributed to the formation of lipid-protein emulsion layer
that is resistant to enzymatic breakdown and the content of which increases with
increasing water content during the hydrolysis [49]. During hydrolysis of cod and
salmon by-products, it was observed that maximum oil yields were attained when no
water was added to the substrates while a dilution of 1:1 (w/v) resulted in decreased
oil yield and large emulsion fraction [49]. Addition of water into the hydrolysis
mixture however results in increased recovery of soluble proteins [40, 50].
Therefore, it is difficult to obtain maximum soluble proteins and lipid yields with the
same hydrolysis conditions [7, 41].

11
4.1.1 Up scaled hydrolysis of salmon by-products with Protex 30L
Hydrolysis at large scale was performed using salmon heads (Figure 4). Salmon
heads (28 kg) were crushed and homogenised using a grinder (GM 200, Retsch
GmbH, Germany). Oil was extracted from 23.4 Kg of the homogenate using Protex
30 L as described in Paper I. The samples were heated for 30 min prior to enzyme
addition, which was then followed by hydrolysis for 1 h with continuous stirring at
400 rpm without water addition. The weight of recovered oil was determined to be
3.9 Kg (16.7% w/w, wet weight). The oil fraction was used for PUFA recovery as
described in Paper IV and the solid fraction (sludge + emulsion) was used for
anaerobic digestion as described in Paper V.
Homogenate
2 kg Homogenate + 1 mlProtex 30 L (Hydrolysis 55 ˚C, no pH adjustment)
Filleting by-products Grinding/homo-genisation
fractionSieve
Bones
Liquid Centrifuge, 15 min, 2000 x g
OilEmulsion
Aqueous fraction
Sludge
Homogenate
2 kg Homogenate + 1 mlProtex 30 L (Hydrolysis 55 ˚C, no pH adjustment)
Filleting by-products Grinding/homo-genisation
fractionSieveSieve
Bones
Liquid Centrifuge, 15 min, 2000 x g
OilEmulsion
Aqueous fraction
Sludge OilEmulsion
Aqueous fraction
Sludge
Figure 4. Schematic presentation of enzymatic hydrolysis of salmon by-products using Protex 30L.
5.0 Lipids
The lipids used in the current study were triglycerides (TAG), free fatty acids or fatty
acid ethyl esters. As building blocks, glycerides contain a glycerol molecule and one
to three fatty acid molecules bound to the glycerol backbone through ester linkages.
Rubio et al. [34] defined fatty acids as organic compounds formed by a hydrocarbon
chain and a carboxylic group. Fatty acids can be saturated or unsaturated with
unsaturated fatty acids having one or several double bonds.
5.1 Determination of fatty acids distribution in triacylglycerols
Due to positional specificity of lipases, during the enzymatic synthesis of structured
lipids or enrichment of certain fatty acids such as PUFAs in marine oil triglycerides, it
is important to evaluate the distribution of fatty acids in the triglyceride (TAG)
molecule. Different fatty acids can be present at any of three positions on the

12
glycerol molecule (referred as, sn-1; sn-2 and sn-3). Fatty acids distribution in the
three positions can be determined using chemical or enzymatic procedures [51-53].
In either case, the fatty acid composition of the original TAG must be determined.
The fatty acid composition is usually expressed on a mol% basis since the relative
molecular weight contributions of individual fatty acids differ depending on chain
length and degree of unsaturation.
In enzymatic procedures, lipases that are specific for fatty acids in sn-1 and sn-3
positions in the triglyceride molecule are used to hydrolyse TAG to obtain 2-
monoacylglycerols. Pancreatic lipase is one of the lipases used to determine the fatty
acid composition of sn-2 position of triacylglycerols [52]. It is activated by bile salts
and calcium ions are essential for the hydrolysis reaction. Other lipases that have
been used for positional analysis are lipase from Rhizopus arrhizus [53], Rhizomucor
miehei [54] and Thermomcyes lanuginosus [54]. The lipases are specific for
positions sn-1 and sn-3 of the glycerol molecule and are not activated by bile salts.
They also do not have an absolute requirement for calcium ion. The resulting 2-
monoacylglycerols (2-MAG) are fractionated from free fatty acids, DAG and TAG,
transmethylated and analysed by gas chromatography as described in Papers I and
II. The limitation of using lipases to determine fatty acid distribution in fish oil is that
most lipases discriminate against long chain PUFAs [52, 54, 55]. However,
comparative positional analysis of fatty acid distribution in fish and squid oil using
two lipases (Rhizomucor miehei and Thermomcyes lanuginosus) gave similar results
indicating that 1,3 specific lipases can be used to give a rough indication of the fatty
acid distribution [54].
Chemical methods provide a suitable alternative to the use of lipases for positional
analysis. Triglycerides are usually reacted with Grignard reagent; methyl magnesium
bromide, ethyl magnesium bromide or allyl magnesium bromide [56], to produce a
representative pool of partial acylglycerols which are separated on thin layer
chromatography (TLC) plates impregnated with boric acid. The procedure shows no
significant selectivity with respect to fatty acid chain length, degree of unsaturation
and double bond configuration [57, 58]. The composition of fatty acids at position 2
is calculated from data for sn-1(3),2-DAG minus TAG or from TAG minus 1,3-DAG.
Acyl migration between sn 1(3) and sn-2 positions affects the accuracy of this
analysis [59, 60]. The acylglycerols formed from the TAG are usually contaminated
by fatty acids that have migrated from the isomeric positions.
13
6.0 Lipases
Lipases (triacylglycerol ester hydrolase, E.C.3.1.1.3) are ubiquitous enzymes and
have been found in most organisms from the microbial, plant and animal kingdom
[61]. They catalyze the cleavage of triacylglycerol (TAG) ester bonds to yield
diacylglycerols (DAG), monoacylglycerols (MAG), free fatty acids and glycerol. The
latter products are taken up by the cells to provide energy and growth intermediates.
Hydrolysis reaction can also be oriented towards ester synthesis when working in
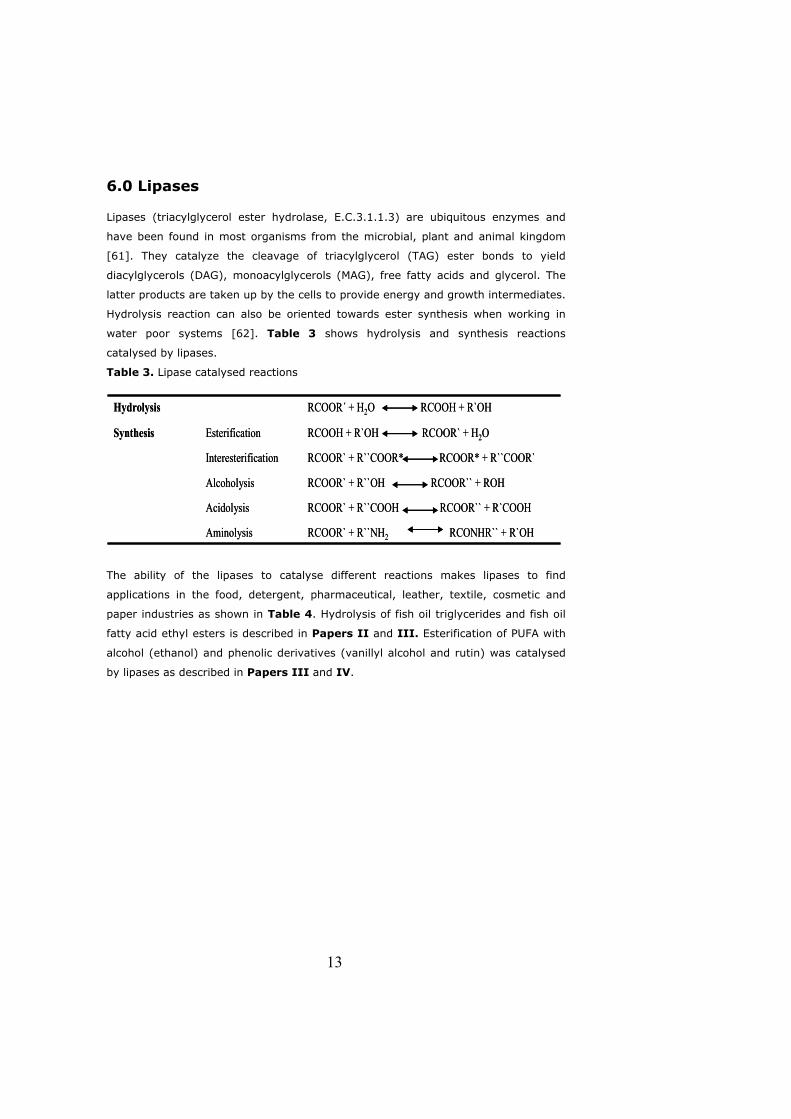
water poor systems [62]. Table 3 shows hydrolysis and synthesis reactions
catalysed by lipases.
Table 3. Lipase catalysed reactions
RCOOR` + R``NH2 RCONHR`` + R`OHAminolysis
RCOOR` + R``COOH RCOOR`` + R`COOHAcidolysis
RCOOR` + R``OH RCOOR`` + ROHAlcoholysis
RCOOR` + R``COOR* RCOOR* + R``COOR` Interesterification
RCOOH + R`OH RCOOR` + H2OEsterificationSynthesis
RCOOR´ + H2O RCOOH + R`OHHydrolysis
RCOOR` + R``NH2 RCONHR`` + R`OHAminolysis
RCOOR` + R``COOH RCOOR`` + R`COOHAcidolysis
RCOOR` + R``OH RCOOR`` + ROHAlcoholysis
RCOOR` + R``COOR* RCOOR* + R``COOR` Interesterification
RCOOH + R`OH RCOOR` + H2OEsterificationSynthesis
RCOOR´ + H2O RCOOH + R`OHHydrolysis
The ability of the lipases to catalyse different reactions makes lipases to find
applications in the food, detergent, pharmaceutical, leather, textile, cosmetic and
paper industries as shown in Table 4. Hydrolysis of fish oil triglycerides and fish oil
fatty acid ethyl esters is described in Papers II and III. Esterification of PUFA with
alcohol (ethanol) and phenolic derivatives (vanillyl alcohol and rutin) was catalysed
by lipases as described in Papers III and IV.

14
Table 4. Industrial application of lipases Industry Example of lipase used
and reaction catalysed Product Application Ref.
Cosmetic Rhizomucor miehei lipase, esterification
Isopropyl myristate, ethylhexyl palmitate
Skin care products
[63]
Candida rugosa lipase, esterification
Wax esters Skin care products
[63]
Pharma-ceutical
Pseudomonas cepacia, resolution of Racemic acetate, (cis-3-acetyloxy-4-phenyl-2-azetidinone)
Enantiomerically Pure 3R- acetate And (3S-cis)-hydroxy-4-phenyl-2-azetidinone
3R- acetate is intermediate in synthesis of anticancer drug (Paclitaxel) side chain.
[64]
Dairy Aspergillus niger and Rhizomucor miehei lipases. Hydrolysis of milk fats
Increased free fatty acids content
Accelerate cheese ripening , flavour and texture enrichment
[65]
Oil and Fat Lipase from Mucor miehei, Interesterification of sunflower oil with behenic acid
Structured lipid Reduced calorie fats
[66]
Rhizopus niveus lipase, esterification of stearic and palmitic acid at sn-1, 3 positions of sunflower oil
Structured lipid Cocoa butter substitute
[65]
Thermomyces lanuginosus lipase, Interesterification of palm stearin and coconut fats
Structured lipid Margarine fats [67]
sn-1, 3–specific Rhizomucor miehei lipase interesterification of palm oil with the fatty acids derived from high-oleic sunflower oil.
Structured lipid (Betapol)
Human milk fat substitute
[68]
Detergent Lipolase from Thermomyces lanuginosus
Lipid degradation to release free fatty acids
Stain removal [63]
15
6.1 General structure of lipases
Lipases belong to the α/β-hydrolase fold family [69-72]. The α/β-hydrolase fold
consists of a central hydrophobic eight stranded β -sheet packed between two layers
of amphiphilic α–helices, providing a stable scaffold for the active site [72]. The
catalytic triad, Serine-Histidine-Aspartic acid, is similar to that of serine proteases
with some variability in the acidic residues which can be aspartic or glutamic acid
[73-75]. In contrast to proteases, lipase catalytic site is buried under the head of a
helical loop (lid) folded onto the triad and stabilised by electrostatic and hydrophobic
interactions. The lid buries non-polar residues underneath and makes the active site
inaccessible to solvent and substrate [74, 76]. Activation of the lipase involves
displacement of the lid which exposes the hydrophobic residues, and favours
interaction with the lipid interface [77, 78]. Displacement of the lid also results in
burying of polar residues on the lid helix and the surface adjacent to it. The water
molecules which form a well defined network in the nonactivated enzyme are also
displaced [79]. Lipase activity is greatly increased at lipid-water interface; this is
called interfacial activation [80]. The catalytic reaction in the lipid–water interphase
involves at least four steps: (i) binding to the lipid surface, (ii) penetration into the
lipid phase, (iii) displacement of the lid (enzyme activation) and (iv) catalytic
hydrolysis [81].
6.1.1 Catalytic mechanism of lipases
Catalytic mechanism of lipases involves acylation and deacylation of the active serine
residue. Abstraction of hydroxyl proton from the active site serine activates it for a
nucleophilic attack on the carbonyl carbon of the ester bond in the acylating agent to
form first tetrahedral intermediate and a protonated imidazole (ImH+) on the
histidine residue (Figure 5). Proton transfer from ImH+ to the ester oxygen forms
the leaving group H2O or ROH depending on whether the acylating agent is an acid
or an ester yielding the acyl enzyme, (E-O-C(O)R). Deacylation is the hydrolysis or
alcoholysis of the acyl enzyme by activation of the incoming nucleophile or acyl
acceptor (H2O/alcohol) by the histidine, thus forming a second tetrahedral
intermediate. This intermediate reforms the carbonyl double bond as the serine
deprotonates ImH+ making the whole enzyme the leaving group. Other residues
supply necessary stabilization by hydrogen bonding to the oxy-anion of the
tetrahedral intermediate carrying much of the negative charge [82, 83].

16
Figure 5. Hydrogen bonding of first tetrahedral intermediate of lipase hydrolysis [82].
6.2 Lipase specificity
Though the catalytic mechanism described above is true for all lipases, the active
site of lipases comes in different shapes and sizes [61, 84]. Lipases are thus divided
into 3 groups: (1) lipases with a hydrophobic, crevice-like binding site located near
the enzyme surface (lipases from Rhizomucor, Rhizopus and Thermomyces
lanuginosus); (2) lipases with a funnel-like binding site (lipases from Candida
antarctica, Pseudomonas, mammalian pancreas and cutinase); and (3) lipases with a
tunnel-like binding site (lipase from Candida rugosa). The shape and micro-
environment of the binding site results in lipase preference to react on certain
acylglycerols or positions within e.g. triglyceride molecule. This is frequently
regarded as the selectivity or specificity of a lipase. Specificities of lipases are divided
into four major types [85]: (i) lipid class, (ii) positional, (iii) fatty acid, and (iv)
stereochemical. Since few lipases approach absolute specificity within analytical
limits in reactions with substrates, the term selectivity is replacing specificity; for
example, regioselectivity for positional specificity [86].
Lipid class selectivity is the specificity of lipases towards certain acylglycerols (TAG,
DAG or MAG). Penicillium camembertii and Penicillium cyclopium lipases act upon
mono- and diglycerides only [87, 88] wherease other Penicillium lipases hydrolyze
only triglycerides. Lipases can be non-regiospecific or display one of two kinds of
positional specificity: sn-l,3 specific or sn-2 specific. Nonspecific lipases hydrolyse all
three ester bonds of triglycerides at the same rate. Sn-l,3 specificity is associated
with the preferential release of fatty acid residues from the sn-1,3 positions of the
glycerol backbone rather than sn-2 position, whereas sn-2 specificity refers to
preferential release from the sn-2 position. Lipases from Candida rugosa and
Pseudomonas cepacia used in Papers II and III and Candida antartica used in
Paper IV are non-regiospecific whereas lipase from Thermomyces lanuginosus used
ImH+

17
in Papers I, II and III is sn-1,3 specific. Regio-selectivity of lipases makes them
effective catalysts for the synthesis of structured lipids that have a predetermined
composition and distribution of fatty acids at the glycerol backbone [89].
Stereoselectivity describes the preference of lipases to cleave ester bonds on sn-1,
or sn-3 positions. Many lipases have a preference for the sn-1 position, such as the
one from Rhizomucor miehei [90]. Fatty acid selectivity or typoselectivity refers to
lipases that are specific to fatty acids of particular chain length or a particular fatty
acid. Enrichment of n-3 PUFA in marine oils depends to a large extent on regio-and
fatty acid selectivities of lipases. This was evident in Paper II where non regio-
specific lipase from Candida rugosa enriched both EPA and DHA since it had low
selectivity towards these fatty acids (Figure 6). On the contrary, sn 1,3 specific
lipase from Thermomyces lanuginosus was ineffective in enriching EPA since a large
fraction of this fatty acid was located at sn 1,3 position.
00.20.40.60.8
11.21.41.61.8
C16:0 C16:1 C18:0 C18:1 EPA DHAFatty acids
1/α
tot
30 º C40 º C50 º C
Figure 6. Specificity of C. rugosa lipase towards different fatty acids in Nile perch oil at different temperatures (Paper II). 1/α represents fatty acid specificity.
6.2.1 Competitive factor
The term competitive factor (α) has been used to describe the kinetics of the reaction
when two substrates are present at the same time in the reaction mixture [91, 92]. α
is the ratio of the specificity constants and Rangheard et al. [93] defined 1/ α for a
substrate as a convenient measure for the specificity for this substrate. The term
specificity refers to enzyme's discrimination between several substrates competing
for an enzyme active site [94]. For two substrates competing for the enzyme, the
ratio of the reaction rates for each substrate (V1 and V2) is given by equation 1 which
holds at all concentrations of competing substrates.

18
V1/V2 = α [Ac1, x]/ [Ac2, x] Equation 1
Where [Ac1] and [Ac2] are concentrations of the two substrates at time x and α is the
competitive factor defined in equation 2.
α = [VAC1, X/KAC1, X]/ [VAC2, X/KAC2, X] Equation 2
where V is the maximal velocity and K is the Michaelis constant.
Practical estimation of the competitive factor is done using equation 3 which is the
integrated form of equation 1.
α = log ([Ac1, X0] / [Ac1, X]) / log ([Ac2, X0] / [Ac2, X]) Equation 3
Usually the best substrate (the highest reaction rate, V) is taken as reference and
each substrate reactivity towards the enzyme is characterized by a competitive
factor calculated using equation 3. The competitive factor for the reference substrate
is equal to 1.00. For a known substrate, the higher the α value, the lower the
reaction rate of this substrate compared to that of the reference compound, in a
mixture of these compounds. In Papers II and III, specificity factor (1/ α) was used
to compare the reactivity of EPA and DHA towards different lipases. EPA and DHA
were present as acylglycerols, free fatty acids or fatty acid ethyl esters. Palmitic acid
(C16:0) was taken as the reference fatty acid since it was the predominant fatty acid
in the oil and also being a saturated fatty acid, the lipases were expected to have a
higher preference towards C16:0 than the PUFAs. Lipase specificity has been shown
to decrease with increasing unsaturaration, when dealing with 1, 5 and 6 double
bonds [95].
Lipases from Thermomyces lanuginosus and Candida rugosa showed higher
specificity for oleic and palmetoleic acid when compared to EPA and DHA [Paper II].
The same lipases showed a clear preference for EPA over DHA in Paper II and III.
This could be explained by the fact that the position of the first double bond relative
to the carboxyl group is closer in DHA than in EPA which presumably adds some
strain to the active site of these enzymes to accommodate DHA properly, hence
making it a poorer substrate [96]. There are however lipases that exhibit a lower
specificity towards EPA than DHA. These include lipases from porcine pancrease,
Chromobacterium viscosum, Pseudomonas cepacia and Pseudomonas fluorescens
[97].
19
As discussed in Paper III, the lipases had a higher specificity of fatty acids when
present as free fatty acids (FFA) than fatty acid ethyl esters (FA-EE). Both lipases
from P. cepacia and T. lanuginosus showed a higher preference of EPA and DHA
when present as FFA than FA-EE. The specificity of T. lanuginosus lipase towards
DHA/ EPA when present as triglyceride, free fatty acid or fatty acid ethyl ester was in
the order of TAG hydrolysis > FFA esterification > FFA-EE hydrolysis [Paper II &
III]. This can be explained by the fact that apart from differences in the fatty acid
structure, when EPA and DHA are present in triglyceride molecule, factors such as
regio, stereo and triglyceride specificity of lipases influence the selectivity of lipases.
On the contrary, when present in FFA or FA-EE, problems associated with non
homogenous distribution of these fatty acids are eliminated and only the direct
effects of fatty acid structure on enzyme activity remain. Fatty acid
selectivity/specificity of lipases is exploited in fatty acid enrichments in single-stage
reactions such as hydrolysis [Paper II] or esterification [Paper III], in combination
with a physical means for separating the desired end product and the residual
unwanted fatty acid fraction.
6.3 Enrichment of long chain polyunsaturated fatty acids (PUFAs) in fish oils
Due to the triglyceride structure of fish oil, the omega-3 PUFAs content (EPA and
DHA) in fish oil does not exceed 30% [98]. Higher concentrations are achieved after
separation of fatty acids from the triacylglycerol structure using several methods
which include; chromatography, distillation, low temperature crystallization,
supercritical fluid extraction, urea complexation and enzyme catalysis [17, 99, 100].
Omega-3 PUFAs concentrates can be in the form of free fatty acids, methyl and ethyl
esters or acylglycerols [99]. Enzymatic enrichment of PUFAs offers many advantages
over other methods due to regio-, stereo-, and substrate specificity of lipases in
addition to the mild conditions (e.g. neutral pH and low temperatures) of the process
thus producing high quality products [101]. Many lipases have a lower specificity to
PUFAs especially EPA and DHA than the saturated and monounsaturated fatty acids
which has proven useful in enrichment of PUFAs in fish oils [54, 55, 97 ,Paper II
and III].
6.3.1 Enrichment of PUFAs in fish oil glycerides by lipase catalysed hydrolysis
The selectivity of lipases towards some fatty acids in fish oil is used to remove
saturated and monounsaturated fatty acids and leave PUFAs attached to the glycerol

20
backbone. However, prolonged hydrolysis can also results in hydrolysis of PUFAs
(Figure 7). Therefore, hydrolysis is usually stopped when the desired level of PUFAs
enrichment and recovery is attained.
H2O R1CO OH
H2O
R3COO H
OH
H2OR2CO OH
OH
OH
H2C O C
O
R1
O CO
R2
C R3
O
H2C
CH2 O
H2C OH
O CO
R2
C R3
O
H2C
CH2 O
H2C OH
O CO
R2H2C
CH2
H2C OH
H2C
CH2
Lipase
Lipase
Lipase
TAGDAG
MAGGlycerol
Figure 7. Lipase catalysed hydrolysis of triglyceride (TAG). R1, R2 and R3 are saturated, polyunsaturated (PUFA) and monounsaturated fatty acids, respectively.
After separation of released free fatty acids, a concentrate of PUFAs attached to
glycerol molecule in form of triglycerides (TAG), diglycerides (DAG) and
monoglycerides (MAG) is obtained. The percentage composition of TAG, DAG and
MAG in the concentrate depends on degree of hydrolysis [102]. n-3 PUFAs in the
acylglycerol form are considered to be more nutritionally favourable than free fatty
acids or ethyl/methyl esters of PUFAs. This is attributed to the high susceptibility of
free fatty acids to oxidation while the ethyl/methyl esters are more resistant to
hydrolysis by pancreatic lipase in the intestine [103-106].
Lipases from Candida rugosa, Thermomyces lanuginosus and Pseudomonas cepacia
have been used to enrich EPA and DHA in the glyceride fraction of fish oil [55]. As
described in paper II, C. rugosa lipase resulted in the best combined EPA and DHA
enrichment in Nile perch oil while T. lanuginosus lipase resulted in best DHA
enrichment but was ineffective in enriching EPA and also resulted in the least decline
of palmitic acid (Figure 8). This was attributed to the fact that a large fraction of
EPA was present in sn-1,3 positions while palmitic acid was in sn-2 position in the
glyceride molecule [Paper II]. Thermomyces lanuginosus lipase being sn-1,3

21
0
5
10
15
20
25
30
35
0 2 4 6 8 10 12 14 16 18 20 22 24 26
Hydrolysis time (h)
mo
l %
DH
A a
nd
EP
A
in g
lyce
rid
e
a)
0
5
10
15
20
25
30
35
0 2 4 6 8 10 12 14 16 18 20 22 24 26
Hydrolysis time (h)
mo
l %
DH
A a
nd
EP
A
in g
lyce
rid
e
a)
specific therefore hydrolysed EPA at sn-1,3 positions while hydrolysis of palmitic acid
in sn-2 position was limited.
10
12
14
16
18
20
22
24
26
28
0 2 4 6 8 10 12 14 16 18 20 22 24 26
Hydrolysis time (h)
mo
l %
P
alm
itic
& o
leic
aci
d
b)
10
12
14
16
18
20
22
24
26
28
0 2 4 6 8 10 12 14 16 18 20 22 24 26
Hydrolysis time (h)
mo
l %
P
alm
itic
& o
leic
aci
d
b)
Figure 8. (a) Changes in DHA and EPA mol% in Nile perch viscera oil following hydrolysis at 40 ˚C. ♦, □, ∆ mol% DHA and ҳ, ◊, ▲ mol% EPA, after hydrolysis with C. rugosa, P. cepacia and T. lanuginosus lipases. (b) Changes in palmitic and oleic acid mol % in Nile perch viscera oil following hydrolysis at 40 ˚C. ♦, □, ∆ mol% palmitic and ҳ, ◊, ▲ mol% oleic acid, after hydrolysis with C. rugosa, P. cepacia and T. lanuginosus lipases (Paper II).

22
A 1,3-specific Rhizopus oryzae lipase has been reported to enrich DHA in seal oil but
was ineffective in enriching EPA [107]. Seal oil has n-3 PUFA located mainly in sn-1
and sn-3 positions of the TAGs with DHA mainly in sn-3 position and EPA random in
sn-1 and sn-3 positions [108, 109]. Candida rugosa lipase has previously been
reported to yield the best DHA enrichment and also combined enrichment of EPA and
DHA in the glyceride fraction of fish oils [55, 99, 102, 110]. This could be attributed
to the fact that the lipase possesses fatty acid chain length selectivity, showing
higher activity with relatively short-chain fatty acids such as C18 or below [111].
Another reason could be its non-regiospecificity and the fatty acid profiles in fish oil
[90, 112]. The lipase has been reported to have structural specificity showing low
specificity to triglyceride molecules having DHA [113].
Temperature has an effect in the level of PUFA enrichment that is achieved following
lipase catalysed hydrolysis. Different levels of PUFAs enrichment were attained when
lipases from C. rugosa and T. lanuginosus were used to catalyse hydrolysis at 30, 40
and 50 ˚C [Paper II]. Maximum EPA and DHA enrichment was attained at 30 ˚C
with C. rugosa lipase while T. lanuginosus lipase gave best DHA enrichment at 50 ˚C
[Paper II]. Denaturation of C. rugosa lipase at 50 ˚C has been reported [114] and
this could explain why no enrichment was observed at this temperature. On the
contrary, lipase from T. lanuginosus is thermostable thus was active at this
temperature. Therefore, to obtain maximum enrichment of PUFA using lipases, the
reactions should be performed at optimum temperatures of the enzyme of choice.
However, the stability of PUFAs at that temperature should be considered.
6.3.1.1 Separation of acylglycerols and free fatty acids after enzymatic hydrolysis
To utilise lipase hydrolysis as a means of enriching fish oils, a method to separate
free fatty acids (FFA) from mono-, di-, and triglycerides is required. For analytical
purposes, the hydrolysis products are separated using thin layer chromatography as
described in Paper I and II. At large scale, glycerides can be separated from FFA by
liquid-liquid extraction, alkali neutralisation, molecular distillation, or crystallisation
[115]. In this study, alkali neutralisation was used as a means to recover the
acylglycerol fraction after hydrolysis of 200 ml of Nile perch viscera oil using 0.3 g of
Candida rugosa lipase (700 U/mg solid) in 200 ml of 0.2 M sodium phosphate buffer
pH 7.0 at 30 ˚C for 24 h with stirring at 300 rpm. The acid value of hydrolysed oil
was 90 mg NaOH /g oil.

23
Initial attempts to isolate FFA through soap formation with NaOH or KOH solutions
resulted in precipitation/solidification of the entire oil fraction probably due to
presence of several hydroxyl groups in diglycerides and monoglycerides of the
hydrolysed oil. A saponification/extraction technique previously reported was thus
used with slight modifications [116]. Hydrolysed oil was neutralised using 1 M KOH
in 0.5 M trisodium phosphate buffer (pH 13.3) and fatty acids extracted into
ethanolic solution. The ratio of oil/KOH/ethanol was 1:2:1 v/v/v. From 200 ml (179
g) of hydrolysed oil, a concentrate of 26.5 g, (14.8% yield) was achieved. The
concentrate contained 24% DHA and 6% EPA. The acylglycerol concentrate was used
in Paper IV for testing stabilisation of fish oil against oxidation using commercial
and synthesised antioxidants.
6.3.2 Enrichment of PUFAs in fish oil as free fatty acids or fatty acid esters
Selective enzymatic esterification of fish oil free fatty acids (FFA) or hydrolysis of the
fatty acid methyl/ethyl esters (FA-EE) could be more effective than hydrolysis of fish
oil triglycerides in concentrating PUFAs. This is because specificity of lipases towards
fatty acids bound to triglyceride molecules is affected by many factors such as regio-
selectivity of the lipases toward triglycerides, non-homogeneous distribution of EPA
and DHA into various positions of the glycerol backbone, as well as a possible
triglyceride selectivity of the lipases. On the contrary, when not attached to glycerol
molecule, lipase specificity is influenced by fatty acid structure or alcohol type used
during esterification reactions [117, 118].
6.3.2.2 Enrichment of PUFAs as free fatty acids
Enrichment of DHA and/or EPA in FFA is achieved by selective esterification of fish oil
free fatty acids (FFA) with an alcohol (Figure 9). Initially fish oil triglycerides are
split into their constituent fatty acids and glycerol by alkaline hydrolysis using
alcoholic KOH or NaOH [119, 120] and Paper III. Use of lipases to release FFA has
also been reported [117, 121, 122]. Due to high level of unsaturation, PUFAs are
poorer substrates of the lipases while the saturated (SA) and monounsaturated fatty
acids (MUFA) are preferred. Thus most of PUFAs are left as FFA while SA and MUFAs
are esterified.
During esterification reaction, the water content should be kept at minimum in order
to prevent product hydrolysis but be sufficiently high in order to prevent enzyme
deactivation [99]. Thus, water released during the esterification reaction is

24
continuously removed by use of adsorbents e.g. molecular sieves used in Paper III
and IV, vacuum evaporation or use of salt hydrates.
H2C O C
O
R1
H2C O CO
R2
CH2 O C R3
O
Hydrolysis
Glycerol
R1COOH
++
+R2COOH
R3COOH Alcohol (ROH)
R1COOR
+R2COOR
R3COOH
+ H2OH2C O C
O
R1
H2C O CO
R2
CH2 O C R3
O
Hydrolysis
Glycerol
R1COOH
++
+R2COOH
R3COOH Alcohol (ROH)
R1COOR
+R2COOR
R3COOH
+ H2O
Figure 9. Lipase catalysed esterification of fish oil FFA with alcohol (ethanol). R1, R2 and R3 are saturated, monounsaturated and PUFA fatty acids, respectively.
Lipases from Rhizopus delemar, Rhizomucor meihei, Pseudomonas fluorescens have
been used to enrich DHA in fish oil by selective esterification of fish oil FFA with
lauryl alcohol, glycerol and octanol, respectively [117, 119, 120]. Long chain
alcohols have been shown to enhance enzymatic esterification with considerable
amount of selectivity towards PUFA [117]. As described in Paper III, lipases from T.
lanuginosus and P. cepacia were used to enrich DHA and EPA in Nile perch oil by
selective esterification of Nile perch FFA with ethanol. Both lipases enriched DHA and
EPA with T. lanuginosus lipase giving better DHA enrichment while P. cepacia lipase
enriched EPA more. It is interesting to note that lipase from T. lanuginosus enriched
EPA when it was present as FFA or FA-EE [Paper III] while in Paper II; the same
lipase could not enrich EPA in glyceride fraction. EPA and DHA yields were also better
than those obtained during enrichment of PUFA as acylglycerols [Paper II and III].
This indicates that lipase selectivity is more pronounced when fatty acids are present
as FFA than when attached to glycerol molecule. It also demonstrates effect of fatty
acid distribution in triglyceride molecule on enrichment of PUFAs using regio-specific
lipases. Since TAG are considered nutritionally more favourable than FFA,
esterification of FFA PUFA concentrate (EPA/DHA), with glycerol is reported [99].
6.3.2.3 Enrichment of PUFAs as fatty acid methyl/ethyl esters
PUFAs in fish oil can also be enriched as methyl/ethyl esters. This involves hydrolysis
of fish oils to release free fatty acids which are then esterified with methanol or
ethanol to obtain FA-ME or FA-EE. Alcoholysis of FA-EE/FA-ME or hydrolysis of such
esters results in a fraction enriched in PUFA methyl or ethyl esters. Alcoholysis of
tuna oil ethyl esters with lauryl alcohol using Rhizopus delemar lipase to enrich DHA-
EE has been reported [123]. As described in Paper III, lipases from T. lanuginosus
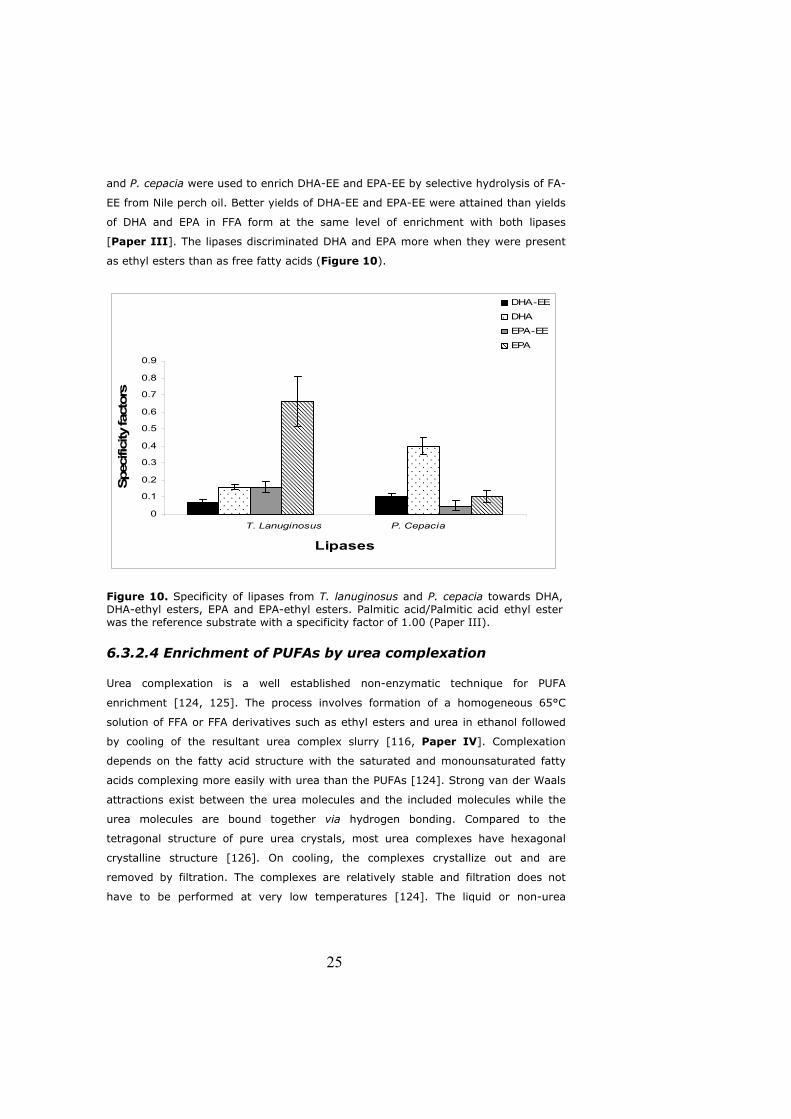
25
and P. cepacia were used to enrich DHA-EE and EPA-EE by selective hydrolysis of FA-
EE from Nile perch oil. Better yields of DHA-EE and EPA-EE were attained than yields
of DHA and EPA in FFA form at the same level of enrichment with both lipases
[Paper III]. The lipases discriminated DHA and EPA more when they were present
as ethyl esters than as free fatty acids (Figure 10).
Figure 10. Specificity of lipases from T. lanuginosus and P. cepacia towards DHA, DHA-ethyl esters, EPA and EPA-ethyl esters. Palmitic acid/Palmitic acid ethyl ester was the reference substrate with a specificity factor of 1.00 (Paper III).
6.3.2.4 Enrichment of PUFAs by urea complexation
Urea complexation is a well established non-enzymatic technique for PUFA
enrichment [124, 125]. The process involves formation of a homogeneous 65°C
solution of FFA or FFA derivatives such as ethyl esters and urea in ethanol followed
by cooling of the resultant urea complex slurry [116, Paper IV]. Complexation
depends on the fatty acid structure with the saturated and monounsaturated fatty
acids complexing more easily with urea than the PUFAs [124]. Strong van der Waals
attractions exist between the urea molecules and the included molecules while the
urea molecules are bound together via hydrogen bonding. Compared to the
tetragonal structure of pure urea crystals, most urea complexes have hexagonal
crystalline structure [126]. On cooling, the complexes crystallize out and are
removed by filtration. The complexes are relatively stable and filtration does not
have to be performed at very low temperatures [124]. The liquid or non-urea
0
0.1
0.2
0.3
0.4
0.5
0.6
0.7
0.8
0.9
T. Lanuginosus and P. Cepacia
Lipases
Spec
ifici
ty fa
ctor
s
DHA-EE
DHA
EPA-EE
EPA
26
complexed fraction is usually enriched in PUFAs. As reported in Paper IV, a
considerable reduction in saturated FFA content and remarkable increase in PUFA
occurs.
7.0 Lipid oxidation
Lipid oxidation is a process by which molecular oxygen reacts with unsaturated lipids
to form lipid peroxides. Oxidation of unsaturated fatty acids can be induced through
autoxidation by free radical reaction or photo-oxidation.
7.1 Free radical autoxidation
Free radical oxidation occurs in three steps: initiation, propagation and termination
[127].
7.1.1 Initiation
In the initiation step, the key event is the formation of a lipid radical L˙ which can be
induced by transition metal ions, hydroperoxide decomposition or heat.
LH + In˙ L˙ + InH Equation 4LH + In˙ L˙ + InH Equation 4
In˙ is the initiating agent and LH is lipid substrate.
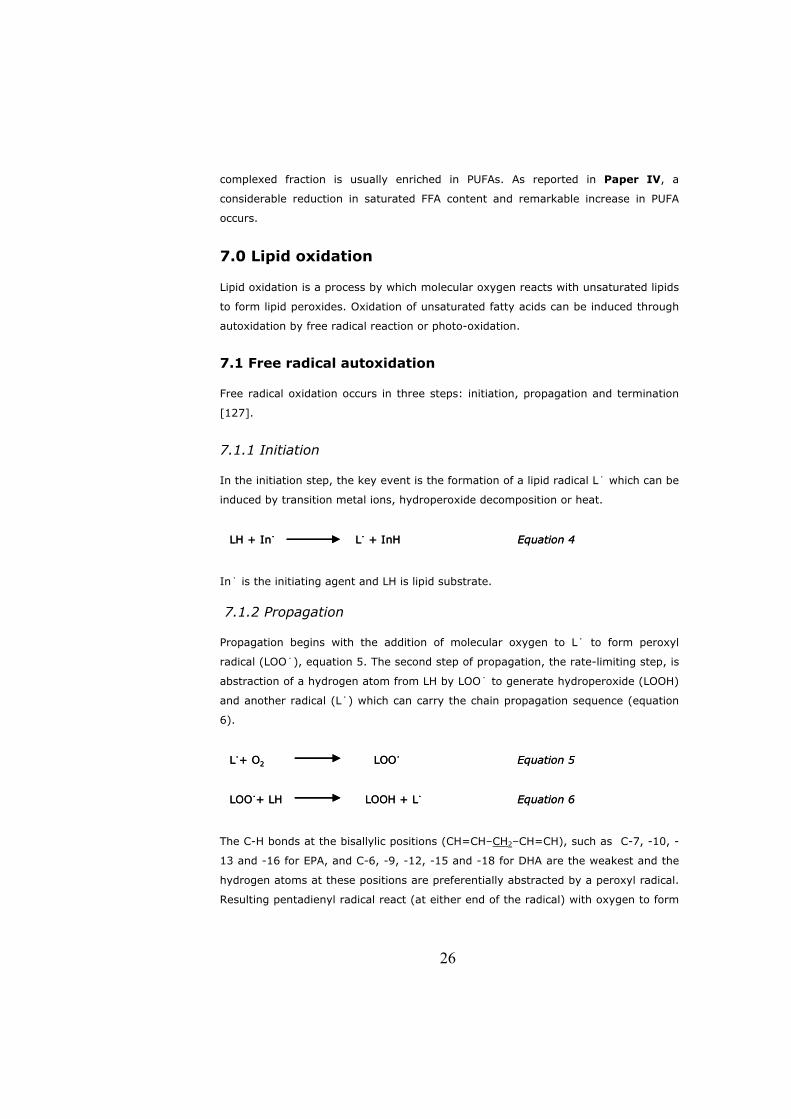
7.1.2 Propagation
Propagation begins with the addition of molecular oxygen to L˙ to form peroxyl
radical (LOO˙), equation 5. The second step of propagation, the rate-limiting step, is
abstraction of a hydrogen atom from LH by LOO˙ to generate hydroperoxide (LOOH)
and another radical (L˙) which can carry the chain propagation sequence (equation
6).
L˙+ O2 LOO˙ Equation 5L˙+ O2 LOO˙ Equation 5
LOO˙+ LH LOOH + L˙ Equation 6LOO˙+ LH LOOH + L˙ Equation 6
The C-H bonds at the bisallylic positions (CH=CH–CH2–CH=CH), such as C-7, -10, -
13 and -16 for EPA, and C-6, -9, -12, -15 and -18 for DHA are the weakest and the
hydrogen atoms at these positions are preferentially abstracted by a peroxyl radical.
Resulting pentadienyl radical react (at either end of the radical) with oxygen to form

27
two kinds of conjugated diene-monohydroperoxides [128]. In the presence of metal
ions or at high temperatures, lipid hydroperoxides can undergo decomposition via
homolytic cleavage of LOOH to form alkoxyl (LO˙) and hydroxyl radicals (˙OH)
[127]. Alkoxyl radical undergoes carbon-carbon cleavage to form breakdown
products including aldehydes, ketones, alcohols and alkyl radical [129]. Most
hydroperoxide decomposition products are responsible for the off-flavor in the
oxidized oils.
7.1.3 Termination
This involves coupling of two radicals to form non-radical products. As hydrogen
atom abstraction is the rate limiting step, recombination reactions are primarily
between two peroxyl radicals. This results in formation of an unstable tetraoxide
intermediate that decomposes to give an aldehyde, alcohol, and molecular oxygen
[130].
L˙ + L˙ L- L L˙ + L˙ L- L
LOO˙ + L˙ LOOL LOO˙ + L˙ LOOL
LOO˙ + LOO˙ non-radical productsLOO˙ + LOO˙ non-radical products
7.2 Photosensitized oxidation
Hydroperoxides of unsaturated fatty acids can also be formed following exposure to
light in the presence of oxygen and sensitizer that activates ground state oxygen to
singlet oxygen. Photosensitizers include chlorophyll, pheophytins, porphyrins,
riboflavin and myoglobin. In the presence of light, ground state photosensitizers
(1Sen) become excited into triplet state (3Sen*)[131]. Photosensetised oxidation can
then occur in two ways: (i) 3Sen* abstracts hydrogen from LH and produces L˙. The
L˙ can abstract hydrogen from neighbouring fatty acids to initiate the free-radical
chain reaction. (ii) Excited triplet sensitizer (3Sen*) transfers energy to ground state
oxygen that becomes activated to singlet oxygen. Singlet oxygen reacts directly with
double bonds in unsaturated fatty acids by ‘ene’ addition. Oxygen is thus added at
either side of the cis double bond, which is shifted to yield lipid hydroperoxides
[132]. Singlet oxygen oxidation yields conjugated and nonconjugated diene
hydroperoxides [133]. Decomposition of the hydroperoxides yields free radicals
which in turn initiate new chain reactions.
28
7.3 Antioxidants and lipid autoxidation
7.3.1 Antioxidants
An antioxidant is a substance that when present at lower concentrations than those
of an oxidizable substrate (lipids, proteins, DNA, carbohydrates) considerably delays
or avoids oxidation of that substrate [134, 135]. There is an increased interest on
the use of natural phenolics as antioxidants in improving the shelf-life of lipid
containing products since the widely used commercial antioxidants such as butylated
hydroxyl toluene (BHT) are considered potential promoters of carcinogenesis [136].
Naturally occurring molecules with antioxidative properties are acid-phenols or
flavonoids and their esters [137]. The antioxidant capacity of phenolic compounds is
based on their ability to scavenge free radicals and, in the particular case of
flavonoids, also by their binding of metal ions. In addition to antioxidant properties,
natural phenolics such as rutin are associated with several health benefits such as
antimicrobial, anti-inflammatory, anti-tumor and anti-angiogenic activities [138].
Phenolic acids consist of two groups: hydroxybenzoic acids and hydroxycinnamic
acids. Hydroxybenzoic acids have a carboxylic group (-COOH) and hydroxyl groups
(one or more) in an aromatic ring. Hydroxycinnamic acids have CH=CH-COOH group
instead of COOH as in hydroxybenzoic acid. Flavonoids are polyphenolic whose basic
structure is a flavan nucleus that consists of 2 aromatic rings that are linked together
by 3 carbon atoms that form an oxygenated heterocycle [139]. Hydroxyl groups
linked with the phenolic compounds are often the most efficient free radical
scavengers in foods since they can readily donate an electron or the hydrogen to
intercept and convert free radicals to a more stable compound [140].
7.3.1.1 Lipophilization of phenolic acids and flavonoids
The use of natural phenolics in lipid based systems is limited due to their poor
solubility which can result in a decrease in their ability to prevent oxidation of
unsaturated fatty acids at oil-water or oil-air interfaces [141]. Acylation of natural
phenols with lipophilic moieties with an aim of improving phenolics hydrophobicity
has been used as one strategy to address this issue [142, 143]. Lipophilization of
natural phenolics such as hydroxytyrosol [144], rutin [142, 145] ferrulic acid [146]
and vanillyl alcohol [147], with fatty acids of varying chain lengths has been
reported. Linolenic acid (C18:3) esterifed to rutin was shown to stabilise fish oil and
emulsion systems against oxidation [142], implying that the fatty acid which is
highly susceptible to oxidation due to presence of double bonds was protected
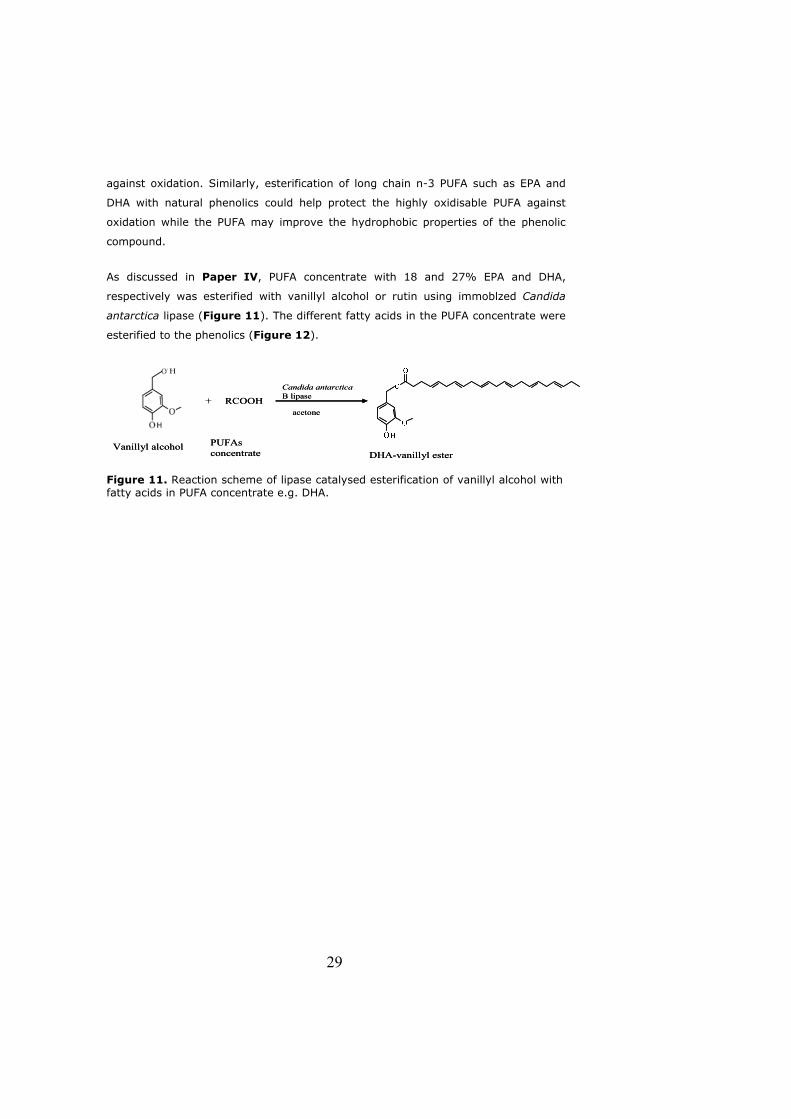
29
against oxidation. Similarly, esterification of long chain n-3 PUFA such as EPA and
DHA with natural phenolics could help protect the highly oxidisable PUFA against
oxidation while the PUFA may improve the hydrophobic properties of the phenolic
compound.
As discussed in Paper IV, PUFA concentrate with 18 and 27% EPA and DHA,
respectively was esterified with vanillyl alcohol or rutin using immoblzed Candida
antarctica lipase (Figure 11). The different fatty acids in the PUFA concentrate were
esterified to the phenolics (Figure 12).
H
+ RCOOHCandida antarcticaB lipase
acetone
Vanillyl alcohol PUFAs concentrate DHA-vanillyl ester
HH
+ RCOOHCandida antarcticaB lipase
acetone
Vanillyl alcohol PUFAs concentrate DHA-vanillyl ester
Figure 11. Reaction scheme of lipase catalysed esterification of vanillyl alcohol with fatty acids in PUFA concentrate e.g. DHA.
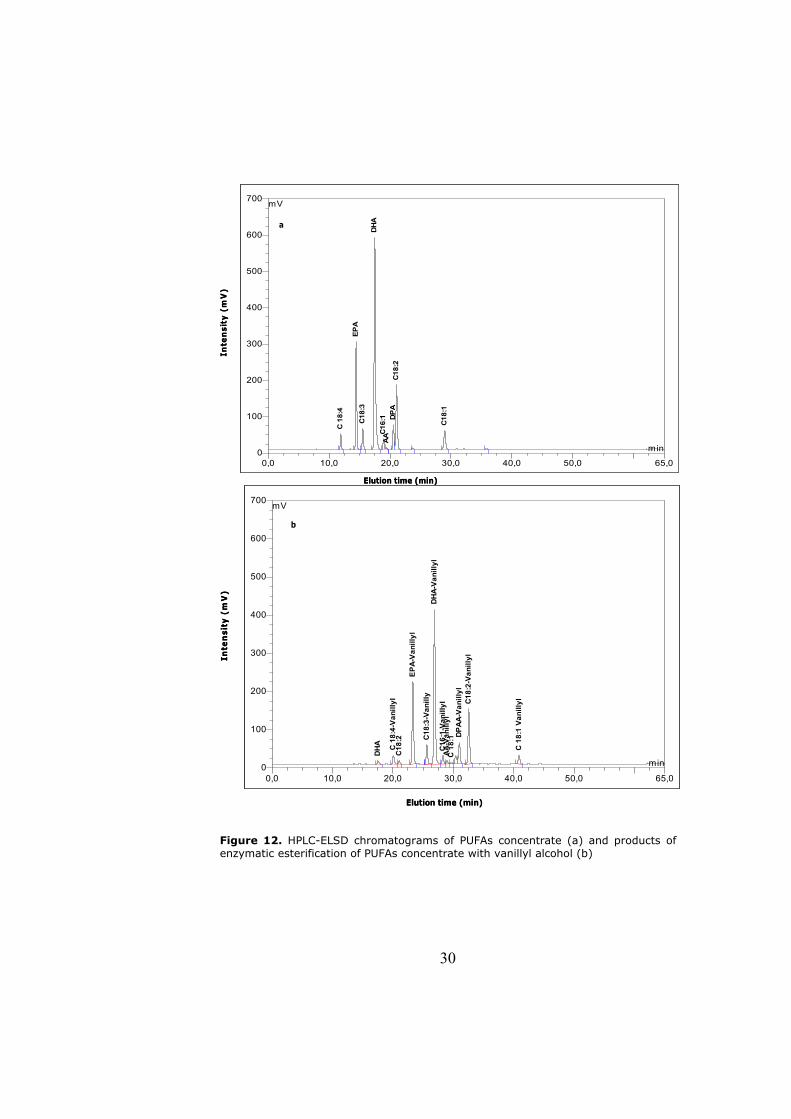
30
Inte
nsi
ty (
mV
)
Elution time (min)
0,0 10,0 20,0 30,0 40,0 50,0 65,00
100
200
300
400
500
600
700 mV
min
C 1
8:4
EP
AC
18:3
DH
AC
16:1
AA
DP
AC
18:2
C18
:1
aIn
ten
sity
(m
V)
Elution time (min)
0,0 10,0 20,0 30,0 40,0 50,0 65,00
100
200
300
400
500
600
700 mV
min
C 1
8:4
EP
AC
18:3
DH
AC
16:1
AA
DP
AC
18:2
C18
:1
a
0,0 10,0 20,0 30,0 40,0 50,0 65,00
100
200
300
400
500
600
700 mV
min
DH
A C 1
8:4-
Van
illyl
C18
:2
EP
A-V
anill
yl
C18
:3-V
anill
yD
HA
-Van
illyl
C16
:1-V
anill
ylA
A-V
anill
ylC
18:
1 DP
AA
-Van
illyl
C18
:2-V
anill
yl
C 1
8:1
Van
illyl
b
Inte
nsi
ty (
mV
)
Elution time (min)
0,0 10,0 20,0 30,0 40,0 50,0 65,00
100
200
300
400
500
600
700 mV
min
DH
A C 1
8:4-
Van
illyl
C18
:2
EP
A-V
anill
yl
C18
:3-V
anill
yD
HA
-Van
illyl
C16
:1-V
anill
ylA
A-V
anill
ylC
18:
1 DP
AA
-Van
illyl
C18
:2-V
anill
yl
C 1
8:1
Van
illyl
b
Inte
nsi
ty (
mV
)
Elution time (min)
Figure 12. HPLC-ELSD chromatograms of PUFAs concentrate (a) and products of enzymatic esterification of PUFAs concentrate with vanillyl alcohol (b)

31
Esterification of vanillyl alcohol with PUFA greatly increased its hydrophobicity
(Figure 12) and the esters stabilized both bulk and emulsion lipid systems against
oxidation. In contrast, a slight increase in rutin hydrophobicity was observed with the
rutin-pufa esters stabilising both bulk and emulsion lipid systems but to a lower
degree in comparison with commercial antioxidants and the vanillyl-PUFA esters
[Paper IV].The difference observed in antioxidant activities of the two products
could be attributed to the difference in the structure, solubility and the number of
phenolic hydroxyls [148]. The results suggest that esterification of PUFA concentrate
to natural phenolics improved their stability against oxidation and that is why the
PUFA-phenolic derivative could stabilise the oil systems against oxidation. The
advantage of such a derivative is that it carries the combined health benefits of PUFA
and phenolics. Esterification of epigallocatechin (EGCG) with EPA or DHA resulted in
esters which in addition to antioxidant activity showed antitumor activity that were
absent in the parent phenolic compound EGCG, suggesting that the PUFA moieties
contributed to the bioactivities of the ester derivatives [149].
8.0 Integration of omega 3-fatty acids and bio-fuel recovery from fish wastes
Enzymatic hydrolysis of fish waste to improve oil yields was employed as the first
step towards recovery of omega-3 PUFAs. This resulted in four fractions: oil,
emulsion, water soluble and insoluble fractions [Paper I]. To achieve better
utilisation of fish waste, it is important to make use of the water non-soluble fraction
as it forms a significant part of the hydrolysis products [50]. The fish sludge
(insoluble fraction + emulsion) following enzymatic hydrolysis of salmon by-products
presented 57% of the hydrolysis products. The potential of utilisation of such a
fraction for biogas production through anaerobic digestion (AD) was evaluated in
Paper V. AD involves the degradation of organic materials by microorganisms in
absence of oxygen which leads to the formation of microbial biomass and biogas, a
mixture of carbon dioxide and methane [150]. Following AD, specific methane yields
of 828 and 742 m3 CH4/ton of organic material measured as volatile solids (VS) were
attained from the fish waste (FW) before oil extraction and fish sludge (FS),
respectively. The lower methane yield in the sludge was attributed to the reduced oil
content. Lipids are known to have very high methane yields, approximately 1000 m3
CH4/ton VS. The methane yield from FS indicated that some lipids were present in
the sludge since methane yield from proteins is about 490 m3 CH4 per ton of VS.
Analysis of composition of different fractions obtained after hydrolysis of cod by-
products showed the sludge contained a relatively high amount of lipids (up to 33.4

32
g/100 g of dry sludge) [49]. Also, as reported in Paper I, the oil yields obtained by
enzymatic extraction method were lower than those obtained using solvents
confirming this observation.
Omega-3 PUFAs in fish oil can be enriched as acylglycerol through hydrolysis of fish
oil triglycerides as described in Paper II, enzymatic esterification of free fatty acids
obtained by hydrolysis of fish oil or hydrolysis [Paper III], enzymatic hydrolysis of
fatty acid ethyl esters as described in Paper III, or urea crystallisation as described
in Paper IV. In all these methods, saturated and monounsaturated fatty acids are
the main by-products and can be converted to methyl/ethyl esters through an
esterification reaction. Methyl/ethyl esters of fatty acids are regarded as biodiesel.
Production of biodiesel from fish by-products has been reported [151].
8.1 Limitations of using fish residues as substrate for biogas production
Despite the high yields of methane observed for FW and FS, there are limitations of
using fish waste for biogas production in a continuous anaerobic digester due to high
content of lipids, proteins and light metals (sodium, potassium and calcium). These
compounds are known to inhibit the methanogenesis [152, 153]. The intermediates
of fat/lipid degradation are glycerol and long chain fatty acids (LCFAs). The inhibitory
effect of lipids is commonly attributed to the free LCFAs [154]. This is due to their
adsorption onto the cell wall/membrane interfering with the transport of soluble
substrates to the biomass and consequently causing the conversion rate of
substrates to decrease [150, 155]. Additionally, sorption of a light layer of LCFAs to
biomass leads to the flotation of sludge and consequent sludge washout.
Ammonia is a product of urea hydrolysis or anaerobic degradation of protein-rich
substrates such as fish sludge. Ammonia concentrations below 200 mg/L are
beneficial to anaerobic process [150], but when present at high concentrations, it
may inhibit methanogenesis. There are two forms of ammoniacal nitrogen in
aqueous solution, ammonium (NH4+), and free ammonia (FA). FA is reported to be
the main cause of inhibition since it is highly membrane-permeable and can
therefore diffuse passively into the cell causing proton imbalance, and/or potassium
deficiency [156]. As discussed in Paper V, both FW and FS had very high nitrogen
concentrations (23 and 26 g/l, respectively), which would result in very high FA
concentrations upon anaerobic digestion.
33
Metal ions are required for microbial growth when present in moderate
concentrations [150]. For instance moderate levels of sodium (100-200 mg/l) are
beneficiary to the anaerobes in formation of ATP and oxidation of NADH, while high
levels may facilitate the passive influx of K+ thereby neutralizing membrane
potential. Fish sludge and FW were rich in light metals such as sodium, potassium
and calcium with potassium concentrations as high as 8.7 g/l [Paper V]. Potassium
is reported to be stimulatory at 200-400 mg/l and toxic above 3000 mg/l [157].
8.1.1 Co-digestion of fish waste for biogas production
The limitations of using FW and FS for biogas production in a continuous anaerobic
digester can be overcome through co-digestion. This is defined as anaerobic
treatment of a mixture of at least two different substrates with the aim of improving
the efficiency of the AD process [158]. It helps in balancing the carbon: nitrogen
(C:N) ratio in the co-substrate mixture, as well as macro and micronutrients, pH, dry
matter and diluting inhibitors/toxic compounds [159]. Feasibility of co-digesting FS
with residues from crop cultivation that are high in carbohydrate but low in fat,
proteins and salts was evaluated and a full scale process outlined in Paper V. Co-
digestion of 604 tonnes (t) of FS (residue that remained after removal of oil and
soluble fish proteins from 1000 t of FW) with 2620 t of crop residues, at a ratio of
1:3 tonnes VS, would yield 538 t of biogas with 65% methane. The effluent, 4206 t
was shown to be a good biofertilizer that can be used in agricultural land due to the
low content of heavy metals while the ammonia-nitrogen, phosphorous and
potassium were in line or higher than present in swine or cattle manure. Co-
digestion of FS after enzymatic pre-treatment of FW for recovery of more valued
PUFA and soluble fish proteins would thus ensure conversion of all parts of a smelly
fish waste to useful products.
9.0 Conclusions and future perspectives
By-products from fish filleting present a potential resource instead of waste. Use of
proteolytic enzymes to hydrolyse such biomass results in three major products, the
oil fraction, soluble protein fraction and insoluble fraction that comprises of emulsion
and sludge [Paper I]. The three fractions can be upgraded to products of more
value such as omega-3 fatty acids [Paper II, III and IV], bioactive peptides and
biogas [Paper V]. By use of proteases, the oil yields are improved when compared
with the conventional cooking method. However, high water content in the samples
results in reduced yields.

34
To add value to Nile perch oil, lipases that discriminate against EPA and DHA in fish
oils were used to enrich these fatty acids. Based on results presented in this thesis,
lipase catalysed enrichment of DHA/EPA as free fatty acids or ethyl esters [Paper
III], resulted in better yields than enrichment as acylglycerols via hydrolysis [Paper
II]. This is because during triglyceride hydrolysis, the full selectivity of lipases is not
expressed as factors such as regio-specificity, non-homogenous distribution of DHA
and EPA in the glyceride molecule as well as triglyceride structure comes into play.
However, if DHA and EPA are required in aclyglycerol form, the DHA and EPA lost
during the hydrolysis step could be enriched through esterification step. Enrichment
of EPA/DHA in free form involves an extra step of splitting the fatty acids from the
triglyceride molecule while enrichment in acylglycerol form involves hydrolysis of the
native oil.
Saturated and monounsaturated fatty acids are the by-products of omega-3 recovery
process. Such fatty acids can be used in production of biodiesel through esterification
process while the sludge from the biomass hydrolysis step is used in biogas
production [Paper V]. Integration of oil extraction for omega-3 recovery and biofuel
production would minimise waste emanating from such a process. In fact, use of fish
biomass as a feedstock would provide an excellent opportunity to initiate a fish
waste biorefining industry. Several products as illustrated in scheme below (Figure
13) can be recovered using a variety of technologies.
Polyunsaturated fatty acids are highly prone to oxidation. This is usually minimised
by addition of antioxidants such as α-tocopherol and BHT. Natural phenolic
antioxidants are also used but the use is limited due to their hydrophilicity.
Esterification of PUFA with natural phenolic compounds improves hydrophobicity of
phenolic compounds [Paper IV]. PUFA esterified to phenolic compound is stabilised
against oxidation and the lipophilic-phenolic derivative protects oil systems against
oxidation. The PUFA-phenolic derivative also carries the health beneficial properties
of PUFAs and phenolics. To synthesize such a kind of derivatives, prior separation of
PUFA into individual fatty acids may not be necessary since using lipase from
Candida antarctica which does not show fatty acid specificity, all fatty acids are
incorporated into the phenolic derivative. Acylation of phenolic derivatives with a
primary hydroxyl group such as vanillyl alcohol results in better yields.
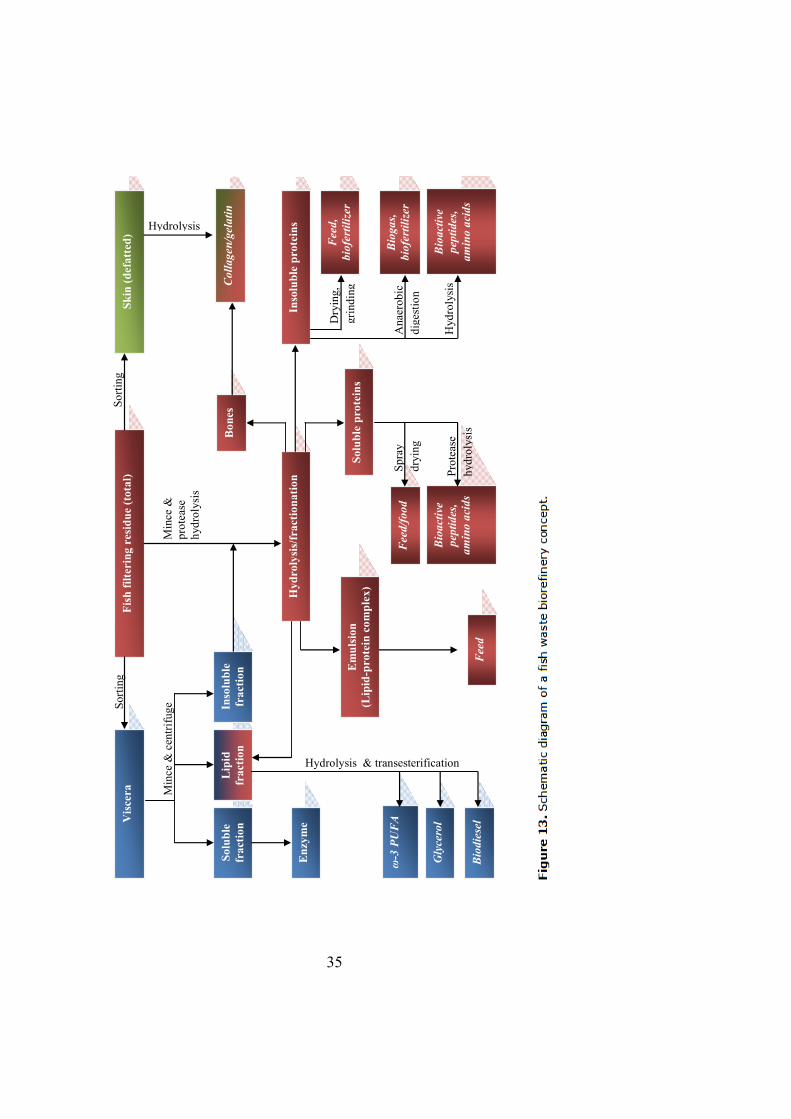
35
Dry
ing,
gr
indi
ng
Solu
ble
frac
tion
Fish
filte
ring
res
idue
(tot
al)
Vis
cera
Sk
in (d
efat
ted)
Hyd
roly
sis/
frac
tiona
tion
Lip
id
frac
tion
Inso
lubl
e fr
actio
n Em
ulsi
on
(Lip
id-p
rote
in c
ompl
ex)
Enz
yme
Feed
ω-3
PU
FA
Gly
cero
l
Biod
iese
l
Solu
ble
prot
eins
Bon
es
Inso
lubl
e pr
otei
ns
Colla
gen/
gela
tin
Feed
/food
Bioa
ctiv
e pe
ptid
es,
amin
o ac
ids
Biog
as,
biof
ertil
izer
Bioa
ctiv
e pe
ptid
es,
amin
o ac
ids
Feed
, bi
ofer
tiliz
er
Hydrolysis & transesterification
Hydrolysis
Ana
erob
ic
dige
stio
n
Hyd
roly
sis
Spra
y dr
ying
Prot
ease
h y
drol
ysis
Min
ce &
cen
trifu
ge Sorti
ng
Sorti
ng
Min
ce &
pr
otea
se
hydr
olys
is

36
10.0 Acknowledgements
I would like to express my appreciation to all the people who in different capacities have greatly supported me during my PhD journey. There are a few who deserve special thanks.
My supervisors
Professor Bo Mattiasson, thank you for accepting me as a PhD student at the department of Biotechnology. I am also very grateful for the valuable discussions, suggestions and always taking time to answer my questions. Your encouragement and support gave a lot of motivation.
Professor Patrick Adlercreutz. Thanks for accepting me as your student when Dietlind left. Thanks for always being available for discussions, excellent advice and encouragement.
Professor Francis Mulaa, thanks for supervision and support while in Kenya.
Dr. Dietlind Adlercreutz, my co-supervisor in the first study (Paper I), thanks for introducing me to the world of lipidomics and being patient with my learning.
To co-authors of my papers Ally, Shiva, Ivo and Lo, thanks for good collaboration and excellent discussions.
To the departments’ secretaries, Siv and Kersti, thanks for your kindness and help at all times since the first day I arrived in Lund. Frans-Peder, for your help with technical problems in the lab and office.
To all present and former environmental group members (Emma, Marika, Lo, Ivo, Valentine, Malik, Kassuwi, Maria, Maryam, Rosa, Danesh, Carla and Marisa): thank you for your friendship, and great moments during the dinners and fikas. Thanks too for bearing the fishy smell. Special thanks to my friends in the department Suhaila, Sindhu, Ally, Maryam, Laura, Tarek, Lesedi, Carla, Malik and Ivo for your help, participation and understanding during my difficult times in Lund. To my Kenyan Friends in Lund; thanks for making me feel home away from home. Suhaila, asante sana .
To the Bioorganic group members (Sindhu, Julia, Fabian, Carl, Gustav, Shiva and Pontus) thanks so much for your help with the analytical equipments (GC and HPLC).
To Marion, Maggie and Benny you are friends in deed. Thanks for standing in the gap and always being there for me.
I owe a lot to mum, dad, baba Jimmy and my siblings. Thanks for endless love, support, encouragement and prayers. Without you, I would not have come this far.
The Swedish International Development Agency (Sida/SAREC) sponsored BIO-EARN (East African Regional Programme and Research Network for Biotechnology, Biosafety and Biotechnology Policy development) program is gratefully acknowledged for the financial support of this work.
Finally, to the Almighty God, the pillar of my life in whom I trust.

37
11.0 References 1. Falch E., Rustad T., Jonsdottir R., Shaw N.B., Dumay J., Berge J. P., Arason S., Kerry J. P., Sandbakk M., Aursand M. Journal of Food Composition and Analysis. (2006), 19: 727–736.
2. Rustad T. Electronic Journal of Enviromental, Agricultural and Food chemistry. (2003), (ISSN: 1579-4377):458-463.
3. Pastoriza L., Sampedro G., Cabo M. L., Herrera J. J. R., Bernardez M. Journal of the Science of Food and Agriculture. (2004), 84: 83-88.
4. Ferraro V., Cruz I. B., Jorge R. F., Malcata F. X., Pintado M. E., Castro P. M. L. Food Research International. (2010), 43: 2221-2233.
5. Skåra, T. C., S. In Seafood From Producer to Consumer, Integrated Approach to Quality; Luten, J. B., Børresen, T., Oehlenschläger, J., Eds.; Elsevier Science, B. V.: Amsterdam, the Netherlands, . 1997: 103-111.
6. Aidos I., Lourenco S., Van der Padt A., Luten J. B., Boom R. M. Journal of Food Science. (2002), 67:3314-3320.
7. Slizyte R., Rustad T., and I. Storro. Process Biochemistry. (2005), 40:3680-3692.
8. Arvanitoyannis S., Kassaveti A. International Journal of Food Science and Technology. (2008), 43: 726-745.
9. Turon F., Rwabwogo B., Barea B., Pina M., Graille J. Journal of Food Composition and Analysis. (2005), 18: 717-722.
10. Gumisiriza R., Musandeti A. M., Rubindamayugi M. T., Kansiime F. and Kivaisi A. K. African Journal of Environmental Science and Technology. (2009), 3: 13-20.
11. FAO, http://www.fao.org/fishery/countrysector/naso_kenya/en.
12. Kabahenda M. K., Husken S. M. C. A review of low-value fish products marketed in the Lake Victoria region. Regional Programme Fisheries and HIV/AIDS in Africa: Investing in Sustainable Solutions. The WorldFish Center. Project Report 1974. 2009.
13. Gehring C. K., Gigliotti J. C., Moritz J. S., Tou J. C., Jaczynski J. Food Chemistry. (2011), 124: 422-431.
14. AWARENET, Handbook for the prevention and minimization of waste and valorization of by-products in European agro-food industries. Agro-food waste minimization and reduction network (AWARENET). Grow Programme, European Commision, 2004:1−7.
15. Gogus U. and C. Smith. International Journal of Food Science & Technology. (2010), 45: 417-437.
16. Bimbo A. P. Lipid Technology. (2007), 19:176-179.
17. Zuta C. P., Simpson B. K., Chan H. M., Phillips L. Journal of the American Oil Chemists Society. (2003), 80: 933-936.
18. Chakraborty K. and Raj R. P. Journal of agricultural and food chemistry. (2007), 55: 7586-7595.
19. Ogwok P., Muyonga J. H., Sserunjogi M. L. Food Chemistry. (2008), 108: 103-109.
20. Napier J. A. and Sayanova O. Proceedings of the Nutrition Society. (2005), 64: 387-393.

38
21. Sprecher H. Prostaglandins, Leukotrienes and Essential Fatty Acids. (2002), 67: 79–83.
22. Vermunt S. H., Mensink R. P., Simonis M. M., and Hornstra G. Lipids. (2000), 35: 137–142.
23. Williams C. M. and Burdge G. in Proceedings of the Nutrition Society. (2006), 42-50.
24. Burdge G. C., and Wootton S. A.The British Journal of Nutrition. (2002), 88: 411-420.
25. Ward O. P. and Singh A. Process Biochemistry. (2005), 40: 3627-3652.
26. Kolanowski W. Nutrition Research. (2008), 28:245-250.
27. Calder P. C. Clinical Science. (2004), 107: 1-11.
28. Horrocks L. A. and Yeo Y. K. Pharmacological Research. (1999), 40: 211-225.
29. Calder P. C. The American Journal of Clinical Nutrition. (2006), 83: 1505s-19s.
30. Tapiero H., G. N. B., P. Couvreur, Tew K. D. Biomedicine & Pharmacotherapy. (2002), 56: 215-222.
31. Lunn J., Theobald H. E. British Nutrition Foundation Nutrition Bulletin. (2006), 31: 178 224.
32. Smith W. L., Murphy R. C. The eicosanoids: cyclooxygenase, lipoxygenase, and epoxygenase pathways, in Biochemistry of Lipids, Lipoproteins and Membranes (Vance DE and Vance JE, eds) pp 341–372, Elsevier, New York. 2002.
33. Moreno J. J. The Journal Of Pharmacology And Experimental Therapeutics. (2009), 331: 1111-1117.
34. Rubio-Rodríguez N., Sagrario B., Isabel J., Sara M. de Diego, María T. S., Jordi R. C. Innovative Food Science & Emerging Technologies. (2010), 11: 1-13.
35. Linder M., Fanni J., and Parmentier M. Marine Biotechnology. (2005), 7: 70-76.
36. Uddin M. S., Ahn H. M., Kishimura H., Chun B. S. Biotechnology and Bioprocess Engineering. (2009), 14: 338-344.
37. Dunford NT, Temelli F., LeBlanc E. Journal of Food Science. (1997), 62: 289-294.
38. Lau E. V., Gan S. and H. K. Ng. International Journal of Analalytical Chemistry.(2010): 2010: doi:10.1155/2010/398381.
39. Shahidi F and Janak Kamil, Y. V. A. Trends in Food Science and Technology. (2001),12: 435-464.
40. Kristinsson H. G., Barbara A. R. Critical Reviews in Food Science and Nutrition. (2000), 40: 43–81.
41. Dumay J., Allery M., Claire D-M., Barnathan G, Jaouen P, Carbonneau M. E. and Berg´e J. P. Journal of the Science of Food and Agriculture. (2009), 89: 1599–1606.
42. Liaset B., Julshamn K., Espe M. Process Biochemistry. (2003), 38: 747-1759.
43. Liaset B., Leid E., and Espe M. Journal of the Science of Food and Agriculture. (2000). 80: 581-589.
44. Onodenalore A. C. and Shahidi F. Journal of Aquatic Food Product Technology. (1996), 5: 43-59.

39
45. Dumay J., Donnay-Moreno C., Barnathan G., Jaouen P., Berge´ J. P. Process Biochemistry. (2006), 41: 2327–2332.
46. Gbogouri G. A., Linder M., Fanni J., Parmentier M. European Journal of Lipid Science and Technology. (2006),108: 766-775.
47. Santamaria R. I., Soto C., Zuniga M. E., Chamy R., Lopez-Munguia A. Journal of the American Oil Chemists Society. (2003), 80: 33-36.
48. Aspmo S. I., Horn S. J., Vincent G. H. Eijsink, Process Biochemistry. (2005), 40:1957-1966.
49. Slizyte R., Dauksas E., Falch E., Storro I., Rustad T. Process Biochemistry. (2005), 40: 1415-1424.
50. Slizyte R., Dauksas E., Falch E., Storro I., Rustad T. Process Biochemistry. (2005), 40: 2021-2033.
51. Turon F., Bachain P., Caro Y., Pina M., Graille J. Lipids. (2002), 37: 817-821.
52. William W. Christie and Xianlin Han. Lipid analysis:Isolation, seperation, identification and lipidomic analysis. 4th edition. The oily press, 2010.
53. Amate L., Ramírez M. and Gil A. Lipids. (1999), 34: 865-871.
54. Lyberg A-M., Adlecreutz P. Biochimica et Biophysica Acta. (2008), 1784: 343–350.
55. Lyberg A-M, Adlecreutz P. European Journal of Lipid Science and Technology. (2008), 110: 317-324.
56. Yasuhiro A., Yuki T. and Yusuke H. Journal of Oleo Science. (2008), 57: 459- 462.
57. Becker C. C., Rosenquist A., Holmer G. Lipids. (1993), 28: 147–149.
58. Blasi F., Cossignani L., and Bosi A. Journal of the American Oil Chemists' Society. (2008), 85: 613-620.
59. Brockerhoff H. Lipids.(1971), 6: 942–956.
60. Serdarevich B. Journal of the American Oil Chemists' Society. (1967), 44: 381–393.
61. Schmid R. D., Verger R. Angewandte Chemie International Edition. (1998), 37:1608-1633.
62. Macrae A. R . Journal of the American Oil Chemists' Society. (1983), 60: 291–294.
63. Fariha H., Aamer A. S. and Abdul H. Enzyme and Microbial Technology. (2006), 39 : 235- 251.
64. Patel R. N. Annual Review of Microbiology. (1998), 98: 361-395.
65. Houde A., Kademi A. and Leblanc D. Applied Biochemistry and Biotechnology. (2004), 118: 155-170.
66. Kanjilal S., Prasad R. B. N., Kaimal T. N. B and Ghaforunissa R. S. H. Lipids. (1999), 34: 1045-1055.
67. Zhang H., Xu X., Nilsson J., Mu H., Adler-Nissen J., and Høy C-K. Journal of the American Oil Chemists' Society. (2001), 78: 57-64.

40
68. Harold W. Gardner and Tsung Min K. ed. Lipid Biotechnology. Chapter 22. Enzymatic Production of Betapol and other specialty fats. Print ISBN: 978-0-8247-0619-7, eBook ISBN: 978-0-203-90819-8, DOI: 10.1201/9780203908198.ch22 CRC Press 2002.
69. Brzozowski A. M., Derewenda U., Derewenda Z. S., Dodson G. G., Lawson D. M., Turkenburg J. P., Bjorkling F., Huge-Jensen B., Patkar S. A., Thim L. Nature. (1991), 351: 491-494.
70. Derewenda U., Brzozowski A. M., Lawson D. M., Derewenda Z. S. Biochemistry. (1992), 31: 1532–1541.
71. Egloff M. P., Marguet F., Buono G., Verger R., Cambillau C., van Tilbeurgh H. Biochemistry. (1995), 34: 2751–2762.
72. Ollis D. L., Cheah E., Cygler M., Dijkstra B., Frolow F., Franken S. M., Harel M., Remington S. J., Silman I., Schrag, J. D. Protein Engeneering. (1992), 5: 197–211.
73. Winkler F. K., D’Arcy A., W. Hunziker W. Nature. (1990), 343: 771–774.
74. Brady L. B. A., Derewenda Z. S., Dodson E., Dodson G., Tolley S., Turkenburg J. P., Christiansen L., Huge-Jensen B., Norskov L . Nature. (1990), 343: 767-770.
75. Derewenda Z. S. and Derewenda U. Biochemistry and Cell Biology. (1991), 69: 842–851.
76. Grochulskpawel Y. L., Joseph D. S. and Miroslaw C. Protein Science. (1994), 3: 82-91.
77. Secundo F., Carrea G., Tarabiono C., Gatti-Lafranconi P., Brocca S., Lotti M., Jaeger K. E., Puls M., Eggert, T. Journal of Molecular Catalysis B-Enzymatic. (2006), 39: 166-170.
78. Grochulski P., Li Y., Schrag, J. D., Cygler M. Protein Science. (1994), 3: 82-91.
79. Ashbaugh H. S., Paulaitis M. E. Journal of Physical Chemistry. (1996), 100: 1900–1913.
80. Sarda L., P. Desnuelle. Biochimica et Biophysica Acta. (1958), 30: 513–521.
81. Svendsen A., Inform. (1994), 351: 619-623.
82. Krautt J. Annual Review of Biochemistry. (1977), 46: 331.
83. Orrenius C., Van Hesuden C., Van Ruiten J., P. L. Antoine Overbeeke, Hans K., Johannis A. D. and Jaapp A. J. Protein Engineering. (1998), 11:1147-1153.
84. Pleiss J.,Fischer M. and Schmid R. D. Chemistry and Physics of Lipids. (1998), 93: 67-80.
85. Jensen R. G., D.R.Galluzzo and Bush V. J. Biocatalysis and Biotransformation. (1990), 3: 307-316.
86. Sonnet P. and Antonian E. Journal of Agriculture and Food Chemistry. (1998). 36: 856-862.
87. Yamaguchi S., Muse T. Applied microbiology and biotechnology. (1991), 34: 720-725.
88. Okumura S., Mieko I. and Yoshio T. The journal of Biochemistry. (1980), 87: 205-211.
89. Halldorsson A., Magnusson C. D. and Gudmundur G. H. Tetrahedron Letters. (2001) 42: 675–7677.

41
90. Rogalska E., Ransac S., and Vergers R. The Journal of Biological. Chemistry.(1990), 266: 20271-20276.
91. Chen C. S., Fujimoto Y., Oirdaukas O. and Sih C. J. Journal of the American Chemical Society. (1982), 104: 7294-7299.
92. Deleuz H., Langrad G., Millet H., Baratfi J., Buono G. and Triantaphylidm C. Biochimica et Biophysica Acta. (1987), 911: 117-120.
93. Rangheard M-S., Langrand G., Triantaphylides C., and Baratti J. Biochimica et Biophysica Acta. (1989), 1004: 20-28.
94. Fersht A., in Enzyme Structure and Mechanism, p. 111, Freeman and Company. 1985.
95. Pedersen S. B and Hølmer G. Journal of the American Oil Chemists' Society. (1995), 72: 239-243.
96. Miller C., Austin H., Posorske L., and Gonzlez J. Journal of the American Chemical Society (1988). 65: 927-931.
97. Halldorsson A., Kristinsson B., Haraldsson G. G. European Journal of Lipid Science and Technology. (2004), 106: 79-87.
98. Kolanowski W. and Laufenberg G. European Food Research and Technology. (2006), 222: 472-477.
99. Shahidi F.,Wanasundura U. N. Trends in Food Science & Technology. (1998), 9: 230-240.
100. Shimada Y., Watanabe Y., Sugihara A., Baba T., Ooguri T, Moriyama S., Terai T.,Tominaga Y. Journal of Bioscience and Bioengineering. (2001), 92: 19-23.
101. Breivik H., Haraldsson G. G., Kristinsson B. Journal of the American Oil Chemists' Society. (1997), 74: 1425–1429.
102. Tomoko O., Morrissey M. T . Food Chemistry. (2007), 103: 1411-1419.
103. Hamazaki T., Hirai A., Terano T., Sajiki J., Kondo S., Fujita T., Tamura Y., and Kumagai A. Prostaglandins. (1982). 23:557-567.
104. El-Boustani S., Colette C., Monnier L., Descomps B., Paulet C. A., and Mendey F. Lipids. (1987), 22: 711-714.
105. Lawson L. D., and B. G. Hughes. Biochemical and Biopysical Research Communications. (1988), 152: 328-335.
106. Yang L.Y., Kuksis A., and Myher J. J. Biochemistry and Cell Biology. (1989), 67: 192-204.
107.Wanasundara N. U., Shahididi F. Journal of the American Oil Chemists' Society. (1998), 75: 945-951.
108. Wanasundara U. N., Shahidi F. Journal of Food Lipids. (1997), 4: 51-64.
109. Aursand M., Jorgensen L., Grasdalen H. Journal of the American Oil Chemists' Society. (1995), 72: 293–297.
110. Sun T., Pigott G. M. and Herwing R. P. Food Chemistry and Toxicology. (2002), 67. 130-136.
111. McNeil G. P., Ackman R. G., Moore S. R. Journal of the American Oil Chemists' Society. (1996), 73: 1403-1407.
42
112. Benzonana G., Esposito S. Biochimica et Biophysica Acta (BBA)-Lipids and Lipid Metabolism. (1971), 231: 15-22.
113. Tanaka Y., Hirano J., and Funada T. Journal of the American Oil Chemists' Society. (1992), 69: 1210-1214.
114. Cleide M., Soares F., Heizir F., De Castro Flávio F. De Moraes and Gisella M. Zanin. Applied Biochemistry and Biotechnology. (1999), 79: 745–757.
115. Coleman M. H., and Macrae A. R. U.S. Patent 4,275,081 (1981).
116. Hayes D. G., Kenneth D. C., and Kleiman R. Journal of the American Oil Chemists' Society. (1996), 73 : 1113- 1119.
117. Rakshit S. K., Vasuhi R., Kosugi Y. Bioprocess Engineering. (2000), 23: 251-255.
118. Lee C. H. and Parkin K. L. Biotechnology progress. (2000), 16: 372-377.
119. Halldorsson A., Kristinsson B., Glynn C., and Haraldsson G. G. Journal of the American Oil Chemists' Society. (2003), 80: 915-921.
120. Shimada Y., Sugihara A., Nakano H., Takashi K., Toshihiro N., Munekazu G. and Yoshio T. Journal of the American Oil Chemists' Society. (1997), 74: 97-101.
121. Shimada Y., Sugihara A., Shigeru M., and Yoshio T. Journal of the American Oil Chemists' Society. (1997), 74: 1441–1446.
122. Gamez-Meza N., Noriega-Rodrguez J. A., Medina-Juarez L. A., Ortega-Garca J., Monroy-Rivera J., Toro-Vazquez F. J., Garca H. S., Angulo-Guerrero O. Food Research International. (2003), 36 : 721-727.
123. Shimada Y., Sugihara A.,Yodono S., Nagao T., Maruyama K., Nakano H., komemushi S. and Yoshio T. Journal oF Fermentation and Bioengineering. (1997), 84: 138-143.
124. Udaya N. Wanasundara F. S. Food Chemistry. (1999), 65: 41-49.
125. Hayes D. G., Bengtsson C. Y., James M. Van Alstine and Setterwall F. Journal of the American Oil Chemists' Society. (1998), 75: 1403–1409.
126. Hayes D. G., Kenneth D. C., and Kleiman R. Journal of the American Oil Chemists' Society. (1996), 73:1113-1119.
127. Frankel E. N. Journal of the American Oil Chemists' Society. (1984), 61: 1908-1917.
128. Kobayashi H., Yoshida M., Miyashita K. Chemistry and Physics of Lipids. (2003), 126: 11–120.
129. Choe E, Min D. B. Comprehensive reviews in food science and food safety. (2006), 5: 169-186.
130 Yin H., Porter A. N. Antioxidants & Redox Signaling. (2005), 7: 170-184.
131. Min D. B., Boff J. M. Comprehensive reviews in food science and food safety. (2002). 1: 51-72.
132. Yasaei M P., Yang C. G., Warner R. C., Daniels H. D. and Ku Y. Journal of the American Oil Chemists' Society. (1996), 73: 1177-1181.
133. Frankel E. N., in Autoxidation in Food and Biological Systems (Simic, M., and Karel, M., eds.) pp. 141-183, Plenum Press, New York. 1980.
134. Halliwell B. Free radical Research Communications. (1990), 9: 1-32.
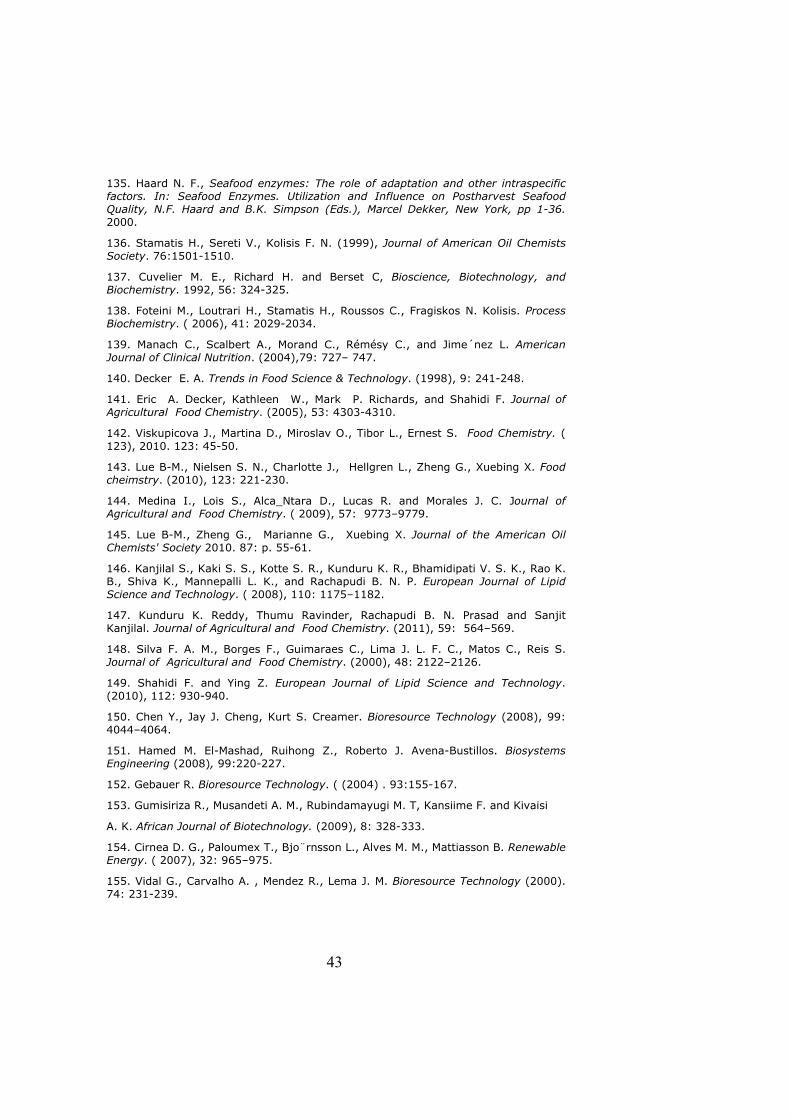
43
135. Haard N. F., Seafood enzymes: The role of adaptation and other intraspecific factors. In: Seafood Enzymes. Utilization and Influence on Postharvest Seafood Quality, N.F. Haard and B.K. Simpson (Eds.), Marcel Dekker, New York, pp 1-36. 2000.
136. Stamatis H., Sereti V., Kolisis F. N. (1999), Journal of American Oil Chemists Society. 76:1501-1510.
137. Cuvelier M. E., Richard H. and Berset C, Bioscience, Biotechnology, and Biochemistry. 1992, 56: 324-325.
138. Foteini M., Loutrari H., Stamatis H., Roussos C., Fragiskos N. Kolisis. Process Biochemistry. ( 2006), 41: 2029-2034.
139. Manach C., Scalbert A., Morand C., Rémésy C., and Jime´nez L. American Journal of Clinical Nutrition. (2004),79: 727– 747.
140. Decker E. A. Trends in Food Science & Technology. (1998), 9: 241-248.
141. Eric A. Decker, Kathleen W., Mark P. Richards, and Shahidi F. Journal of Agricultural Food Chemistry. (2005), 53: 4303-4310.
142. Viskupicova J., Martina D., Miroslav O., Tibor L., Ernest S. Food Chemistry. ( 123), 2010. 123: 45-50.
143. Lue B-M., Nielsen S. N., Charlotte J., Hellgren L., Zheng G., Xuebing X. Food cheimstry. (2010), 123: 221-230.
144. Medina I., Lois S., Alca_Ntara D., Lucas R. and Morales J. C. Journal of Agricultural and Food Chemistry. ( 2009), 57: 9773–9779.
145. Lue B-M., Zheng G., Marianne G., Xuebing X. Journal of the American Oil Chemists' Society 2010. 87: p. 55-61.
146. Kanjilal S., Kaki S. S., Kotte S. R., Kunduru K. R., Bhamidipati V. S. K., Rao K. B., Shiva K., Mannepalli L. K., and Rachapudi B. N. P. European Journal of Lipid Science and Technology. ( 2008), 110: 1175–1182.
147. Kunduru K. Reddy, Thumu Ravinder, Rachapudi B. N. Prasad and Sanjit Kanjilal. Journal of Agricultural and Food Chemistry. (2011), 59: 564–569.
148. Silva F. A. M., Borges F., Guimaraes C., Lima J. L. F. C., Matos C., Reis S. Journal of Agricultural and Food Chemistry. (2000), 48: 2122–2126.
149. Shahidi F. and Ying Z. European Journal of Lipid Science and Technology. (2010), 112: 930-940.
150. Chen Y., Jay J. Cheng, Kurt S. Creamer. Bioresource Technology (2008), 99: 4044–4064.
151. Hamed M. El-Mashad, Ruihong Z., Roberto J. Avena-Bustillos. Biosystems Engineering (2008), 99:220-227.
152. Gebauer R. Bioresource Technology. ( (2004) . 93:155-167.
153. Gumisiriza R., Musandeti A. M., Rubindamayugi M. T, Kansiime F. and Kivaisi
A. K. African Journal of Biotechnology. (2009), 8: 328-333.
154. Cirnea D. G., Paloumex T., Bjo¨rnsson L., Alves M. M., Mattiasson B. Renewable Energy. ( 2007), 32: 965–975.
155. Vidal G., Carvalho A. , Mendez R., Lema J. M. Bioresource Technology (2000). 74: 231-239.

44
156. Gallert á S. C., Bauer á J. Winter. Applied Microbiology and Biotechnoly. (1998), 50: 495-501.
157. Kugelman I. J. and McCarty, P. L. Journal Water Pollution Control Federation (1965), 37:97-115.
158. Álvarez J. A., Otero L., Lema J. M. Bioresource Technology .(2010), 101: 1153-1158.
159. Hartmann H., Angelidaki I., Ahring B. K. Co-digestion of the organic fraction of municipal waste types. In: Mata-Álvarez, J. (Ed.), Biomethanization of the Organic Fraction of Municipal Solid Wastes. IWA Publishing, UK. 2003.

Paper I

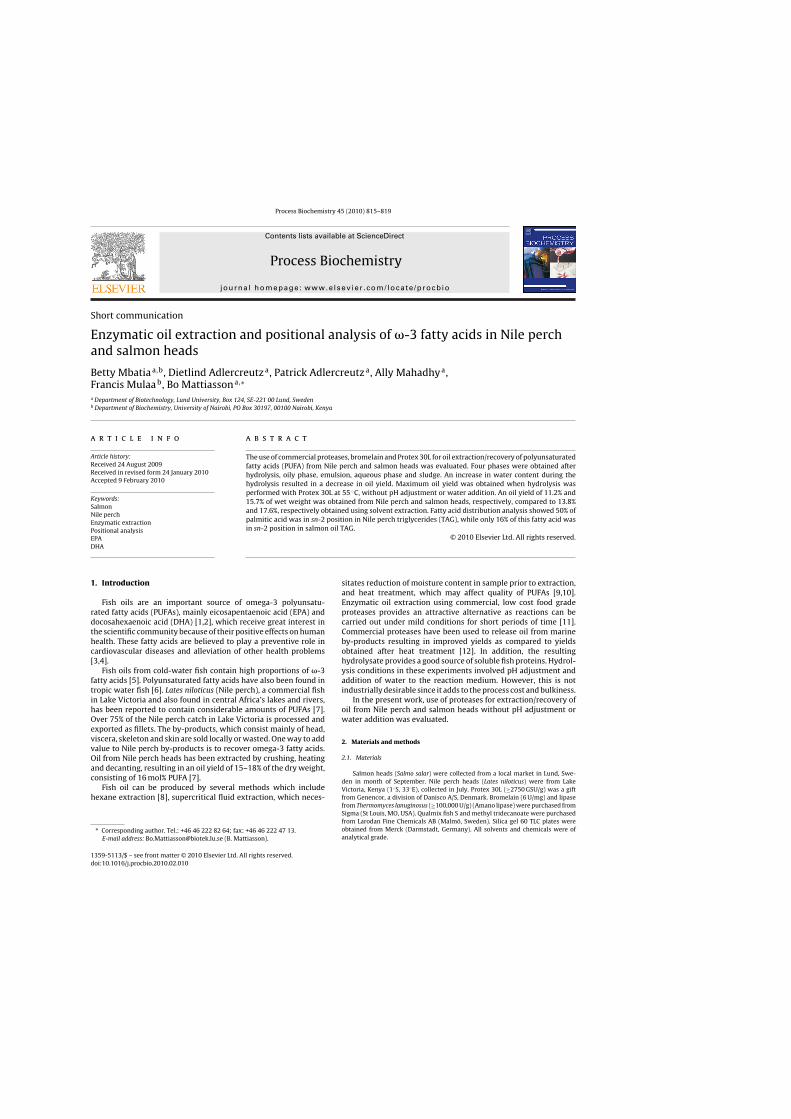
Process Biochemistry 45 (2010) 815–819
Contents lists available at ScienceDirect
Process Biochemistry
journa l homepage: www.e lsev ier .com/ locate /procbio
Short communication
Enzymatic oil extraction and positional analysis of �-3 fatty acids in Nile perchand salmon heads
Betty Mbatiaa,b, Dietlind Adlercreutza, Patrick Adlercreutza, Ally Mahadhya,Francis Mulaab, Bo Mattiassona,∗
a Department of Biotechnology, Lund University, Box 124, SE-221 00 Lund, Swedenb Department of Biochemistry, University of Nairobi, PO Box 30197, 00100 Nairobi, Kenya
a r t i c l e i n f o
Article history:Received 24 August 2009Received in revised form 24 January 2010Accepted 9 February 2010
Keywords:SalmonNile perchEnzymatic extractionPositional analysisEPADHA
a b s t r a c t
The use of commercial proteases, bromelain and Protex 30L for oil extraction/recovery of polyunsaturatedfatty acids (PUFA) from Nile perch and salmon heads was evaluated. Four phases were obtained afterhydrolysis, oily phase, emulsion, aqueous phase and sludge. An increase in water content during thehydrolysis resulted in a decrease in oil yield. Maximum oil yield was obtained when hydrolysis wasperformed with Protex 30L at 55 ◦C, without pH adjustment or water addition. An oil yield of 11.2% and15.7% of wet weight was obtained from Nile perch and salmon heads, respectively, compared to 13.8%and 17.6%, respectively obtained using solvent extraction. Fatty acid distribution analysis showed 50% ofpalmitic acid was in sn-2 position in Nile perch triglycerides (TAG), while only 16% of this fatty acid wasin sn-2 position in salmon oil TAG.
© 2010 Elsevier Ltd. All rights reserved.
1. Introduction
Fish oils are an important source of omega-3 polyunsatu-rated fatty acids (PUFAs), mainly eicosapentaenoic acid (EPA) anddocosahexaenoic acid (DHA) [1,2], which receive great interest inthe scientific community because of their positive effects on humanhealth. These fatty acids are believed to play a preventive role incardiovascular diseases and alleviation of other health problems[3,4].
Fish oils from cold-water fish contain high proportions of �-3fatty acids [5]. Polyunsaturated fatty acids have also been found intropic water fish [6]. Lates niloticus (Nile perch), a commercial fishin Lake Victoria and also found in central Africa’s lakes and rivers,has been reported to contain considerable amounts of PUFAs [7].Over 75% of the Nile perch catch in Lake Victoria is processed andexported as fillets. The by-products, which consist mainly of head,viscera, skeleton and skin are sold locally or wasted. One way to addvalue to Nile perch by-products is to recover omega-3 fatty acids.Oil from Nile perch heads has been extracted by crushing, heatingand decanting, resulting in an oil yield of 15–18% of the dry weight,consisting of 16 mol% PUFA [7].
Fish oil can be produced by several methods which includehexane extraction [8], supercritical fluid extraction, which neces-
∗ Corresponding author. Tel.: +46 46 222 82 64; fax: +46 46 222 47 13.E-mail address: [email protected] (B. Mattiasson).
sitates reduction of moisture content in sample prior to extraction,and heat treatment, which may affect quality of PUFAs [9,10].Enzymatic oil extraction using commercial, low cost food gradeproteases provides an attractive alternative as reactions can becarried out under mild conditions for short periods of time [11].Commercial proteases have been used to release oil from marineby-products resulting in improved yields as compared to yieldsobtained after heat treatment [12]. In addition, the resultinghydrolysate provides a good source of soluble fish proteins. Hydrol-ysis conditions in these experiments involved pH adjustment andaddition of water to the reaction medium. However, this is notindustrially desirable since it adds to the process cost and bulkiness.
In the present work, use of proteases for extraction/recovery ofoil from Nile perch and salmon heads without pH adjustment orwater addition was evaluated.
2. Materials and methods
2.1. Materials
Salmon heads (Salmo salar) were collected from a local market in Lund, Swe-den in month of September. Nile perch heads (Lates niloticus) were from LakeVictoria, Kenya (1◦S, 33◦E), collected in July. Protex 30L (≥2750 GSU/g) was a giftfrom Genencor, a division of Danisco A/S, Denmark. Bromelain (6 U/mg) and lipasefrom Thermomyces lanuginosus (≥100,000 U/g) (Amano lipase) were purchased fromSigma (St Louis, MO, USA). Qualmix fish S and methyl tridecanoate were purchasedfrom Larodan Fine Chemicals AB (Malmö, Sweden). Silica gel 60 TLC plates wereobtained from Merck (Darmstadt, Germany). All solvents and chemicals were ofanalytical grade.
1359-5113/$ – see front matter © 2010 Elsevier Ltd. All rights reserved.doi:10.1016/j.procbio.2010.02.010

816 B. Mbatia et al. / Process Biochemistry 45 (2010) 815–819
2.2. Sample preparation and analysis
Three Kg each of salmon and Nile perch heads were ground and homogenizedat 4 ◦C using Grindomix-GM 200 grinder to reduce particle size. The homogenateswere preserved under nitrogen atmosphere at −20 ◦C until further analysis. Thiswas done to minimize oxidation of long chain fatty acids and minimize endogenouslipolytic activity.
2.3. Enzymatic oil extraction from salmon and Nile perch heads
Ground and homogenized frozen salmon head fractions were thawed overnightat 4 ◦C. A 50 g sample was mixed with different amounts of water (0, 10, 25, 40and 50 ml) in a 500 ml jacketed reactor heated from a re-circulating water bath.The mixtures were heated to a temperature of 55 ◦C (approximate 15 min) withstirring at 500 rpm after which enzymatic hydrolysis was initiated by addition of0.5% bromelain (by wet weight of raw material). The contents were flushed withnitrogen and hydrolysis was allowed to proceed for 1 h.
Other parameters studied were enzyme concentration (bromelain 0.2–1%(w/w), Protex 30L 0.01–0.3% (v/w)), and hydrolysis time. The hydrolysates werecentrifuged at 2000 × g at room temperature for 15 min. In order to recover thedifferent fractions after centrifugation, the tubes were put upright at −20 ◦C for2 h and the fractions separated by cutting the frozen content of the tubes and thewet weights determined. In all cases, control experiments were performed withoutenzyme addition.
Using the optimum hydrolysis conditions obtained with salmon (water content,hydrolysis time and enzyme concentration above), oil was extracted from 100 g ofNile perch heads homogenate using 0.16% (v/w) of Protex 30L. All experiments wereperformed in triplicates.
2.4. Chemical analysis
Dry matter content in salmon and Nile perch heads and fractions obtained afterhydrolysis was determined gravimetrically after oven-drying the samples at 105 ◦Cfor at least 16 h [13]. Thereafter, ash content was quantified after heating the sampleat 550 ◦C for 2 h. Total lipids were extracted from the by-products according to Folchmethod [14]. Crude protein content (N x 6.25) in the raw material and emulsionphase was determined using the Kjeldahl method [13] using FIAStar 5000 Analyzer(Foss-Tecator, AB Sweden).
2.5. Positional distribution of fatty acids
Positional distribution of fatty acids in the extracted oils was analyzed asdescribed by Amate and Ramirez [15]. A 1,3-specific lipase from Thermomyces lanug-inosus (1000 units) was used to hydrolyse 120 mg of oil and reaction stopped after1 h. Hydrolysate was applied on thin layer chromatography (TLC) plates and elutedwith cyclohexane/diethyl ether/acetic acid (50:50:1, v/v/v) to separate the mono-glycerides (MAG), diglycerides (DAG), triglycerides (TAG) and free fatty acids [16].Plates were viewed at 366 nm after spraying with 0.2% w/v 2,7-dichloroflourescenein ethanol. MAG fraction was scraped off and methylated for GC analysis. Fractionof fatty acid x at sn-2 position of TAG was calculated according to Eq. (1):
Fractionx sn-2 = MAGx
3 ∗ TAGx(1)
where X = mol% Palmitic acid, EPA or DHA.
2.6. Gas chromatography analysis of fatty acids
Extracted crude oils from Nile perch and salmon heads were transesterified intofatty acid methyl esters (FAME) using sodium methoxide [16,17]. FAME analysiswas carried out using a Varian 3400 GC system equipped with a flame ionisationdetector. Supelcowax 10 capillary column (60 m × 0.32 mm × 25 �m film thickness;Supelco, Bellefonte, PA, USA) was used to separate FAME. The carrier gas was heliumat 1.79 × 10⁻¹ MPa. Temperature programme for separation was: initial temperatureof 50 ◦C was held for 5 min, increased to 220 ◦C at 25 ◦C/min and held for 21 min thiswas then increased to 240 ◦C at 15 ◦C/min and held for 10 min. Injector temperaturewas maintained at 60 ◦C for 0.1 min, and then increased to 250 ◦C at 60 ◦C/min andheld for 2 min. Detector temperature was kept constant at 250 ◦C.
3. Results and discussion
3.1. Approximate chemical composition of salmon and Nile perchheads
Crude salmon heads contained (%): 38.2 ± 1.2 dry matter (DM);3.3 ± 0.2 ash, 17.6 ± 1.5 lipid, and 11.9 ± 0.4 protein, while Nileperch heads contained (%): 37.3 ± 1.7 DM, 4.5 ± 0.4 ash, 13.8 ± 0.8lipid. The low DM content in Nile perch and salmon heads indicatedthat above 60% of the Nile perch and salmon heads constituted
Table 1Yield of dry matter (g/100 g wet weight of raw material) obtained after enzymatichydrolysis.
Water/substrate ratio No water 1:1 1:2
Oil 12.2 ± 1.1 7.6 ± 0.3 8.8 ± 1.2Fish protein hydrolysate 6.9 ± 0.8 10.8 ± 0.3 8.7 ± 1.2Emulsion 5.8 ± 0.5 7.3 ± 0.1 5.4 ± 0.4Emulsion protein content 0.6 ± 0.1 1.2 ± 0.1 0.7 ± 0.2Controla 6.4 ± 0.7 7.0 ± 1.3 6.4 ± 0.8
Values are means ± standard deviation of triplicate determinations.50 g salmon head homogenate hydrolysed for 1 h with 0.5% (w/w) Bromelain in thepresence of different amounts of water and without pH adjustment.
a Control experiment is without enzyme
water. Linder et al. [11] reported DM and ash content of 38.2 ± 1.3%and 2.6 ± 0.6%, respectively, from salmon heads.
3.2. Enzymatic oil extraction from salmon and Nile perchby-products
3.2.1. Effect of water on oil yieldEnzymatic hydrolysis resulted in formation of four phases (an
oily phase, emulsion phase, aqueous phase and sludge). A max-imum oil yield of 12.2 ± 1.1% of wet weight was obtained whensalmon heads were hydrolysed with 0.5% (w/w) bromelain withno water addition. The oil yield decreased with increasing watercontent with an oil yield of 7.6 ± 0.3% being attained when thesample was mixed with an equal amount of water (1:1, w/v)(Table 1). Decrease in oil yield with increasing water contentduring the hydrolysis could have been due to emulsion for-mation. An emulsion of 5.7 ± 0.5 and 7.3 ± 0.1 g dry weight per100 g wet weight starting raw material, with protein content of0.6 ± 0.1 and 1.2 ± 0.2 g was attained in the sample hydrolysedwithout water addition and at 1:1 (w/v) dilution, respectively.The emulsion has been reported to contain a high fat contentcompared to aqueous/fish protein hydrolysate (FPH) fraction, dueto high contents of hydrophobic amino acids that retain moreof the lipids than the more water-soluble FPH fraction [18].During enzymatic hydrolysis of raw materials containing highamounts of lipids (10–30%), amount of added water has also beenreported to have a significant influence on the amount of sep-arated oil and emulsion fraction with the highest oil yield andlowest amount of emulsion being attained in the absence of water[19,20].
3.3. Effect of hydrolysis time on oil yield
By hydrolysing 50 g of salmon heads homogenate with0.5% (w/w) bromelain without water addition, an oil yield of11.8 ± 0.4% g lipids/100 g wet weight was achieved after 1 h ofhydrolysis (Fig. 1). Prolonged hydrolysis (4–14 h) did not improvethe oil yield further but resulted in a colour change of aqueous phaseto brown. The formation of brown pigments could have resultedfrom reaction of carbonyls such as aldehydes produced from PUFAoxidation with amino acids and proteins [21]. Decrease in oil yieldafter 2 h could have been due to interaction of more lipids with thehydrolysed proteins as was the case observed when higher amountof water was added to the reaction. Linder et al. [11] reported thatfat recoveries from salmon heads did not increase further with anincrease in hydrolyzing time.
3.4. Effect of enzyme concentration on oil yield
The effect of varying amounts of enzyme on oil yield dur-ing hydrolysis was investigated using 50 g of salmon headshomogenate in condition where neither water was added nor pH
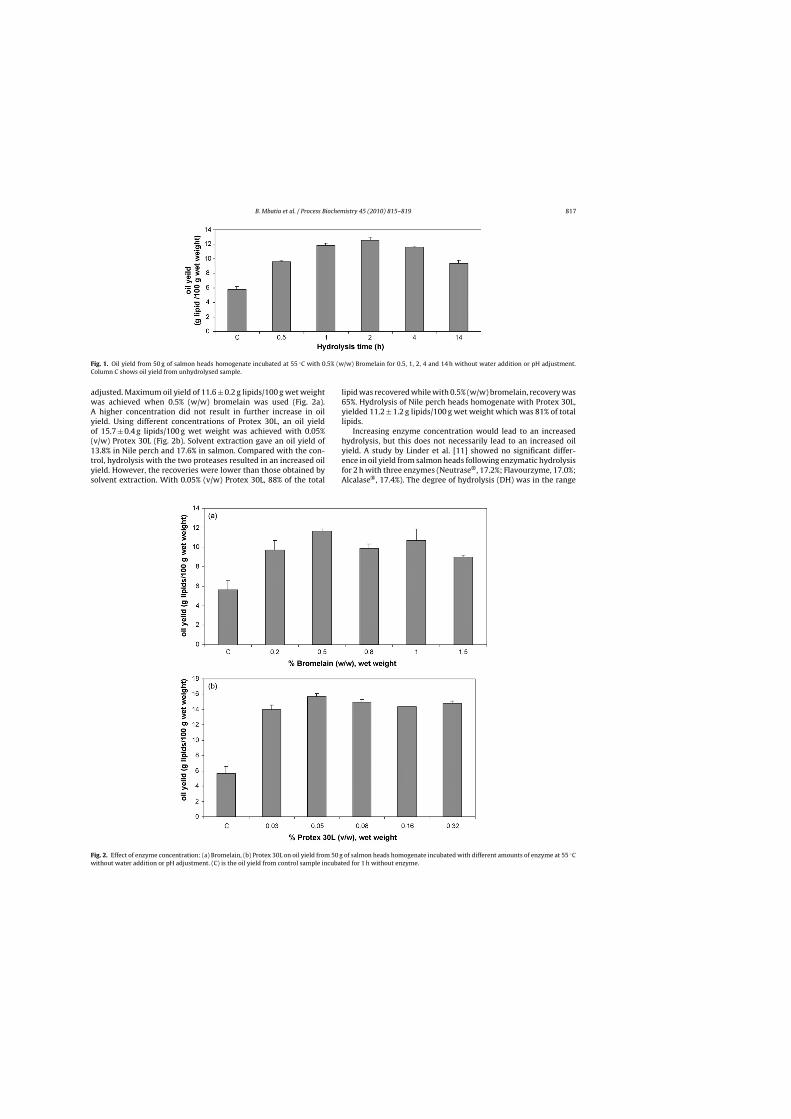
B. Mbatia et al. / Process Biochemistry 45 (2010) 815–819 817
Fig. 1. Oil yield from 50 g of salmon heads homogenate incubated at 55 ◦C with 0.5% (w/w) Bromelain for 0.5, 1, 2, 4 and 14 h without water addition or pH adjustment.Column C shows oil yield from unhydrolysed sample.
adjusted. Maximum oil yield of 11.6 ± 0.2 g lipids/100 g wet weightwas achieved when 0.5% (w/w) bromelain was used (Fig. 2a).A higher concentration did not result in further increase in oilyield. Using different concentrations of Protex 30L, an oil yieldof 15.7 ± 0.4 g lipids/100 g wet weight was achieved with 0.05%(v/w) Protex 30L (Fig. 2b). Solvent extraction gave an oil yield of13.8% in Nile perch and 17.6% in salmon. Compared with the con-trol, hydrolysis with the two proteases resulted in an increased oilyield. However, the recoveries were lower than those obtained bysolvent extraction. With 0.05% (v/w) Protex 30L, 88% of the total
lipid was recovered while with 0.5% (w/w) bromelain, recovery was65%. Hydrolysis of Nile perch heads homogenate with Protex 30L,yielded 11.2 ± 1.2 g lipids/100 g wet weight which was 81% of totallipids.
Increasing enzyme concentration would lead to an increasedhydrolysis, but this does not necessarily lead to an increased oilyield. A study by Linder et al. [11] showed no significant differ-ence in oil yield from salmon heads following enzymatic hydrolysisfor 2 h with three enzymes (Neutrase®, 17.2%; Flavourzyme, 17.0%;Alcalase®, 17.4%). The degree of hydrolysis (DH) was in the range
Fig. 2. Effect of enzyme concentration: (a) Bromelain, (b) Protex 30L on oil yield from 50 g of salmon heads homogenate incubated with different amounts of enzyme at 55 ◦Cwithout water addition or pH adjustment. (C) is the oil yield from control sample incubated for 1 h without enzyme.

818 B. Mbatia et al. / Process Biochemistry 45 (2010) 815–819
Table 2Fatty acid composition (mol%) in crude oil recovered from Nile perch and salmon heads.
Fatty acid profile (mol%) Fatty acid distribution (mol%) sn 2 -position
Fatty acid Salmon oil Nile perch oil Salmon oil Nile perch oil
C 14:0 3.4 ± 0.01 3.6 ± 0.03 2.1 ± 0.06 4.2 ± 0.53C 15:0 0.3 ± 0.04 0.2 ± 0.47 0.3 ± 0.02 0.6 ± 0.18C 16:0 12.3 ± 0.17 24.0 ± 0.20 5.9 ± 1.09 36.8 ± 1.45C 16:1 4.6 ± 0.06 11.0 ± 2.29 5.2 ± 0.07 10.5 ± 1.05C 18:0 3.0 ± 0.04 9.0 ± 0.25 0.6 ± 0.09 5.1 ± 1.11C 18:1 34.9 ± 1.61 24.2 ± 0.43 39.6 ± 0.47 14.8 ± 0.45C 18:2 10.2 ± 0.14 2.3 ± 0.50 11.5 ± 0.13 0.9 ± 0.19C 18:3 4.2 ± 0.06 4.6 ± 1.13 6.2 ± 0.14 1.9 ± 0.5C 18:4 1.1 ± 0.01 0.1 ± 0.88 1.7 ± 0.02 1.0 ± 0.07C 20:1 1.0 ± 0.01 10.2 ± 0.43 2.7 ± 0.05 –C 20:4 0.5 ± 0.01 2.7 ± 0.21 0.5 ± 0.01 0.7 ± 0.03C 20:5 6.1 ± 0.09 3.4 ± 0.25 4.5 ± 0.28 3.2 ± 0.73C 22:1 6.9 ± 0.1 0.1 ± 0.08 0.8 ± 0.05 1.3 ± 0.04C22:4 0.1 ± 0.03 1.0 ± 0.47 – –C 22:5 3.0 ± 0.04 5.9 ± 0.27 3.8 ± 0.05 7.5 ± 0.5C 22:6 8.4 ± 0.07 7.7 ± 0.29 14.8 ± 0.13 11.5 ± 0.01
of 6.9–7.2, 8.0–8.2, or 16.4–16.6 for Neutrase®, Flavourzyme orAlcalase®, respectively.
3.5. Fatty acid profile and positional distribution of fatty acids inNile Perch and salmon oils
Fatty acid profile of unhydrolysed oil and monoglyceride frac-tion obtained after hydrolysis with 1,3-specific lipase is shown inTable 2. Nile perch oil showed a higher content of saturated fattyacid (36.8 mol%) than salmon oil (19 mol%) (Table 2). This could bea temperature effect since Nile perch is a warm water fish whilesalmon is cold water. Uysal et al. [22] observed that in the muscleof Barbus plebejus esherichi saturated fatty acid content was signif-icantly higher in July (temperate conditions, 26 ◦C) than in January(cold conditions, 5 ◦C), while polyunsaturated fatty acid contentwas significantly higher in January than in July. A decrease of envi-ronmental temperature has been reported to lead to an increasedproportion of unsaturated fatty acids that are important on main-taining membrane fluidity [23].
Of the total palmitic acid, EPA and DHA present in the crudeoils, approximately 50, 13 and 48 mol% palmitic acid, EPA andDHA respectively, were in the sn-2 position in Nile perch TAG(Table 3). In salmon oil 17, 28 and 57 mol% palmitic acid, EPA andDHA respectively was in sn-2 position (Table 3). Lipase hydrol-ysis does not give the complete structure of the TAG molecule,but it offers reliable information about the sn-2 position. Turon etal. [7] reported a comparable distribution of 46, 25 and 57 mol%palmitic, EPA and DHA, respectively in sn-2 position of Nile perchTAG using chemical deacylation. Using high-resolution 13C nuclearmagnetic resonance spectroscopy, DHA has been reported to beconcentrated in sn-2 position of TAG, whereas EPA is randomlydistributed in all the three positions of Atlantic salmon TAG [24].1,3-specific lipases have been used to give an estimate compositionof sn-2 position in squid, menhaden fish oils, tuna triglycerides, fun-
Table 3Positional analysis of palmitic acid, EPA and DHA found at the sn-2 and sn-1 andsn-3 positions of the TAGs in Salmon and Nile perch heads oils.
Oil Position Palmitic acid EPA DHA
Salmon sn-2a 0.16 ± 0.03 0. 25 ± 0.04 0.59 ± 0.01sn-1 + 3b 0.84 ± 0.03 0.75 ± 0.04 0.41 ± 0.01
Nile perch sn-2a 0.51 ± 0.01 0.13 ± 0.02 0.50 ± 0.01sn-1 + 3b 0.49 ± 0.01 0.87 ± 0.02 0.50 ± 0.01
a mol% fatty acid in monoglyceride (sn 2-MAG)/3*mol% fatty acid in initial triglyc-eride.
b sn -1 + 3 = 1 − sn-2.
gal triglycerides, egg phospholipids, and pig brain phospholipids[15,16].
4. Conclusion
This work shows that improved oil yields from fish by-productscan be obtained by use of proteases with the added advantage of notrequiring pH adjustment or addition of water. Since the pH of theby-products is close to neutral, enzymes with optimum pH withinthis range could be used. Simultaneous release of soluble proteinsis another advantage. By-products of Nile perch processing are apotentially useful source of fish oil, which can be a source of eco-nomically useful omega-PUFAs. However, there is need to reducethe high concentration of saturated fatty acids, which constitute36 mol% of total fatty acids.
Acknowledgements
We thank Dr. Suhaila Hashim for valuable input in manuscriptpreparation. The project is part of the Swedish International Devel-opment Cooperation Agency (SIDA/SAREC) sponsored BIO-EARN(East African Regional Programme and Research Network forBiotechnology, Biosafety and Biotechnology Policy development)program.
References
[1] Ackman RG. Seafood lipids and fatty acids. Food Review International1990;6:617–46.
[2] Sargent JR, Bell JG, McGhee F, McEvoy J, Webster JL. The nutritional value of fish.In: Kestin SC, Warriss PD. (Eds.), Farmed Fish Quality, Bristol, UK; 2001;3–12.
[3] Uauy R, Valenzuela A. Marine oils: the health benefits of n-3 fatty acids. Nutri-tion 2000;16:680–4.
[4] Calder PC. Long-chain n-3 fatty acids and cardiovascular disease: further evi-dence and insights. Nutrition Research 2004;24:761–72.
[5] Sanders TAB.Proceedings of the Nutrition Society, Influence of fish-oil supple-ments on man, vol. 44. 1985. p. 391–7.
[6] Zenebe T, Ahlgren G, Boberg M. Fatty acid content of some freshwater fish ofcommercial importance from tropical lakes in the Ethiopian Rift Valley. Journalof Fish Biology 1998;53:987–1005.
[7] Turon F, Rwabwogo B, Barea B, Pina M, Graille J. Fatty acid composition of oilextracted from Nile perch (Lates niloticus) head. Journal of Food Compositionand Analysis 2005;18:717–22.
[8] Hara A, Radin NS. Lipid extraction of tissues with a low toxicity solvent. Ana-lytical Biochemistry 1978;90:420–6.
[9] Dunford NT, Temelli F, LeBlanc E. Supercritical CO2 extraction of oil and residualproteins from Atlantic mackerel (Scomber scombrus) as affected by moisturecontent. Journal of Food Science 1997;62:289–94.
[10] Chantachum S, Benjakul S, Sriwirat N. Separation and quality of fish oil fromprecooked and non-precooked tuna heads. Food Chemistry 2000;69:289–94.
[11] Linder M, Fanni J, Parmentier M. Proteolytic extraction of salmon oil and PUFAconcentration by lipases. Marine Biotechnology 2005;7:70–6.
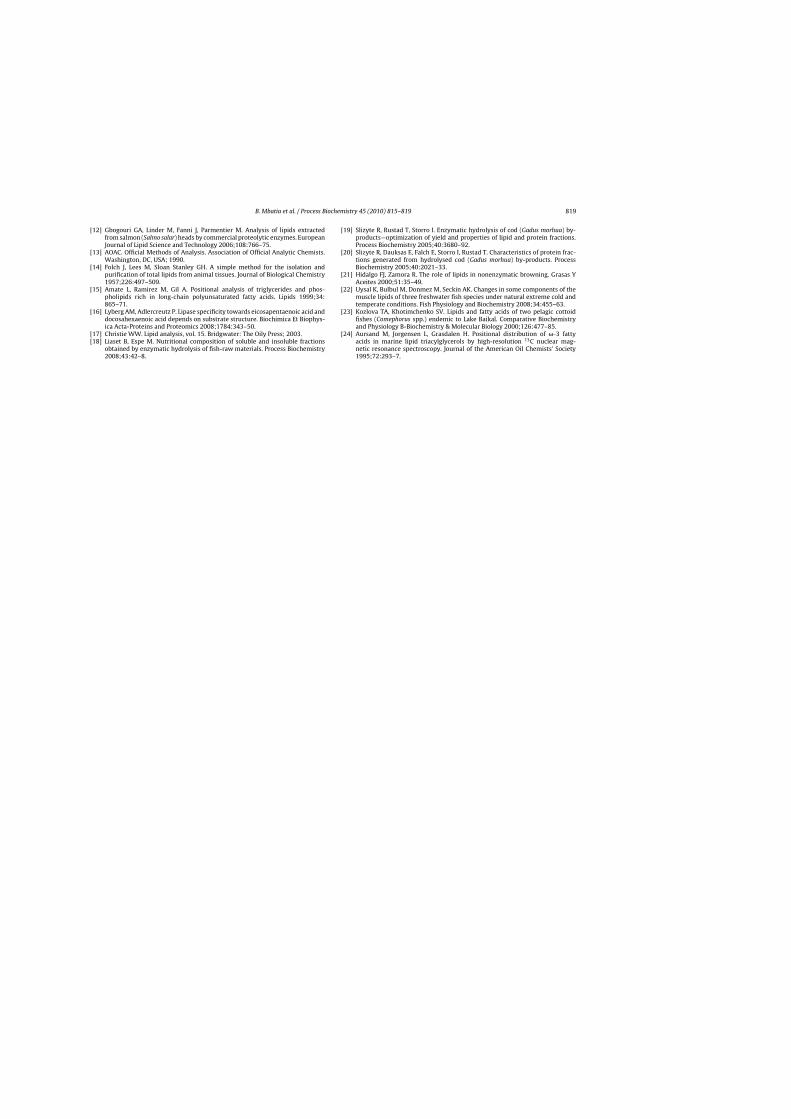
B. Mbatia et al. / Process Biochemistry 45 (2010) 815–819 819
[12] Gbogouri GA, Linder M, Fanni J, Parmentier M. Analysis of lipids extractedfrom salmon (Salmo salar) heads by commercial proteolytic enzymes. EuropeanJournal of Lipid Science and Technology 2006;108:766–75.
[13] AOAC. Official Methods of Analysis. Association of Official Analytic Chemists.Washington, DC, USA; 1990.
[14] Folch J, Lees M, Sloan Stanley GH. A simple method for the isolation andpurification of total lipids from animal tissues. Journal of Biological Chemistry1957;226:497–509.
[15] Amate L, Ramirez M, Gil A. Positional analysis of triglycerides and phos-pholipids rich in long-chain polyunsaturated fatty acids. Lipids 1999;34:865–71.
[16] Lyberg AM, Adlercreutz P. Lipase specificity towards eicosapentaenoic acid anddocosahexaenoic acid depends on substrate structure. Biochimica Et Biophys-ica Acta-Proteins and Proteomics 2008;1784:343–50.
[17] Christie WW. Lipid analysis, vol. 15. Bridgwater: The Oily Press; 2003.[18] Liaset B, Espe M. Nutritional composition of soluble and insoluble fractions
obtained by enzymatic hydrolysis of fish-raw materials. Process Biochemistry2008;43:42–8.
[19] Slizyte R, Rustad T, Storro I. Enzymatic hydrolysis of cod (Gadus morhua) by-products—optimization of yield and properties of lipid and protein fractions.Process Biochemistry 2005;40:3680–92.
[20] Slizyte R, Dauksas E, Falch E, Storro I, Rustad T. Characteristics of protein frac-tions generated from hydrolysed cod (Gadus morhua) by-products. ProcessBiochemistry 2005;40:2021–33.
[21] Hidalgo FJ, Zamora R. The role of lipids in nonenzymatic browning. Grasas YAceites 2000;51:35–49.
[22] Uysal K, Bulbul M, Donmez M, Seckin AK. Changes in some components of themuscle lipids of three freshwater fish species under natural extreme cold andtemperate conditions. Fish Physiology and Biochemistry 2008;34:455–63.
[23] Kozlova TA, Khotimchenko SV. Lipids and fatty acids of two pelagic cottoidfishes (Comephorus spp.) endemic to Lake Baikal. Comparative Biochemistryand Physiology B-Biochemistry & Molecular Biology 2000;126:477–85.
[24] Aursand M, Jorgensen L, Grasdalen H. Positional distribution of �-3 fattyacids in marine lipid triacylglycerols by high-resolution 13C nuclear mag-netic resonance spectroscopy. Journal of the American Oil Chemists’ Society1995;72:293–7.


Paper II


Research Article
Enzymatic enrichment of omega-3 polyunsaturated fattyacids in Nile perch (Lates niloticus) viscera oil
Betty Mbatia1,2, Patrick Adlercreutz1, Francis Mulaa2 and Bo Mattiasson1
1 Department of Biotechnology, Lund University, Lund, Sweden2 Department of Biochemistry, University of Nairobi, Nairobi, Kenya
Oil was extracted from fatty material obtained from Nile perch viscera using the protease Protex 30L.
Enrichment of eicosapentaenoic acid (EPA) and docosahexaenoic acid (DHA) in the glyceride fraction
was carried out by hydrolysis of extracted oils with lipases from Candida rugosa, Thermomyces lanuginosus
and Pseudomonas cepacia. The unusual fatty acid distribution of the oil influenced the apparent lipase
specificity to a large extent. In the unhydrolysed oil, only 16% of EPA was in sn-2 position while 51% of
palmitic acid was located in this position of the triacylglycerol (TAG) molecules. Non-regioselective
lipase from C. rugosa was the most effective in combined enrichment of both EPA and DHA. This was
partly because it was able to hydrolyse off palmitic acid from the sn-2 position, which 1-, 3-specific lipases
were unable to do. Hydrolysis with C. rugosa lipase enriched EPA from 3 to 6 mol% and DHA from 9 to
23 mol%, with recoveries of 42 and 55%, respectively. The 1-, 3-specific lipase from T. lanuginosus was
ineffective in enriching EPA, but gave best DHA enrichment, 38 mol% with a recovery of 39%. DHA
was rather equally distributed in sn-1, -2 and -3 positions of TAG. The results show that both the fatty
acid specificity and regiospecificity of the lipase as well as the fatty acid distribution of the oil should be
considered when choosing the strategy for fatty acid enrichment.
Keywords: DHA / EPA / Lipase-catalysed hydrolysis / Nile perch oil / Specificity constant
Received: January 12, 2010 / Revised: April 26, 2010 / Accepted: June 14, 2010
DOI: 10.1002/ejlt.201000009
1 Introduction
Nile perch (Lates niloticus) is a fatty fish from warm and fresh
water and is the most dominant species in Lake Victoria,
Eastern Africa. The bulk of by-products from Nile perch
processing are wasted or sold at very low prices [1, 2].
Better utilization of the by-products could be achieved by
recovering valuable products such as enzymes, vitamins,
proteins and fish oil. Viscera and heads from Nile perch have
the potential to be used as raw material for the production of
fish oil since they contain a large amount of lipids rich in v-3
polyunsaturated fatty acids (PUFA) [3, 4]. In addition, the oil
has a high content of natural antioxidants (b-carotene and
a-tocopherol) that are important in delaying PUFA
oxidation [3].
Omega-3 fatty acids, docosahexaenoic acid (DHA) and
eicosapentaenoic acid (EPA) are associated with several health
benefits [5–7] and consumption of appropriate amounts and
proportions of these fatty acids are essential. When fish oil is
suggested as a means of improving health, the content of
saturated fatty acid (SFA) and PUFA composition should
be considered and in some cases it is beneficial to concentrate
EPA and DHA further. A number of techniques have thus
been developed to prepare PUFA concentrates from fish oils,
devoid of more SFA. They include low temperature crystal-
lization, urea complexation, distillation, supercritical fluid
extraction, chromatography and enzymatic methods [8].
Enzymatic enrichment of PUFA has shown potential in
producing high quality product due to the mild conditions
(e.g. neutral pH and low temperatures) of the process [9].
Concentrates of both EPA and DHA may be prepared by
selective hydrolysis of fish oils using lipases which discrimi-
nate against v-3 PUFA such as lipases from Candida rugosa,
Pseudomonas sp.,Aspergillus niger andThermomyces lanuginosus
[10–13] or by selective esterification [14, 15].
Correspondence: Patrick Adlercreutz, Department of Biotechnology,
Lund University, P. O. Box 124, SE-22100 Lund, Sweden
E-mail: [email protected]
Fax: þ46-46-222-47-13
Abbreviations: DAGs, diglycerides; DHA, docosahexaenoic acid; DPA,
docosapentaenoic acid; EPA, eicosapentaenoic acid; FAME, fatty acid
methyl esters; MAGs, monoglycerides; MUFA, Monounsaturated fatty
acid; PUFA, polyunsaturated fatty acids; SFA, saturated fatty acid;
TAG, triacylglycerol
Eur. J. Lipid Sci. Technol. 2010, 112, 977–984 977
� 2010 WILEY-VCH Verlag GmbH & Co. KGaA, Weinheim www.ejlst.com

Use of lipases to enrichv-3 fatty acids inNile perch oil has
not been reported. In this study, preparation of v-3 PUFA
enriched acylglycerols from Nile perch viscera oil via enzy-
matic hydrolysis was evaluated using three commercial
lipases. Effect of temperature on v-3 PUFA enrichment
and lipase specificity has also been evaluated.
2 Materials and methods
2.1 Materials
Protex 30L (�2750 GSU/g) was a gift from Genencor, a
division of Danisco A/S Denmark. Lipases from
T. lanuginosus (�100 000 U/g), C. rugosa (�700 000 U/g)
and P. cepacia (Amano lipase PS, �30 000 U/g) were from
Sigma (St Louis, MO, USA). Qualmix fish S and methyl
tridecanoate were purchased from Larodan Fine Chemicals
AB (Malmo, Sweden). Silica gel 60 TLC plates were
obtained from Merck (Darmstadt, Germany). All solvents
and chemicals were of analytical grade.
2.2 Sampling and sample preparation
Fatty material obtained from Nile perch viscera was kindly
donated by W. E. Tilly Ltd, Nile perch processing factory in
Kenya and preserved at �208C until use.
2.3 Enzyme assisted oil extraction and determinationof fatty acid profile
Fatty material was defrosted at room temperature overnight.
Hydrolysis with Protex 30L was performed at 558C in a
stirred jacketed reactor as described by Mbatia et al. [16].
The substrate was preheated to 558C and enzymatic hydroly-
sis started by addition of Protex 30L, 0.05% v/w (wet weight
of substrate). The contents were flushed with nitrogen and
hydrolysis was allowed to proceed for 1 h with continuous
stirring. This was followed by centrifugation at 10 000 � g
for 10 min. The oil layer was decanted and preserved under
nitrogen atmosphere at �208C until further analysis.
In order to determine fatty acid profile of the extracted oil,
a sample was transesterified into fatty acid methyl esters
(FAME) using sodium methoxide [17, 18]. Methylation
procedure was as described by Lyberg and Adlercreutz [13].
2.4 Lipase catalysed hydrolysis of Nile perchviscera oil
Oil extracted (Section 2.3) was hydrolysed with lipases
from C. rugosa, P. cepacia and T. lanuginosus at 408C(1000 U/g substrate). In order to determine the effect of
temperature on enzymatic enrichment of EPA and DHA, a
second set of hydrolysis was performed with lipases from
C. rugosa and T. lanuginosus at 30, 40 and 508C. In each
reaction, 0.25 g of crude oil in 1.25 mL of 0.2 M sodium
phosphate buffer (pH 7.2) was hydrolysed with continuous
shaking at 500 rpm. A control experiment at 40 and 508Cwas performed without enzyme addition. To minimize oxi-
dation, the vials were bubbled with nitrogen prior to shaking.
Samples were withdrawn after 0, 1, 2, 4, 6, 12 and 24 h
and diluted with 3 mL THF. Fatty acid composition of the
hydrolysed lipids was determined by TLC and GC.
2.5 Thin layer chromatography
Triglycerides (TAGs), diglycerides (DAGs), monoglycerides
(MAGs) and free fatty acids (FFAs) from lipase hydrolysed
oil samples were separated on silica gel 60 TLC plates using
the mobile phase cyclohexane/diethyl ether/acetic acid
(50:50:1). In order to visualize the lipids and fatty acids in
UV light (366 nm), the TLC plates were sprayed with 0.2%
2, 7-dichlorofluorescein in 99.5% ethanol. The bands con-
taining TAGs (Rf ¼ 0.74), DAGs (Rf ¼ 0.41) and MAGs
(Rf ¼ 0.12) were scraped off and each fraction methylated as
described by Lyberg and Adlercreutz [13] and analysed
using GC.
2.6 Gas chromatography analysis
Fatty acid analysis was carried out using a Varian 3400 GC
system equipped with a flame ionization detector (FID).
Supelcowax 10 capillary column (60 m � 0.32 mm �25 mm film thickness; Supelco, Bellefonte, PA, USA) was
used to separate FAME. The carrier gas was helium at
1.79 � 10�1 MPa. The temperature programme for separ-
ation was as follows: initial temperature of 508C was held for
5 min, increased to 220 at 258C/min and held for 21 min.
The temperature was then increased to 2408C at 158C/min
and held for 10 min. The injector temperature was main-
tained at 608C for 0.1 min, and was then increased to 2508Cat 608C/min and held for 2 min. The detector temperature
was kept constant at 2508C.
The instrument was calibrated with a one-point cali-
bration method, using a standard mixture of fish oil
FAME of known proportions (Qualmix fish S). The response
factors of the different FAME were obtained from analysis of
the standard mixture and were used to calculate the relative
amounts of different fatty acids in a sample based on mol%.
These data were compared with the internal standard (methyl
tridecanoate) to determine the absolute amount (mmol) of
the fatty acids in the sample. GC data provided are based on
duplicate measurements.
2.7 The positional fatty acid composition
The positional fatty acid composition of the TAG was deter-
mined from fatty acid composition of the MAG fraction
generated in the reaction catalysed by T. lanuginosus lipase
at 30 and 408C.MAG obtained after 1 h of hydrolysis at each
temperature was used to calculate the fatty acid composition
978 B. Mbatia et al. Eur. J. Lipid Sci. Technol. 2010, 112, 977–984
� 2010 WILEY-VCH Verlag GmbH & Co. KGaA, Weinheim www.ejlst.com

of MAG (mol%). These data together with the fatty acid
composition of the initial TAG in unhydrolysed oil were used
to calculate the fraction of x (myristic acid, palmitic acid,
EPA, DHA or docosapentaenoic acid (DPA)) at the sn-2 and
sn-1 þ 3 position of TAG according to Eqs. (1) and (2)
Fractionx sn�2 ¼MAGx
3�TAGx
(1)
Fractionx sn�1þ3 ¼ 1� Fractionx sn�2 (2)
2.8 Lipase specificity at different temperatures
The specificity of lipases from T. lanuginosus and C. rugosa
towards C16:1, C18:0, C18:1, EPA and DHA at the three
temperatures was determined by calculating competitive fac-
tor, a defined by Eq. (3) [19, 20]. A log–log plot of Eq. (3)
yields a linear curve with the slope equal to a value of the
opposing substrate (B). From the a value, the specificity
constant was calculated as 1/a with palmitic acid as reference
substrate and its specificity constant taken as 1.00
a¼ logðA0=AÞlogðB0=BÞ
(3)
where A0 is the initial Palmitic acid concentration , A the
Palmitic acid concentration at time t, B0 the initial C16:1,
C18:0, C18:1, EPA/DHA concentration and B is C16:1,
C18:0, C18:1, EPA/DHA concentration at time t.
Two sets of competitive factors were calculated for
T. lanuginosus lipase since it expresses regioselectivity. In
the first case the competitive factors were calculated without
taking into account the positional distribution of fatty acids
and fatty acids in sn-1, -2 and -3 were considered as sub-
strates. In the second case, only fatty acids in position sn-1
and sn-3 positions were considered as substrates. These were
calculated as outlined below:
Initial amount of fatty acid ðxÞ at sn� 1;
� 3TAG¼moles x � Fractionx sn�1þ3 (4)
Initial amount of fatty acid ðxÞ at sn�2¼moles of x
� Fractionx sn�2 (5)
Amount of fatty acid ðxÞ at sn� 1;�3 at time t¼moles of xt
� initialmoles of x at sn�2 ð6Þ
3 Results and discussion
3.1 Fatty acid profile in Nile perch viscera oil
Fatty acid composition of crudeNile perch viscera oil (mol%)
is shown in Table 1. The SFA fraction was higher (36 mol%)
than the PUFA fraction (27 mol%) with a ratio of PUFA to
SFA of 0.73. Palmitic acid was the predominant fatty acid
accounting for 23 mol%. Total v-3 PUFAs (linolenic acid,
EPA, DPA and DHA) accounted for 76% of the PUFA
fraction. Monounsaturated fatty acid (MUFA) accounted
for 37 mol% of total fatty acids. Ogwok et al. [3] reported
a similar profile using oil extracted from belly flaps of Nile
perch by cooking method. A PUFA/SFA ratio of 0.68–0.74
was reported in oil obtained from Nile perch of different size
categories. Oil extracted from Nile perch head showed a
similar profile with PUFA/SFA ratio of 0.55 [4].
The SFA andMUFA content in Nile perch oils are higher
than in menheden fish oil, while the v-PUFA contents and
PUFA/SFA ratio is lower. Menhaden oil has been proposed
byUSFDA [21] as PUFA supplement withv-PUFA,MUFA
and SFA fractions of 28.9, 19.4 and 20.2%, respectively, and
a PUFA/SFA ratio of 2.87 [13, 22]. The high content of SFA,
MUFA and low PUFA to SFA ratio in Nile perch oils
indicates a need to concentrate PUFA prior to human con-
sumption. Consumption of Nile perch PUFA concentrates
may be more effective than the crude oil itself because the
concentrates would contain less SFA thus allowing daily
intake of total lipids to remain low.
The positional distribution of fatty acids in Nile perch
viscera oil is shown in Tables 1 and 2. SFAs, palmitic acid
(51%) and myristic acid (58%) were located in sn-2 position
while EPA was mainly in sn-1 and sn-3 positions. DHA and
DPAwere equally distributed in the three positions. A similar
distribution was found in oil extracted from Nile perch heads
[4]. Myristic and palmitic acids were high in sn-2 position
while unsaturated fatty acids were preferentially esterified in
sn-1 and sn-3 positions [4].
Table 1. Fatty acid composition and distribution (sn-2 position) of oil
from Nile perch viscera oil
Fatty acid
Fatty acid
profile (mol%)
Fatty acid distribution (mol%)
sn-2 positiona)
C14:0 3.4 � 0.3 5.5 � 0.90
C15:0 0.5 � 0.01 0.7 � 0.03
C16:0 23.4 � 0.1 35.3 � 1.31
C16:1 12.7 � 0.1 12.7 � 1.23
C18:0 8.9 � 0.01 5.3 � 0.57
C18:1 23.7 � 0.4 14.7 � 1.87
C18:2 2.2 � 0.1 2.2 � 0.88
C18:3 2.3 � 0.1 1.8 � 0.17
C18:4 0.4 � 0.03 0.0 � 0.00
C20.1 0.6 � 0.1 0.0 � 0.00
C20:4 2.4 � 0.1 1.9 � 0.45
C20.5 3.0 � 0.7 1.8 � 0.14
C22:4 1.1 � 0.4 1.2 � 0.16
C22:5 6.2 � 0.4 5.9 � 0.75
C22:6 9.0 � 0.5 10.8 � 0.38
a) Fatty acid composition (mol%) in MAG fraction obtained after
1 h hydrolysis of TAG with T. lanuginosus at 308C.
Eur. J. Lipid Sci. Technol. 2010, 112, 977–984 Enzymatic enrichment of v-3 polyunsaturated fatty acids 979
� 2010 WILEY-VCH Verlag GmbH & Co. KGaA, Weinheim www.ejlst.com

3.2 Fatty acid profiles after lipase hydrolysis
The three lipases used in this study caused changes in fatty
acid composition, but in varying amounts. Ideally, enzymatic
hydrolysis of fish oils followed by FFA removal will increase
the concentration of PUFA while reducing SFAs and
MUFAs. Figure 1a and b shows the changes in DHA,
EPA, palmitic acid (C16:0) and oleic acid (C18:1) content
in the glyceride fraction upon lipase hydrolysis. Among the
lipases tested, 24 h hydrolysis with lipase from C. rugosa
gave a better enrichment of combined DHA and EPA in
the glyceride fraction than lipases from P. cepacia and
T. lanuginosus (Fig. 1a). It also resulted in the highest decline
of oleic acid after 24 h of hydrolysis (Fig. 1b). DHA and EPA
contents were increased to 20 and 6 mol%, respectively,
while oleic acid decreased to 14 mol%. Lipase from
T. lanuginosus was the most efficient in enriching DHA
(32 mol%). However, it was ineffective in enriching EPA
(Fig. 1a). It also resulted in the least decline in palmitic acid
(Fig. 1b). Lipase from P. cepacia increased DHA the least
(14 mol%) while EPA was increased to 7 mol% (Fig. 1a). It
also resulted in the highest decline of palmitic acid (Fig. 1b).
The ability of C. rugosa lipase to enrich both DHA and
EPA indicates ability of the lipase to discriminate SFAs and
MUFAs from EPA and DHA in fish oils, most likely due to
the reduced steric hinderance observed with SFAs and
MUFAs [23]. In addition, C. rugosa lipase is non-regiospe-
cific and catalyse hydrolysis of fatty acids at all positions in the
TAGs [24, 25]. The lipase has been reported to be the most
efficient in enriching combined v-3 PUFA in marine oils
[12, 26, 27]. Non-regiospecific lipase from P. cepacia gave
a slightly better enrichment of EPA (7.0 mol%) compared to
lipase from C. rugosa (6 mol%) although it increased DHA to
14 mol% compared to 20 mol% obtained with C. rugosa
lipase. This was not surprising since lipases from
Pseudomonas species (P. cepacia and P. fluorescens) have been
reported to discriminate EPA more than DHA, resulting in
an efficient increase in concentration of EPA in the acylgly-
cerol form of fish oil [12, 13, 28]. Chromobacterium viscosum
lipase is another lipase that has been reported to discriminate
against EPA more than DHA [20].
Enrichment profile observed while using lipase from
T. lanuginosus was probably influenced by its sn-1 and sn-3
position specificity. In the oil used in this study, EPA was
mainly in sn-1 and sn-3 positions while 51% palmitic acid was
in sn-2 position (Table 2). This was probably part of the
reason why T. lanuginosus lipase was ineffective in enriching
EPA and also hydrolysed palmitic acid least when compared
to the other lipases. In the absence of lipases, there was
minimal change in mol% EPA and DHA during the 24 h
incubation (data not shown). This indicated that there was
minimal oxidation of PUFA during the hydrolysis.
3.3 Competitive factors
Competitive factors for lipases from C. rugosa and
T. lanuginosus with respect to C16:1, C18:0, C18:1, EPA
and DHA were determined according to Eq. (3). Palmitic
acid was chosen as a reference since it provided the highest
concentration in the TAGs. Lipase specificity for a certain
fatty acid was expressed as 1/a.
Table 2. Distribution of Palmitic acid, myristic acid, EPA, DPA and DHA in different positions of TAG in Nile perch viscera oil
Position C16:0 C14:0 EPA DPA DHA
sn-2a) 0.51 � 0.014 0.58 � 0.049 0.16 � 0.057 0.37 � 0.071 0.39 � 0.021
sn-1 þ 3 0.49 � 0.014 0.42 � 0.049 0.84 � 0.057 0.63 � 0.071 0.61 � 0.021
Each value represents an average value of three independent experiments at 30 and 408C and their SD.a) Mol% fatty acid in monoglyceride (2-MAG)/3 � mol% fatty acid in initial TAG.
Figure 1. (a) Changes in DHA and EPA mol% in Nile perch viscera
oil following hydrolysis at 408C. ^, &, ~ mol% DHA and X, ^,
~ mol% EPA, after hydrolysis with C. rugosa, P. cepacia and
T. lanuginosus lipases. (b) Changes in palmitic and oleic acid
mol% in Nile perch viscera oil following hydrolysis at 408C. ^, &,
~mol% palmitic and X,^,~mol% oleic acid, after hydrolysis with
C. rugosa, P. cepacia and T. lanuginosus lipases.
980 B. Mbatia et al. Eur. J. Lipid Sci. Technol. 2010, 112, 977–984
� 2010 WILEY-VCH Verlag GmbH & Co. KGaA, Weinheim www.ejlst.com

3.3.1 C. rugosa lipase specificity towards fatty acidsin Nile perch oil at different temperatures
The specificity constants for C. rugosa lipase towards C16:1,
C18:0, C18:1, EPA and DHA in crude Nile perch viscera oil
at different temperatures are presented in Fig. 2. Ability of the
non-regiospecific lipase from C .rugosa to enrich both DHA
and EPA in the glyceride fraction was in agreement with
specificity constants (1/a values) obtained. The lipase showed
lower specificity to DHA and EPA compared to other fatty
acids with DHA having the lowest specificity (Fig. 2). The
lipase also showed a slightly higher preference for palmitoleic
and oleic acid than palmitic acid. Haraldsson and coworkers
[28], reported distinct discrimination of v-3 PUFA for SFAs
and MUFAs by C. rugosa lipase while considering hydrolysis
of sardine oil ethyl esters, palmitic acid being the best sub-
strate. The long chain PUFAs were also poorer substrates
with the lipase displaying higher activity towards EPA than
DHA [28].The lipase has been reported to have a strong
discrimination against unsaturated fatty acids having the first
double bond from the carboxyl end at an even number carbon
such as (cis-4, such as DHA; and cis-6) than the others (cis-5,
such as EPA; and cis-9) [20, 29].
Many factors such as regiospecificity, stereospecificity
and structural specificity affect lipase specificity when con-
sidering hydrolysis of natural TAGs which have various fatty
acids compositions and distribution within the glycerol back-
bone [25, 30, 31]. C. rugosa lipase preference for palmetoleic
acid and oleic acid over palmitic acid observed in this study
was not unusual. Lyberg and Adlercreutz [13] made a similar
observation while hydrolysing oil from menhaden fish.
3.3.2 T. lanuginosus lipase specificity towards fattyacids in Nile perch oil at different temperatures
The specificity constants for T. lanuginosus lipase towards
C16:1, C18:0, C18:1, EPA and DHA in crude Nile perch
viscera oil at different temperatures are presented in Figs. 3
and 4. The 1/atot values in Fig. 4 indicate that the lipase
discriminates strongly against DHA in the oil, while discrimi-
nation against EPA seems quite low. The observed
discrimination is partly caused by the fatty acid selectivity
of the lipase. However, since this lipase is 1-, 3-specific, the
distribution of fatty acids in the oil also influences the appa-
rent discrimination. To obtain information on the true fatty
acid specificity of the lipase, only fatty acids in the sn-1 and sn-
3 positions of the TAG molecules should be considered as
accessible substrate. When calculations are based on this, 1/
a1þ3 values are obtained (Fig. 4). For EPA, the 1/a1þ3 value
was about two times lower than 1/atot, because EPA was
mainly present in the sn-1 and sn-3 positions while the refer-
ence, palmitic acid to a large extent was present in the sn-2
position (Table 2). This means that the enzyme discriminates
against EPA, but this is compensated for by the uneven fatty
acid distribution, which makes the apparent discrimination
(shown as 1/atot) low. Similar effects were seen for C18:0 and
C18:1. The 1/a1þ3 value for DHA were slightly higher than
those of EPA at all the temperatures indicating higher dis-
crimination of DHA. In addition to being regiospecific, lipase
stereoselectivity has been reported [23, 30]. Lipase from
T. lanuginosus has been reported to be more active at sn-1
position than at sn-3 position [23] which might have con-
tributed to the results in the present study.
Previously, T. lanuginosus lipase has been reported to
enrich EPA and DHA in menhaden fish oil [13]. The oil
has a higher percentage of DHA in sn-2 position while EPA is
equally distributed in sn-2 and sn-3 position and small
amounts are in sn-1 position [13, 32]. A 1-, 3-specific
Rhizopus oryzae lipase has been reported to enrich DHA in
Figure 2. Specificity of C. rugosa lipase to fatty acids in Nile perch
viscera oil at different temperatures.
Figure 3. Specificity of T. lanuginosus lipase at different tempera-
tures to fatty acids in sn-1, -2 and -3 positions of oil extracted from
Nile perch viscera.
Figure 4. Specificity of T. lanuginosus lipase at different tempera-
tures to fatty acids in sn-1 and sn-3 positions of oil extracted from
Nile perch viscera.
Eur. J. Lipid Sci. Technol. 2010, 112, 977–984 Enzymatic enrichment of v-3 polyunsaturated fatty acids 981
� 2010 WILEY-VCH Verlag GmbH & Co. KGaA, Weinheim www.ejlst.com

seal oil but was ineffective in enriching EPA [32]. Seal oil has
v-3 PUFA located mainly in sn-1 and sn-3 positions of the
TAGs with DHAmainly in sn-3 position and EPA random in
sn-1 and sn-3 positions [32, 33]. These results indicate that
positional distribution of PUFAs in TAGs influences there
enrichment while using regiospecific lipases.
3.4 Effect of temperature on enrichment of EPA andDHA
Temperature can affect the reaction rate of lipases and thus
enrichment levels. Figure 5a and b shows the effect of
temperature on enrichment of EPA and DHA using
C. rugosa lipase. Higher enrichment levels were associated
with more EPA and DHA losses. At 30 and 408C increment
of DHA appeared similar for the first 6 h of hydrolysis.
However, between 12 and 24 h of hydrolysis, a better
DHA enrichment to 17 and 23 mol%, respectively, was
attained at 308C compared to 14 and 18 mol% at 408C.
After 24 h of hydrolysis at 30 and 408CDHA recoveries were
55 and 75%, respectively. EPA levels increased to 6 mol%
after 24 h hydrolysis at 308Cwith a recovery of 42%. At 508Conly a slight increment of DHA to 13 mol% and EPA to
4 mol% was observed. A study by Sun et al. [27] showed that
lipase from C. rugosa increased the EPA and DHA
concentrations in salmon oil at 20, 35, and 508C with
358C being the optimum temperature. Inefficiency of
C. rugosa lipase to enrich EPA and DHA at elevated tem-
peratures could be due to the enzyme inactivation. C. rugosa
lipase with an optimum activity at 408C has been shown to
maintain 20 and 10% of its original activity after 1 h incu-
bation with 0.1 M sodium phosphate buffer, pH 7.5 at 40
and 508C, respectively [34].
Hydrolysis with lipase from T. lanuginosus was effective in
enriching DHA at the three temperatures (Fig. 6). However,
EPA was not enriched at all temperatures (data not shown).
During the first 4 h of hydrolysis, DHA increment appeared
similar at the three temperatures. However after 12 and 24 h
of hydrolysis, the enzyme appeared to perform better at 40
and 508Cwith best DHA enrichment being achieved at 508C.
At 508C DHA increased to 29 and 38 mol% at 12 and 24 h
with recovery values of 45 and 39%, respectively, which
shows that the lipase was still active at 508C. A study by
Zhu et al. [35] revealed that activity of wild typeT. lanuginosus
lipase and its mutantW89L increased with temperature up to
608C then decreased upon further heating. Omar et al. [36]
reported a similar finding with thermostable lipase from
T. lanuginosus N0.3. The enzyme maintained 100% of its
original activity for 24 h at 458C, 20 h at 608Cand 1 h at 658C.
Increase in temperature is associated with increased non-
enzymatic acyl migration. This would not be preferred during
enzymatic enrichment of fish oils with v-3 PUFA located
mainly in sn-2 position if a 1-, 3-specific lipase is used.
However, in Nile perch oil acyl migration of palmitic acid
from sn-2 to sn-1(3) position could have resulted in the rapid
increase in enrichment levels from 6 to 24 h at 40 and 508C.
Palmitic acid was the predominant fatty acid in this oil with
51% located in sn-2 position (Tables 1 and 2). Omar et al.
[36] detected 1, 3 DAG after prolonged incubation of triolein
with T. lanuginosus lipase (458C, 24 h), when in essence
prolonged hydrolysis with 1-, 3-specific T. lanuginosus is
expected to yield 2-MAG and 1(3), 2 DAG.
Change in temperature did not significantly affect sub-
strate specificity forC. rugosa and T. lanuginosus lipases in this
Figure 5. (a) Mol% DHA in the glyceride fraction
(TAG þ DAG þ MAG) and recovery of DHA in this fraction as a
function of time during hydrolysis of Nile perch viscera oil catalysed
by lipase fromC. rugosa.^ 30,~ 40 and& 508CDHAmol%.^ 30,
~ 40 and & 508C % DHA recovery. (b) Mol% EPA in the glyceride
fraction (TAG þ DAG þ MAG) and recovery of EPA in this fraction
as a function of time during hydrolysis of Nile perch Viscera oil
catalysed by lipase from C. rugosa ^ 30, ~ 40 and & 508CEPA mol%. ^ 30, ~ 40 and & 508C% EPA recovery.
Figure 6. Mol% DHA in the glyceride fraction
(TAG þ DAG þ MAG) and recovery of DHA in this fraction as a
function of time during hydrolysis of Nile perch Viscera oil catalysed
by lipase from T. lanuginosus ^ 30, ~ 40 and & 508C DHA mol%.
^ 30, ~ 40 and & 508C % DHA recovery.
982 B. Mbatia et al. Eur. J. Lipid Sci. Technol. 2010, 112, 977–984
� 2010 WILEY-VCH Verlag GmbH & Co. KGaA, Weinheim www.ejlst.com

study (Figs. 2–4). Lipase from C. rugosa showed low selec-
tivity towards EPA andDHA as compared to other fatty acids
with DHA having lowest selectivity at all temperatures.
Similary, lipase from T. lanuginosus showed lowest selectivity
towards DHA. Increase in temperature increases rate of
reaction as long as the enzyme is stable. Higher temperature
can also reduce the viscosity as well as improve the diffusion
of substrate to the active site. Since competitive factors are a
ratio of specificity constants (Kcat/Km), they are often not
affected by variations of individual reaction rates. A study of
multi-competitive enzymatic reactions in organic media
showed that changes in physiochemical conditions of the
reaction, e.g. temperature, water content and substrate con-
centration did not significantly affect lipase specificity [19].
4 Conclusion
Lipase-catalysed hydrolysis of Nile perch viscera oil was
demonstrated to be a feasible method for enrichment of
Nile perch n-3 PUFA. This method offers a potential
advantage for value addition of by-products from fish indus-
tries in Eastern Africa. Choice of lipase when performing
hydrolysis of marine oils depends on the desired DHA and
EPA enrichment and recovery levels. The ratio of DHA to
EPA in the final product is also important. In the current
study, T. lanuginosus lipase gave better DHA enrichment than
C. rugosa lipase but showed low DHA recoveries and was
ineffective in EPA enrichment. Lipase from C. rugosa could
thus be better in catalysing hydrolysis of Nile perch viscera oil
for enrichment of both DHA and EPA in acylglycerols.
C. rugosa lipase has previously been recommended to be
the enzyme of choice for preparation of v-PUFA in the
acylgycerol form in marine oils. On the other hand
T. lanuginosus lipase would be the enzyme of choice if a high
ratio of DHA to EPA is desired. For purposes of industrial
application, lipases may be the most expensive part of the
process and thus feasibility of using immobilized lipases
needs to be investigated.
This project was part of the Swedish International Development
Cooperation Agency (SIDA/SAREC) sponsored BIO-EARN
(East African Regional Programme and Research Network for
Biotechnology, Biosafety and Biotechnology Policy development)
programme.
The authors have declared no conflict of interest.
References
[1] MAAIF, Ministry of agriculture, animal industry and fish-eries. Fisheries department annual report. Entebbe,Government of Uganda 2006.
[2] Gumisiriza, R., Mshandete, A. M., Rubindamayugi, M. S.T., Kansiime, F., Kivaisi, A. K., Enhancement of anaerobic
digestion of Nile perch fish processing wastewater. Afr. J.Biotechnol. 2009, 8, 328–333.
[3] Ogwok, P., Muyonga, J. H., Sserunjogi, M. L., Fatty acidprofile and stability of oil from the belly flaps of Nile perch(Lates niloticus). Food Chem. 2008, 108, 103–109.
[4] Turon, F., Rwabwogo, B., Barea, B., Pina, M., Graille, J.,Fatty acid composition of oil extracted fromNile perch (Latesniloticus) head. J. Food Compos. Anal. 2005, 18, 717–722.
[5] Tapiero, H., Nguyen Ba, G., Couvreur, P., Tew, K. D.,Polyunsaturated fatty acids (PUFA) and eicosanoids inhuman health and pathologies. Biomed. Pharmacother.2002, 56, 215–222.
[6] Kinsella, J. E., Food component with potential benefits: Then-3 polyunsaturated fatty acids in fish oils. Food Technol.1986, 40, 89–97.
[7] Horrocks, L. A., Yeo, Y. K., Health benefits of docosahex-aenoic acid (DHA), Pharmacol. Res. 1999, 40, 211–225.
[8] Shahidi, F., Wanasundara, U. N., Omega-3 fatty acid con-centrates: Nutritional aspects and production technologies.Trends Food Sci. Technol. 1998, 9, 230–240.
[9] Breivik, H., Haraldsson, G. G., Kristinsson, B., Preparationof highly purified concentrates of eicosapentaenoic acid anddocosahexaenoic acid. J. Am. Oil Chem. Soc. 1997, 74, 1425–1429.
[10] Hoshino, T., Yamane, T., Shimizu, S., Selective hydrolysisof fish oil by lipase to concentrate n-3 polyunsaturated fattyacids. Agric. Biol. Chem. 1990, 54, 1459–1467.
[11] de Carvalho, P. O., Campos, P. R. B., Noffs, M. D.,Fregolente, P. B. L., Fregolente, L. V., Enzymatic hydrolysisof salmon oil by native lipases: Optimization of processparameters. J. Braz. Chem. Soc. 2009, 20, 117–124.
[12] Wanasundara, U. N., Shahidi, F., Lipase-assisted concen-tration of n-3 polyunsaturated fatty acids in acylglycerolsfrom marine oils. J. Am. Oil Chem. Soc. 1998, 75, 945–951.
[13] Lyberg, A. M., Adlercreutz, P., Lipase specificity towardseicosapentaenoic acid and docosahexaenoic acid depends onsubstrate structure. Biochim. Biophys. Acta 2008, 1784, 343–350.
[14] Hills, M. J., Kiewitt, I., Mukherjee, K. D., Enzymic frac-tionation of fatty acids: Enrichment of gamma-linolenic acidand docosahexaenoic acid by selective esterification catalyzedby lipases. J. Am. Oil Chem. Soc. 1990, 67, 561–564.
[15] Shimada, Y., Sugihara, A., Nakano, H., Kuramoto, T., et al.,Purification of Docosahexaenoic Acid by SelectiveEsterification of Fatty Acids from Tuna Oil with Rhizopusdelemar Lipase. J. Am. Oil Chem. Soc. 1997, 74, 97–101.
[16] Mbatia, B., Adlercreutz, D., Adlercreutz, P., Mahadhy, A.,et al., Enzymatic oil extraction and positional analysis of v-3fatty acids in Nile perch and salmon heads. Process Biochem.2010, 45, 815–819.
[17] Christie, W. W., Lipid Analysis, The Oily Press, Bridgwater,UK 2003.
[18] Svensson, I., Adlercreutz, P., Mattiasson, B., Lipase-cata-lyzed transesterification of phosphatidylcholine at controlledwater activity. J. Am. Oil Chem. Soc. 1992, 69, 986–991.
[19] Rangheard, M. S., Langrand, G., Triantaphylides, C.,Baratti, J., Multi-competitive enzymic reactions in organicmedia: A simple test for the determination of lipase fatty acidspecificity. Biochim. Biophys. Acta 1989, 1004, 20–28.
Eur. J. Lipid Sci. Technol. 2010, 112, 977–984 Enzymatic enrichment of v-3 polyunsaturated fatty acids 983
� 2010 WILEY-VCH Verlag GmbH & Co. KGaA, Weinheim www.ejlst.com

[20] Mukherjee, K. D., Kiewitt, I., Hills, M. J., Substrate specif-icities of lipases in view of kinetic resolution of unsaturatedfatty acids. Appl. Microbiol. Biotechnol. 1993, 40, 489–493.
[21] FDA. Food and Drug Administration. Food labelling:Requirements for nutrient content claims, health claims,and statements of nutritional support for dietary supple-ments. Fed. Regist. – Rules Regul. 1997, 62, 49859–49868.
[22] Osman,H., Suriah, A. R., Law, E. C., Fatty acid compositionand cholesterol content of selected marine fish in Malaysianwaters. Food Chem. 2001, 73, 55–60.
[23] Gamez-Meza, N., Noriega-Rodriguez, J., Medina-Juarez,L. A., Ortega-Garcia, J., et al., Concentration of eicosapentae-noic acid and docosahexaenoic acid from fish oil by hydrolysisand urea complexation. Food Res. Int. 2003, 36, 721–727.
[24] Rogaska, E., Cudrey, C., Ferrato, F., Verger, R.,Stereoselective hydrolysis of triglycerides by animal andmicrobial liapses. Chirality 1993, 5, 24–30.
[25] Benzonana, G., Esposito, S., Positional and chain specific-ities of Candida cylindracea lipase. Biochim. Biophys. Acta1971, 231, 15–22.
[26] Tomoko, O., Morrissey, M. T., Production of n-3 polyunsa-turated fatty acid concentrate from sardine oil by lipase-catalyzed hydrolysis. Food Chem. 2007, 103, 1411–1419.
[27] Sun, T., Pigott, G. M., Herwing, R. P., Lipase-assistedconcentration of n-3 polyunsaturated fatty acids from visceraof farmed Atlantic salmon (Salmo salar L.). J. Food Sci. 2002,67, 130–136.
[28] Halldorsson, A., Kristinsson, B., Haraldsson, G. G., Lipaseselectivity toward fatty acids commonly found in fish oil. Eur.J. Lipid Sci. Technol. 2004, 106, 79–87.
[29] Jachmanian, I., Schulte, E., Mukherjee, K. D., Substrateselectivity in esterification of less common fatty acids cata-lyzed by lipases from different sources. Appl. Microbiol.Biotechnol. 1996, 44, 563–567.
[30] Tanaka, Y., Funada, T., Hirano, J., Hashizume, R.,Triglyceride specificity of Candida cylindracea lipase: Effectof docosahexaenoic acid on resistance of triglyceride tolipase. J. Am. Oil Chem. Soc. 1993, 70, 1031–1034.
[31] Rogalska, E., Ransac, S., Verger, R., Stereoselectivity oflipases: Stereoselective hydrolysis of Triglycerides by gastricand pancreatic lipases. J. Biol. Chem. 1990, 265, 20271–20276.
[32] Wanasundara, U. N., Shahidi, F., Positional distribution offatty acids in triacylglycerols of seal blubber oil. J. FoodLipids. 1997, 51–64.
[33] Aursand, M., Jorgensen, L., Grasdalen, H., Positional distri-bution of v-3 fatty acids in marine lipid triacylglycerols byhigh-resolution 13C nuclear magnetic resonance spec-troscopy. J. Am. Oil Chem. Soc. 1995, 72, 293–297.
[34] Soares, C. M. F., DE Castro, H. F., DE Moraes, F. F.,Zanin, G. M., Characterization and Utilization of Candidarugosa Lipase Immobilized on Controlled Pore Silica. Appl.Biochem. Biotech. 1999, 79, 745–757.
[35] Zhu, K., Jutila, A., Tuominen, E. K. J., Patkar, S. A., et al.,Impact of the tryptophan residues of Humicola lanuginosalipase on its thermal stability. J. Biochim. Biophys. Acta2001, 1547, 329–338.
[36] Omar, C., Hayashi, M., Nagai, S., Purification and someproperties of a thermostable lipase from Humicola lanuginosano. 3. Agric. Biol. Chem. 1987, 51, 37–45.
984 B. Mbatia et al. Eur. J. Lipid Sci. Technol. 2010, 112, 977–984
� 2010 WILEY-VCH Verlag GmbH & Co. KGaA, Weinheim www.ejlst.com

Correction
Eur. J. Lipid Sci. Technol. 2010, 112, 977–984
Correction to: Enzymatic enrichment of omega-3 pol-
yunsaturated fatty acids in Nile perch (Lates niloti-
cus) viscera oil
Betty Mbatia, Patrick Adlercreutz, Francis Mulaa, Bo
Mattiasson
Corrected Figure 4 provided by the Authors appears
below:
Eur. J. Lipid Sci. Technol. 2011, 113, 275 Correction 275
� 2011 WILEY-VCH Verlag GmbH & Co. KGaA, Weinheim www.ejlst.com


Paper III


1
Strategies for the enzymatic enrichment of polyunsaturated fatty acids
from fish oil
Betty Mbatiaa, b, Bo Mattiassona, Francis Mulaab, Patrick Adlercreutza* a Department of Biotechnology, Lund University, Box 124, SE-221 00 Lund, Sweden b Department of Biochemistry, University of Nairobi, P.O. Box 30197, 00100 Nairobi, Kenya *Corresponding author. Tel.: +46462224842; fax: +46462224713 E-mail address: [email protected]
Abstract.
Polyunsaturated fatty acids (PUFA) from oil extracted from Nile perch viscera were
enriched by selective enzymatic esterification of the free fatty acids (FFA) or by
hydrolysis of ethyl esters of the fatty acids from the oil (FA-EE). Quantitative
analysis was performed using reverse phase high performance liquid
chromatography coupled to an evaporative light scattering detector (RP-HPLC-
ELSD). The lipase from Thermomyces lanuginosus discriminated DHA most,
resulting in best DHA/DHA-EE enrichment while lipase from Pseudomonas cepacia
discriminated EPA most, resulting in best EPA/EPA-EE enrichment. The lipases
discriminated docosahexaenoic acid (DHA) and eicosapentaenoic acid (EPA) more
when present as ethyl esters (EE) than when in FFA form. Thus when DHA/EPA had
been enriched to the same level during esterification and hydrolysis reactions, the
DHA-EE/EPA-EE recoveries were better than those of DHA/EPA-FFA. In reactions
catalysed by lipase from T. lanuginosus, at 26 mol% DHA/DHA-EE, DHA recovery
was 76% while that of DHA-EE was 84%. In reactions catalysed by lipase from P.
cepacia, at 11 mol% EPA/EPA-EE, EPA recovery was 79% while that of EPA-EE was
92%. Both esterification of FFA and hydrolysis of FA-EE were more effective at
enriching PUFA than hydrolysis of the natural oil and are thus attractive process
alternatives for the production of products highly enriched in DHA and/or EPA. When
there is only one fatty acid residue in each substrate molecule, the full fatty acid
selectivity of the lipase can be expressed, which is not the case with triglycerides as
substrates.
Key words: EPA/DHA/lipase specificity/esterification/hydrolysis.
Introduction.
Marine oils are the major commercial source of the essential long chain
polyunsaturated omega-3 fatty acids (n-3 PUFA), eicosapentaenoic acid (EPA) and
docosahexaenoic acid (DHA) [1, 2]. However, they also contain substantial amounts

2
of saturated and monounsaturated fatty acids [3, 4] which in some applications
need to be removed in order to increase the overall content of DHA and EPA. Lipases
have found applicability in such enrichment due to their fatty acid selectivity, which
can be used in concentrating EPA and/or DHA by kinetic resolution [5]. There are
numerous reports involving enrichment of EPA and/or DHA in the glycerol backbone
through hydrolysis or transesterification of fish oil triglycerides with lipases [6-10].
The selectivity of lipases is however influenced by the distribution of fatty acids in
the three positions of triglycerides and sometimes the glyceride structure [11, 12].
Therefore one lipase may concentrate EPA and DHA in one kind of fish oil but not be
effective in another depending on the distribution in the triglyceride molecule. For
example, lipase from Aspergillus niger increased DHA concentration in cod liver oil
[13], but did not increase it in menhaden oil [14] or tuna oil [15]. Lipase from
Thermomyces lanuginosus increased DHA and EPA contents in squid and menhaden
oil [7, 9], but was ineffective in enriching EPA in Nile perch oil [12].
Eicosapentaenoic acid and DHA can also be enriched as free fatty acids by selective
esterification of fish oil free fatty acids with an alcohol or glycerol [16-18] or by
hydrolysis of fish oil fatty acid ethyl esters [19]. In this case, the fatty acid structure
affects the lipase specificity in addition to the type of alcohol used during
esterification reactions [18, 20]. Hydrolysis of sardine oil ethyl esters with several
commercial enzymes revealed that all the lipases discriminated against n-3 PUFA
and preferred the more saturated fatty acids as substrates [21]. The lipases also
discriminated between EPA and DHA with most lipases such as lipases from
Geotrichum candidum, Candida rugosa and Thermomyces lanuginosus showing
preference for EPA over DHA while lipases from Pseudomonas species showed DHA
preference over EPA.
The specificity of lipases (Thermomyces lanuginosus and Pseudomonas cepacia)
towards PUFA in free fatty acids (FFA) and fatty acid ethyl esters (FA-EE) obtained
from Nile perch oil was investigated in the current study and compared with
previously obtained results concerning PUFA enrichment in the glyceride fraction by
direct hydrolysis of the natural oil. The reaction mixtures were analyzed in a single
run using RP-HPLC-ELSD.

3
2. Materials and methods
2.1 Materials
Protex 30L (≥2,750 GSU/g) was a gift from Genencor, a division of Danisco A/S
Denmark. Lipases from Thermomyces lanuginosus (≥100,000U/g), Candida rugosa
(≥700 000 U/g) and Pseudomonas cepacia (Amano lipase PS, ≥ 30 000U/g) were
from Sigma (St Louis, MO, USA). Free fatty acids and fatty acid ethyl esters were
purchased from Larodan Fine Chemicals AB (Malmö, Sweden) and Nu-check prep.
Inc, USA, respectively. All solvents and chemicals were of analytical grade.
2.2 Sampling and sample preparation
Nile perch viscera was kindly donated by W. E Tilly LTD, Nile perch processing
factory in Kenya and preserved at -20 ˚C until use. Oil extraction was performed as
described by Mbatia et al [22] and the fatty acid composition determined. The DHA
and EPA contents in the crude oil were 9 and 3 mol%, respectively.
2.3 Preparation of Nile perch viscera oil free fatty acids and fatty acid ethyl
esters
Nile perch free fatty acids were prepared by saponifying 100 ml of Nile perch viscera
oil with 250 ml of 90% ethanol containing 15 g of NaOH [23]. The reaction was
carried out at 50 ˚C for 1 h. The saponified product was acidified to pH 2 using
aqueous concentrated HCl and the free fatty acid fraction was separated from the
aqueous phase using a separating funnel. The fraction was washed in excess water
and analysed on silica plates using cyclohexane/diethyl ether/acetic acid (50/50/1)
as eluent.
Fatty acid ethyl esters (FA-EE) were prepared as described by Ahmed et al [24]. 15
g Nile perch free fatty acids were refluxed overnight at 90 ˚C in 250 ml absolute
ethanol containing 2% sulphuric acid. The refluxed sample was cooled to room
temperature and the FA-EE was extracted in 50 ml hexane/water (1:1 v/v). The
hexane fraction was washed with 2% bicarbonate solution and dried over anhydrous
sodium sulphate. Esters were concentrated by vacuum distillation. Composition of
generated FFA and FA-EE is shown in Table 1.

4
Table 1. Mol% fatty acids (FFA) and fatty acid ethyl esters (FFA-EE) produced after
alkaline hydrolysis of Nile perch viscera oil or acid catalysed esterification of the free
fatty acids.
Fatty acids FFA- mol% FFA-EE mol%
C 16:0 28.4 ± 1.5 33.6 ± 1.4
C 16:1 13.4 ± 0.8 18.2 ± 0.9
C 18:0 7.8 ±3.2 5.1 ± 0.1
C 18:1 21.8±0.8 20.1 ± 0.3
C 18:2 3.6 ± 0.5 1.2 ± 0.7
C 18:3 2.7 ± 0.2 1.8 ± 0.0
20:4 2.4 ± 0.1 2.2 ± 0.8
EPA 3.5 ± 0.1 3.5 ± 0.2
DPA 5.4 ± 0.1 5.1 ± 3.0
DHA 10.9 ± 0.8 9.2 ± 0.2
2.4 Immobilization of Lipases
The lipases were immobilised on Accurel MP1000 support by adsorption using a
method similar to that described previously [25, 26]. Lipases from T. lanuginosus
(2.5 mL), C. rugosa (1.21 g) or P. cepacia (2 g) were each dissolved in 20 mL of 20
mM sodium phosphate buffer (pH 7.0). The solution was centrifuged at 840 x g for 5
min and the supernatant was added to the MP1000 support, which had been pre-
wetted with ethanol (3 ml/g support). The amount of MP1000 used was 1.0 g for the
lipase from T. lanuginosus, 0.5 g for lipase from C. rugosa and 0.4 g for lipase from
P. cepacia. The mixture containing enzyme and support was gently mixed overnight
at room temperature. The enzyme preparation was then filtered and washed (3 x)
with 20 ml sodium phosphate buffer (20 mM, pH 7.0). To the enzyme preparation, 1
ml sodium phosphate buffer (200 mM, pH 7.0)/g preparation was added and this
preparation was dried under reduced pressure overnight. The protein content in the
immobilized preparation was determined by the Bradford method [27] .
Activity assay was performed using a spectrophotometric assay based on hydrolysis
of p-nitro phenyl butyrate (pNPB) to p-nitrophenol (pNP). 10 µl of 20 mM pNPB in
ice cold dried methanol was added into a cuvette containing 1 ml phosphate buffer
(200 mM, pH 7.0) with different amounts of enzyme samples (10, 20 and 30 µl)
which were taken before immobilization and from the filtrate obtained after
immobilization. The contents were mixed and absorbance recorded at 400 nm
continuously for 2 min. Spontaneous hydrolysis of pNPB was determined by adding
pNPB to phosphate buffer with no enzyme sample. Activities were 310, 510 and 728

5
U/g immobilized preparation for T. lanuginosus, P. cepacia and C. rugosa lipases,
respectively. Activities for non-immobilizes enzymes were 980, 156 and 1340 U/g
solid for T. lanuginosus, P. cepacia and C. rugosa lipases, respectively according to
this assay.
2.5 Lipase catalyzed esterification of Nile perch free fatty acids
Esterification reactions were performed in 4 ml vials sealed with screw caps and
Teflon lined septa. Nile perch free fatty acids (0.1 g) were esterified with ethanol,
1:3 molar ratios. The amounts of enzyme used were, 0.01 g T. lanuginosus lipase
(3.1 U), 0.006 g P. cepacia lipase (3.1 U) or 0.004 g C. rugosa lipase (2.9 U). The
reaction temperature was maintained at 30 ˚C in a thermoshaker (700 rpm). Vials
containing 0.1 g samples were withdrawn after 0, 30 min, 1, 2, 4, 6, 9, 12 and 24 h
and diluted with 3 ml acetonitrile. The lipid sample was further diluted to a final
concentration of 1 mg/ml of which 20 µl was used for RP-HPLC-ELSD analysis. All
experiments were performed in triplicates. The extent of esterification was
determined as: ([Ai]-[At]/ [Ai])*100. [Ai] is initial concentration of FFA and [At] is
the concentration at time (t).
DHA/EPA recovery was determined as ([At]/[Ai])*100, where [At] is concentration of
EPA or DHA in their original form (for example as free fatty acids in the case of the
esterification approach) at time (t) and [Ai] is the initial concentration.
2.6 Lipase catalyzed hydrolysis of Nile perch fatty acid ethyl esters
Hydrolysis of 0.1 g Nile perch fatty acid ethyl esters was performed in 0.5 ml of 0.2
M phosphate buffer containing either 0.06 or 0.28 units of T. lanuginosus and P.
cepacia lipases, respectively in 10 ml glass vials. These enzyme units were based on
the activity assay with p-nitrophenol as indicated in 2.4 above. The reaction
temperature was maintained at 30 ˚C in a thermoshaker (700 rpm). Vials containing
0.1 g samples were withdrawn after 0, 30 min, 1, 2, 4, 6, 9, 12 and 24 h. Formation
of a white precipitate was observed over hydrolysis time. To stop the reaction,
samples were diluted with 8 ml acetonitrile. A further dilution to 1 mg/ml in
acetonitrile was performed prior to RP-HPLC-ELSD analysis of which 20 µl samples
were injected. All experiments were performed in triplicates. The extent of
hydrolysis was determined as: ([Ai]-[At]/ [Ai])*100. [Ai] is initial concentration of
FA-EE and [At] is the concentration at time (t).

6
2.7 Calibration of evaporative light scattering detector (ELSD)
Different concentrations of free fatty acid standards were used. For DHA, EPA,
C16:1, C18:0, C18:1, C18:2, C18:3, arachidonic acid (AA), docosapentaenoic acid
(DPA) a concentration of 0.025-0.5 mM was used while for C16:0, a concentration
of 0.05-0.8 mM was used. A plot of log peak areas versus log concentration was
used to obtain the calibration curves of each fatty acid. For FA-EE, a concentration
of 0.05-0.8 mM for C18:1, EPA, DPA was used while for C16:0 and C16:1 a
concentration range of 0.02-1.4 mM was used. The standard curve for EPA-EE was
used to estimate AA-EE concentrations while that of C18:1-EE was used to estimate
the concentrations of C18:0, C18:2 and C18:3 ethyl esters.
2.8 Apparatus and RP-HPLC ELSD conditions
The HPLC system was Dionex ultimate 3000 connected with a Varian 385- LC
evaporative light scattering detector (ELSD). A RP-C18 (3 x 250 mm, 5 µm) column
was used for separations. The ELSD drift tube temperature was 25 ˚C, nebulisation
temperature was 25 ˚C and gas flow 1.7 standard litres per minute (SLPM). The
eluent programme used for free fatty acids and ethyl esters is shown in Table 2.
For samples containing only free fatty acids, the programme shown in Table 2 was
used except that the isocratic elution with acetonitrile was shortened to 5 min.
Table 2: Gradient elution programme for fatty acids and fatty acid ethyl esters in a
RP-C18 column using a mobile phase of acetonitrile and aqueous acetic acid.
Time (min) Acetonitrile (%)
0.05% aqueous acetic acid (%)
Flow rate (ml/min)
0 78 22 0.43
50 100 0 0.43
65 100 0 0.43
66 78 22 0.43
75 78 22 0.43
2.9 Determination of lipase specificity
The specificity of lipases from T. lanuginosus and P. cepacia towards fatty acids or
fatty acid ethyl esters was determined by calculating the competitive factor (α). A
log-log plot of equation (1) yields a linear curve with the slope equal to α value of

7
the substrate (B). From the α value, the specificity constant was calculated as 1/ α
with palmitic acid as reference substrate (A); its specificity constant taken as 1.00.
α=)/log()/log(
0
0
BBAA
(1)
A0 is the initial palmitic acid or palmitic acid ethyl ester concentration while A is the
palmitic acid or palmitic acid ethyl ester concentration at time t. B0 is the initial
C16:1, C18:1, EPA and DHA fatty acid or the ethyl esters concentration while B is
their concentration at time t.
Results and discussions
Conversion of FFA to FA-EE increased their retention times in the reversed phase
HPLC method by approximately 15 min which made it possible to separate a mixture
of FFA and FA-EE in a single run (Figure 1). Evaporative light scattering detector
(ELSD) is a mass detector for non-volatile compounds that remain after solvent
evaporation; therefore the samples were not derivatized. Gas chromatography (GC)
is the most frequently used approach for fatty acid analysis due to its great
efficiency. However, the fatty acids are derivatised to fatty acid methyl esters to
increase their volatility and reduce polarity [28]. In addition, for analysis of different
lipid classes for example FFA and FA-EE, a prior separation using thin layer
chromatography is normally used before GC analysis [29] .
HPLC-ELSD was used for qualitative and quantitative analysis of fatty acids. The
critical parameters of ELSD are the temperature of the drift tube, and the gas flow
rate, which play a prominent role for the analyte’s response [30]. The detector
conditions in the current study were optimised using the ethyl esters since they
were more volatile than the FFA. The use of a slow gradient assisted in avoiding co-
elution of closely eluting pairs such as oleic/palmitic acids and
arachidonic/palmitoleic acids (Figure 1). Unlike in GC where elution of fatty acids is
influenced by chain length, in reverse-phase HPLC, unsaturated fatty acids are
eluted substantially ahead of the saturated fatty acids of the same chain length
[28]. In addition, the more the number of double bonds in unsaturated fatty acids of
the same chain length, the shorter the elution time, therefore linolenic acid (C18:3)
elutes ahead of linoleic acid (C18:2) and oleic acid (C18:1) [31]. The order of
elution of some fatty acids also change with relative proportion of organic solvent in
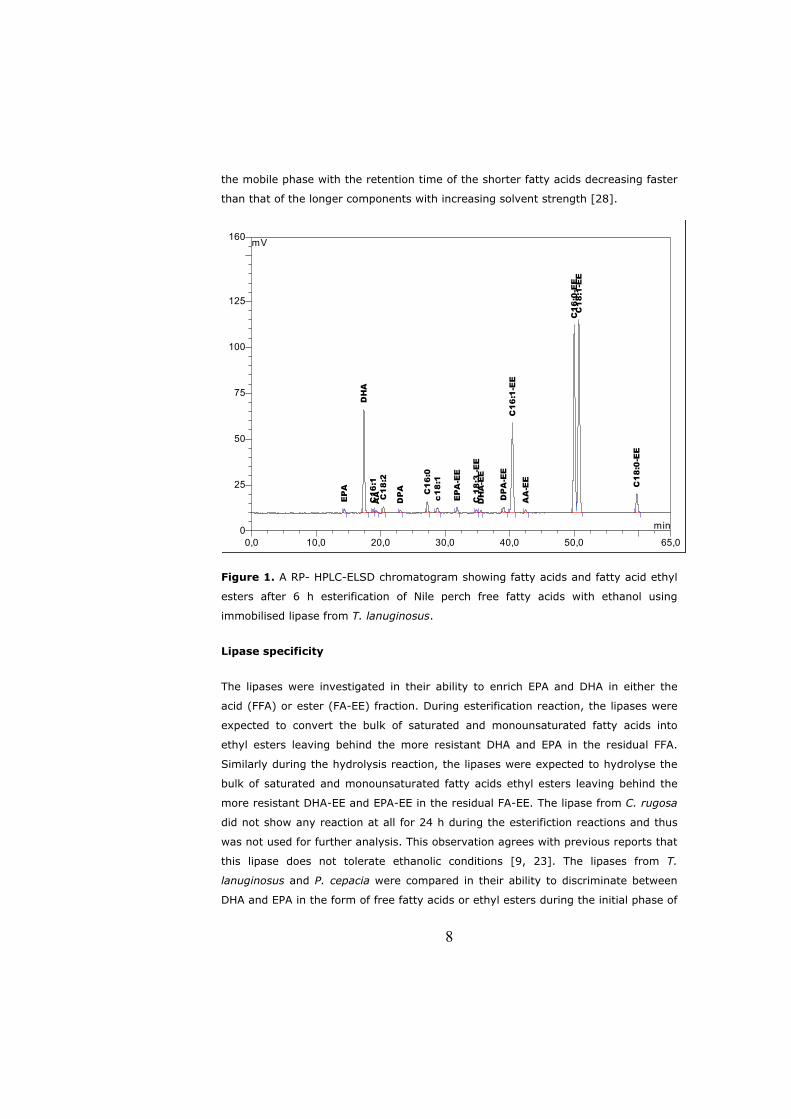
8
the mobile phase with the retention time of the shorter fatty acids decreasing faster
than that of the longer components with increasing solvent strength [28].
Figure 1. A RP- HPLC-ELSD chromatogram showing fatty acids and fatty acid ethyl
esters after 6 h esterification of Nile perch free fatty acids with ethanol using
immobilised lipase from T. lanuginosus.
Lipase specificity
The lipases were investigated in their ability to enrich EPA and DHA in either the
acid (FFA) or ester (FA-EE) fraction. During esterification reaction, the lipases were
expected to convert the bulk of saturated and monounsaturated fatty acids into
ethyl esters leaving behind the more resistant DHA and EPA in the residual FFA.
Similarly during the hydrolysis reaction, the lipases were expected to hydrolyse the
bulk of saturated and monounsaturated fatty acids ethyl esters leaving behind the
more resistant DHA-EE and EPA-EE in the residual FA-EE. The lipase from C. rugosa
did not show any reaction at all for 24 h during the esterifiction reactions and thus
was not used for further analysis. This observation agrees with previous reports that
this lipase does not tolerate ethanolic conditions [9, 23]. The lipases from T.
lanuginosus and P. cepacia were compared in their ability to discriminate between
DHA and EPA in the form of free fatty acids or ethyl esters during the initial phase of
0,0 10,0 20,0 30,0 40,0 50,0 65,00
25
50
75
100
125
160 mV
min
EP
A
DH
AC
16
:1A
A C1
8:2
DP
A C1
6:0
c1
8:1
EP
A-E
E
C 1
8:3
-EE
DH
A-E
E
DP
A-E
EC
16:1
-EE
AA
-EE
C16
:0-E
EC
18
:1-E
E
C1
8:0
-EE

9
the reactions (Figure 2). The lipase from T. lanuginosus discriminated both forms of
DHA more than the P. cepacia lipase while the latter was more effective in the
discrimination of EPA and EPA-EE. Similar kind of discrimination for lipases from T.
lanuginosus and P. cepacia is reported previously [7, 21]. The lipase from
Pseudomonas fluorescens is another example of a lipase that has been reported to
be more effective than other lipases in the enrichment of EPA in commercial fish oil
(43.1% EPA) and from Phaeodactylum tricornutum oil (23% EPA), a single-cell oil,
by selective enzymatic esterification [32]. The selectivity of the lipase for EPA
depended on the content of EPA, with higher contents of EPA in the initial FFA
mixture reducing the selectivity for EPA.
Figure 2. Specificity factors for lipases from T. lanuginosus and P. cepacia towards
DHA, DHA-ethyl esters, EPA and EPA-ethyl esters. Palmitic acid/Palmitic acid ethyl
ester was the reference substrate with a specificity factor of 1.00.
Both the T. lanuginosus and P. cepacia lipases showed a higher discrimination of
DHA and EPA during the hydrolysis of FA-EE compared to the esterification
reactions. The specificity factors obtained during esterification reaction were 0.16
and 0.66 for DHA and EPA using T. lanuginosus lipases and during hydrolysis of FA-
EE they were 0.07 and 0.16 for DHA and EPA, respectively. When P. cepacia was
used to catalyse esterification reaction, the specificity factors for DHA and EPA were
0
0.1
0.2
0.3
0.4
0.5
0.6
0.7
0.8
0.9
T. Lanuginosus and P. Cepacia
Lipases
Spec
ifici
ty fa
ctor
s
DHA-EE
DHA
EPA-EE
EPA
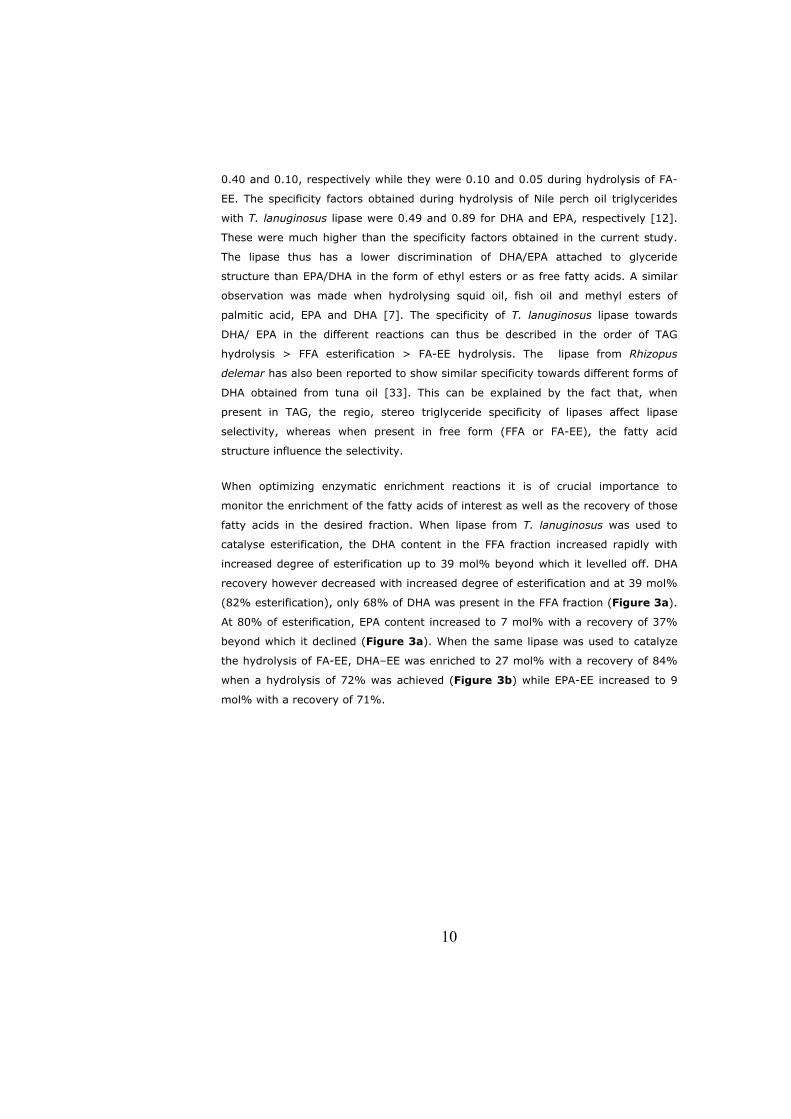
10
0.40 and 0.10, respectively while they were 0.10 and 0.05 during hydrolysis of FA-
EE. The specificity factors obtained during hydrolysis of Nile perch oil triglycerides
with T. lanuginosus lipase were 0.49 and 0.89 for DHA and EPA, respectively [12].
These were much higher than the specificity factors obtained in the current study.
The lipase thus has a lower discrimination of DHA/EPA attached to glyceride
structure than EPA/DHA in the form of ethyl esters or as free fatty acids. A similar
observation was made when hydrolysing squid oil, fish oil and methyl esters of
palmitic acid, EPA and DHA [7]. The specificity of T. lanuginosus lipase towards
DHA/ EPA in the different reactions can thus be described in the order of TAG
hydrolysis > FFA esterification > FA-EE hydrolysis. The lipase from Rhizopus
delemar has also been reported to show similar specificity towards different forms of
DHA obtained from tuna oil [33]. This can be explained by the fact that, when
present in TAG, the regio, stereo triglyceride specificity of lipases affect lipase
selectivity, whereas when present in free form (FFA or FA-EE), the fatty acid
structure influence the selectivity.
When optimizing enzymatic enrichment reactions it is of crucial importance to
monitor the enrichment of the fatty acids of interest as well as the recovery of those
fatty acids in the desired fraction. When lipase from T. lanuginosus was used to
catalyse esterification, the DHA content in the FFA fraction increased rapidly with
increased degree of esterification up to 39 mol% beyond which it levelled off. DHA
recovery however decreased with increased degree of esterification and at 39 mol%
(82% esterification), only 68% of DHA was present in the FFA fraction (Figure 3a).
At 80% of esterification, EPA content increased to 7 mol% with a recovery of 37%
beyond which it declined (Figure 3a). When the same lipase was used to catalyze
the hydrolysis of FA-EE, DHA–EE was enriched to 27 mol% with a recovery of 84%
when a hydrolysis of 72% was achieved (Figure 3b) while EPA-EE increased to 9
mol% with a recovery of 71%.
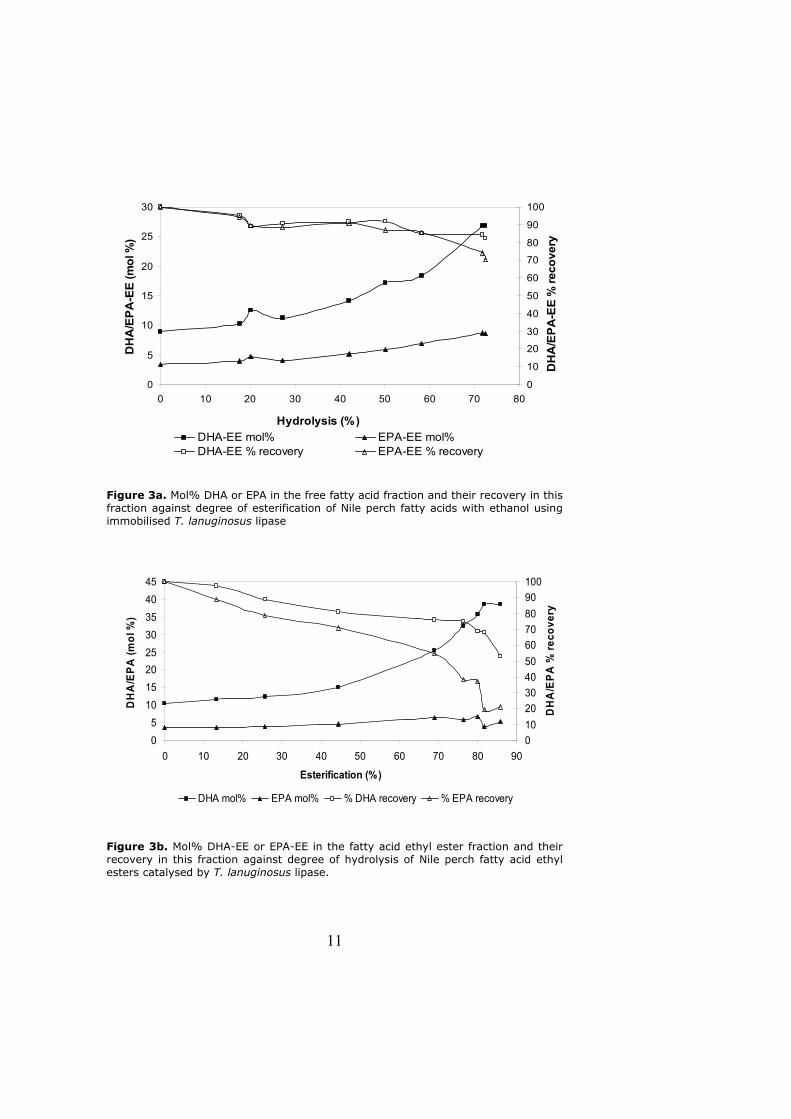
11
0
5
10
15
20
25
30
0 10 20 30 40 50 60 70 80
Hydrolysis (%)
DH
A/E
PA-E
E (m
ol %
)
0
10
20
30
40
50
60
70
80
90
100
DH
A/E
PA-E
E %
reco
very
DHA-EE mol% EPA-EE mol%DHA-EE % recovery EPA-EE % recovery
Figure 3a. Mol% DHA or EPA in the free fatty acid fraction and their recovery in this fraction against degree of esterification of Nile perch fatty acids with ethanol using immobilised T. lanuginosus lipase
05
1015202530354045
0 10 20 30 40 50 60 70 80 90
Esterification (%)
DH
A/E
PA (m
ol %
)
0102030405060708090100
DH
A/E
PA %
reco
very
DHA mol% EPA mol% % DHA recovery % EPA recovery
Figure 3b. Mol% DHA-EE or EPA-EE in the fatty acid ethyl ester fraction and their recovery in this fraction against degree of hydrolysis of Nile perch fatty acid ethyl esters catalysed by T. lanuginosus lipase.

12
When lipase from P. cepacia was used to catalyse the esterification reaction, EPA
increased to 16 mol% with 70% recovery after 85% of esterification after which it
started to decline (Figure 4a). The DHA content increased to 20 mol% with 40%
recovery after 78% esterification beyond which it gradually declined. The marked
decrease in EPA and DHA contents during the later part of the conversions shows
that the P. cepacia lipase has an intermediate specificity for these fatty acids. In the
beginning of the reaction mainly those fatty acids for which the lipase has high
specificity are esterified, while EPA and/DHA are enriched in the FFA fraction. Later
on EPA/DHA are esterified to a larger extent while fatty acids for which the lipase
has especially low specificity are enriched in the FFA fraction. If the P. cepacia lipase
catalyzed esterification reaction is to be used for enrichment of EPA/DHA it is thus of
vital importance to stop the reaction at a suitable time. The maximum for DHA
comes before that for EPA which is in agreement with the specificity results (Figure
2) where P. cepacia lipase showed a higher preference for DHA than EPA. In the
hydrolysis reaction, the lipase increased EPA-EE to 11 mol% with a recovery of 92%
while DHA-EE was increased to 21 mol% with 73% recovery when a hydrolysis of
68% was achieved (Figure 4b).
A comparison of the esterification and hydrolysis reactions at the same level of
enrichment showed better recoveries in the hydrolysis reaction. For example when
the lipase from T. lanuginosus was used, at 26 mol% DHA, the recovery was 84% in
the hydrolysis reaction, while it was 76% in the esterification (Figures 3a and b).
This was the same when both reactions catalyzed by P. cepacia lipase were
compared. At 11 mol% EPA, the recoveries were 92 and 79% during hydrolysis and
esterification reactions, respectively (Figures 4a and b). This result was in
agreement with the specificity results since the lipases showed a lower specificity for
DHA and EPA when they were present as ethyl esters (Figure 2).

13
0
5
10
15
20
25
0 10 20 30 40 50 60 70 80Hydrolysis (%)
DH
A/E
PA-E
E (m
ol %
)
0
10
20
30
40
50
60
70
80
90
100D
HA
/EPA
-EE
% re
cove
ry
DHA mol% EPA mol%
DHA-EE % recovery EPA-EE % recovery
0
5
10
15
20
25
30
0 10 20 30 40 50 60 70 80 90 100Esterification (%)
DH
A/E
PA (m
ol %
)
0
10
20
30
40
50
60
70
80
90
100
DH
A/E
PA %
reco
very
DHA mol% EPA mol% DHA % recovery EPA % recovery
Figure 4a. Mol% DHA or EPA in the free fatty acid fraction and their recovery in this fraction against degree of esterification of Nile perch fatty acids with ethanol using immobilised P. cepacia lipase.
Figure 4b. Mol% DHA-EE or EPA-EE in the fatty acid ethyl ester fraction and their recovery in this fraction against degree of hydrolysis of Nile perch fatty acid ethyl esters catalysed by P. cepacia lipase.
14
Thermomyces lanuginosus lipase was able to enrich both EPA and DHA in the
current study, although in a previous study, we observed that the same lipase was
ineffective in enriching EPA but enriched DHA to 38 mol% during hydrolysis of
triglycerides present in Nile perch oil [12]. This was attributed to the regioselectivity
of the lipase and the fatty acid distribution in the triglyceride molecules [34, 35].
The content of EPA was high in the sn 1,3 positions of the triglyceride while DHA
was equally distributed in the three positions [12]. Better yields (recoveries) of DHA
and EPA obtained in the current study compared with those attained during
enrichment of n-3 PUFA as acylglycerols [12] indicated that fatty acid selectivity was
more pronounced when fatty acids were present as ethyl esters or in free form than
when attached to glycerol. It should be pointed out that when the n-3 PUFAs to be
enriched are mainly present in the sn-2 position, the 1,3-specificity of a lipase can
help in the enrichment process. However, even in such cases enrichment by
hydrolysis of esters of isolated fatty acids is often more efficient [7].
In conclusion, hydrolysis of simple esters and esterification of free fatty acids are
more efficient process alternatives for the production of products highly enriched in
DHA and/or EPA. When there is only one fatty acid residue in each substrate
molecule, the full fatty acid selectivity of the lipase can be expressed, while the
influence of combinations of different fatty acids in each substrate molecule reduces
the observed selectivity in conversions of triglycerides. Nile perch oil is relatively
inexpensive fish oil that is normally sold off as a by-product. The EPA and DHA
content can be increased to favourable levels with excellent recoveries through
esterification of FFA or hydrolysis of FA-EE, and thus these lipase-catalyzed
conversions provide attractive routes to high value products. The previously studied
direct lipase-catalysed enrichment in the glyceride fraction is another interesting
option, mainly because it can be carried out directly on the natural oil. It should be
pointed out that DHA and EPA lost during the enzymatic processes, could also be
recovered from the side streams and re-cycled, thus ensuring maximum recovery of
these essential fatty acids.
Acknowledgement
We thank Dr. Carl Grey for guidance in development of the HPLC-ELSD method. The
project is part of the Swedish International Development Cooperation Agency
(SIDA/SAREC) sponsored BIO-EARN (East African Regional Programme and
Research Network for Biotechnology, Biosafety and Biotechnology Policy
development) program.
15
References
[1] N. Gámez-Meza, I. Higuera-Ciapara, A.M. Calderon de la Barca, L. Vázquez-Moreno, J. Noriega-Rodríguez, and O. Angulo-Guerrero: Seasonal variation in the fatty acid composition and quality of sardine oil from Sardinops sagax caeruleus of the Gulf of California, Lipids. 1999, 34, 639-642.
[2] C. M Williams and G. Burdge: Long-chain n-3 PUFA: plant v. marine sources, in Proc. Nutr. Soc. 2006, 65, 42-50.
[3] R. G. Ackman, W. M. N. Ratnayake and B. Olsson: The basic fatty-acid composition of atlantic fish oils-potential similarities useful for enrichment of polyunsatuarted fatty-acids by urea complexation, J. Am. Oil Chem. 1988, 65, 136-138.
[4] U. N. Wanasundara and F. Shahidi. Concentration of omega 3-polyunsaturated fatty acids of seal blubber oil by urea complexation: optimization of reaction conditions, Food Chem. 1999, 65, 41-49.
[5] K. D. Mukherjee, I. Kiewitt, M. J Hills. Substrate specificities of lipases in view of kinetic resolution of unsaturated fatty acids, Appl. Microbiol. Biotechnol. 1993, 40, 489–493.
[6] T. Okada, M.T. Morrissey. Production of n-3 polyunsaturated fatty acid concentrate from sardine oil by immobilized Candida rugosa lipase, J. Am. Oil Chem. 2008. 73, C146-C150.
[7] A. M Lyberg, P. Adlercreutz. Lipase specificity towards eicosapentaenoic acid and docosahexaenoic acid depends on substrate structure, Biochim. Biophys. Acta 2008, 1784, 343–350.
[8] P. Carvalho, P. Campos, M. Noffs, P. Fregolente, L. Fregolente: Enzymatic hydrolysis of salmon oil by native lipases: Optimization of process parameters. J. Braz. Chem. Soc. 2009. 20, 117-124.
[9] A. M Lyberg, P. Adlercreutz.:Lipase-catalysed enrichment of DHA and EPA in acylglycerols resulting from squid oil ethanolysis, Eur. J. Lipid Sci. Technol.2008 110, 317-324.
[10] G. G. Haraldsson, B. Kristinsson, R. Sigurdardottir, G.G. Gudmundsson and H. Breivik: The preparation of concentrates of eicosapentaenoic acid and docosahexaenoic acid by lipase-catalyzed transesterification of fish oil with ethanol, J. Am. Oil Chem. 1997, 74, 1419-1424.
[11] Y. Tanaka, T. Funada, J. Hirano, R. Hashizume: Triglyceride specificity of Candida cylindracea lipase-effect of docosahexaenoic acid on resistance of triglycerides to lipase, J. Am. Oil Chem. 1993, 70, 1031-1034
[12] B. Mbatia, P. Adlercreutz, F. Mulaa, B. Mattiasson: Enzymatic enrichment of n-3 polyunsaturated fatty acids in Nile perch (Lates niloticus) viscera oil, Eur. J. Lipid Sci. Technol. 2010, 112, 977–984
[13] T. Hoshino, Yamane T, Shimizu S: Bioreactor for enzymatic -reaction of fat and fatty-acid derivatives. 12. selective hydrolysis of fish oil by lipase to concentrate n-3 polyunsaturated fatty-acids, Agric. Biol. Chem. 1990, 54, 1459–1467.
[14] U. N. Wanasundara, F. Shahidi: Lipase-assisted concentration of n-3 polyunsaturated fatty acids in acylglycerols from marine oils, J. Am. Oil Chem. Soc. 1998, 75, 945–951.

16
[15] Y. Tanaka, J. Hirano, T. Funada: Concentration of docosahexaenoic acid in glyceride by hydrolysis of fish oil with Candida cylindricae lipase, J. Am. Oil Chem. Soc. 69, 1210-1214.
[16] A. Halldorsson, B. Kristinsson, C. Glynm and G.G. Haraldsson: Separation of EPA and DHA in fish oil by lipase-catalyzed esterification with glycerol. J. Am. Oil Chem. Soc. 2003. 80, 915-921.
[17] Y. Shimada, K. Maruyama, A. Sugihara, S. Moriyama and Y. Tominaga: Purification of docosahexaenoic acid from tuna oil by a two-step enzymatic method: Hydrolysis and selective esterification, J. Am. Oil Chem. Soc . 1997, 74, 1441-1446.
[18] S. K. Rakshit, R. Vasuhi and Y. Kosugi: Enrichment of polyunsaturated fatty acids from tuna oil using immobilized Pseudomonas fluorescens lipase, Bioprocess Eng. 2000, 23, 251-255.
[19] Y. Shimada, A. Sugihara, S. Yodono, T. Nagao, K. Maruyama, H. Nakano, S. Komemushi and Y. Tominaga: Enrichment of ethyl docosahexaenoate by selective alcoholysis with immobilized Rhizopus delemar lipase, J. Ferment. Bioeng. 1997,84, 138-143.
[20] C. H Lee, K.L Parkin: Comparative fatty acid selectivity of lipases in esterification reactions with glycerol and diol analogues in organic media, Biotechnol Prog. 2000, 16, 372-377.
[21] A. Halldorsson, B. Kristinsson, G. G Haraldsson: Lipase selectivity toward fatty acids commonly found in fish oil, Eur. J. Lipid Sci. Technol. 2004, 106, 79–87.
[22] B. Mbatia, D. Adlercreutz, P. Adlercreutz, A. Mahadhy, F. Mulaa, B. Mattiasson: Enzymatic oil extraction and positional analysis of omega-3 fatty acids in Nile perch and salmon heads, Process Biochem. 2010, 45, 815-819.
[23] G. G Haraldsson, B. Kristinson: Separation of eicosapentaenoic acid and docosahexaenoic acid in fish oil by kinetic resolution using lipase, J. Am. Oil Chem. Soc . 1998, 75, 1551-1556.
[24] S. Ahmed, K. Reddy, S. Swathy, S. Singh, S. Kanjilal, R. Prasad and A. Pandey: Enrichment of gamma-linolenic acid in the lipid extracted from Mucor zychae MTCC 5420, Food Res Int. 2009, 42, 449-453.
[25] M. Persson, I. Mladenoska, E.Wehtje and P. Adlercreutz: Preparation of lipases for use in organic solvents, Enzyme Microb Tech. 2002, 31, 833-841.
[26] T. Gitlesen, M. Bauer and P. Adlercreutz : Adsorption of lipase on polypropylene powder, Biochim. Biophys. Acta 1997, 1345, 188-196.
[27] M. Bradford: A rapid and sensitive method for quantitation of microgram quantities of protein utilizing the principle of protein-dye binding, Anal. Biochem. 1976, 72, 248-254.
[28] W.W. Christie, X. Han: Lipid Analysis (4th edition): Isolation, Separation, Identification and Lipidomic Analysis. 2010, 189-192.
[29] S. Ahuja: Derivatisation in gas chromatography, J. Pharm. Sci. 1976, 65, 163- 165.
[30] Alltech ELSD 2000. Evaporative Light Scattering Detector Operating Manual. 2002.
[31] J. Svensson, P. Adlercreutz: Identification of triacylglycerols in the enzymatic transesterification of rapeseed and butter oil, Eur. J. Lipid Sci. Technol. 2008. 110, 1007-1014.

17
[32] A. Fajardo, L. Cerdán, A. Medina, M. Martínez, E. Peña and E. Grima: Concentration of Eicosapentaenoic Acid by Selective Esterification Using Lipases, J. Am. Oil Chem. Soc.2006, 73, 215-221.
[33] Y. Shimada, A. Sugihara, S. Yodono, T. Nagao, K. Maruyama, H. Nakano, S. Komemushi and Y. Tominaga: Enrichment of Ethyl Docosahexaenoate by Selective Alcoholysis with Immobilized Rhizopus delemar Lipase, J. Ferment Bioeng. 1997, 84, 138-143.
[34] W.W. Christie: The positional distribution of fatty acids in triglycerides, in Analysis of oils and Fats, edited by R.J. Hamilton and J.B Rossell, Elsevier, London, 1986, 313-339.
[35] P. Sonnet, J. Gazzillo: Evaluation of lipase selectivity for hydrolysis J. Am. Oil Chem. Soc .1991, 68, 11-15.


Paper IV

1
Enzymatic synthesis of lipophilic rutin and vanillyl esters from fish
byproducts
Betty Mbatiaa,b, Kaki Shiva Shankera, Bo Mattiassona, Francis Mulaab, Patrick Adlercreutza* a Department of Biotechnology, Lund University, Box 124, SE-221 00 Lund, Sweden b Department of Biochemistry, University of Nairobi, P.O. Box 30197, 00100 Nairobi, Kenya *Corresponding author. Tel.: +46462224842; fax: +46462224713. E-mail address: [email protected].
Abstract
Lipase-catalyzed synthesis of lipophilic phenolic antioxidants was carried out with a
concentrate of n-3 polyunsaturated fatty acids (PUFAs), recovered from oil extracted
from Salmon (Salmon salar) filleting by-products. Vanillyl alcohol and rutin were
selected for the esterification reaction and obtained esters yields were 60 and 30%,
respectively. The antioxidant activities of the esters were compared with those of
commercial butylated hydroxytoluene (BHT) and α-tocopherol using DPPH radical
scavenging assay and thiobarbituric acid assay. In the DPPH radical assay, rutin
esters showed better activity than the vanillyl esters and on the contrary in lipophilic
medium, the vanillyl esters were found to be superior to the rutin esters in the
tested concentrations. In bulk oil system, the antioxidant activities of rutin and
vanillyl derivatives were lower than that of BHT and α-tocopherol but in emulsion,
they showed better activity than α-tocopherol. By attaching PUFAs to natural
phenolics, the PUFAs are protected against oxidation while PUFA makes the phenolic
antioxidant more hydrophobic which could enhance its function in lipid systems.
Key words: lipophilization, PUFA, phenolics, antioxidant
1. Introduction
The use of phenolic antioxidants to protect food based products from oxidation and
also to improve the shelf life of lipid containing products has nutritional and
pharmaceutical relevance (Figueroa-Espinoza et al, 2005). The use of natural
phenolics as antioxidants has been increasing because the most widely used and
commercially available antioxidants such as butylated hydroxytoluene (BHT),
butylated hydroxyanisole (BHA) and tert-butylhydroquinone (TBHQ) are not
considered safe due to their suspected role as promoters of carcinogenesis (Iverson,
1995). The other alternative is the use of natural phenolics which is however limited
due to their poor solubility in hydrophobic media. To address this, several reports on

2
the lipophilization of natural phenolics to prepare lipophilic antioxidants have been
published (Guyot et al, 2000, Sabbally et al, 2005, & 2006, Kanjilal et al, 2008).
Natural phenolics which are abundant in plant kingdom are of particular interest
because of their potential biological properties, such as antioxidant, chelating, free
radical scavenging, anti-inflammatory, anti-allergic, antimicrobial, antiviral and
anticarcinogenic (Figueroa-Espinoza et al, 2005).
Fish oils are receiving increased interest due to their high content of omega-3
polyunsaturated fatty acids (PUFAs), which are reported to exert positive effects on
human health (Uauy, 2000 & Calder, 2004). In addition, PUFAs serve a role as
precursors of a wide variety of metabolites (prostagladins, leukotrienes and hydroxyl
fatty acids) regulating critical biological functions. Since mammals have limited
ability to synthesize these unsaturated fatty acids, they must be supplied in the diet.
The practical use of omega-3 PUFAs for a preventive purpose is limited because of
their high susceptibility to autoxidation, which is responsible for the unfavourable
off-flavour in rancid oils. A solution would be to combine PUFA with natural
antioxidants such as flavonoids, by forming an ester bond. Viskupicova et al, (2010)
observed that long chain fatty acids conjugated to rutin provided improved
stabilisation of sunflower oil against oxidation compared to conjugates with short
chain fatty acids. Based on this observation, and the increasing demand of omega-3
PUFA, it was assumed that esterification of PUFAs concentrate with natural phenolic
compounds can be helpful in protecting both the PUFAs and the product in which the
PUFA-phenolic derivatives are present against oxidation. Also the products prepared
would confer the beneficial effects of both the PUFA and the phenolic compounds. In
addition to antioxidant activity, products of natural phenolics as esters of PUFA have
been reported to show significantly improved anti-inflamatory activities as well
antiviral and anticancer activities that were not present in the original phenolic
molecule suggesting that PUFA moieties contribute to the bioactivities of the ester
derivatives (Shahidi and Zhong, 2010).
Recently, we reported the utilization of by-products from fish industries as a source
of omega-3 PUFAs (Mbatia et al, 2010 a & b). To the best of our knowledge, there
are no reports on the utilization of PUFAs concentrate from fish oil to prepare
lipophilic antioxidants and test them on stabilisation of fish oils. Two natural
phenolics, rutin and vanillyl alcohol, were selected for this study. Enzymatic
lipophilization of rutin with individual fatty acids (C4–C18) has been reported (Lue et
al, 2010a, Viskupicova et al, 2010). Similarly, enzymatic esterification of vanillyl
alcohol with individual fatty acids to prepare capsinoid derivatives have been
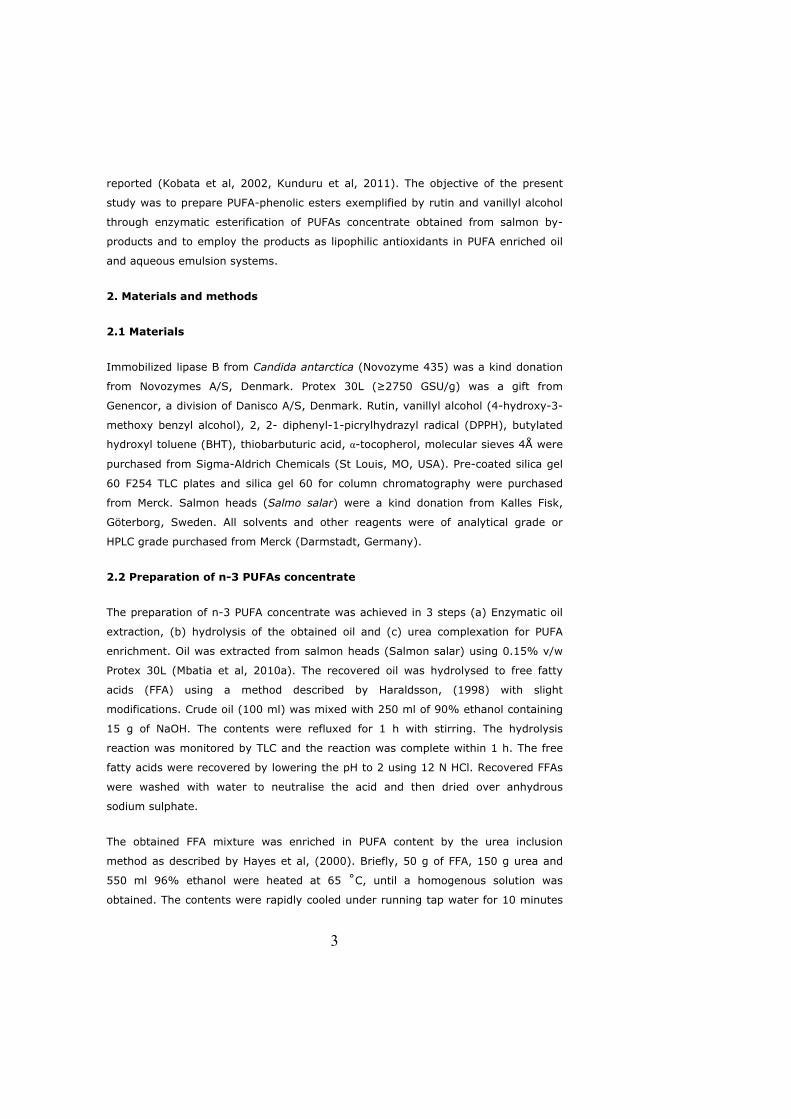
3
reported (Kobata et al, 2002, Kunduru et al, 2011). The objective of the present
study was to prepare PUFA-phenolic esters exemplified by rutin and vanillyl alcohol
through enzymatic esterification of PUFAs concentrate obtained from salmon by-
products and to employ the products as lipophilic antioxidants in PUFA enriched oil
and aqueous emulsion systems.
2. Materials and methods
2.1 Materials
Immobilized lipase B from Candida antarctica (Novozyme 435) was a kind donation
from Novozymes A/S, Denmark. Protex 30L (≥2750 GSU/g) was a gift from
Genencor, a division of Danisco A/S, Denmark. Rutin, vanillyl alcohol (4-hydroxy-3-
methoxy benzyl alcohol), 2, 2- diphenyl-1-picrylhydrazyl radical (DPPH), butylated
hydroxyl toluene (BHT), thiobarbuturic acid, α-tocopherol, molecular sieves 4Å were
purchased from Sigma-Aldrich Chemicals (St Louis, MO, USA). Pre-coated silica gel
60 F254 TLC plates and silica gel 60 for column chromatography were purchased
from Merck. Salmon heads (Salmo salar) were a kind donation from Kalles Fisk,
Göterborg, Sweden. All solvents and other reagents were of analytical grade or
HPLC grade purchased from Merck (Darmstadt, Germany).
2.2 Preparation of n-3 PUFAs concentrate
The preparation of n-3 PUFA concentrate was achieved in 3 steps (a) Enzymatic oil
extraction, (b) hydrolysis of the obtained oil and (c) urea complexation for PUFA
enrichment. Oil was extracted from salmon heads (Salmon salar) using 0.15% v/w
Protex 30L (Mbatia et al, 2010a). The recovered oil was hydrolysed to free fatty
acids (FFA) using a method described by Haraldsson, (1998) with slight
modifications. Crude oil (100 ml) was mixed with 250 ml of 90% ethanol containing
15 g of NaOH. The contents were refluxed for 1 h with stirring. The hydrolysis
reaction was monitored by TLC and the reaction was complete within 1 h. The free
fatty acids were recovered by lowering the pH to 2 using 12 N HCl. Recovered FFAs
were washed with water to neutralise the acid and then dried over anhydrous
sodium sulphate.
The obtained FFA mixture was enriched in PUFA content by the urea inclusion
method as described by Hayes et al, (2000). Briefly, 50 g of FFA, 150 g urea and
550 ml 96% ethanol were heated at 65 ˚C, until a homogenous solution was
obtained. The contents were rapidly cooled under running tap water for 10 minutes
4
to allow crystallisation. The crystallised and non-crystallised fractions were
separated by filtration. The method for preparation of fatty acid methyl esters
(FAME) and program for FAME analysis by GC was as described by Mbatia et al,
(2010a).
2.3 Lipase catalyzed synthesis of lipophilic esters
2.3.1 Enzymatic synthesis of rutin fatty acid esters
This was performed following a method reported by Lue et al (2010a). Briefly, rutin
(1 g) and PUFA concentrate (1.9 g) 1:4 rutin/PUFA molar ratio, were solubilised in
dried acetone (300 mL). Immobilized lipase (6 g) and molecular sieves (15 g) were
added and the reaction was agitated at 200 rpm, 50 ˚C for 96 h. To terminate the
reaction, enzyme and molecular sieves were filtered off and acetone was
evaporated. The residue was transferred into 4 centrifuge tubes. Heptane/water 30
ml (4:1 v/v) was used to extract unreacted PUFA. The heptane phase was
discarded. Rutin and rutin-PUFA esters were separated using 35 ml ethyl acetate/
hot water (60 ˚C, 1: 6 v/v). Esters were extracted into the ethyl acetate phase. The
ethyl acetate phases were pooled, dried over anhydrous sodium sulphate and
evaporated using rota-vapour to recover the rutin esters of PUFA as a solid dark-
yellow product (0.43 g, 30%).
2.3.2 Enzymatic synthesis of vanillyl fatty acid esters
This was performed as described by Kobata et al, (2002) with slight modifications.
To a mixture of fish oil PUFA (6 g,) and vanillyl alcohol (4.5 g), (1:1.5 PUFA/vanillin
molar ratio) in acetone (25 mL), lipase (2 g) and 2.5 g of molecular sieves were
added and the mixture was agitated at 200 rpm for 48 h at 50 ˚C. To stop the
reaction, enzyme and molecular sieves were separated by filtration. The filtrate was
washed with sodium bicarbonate in water. The organic phase was dried over
anhydrous sodium sulphate and concentrated in vacuo. The crude product was
purified by silica gel column chromatography using hexane/ ethyl acetate (96:4
v/v), to obtain the vanillyl esters of PUFA as oily colourless liquid (5.16 g, 60%).
2.4 Analytical methods
The reaction products of both rutin and vanillyl esters were monitored by TLC and
HPLC and confirmed by LC-MS of purified samples. For rutin esters, mixtures of
chloroform/methanol (80:20 v/v) and for vanillyl esters pure chloroform were used

5
as mobile phase for TLC analysis. TLC plates were visualised under UV light (254
nm).
HPLC analysis was carried out using DIONEX Ultimate HPLC system equipped with a
Varian 385-LC evaporative light scattering detector (ELSD) and a Luna RP-C18
column (250 X 3.0 mm, 5 µm particle size). This system was also equipped with an
autosampler, on-line degasser and a column heater. Injection volume was 20 µl.
Acetonitrile and water containing 0.05% acetic acid were used as mobile phases A
and B, respectively, in the following gradient elution: 78 to 100% A over 50 min,
100% A for 5 min, followed by 10 min re-equilibration time between samples.
Column temperature was 25 ˚C, flow rate was 0.43 mL/min and detection was
carried out in ELSD using evaporator and nebulizer temperatures of 25 and 40 ˚C,
respectively, and a gas flow of 1.7 standard liters per minute (SLPM).
LC-MS analysis was carried out on a hybrid QSTAR Pulsar quadrupole time-of-flight
mass spectrometer (PE Sciex Instruments, Toronto, Canada), equipped with
electrospray ionization (ESI) source. The software used was Analyst QS 1.1, also
from PE Sciex. LC-MS was used to characterise the purified vanillyl and rutin PUFA
esters. The elution program was similar to that used during RP-HPLC analysis. The
scan range was 200-1500 m/z. Negative ESI mode was used for PUFA and rutin-
PUFA esters while positive ionisation mode was used for vanillyl-PUFA esters.
2.5 Determination of antioxidant activity
2.5.1. DPPH radical scavenging activity
The antioxidant activity was determined by the radical scavenging ability using the
stable DPPH˙ radical as described by Akowuah et al, (2006). Briefly, 200 μL of
methanolic solution of the synthesized phenolic lipids (1 mM or 2 mM) was added to
2 mL of methanolic solution of DPPH˙ radical (0.1 mM) and total volume was made
up to 3 mL with methanol. After 60 min incubation at 30 ˚C in the dark, the
absorbance of the mixture was measured at 517 nm against methanol as blank in
an Ultrospec 1000 UV spectrophotometer.
BHT and α-tocopherol were used as positive controls and their concentrations were
kept equal to that of synthesized phenolic lipids. The free radical scavenging activity
(FRSA in %) of the tested samples were evaluated by comparison with a control (2
mL of DPPH radical solution and 1 mL of methanol). Each sample was measured in
triplicates and an average value was calculated. Antioxidant activity was expressed

6
as a percentage of DPPH˙ radical scavenging activity compared to control. The FRSA
was calculated using the formula: FRSA = [(Ac-As) /Ac] x 100, where ‘Ac’ is the
absorbance of the control and ‘As’ is the absorbance of the tested sample after 60
min.
2.5.2 Stabilisation of fish oil against oxidation employing synthesised antioxidants.
The potential of the synthesised antioxidants to protect fish oil acylglycerol
concentrate prepared in our laboratory was evaluated. The acylglycerol concentrate
was spiked with vanillyl-PUFA, rutin-PUFA, α-tocopherol or BHT to a final
concentration of 5 or 25 mM. A control sample with no antioxidant added was
included. The samples were heated for 6 h in a water bath set at 70 ˚C with
agitation at 170 rpm. The extent of oxidation was determined by the thiobarbituric
acid assay (TBARS) as described in section 2.5.3.
2.5.2.1 Stabilisation of fish oil emulsion against oxidation using synthesised
antioxidants.
The potential of synthesised antioxidants to protect an emulsion against oxidation
was tested. An oil emulsion was prepared from the acylglycerol concentrate as
described by Huber et al, (2009). Acylglycerol concentrate (10 mg/ml) was
dissolved in buffer (pH 7.0) containing 50 mM Tris-HCl, 150 mM KCl and 1% Tween
20. The contents were sonicated for 20 seconds (ultrasonic cleaner BRANSON 200).
The emulsion was maintained by agitating the tubes with the emulsion at 400 rpm.
The emulsion sample (2 ml) was mixed with vanillyl-PUFA, rutin-PUFA, α-tocopherol
or BHT to a final concentration of 5 or 25 mM. A control without antioxidant was
included. The samples were heated at 70 ˚C for 6 h and extent of oxidation
determined using TBARS assay as described in section 2.5.3. The experiment was
performed in triplicate.
2.5.3 Thiobarbituric acid assay (TBARS)
This assay was performed based on the method described by Huber et al, (2009),
with slight modifications. Briefly, 100 µl of lipid sample or 400 µl for emulsion
sample was mixed with 2 ml of TBARS reagent (0.375% (w/v) TBA in 250 mM HCl)
by agitating the contents at 200 rpm for 5 min. The contents were centrifuged at
2150 x g for 5 min. The lower phase (approximately 1 ml) was carefully transferred
into Eppendorf tubes and heated at 80 ˚C for 20 minutes. The tubes were then
allowed to cool to room temperature and again centrifuged at 2150 x g for 5
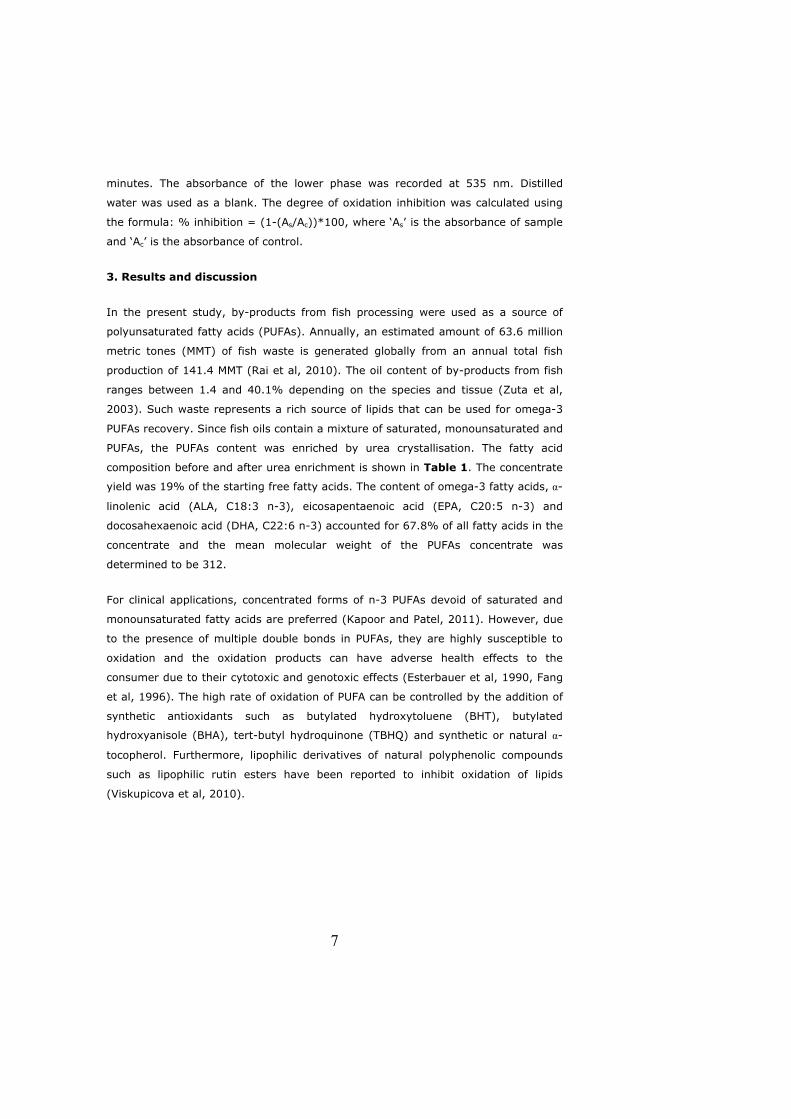
7
minutes. The absorbance of the lower phase was recorded at 535 nm. Distilled
water was used as a blank. The degree of oxidation inhibition was calculated using
the formula: % inhibition = (1-(As/Ac))*100, where ‘As’ is the absorbance of sample
and ‘Ac’ is the absorbance of control.
3. Results and discussion
In the present study, by-products from fish processing were used as a source of
polyunsaturated fatty acids (PUFAs). Annually, an estimated amount of 63.6 million
metric tones (MMT) of fish waste is generated globally from an annual total fish
production of 141.4 MMT (Rai et al, 2010). The oil content of by-products from fish
ranges between 1.4 and 40.1% depending on the species and tissue (Zuta et al,
2003). Such waste represents a rich source of lipids that can be used for omega-3
PUFAs recovery. Since fish oils contain a mixture of saturated, monounsaturated and
PUFAs, the PUFAs content was enriched by urea crystallisation. The fatty acid
composition before and after urea enrichment is shown in Table 1. The concentrate
yield was 19% of the starting free fatty acids. The content of omega-3 fatty acids, α-
linolenic acid (ALA, C18:3 n-3), eicosapentaenoic acid (EPA, C20:5 n-3) and
docosahexaenoic acid (DHA, C22:6 n-3) accounted for 67.8% of all fatty acids in the
concentrate and the mean molecular weight of the PUFAs concentrate was
determined to be 312.
For clinical applications, concentrated forms of n-3 PUFAs devoid of saturated and
monounsaturated fatty acids are preferred (Kapoor and Patel, 2011). However, due
to the presence of multiple double bonds in PUFAs, they are highly susceptible to
oxidation and the oxidation products can have adverse health effects to the
consumer due to their cytotoxic and genotoxic effects (Esterbauer et al, 1990, Fang
et al, 1996). The high rate of oxidation of PUFA can be controlled by the addition of
synthetic antioxidants such as butylated hydroxytoluene (BHT), butylated
hydroxyanisole (BHA), tert-butyl hydroquinone (TBHQ) and synthetic or natural α-
tocopherol. Furthermore, lipophilic derivatives of natural polyphenolic compounds
such as lipophilic rutin esters have been reported to inhibit oxidation of lipids
(Viskupicova et al, 2010).

8
Table 1. Fatty acid composition of salmon oil and PUFAs concentrate obtained by
urea complexation. The ratio of urea to fatty acids was 3:1 (w/w).
Before enrichment After enrichment
Fatty acid mol% mol%
C 14:0 5.4 ± 0.06 0.7± 0.06
C 15:0 0.4 ± 0.00 0.2± 0.01
C 16:0 15.8± 0.06 0.1± 0.02
C 16:1 5.6± 0.01 6.2± 0.39
C 18:0 3.5± 0.01 0.4± 0.41
C 18:1 n-9 28.0± 0.11 8.5± 1.46
C 18:1 n-7 3.6± 0.04 1.6± 0.25
C 18:2 7.9± 0.01 16.9± 0.01
C 18:3 (ALA) 2.8± 0.00 6.7± 0.06
C 18:4 1.2± 0.00 3.9± 0.11
C 20:0 5.1± 0.03 0.4± 0.09
C 20:4 0.5± 0.01 1.5± 0.05
C 20:5 (EPA) 5.5± 0.01 17.8± 0.58
C 22:1 4.3± 0.03 0.2± 0.05
C 22:4 0.2± 0.01 0.5± 0.02
C 22:5 (DPA) 2.5± 0.00 7.4± 0.32
C 22:6 (DHA) 7.6± 0.02 26.9± 1.26
3.1. Enzymatic synthesis of rutin and vanillyl esters of PUFA
The synthesis of lipophilic derivatives of rutin and vanillyl alcohol was performed
employing reported methods with slight modifications (Lue et al, 2010a, Kobata et
al, 2002). The yields obtained for isolated rutin and vanillyl PUFA esters after
purification were 30% and 60%, respectively. Previously, lipophilization of phenolic
derivatives is mainly reported with pure fatty acids in the range C4-C18 (Lue et al,
2010a, Viskupicova et al, 2010, Kanjilal et al, 2008 and Ardhoui et al, 2004). In this
study, a PUFA concentrate with fatty acids mainly in the range C18-C22 was used.
All the fatty acids were incorporated into the phenolic derivatives despite the
differences in chain length and degree of unsaturation (Figure 1b, c). The shift in
the retention times in reversed phase HPLC of the PUFA concentrate components
after reaction with either vanillyl alcohol or rutin (Figures 1a, b, c), was an
indication of ester formation. This was further ascertained by LC-MS. The observed
and expected molecular weights of selected fatty acid esters are given in Table 2.

9
Table 2. Molecular weights of vanillyl-PUFA and rutin-PUFA esters observed in the
LC-MS analysis (expected masses are shown in brackets).
Fatty acid Vanillyl- PUFAa Rutin- PUFAb
C 18:3 415.2869 (415.2848) 869.5341 (869.3596) C18:4 413.2730 (413.2692) 867.5105 (867.3439) C 20:4 441.2950 (441.3005) 895.5675 (895.3752) EPA 439.2622 (439.2848) 893.5427 (893.3596) DPA 467.2669 (467.3161) 921.6045 (921.3909) DHA 465.2893 (465.3005) 919.5728 (919.3752)
a = M+H, b = M-H
Figure 1a. HPLC–ELSD profile of salmon oil PUFA concentrate before esterifcation
with vanillyl alcohol or rutin.
Inte
nsity
(mV
)
Elution time (min)0,0 10,0 20,0 30,0 40,0 50,0 65,0
0
100
200
300
400
500
600
700 mV
min
C 18
:4
EP
AC
18:3
DHA
C16
:1A
ADP
AC1
8:2
C18:
1
a
Inte
nsity
(mV
)
Elution time (min)0,0 10,0 20,0 30,0 40,0 50,0 65,0
0
100
200
300
400
500
600
700 mV
min
C 18
:4
EP
AC
18:3
DHA
C16
:1A
ADP
AC1
8:2
C18:
1
a
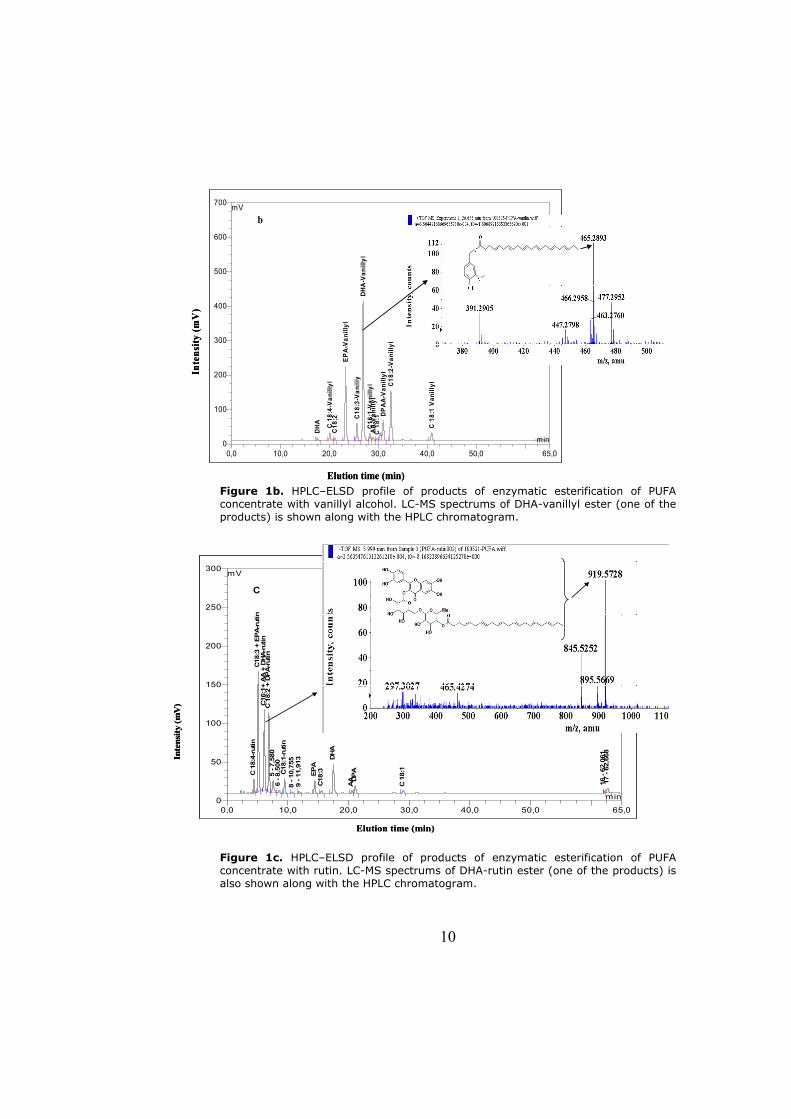
10
Figure 1b. HPLC–ELSD profile of products of enzymatic esterification of PUFA concentrate with vanillyl alcohol. LC-MS spectrums of DHA-vanillyl ester (one of the products) is shown along with the HPLC chromatogram.
Figure 1c. HPLC–ELSD profile of products of enzymatic esterification of PUFA concentrate with rutin. LC-MS spectrums of DHA-rutin ester (one of the products) is also shown along with the HPLC chromatogram.
0,0 10,0 20,0 30,0 40,0 50,0 65,00
100
200
300
400
500
600
700 mV
min
DH
A C 1
8:4-
Van
illyl
C18
:2E
PA
-Van
illyl
C18
:3-V
anill
yD
HA
-Van
illyl
C16
:1-V
anill
ylA
A-V
anill
ylC
18:
1 DP
AA
-Van
illyl
C18
:2-V
anill
yl
C 1
8:1
Van
illyl
b
Inte
nsity
(mV
)
Elution time (min)
0,0 10,0 20,0 30,0 40,0 50,0 65,00
100
200
300
400
500
600
700 mV
min
DH
A C 1
8:4-
Van
illyl
C18
:2E
PA
-Van
illyl
C18
:3-V
anill
yD
HA
-Van
illyl
C16
:1-V
anill
ylA
A-V
anill
ylC
18:
1 DP
AA
-Van
illyl
C18
:2-V
anill
yl
C 1
8:1
Van
illyl
b
Inte
nsity
(mV
)
Elution time (min)
Elution time (min)
0,0 10,0 20,0 30,0 40,0 50,0 65,00
50
100
150
200
250
300 mV
min
C 1
8:4-
rutin
C18
:3 +
EP
A-r
utin
C16
:1+
AA
+ D
HA-r
utin
C 1
8:2
+ D
PA
-rutin
5 - 7
,580
6 - 8
,500
C18
:1-r
utin
8 - 1
0,75
59
- 11,
913
EP
AC
18:3
DH
A
AAD
PA
C 1
8:1
16 -
62,0
6117
- 62
,668
C
Inte
nsity
(mV
)
Elution time (min)
0,0 10,0 20,0 30,0 40,0 50,0 65,00
50
100
150
200
250
300 mV
min
C 1
8:4-
rutin
C18
:3 +
EP
A-r
utin
C16
:1+
AA
+ D
HA-r
utin
C 1
8:2
+ D
PA
-rutin
5 - 7
,580
6 - 8
,500
C18
:1-r
utin
8 - 1
0,75
59
- 11,
913
EP
AC
18:3
DH
A
AAD
PA
C 1
8:1
16 -
62,0
6117
- 62
,668
C
Inte
nsity
(mV
)

11
The better yields of vanillyl esters than those of rutin esters may be attributed to
the lower reactivity of rutin with fatty acids compared to that of vanillyl alcohol. It
has been reported that though Novozyme 435 is a non-specific lipase, it shows
greater selectivity towards primary hydroxyl groups compared to secondary
hydroxyls (Virto et al, 2000). Vanillyl alcohol has a primary hydroxyl group while
incase of rutin, acylation occurs on the 4’’’- hydroxyl group of the rhamnoside
moiety (Viskupicova et al, 2010, Oliveira et al, 2009). Despite there being six
secondary hydroxyl groups in rutin molecule, LC-MS data indicated that no rutin
molecule was acylated with more than one fatty acid. A previous study by Lue et al,
(2010a) in which rutin was esterified with lauric or palmitic acid reported rutin-
laurate and rutin-palmitate esters yield of 82%. The lower rutin esters yields (30%)
obtained in the current study could be due to presence of greater amounts of long
chain PUFAs in the fatty acid mixture. It was earlier reported that as the chain
length increases, the conversion yields of esters gradually decreases (Viskupicova et
al, 2010, Ardhaoui et al, 2004). When using Candida antarctica lipase in 2-
methylbutan-2-ol, esterification of rutin with fatty acids of chain lengths (C4-C12)
gave a conversion yield greater than 50% while lower yields were obtained with
longer fatty acids (C12-C18) (Viskupicova et al, 2010).
3.2 Antioxidant activity
Esterification of PUFA concentrate with vanillyl alcohol resulted in PUFA-vanillyl
esters that were more hydrophobic than the PUFA concentrate while rutin-PUFA
esters were less hydrophobic according to the retention times in reversed phase
HPLC (Figure 1b, c). However, both products were more hydrophobic than either
rutin or vanillyl alcohol with retention times of 2.26 and 2.65 min, respectively.
The well established DPPH radical scavenging activity was used to determine the
antioxidant activity for the synthesized rutin and vanillyl PUFA esters in two different
concentrations. The results were compared with those of the reference compounds
BHT and α-tocopherol as well as the parent compounds rutin and vanillyl alcohol and
are given in Table 3. Both rutin and vanillyl PUFA esters showed radical scavenging
activity in the DPPH radical assay. The antioxidant activity of the synthesized rutin-
PUFA esters was higher compared to that of vanillyl-PUFA esters in both the tested
concentrations. The rutin-PUFA esters exhibited higher activity than the commercial
antioxidant BHT, and an activity similar to that of α-tocopherol. The difference in
antioxidant activities between the synthesised esters maybe attributed to the
difference in the structure, solubility and the number of phenolic hydroxyls (Silva et

12
al, 2000). Unlike rutin which has four phenolic hydroxyl groups, vanillyl alcohol has
only one phenolic hydroxyl group and a methoxy group. In addition, the solubility of
the rutin derivatives in methanolic solution could be higher than that of vanillyl
esters due to the presence of the carbohydrate moiety which may be the reason for
the difference in the activity in DPPH radical assay. Lipophilization of rutin did not
influence the radical scavenging activity as both rutin and rutin esters showed
similar radical scavenging capacity. Similar patterns were also reported by
Viskupicova et al, (2010) and Lue et al, (2010b). Lipophilization of vanillyl alcohol
however lowered its DPPH˙ scavenging activity. This could be due to the greatly
increased hydrophobicity which may have resulted to decreased solubility in the
tested medium.
Table 3. % antioxidant activity of commercial antioxidants, substrate phenolics and
the synthesized rutin- and vanillyl-PUFA esters as determined by DPPH radical
method.
Compound 1 mM 2 mM
α -tocopherol 92.3 ±0.69 92.6 ±0.71
BHT 65.8 ± 3.75 84.8 ± 0.21
Rutin 91.6 ± 0.57 95.6 ± 0.26
Vanillyl alcohol 87 ± 0.09 90.5 ± 1.48
Rutin-PUFA esters 91.1 ± 0.32
92.2 ± 0.31
Vanillyl-PUFA esters 52.3 ± 0.15 66.1 ±1.71
The antioxidant activity of the prepared lipophilic phenolic derivatives was also
evaluated in two types of media rich in PUFA: an acylglycerol concentrate containing
53% PUFA obtained from enzymatic treatment of fish oil and an emulsion prepared
using the same acylglycerol concentrate. Both the prepared lipophilic derivatives
exhibited antioxidant activity as determined by the TBARS assay. BHT and α-
tocopherol were used as reference antioxidants and the results are presented in
Table 4.
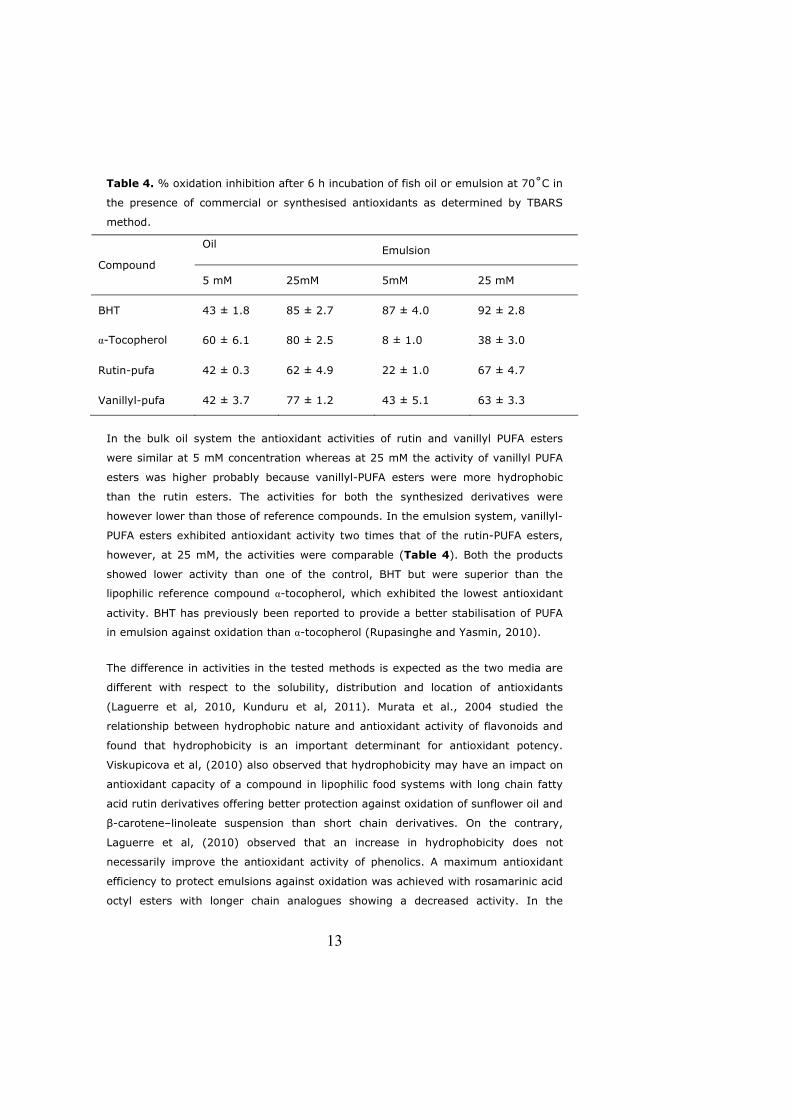
13
Table 4. % oxidation inhibition after 6 h incubation of fish oil or emulsion at 70˚C in
the presence of commercial or synthesised antioxidants as determined by TBARS
method.
Oil Emulsion
Compound 5 mM 25mM 5mM 25 mM
BHT 43 ± 1.8 85 ± 2.7 87 ± 4.0 92 ± 2.8
α-Tocopherol 60 ± 6.1 80 ± 2.5 8 ± 1.0 38 ± 3.0
Rutin-pufa 42 ± 0.3 62 ± 4.9 22 ± 1.0 67 ± 4.7
Vanillyl-pufa 42 ± 3.7 77 ± 1.2 43 ± 5.1 63 ± 3.3
In the bulk oil system the antioxidant activities of rutin and vanillyl PUFA esters
were similar at 5 mM concentration whereas at 25 mM the activity of vanillyl PUFA
esters was higher probably because vanillyl-PUFA esters were more hydrophobic
than the rutin esters. The activities for both the synthesized derivatives were
however lower than those of reference compounds. In the emulsion system, vanillyl-
PUFA esters exhibited antioxidant activity two times that of the rutin-PUFA esters,
however, at 25 mM, the activities were comparable (Table 4). Both the products
showed lower activity than one of the control, BHT but were superior than the
lipophilic reference compound α-tocopherol, which exhibited the lowest antioxidant
activity. BHT has previously been reported to provide a better stabilisation of PUFA
in emulsion against oxidation than α-tocopherol (Rupasinghe and Yasmin, 2010).
The difference in activities in the tested methods is expected as the two media are
different with respect to the solubility, distribution and location of antioxidants
(Laguerre et al, 2010, Kunduru et al, 2011). Murata et al., 2004 studied the
relationship between hydrophobic nature and antioxidant activity of flavonoids and
found that hydrophobicity is an important determinant for antioxidant potency.
Viskupicova et al, (2010) also observed that hydrophobicity may have an impact on
antioxidant capacity of a compound in lipophilic food systems with long chain fatty
acid rutin derivatives offering better protection against oxidation of sunflower oil and
β-carotene–linoleate suspension than short chain derivatives. On the contrary,
Laguerre et al, (2010) observed that an increase in hydrophobicity does not
necessarily improve the antioxidant activity of phenolics. A maximum antioxidant
efficiency to protect emulsions against oxidation was achieved with rosamarinic acid
octyl esters with longer chain analogues showing a decreased activity. In the

14
present study, ranges of products with varying length of the fatty acid chain were
synthesized, which can be a good strategy to assure that at least some molecules
have ideal properties for use in each system.
4. Conclusion
In addition to their health beneficial effects, consumption of omega-3 PUFAs
stimulate oxidation which necessitates their use in presence of an antioxidant. In
this study, esterification of PUFA to natural phenolics resulted in lipophilic esters that
were able to stabilise oil and emulsions against oxidation. Esterification of omega-3
PUFA to natural phenolics which have antioxidant properties thus protects the PUFAs
from oxidation while the PUFA-phenolic derivative carry combined health beneficial
properties of PUFA and the phenolic molecule.
Acknowledgements:
We thank Dr. Carl Grey for guidance in development of the HPLC-ELSD method and
Martin Hedström for LC-MS analysis. The authors are also grateful to Kalles Fisk
from Göterborg for supplying salmon heads.The project is part of the Swedish
International Development Cooperation Agency (SIDA/SAREC) sponsored BIO-EARN
(East African Regional Programme and Research Network for Biotechnology,
Biosafety and Biotechnology Policy development) program.
References:
Akowuah G. A., Zhari G. A., Norhayati I., Mariam A., 2006. HPLC and HPTLC
densitometric determination of andrographolides and antioxidant potential of
Andrographis paniculata. J Food Comp Anal. 19, 118-126.
Ardhaoui M., Falcimaigne A., Ognier S., Engasser J-M, Moussou P., Pauly G., Ghoul
M., 2004. Effect of acyl donor chain length and substitutions pattern on the
enzymatic acylation of flavonoids. J Biotechnol. 110, 265–271.
Calder P. C., 2004. Long-chain n-3 fatty acids and cardiovascular disease: further
evidence and insights. Nutr Res. 24, 761–762.
Esterbauer H., Schaur R. J., Zollner H., 1990. Chemistry and biochemistry of 4-
hydroxynonenal, malonaldehyde and related aldehydes. Free Radic Biol Med. 11,
81–128.

15
Fang J., Vaca L., Valsta L., Mutanen M., 1996. Determination of DNA adducts of
malonaldehyde in humans: Effects of dietary fatty acid composition. Carcinogenesis.
17, 1035–1040.
Figueroa-Espinoza M.-C., Villeneuve P., 2005. Phenolic acids enzymatic
lipophilization. J Agric Food Chem. 53, 2779–2787.
Guyot B., Gueule D., Pina M., Graille J., Farines V., Farines M., 2000. Enzymatic
synthesis of fatty esters in 5-caffeoyl quinic acid. Eur J Lipid Sci Technol. 102, 93–
96.
Haraldsson G. G. and Kristinsson B., 1998. Separation of eicosapentaenoic acid and
docosahexaenoic acid in fish oil by kinetic resolution using lipase. J. Am. Oil Chem.
Soc. 75, 1551–1556.
Hayes D. G., Van Alstine J. M., and Setterwall F., 2000. Urea-based fractionation of
seed oil samples containing fatty acids and acylglycerols of polyunsaturated and
hydroxy fatty acids. J. Am. Oil Chem. Soc. 77, 207–213.
Huber G. M., Rupasinghe V. H. P., Shahidi F., 2009. Inhibition of oxidation of
omega-3 polyunsaturated fatty acids and fish oil by quercetin glycosides. Food
Chem. 117, 290-295.
Iverson F., 1995. Phenolic antioxidants: health protection branch studies on
butylated hydroxyanisole . Cancer Lett. 93, 49-54. 9
Kanjilal S., Kaki S. S., Kotte S. R., Kunduru K. R., Bhamidipati V. S. K., Rao K. B.,
Shiva K., Mannepalli L. K., and Rachapudi B. N. P., 2008. Chemo-enzymatic
synthesis of lipophilic ferulates and their evaluation for antioxidant and antimicrobial
activities. Eur. J. Lipid Sci. Technol. 110, 1175–1182
Kapoor R. and Patil U. K. , 2011. Importance and production of omega-3 fatty acids
from natural sources. International Food Research Journal 18, 491-497.
Kobata K., Kawaguchi M., Watanabe T., 2002. Enzymatic synthesis of a capsinoid by
the acylation of vanillyl alcohol with fatty acid derivatives catalyzed by lipases.
Biosci. Biotechnol. Biochem. 66, 319–327.
Kuduru K. R., Thumu R., Rachapudi B. N. P., and Sanjit K., 2011. Evaluation of the
antioxidant activity of capsiate analogues in polar, nonpolar, and micellar media. J.
Agr. Food Chem. 59, 564-569.
16
Kumar A. R., Swapna H. C., Bhaskar N., Halami P.M., Sachindra N. M., 2010. Effect
of fermentation ensilaging on recovery of oil from fresh water fish viscera. Enzyme
Microb Tech. 46, 9–13.
Laguerre M., Giraldo L. J. L., Lecomte J., Figueroa-Espinoza M.-C., Barea B., Weiss
J., Decker E. A., Villeneuve P., 2010. Relationship between hydrophobicity and
antioxidant ability of phenolipids in emulsion: A parabolic effect of the chain length
of rosmarinate esters. J. Agric. Food Chem. 58, 2869-2876.
Lue, B-M., Guo Z., Glasius M., Xu X ., 2010a. Scalable preparation of high purity
rutin fatty acid esters. J. Am. Oil Chem. Soc. 87, 55–61.
Lue B-M.,,Nielsen N. S., Charlotte J., Lars H., Guo Z., Xu X., 2010b. Antioxidant
properties of modified rutin esters by DPPH, reducing power, iron chelation and
human low density lipoprotein assays. Food Chem. 123, 221-230.
Mbatia B., Adlercreutz D., Adlercreutz P., Mahadhy A., Mulaa F. and Mattiasson B.,
2010a. Enzymatic oil extraction and positional analysis of n-3 fatty acids in Nile
perch and salmon heads. Process Biochem. 45, 815-819.
Mbatia B., Adlercreutz P., Mulaa F. and Mattiasson B., 2010b. Enzymatic enrichment
of omega-3 polyunsaturated fatty acids in Nile perch (Lates niloticus) viscera oil.
Eur. J. Lipid Sci. Technol. 112, 977-984.
Murata Y., Osaki K.-I., Shimoishi Y., Baba N., and Tada M., 2004. Degradation of
ethyl docosahexaenoate by gamma-ray irradiation and suppression of this
degradation by antioxidants. Biosci. Biotechnol. Biochem. 68,743–745.
Oliveira E. B. De, Humeau C., Chebil L., Elaine R. M., Francois D., Maigret B., Ghoul
M., Engasser J-M., 2009. A molecular modelling study to rationalize the
regioselectivity in acylation of flavonoid glycosides catalyzed by Candida antarctica
lipase B. J Mol Catal B-Enzy. 59, 96–105.
Rupasinghe H. P. V., Yasmin A., 2010. Inhibition of oxidation of aqueous emulsions
of omega-3 fatty acids and fish oil by phloretin and phloridzin. Molecules. 15, 251-
258.
Sabally K., Karboune S., St-Louis R. and Kermasha S., 2006. Lipase-catalyzed
transesterification of dihydrocaffeic acid with flaxseed oil for the synthesis of
phenolic lipids. J. Biotechnol. 127, 167-176.
Sabally K., Karboune S., Yeboah F. K. and Kermasha S., 2005. Enzymatic
esterification of dihydrocaffeic acid with linoleyl alcohol in organic solvent media.
Biocatal. Biotransform. 23, 37-44.

17
Silva F. A. M., Borges F., Guimaraes C., Lima J. L. F. C., Matos C., Reis S., 2000.
Phenolic acids and derivatives: studies on the relationship among structure, radical
scavenging activity, and physicochemical parameters. J. Agr. Food Chem. 48, 2122–
2126.
Shahidi F. and Ying Z., 2010 . Novel antioxidants in food quality preservation and
health promotion. Eur. J. Lipid Sci. Technol. 112, 930–940.
Uauy R., Valenzuela A., 2000. Marine oils: the health benefits of n-3 fatty acids.
Nutrition.16, 680–684.
Virto C. and Adlercreutz P., 2000. Lysophosphatidylcholine synthesis with Candida
antarctica lipase B (Novozym 435). Enz. Microb. Tech. 26, 630-635.
Viskupicova J., Martina D., Miroslav O., Tibor L., Ernest S., 2010. Lipophilic rutin
derivatives for antioxidant protection of oil-based foods. Food Chem. 123, 45-50.
Zuta C. P., Simpsona B. K., Chan M. H., and Phillips L., 2003. Concentrating PUFA
from mackerel processing waste. J. Am. Oil chem. Soc. 80, 933-936.


Paper V


1
Improved utilization of fish waste by anaerobic digestion following omega-3 fatty acids extraction Nges Ivo Achu*, Betty Mbatia and Lovisa Björnsson Department of Biotechnology, Lund University, P.O. Box 124, SE-22100 Lund, Sweden *Corresponding author: [email protected]. Tel.: +46462228347. Fax: +46462224713
ABSTRACT
Fish waste is a potentially valuable resource that can be used to harness high value
products. Following an enzymatic pre-treatment to extract fish oil and fish protein
hydrolysate, anaerobic digestion of the remaining fraction (fish sludge) and the
original fish waste were evaluated for methane production. Results showed high
biodegradability of both fish sludge and fish waste with specific methane yields of
742 and 828 m3 CH4/ton VS added respectively. However, chemical analyses
showed high concentrations of light metals which together with high fat and protein
content could be inhibitory to methanogenic bacteria. The feasibility of co-digesting
the fish sludge with a carbohydrate-rich residue from crop production was
demonstrated, and a full scale process was outlined, converting all parts of a smelly
fish waste to useful products.
Keywords: Jerusalem artichoke, salmon waste, biogas
1. Introduction
The Food and Agricultural Organisation (FAO, 2005), puts the annual world fish
harvest at 140 million tonnes, captured by commercial fishing in the wild fisheries
and fish farms. Fish processing generates considerable quantity of waste in the form
of edible and non-edible by-products. Considering 45% of the live weight to be the
waste, it can be estimated that nearly 64 million tonnes of fish waste are generated
annually (Rai et al., 2010). This waste is mainly composed of heads, viscera, bones
and scales and is rich in lipids and proteins. Oxidation of the unsaturated fatty acids
present in the lipids is the major factor responsible for the offensive odors
associated with fish and fish waste (Rai et al., 2010). Fish waste is often
underutilized (Berge, 2007) and mainly used in the production of low value animal
feed products such as fish meal or fish silage (Crexi et al., 2009; Liaset and Espe,
2008). Arvanitoyannis and Kassaveti (2008) reported that also highly valuable
compounds such as fish oils, biodiesel from fish oils, enzymes, omega-3 fatty acids
and proteins can be obtained from fish waste. Much work has been done on the

2
extraction and purification of omega-3 polyunsaturated fatty acids (PUFA) from fish
waste (Liaset and Espe, 2008; Linder et al., 2005; Mbatia et al., 2010a). PUFA are
mainly present in marine oils and are associated with a several health benefits
(Mozaffarian et al., 2010; Patel et al., 2010). The potential of using the soluble
proteins or fish protein hydrolysate (FPH) for microbiological media has also been
reported (Aspmo et al., 2005; Klompong et al., 2009). Extraction of PUFA and FPH
from fish waste will however also leave a waste product which has to be properly
handled.
Salmon (Salmo salar) heads have been used to represent oil rich fish waste (Mbatia
et al., 2010a). Salmon constituted just over a million tonnes of the world fish
harvest in 2006 (Gebauer and Eikebrokk, 2006). In a typical automated filleting line,
the fillets count for approximately 59-63% of the total wet weight in a salmon with
body weight of 5-6 kg (Liaset and Espe, 2008), hence about half a million tones of
salmon waste is generated annually. Oils were extracted and PUFA enriched by
enzymatic hydrolysis as described by (Mbatia et al., 2010a; Mbatia et al., 2010b).
The extraction method applied also allowed straightforward removal of FPH, which
was used for as an additive for Lactobacillus sp growth media. The residual product,
called the fish sludge, was used for biogas production through anaerobic digestion
(AD). As a comparison, the original fish waste was also investigated for biogas
production.
AD is a technology that has been used for waste treatment and biogas recovery
from many types of waste. Its numerous advantages such as the recovery of a
renewable energy carrier, waste volume reduction and odour reduction are well
documented (Parawira et al., 2008; Wu et al., 2009). Plant nutrients such as
nitrogen and phosphorous are retained in the effluent (digestate) after AD, which
could be used as a biofertilizer in agricultural production, provided it meets the
required standards. The digestate heavy metals content is regulated by different
certification schemes in different countries (e.g. SP, 2010). Also, legislation
regarding handling of animal by-products may be applicable, which in the EU can
involve heat treatment with a minimal particle size of 12 mm at 70 ˚C for 1 hour (EC
regulation No 178/2002 with amendment 208/2006).
Waste like fish waste and fish sludge, which are rich in lipids and proteins, have the
advantage of giving high methane yields, and can be attractive as substrates in an
AD process (Cirne et al., 2007). At the same time, these waste types also have
properties that make them less suitable for anaerobic microbial degradation;

3
-free long chain fatty acids (LCFA) can inhibit methanogenesis (Cirne et al., 2007;
Pereira et al., 2005).
-protein degradation will cause high concentrations of free ammonia in the process,
which might inhibit aceticlastic methanogenesis (Schnurer and Nordberg, 2008).
-High concentrations of light metals such as calcium, sodium, potassium and
magnesium are known to be inhibitory to methanogens (Chen et al., 2008).
Anaerobic digestion of protein-rich substrates such as meat and bone has been
reported (Wu et al., 2009). A few studies have been done on biogas production from
fish related waste, like sludge from saline fish farming and sludge from salmon
farming (Arvanitoyannis and Kassaveti, 2008; Gebauer, 2004; Gebauer and
Eikebrokk, 2006). Gumisiriza et al. (2009) and Mshandete et al. (2004) attributed
poor results in AD of fish residues to the inhibitory effects of lipids and ammonia,
and investigated co-digestion as an alternative. In this study, as a strategy to avoid
inhibition by free ammonia (FA), LCFA and light metal ions, the possibility of co-
digestion with biomass with a low content of the above compounds was
investigated. The above ground part of Jerusalem artichoke was chosen to represent
a residual biomass from crop cultivation, which is typically high in carbohydrates but
low in fats, protein and salts.
In this study, as a step further from oils (PUFA) and FPH extraction, the potential of
full utilization of the fish waste was evaluated. The study aims at evaluating the
possibilities and limitations of using fish waste and fish sludge as substrates for
biogas production. The evaluation was done through biochemical methane potential
tests, chemical analyses and calculations based on the experimental data. The
overall aim was to explore a biorefinery approach, in extraction of multiple products
from waste, taking advantage of the differences in biomass components and
intermediates, while limiting waste production (Lopez et al., 2010).
2. Materials and methods
2.1 Substrates and inoculum
2.1.1 Fish waste and fish sludge
The salmon heads were minced and homogenised with a grinder (GM 200, Retsch
GmbH, Germany). This fraction, the fish waste, was investigated for biogas
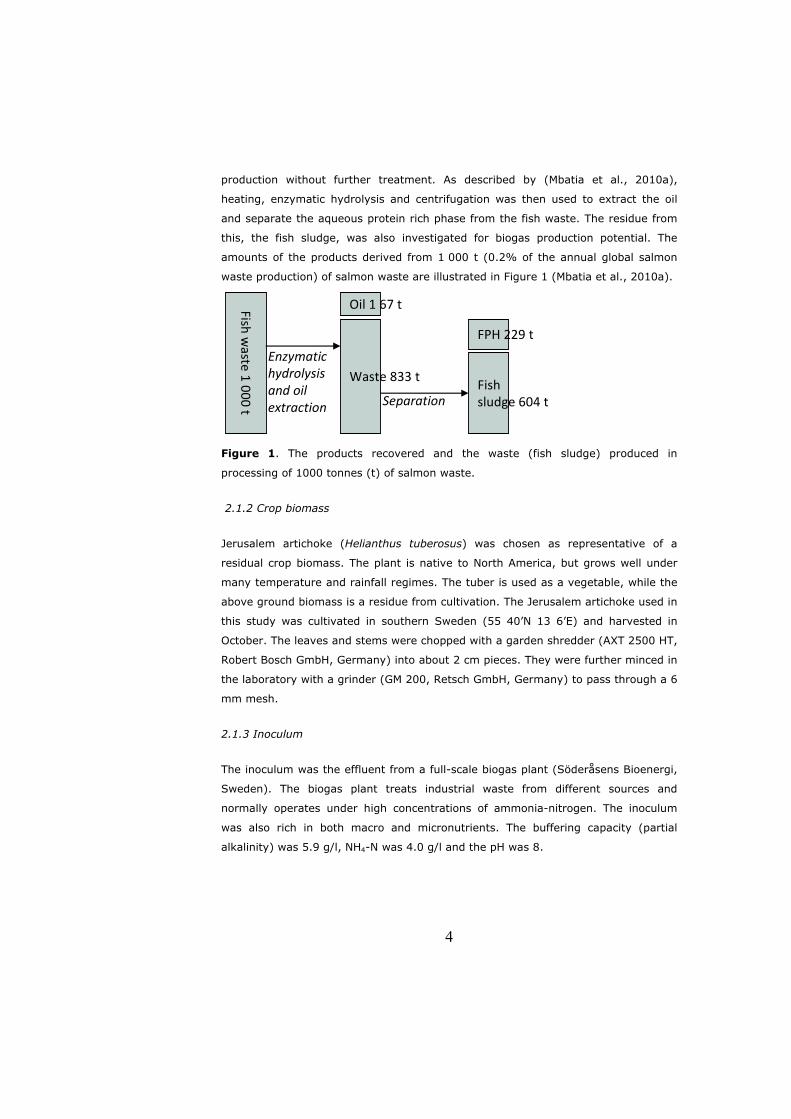
4
production without further treatment. As described by (Mbatia et al., 2010a),
heating, enzymatic hydrolysis and centrifugation was then used to extract the oil
and separate the aqueous protein rich phase from the fish waste. The residue from
this, the fish sludge, was also investigated for biogas production potential. The
amounts of the products derived from 1 000 t (0.2% of the annual global salmon
waste production) of salmon waste are illustrated in Figure 1 (Mbatia et al., 2010a).
Figure 1. The products recovered and the waste (fish sludge) produced in
processing of 1000 tonnes (t) of salmon waste.
2.1.2 Crop biomass
Jerusalem artichoke (Helianthus tuberosus) was chosen as representative of a
residual crop biomass. The plant is native to North America, but grows well under
many temperature and rainfall regimes. The tuber is used as a vegetable, while the
above ground biomass is a residue from cultivation. The Jerusalem artichoke used in
this study was cultivated in southern Sweden (55 40’N 13 6’E) and harvested in
October. The leaves and stems were chopped with a garden shredder (AXT 2500 HT,
Robert Bosch GmbH, Germany) into about 2 cm pieces. They were further minced in
the laboratory with a grinder (GM 200, Retsch GmbH, Germany) to pass through a 6
mm mesh.
2.1.3 Inoculum
The inoculum was the effluent from a full-scale biogas plant (Söderåsens Bioenergi,
Sweden). The biogas plant treats industrial waste from different sources and
normally operates under high concentrations of ammonia-nitrogen. The inoculum
was also rich in both macro and micronutrients. The buffering capacity (partial
alkalinity) was 5.9 g/l, NH4-N was 4.0 g/l and the pH was 8.
Fish waste 1 000 t
Enzymatic hydrolysis and oil extraction
Oil 1 67 t
Waste 833 tFish sludge 604 t
FPH 229 t
Separation

5
2.2 Biochemical methane potential assay
The biochemical methane potential (BMP) was determined as previously described
by (Kreuger, 2011). Exceptions were that 37 ˚C was used as the digestion
temperature, 300 mL of inoculum was used per assay, the control was crystalline
cellulose (Avicel PH-101, Sigma-Aldrich, St. Louis, MO, USA) and no nutrients were
added to the assays. During the experiment, gas composition and total gas volume
were monitored every other day. Ammoniacal-nitrogen and pH were determined at
the end of the experiment. The experiments were terminated after 33 days of
incubation.
In laboratory triplicates, fish waste, fish sludge and Jerusalem artichoke were
digested separately, and the fish sludge was co-digested with Jerusalem artichoke in
ratios 1:1 and 1:3 based on the content of organic material measured as volatile
solids (VS). All gas volumes are given as dry gas normalised to standard
temperature and pressure (0 ˚C, 1 atm) and the methane yield is reported as
normalized volume of methane per added amount of VS of each substrate or
substrate mixes.
2.3 Analytical methods
Total solid (TS), VS and pH were determined according to standard methods (APHA,
1995). Total nitrogen, macrominerals and light metals (S, P, K, Na, Ca, Mg), and
heavy metals (Zn, Ni, Cr, Pb, Cd, Cu, Hg) were analysed by Kjelldahl, ICP-OES
(inductively coupled plasma–optical emission spectrometer) and ICP-MS (inductively
coupled plasma–mass spectrometer) respectively by LMI AB (Helsingborg, Sweden).
The ammonia concentrations were measured with the Dr Lange test kit LCK 303 (Dr.
Bruno Lange GmbH, Dusseldorf, Germany) after diluting a 0.45 μm filtered sample
to fall within the detection range. Biogas composition was determined by gas
chromatography as described elsewhere (Parawira et al., 2008). Total gas volume
was measured using a graduated 100-ml gas-tight glass syringe with a sample lock
(Fortuna, Germany).
2.4 Calculations
The non-ionised fraction of the ammoniacal nitrogen (free ammonia) was calculated
as described elsewhere (Angelidaki and Ahring, 1993).

6
Based on the experimentally determined methane yields and the chemical analyses,
calculations were made to illustrate the potential full scale conditions in an anaerobic
co-digestion process. The mass loss and VS-reduction during digestion was
calculated by subtraction of the total mass of CH4 and CO2 formed, these latter
quantified by using the experimentally determined methane yields. The potential
loss from other compounds, e.g H2O, H2S, NH3, through the raw gas was assumed to
be negligible. These gases would hence influence the results very little and were not
included in the calculations. This means that all minerals in the ingoing substrate
remained in the effluent, the biofertilizer. The only change was that organically
bound nitrogen was partly mineralized. The degree of mineralization of organically
bound nitrogen was assumed to be equal to the degree of VS degradation. The
lower heating value (9.97 kWh/m3) was used to convert normalized methane
volumes to energy units.
2.5 Statistical analyses
A significance test (one-way ANOVA P = 0.05) was performed to verify if co-
digestion led to any significant difference in methane yield in the batch experiments.
Grubb´s test (P = 0.05) was used to make certain there were no outliers in the
batch test replicates and a t-Test (P = 0.05) was performed to compare the means
in the batch experiments.
3. Results and discussions
3.1 Material flow and chemical analyses
The amount of residual fish sludge extracted from fish waste is outlined in Figure 1.
The fish sludge made up about 60% of the total amount after removal of fish oil and
FPH. The analyzed parameters for the investigated materials and the inoculum are
shown in Table 1. The fish sludge retained 52 and 49% of the TS and VS of the
original fish waste respectively, hence the amount of remaining waste after
extraction of oil and FPH is significant. Table 1 shows the very high nitrogen
concentration of both fish sludge and fish waste as compared to that of a crop
residue (Jerusalem artichoke) and the concentration in the effluent from a large
scale biogas process (inoculum). Already this parameter shows that it is not possible
to digest either of these substrates (fish waste and fish sludge) alone in a biogas
process due to the very high ammonia-nitrogen concentrations that will occur. The
concentrations of light metals are also high, while heavy metals with the exception

7
of zinc, which could jeopardize the biofertilizer quality, are not higher than in the
investigated crop and biogas effluent samples.
Table 1 Characteristic of substrates and inoculum used in the anaerobic
degradation trials
Variables Inoculum Fish waste Fish sludge J. artichoke
TS (%) 3.7 41.2 37.7 24.7
VS (%) 2.0 35.5 31.4 21.7
Concentrations (mg/kg wet weight)
N 8010 23800 26100 5340
P 440 7700 8700 380
S 360 1800 1900 280
K 1200 1600 1500 1430
Na 1500 1800 1800 64
Ca 760 11000 13000 6170
Mg 66 380 410 1480
Cd 0.02 0.01 0.03 0.09
Pb 0.3 0.3 0.2 0.5
Zn 8.6 88 71 4.8
Ni 0.50 0.06 0.17 0.23
Cr 0.49 0.29 0.25 0.15
Cu 4.00 0.90 0.91 1.24
Hg <0.01 0.02 0.03 0.01
3.2 Biochemical methane potential
The characteristic pungent smell that can emanate from fish was completely absent
in the BMP assays after digestion. The pungent smell from fish waste has been
blamed on the oxidation of unsaturated fatty acids (Rai et al., 2010), and oil
extraction (Mbatia et al., 2010a) followed by a further biodegradation step could be
expected to greatly reduce the smell.
3.2.1 Digestion of Jerusalem artichoke, fish waste and fish sludge
The extent of conversion of various substrates in terms of methane yield is shown in
Figure 2. Jerusalem artichoke showed the lowest methane yield amongst the
investigated feedstocks (283 ± 14 m3 CH4/ton VS added, corresponding to 61 ± 3 m3
CH4/ton WW added). Gunnarson et al. (1985) achieved 315 m3 CH4/ton VS added in
the anaerobic digestion of the above the ground part of Jerusalem artichoke. The
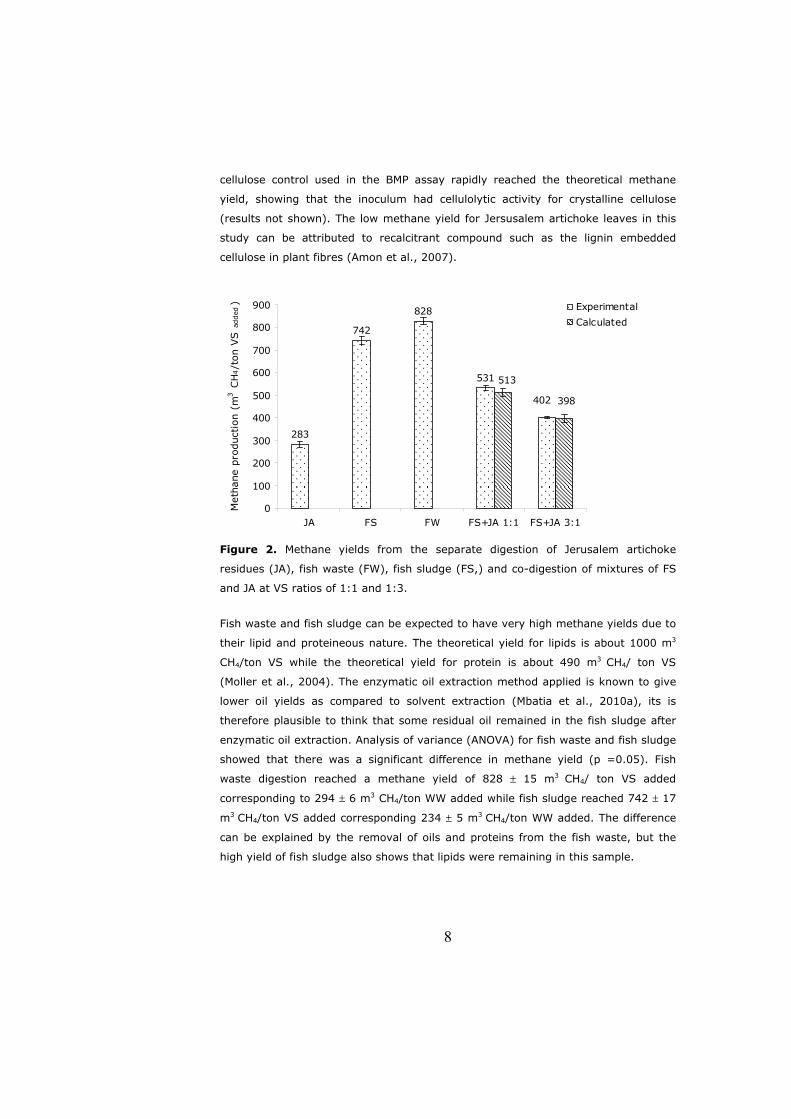
8
cellulose control used in the BMP assay rapidly reached the theoretical methane
yield, showing that the inoculum had cellulolytic activity for crystalline cellulose
(results not shown). The low methane yield for Jersusalem artichoke leaves in this
study can be attributed to recalcitrant compound such as the lignin embedded
cellulose in plant fibres (Amon et al., 2007).
283
742
828
531
402
513
398
0
100
200
300
400
500
600
700
800
900
JA FS FW FS+JA 1:1 FS+JA 3:1
Met
hane
pro
duct
ion
(m3 C
H4/t
on V
S a
dded
) ExperimentalCalculated
Figure 2. Methane yields from the separate digestion of Jerusalem artichoke
residues (JA), fish waste (FW), fish sludge (FS,) and co-digestion of mixtures of FS
and JA at VS ratios of 1:1 and 1:3.
Fish waste and fish sludge can be expected to have very high methane yields due to
their lipid and proteineous nature. The theoretical yield for lipids is about 1000 m3
CH4/ton VS while the theoretical yield for protein is about 490 m3 CH4/ ton VS
(Moller et al., 2004). The enzymatic oil extraction method applied is known to give
lower oil yields as compared to solvent extraction (Mbatia et al., 2010a), its is
therefore plausible to think that some residual oil remained in the fish sludge after
enzymatic oil extraction. Analysis of variance (ANOVA) for fish waste and fish sludge
showed that there was a significant difference in methane yield (p =0.05). Fish
waste digestion reached a methane yield of 828 ± 15 m3 CH4/ ton VS added
corresponding to 294 ± 6 m3 CH4/ton WW added while fish sludge reached 742 ± 17
m3 CH4/ton VS added corresponding 234 ± 5 m3 CH4/ton WW added. The difference
can be explained by the removal of oils and proteins from the fish waste, but the
high yield of fish sludge also shows that lipids were remaining in this sample.

9
In other studies on the AD of fish residues, inhibiting conditions, and resulting low
methane yields have been reported. Gebauer and Eikebrokk (2006) reported
methane yields in the range of 260-280 m3 CH4/ton VS added in the mesophilic
treatment of salmon sludge (generated from salmon farming). Low yields were
attributed to high concentrations of VFAs and ammonia, a condition reported
elsewhere as inhibited steady-state (Angelidaki and Ahring, 1993). Also, poor
methane yields have been reported by Gebauer (2004) as due to high
concentrations of sodium and ammonia. The methane yield reported by Mshandete
et al. (2004) for fish waste was 390 m3 CH4/VS, lower than the theoretical yield of
proteinous substrate (Moller et al., 2004), the authors commented on the inoculum
to substrate ratio as reason for the low yield. The high methane yield in the present
study indicates that the BMP assay was probably performed under non-inhibited
conditions.
3.2.2 Co-digestion of fish sludge and Jerusalem artichoke
The methane yields from the co-digestions of fish sludge and Jerusalem artichoke
residues are shown in Figure 2. The figure also shows the expected methane yield
calculated from the individual digestion of fish sludge and Jerusalem artichoke. Co-
digestion might lead to either synergism or antagonism. Synergism is occurs when
an additional substrate e.g. contributes essential nutrients needed for bacterial
growth, or dilutes the toxic effect of already present compounds. In antagonism, the
toxic effect of a compound is further exacerbated by the addition another
compound. In this study, co-digestion did not readily lead to either synergism or
antagonism. Analysis of variance (ANOVA) for methane yield for the 1:1 and 1:3
VS-ratios of fish sludge/Jerusalem artichoke combinations experimented and
calculated from the individual yields showed that there were no significant
differences (p = 0.05). The experimented yield for the 1:1 mixture was 531 ± 10 m3
CH4/ton VS added as compared to 402 ± 3 m3 CH4/ton VS added for the 1:3 mix of
fish sludge/Jerusalem artichoke combination. If co-digestion trials would have shown
higher methane yields that those calculated from digestion of the individual
substrates, inhibition in the individual digestion of fish sludge could have been
suspected, but this observation further supports the fact that no inhibition occurred
in the BMP assays.
The average CH4 content of the biogas produced from the 1:1 and 1:3 co-digestion
trials were 70% and 67% respectively. These values are higher than those normally
obtained from conventional anaerobic digestion of organic waste conducted in single

10
stage-slurry digesters (Samani, 2001). This is due to the high methane content in
the biogas from the fish residues, 75-80%, which improves the methane
concentration typical for a carbohydrate dominated waste like Jerusalem artichoke
(50-60%).
3.3 Limitations of using fish residues as substrate for biogas production
The potential problems of using fish waste/fish sludge as substrate in biogas
production can not be fully demonstrated in a BPM assay, where the substrate is
mixed with a high amount of inoculum. The chemical analysis of the waste in
combination with interpretations of results from the BMP assay will however allow
for an analysis of the problems that might occur.
3.3.1 Ammonia inhibition
Ammonia is produced through biological degradation of protein-rich material.
Ammonium, NH4+, and free ammonia (FA), NH3, are the principal forms of inorganic
ammoniacal-nitrogen in aqueous solution. FA has been suggested to be the main
cause of inhibition since it is freely membrane permeable (Chen et al., 2008). The
hydrophobic molecule may diffuse passively into the cell, causing proton imbalance
and or potassium deficiency (Chen et al., 2008).
The inoculum had an ammoniacal-N concentration of 4.0 g/l at a pH of 8. A rapid
methane production from the control substrate in the BMP assay (the crystalline
cellulose) indicated that the inoculum was well adapted for degradation under high
concentration of FA (results not shown). The fish sludge had a total nitrogen
concentration of 26.1 g/kg (Table 1), but the measured concentration of
ammoniacal nitrogen after the BMP assay was only 4.2 g/kg since the inoculum was
added in large excess to the FS. The calculated FA at completion of the BMP assay
was 532 mg/l (Angelidaki and Ahring, 1993). This is a relatively high value and can
be inhibitory, especially in non acclimated systems. In non acclimated systems, a
free ammonia level of 150 mg/l can cause growth inhibition but acclimated system
can withstand up to 1100 mg/l free ammonia levels, an adaptation attributed to a
shift in the microbial degradation pathway (Hansen et al., 1998; Schnürer and
Nordberg, 2008). In designing and operating an anaerobic digestion process, a
substrate contributing with so much nitrogen must be added with care not to cause
free ammonia inhibition.

11
3.3.2 Light metals
The fish sludge abounds in light metals such as sodium, potassium and calcium with
calcium concentrations as high as 13 g/l (Table 1). Generally, high salt
concentrations may dehydrate bacterial cells due to osmotic pressure though
microbes in saline environment have been reported to accumulate or synthesize
substances (osmolytes) which might aid in water retention in the cells. Though
moderate levels of sodium (100-200 mg/l) are beneficiary to the anaerobes as in
formation of ATP and oxidation of NADH, high levels can be detrimental. High levels
of potassium for example may facilitate the passive influx of K+ thereby neutralizing
membrane potential (Chen et al., 2008). This may negatively impact on the
membrane integrity thereby jeopardizing transport, protective and nutritional
functionalities. The high concentration of calcium in fish sludge means that
carbonates and phosphate may be precipitated leading to loss in buffering capacity,
scaling of reactors pipes, scaling of biomass hence reducing specific activity.
3.3.3 Long chain fatty acid (LCFA) inhibition
Fish waste abounds in oils or lipids (Figure 1). The lipid concentration in the fish
sludge was not analyzed, but the presence of good amounts of lipids is evident by
the high methane yield (Figure 2). Lipid degradation products, LCFA, have been
reported to severely inhibit methanogenesis (Cirne et al., 2007; Luostarinen et al.,
2009). This inhibition though reversible is mainly due to adsorption of LCFA to
bacterial biomass, causing floatation and precipitation. This creates a physical
barrier and hinders the transfer of substrates and products, leading to a delay in the
initial methane production rate (Pereira et al., 2005). Due to this, substrate with
high amounts of lipids are attractive due to the high methane yields, but must be
blended with other types of substrates.
3.4 Features of a biogas process using fish sludge
To illustrate that a feasible biogas process can be designed to utilize fish sludge as
feedstock, calculations were made based on the laboratory scale results. The
calculation was based on the annual processing of 1 000 t fish waste, creating 604 t
fish sludge after extraction of the oils and FPH (Figure 1). This fish sludge was
mixed with Jerusalem artichoke in the experimentally investigated ratio of 1:3 based
on the VS content. This means that 2 620 t of the leaves and stems of Jerusalem
artichoke should be added per year (Figure 3). In Table 2, the experimentally
achieved input data are summarized, and the calculated outputs for a process are

12
outlined. The selected process for calculations was a one stage continuous stirred
tank reactor, which ideally mixed gives concentrations in the reactor equal to
concentrations in the outflow. The organic loading rate was set to 3 kg VS/m3, d,
which is normal for a co-digestion process, and the TS in the reactor was set to a
maximum of 8%. At reactor TS of 9% and above, increases in viscosity has been
observed, making proper mixing of the reactor content difficult (FNR, 2010).
Figure 3. A feasible anaerobic digestion process for the fish sludge remaining from
extraction of high-value products from 1 000 t fish waste as shown in Figure 1.
The calculated outputs called scenario A in Table 2 are with addition of the above
mentioned substrates only. The effluent concentration in scenario A, which also
represents the concentrations in the reactor, of both TS and ammoniacal nitrogen
will then be too high, 12.5% and 8.6 g/l respectively. In scenario B, water is added
to reach the preconditioned limit of 8% TS in the reactor. This causes a dilution to
5.5 g/l ammoniacal nitrogen. This is within the range where the microbial consortia
will be influenced by FA, but the process is likely to be feasible (Schnürer and
Nordberg, 2008). Adding water but keeping the reactor volume constant will
decrease the hydraulic retention time from scenario A to B, but the resulting 53
days is satisfactory and likely to give a stable and high methane production also in
combination with a high FA concentration (Schnürer and Nordberg, 2008). Figure 3
shows the total input and output in a co-digestion process that enables
biodegradation of the fish sludge under non-inhibited conditions. The produced 538
ton, or 466 000 m3, of biogas has a calculated methane content of 65%, and an
energy content of 3 GWh, or close to 300 m3 diesel per year.
Fish sludge 604 t
Crop residues 2 620 t
Anaerobic digestion
Biofertilizer 4 206 t
Water 1 520 t
Biogas 538 t

13
Table 2. Input and output data for a calculated process based on experimental
data.
Input data
Fish sludge
Jerusalem artichoke
Amount (t/year) 604 2 620
Amount (t VS/year) 190 570
Methane yield (Nm3/t VS) 742 283
Methane content in biogas (%) 79 55
Outputs Scenario
A
B
Methane production (MWh/year) 3 007
Methane content in biogas (%) 65
Active reactor volume (m3) 690
Hydraulic retention time (d) 78 53
Effluent (biofertilizer)
Amount (t/year) 2 690 4 210
TS (%) 12.5 8.0
Ammoniacal nitrogen (g/l) 8.6 5.5
Process water addition (t/year) - 1 520
In Table 3, the calculated composition of the effluent from the biogas process based
on scenario B is summarized. The heavy metal content meets in all cases the given
guidelines, allowing certification of the effluent as an approved biofertilizer according
to Swedish regulations (SP, 2010). The content of ammonia-nitrogen, P and K are in
line with or higher than that of e.g. swine or cattle manure, which should make this
effluent an attractive biofertilizer. However, waste of animal origin must also meet
the demands on hygienic quality, which can be achieved by treating the waste at 70
˚C for 1 hour. Alternative treatment with proven similar effects on pathogen
reduction can also be approved, and 55 ˚C for 10 hours is one suggested
alternative. During oil extraction (Mbatia et al., 2010a) the fish waste was
pretreated at 55 ˚C for 1 hour, and prolonging the holding time did not affect the oil
yield. The holding time could thus be extended to 10 hours in this extraction step, to
ensure that the hygienic quality standard is met, and no separate hygienization
would be needed. All together, the biofertilizer produced in the suggested process is
deemed to be an attractive high quality product.

14
Table 3. Characteristics of the effluent (bio-fertilizer) for a calculated full scale AD
process. Values in brackets: maximum concentrations for certification of biogas
plant effluent as biofertilizer (SP, 2010).
4. Conclusion
The study demonstrates how all the different components of fish waste can be
converted to useful products. The fish sludge is through anaerobic digestion
converted from a smelly residue to a renewable energy carrier and a high quality
biofertilizer. The fish sludge could, however, not be digested alone due to the
demonstrated high content of potentially inhibitory compounds. Co-digestion, in this
study exemplified with a residue from crop production, could mitigate the inhibitory
effect of FA, light metals and LCFAs as these inhibitors are degraded or diluted to
acceptable levels.
Acknowledgements
The funding from Swedish International Development Cooperation Agency
(SIDA/SAREC) and the faculty of engineering at Lund University are gratefully
Parameters Biofertilizer scenario B
TS (%) 8.0
VS (%) 5.2
Concentrations (mg/kg wet weight)
Ntot 7100
NH4-N 5500
P 1500
S 450
K 1100
Na 290
Ca 5710
Mg 980
Cd 0.06 (0.08)
Pb 0.35 (8.0)
Zn 13.2 (64)
Ni 0.17 (4.0)
Cr 0.13 (8.0)
Cu 0.90 (48)
Hg 0.01 (0.08)

15
acknowledged. Kalles Fisk Göterborg, Sweden is also acknowledged for supplying
fish heads.
References
Amon T., Amon B., Kryvoruchko V., Zollitsch W., Mayer K., Gruber L. (2007) Biogas
production from maize and dairy cattle manure - Influence of biomass composition
on the methane yield. Agriculture Ecosystems & Environment 118:173-182.
Angelidaki I., Ahring B.K. (1993) Thermophilic anaerobic digestion of livestock waste
- the effect of ammonia. Applied Microbiology and Biotechnology 38:560-564.
Arvanitoyannis I.S., Kassaveti A. (2008) Fish industry waste: treatments,
environmental impacts, current and potential uses. International Journal of Food
Science and Technology 43:726-745.
Aspmo S.I., Horn S.J., Eijsink V.G.H. (2005) Hydrolysates from Atlantic cod (Gadus
morhua L.) viscera as components of microbial growth media. Process Biochemistry
40:3714-3722.
Berge J.-P. (2007) For a better use of marine by-products and wastes. FAO Fisheries
Report 819:103-110.
Chen Y., Cheng J.J., Creamer K.S. (2008) Inhibition of anaerobic digestion process:
A review. Bioresource Technology 99:4044-4064.
Cirne D.G., Paloumet X., Bjornsson L., Alves M.M., Mattiasson B. (2007) Anaerobic
digestion of lipid-rich waste - Effects of lipid concentration. Renewable Energy
32:965-975.
Crexi V.T., Souza-Soares L.A., Pinto L.A.A. (2009) Carp (Cyprinus carpio) oils
obtained by fishmeal and ensilage processes: characteristics and lipid profiles.
International Journal of Food Science and Technology 44:1642-1648..
FAO. (2005) Review of the scale of world marine fishery resources. FAO Fisheries
Technical Paper.
FNR. (2010) Biogas-messprogram II. Report (German) Fachagentur Nachwachsende
Rohstoffe e.V., Gulzow, Germany.
Gebauer R. (2004) Mesophilic anaerobic treatment of sludge from saline fish farm
effluents with biogas production. Bioresource Technology 93:155-167.
Gebauer R., Eikebrokk B. (2006) Mesophilic anaerobic treatment of sludge from
salmon smolt hatching. Bioresource Technology 97:2389-2401.

16
Gumisiriza R., Mshandete A.M., Rubindamayugi M.S.T., Kansiime F., Kivaisi A.K.
(2009) Enhancement of anaerobic digestion of Nile perch fish processing
wastewater. African Journal of Biotechnology 8:328-333.
Gunnarson S., Malmberg A., Mathisen B., Theander O., Thyselius L., Wunsche U.
(1985) JERUSALEM ARTICHOKE (Helianthus-tuberosus l) FOR BIOGAS
PRODUCTION. Biomass 7:85-97.
Hansen K.H., Angelidaki I., Ahring B.K. (1998) Anaerobic digestion of swine
manure: Inhibition by ammonia. Water Research 32:5-12.
Klompong V., Benjakul S., Kantachote D., Shahidi F. (2009) Characteristics and Use
of Yellow Stripe Trevally Hydrolysate as Culture Media. Journal of Food Science
74:S219-S225.
Kreuger E., Sipos, B., Zacchi, G., Svensson, S-E. and Björnsson, L. (2011)
Bioconversion of industrial hemp to ethanol and methane: The benefits of steam
pre-treatment and co-production. Bioresource Technology 102:3457-3465.
Liaset B., Espe M. (2008) Nutritional composition of soluble and insoluble fractions
obtained by enzymatic hydrolysis of fish-raw materials. Process Biochemistry 43:42-
48.
Linder M., Fanni J., Parmentier M. (2005) Proteolytic extraction of salmon oil and
PUFA concentration by lipases. Marine Biotechnology 7:70-76.
Lopez J.A.S., Li Q., Thompson I.P. (2010) Biorefinery of waste orange peel. Critical
Reviews in Biotechnology 30:63-69.
Luostarinen S., Luste S., Sillanpaa M. (2009) Increased biogas production at
wastewater treatment plants through co-digestion of sewage sludge with grease
trap sludge from a meat processing plant. Bioresource Technology 100:79-85.
Mbatia B., Adlercreutz P., Mulaa F., Mattiasson B. (2010a) Enzymatic enrichment of
omega-3 polyunsaturated fatty acids in Nile perch (Lates niloticus) viscera oil.
European Journal of Lipid Science and Technology 112:977-984.
Mbatia B., Adlercreutz D., Adlercreutz P., Mahadhy A., Mulaa F., Mattiasson B.
(2010b) Enzymatic oil extraction and positional analysis of omega-3 fatty acids in
Nile perch and salmon heads. Process Biochemistry 45:815-819.
Moller H.B., Sommer S.G., Ahring B. (2004) Methane productivity of manure, straw
and solid fractions of manure. Biomass & Bioenergy 26:485-495.

17
Mozaffarian D., Micha R., Wallace S. (2010) Effects on Coronary Heart Disease of
Increasing Polyunsaturated Fat in Place of Saturated Fat: A Systematic Review and
Meta-Analysis of Randomized Controlled Trials. Plos Medicine 7.
Mshandete A., Kivaisi A., Rubindamayugi M., Mattiasson B. (2004) Anaerobic batch
co-digestion of sisal pulp and fish wastes. Bioresource Technology 95:19-24.
Parawira W., Read J.S., Mattiasson B., Bjornsson L. (2008) Energy production from
agricultural residues: High methane yields in pilot-scale two-stage anaerobic
digestion. Biomass & Bioenergy 32:44-50.
Patel J.V., Tracey I., Hughes E.A., Lip G.Y. (2010) Omega-3 polyunsaturated acids
and cardiovascular disease: notable ethnic differences or unfulfilled promise? Journal
of Thrombosis and Haemostasis 8:2095-2104.
Pereira M.A., Pires O.C., Mota M., Alves M.M. (2005) Anaerobic biodegradation of
oleic and palmitic acids: Evidence of mass transfer limitations caused by long chain
fatty acid accumulation onto the anaerobic sludge. Biotechnology and
Bioengineering 92:15-23.
Rai A.K., Swapna H.C., Bhaskar N., Halami P.M., Sachindra N.M. (2010) Effect of
fermentation ensilaging on recovery of oil from fresh water fish viscera. Enzyme and
Microbial Technology 46:9-13.
Samani Z., Yu, W.H., Hanson, A. (2001) Energy production fom segregated
municipal waste using bi-phasic anaerobic digestion. In: Van Velsen, A.F.M.,
Verstraete, W.H., (Eds), Anaerobic conversion for sustainability. Proceedings 9th
World Congress Anaerobic Digestion, Antwerpen, Belgium.195-197.
Schnurer A., Nordberg A. (2008) Ammonia, a selective agent for methane
production by syntrophic acetate oxidation at mesophilic temperature. Water
Science and Technology 57:735-740.
SP. (2010) SPCR 120-Certification rules for digestate from biowaste by the quality
assurance system of Swedish Waste Management (in Swedish). SP technical
research institute of Sweden, Borås. May2010. http://www-
v2.sp.se/publ/user/default.aspx?RapportId=7335#7335. Accessed 110201.
Wu G.X., Healy M.G., Zhan X.M. (2009) Effect of the solid content on anaerobic
digestion of meat and bone meal. Bioresource Technology 100:4326-4331.