Embed Size (px)
Citation preview
Validity of a PCI Bleeding Risk Scorein patient subsets stratified for bodymass index
David R Dobies,1 Kimberly R Barber,2 Amanda L Cohoon3
To cite: Dobies DR,Barber KR, Cohoon AL.Validity of a PCI BleedingRisk Score in patient subsetsstratified for body massindex. Open Heart 2015;2:e000088. doi:10.1136/openhrt-2014-000088
Received 27 March 2014Revised 24 November 2014Accepted 12 January 2015
1Regional CardiologyAssociates, Grand Blanc,Michigan, USA2Genesys Regional MedicalCenter, Office of Research,Grand Blanc, Michigan, USA3Genesys Regional MedicalCenter, Cardiac Cath Lab,Grand Blanc, Michigan, USA
Correspondence toProfessor Kimberly R Barber;[email protected]
ABSTRACTObjective: An accurate tool with good discriminative forbleeding would be useful to clinicians for improvedmanagement of all their patients. Bleeding risk modelshave been published but not externally validated inindependent clinical data set. We chose the NationalCardiovascular Data Registry (NCDR) percutaneouscoronary intervention (PCI) score to validate within alarge, multisite community data set. The aim of the studywas validation of this Bleeding Risk Score (BRS) toolamong a subgroup of patients based on body massindex.Methods: This is a large-scale retrospective analysis ofa current registry utilising data from a 37-hospital healthsystem. The central repository of patients with coronaryheart disease undergoing PCI between 1 June 2009 and30 June 2012 was utilised to validate the NCDR PCI BRSamong 4693 patients. The primary end point was majorbleeding. Validation analysis calculating the receiveroperating characteristic curve was performed.Results: There were 143 (3%) major bleeds. Mean BRSwas 14.7 (range 3–42). Incidence of bleeding by riskcategory: low (0.5%), intermediate (1.7%) and high risk(7.6%). Tool accuracy was poor to fair (area-under-thecurve (AUC) 0.78 heparin, 0.65 bivalirudin). Overallaccuracy was 0.71 (CI 0.66 to 0.76). Accuracy did notimprove when confined to just the intermediate riskgroup (AUC 0.58; CI 0.55 to 0.67). Tool accuracy was thelowest among the low BMI group (AUC 0.62) thoughthey are at increased risk of bleeding following PCI.Conclusions: Bleeding risk tools have low predictivevalue even among subgroups of patients at higher risk.Adjustment for anticoagulation use resulted in poordiscrimination because bivalirudin differentially biasesoutcomes toward no bleeding. The current state ofbleeding risk tools provide little support for diagnosticutility in regards to major bleeding and therefore havelimited clinical applicability.
INTRODUCTIONPeriprocedural major bleeding is a significantindependent predictor of vascular complica-tion including non-fatal myocardial infarctionand death following percutaneous coronaryintervention (PCI).1 2 Patients with majorbleeding have higher in hospital and 30-daymortality rates compared to those without
major bleeding.3 4 Furthermore, major bleed-ing requiring transfusion significantlyincreases the risk of death at 1-year.5 Theimpact of bleeding after PCI has been con-firmed with more recently refined bleedingclassifications such as BARC (BleedingAcademic Research Consortium).6 7 Despiteadvances in technology and therapy, majorbleeding following PCI remains a significantconcern.Attempts have been made to identify popu-
lations of patients based on their bleeding riskfollowing PCI.8–11 These include variousBleeding Risk Score (BRS) tools that areapplied prior to PCI to predict bleeding basedon patient demographic and health conditioncharacteristics. The National CardiovascularData Registry (NCDR) PCI BRS is a commontool currently in use in the USA.12 Our under-standing of the utility of these tools has beenlimited to databases in which they weredesigned and to overall patient populations.10
A tool that accurately discriminates bleedingrisk would be useful for therapeutic manage-ment and standardisation. However, these BRStools have yet to be validated with variousexternal clinical databases and confirmation ofthe predictive value of these BRS tools islacking for specific populations such as thosebased on BMI. The extent to which these tools
KEY QUESTIONS
What is already known about this subject?▸ Low body mass index is an independent risk
factor for bleeding following percutaneous cor-onary intervention (PCI).
What does this study add?▸ A Bleeding Risk Score tool is not predictive even
in high-risk subgroups such as those based onweight where bivalirudin is used during PCI.
How might this impact on clinical practice?▸ This might change the emphasis from predicting
bleeding in a few patients to preventing bleedingamong all patients undergoing PCI.
Dobies DR, Barber KR, Cohoon AL. Open Heart 2015;2:e000088. doi:10.1136/openhrt-2014-000088 1
Interventional cardiology
on 16 June 2018 by guest. Protected by copyright.
http://openheart.bmj.com
/O
pen Heart: first published as 10.1136/openhrt-2014-000088 on 10 F
ebruary 2015. Dow
nloaded from
have utility among subgroup populations remains to bedetermined. Patients with Lower body mass index (BMI≤25), who undergo a PCI are at greater risk of bleedingthan patients who are overweight (BMI >25).13– Thesepatients experience more bleeding, major as well as moreminor bleeding, episodes than patients who are over-weight or obese.16 17 Thus, PCI patients can be atincreased risk of longer term poor outcomes includingdeath, based on their BMI.18
The purpose of this study was to examine the diagnos-tic utility of the BRS tool among patients undergoingPCI in a clinical database of real world practice. Wechose a nationally recognised index, the NCDR of PCIsBRS, to be validated by an independent, multisite com-munity hospital real-world data registry.11 This bleedingrisk index was chosen because if its current use amonghospitals, including Accountable Care Organizations(ACO) in the USA. The hypothesis was to test whetherthe BRS can discriminate bleeding risk among sub-groups of patients based on BMI.
METHODSStudy design and populationThis is a real-world, large-scale retrospective analysis utilis-ing American College of Cardiology (ACC) data from theAscension Health System (AHS). The AHS includes agroup of 39 community hospitals across the USA. A centralrepository, independent of the NCDR-CathPCI database,was prospectively initiated across the health system in 2007with mandatory reporting of 84 standardised data pointsdefined by the ACC. Data were entered prospectively bytrained personnel at the time of the heart catheterisationfor consecutive patients from all AH hospitals performingcatheterisation in this healthcare system. This data entrywas collected and entered into the hospital registry inde-pendent of national reporting by hospitals to the NCDRand, unlike the NCDR, does not include university hospitalor tertiary centre data. Cath laboratory technicians andnursing staff entered the data immediately following eachprocedure. The registry represents procedures and devicesas used in routine clinical practice per operator discretion.The database is routinely audited for accuracy and com-pleteness. The data from the most recent 3-year periodfrom 1 June 2009 through 30 June 2012 for index PCI pro-cedures was selected (n=5114). Preprocedure creatininevalues were used for the glomerular filtration rate (GFR)calculation. Patients missing preprocedure creatinine(n=254) had postprocedure creatinine imputed into thecalculation. An additional 167 patients had missing pre-creatinine and postcreatinine and were excluded from theanalysis (3.2%). Patients with complete BRS informationwere included in this study (n=4693).
End pointsThe primary end point for the predictive accuracy of theNCDR PCI BRS was major bleeding episodes. Majorbleeding was defined as any of the following occurring
within a 72 h period of the procedure: haemoglobindrop of ≥3 g/dL; transfusion of whole blood or packedred blood cells; procedural intervention/surgery at thebleeding site to reverse/stop or correct the bleeding.This definition by the ACC mirrors that of the BARC cri-teria. For example, a Type 3a BARC criteria fits our useof a ≥3 g/dL drop in hemoglobin and a Type 3b BARCcriteria fits our use of any need for procedural interven-tion or surgery.
Bleeding risk modelThe risk scale used for this propensity analysis was theNCDR PCI BRS.11 The 13-point (pt) scale includes theprognostic factors of acute coronary syndrome (ACS)type (10 or 3 pt), New York Heart Association (NYHA)class IV CHF status (4 pt), gender (6 pt), cardiovascularhistory (8, 4 or 2 pt), no previous PCI (4 pt), age (8, 5,or 2 pt) and estimated GFR (1 pt per 10 unit decrease<90). The risk score is further categorised into three dis-tinct risk levels of low (≤7 pt), intermediate (8–16 pt),and high (≥17 pt). Continuous variables are presentedas means (SDs) and categorical variables are presentedas counts (%) and compared by χ2 analysis and FischerExact test for rare event rates. The BRS was calculatedfor each patient in the database from the prognosticvariables and programmed into SPSS. The Modificationof Diet in Renal Disease (MDRD) equation was used tocalculate the GFR (mLs/min/1.73 m2) from the prepro-cedure creatinine (mg/dL) levels reported in the regis-try and the following formula was imputed into thedatabase (186×(creatinine/88.4)−1.154×(age)−0.203×(0.742if female)×(1.210 if black).18 Creatinine levels werethose that were the most recent creatinine level obtainedbetween the procedure and 1 month prior to the pro-cedure. The actual BRS was calculated and then con-structed to assign patients into three risk categories (low,intermediate and high). Patients were further cate-gorised by cut-off values (≤7 and 8–16) with the low andintermediate risk combined and the high-risk category(≥17) used as the comparative group for sensitivity andaccuracy analyses.
Statistical analysisDiscrimination of the scale was evaluated by the receiveroperating characteristics (ROC) curve and area-under-thecurve (AUC) expressed by the c-statistic. Calibration orlevel of agreement between observed and predicted out-comes was assessed using the Hosmer-Lemeshowgoodness-of-fit test. Sensitivity indicates the proportion ofpatients with the target disorder who have a positive testresult (true positive). Specificity indicates the proportionof patients without the target disorder who have a negativetest result (true negative). Likelihood ratio is the likeli-hood (probability) that a given test result would beexpected in a patient with the target disorder compared tothe same likelihood that the same result would beexpected in a patient without the target disorder. For all
2 Dobies DR, Barber KR, Cohoon AL. Open Heart 2015;2:e000088. doi:10.1136/openhrt-2014-000088
Open Heart
on 16 June 2018 by guest. Protected by copyright.
http://openheart.bmj.com
/O
pen Heart: first published as 10.1136/openhrt-2014-000088 on 10 F
ebruary 2015. Dow
nloaded from
analyses, significance was set at p<0.05. Software for pro-cessing the data was SPSS V.18.0 (Chicago, Illinois, USA).
RESULTSBaseline characteristicsPatient characteristics are summarised in table 1.Of the total number of patients (n=4693), a majority
were Caucasian (n=4259, 90.8%) and male (n=3139,66.9%). Most were hypertensive (n=3964, 84.6%) andoverweight (n=1633, 35.3%) or obese (n=2146, 46.4%).The BMI ranged from 10.6 through 390.8. Diabetes waspresent in 1728 (36.8%). The overall mean creatininelevel was 1.18 (SD=0.93, range 0–20). The mean GFRlevel was 57.1 (SD=26.3, range: 2–818).There were 1889 (40.3%) elective procedures and
2794 (59.6%) urgent or emergent. The most commonindication for PCI was high-risk non STEMI or unstableangina (n=2064, 44%). A majority were conductedthrough femoral access (n=4546, 97.1%) and withmanual compression to close the site (n=2884, 78.7%).
End pointsA total of 143 patients (3%) experienced a major bleed-ing event. Bleeding event rates by type of anticoagulantare presented in table 2. There were fewer major bleedsamong those treated with bivalirudin.
Bleeding risk scoreA breakdown of all patients with the factors included inthe bleeding risk model is summarised in table 3. Thecategorical cut-off points for the NCDR BRS placed amajority of patients into the ‘Intermediate’ risk category(n=2404, 51.2%). The mean BRS was 14.7 (SD=5.9,range: 3–42). The incidence of bleeding observed for
the low, intermediate and high-risk categories was 0.5%,1.7% and 7.6% respectively.
Diagnostic utilityThe accuracy of the BRS for predicting major bleedingevents was examined. Among the overall population, theBRS sensitivity was 0.76 and specificity was 0.64. Thepositive Likelihood Ratio (LR+) was 2.1 and the negativeLR (LR−) was 0.38. The tool was least accurate forpatients receiving bivalirudin (table 4). Test parameterresults generated were least likely to distinguish bleedingevents for patients given bivalirudin without glycoproteinIIb/IIIa inhibitor (GPI). Parameter results for patientsgiven GPI were similar between heparin and bivalirudin(data not shown).Major bleeding was more common among the low
BMI group (32 or 3.8%) compared to the high BMIgroup (111 or 2.9%) (OR=1.3, CI 0.90 to 1.8, p=0.11).Low BMI was associated with higher bleeding rates
Table 3 Breakdown of patient factors per Bleeding Risk
Score
Variable
Points
assigned
Frequency
n (%)
ACS type:
STEMI 10 633 (7.7)
Other 3 4058 (49.1)
Cardiogenic shock 8 68 (0.8)
Female gender 6 3167 (38.3)
Previous CHF 5 1039 (12.6)
No previous PCI 4 5238 (63.4)
NYHA class IV CHF 4 84 (1.0)
PVD 2 920 (11.1)
Age (years)
66–75 2 2227 (26.9)
76–85 5 1369 (16.6)
>85 8 201 (2.4)
Estimated GFR 0 1799 (1.9)
(1 per 10 unit decrease
<90)
>0 6464 (78.2)
Risk categories
Low ≤7 2071 (25.1)
Intermediate 8–16 4274 (51.7)
High ≥17 1918 (23.2)
ACS, acute coronary syndrome; CHF, congestive heart failure;GFR, glomerular filtration rate; NYHA, New York HeartAssociation; PCI, percutaneous coronary intervention; PVD,peripheral vascular disease; STEMI, ST segment elevationmyocardial infarction.
Table 1 Patient characteristics for total sample (n=4693)
Variable Number (%)
Gender: male 3139 (66.9)
Race: Caucasian 4259 (90.8)
Age (mean (SD)) 64.3 (12.0)
HTN 3964 (84.5)
Smoker 1434 (30.6)
Prior MI 1491 (31.8)
Prior CHF 657 (14.0)
Prior PCI 2018 (43.0)
Prior CABG 1023 (21.8)
Kidney disease 93 (2.0)
CVD 618 (13.2)
PVD 640 (13.7)
Lung disease 932 (19.9)
BMI: overweight/obese 3779 (80.5)
Death 52 (1.1)
BMI, body mass index; CABG, coronary artery bypass graft; CHF,congestive heart failure; CVD, cardiovascular disease; HTN,hypertension; MI, myocardial infarction; PCI, percutaneouscoronary intervention; PVD, peripheral vascular disease.
Table 2 Major bleeding events by anticoagulant therapy
Heparin
(n/total (%))
Bivalirudin
(n/total (%)) Significant
All 113/3080 (3.7) 30/1464 (2.1) 0.003
GPI 33/1833 (1.8) 24/1412 (1.7) 0.80
No GPI 77/1328 (5.8) 6/122 (4.9) 0.12
GIP, glycoprotein IIb/IIIa inhibitor.
Dobies DR, Barber KR, Cohoon AL. Open Heart 2015;2:e000088. doi:10.1136/openhrt-2014-000088 3
Interventional cardiology
on 16 June 2018 by guest. Protected by copyright.
http://openheart.bmj.com
/O
pen Heart: first published as 10.1136/openhrt-2014-000088 on 10 F
ebruary 2015. Dow
nloaded from
regardless of GPI use (table 5). This was not the case forthose receiving bivalirudin in which the groups had lowand equivalent rates of bleeding.The diagnostic utility of the BRS among patients
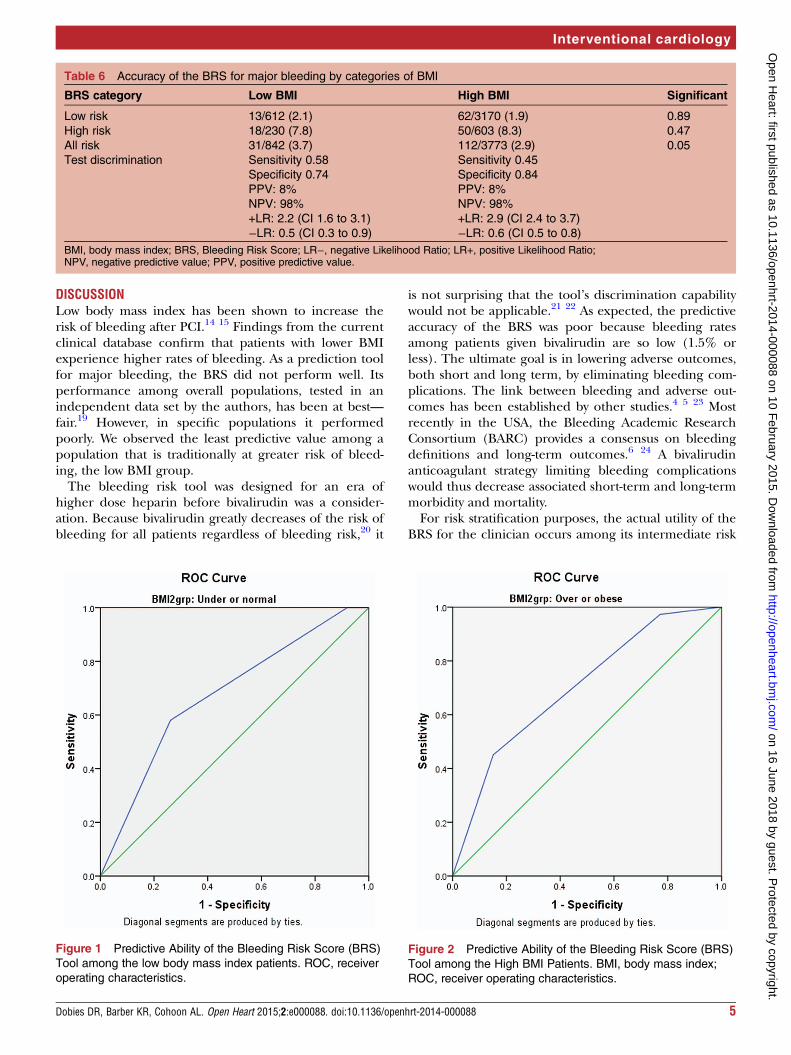
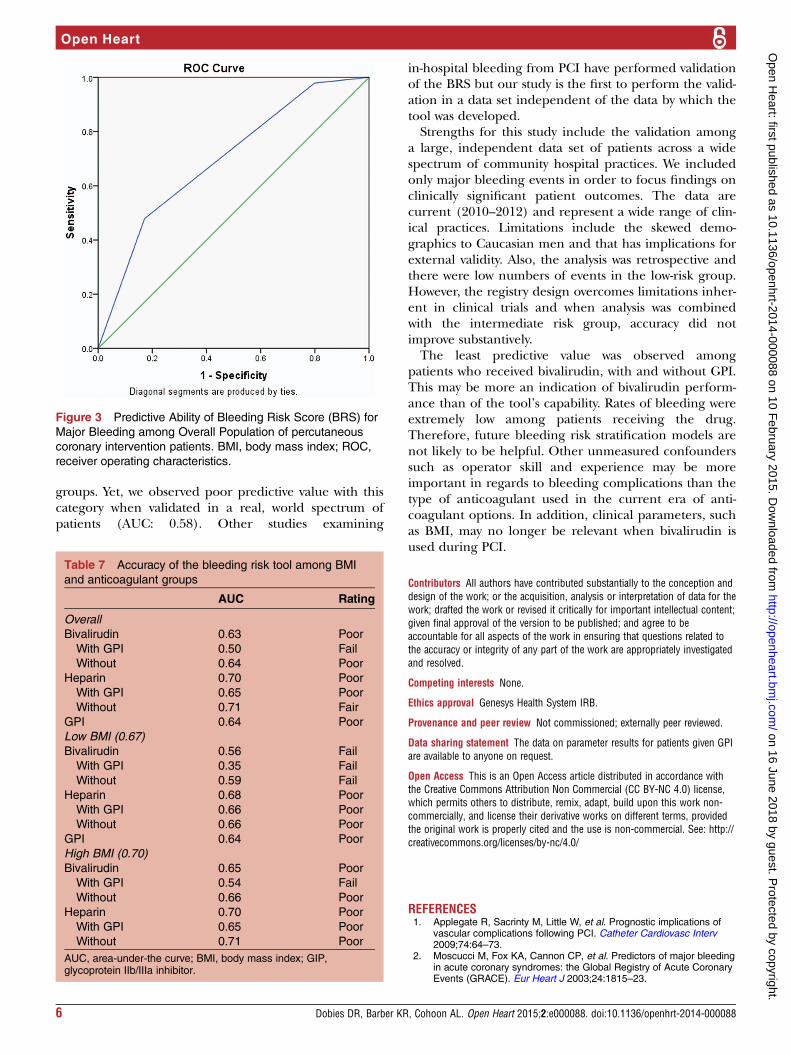
according to BMI demonstrated poor utility and did notdifferentiate bleeding risk between the BMI groups(table 6). The predictive ability of the tool was poor withlikelihood test parameters, at best, indeterminate(figures 1 and 2).
Predictive abilityThe ability of the tool to predict major bleeding was con-firmed by calculating the AUC and the correspondingreceiver operator characteristics (ROC) curve.Determination of the additive value of the tool was made bythe AUC scale for which a 1.0 is a perfect test.11 The AUCranking is as follows: excellent (0.91–1.0), good (0.81–0.90),fair (0.71–0.80), poor (0.61–0.70) and fail (0.51–0.60).Among the entire sample of 4693 patients, 143 (3.0%)
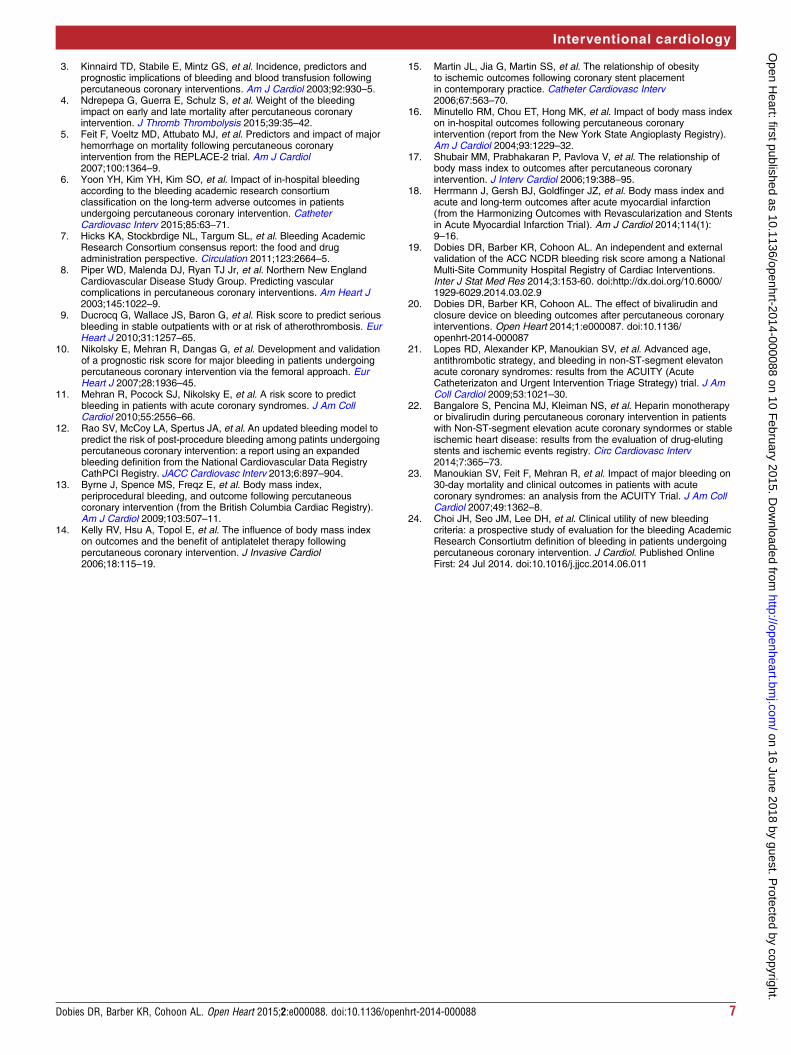
had a major bleeding outcome. The AUC was 0.71
(CI 0.67 to 0.79), a prediction value of for the BRS toolof ‘fair’. We then examined the accuracy within eachcut-off point of the BRS (low, intermediate, high)(figure 3). The AUC for the Low Risk group of patients(n=879, events=4) was 0.57 (CI 0.26 to 0.88), the AUCfor the Intermediate Risk group (n=2364, events=40)was 0.58 (CI 0.49 to 0.67), and the AUC for the HighRisk group (n=1306, events=99) was 0.61 (CI 0.55 to0.67). The corresponding predictive value for these risklevels is fail, fail, and poor, respectively. Performance ofthe tool fared the worst for lower BMI patients withLikelihood ratios that provided indeterminate results(figure 1).The predictive accuracy of the BRS was least among
patients that received bivalirudin with GPI (table 7).Predictive accuracy was also less among the low BMIgroup than the high BMI group (poor and fair, respect-ively). Among lower BMI patients the tool failed amongthose receiving bivalirudin regardless of GPI (fail inevery case).
Table 4 Accuracy of the Bleeding Risk Score by categories for major bleeding
All Positive bleed Negative bleed Total Test discrimination
High risk 109 1617 1726 Sensitivity 0.76
Specificity 0.64
PPV 6.3%
NPV 98%
+LR 2.1(CI 1.7 to 2.8)
−LR 0.3 (CI 0.2 to 0.7)
Not high risk 34 2932 2966
Total 143 4549 4692
Heparin (without GPI)
High risk 90 1107 1197 Sensitivity 0.80
Specificity 0.59
PPV 7.5%
NPV 98.7%
+LR 1.9 (CI 1.8 to 2.2)
−LR 0.3(CI 0.2 to 0.5)
Not high risk 22 1631 1653
Total 112 2738 2850
Bivalirudin (without GPI)
High risk 19 505 524 Sensitivity 0.65
Specificity 0.61
PPV 3.6%
NPV 98.7%
+LR 1.6 (CI 1.3 to 2.2)
−LR 0.5 (CI 0.3 to 0.9)
Not high risk 10 795 805
Total 29 1300 1329
GIP, glycoprotein IIb/IIIa inhibitor; LR−, negative Likelihood Ratio; LR+, positive Likelihood Ratio; NPV, negative predictive value;PPV, positive predictive value.
Table 5 Bleeding events (n/total (%))
Low BMI High BMI
Significant
(between BMI)
2B3A
UH 17/247 (6.9) 61/1074 (5.6) 0.07
Bivalirudin 1/21 (4.8) 5/100 (5.0) 0.41
No 2B3A
UH 9/306 (2.9) 24/1524 (1.6) 0.04
Bivalirudin 4/261 (1.5) 20/1093 (1.8) 0.21
BMI, body mass index; UH, unfractionated heparin.
4 Dobies DR, Barber KR, Cohoon AL. Open Heart 2015;2:e000088. doi:10.1136/openhrt-2014-000088
Open Heart
on 16 June 2018 by guest. Protected by copyright.
http://openheart.bmj.com
/O
pen Heart: first published as 10.1136/openhrt-2014-000088 on 10 F
ebruary 2015. Dow
nloaded from
DISCUSSIONLow body mass index has been shown to increase therisk of bleeding after PCI.14 15 Findings from the currentclinical database confirm that patients with lower BMIexperience higher rates of bleeding. As a prediction toolfor major bleeding, the BRS did not perform well. Itsperformance among overall populations, tested in anindependent data set by the authors, has been at best—fair.19 However, in specific populations it performedpoorly. We observed the least predictive value among apopulation that is traditionally at greater risk of bleed-ing, the low BMI group.The bleeding risk tool was designed for an era of
higher dose heparin before bivalirudin was a consider-ation. Because bivalirudin greatly decreases of the risk ofbleeding for all patients regardless of bleeding risk,20 it
is not surprising that the tool’s discrimination capabilitywould not be applicable.21 22 As expected, the predictiveaccuracy of the BRS was poor because bleeding ratesamong patients given bivalirudin are so low (1.5% orless). The ultimate goal is in lowering adverse outcomes,both short and long term, by eliminating bleeding com-plications. The link between bleeding and adverse out-comes has been established by other studies.4 5 23 Mostrecently in the USA, the Bleeding Academic ResearchConsortium (BARC) provides a consensus on bleedingdefinitions and long-term outcomes.6 24 A bivalirudinanticoagulant strategy limiting bleeding complicationswould thus decrease associated short-term and long-termmorbidity and mortality.For risk stratification purposes, the actual utility of the
BRS for the clinician occurs among its intermediate risk
Table 6 Accuracy of the BRS for major bleeding by categories of BMI
BRS category Low BMI High BMI Significant
Low risk 13/612 (2.1) 62/3170 (1.9) 0.89
High risk 18/230 (7.8) 50/603 (8.3) 0.47
All risk 31/842 (3.7) 112/3773 (2.9) 0.05
Test discrimination Sensitivity 0.58
Specificity 0.74
PPV: 8%
NPV: 98%
+LR: 2.2 (CI 1.6 to 3.1)
−LR: 0.5 (CI 0.3 to 0.9)
Sensitivity 0.45
Specificity 0.84
PPV: 8%
NPV: 98%
+LR: 2.9 (CI 2.4 to 3.7)
−LR: 0.6 (CI 0.5 to 0.8)
BMI, body mass index; BRS, Bleeding Risk Score; LR−, negative Likelihood Ratio; LR+, positive Likelihood Ratio;NPV, negative predictive value; PPV, positive predictive value.
Figure 1 Predictive Ability of the Bleeding Risk Score (BRS)
Tool among the low body mass index patients. ROC, receiver
operating characteristics.
Figure 2 Predictive Ability of the Bleeding Risk Score (BRS)
Tool among the High BMI Patients. BMI, body mass index;
ROC, receiver operating characteristics.
Dobies DR, Barber KR, Cohoon AL. Open Heart 2015;2:e000088. doi:10.1136/openhrt-2014-000088 5
Interventional cardiology
on 16 June 2018 by guest. Protected by copyright.
http://openheart.bmj.com
/O
pen Heart: first published as 10.1136/openhrt-2014-000088 on 10 F
ebruary 2015. Dow
nloaded from
groups. Yet, we observed poor predictive value with thiscategory when validated in a real, world spectrum ofpatients (AUC: 0.58). Other studies examining
in-hospital bleeding from PCI have performed validationof the BRS but our study is the first to perform the valid-ation in a data set independent of the data by which thetool was developed.Strengths for this study include the validation among
a large, independent data set of patients across a widespectrum of community hospital practices. We includedonly major bleeding events in order to focus findings onclinically significant patient outcomes. The data arecurrent (2010–2012) and represent a wide range of clin-ical practices. Limitations include the skewed demo-graphics to Caucasian men and that has implications forexternal validity. Also, the analysis was retrospective andthere were low numbers of events in the low-risk group.However, the registry design overcomes limitations inher-ent in clinical trials and when analysis was combinedwith the intermediate risk group, accuracy did notimprove substantively.The least predictive value was observed among
patients who received bivalirudin, with and without GPI.This may be more an indication of bivalirudin perform-ance than of the tool’s capability. Rates of bleeding wereextremely low among patients receiving the drug.Therefore, future bleeding risk stratification models arenot likely to be helpful. Other unmeasured confounderssuch as operator skill and experience may be moreimportant in regards to bleeding complications than thetype of anticoagulant used in the current era of anti-coagulant options. In addition, clinical parameters, suchas BMI, may no longer be relevant when bivalirudin isused during PCI.
Contributors All authors have contributed substantially to the conception anddesign of the work; or the acquisition, analysis or interpretation of data for thework; drafted the work or revised it critically for important intellectual content;given final approval of the version to be published; and agree to beaccountable for all aspects of the work in ensuring that questions related tothe accuracy or integrity of any part of the work are appropriately investigatedand resolved.
Competing interests None.
Ethics approval Genesys Health System IRB.
Provenance and peer review Not commissioned; externally peer reviewed.
Data sharing statement The data on parameter results for patients given GPIare available to anyone on request.
Open Access This is an Open Access article distributed in accordance withthe Creative Commons Attribution Non Commercial (CC BY-NC 4.0) license,which permits others to distribute, remix, adapt, build upon this work non-commercially, and license their derivative works on different terms, providedthe original work is properly cited and the use is non-commercial. See: http://creativecommons.org/licenses/by-nc/4.0/
REFERENCES1. Applegate R, Sacrinty M, Little W, et al. Prognostic implications of
vascular complications following PCI. Catheter Cardiovasc Interv2009;74:64–73.
2. Moscucci M, Fox KA, Cannon CP, et al. Predictors of major bleedingin acute coronary syndromes: the Global Registry of Acute CoronaryEvents (GRACE). Eur Heart J 2003;24:1815–23.
Figure 3 Predictive Ability of Bleeding Risk Score (BRS) for
Major Bleeding among Overall Population of percutaneous
coronary intervention patients. BMI, body mass index; ROC,
receiver operating characteristics.
Table 7 Accuracy of the bleeding risk tool among BMI
and anticoagulant groups
AUC Rating
Overall
Bivalirudin 0.63 Poor
With GPI 0.50 Fail
Without 0.64 Poor
Heparin 0.70 Poor
With GPI 0.65 Poor
Without 0.71 Fair
GPI 0.64 Poor
Low BMI (0.67)
Bivalirudin 0.56 Fail
With GPI 0.35 Fail
Without 0.59 Fail
Heparin 0.68 Poor
With GPI 0.66 Poor
Without 0.66 Poor
GPI 0.64 Poor
High BMI (0.70)
Bivalirudin 0.65 Poor
With GPI 0.54 Fail
Without 0.66 Poor
Heparin 0.70 Poor
With GPI 0.65 Poor
Without 0.71 Poor
AUC, area-under-the curve; BMI, body mass index; GIP,glycoprotein IIb/IIIa inhibitor.
6 Dobies DR, Barber KR, Cohoon AL. Open Heart 2015;2:e000088. doi:10.1136/openhrt-2014-000088
Open Heart
on 16 June 2018 by guest. Protected by copyright.
http://openheart.bmj.com
/O
pen Heart: first published as 10.1136/openhrt-2014-000088 on 10 F
ebruary 2015. Dow
nloaded from
3. Kinnaird TD, Stabile E, Mintz GS, et al. Incidence, predictors andprognostic implications of bleeding and blood transfusion followingpercutaneous coronary interventions. Am J Cardiol 2003;92:930–5.
4. Ndrepepa G, Guerra E, Schulz S, et al. Weight of the bleedingimpact on early and late mortality after percutaneous coronaryintervention. J Thromb Thrombolysis 2015;39:35–42.
5. Feit F, Voeltz MD, Attubato MJ, et al. Predictors and impact of majorhemorrhage on mortality following percutaneous coronaryintervention from the REPLACE-2 trial. Am J Cardiol2007;100:1364–9.
6. Yoon YH, Kim YH, Kim SO, et al. Impact of in-hospital bleedingaccording to the bleeding academic research consortiumclassification on the long-term adverse outcomes in patientsundergoing percutaneous coronary intervention. CatheterCardiovasc Interv 2015;85:63–71.
7. Hicks KA, Stockbrdige NL, Targum SL, et al. Bleeding AcademicResearch Consortium consensus report: the food and drugadministration perspective. Circulation 2011;123:2664–5.
8. Piper WD, Malenda DJ, Ryan TJ Jr, et al. Northern New EnglandCardiovascular Disease Study Group. Predicting vascularcomplications in percutaneous coronary interventions. Am Heart J2003;145:1022–9.
9. Ducrocq G, Wallace JS, Baron G, et al. Risk score to predict seriousbleeding in stable outpatients with or at risk of atherothrombosis. EurHeart J 2010;31:1257–65.
10. Nikolsky E, Mehran R, Dangas G, et al. Development and validationof a prognostic risk score for major bleeding in patients undergoingpercutaneous coronary intervention via the femoral approach. EurHeart J 2007;28:1936–45.
11. Mehran R, Pocock SJ, Nikolsky E, et al. A risk score to predictbleeding in patients with acute coronary syndromes. J Am CollCardiol 2010;55:2556–66.
12. Rao SV, McCoy LA, Spertus JA, et al. An updated bleeding model topredict the risk of post-procedure bleeding among patints undergoingpercutaneous coronary intervention: a report using an expandedbleeding definition from the National Cardiovascular Data RegistryCathPCI Registry. JACC Cardiovasc Interv 2013;6:897–904.
13. Byrne J, Spence MS, Freqz E, et al. Body mass index,periprocedural bleeding, and outcome following percutaneouscoronary intervention (from the British Columbia Cardiac Registry).Am J Cardiol 2009;103:507–11.
14. Kelly RV, Hsu A, Topol E, et al. The influence of body mass indexon outcomes and the benefit of antiplatelet therapy followingpercutaneous coronary intervention. J Invasive Cardiol2006;18:115–19.
15. Martin JL, Jia G, Martin SS, et al. The relationship of obesityto ischemic outcomes following coronary stent placementin contemporary practice. Catheter Cardiovasc Interv2006;67:563–70.
16. Minutello RM, Chou ET, Hong MK, et al. Impact of body mass indexon in-hospital outcomes following percutaneous coronaryintervention (report from the New York State Angioplasty Registry).Am J Cardiol 2004;93:1229–32.
17. Shubair MM, Prabhakaran P, Pavlova V, et al. The relationship ofbody mass index to outcomes after percutaneous coronaryintervention. J Interv Cardiol 2006;19:388–95.
18. Herrmann J, Gersh BJ, Goldfinger JZ, et al. Body mass index andacute and long-term outcomes after acute myocardial infarction(from the Harmonizing Outcomes with Revascularization and Stentsin Acute Myocardial Infarction Trial). Am J Cardiol 2014;114(1):9–16.
19. Dobies DR, Barber KR, Cohoon AL. An independent and externalvalidation of the ACC NCDR bleeding risk score among a NationalMulti-Site Community Hospital Registry of Cardiac Interventions.Inter J Stat Med Res 2014;3:153-60. doi:http://dx.doi.org/10.6000/1929-6029.2014.03.02.9
20. Dobies DR, Barber KR, Cohoon AL. The effect of bivalirudin andclosure device on bleeding outcomes after percutaneous coronaryinterventions. Open Heart 2014;1:e000087. doi:10.1136/openhrt-2014-000087
21. Lopes RD, Alexander KP, Manoukian SV, et al. Advanced age,antithrombotic strategy, and bleeding in non-ST-segment elevatonacute coronary syndromes: results from the ACUITY (AcuteCatheterizaton and Urgent Intervention Triage Strategy) trial. J AmColl Cardiol 2009;53:1021–30.
22. Bangalore S, Pencina MJ, Kleiman NS, et al. Heparin monotherapyor bivalirudin during percutaneous coronary intervention in patientswith Non-ST-segment elevation acute coronary syndormes or stableischemic heart disease: results from the evaluation of drug-elutingstents and ischemic events registry. Circ Cardiovasc Interv2014;7:365–73.
23. Manoukian SV, Feit F, Mehran R, et al. Impact of major bleeding on30-day mortality and clinical outcomes in patients with acutecoronary syndromes: an analysis from the ACUITY Trial. J Am CollCardiol 2007;49:1362–8.
24. Choi JH, Seo JM, Lee DH, et al. Clinical utility of new bleedingcriteria: a prospective study of evaluation for the bleeding AcademicResearch Consortiutm definition of bleeding in patients undergoingpercutaneous coronary intervention. J Cardiol. Published OnlineFirst: 24 Jul 2014. doi:10.1016/j.jjcc.2014.06.011
Dobies DR, Barber KR, Cohoon AL. Open Heart 2015;2:e000088. doi:10.1136/openhrt-2014-000088 7
Interventional cardiology
on 16 June 2018 by guest. Protected by copyright.
http://openheart.bmj.com
/O
pen Heart: first published as 10.1136/openhrt-2014-000088 on 10 F
ebruary 2015. Dow
nloaded from