Embed Size (px)
Citation preview
NASA
Technical Memorandum 105359
r, •
/
Technical Report 92-C-050
Validation of Finite Element and BoundaryElement Methods for Predicting StructuralVibration and Radiated Noise
A.F. Seybert and X.E Wu
Department of Mechanical Engineering
University of Kentucky
Lexington, Kentucky
and
Fred B. Oswald
Lewis Research Center
Cleveland, Ohio
Prepared for the
American Society of Mechanical Engineers
Winter Annual Meeting
Lexington, Kentucky, November 8-13, 1992
N/ A(_JASA-TM-155359) VALI_ATIU_! OF F[NIT7
LLE_[_T A_'O Lf]ONO_RY ELrMENT METHODS FOR
r_L_nICTIN(; STPOCTURA L VI6:_ATI_N ANO RAOTATE r]
F_I SE (N _,A) q nc,3/37
Nq2-29097
Unclas0110084
https://ntrs.nasa.gov/search.jsp?R=19920020454 2018-06-27T16:18:58+00:00Z

VALIDATION OF FINITE ELEMENT AND BOUNDARY ELEMENT METHODS FOR PREDICTING
STRUCTURAL VIBRATION AND RADIATED NOISE
A.F. Seybert and X.F. Wu
Department of Mecha.nical Engineering
University of Kentucky
Lexington, Kentucky 40506
and
Fred B. Oswald
National Aeronautics and Space AdministrationLewis Research Center
Cleveland, Ohio 44135
ABSTRACT
Analytical and experimental validation of methods to predict structural
vibration and radiated noise is presented in this paper. A rectangular box
excited by a mechanical shaker was used as a vibrating structure. Combined
finite element method (FEM) and boundary element method (BEM) models
of the apparatus were used to predict the noise radiated from the box. The
FEM was used to predict the vibration, and the surface vibration was used
as input to the BEM to predict the sound intensity and sound power.
Vibration predicted by the FEM model was validated by experimental modal
analysis. Noise predicted by the BEM was validated by sound intensity
measurements. Three types of results are presented for the total radiated
sound power: (1) sound power predicted by the BEM model using vibration
data measured on the surface of the box, (2) sound power predicted by the
FEM/BEM model, and (3) sound power measured by a sound intensity scan.
The sound power predicted from the BEM model using measured vibration
data yields an excellent prediction of radiated noise. The sound power
predicted by the combined FEM/BEM model also gives a good prediction of
radiated noise except for a shift of the natural frequencies that are due tolimitations in the FEM model.
INTRODUCTION
The prediction of noise in the design stage is important for building
low-noise and high performance machines. Two steps are involved in pre-
dicting noise radiated by a machine: prediction of machine vibration; and
prediction of noise based on the predicted vibration or on the vibration
obtained from other approaches (e.g., experimental data). Analytical
methods and the finite element method (FEM) are used to predict machine
vibration. To predict machine radiated noise, analytical methods, the finite
element method, and the boundary element method (BEM) axe used.
Perreira and Dubowsky (1979, 1980} used a combined analytical-
numerical method to model simply shaped machine elements. In their work,
a machine link was modeled as a vibrating beam in an infinite, rigid baffle,
and the Rayleigh integral was used to calculate the radiated noise. The
major advantage of using the Rayleigh integral is its solution efficiency
because it does not require a simultaneous equation solution; the sound
pressure is determined by direct integration of the known boundary normal
velocities. Certain simple machine elements can be modeled well with such
treatments; however, the assumptions required to use the Rayleigh integral
are rarely met by realistic vibrating structures.
The acoustic finite element method has been used successfully for inte-rior problems in which the acoustic field is calculated within an enclosed
volume, such as printer enclosures and vehicle cabins. Bernhard and Takeo
(1988} used the FEM to model small cavity enclosures with acoustical treat-
ment materials, sound sources, and apertures. The sound pressure and sound
intensity inside the cav!ty were predicted. The sensitivity of two acousticdesign objective functions, the radiated sound power through apertures and
the total energy in the cavity, to the surface acoustic treatments were also
calculated. Sung and Nefske (1984) used a coupled structural-acoustic finite
element model to predict vehicle cabin vibration and noise. The predicted
structural response and sound pressure were verified by experiments. For
exterior problems, however, one encounters difficulties using the FEM, suchas where to stop the domain discretisation, and the substantial computational
effort required because the three-dimensional acoustic field must be
discreti,ed.
The BEM requires substantially less computational effort for exterior
problems because only the boundary needs to be discretized rather than the
whole acoustic domain, as with the FEM. Termination of domain discretiza-
tion and attendant numerical closure, problems commonly encountered when
using the domain methods, do not appear when using the BEM. Also, the
unknown variables on the surface arc found directly from the BEM surface
solution without having to solve for the values at other points in the exterior
region.Various researchers, including Copley (1967), Schenck (1968), and Meyer
et al. (1978), have verified the radiated noise predicted by the BEM by using
spheres, cylinders, boxes, etc., where analytical solutions exist. Smith and
Bernhard (1988) also have verified predicted noise, using the BEM and theRayleigh integral equation from measured vibration, with sound pressure
measurements in a semianechoic chamber. Oppenheimer (1988) used the
FEM and the BEM to predict the sound power and sound pressure of a
machine-like enclosure. The predicted sound power and sound pressure were
then validated by experiments. The sound power levels were computed from
an average of sound pressure level measurements, assuming a diffuse sound
field. Single frequency excitation was used for the acoustic measurements,
however, such excitations may not excite enough room modes to approximate
a true diffuse field.
This paper presents a combined numerical and experimental validation
of methods to predict structural vibration and radiated noise. The modal
superposition method is used to predict the vibration, which was validated by
experimental modal analysis. A modified Hclmholtz integral equation for
bodies sitting on an infinite plane {Seybert and Wu, 1989) is used to predict
the radiated noise, which was validated by sound intensity measurements.
Three types of results are presented for the total radiated sound power:
(1) sound power predicted by the BEM model using measured vibration data,
(2) sound power predicted by the FEM/BEM model, and (3) sound power
measured by the sound intensity method.
EXPERIMENTAL APPARATUS AND MEASUREMENTS
Preliminary Considerations
In most experimental/computational validation studies of the type
reported herein,the experimental portion is the more difficultpart of the
study, instrumentation variability,drift,calibration,dynamic range,signai-
to-noiseratio,and a host of other issues,make itdifficultto obtain highly
repeatabledata from an experiment. In s_idition,the time required to obtain
the quantity and type of data (vibration,forceinputs,sound pressure_and
sound intensity}needed for such a validationislengthy, thereby increasing
the likelihoodthat experimental conditionswill change during the course of
the test.
The apparatus chosen for the validationstudy was a simple rectangular
box excitedby an electromechanicalshaker. The simplicityof thisapparatus
with itsvery controlledexcitationas compared to an actual machine (e.g.,
engine or pump) resultedin a relativelyhigh degree ofrepeatabilitywithout
an undue amount of experimental data to be acquired and processed. Even
so, most of the discrepanciesbetween the experimental and predicted data
were ascribed to the limitations of the experiment, as described in the
followingsection.
Vibration Measurements
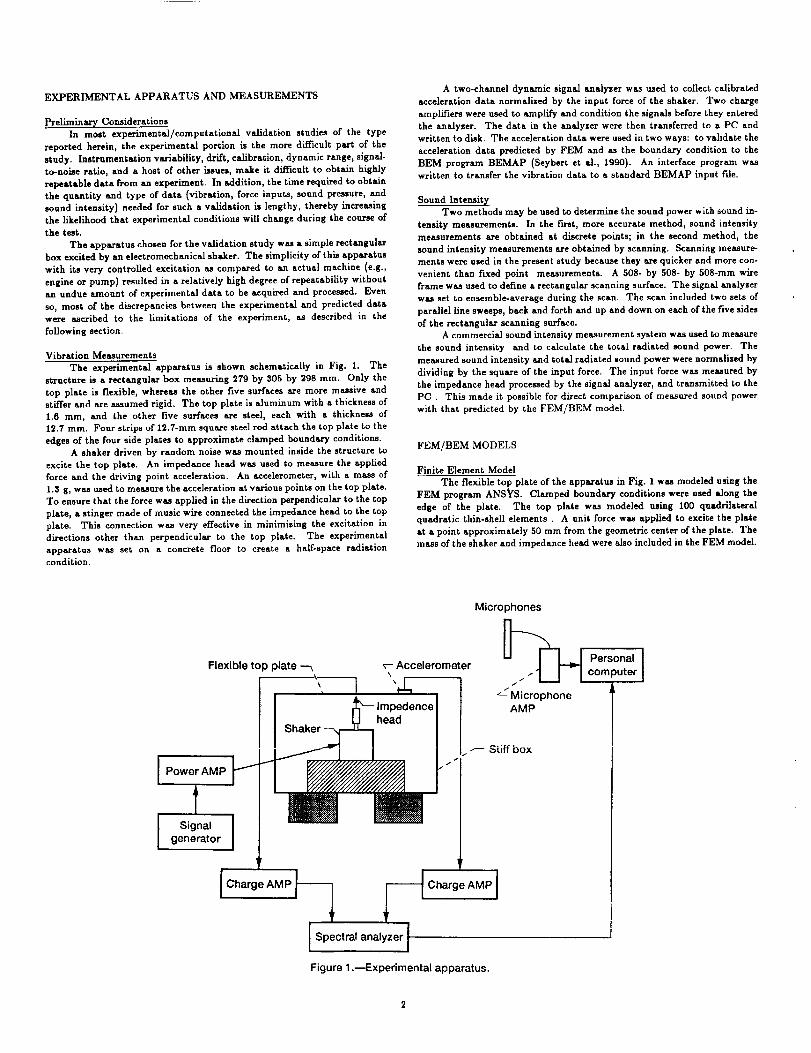
The experimental apparatus is shown schematically in Fig. 1. The
structureisa rectangular box measuring 279 by 305 by 298 rnm. Only the
top plate is flexible,whereas the other fivesurfaces are more massive and
stifferand are assumed rigid.The top plateisaluminum with a thicknessof
1.6 ram, and the other five surfaces axe steel,each with a thickness of
12.7 ram. Four stripsof 12.7-ram square steelrod attach the top plateto the
edges of the four side platesto approximate clamped boundary conditions.
A shaker driven by random noise was mounted inside the structureto
excitethe top plate. An impedance head was used to measure the applied
forceand the driving point acceleration. An accelerometer,with a mass of
1.$ g,was used to measure the accelerationat variouspoints on the top plate.
To ensure that the forcewas appliedin the directionperpendicularto the top
plate,a stingermade ofmusic wire connected the impedance head to the top
plate. This connection was very effectivein minimising the excitationin
directionsother than perpendicular to the top plate. The experimental
apparatus was set on a concrete floor to create a half-spaceradiation
condition.
A two-channel dynamic signal analyzer was used to collectcalibrated
accelerationdata normalized by the input forceof the shaker. Two charge
amplifierswere used to amplify and condition the signalsbeforethey entered
the analyser. The data in the analyser were then transferredto a PC and
written todisk. The accelerationdata were used in two ways: tovalidatethe
accelerationdata predicted by FEM and as the boundary condition to the
BEM program BEMAP (Seybert et al.,1990). An interfaceprogram was
written to transferthe vibration data to a standard BEMAP input i'lle.
Sound Intensit]¢
Two methods may be used to determine the sound power with sound in-
tensitymeasurements. In the first,more accurate method, sound intensity
measurements are obtained at discretepoints; in the second method, the
sound intensitymeasurements are obtained by scanning. Scanning measure-
ments were used in the present study because they arequicker and more con-
venient than f'Lxedpoint measurements. A 508- by 508- by 508-ram wire
frame was used to definea rectangularscanning surface.The signalanalyser
was set to ensemble-average during the scan. The scan included two setsof
parallellinesweeps, back and forthand up and down on each of the fivesides
of the rectangular scanning surface.
A commercial sound intensitymeasurement system was used to measure
the sound intensity and to calculatethe totalradiated sound power. The
measured sound intensityand totalradiated sound power were normalised by
dividing by the square of the input force. The input forcewas measured by
the impedance head processedby the signalanalyzer,and transmitted to the
PC . This made itpossiblefor directcomparison of measured sound power
with that predicted by the FEM/BEM model.
FEM/BEM MODELS
Finite Element Model
The flexibletop plateof the apparatus in Fig. 1 was modeled using the
FEM program ANSYS. Clamped boundary conditionswere used along the
edge of the plate. The top plate was modeled using 100 quadrilateral
quadratic thin-shellelements . A unit forcewas applied to excitethe plate
at a point approximately 50 mm from the geometric centerof the plate. The
mass ofthe shaker and impedance head were alsoincluded in the FEM model.
Flexible top plate --_ v- Accelerometer\
"7-3 'J,I "x--Impedence
Shaker head
Power AMP i_
Signal Igenerator I
Microphones
/
_- Microphone
AMP
r Stiff box
T 1'
IoargeAMP Char eAMP,I Spectral analyzer }
Figure 1 .--Experimental apparatus.
Personal Icomputer
The mus of the accelerometer (1.3 g) was neglected in the FEM model
because it did not significantly affect the structural dynamics in the frequency
range of interest, limited here to 100 to 500 Hz by the FEM model.The modal superposition method was used to compute the harmonic
response of the FEM model. Figure 2 shows the acceleration normalized by
the applied force at the driving point of the top plate of the box. The
difference between the experimental data and the FEM data is the result of
a shifting of the resonance frequencies. The largest shift (about 5 percent)
occurs at the fourth resonance frequency. The m_or reason for the discrep-
ancy is that cl_nped boundary conditions for the top surface were used in the
FEN[ model. The boundary conditions of the real system are not perfectly
cl_nped, but are between simple support and clamped Thus: the FEM
model isstifferthem the realsystem.
The experiment determined the equivalent viscous damping of the
structure for each mode by using the =half-power bandwidth" method
(Thomson, 1981). Figure 2 demonstrates that the equivalentviscousdamping
used in the FEM model resulted in the correct peak response for that
particularmeasurement point. However, at otherpoints,the measured values
of equivalentviscousdamping did not agree as well as that shown in Fig. 2.
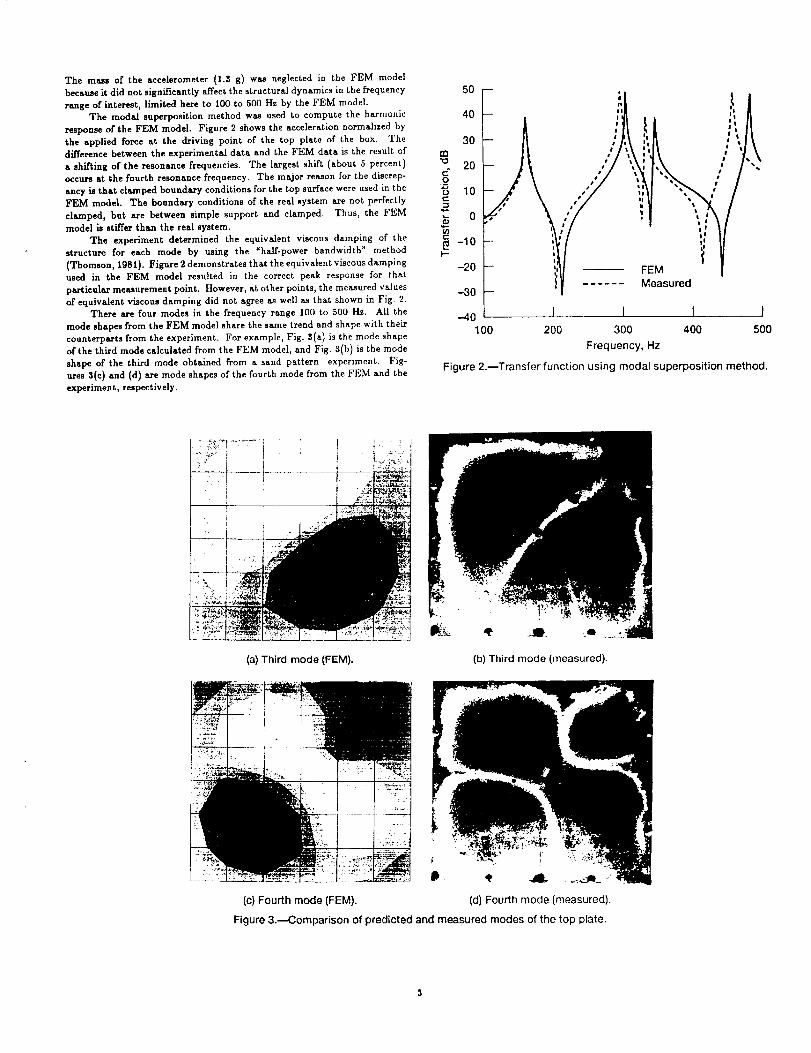
There are four modes in the frequency range 100 to 500 Hz. All the
mode shapes from the FEM model sharethe seinetrend and shape with their
counterpartsfrom the experiment. For example, Fig.3(a) isthe mode shape
of the thirdmode calculatedfrom the FEM model, and Fig. 3(b) isthe mode
shape of the third mode obtained from a sand pattern experiment. Fig-
ures 8(c) and (d) are mode shapes ofthe fourth mode from the FEM and the
experiment, respectively.
rn"o
t-o
ot-
t-
50 --
40 -- _'
30 -- I ,
20 '/ '
10 -- ,"'/
Z
o ',"
-10 !
-20
-30
.4o I I I I100 200 300 400 500
Frequency, Hz
Figure 2.--Transfer function using modal superposition method.
t II
=iFEM
Measured
(a) Third mode (FEM). (b) Third mode (measured).
(c) Fourth mode (FEM). (d) Fourth mode (measured).
Figure 3.---Comparison of predicted and measured modes of the top plate.
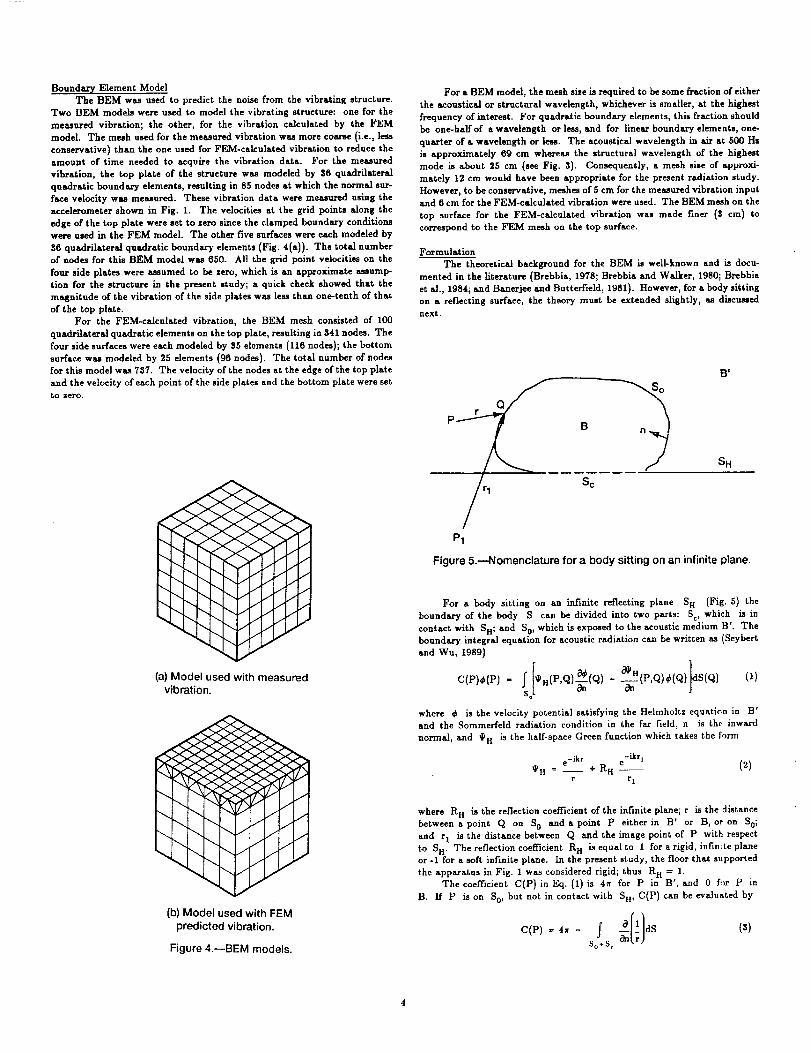
Boundary Element ModelThe BEN[ was used to predict the noise from the vibrating structure.
Two BEM models were used to model the vibrating structure: one for the
measured vibration; the other, for the vibration calculated by the FEM
model. The mssh u_d for the measured vibration was more coarse (i.e., less
conservative) than the one used for FEM-calculated vibration to reduce theamount of time needed to acquh'e the vibration data. For the measured
vibration, the top plate of the structure was modeled by 36 quadrilateral
quadratic boundary elements, resulting in 85 nodes at which the normal sur-
face velocity was measured. These vibration data were measured using the
accelerometer shown in Fig. 1. The velocities at the grid points along the
edge of the top plate were set to sero since the clamped boundary conditionswere used in the FEM model. The other five surfaces were each modeled by
S6 quadrilateral quadratic boundary elements (Fig. 4(a)). The total number
of nodes for this BEN[ model was 650. All the grid point velocities on the
four side plates were assumed to be zero, which is an appcoximate assump-tion for the structure in the present study; a quick check showed that the
magnitude of the vibration of the side plates was less than one-tenth of that
of the top plate.
For the FEM-calculated vibration, the BEM mesh consisted of 100
quadrilateral quadratic elements on the top plate, resulting in 341 nodes. The
four side surfaces were each modeled by $5 elements (116 nodes); the bottom
surface was modeled by 25 elements (96 nodes). The total number of nodes
for this model was 737. The velocity of the nodes at the edge of the top plate
and the velocity of each point of the side plates and the bottom plate were set
to sero.
I
.'>
..,>J-,>
(a) Model used
vibration.
>>f
J
<
with measured
f(b) Model used with FEM
predicted vibration.
Figure 4.--BEM models.
For a BEM model, the mesh sise is required to be some fraction of either
the acousticalor structuralwavelength, whichever issmaller,at the highest
frequency of interest.For quadratic boundary dements, thisfractionshould
be one-halfof a wavelength or less,and for linearboundary elements, one-
quarter of a wavelength or less.The acousticM wavelength in air at 500 I-Is
is_pproxirnately 69 cm whereas the structuralwavelength of the highest
mode isabout 25 cm (seeFig. 3). Consequently, a mesh siseof approxi-
mately 12 cm would have been appropriate for the present radiation study.
However, to be conservative, meshes of 5 cm for the measured vibration inputand 6 cm for the FEM-cnlculated vibration were used. The BEM mesh on the
top surface for the FEM-calculated vibration was made finer ($ cm) to
correspond to the FEM mesh on the top surface.
Formulation
The theoreticalbackground for the BEM is well-known and isdocu-
mented inthe literature(Brebbia, 1978;Brebbia and Walker, 1980; Brebbia
etal.,1984;and Banerjee and Butterfleld_1981). However, for a body sitting
on a reflectingsurface,the theory must be extended slightly,as discussed
next.
a I
P B
SH
Pl
Figure 5.---Nomenclature for a body sitting on an infinite plane.
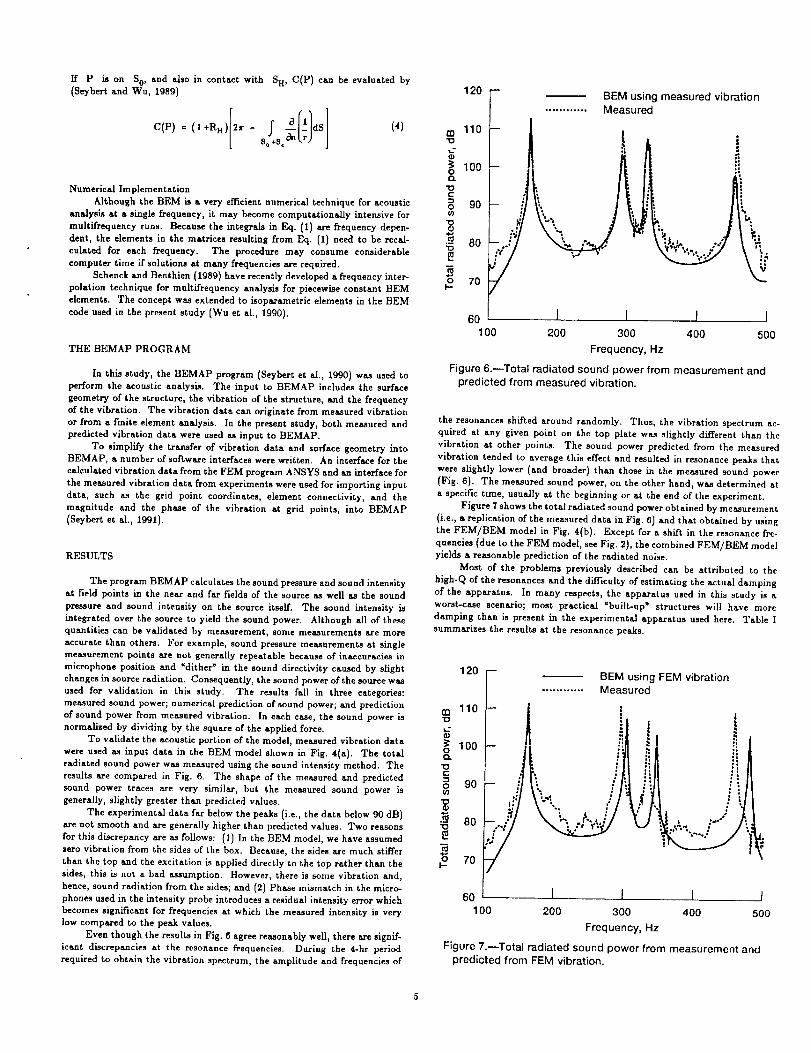
For a body sittingon an infinitereflectingplane SH (Fig.5) the
boundary of the body S can be divided into two parts: So, which isin
contact with SH; and S0, which isexposed to the acousticmedium B'. The
boundaxy integralequation for acousticradiationcan be written as (Seybert
and Wu, 1989)
C(P),(P) ffi !o[' I.](P,Q)-_n-(Q) - --_-H-(P,Q) '(Q) ]dS (Q) (1)
where @ isthe velocity potentialsatisfyingthe Helmholts equation in B'
and the Sommerfeld radiation condition in the far field,n is the inward
normal, and ¢JH isthe half-spaceGreen function which takes the form
e-ikr ~ikrl
Sa = -- + Ra e (2)
r r I
where R H isthe reflectioncoefficientof the infiniteplane; r isthe distance
between a point Q on So and a point P eitherin B' or B, or on So;
and rI isthe distance between Q and the image point of P with respect
to S H. The reflectioncoefficientR H isequal to I for a rigid,infiniteplane
or -i for a softinfiniteplane. In the present study, the floorthat supported
the apparatus in Fig. 1 was considered rigid;thus R H = I.
The coefficientC(P)in gq. (1)is 4_ for P in B', and 0 for P in
B. If P ison So, but not in contact with SH, C(P) can be evaluated by
C(P) = 4= - f NI, r)S0+S c
If P is on So, and also in contact with SH, C(P} can be evaluated by
(Seybert and Wu, 1989)
Numerical Implementation
Although the BEM is a very efficientnumerical technique for acoustic
analysis at a singlefrequency,itmay become computationally intensivefor
multifrequency runs. Because the integralsin Eq. (1) are frequency depen-
dent, the elements in the matrices resultingfrom Eq. (1} need to be recal-
culated for each frequency. The procedure may consume considerable
computer time ifsolutionsat many frequenciesare required.
Schenck and Benthien {1989) have recentlydeveloped a frequency inter-
polation technique for multifrequency analysisfor piecewiseconstant BEM
elements. The concept was extended to isoparametrlcelements in the BEM
code used in the presentstudy (Wu et al.,1990).
THE BEMAP PROGRAM
In thisstudy, the BEMAP program (Seybert eta].,1990) was used to
perform the acoustic analysis. The input to BEMAP includes the surface
geometry of the structure,the vibrationof the structure,and the frequency
ofthe vibration. The vibration data can originatefrom measured vibration
or from a finiteelement analysis. In the present study, both measured and
predictedvibrationdata were used as input to BEMAP.
To simplify the transferof vibration data and surface geometry into
BEMAP, a number of software interfaceswere written. An interfacefor the
calculatedvibrationdata from the FEM program ANSYS and an interfacefor
the measured vibrationdata from experiments were used for importing input
data, such as the grid point coordinates, element connectivity, and the
magnitude and the phase of the vibration at grid points, into BEMAP
(Seybert et al.,1991).
RESULTS
The program BEMAP calculatesthe sound pressureand sound intensity
at fieldpoints in the near and far fieldsof the source as well as the sound
pressure and sound intensityon the source itself.The sound intensityis
integratedover the source to yieldthe sound power. Although allof these
quantitiescan be validated by measurement, some measurements are more
accurate than others. For example, sound pressure measurements at single
measurement points are not generallyrepeatable because of inaccuraciesin
microphone positionand "dither" in the sound directivitycaused by slight
changes insource radiation.Consequently, the sound power ofthe source was
used for validation in this study. The resultsfallin three categories:
measured sound power; numerical predictionof sound power; and prediction
of sound power from measured vibration. In each case,the sound power is
normalised by dividing by the square of the appliedforce.
To validate the acousticportion ofthe model, measured vibration data
were used as input data in the BEM model shown in Fig. 4(a). The total
radiated sound power was measured using the sound intensitymethod. The
resultsare compared in Fig. 6. The shape of the measured and predicted
sound power traces are very similar,but the measured sound power is
generally,slightlygreaterthan predicted values.
The experimental data far below the peaks {i.e.,the data below 90 dB)
are not smooth and are generallyhigher than predictedvalues, Two reasons
for thisdiscrepancy are as follows: (I)In the BEM model, we have assumed
zero vibration from the sidesof the box. Because, the sidesare much stiffer
than the top and the excitationisapplieddirectlyto the top rather than the
sides,this isnot a had assumption. However, there issome vibration and,
hence, sound radiationfrom the sides;and (2)Phase mlsmntch in the micro-
phones used in the intensityprobe introducesa residualintensityerrorwhich
becomes significantfor frequenciesat which the measured intensityis very
low compared to the peak values.
Even though the resultsinFig.6 agree reasonablywell,there aresignif-
icant discrepanciesat the resonance frequencies. During the 4-hr period
required to obtain the vibration spectrum, the amplitude and frequenciesof
120
m 110"0
t-O
_o 100Q."0C
0 90¢q
-=o
_ 80
_ 70I.-
-- BEM using measured vibration
............ Measured
6o I I _ I100 200 300 400 500
Frequency, Hz
Figure 6.--3"oral radiated sound power from measurement and
predicted from measured vibration.
the resonances shiftedaround randomly. Thus, the vibration spectrum ac-
quired at any given point on the top plate was slightlydifferentthan the
vibration at other points. The sound power predicted from the measured
vibration tended to average this effectand resulted in resonance peaks that
were slightlylower (and broader) than those in the measured sound power
{Fig.6). The measured sound power, on the other hand, was determined at
a specifictime, usually at the beginning or at the end of the experiment.
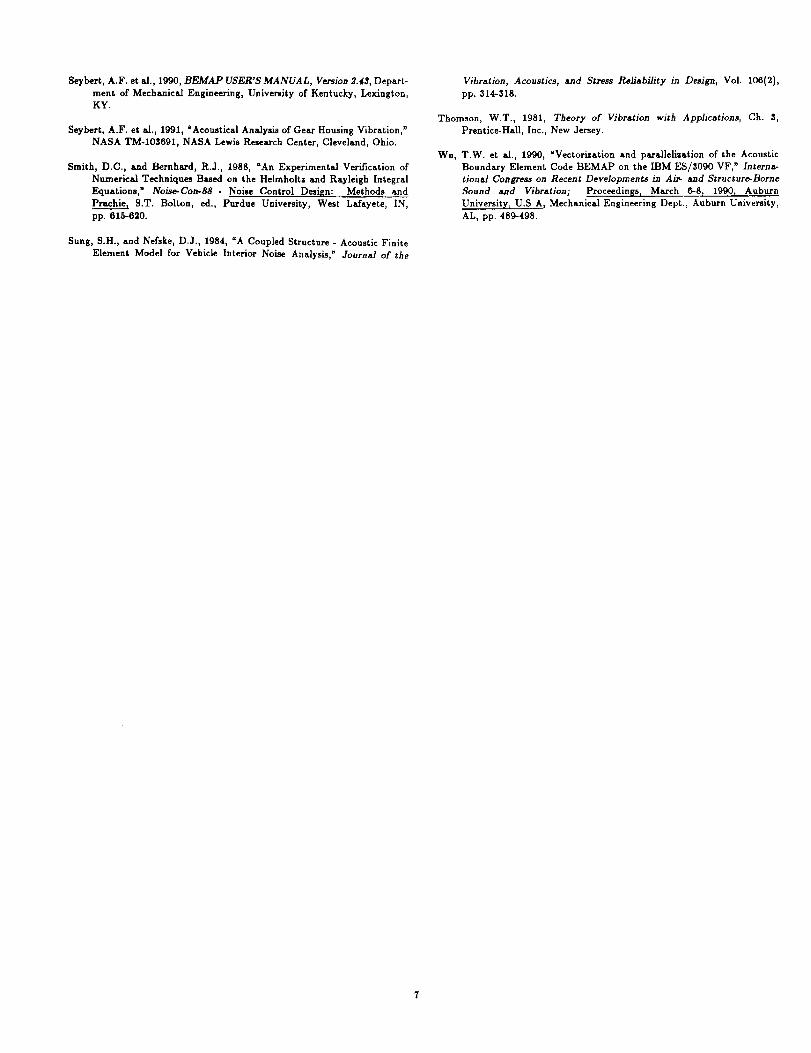
Figure 7 shows the totalradiated sound power obtained by measurement
(i.e.,a replicationof the measured data inFig. 6) and that obtained by using
the FEM/BEM model in Fig. 4(b). Except for a shiftin the resonance fre-
quencies (due to the FEM model, see Fig.2),the combined FEM/BEM model
yieldsa reasonable predictionof the radiated noise.
Most of the problems previously described can be attributed to the
high-Q of the resonances and the difficultyofestimating the actual damping
of the apparatus. In many respects,the apparatus used in thisstudy isa
worst-case scenario;most practical =built-up_ structures will have more
damping than is present in the experimental apparatus used here. Table I
summaxises the resultsat the resonance peaks.
120 --
m 11010
0
o_ 100c}.
"1ot-
O 90v}
(D
,_ 80"0
g 70I..-
BEM using FEM vibration
............ Measured
t
J ::::
t:
6o I I I I100 200 300 400 500
Frequency, Hz
Figure 7.--Total radiated sound power from measurement and
predicted from FEM vibration.
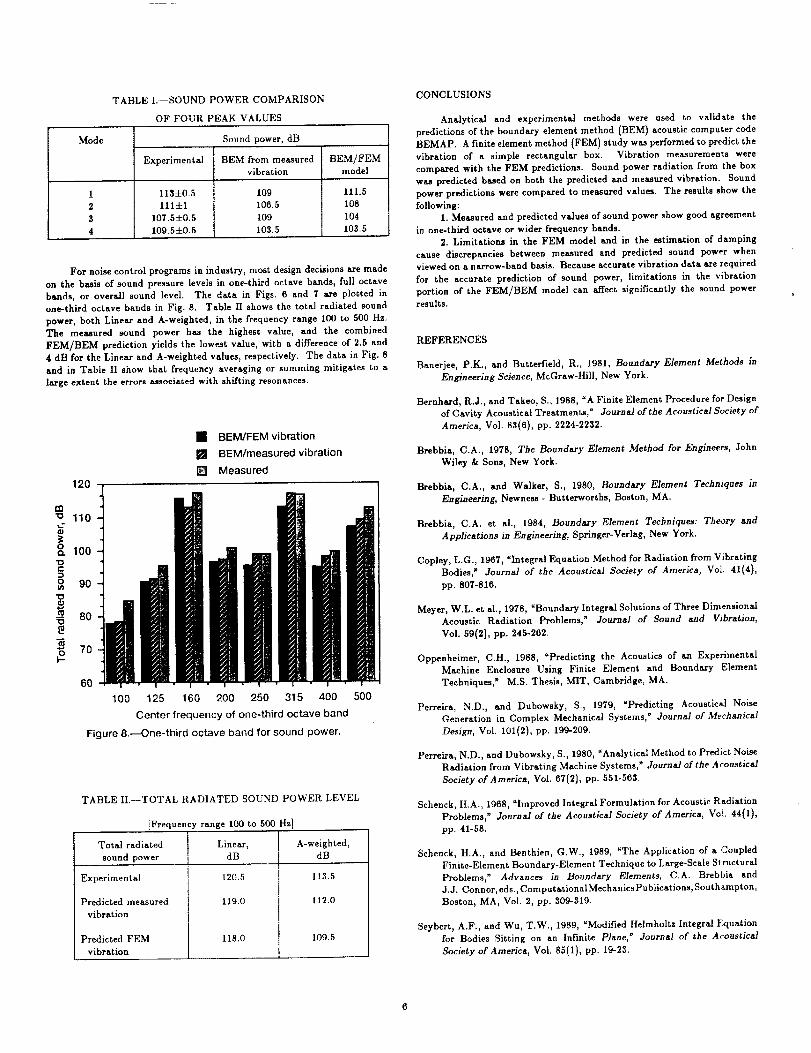
TABLE I.--SOUND POWER COMPARISON
OF FOUR PEAK VALUES
Mode
Experimental
1 113_0.3
2 lllfl:l
3 107.5=k0.5
4 109.5:J:0.5
Sound power, dB
BEM from measured BEM/FEMvibration model
109 111.5
106.5 108
109 104
105.5 103.5
For noisecontrolprograms in industry,most design decisionsare made
on the basis of sound pressure levelsin one-thirdoctave bands, fulloctave
bands, or overallsound level. The data in Figs. 6 and 7 are plotted in
one-third octave bands in Fig. 8. Table H shows the totalradiated sound
power, both Linear and A-weighted, in the frequency range 100 to 500 Hz.
The measured sound power has the highest value, and the combined
FEM/BEM predictionyieldsthe lowest value, with a differenceof 2.5 and
4 dB for the Linear and A-weighted values, respectively. The data in Fig. 8
and in Table II show that frequeney averaging or summing mitigates to a
large extent the errors associated with shifting resonances.
120
• BEM/FEM vibration
[] BEM/rneasured vibration
[] Measured
rn"o 110
o 100
o 90I,@
"t_
--_ 80
I-.-
60
100 125 160 200 250 315 400
Center frequency of one-third octave band
Figure 8.---One-third octave band for sound power.
500
TABLE II.---TOTAL RADIATED SOUND POWER LEVEL
[Frequency range I00 to 500 Hz]
Total radiated Linear, A-weighted,
sound power dB dB
Experimental
Predicted measured
vibration
Predicted FEM
vibration
120.5
119.0
118.0
113.5
112.0
109.5
CONCLUSIONS
Analytical and experimental methods were used to validate the
predictionsof the boundary element method (BEM} acousticcomputer code
BEMAP. A finiteelement method {FEM) study was performed topredictthe
vibration of a simple rectangular box. Vibration measurements were
compared with the FEM predictions. Sound power radiationfrom the box
was predicted based on both the predicted and measured vibration. Sound
power predictionswere compared to measured values. The resultsshow the
following:
I. Measured and predictedvalues of sound power show good agreement
in one-thlrdoctave or wider frequency bands.
2. Limitations in the FEM model and in the estimation of damping
cause discrepancies between measured and predicted sound power when
viewed on a narrow-band basis. Because accurate vibrationdata are required
for the accurate prediction of sound power, limitationsin the vibration
portion of the FEM/BEM model can reelectsignificantlythe sound power
results.
REFERENCES
Banerjee, P.K., and Butterfield, R., 1981, Boundary Element Methods in
Engineering Science, McGraw-Hill, New York.
Bernhard, R.J., and Takeo, S., 1988, "A Finite Element Procedure for Design
of Cavity Acoustical Treatments," Journal of the Acoustical Society of
America, Vol. 83(6), pp. 2224-2232.
Brebbia, C.A., 1978, The Boundary Element Method for Engineers, John
Wiley & Sons, New York.
Brebbia, C.A., and Walker, S., 1980, Boundary Element Techniques in
Engineering, Newness - Butterworths, Boston, MA.
Brebbia, C.A. et al., 1984, Boundary Element Techniques: Theory and
Applications in Engineering, Springer-Verlag, New York.
Copley, L.G., 1967, aIntegralEquation Method for Radiation from Vibrating
Bodiesf Journal of the Acoustical Society of America, Vol. 41(4),
pp. 807-816.
Meyer, W.L. et al., 1978, "Boundary Integral Solutions of Three Dimensional
Acoustic Radiation Problems," Journal of Sound and Vibration,
Vol. 59(2), pp. 245-262.
Oppenheimer, C.H., 1988, =Predicting the Acoustics of an Experimental
Machine Enclosure Using Finite Element and Boundary Element
Techniques," M.S. Thesis,MIT, Cambridge, MA.
Perrelra, N.D., and Dubowsky, S., 1979, =Predicting Acoustical Noise
Generation in Complex Mechanical Systems," JournM of Mechanical
Design, Vol. 101(2), pp. 199-209.
Perreira, N.D., and Dubowsky, S., 1980, =Analytical Method to Predict Noise
Radiation from Vibrating Machine Systems, _ Journal of the Acoustical
Society of America, Vol. 67(2), pp. 551-563.
Schenck, H.A., 1968, "Improved Integral Formulation for Acoustic Radiation
Problems," Journal of the Acoustlca] Society of America, Vet. 44(1),
pp. 41-58.
Schenck, H.A., and Benthien, G.W., 1989, =The Application of a Coupled
Finite-Element Boundary-Element Technique to Large-Scale Structural
Problems," Advances in Boundary Elements, C.A. Brebbia and
3.J. Conner, eds., Computational Mechanics Publications, Southampton,
Boston, MA, Vol. 2, pp. $09-_19.
Seybert, A.F., and Wu, T.W., 1989, "Modified Helmholtz Integral Equation
for Bodies Sitting on an Infinite Plane," Journal of the AcousticM
Society of America, Vol. 85(1}, pp. 19-23.
Seybert, A.F. et al., 1990, BEMAP USER'S MANUAL, Version 2._3, Depart-
ment of Mechanical Engineering, University of Kentucky, Lexington,KY.
Seybert, A.F. et al.,1991, JAcoustical Analysis of Gear Housing Vibration,_
NASA TM-105691, NASA Lewis Research Center, Cleveland, Ohio.
Smith, D.C., and Bernhard, R.J., 1988, aAn Experimental Verificationof
Numerical Techniques Based on the I-Ielmholtzand Ray]eigh Integral
Equations,_ No, Con-88- Noise Control Design: Methods and
Pr_hie, S.T. Bolton, ed., Purdue University, West Lafayete, IN,
pp. 615-620.
Sung, S.H.,and Nefske, D.J., 1984, aA Coupled Structure- Acoustic Finite
Element Model for Vehicle InteriorNoise Analysis," Journal of the
Vibration, Acoustic.s, and Stress Reliability in Design, Vol. 106(2),
pp. 314-318.
Thomson, W.T., 1981, Theor X of Vibration with Applications, Ch. 3,
Prentice-Hall,Inc.,New Jersey.
Wu, T.W. et al.,1990, _Vectorisation and parallelisationof the Acoustic
Boundary Element Code BEMAP on the IBM ES/3090 VF, _ Interna-
tionad Congress on Recent Developments in Ait_ and Structure-Borne
Sound and Vibration; Proceedings w March 6-8: 1990; Auburn
University_ U.S A, Mechanical Engineering Dept., Auburn University,
AL, pp. 489-198.
Form ApprovedREPORT DOCUMENTATION PAGE OMB NO. 0704-01B8
Public reporting burden for this collection of information is estimated to average 1 hour per response, including the time lor reviewing instructions, searching existing data sources,
gathering and maintaining the data needed, and completing and reviewing the collection of information. Send comments regarding this burden eslimale or any other aspect of this
collection of intormation, including suggesttons lor reducing this burden, to Washington Headquarters Services, Directorate for information Operations and Reports, 1215 Jefferson
Davis Highway,, Suite 1204, Arlington, VA 22202-4302, and to the Office of Management and Budget, Paperwork Reduction Prolect (0704_0188). Washington, DC 20503.
1. AGENCY USE ONLY (Leave blank) 12. REPORT DATE 3. REPORT TYPE AND DATES COVERED
I November 1992 Technical Memorandum
4. TITLE AND SUBTITLE 5. FUNDING NUMBERS
Validation of Finite Element and Boundary Element Methods for Predicting
Structural Vibration and Radiated Noise
6. AUTHOR(S)
A.F. Seybert, X.F. Wu, and Fred B. Oswald
7. PERFORMING ORGANIZATION NAME(S) AND ADDRESS(ES)
National Aeronautics and Space Administration
Lewis Research Center
Cleveland, Ohio 44135-3191
9. SPONSORING/MONITORING AGENCY NAMES(S) AND ADORESS(ES)
National Aeronautics and Space Administration
Washington, D.C. 20546-0001
WU-505-63-39
8. PERFORMING ORGANIZATIONREPORT NUMBER
E-7127
10. SPONSORING/MONITORINGAGENCY REPORTNUMBER
NASA TM- 105359
AVSCOM TR-92-C-050
11. SUPPLEMENTARY NOTES
Prepared for the American Society of Mechanical Engineers, Winter Annual Meeting, Anaheim, California, November 8-13 1992.
A.F. Seybert and X.E Wu, Department of Mechanical Engineering, University of Kentucky, Lexington, Kentucky, and Fred B.
Oswald, NASA Lewis Research Center, Cleveland, Ohio. Responsible person, Fred B. Oswald, (216) 433-3957.
12a. DISTR|BUTION/AVAILABILITY STATEMENT 12b. DISTRIBUTION CODE
Unclassified - Unlimited
Subject Category 37
13. ABSTRACT (Maximum 200 words)
Analytical and experimental validation of methods to predict structural vibration and radiated noise is presented in this
paper. A rectangular box excited by a mechanical shaker was used as a vibrating structure. Combined finite elemenl
method (FEM) and boundary element method (BEM) models of the apparatus were used to predict the noise radiated from
the box. The FEM was used to predict the vibration, and the surface vibration was used as input to the BEM to predict the
sound intensity and sound power. Vibration predicted by the FEM model was validated by experimental modal analysis.
Noise predicted by the BEM was validated by sound intensity measurements. Three types of results arc presented for the
total radiated sound power: (1) sound power predicted by the BEM model using vibration data measured on the surface
of the box, (2) sound power predicted by the FEM/BEM model, and (3) sound power measured by a sound intensity scan.
The sound power predicted from the BEM model using measured vibration data yields an excellent prediction of radiated
noise. The sound _)wer predicted by the combined FEM/BEM model also gives a good prediction of radiated noise except
for a shift of the natural frequencies that are due to limitations in the FEM model.
14. SUBJECT TERMS
Acoustic intensity, Noise, Vibration, Boundary element, Finite element
17. SECURITY CLASSIFICATIONOF REPORT
Unclassified
18. SECURITY CLASSIFICATIONOF THIS PAGE
Unclassified
NSN 7540-01-280-5500
19. SECURITYCLASSIFICATIONOF ABSTRACT
Unclassified
15. NUMBER OF PAGES8
16. PRICE CODEA02
20. LIMITATION OF ABSTRACT
Standard Form 298, trey. 2-89)
Prescribed by ANSI Std. Z39-1B
298-102

National Aeronautics and
Space Administration
Lewis Research Center
Cleveland, Ohio 44135
Official Bual_
Pe_ny for Pdvme Uu
FOURTH CLASS MAIL
ADDRESS CORRECTION REQUESTED
IiiUl
Postage and Fees Pa_FJNahonal Aeronauhcs and
Space AdmmLslrah()n
NASA 451
N/LRAii i


![Hunter, P - Finite Element Method & Boundary Element Method [Course Notes 2001]](https://img.pdfslide.us/doc/110x75/552d570e4a7959c6598b4696/hunter-p-finite-element-method-boundary-element-method-course-notes-2001.jpg)