Embed Size (px)
Citation preview

International Cloud Working Group Mtg., Lille, France, 17-20 May 2016
Validation of Cloud Parameters Derived from
Geostationary Satellites, AVHRR, MODIS, and
VIIRS Using SatCORPS Algorithms
P. Minnis1, S. Sun-Mack2, K. M. Bedka1, C. R. Yost2, Q.
Z. Trepte2, W. L. Smith, Jr. 1, D. Painemal2, Y. Chen2, R.
Palikonda2, X. Dong2, B. Xi2
1NASA Langley Research Center, Hampton, VA, USA
2SSAI, Hampton, VA, USA
https://ntrs.nasa.gov/search.jsp?R=20160009171 2018-07-01T22:48:58+00:00Z
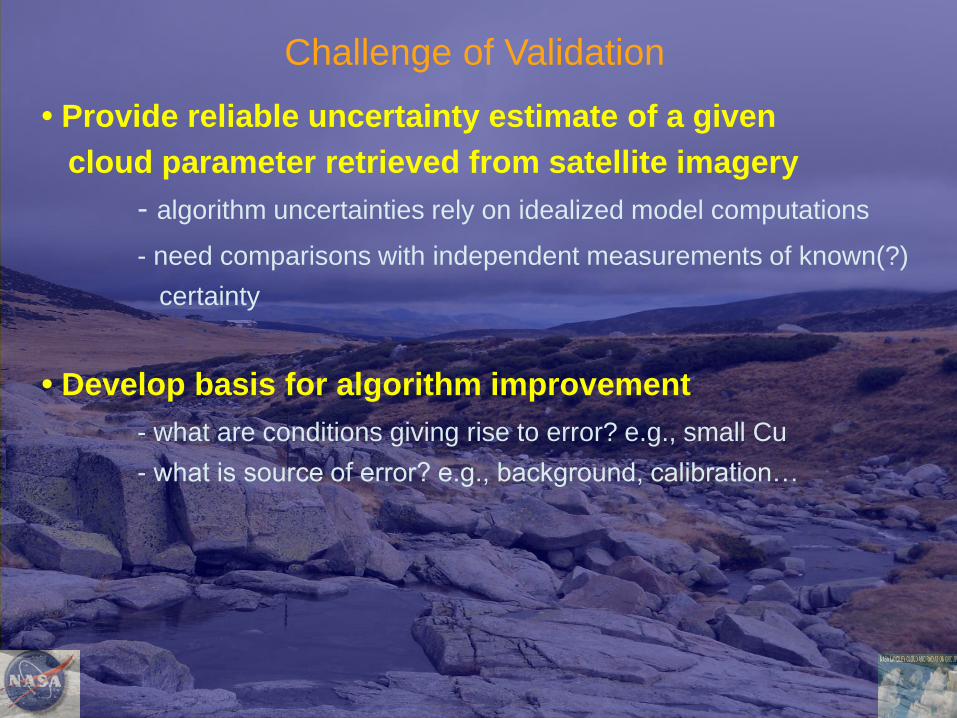
Challenge of Validation
• Provide reliable uncertainty estimate of a given
cloud parameter retrieved from satellite imagery
- algorithm uncertainties rely on idealized model computations
- need comparisons with independent measurements of known(?)
certainty
• Develop basis for algorithm improvement
- what are conditions giving rise to error? e.g., small Cu
- what is source of error? e.g., background, calibration…

INDEPENDENT MEASUREMENT SOURCES*
Platform parameters pros cons
• In situ CF, Zt, Zb, COD, Re, most physical, sparse, 1 level at a time,
CWC, Habit, phase integratable? µ-physics guys disagree
• surface or CF, Zt, Zb, COD, Re, transmission or spatially sparse, requires
ship sites CWC, Habit, phase, active sensors, in situ valid, sometimes
CWP diurnal cycle trouble with Zt
• other satellites CF, Zt, Zb, COD, Re, assess q depend, same probs as target,
CWC, Habit?, phase, same/different mostly cloud top only
CWP methods
• Quality and number of parameters depend on instruments available!
• All measurements have their own uncertainties, which can be large

Langley (LaRC) Imager Cloud Retrievals Considered
• Aqua MODIS: CERES Ed4, 1 km subsampled 2x4 => 2.8 km
• SNPP VIIRS: CERES Ed1, 0.75 km subsampled 2x4 => 2.4 km
• GEOSats: GOES-E, GOES-W, Meteosat, MTSAT (4 km), Himiwari-8
• AVHRR: GAC 4 km, NOAA-18 JAJO
Satellites / Imagers
Methodology
• VISST: 0.65, 3.8, 11, 12 µm (daytime)
• SIST: 3.8, 11, 12 µm, or 3.8 & 11 µm (night SZA > 82°)
• SINT: 1.24, 3.8, 11, 12 µm (day over snow, MODIS & VIIRS)
- Minnis et al. (2010, 2011)
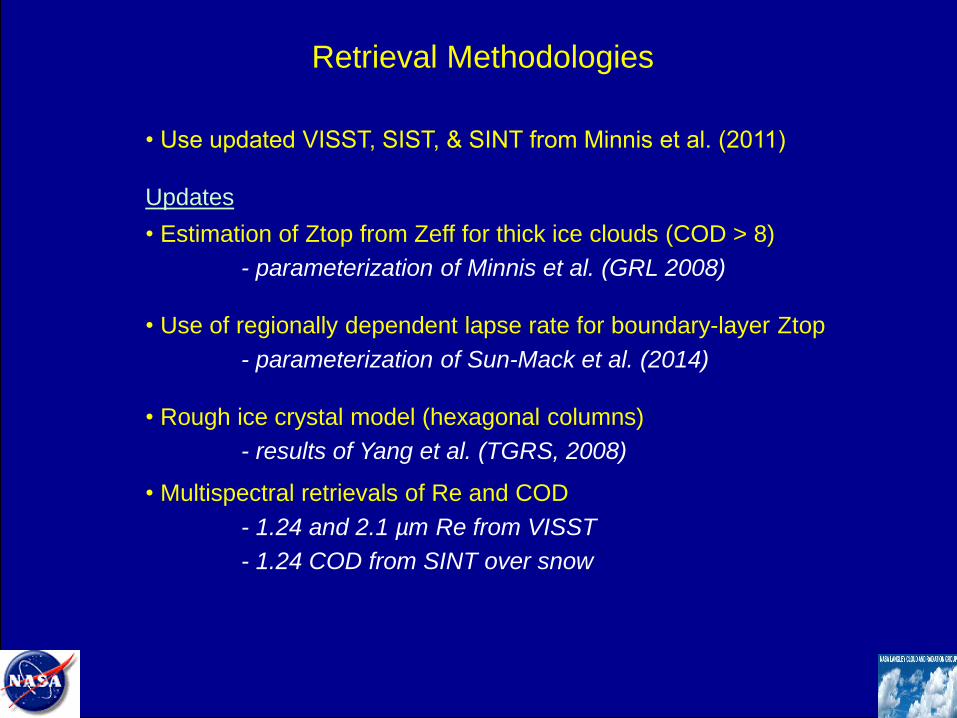
Retrieval Methodologies
• Use updated VISST, SIST, & SINT from Minnis et al. (2011)
Updates
• Estimation of Ztop from Zeff for thick ice clouds (COD > 8)
- parameterization of Minnis et al. (GRL 2008)
• Use of regionally dependent lapse rate for boundary-layer Ztop
- parameterization of Sun-Mack et al. (2014)
• Rough ice crystal model (hexagonal columns)
- results of Yang et al. (TGRS, 2008)
• Multispectral retrievals of Re and COD
- 1.24 and 2.1 µm Re from VISST
- 1.24 COD from SINT over snow
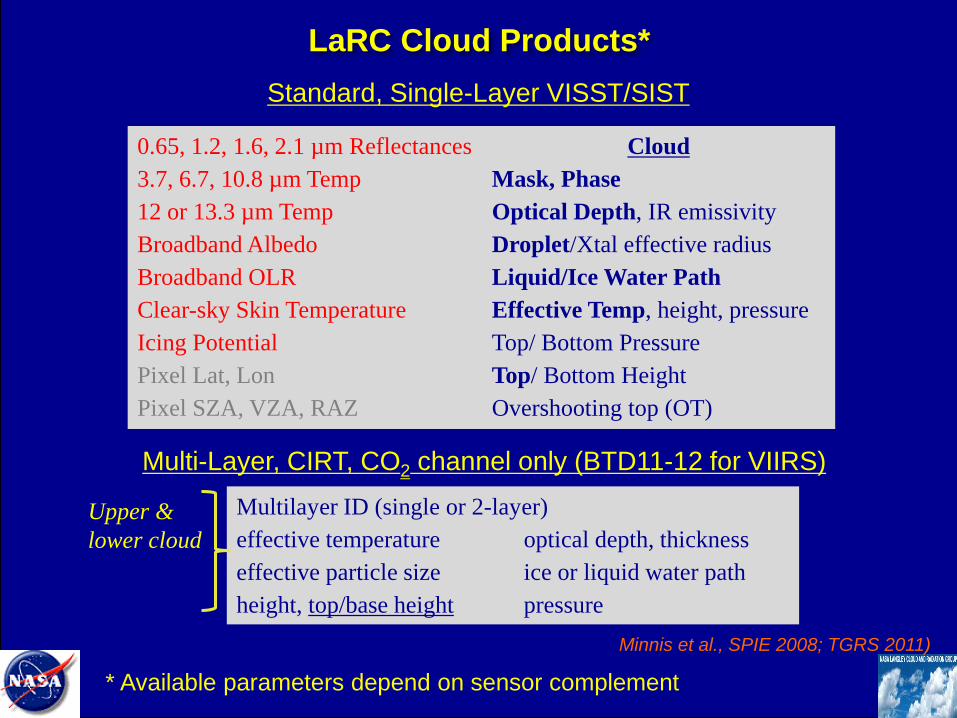
Cloud
Mask, Phase
Optical Depth, IR emissivity
Droplet/Xtal effective radius
Liquid/Ice Water Path
Effective Temp, height, pressure
Top/ Bottom Pressure
Top/ Bottom Height
Overshooting top (OT)
0.65, 1.2, 1.6, 2.1 µm Reflectances
3.7, 6.7, 10.8 µm Temp
12 or 13.3 µm Temp
Broadband Albedo
Broadband OLR
Clear-sky Skin Temperature
Icing Potential
Pixel Lat, Lon
Pixel SZA, VZA, RAZ
Multilayer ID (single or 2-layer)
effective temperature optical depth, thickness
effective particle size ice or liquid water path
height, top/base height pressure
Upper &
lower cloud
LaRC Cloud Products*
Standard, Single-Layer VISST/SIST
Multi-Layer, CIRT, CO2 channel only (BTD11-12 for VIIRS)
Minnis et al., SPIE 2008; TGRS 2011)
* Available parameters depend on sensor complement
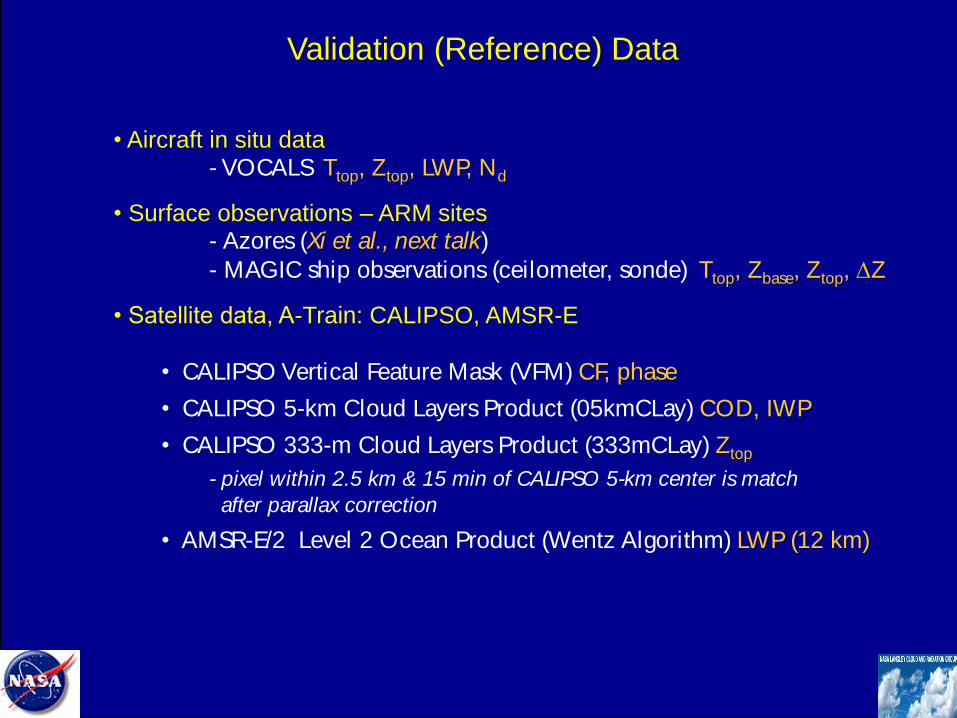
Validation (Reference) Data
• Aircraft in situ data- VOCALS Ttop, Ztop, LWP, Nd
• Surface observations – ARM sites- Azores (Xi et al., next talk)
- MAGIC ship observations (ceilometer, sonde) Ttop, Zbase, Ztop, DZ
• Satellite data, A-Train: CALIPSO, AMSR-E
• CALIPSO Vertical Feature Mask (VFM) CF, phase
• CALIPSO 5-km Cloud Layers Product (05kmCLay) COD, IWP
• CALIPSO 333-m Cloud Layers Product (333mCLay) Ztop
- pixel within 2.5 km & 15 min of CALIPSO 5-km center is match
after parallax correction
• AMSR-E/2 Level 2 Ocean Product (Wentz Algorithm) LWP (12 km)
Surface Example
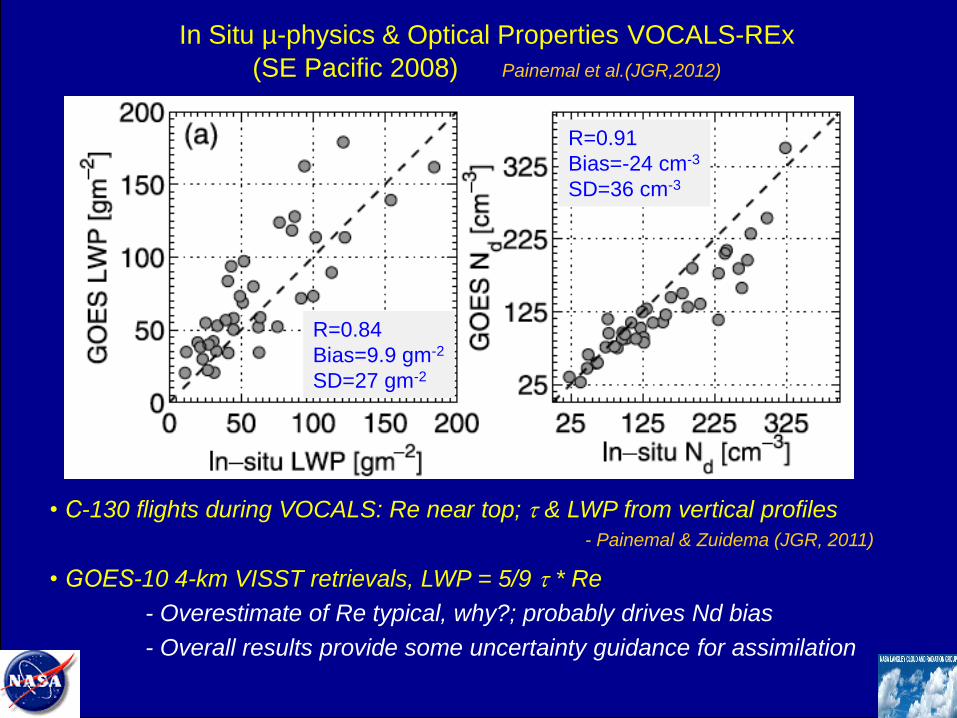
In Situ µ-physics & Optical Properties VOCALS-REx
(SE Pacific 2008) Painemal et al.(JGR,2012)
• C-130 flights during VOCALS: Re near top; t & LWP from vertical profiles
- Painemal & Zuidema (JGR, 2011)
• GOES-10 4-km VISST retrievals, LWP = 5/9 t * Re
- Overestimate of Re typical, why?; probably drives Nd bias
- Overall results provide some uncertainty guidance for assimilation
R = 0.91
Bias = 2.4 µm
SD = 1.1 µm
R = 0.79
Bias = 0.5
SD = 3.7
R=0.84
Bias=9.9 gm-2
SD=27 gm-2
R=0.91
Bias=-24 cm-3
SD=36 cm-3

Day
Night
• Ttop colder than air; seen in other marine Sc areas with MODIS data
- drops colder than air?
• Heights very close with both techniques (lapse rate & new technique)
• 1 region, 1 satellite, 1 season
R=0.86
Bias=-1.0°C
SD=1.5°C
R=0.86
Bias=84 m
SD=135 m
Cloud-Top Height & Temperature VOCALS-Rex, GOES vs in situ
(SE Pacific 2008) Painemal & Minnis (JAS,2013)
Temperature Height

Surface Example
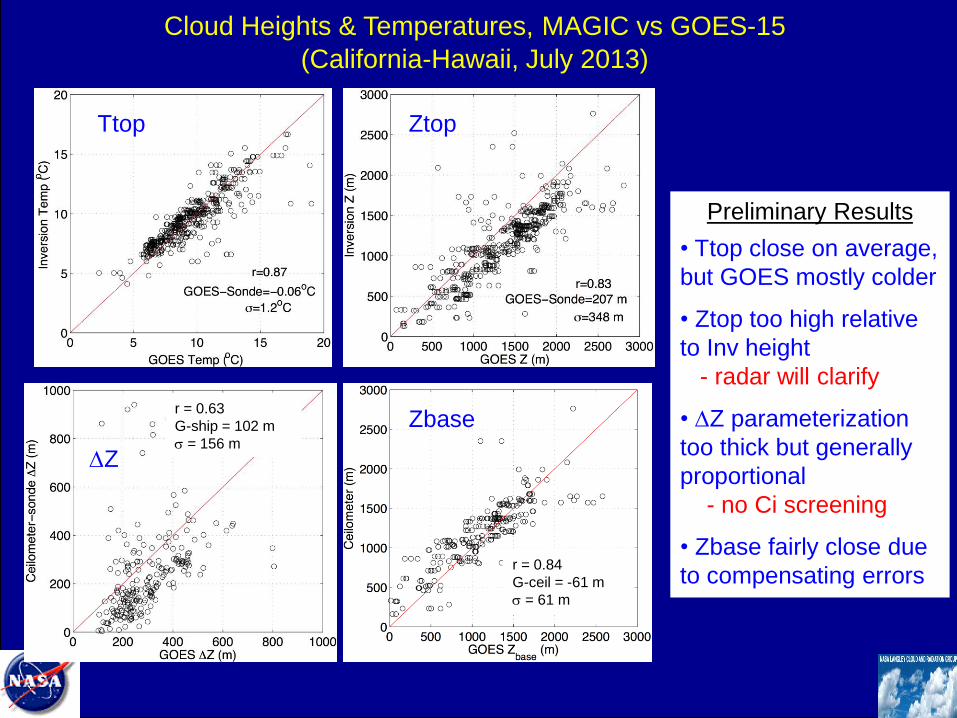
Preliminary Results
• Ttop close on average,
but GOES mostly colder
• Ztop too high relative
to Inv height
- radar will clarify
• DZ parameterization
too thick but generally
proportional
- no Ci screening
• Zbase fairly close due
to compensating errors
Cloud Heights & Temperatures, MAGIC vs GOES-15
(California-Hawaii, July 2013)
r = 0.63
G-ship = 102 m
s = 156 m
r = 0.84
G-ceil = -61 m
s = 61 m
Ttop Ztop
DZ
Zbase

Satellite to Satellite

CALIPSO VFM – no 80 km, 0.684
NPP VIIRS Ed1, 0.649 CM Ed4 – Aqua 0.644
NOAA-19 AVHRR, 0.671
Mean Cloud Fraction, April 2013, day
Day periods different in polar regions
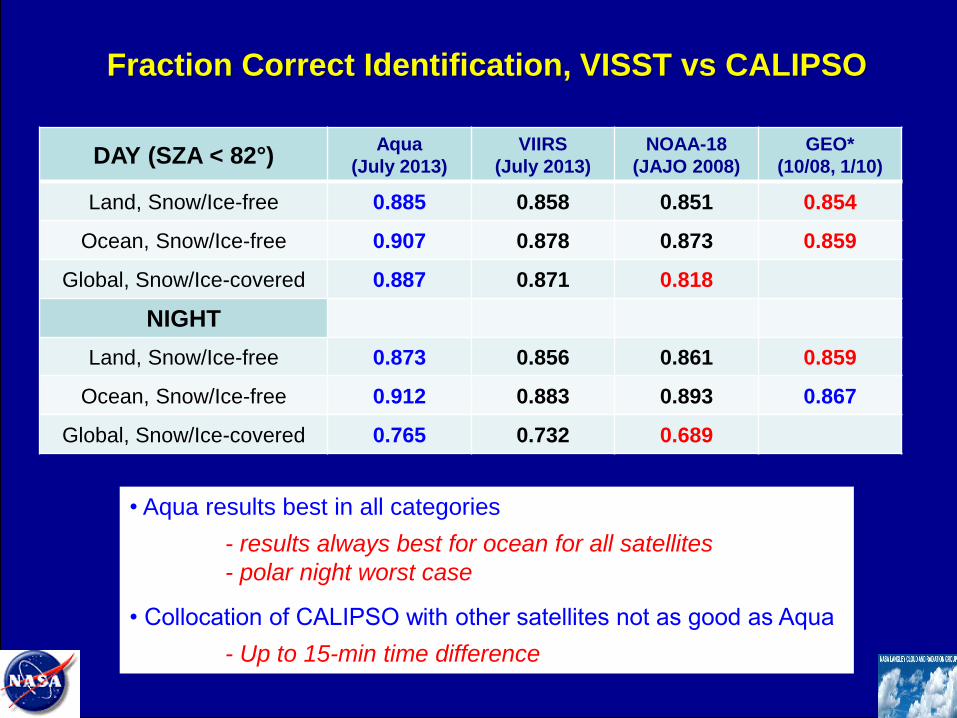
DAY (SZA < 82°)Aqua
(July 2013)
VIIRS
(July 2013)
NOAA-18
(JAJO 2008)
GEO*
(10/08, 1/10)
Land, Snow/Ice-free 0.885 0.858 0.851 0.854
Ocean, Snow/Ice-free 0.907 0.878 0.873 0.859
Global, Snow/Ice-covered 0.887 0.871 0.818
NIGHT
Land, Snow/Ice-free 0.873 0.856 0.861 0.859
Ocean, Snow/Ice-free 0.912 0.883 0.893 0.867
Global, Snow/Ice-covered 0.765 0.732 0.689
Fraction Correct Identification, VISST vs CALIPSO
• Aqua results best in all categories
- results always best for ocean for all satellites
- polar night worst case
• Collocation of CALIPSO with other satellites not as good as Aqua
- Up to 15-min time difference
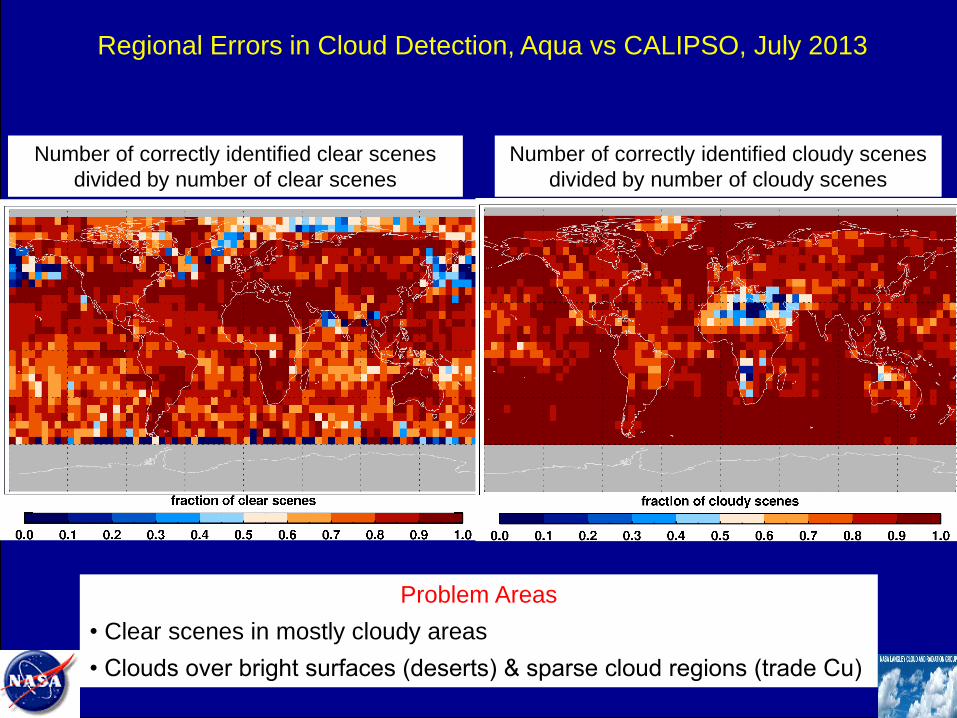
Number of correctly identified cloudy scenes
divided by number of cloudy scenes
Number of correctly identified clear scenes
divided by number of clear scenes
Regional Errors in Cloud Detection, Aqua vs CALIPSO, July 2013
Problem Areas
• Clear scenes in mostly cloudy areas
• Clouds over bright surfaces (deserts) & sparse cloud regions (trade Cu)
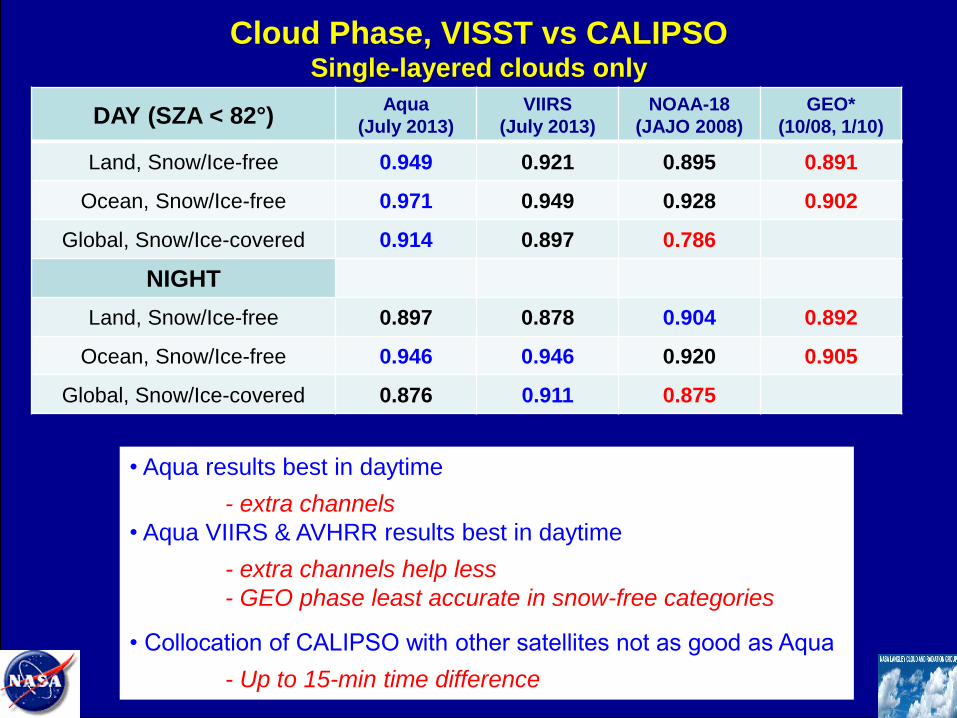
Cloud Phase, VISST vs CALIPSOSingle-layered clouds only
DAY (SZA < 82°)Aqua
(July 2013)
VIIRS
(July 2013)
NOAA-18
(JAJO 2008)
GEO*
(10/08, 1/10)
Land, Snow/Ice-free 0.949 0.921 0.895 0.891
Ocean, Snow/Ice-free 0.971 0.949 0.928 0.902
Global, Snow/Ice-covered 0.914 0.897 0.786
NIGHT
Land, Snow/Ice-free 0.897 0.878 0.904 0.892
Ocean, Snow/Ice-free 0.946 0.946 0.920 0.905
Global, Snow/Ice-covered 0.876 0.911 0.875
• Aqua results best in daytime
- extra channels
• Aqua VIIRS & AVHRR results best in daytime
- extra channels help less
- GEO phase least accurate in snow-free categories
• Collocation of CALIPSO with other satellites not as good as Aqua
- Up to 15-min time difference
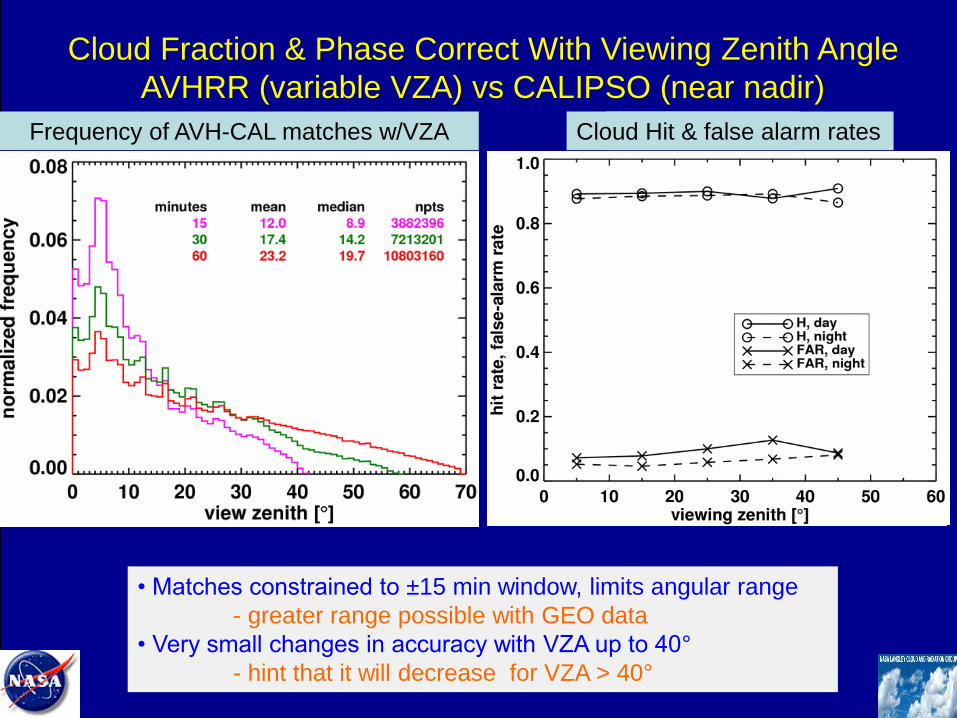
Cloud Fraction & Phase Correct With Viewing Zenith Angle
AVHRR (variable VZA) vs CALIPSO (near nadir)
Frequency of AVH-CAL matches w/VZA Fraction CorrectCloud Hit & false alarm rates
• Matches constrained to ±15 min window, limits angular range
- greater range possible with GEO data
• Very small changes in accuracy with VZA up to 40°
- hint that it will decrease for VZA > 40°
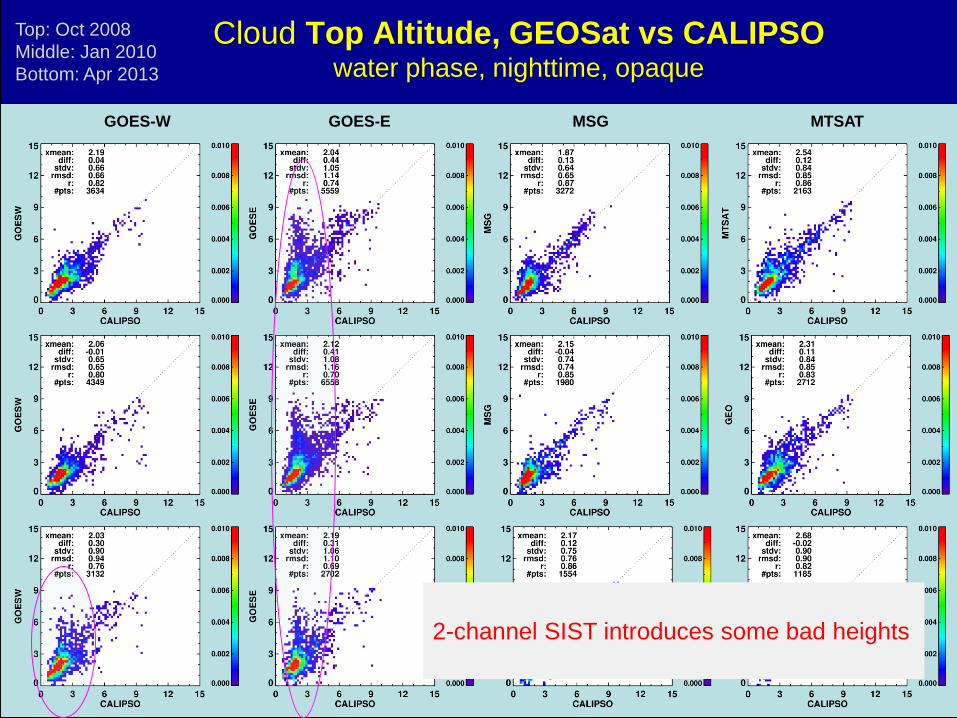
Cloud Top Altitude, GEOSat vs CALIPSOwater phase, nighttime, opaque
GOES-EGOES-W MSG MTSAT
Top: Oct 2008
Middle: Jan 2010
Bottom: Apr 2013
2-channel SIST introduces some bad heights
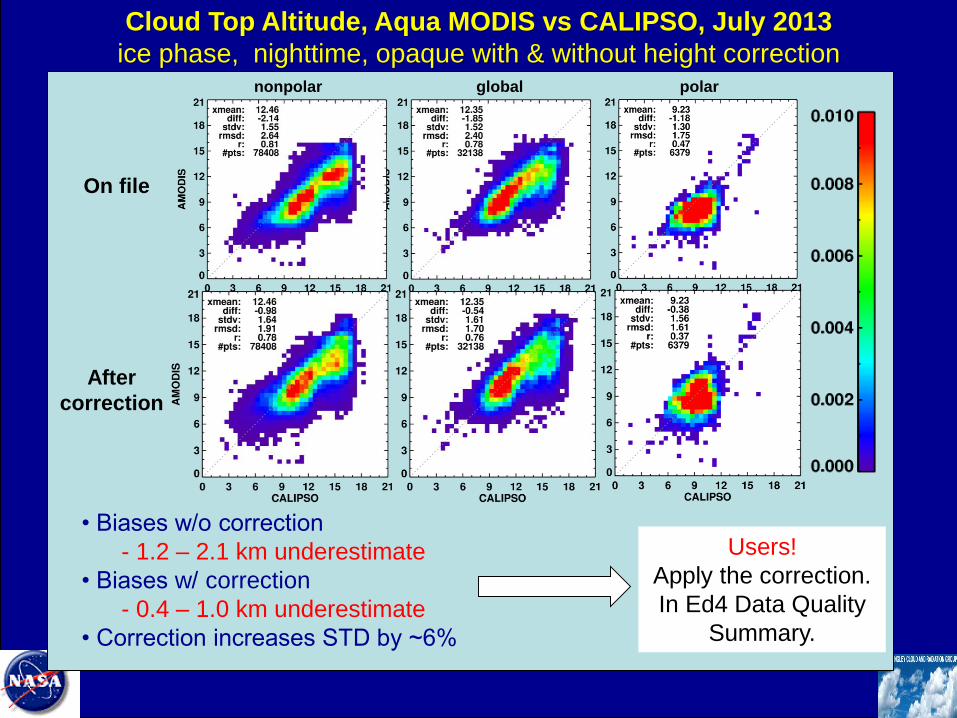
Cloud Top Altitude, Aqua MODIS vs CALIPSO, July 2013
ice phase, nighttime, opaque with & without height correction
On file
After
correction
nonpolar polarglobal
• Biases w/o correction
- 1.2 – 2.1 km underestimate
• Biases w/ correction
- 0.4 – 1.0 km underestimate
• Correction increases STD by ~6%
Users!
Apply the correction.
In Ed4 Data Quality
Summary.
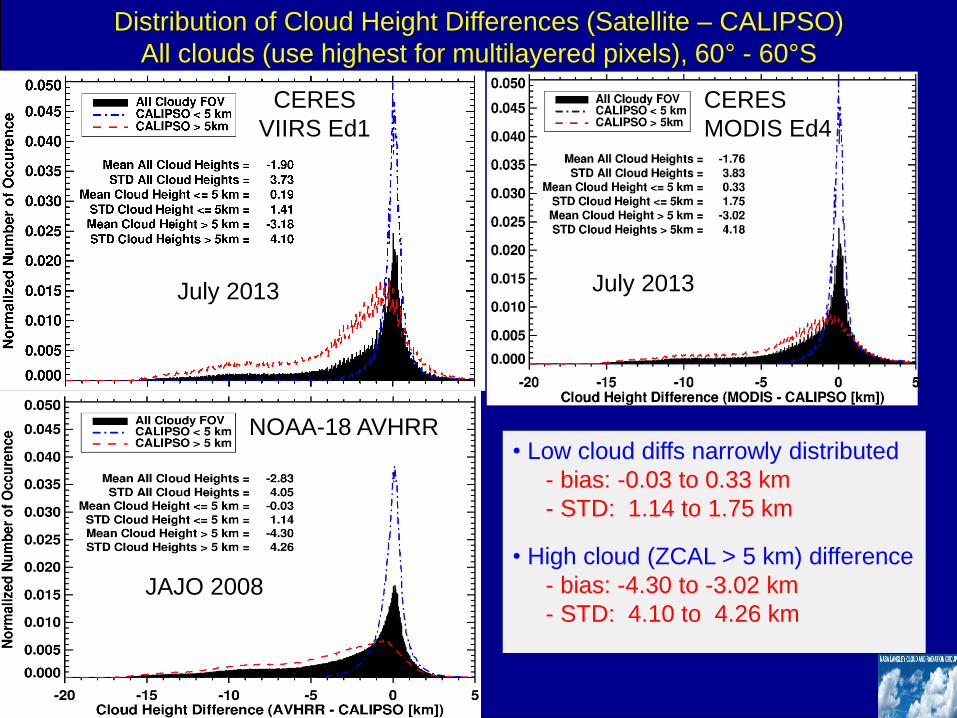
NOAA-18 AVHRR
CERES
VIIRS Ed1
Distribution of Cloud Height Differences (Satellite – CALIPSO)
All clouds (use highest for multilayered pixels), 60° - 60°S
• Low cloud diffs narrowly distributed
- bias: -0.03 to 0.33 km
- STD: 1.14 to 1.75 km
• High cloud (ZCAL > 5 km) difference
- bias: -4.30 to -3.02 km
- STD: 4.10 to 4.26 kmJAJO 2008
July 2013
CERES
MODIS Ed4
July 2013
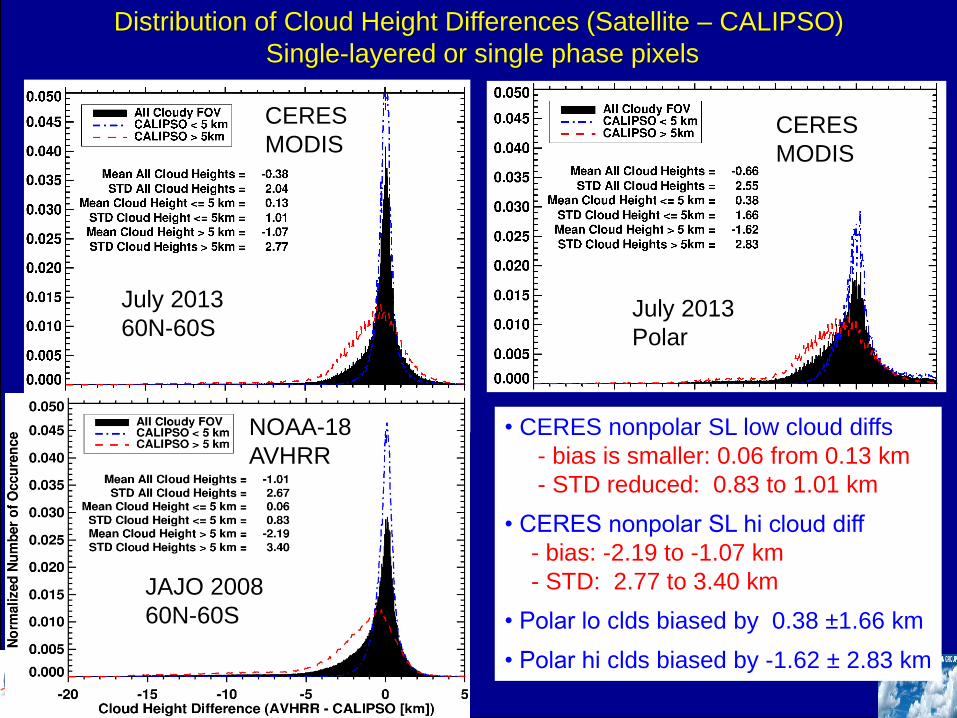
Distribution of Cloud Height Differences (Satellite – CALIPSO)
Single-layered or single phase pixels
• CERES nonpolar SL low cloud diffs
- bias is smaller: 0.06 from 0.13 km
- STD reduced: 0.83 to 1.01 km
• CERES nonpolar SL hi cloud diff
- bias: -2.19 to -1.07 km
- STD: 2.77 to 3.40 km
• Polar lo clds biased by 0.38 ±1.66 km
• Polar hi clds biased by -1.62 ± 2.83 km
CERES
MODIS
July 2013
60N-60S
CERES
MODIS
July 2013
Polar
CERES
MODIS
NOAA-18
AVHRR
JAJO 2008
60N-60S
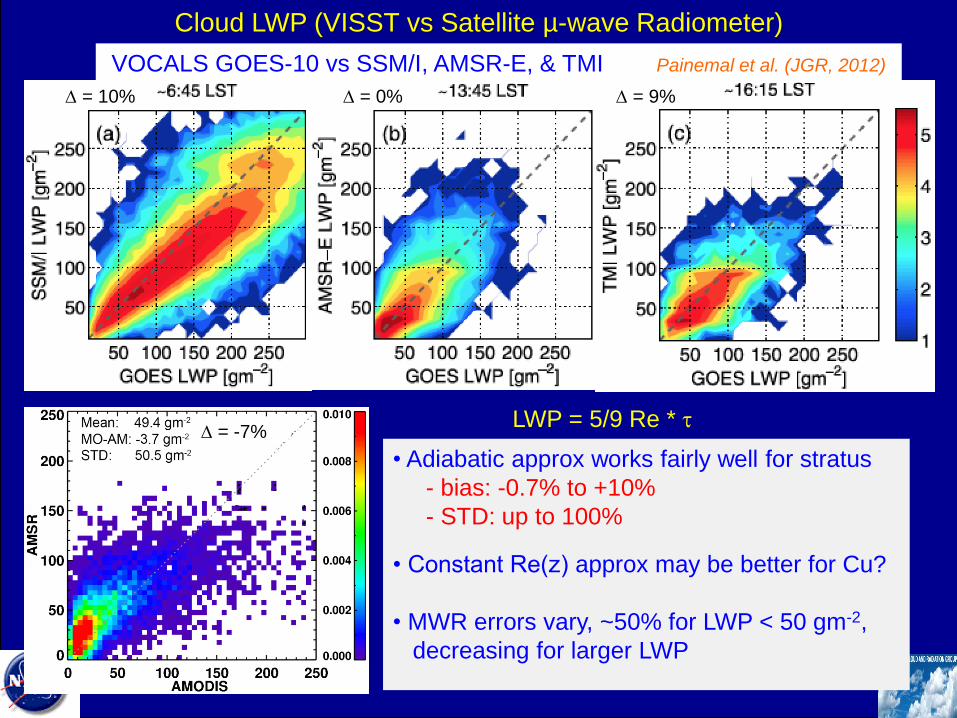
Cloud LWP (VISST vs Satellite µ-wave Radiometer)
VOCALS GOES-10 vs SSM/I, AMSR-E, & TMI Painemal et al. (JGR, 2012)
• Adiabatic approx works fairly well for stratus
- bias: -0.7% to +10%
- STD: up to 100%
• Constant Re(z) approx may be better for Cu?
• MWR errors vary, ~50% for LWP < 50 gm-2,
decreasing for larger LWP
LWP = 5/9 Re * t
D = 10% D = 0% D = 9%
D = -7%

• ARM Mobile Facility (AMF2): radars, lidars,
microwave and visible radiometers, sondes, and
aerosol probes
• Nine months of measurements
– Oct-Jan 2012-2013, May-Sept 2013, 6 days/leg
– L.A.-Honolulu: More than 30 transects
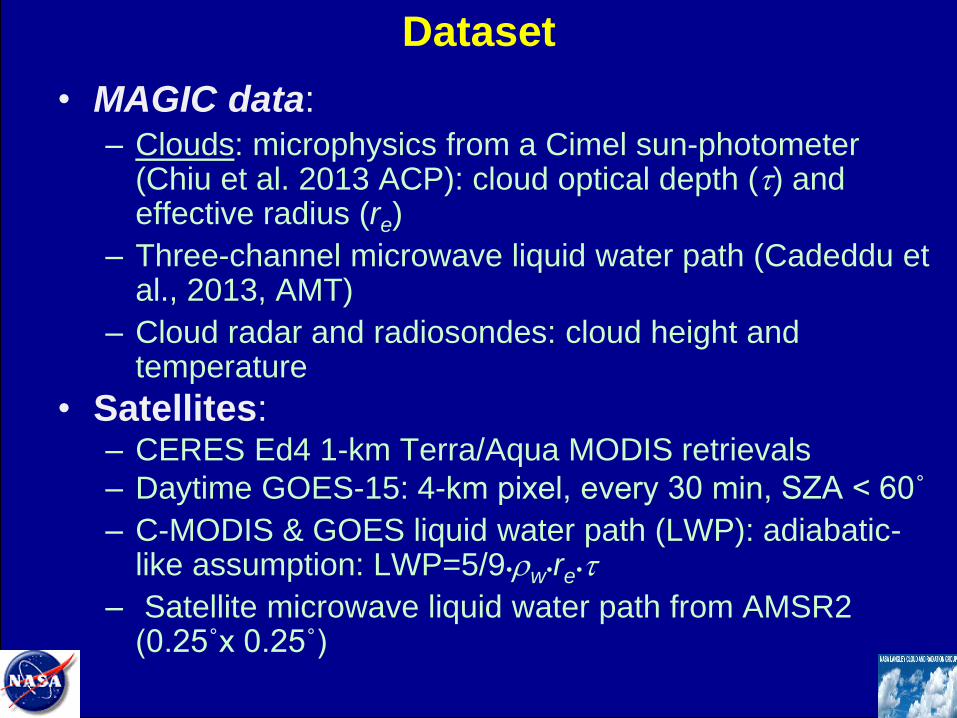
Dataset
• MAGIC data: – Clouds: microphysics from a Cimel sun-photometer
(Chiu et al. 2013 ACP): cloud optical depth (t) and effective radius (re)
– Three-channel microwave liquid water path (Cadeddu et al., 2013, AMT)
– Cloud radar and radiosondes: cloud height and temperature
• Satellites: – CERES Ed4 1-km Terra/Aqua MODIS retrievals
– Daytime GOES-15: 4-km pixel, every 30 min, SZA < 60˚
– C-MODIS & GOES liquid water path (LWP): adiabatic-like assumption: LWP=5/9rwret
– Satellite microwave liquid water path from AMSR2 (0.25˚x 0.25˚)
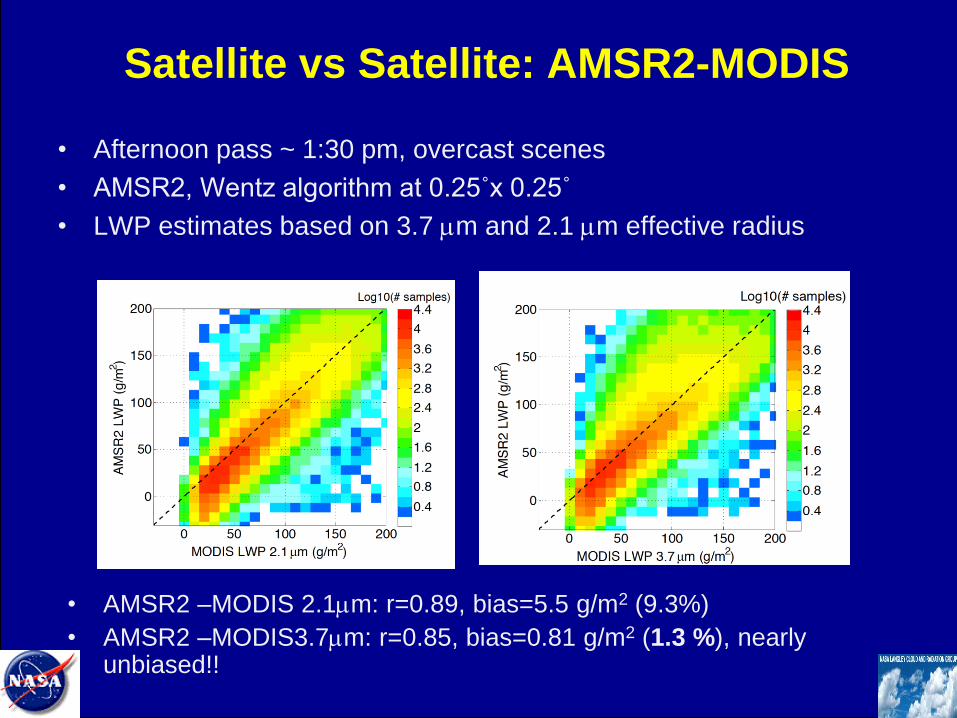
Satellite vs Satellite: AMSR2-MODIS
• Afternoon pass ~ 1:30 pm, overcast scenes
• AMSR2, Wentz algorithm at 0.25˚x 0.25˚
• LWP estimates based on 3.7 mm and 2.1 mm effective radius
• AMSR2 –MODIS 2.1mm: r=0.89, bias=5.5 g/m2 (9.3%)
• AMSR2 –MODIS3.7mm: r=0.85, bias=0.81 g/m2 (1.3 %), nearly unbiased!!
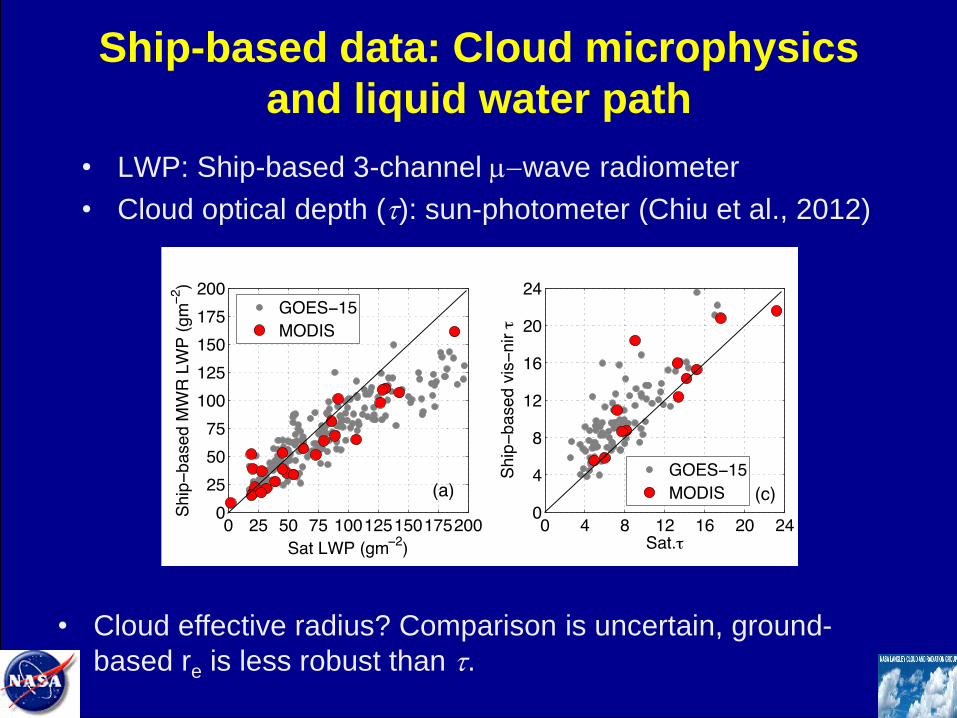
Ship-based data: Cloud microphysics
and liquid water path
• LWP: Ship-based 3-channel m-wave radiometer
• Cloud optical depth (t): sun-photometer (Chiu et al., 2012)
• Cloud effective radius? Comparison is uncertain, ground-
based re is less robust than t.
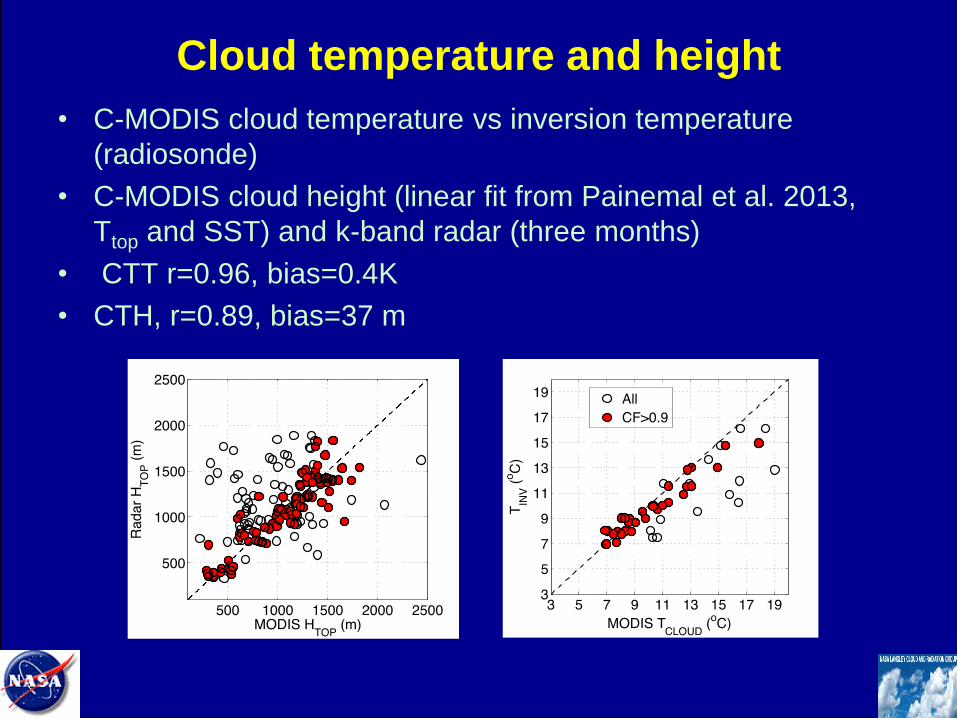
Cloud temperature and height
• C-MODIS cloud temperature vs inversion temperature
(radiosonde)
• C-MODIS cloud height (linear fit from Painemal et al. 2013,
Ttop and SST) and k-band radar (three months)
• CTT r=0.96, bias=0.4K
• CTH, r=0.89, bias=37 m
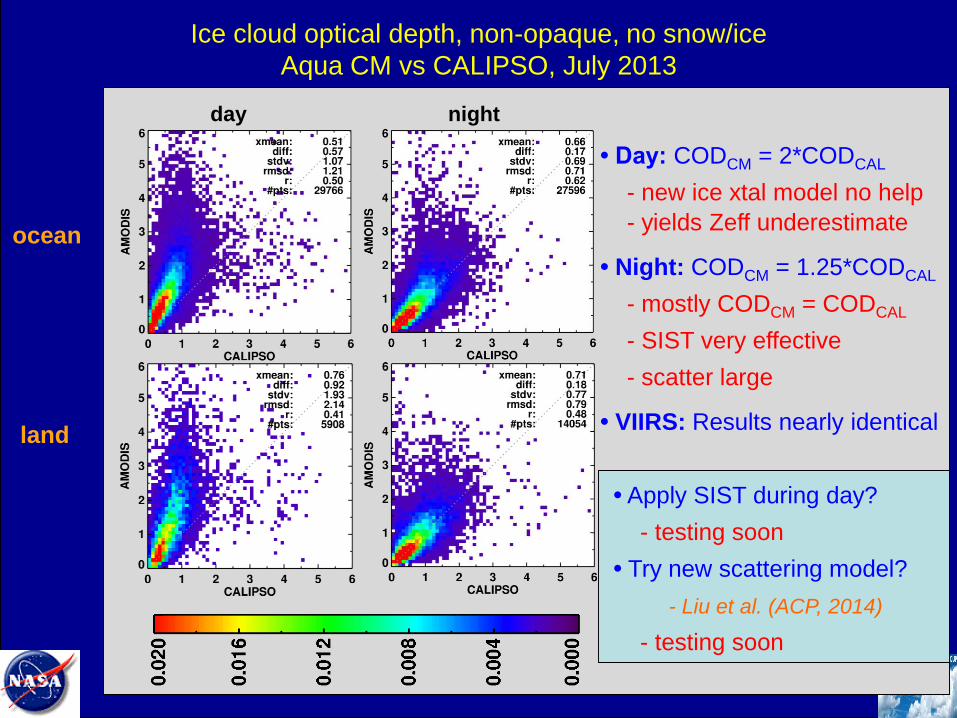
ocean
land
day night
Ice cloud optical depth, non-opaque, no snow/ice
Aqua CM vs CALIPSO, July 2013
• Day: CODCM = 2*CODCAL
- new ice xtal model no help
- yields Zeff underestimate
• Night: CODCM = 1.25*CODCAL
- mostly CODCM = CODCAL
- SIST very effective
- scatter large
• VIIRS: Results nearly identical
• Apply SIST during day?
- testing soon
• Try new scattering model?
- Liu et al. (ACP, 2014)
- testing soon
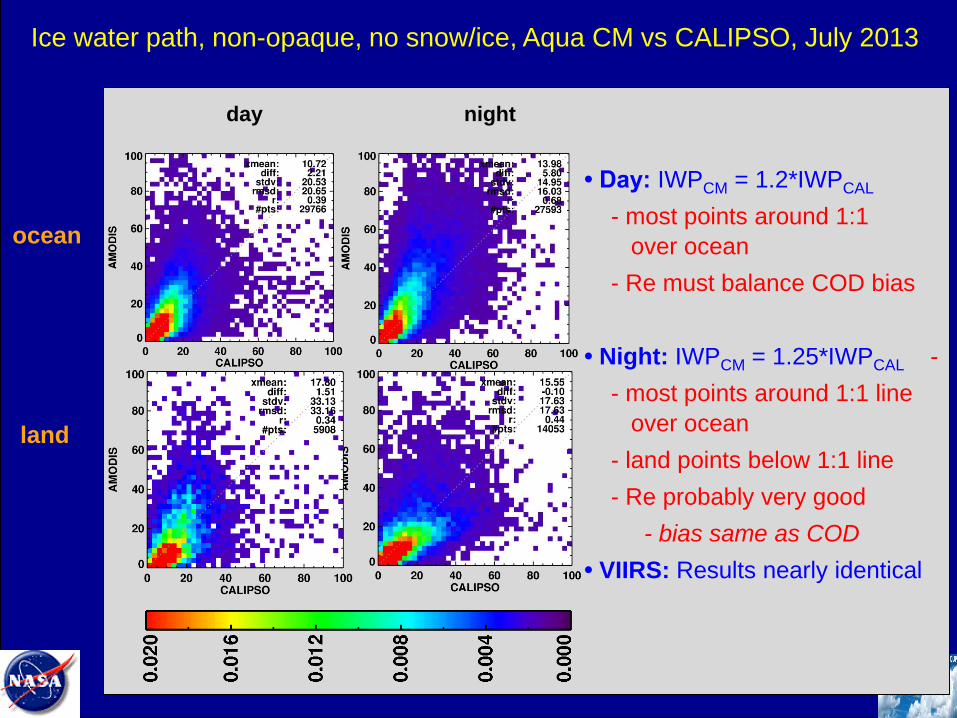
Ice water path, non-opaque, no snow/ice, Aqua CM vs CALIPSO, July 2013
ocean
land
day
• Day: IWPCM = 1.2*IWPCAL
- most points around 1:1
over ocean
- Re must balance COD bias
• Night: IWPCM = 1.25*IWPCAL -
- most points around 1:1 line
over ocean
- land points below 1:1 line
- Re probably very good
- bias same as COD
• VIIRS: Results nearly identical
night
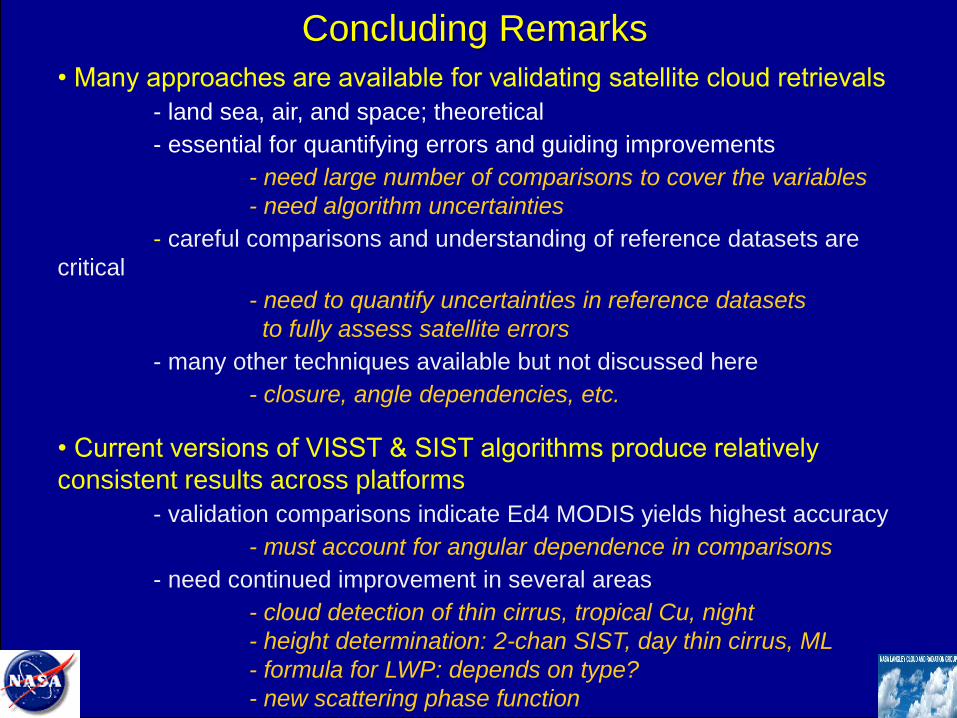
Concluding Remarks
• Many approaches are available for validating satellite cloud retrievals
- land sea, air, and space; theoretical
- essential for quantifying errors and guiding improvements
- need large number of comparisons to cover the variables
- need algorithm uncertainties
- careful comparisons and understanding of reference datasets are
critical
- need to quantify uncertainties in reference datasets
to fully assess satellite errors
- many other techniques available but not discussed here
- closure, angle dependencies, etc.
• Current versions of VISST & SIST algorithms produce relatively
consistent results across platforms
- validation comparisons indicate Ed4 MODIS yields highest accuracy
- must account for angular dependence in comparisons
- need continued improvement in several areas
- cloud detection of thin cirrus, tropical Cu, night
- height determination: 2-chan SIST, day thin cirrus, ML
- formula for LWP: depends on type?
- new scattering phase function
T10
MAST
Coll 6
CERES
VIIRS
CERES
MODIS
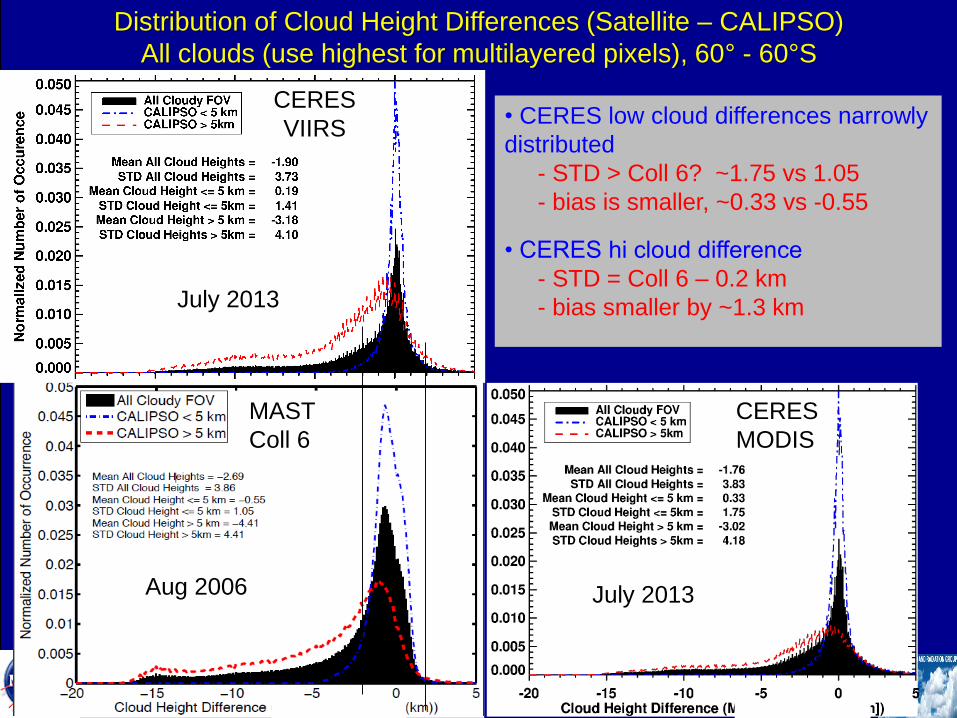
Distribution of Cloud Height Differences (Satellite – CALIPSO)
All clouds (use highest for multilayered pixels), 60° - 60°S
• CERES low cloud differences narrowly
distributed
- STD > Coll 6? ~1.75 vs 1.05
- bias is smaller, ~0.33 vs -0.55
• CERES hi cloud difference
- STD = Coll 6 – 0.2 km
- bias smaller by ~1.3 km
Aug 2006 July 2013
July 2013

T10
MAST
Coll 6
CERES
MODIS
Distribution of Cloud Height Differences (Satellite – CALIPSO)
Single-layered pixels, 60° - 60°S
• CERES low cloud differences narrowly
distributed
- STD reduced ~1.75 to 1.01 km
- bias is smaller, ~0.13 from 0.33 km
• CERES hi cloud difference
- STD = Coll 6 – 0.2 km
- bias smaller by ~1.3 km
• Not clear if MAST used 5 or 1 km pixel
Aug 2006
60N-60SJuly 2013
60N-60S
CERES
MODIS
July 2013
Polar

CERES MODIS NOAA-18
Cloud Detection vs CALIPSO COD
60° - 60°S
• MODIS mask more sensitive than AVHRR
- bias: -0.7% to +10%
- STD: up to 100%
• Cloud detection more difficult at night