Embed Size (px)
Citation preview
Validation of a matrix reasoning task for mobile devices
Anja Pahor1 & Trevor Stavropoulos1 & Susanne M. Jaeggi2 & Aaron R. Seitz1
# Psychonomic Society, Inc. 2018
AbstractMany cognitive tasks have been adapted for tablet-based testing, but tests to assess nonverbal reasoning ability, as measured bymatrix-type problems that are suited to repeated testing, have yet to be adapted for and validated onmobile platforms. Drawing onprevious research, we developed the University of California Matrix Reasoning Task (UCMRT)—a short, user-friendly measureof abstract problem solving with three alternate forms that works on tablets and other mobile devices and that is targeted at a high-ability population frequently used in the literature (i.e., college students). To test the psychometric properties of UCMRT, a largesample of healthy young adults completed parallel forms of the test, and a subsample also completed Raven’s AdvancedProgressive Matrices and a math test; furthermore, we collected college records of academic ability and achievement. These datashow that UCMRT is reliable and has adequate convergent and external validity. UCMRT is self-administrable, freely availablefor researchers, facilitates repeated testing of fluid intelligence, and resolves numerous limitations of existing matrix tests.
Keywords UCMRT . Reasoning . Fluid intelligence .Matrix problems . Validity . Mobile
Fluid intelligence refers to the ability to solve problems with-out relying on explicit knowledge derived from previous ex-perience (Cattell, 1963). Raven’s Advanced ProgressiveMatrices (APM) is one of the most widely used standardizedtests that is used as a proxy for higher-order cognitive ability(Arthur & Day, 1994), and as such, it is often administered toundergraduate university students. One of the drawbacks ofAPM is its protracted test time, which ranges from 40 to 60min. Although this may be appropriate for a single testingsession, researchers often choose to administer multiple cog-nitive tests, extending the testing time to several hours, whichcan lead to fatigue and decreased participant engagement(Ackerman & Kanfer, 2009). Moreover, the lack of parallelforms of APM has led researchers to split the test, but due tothe limited set of items, this approach only results in twoversions, which does not allow for a third assessment—forexample, in a longitudinal design. It is also not always evidentthat the resulting versions are similar in difficulty (Jaeggi,
Buschkuehl, Shah, & Jonides, 2014), and most importantly,the reduced amount of items diminishes the test’s reliability(Sefcek, Miller, & Figueredo, 2016). Matzen et al. (2010)addressed those issues by creating software for systematicallygenerating large numbers of matrix problems, which werevalidated against Raven’s Standard Progressive Matrices(SPM). Even though this presents a solution in terms of thequantity of test items, the quality of the drawings presentscertain limitations, especially if the items are presented on asmall screen.
In general, online tests of reasoning ability can be expen-sive for researchers and offer little control over the content ofthe tasks. Recently, there has been a shift toward developingproducts that are in the public domain, such as theInternational Cognitive Ability Resource (ICAR), which in-cludes 11 matrix reasoning problems (Condon & Revelle,2014), as well as 27 progressive matrices. ICAR collaboratorshave contributed more items that could allow for repeatedtesting, but no psychometric data are available for these itemsets (ICAR Catalogue, 2017). A growing number of re-searchers and healthcare services are adopting cognitive test-ing through touch screen devices, yet, to our knowledge, avalidated tablet-based measure of analytical intelligence withmultiple versions does not exist. To address the limitations ofcurrent approaches in the field, we developed a modified ma-trix reasoning test (the University of California MatrixReasoning Task [UCMRT]) based largely on matrix problemsgenerated by Sandia Laboratories (Matzen et al., 2010), which
Electronic supplementary material The online version of this article(https://doi.org/10.3758/s13428-018-1152-2) contains supplementarymaterial, which is available to authorized users.
* Anja [email protected]
1 University of California, Riverside, CA, USA2 University of California, Irvine, CA, USA
https://doi.org/10.3758/s13428-018-1152-2
Published online: 26 October 2018
Behavior Research Methods (2019) 51:2256–2267
(1) only takes 12–15 min to complete, (2) has three parallelforms, (3) can be administered on tablets and mobile devices,(4) does not require the presence of an administrator, and (5) isdesigned for people of above-average aptitude.
The goals of the present study were to evaluate the psycho-metric properties of UCMRT and to examine whether the dif-ficulty level is appropriate for healthy young adults.Specifically, we tested whether the parallel forms are compa-rable, and we also examined convergent and external validityby comparing performance on the new test with that onRaven’s APM, as well as math scores, and furthermore, weexamined the relationship between UCMRT performance andboth scores from standardized proficiency tests and GPA.
Method
Participants
A total of 713 participants (mean age = 20.02 years, SD =2.74; NFemale = 494, NMale = 201, NOther = 18) took part in atleast one session of UCMRT over a period of 6 months. Theparticipants were a sample of ethnically diverse universitystudents (see Table S1 of the supplemental materials) recruitedat the University of California, Riverside (UCR; N = 353), orthe University of California, Irvine (UCI; N = 360), with nor-mal or corrected-to-normal vision. All participants providedinformed consent and received either course credit or mone-tary compensation for their participation. Most participants (N= 676) were asked for permission to obtain their educationalrecords, which was granted by 416 of the students. A subset ofthe participants also completed a newly developed, tablet-based Math Test (N = 483), and some of these (N = 238) alsocompleted Raven’s APM, allowing for analyses of convergentand external validity (see the Convergent Validity Tasks sec-tion for more information). Another subset of the participants(N = 213) performed alternate versions of the UCMRTon twooccasions, which allowed us to calculate test–retest reliability.All study procedures were approved by the UCR and UCIinstitutional review boards.
University of California Matrix Reasoning Task(UCMRT)
The UCMRTconsists of Raven-like matrix problems, most ofwhich are based on the matrices produced by Sandia NationalLaboratories.1 The software developed by this laboratory cansystematically generate a large number of matrices, whichprovide a good match to Raven’s SPM (Matzen et al., 2010).However, we believe that the Sandia matrix problems are
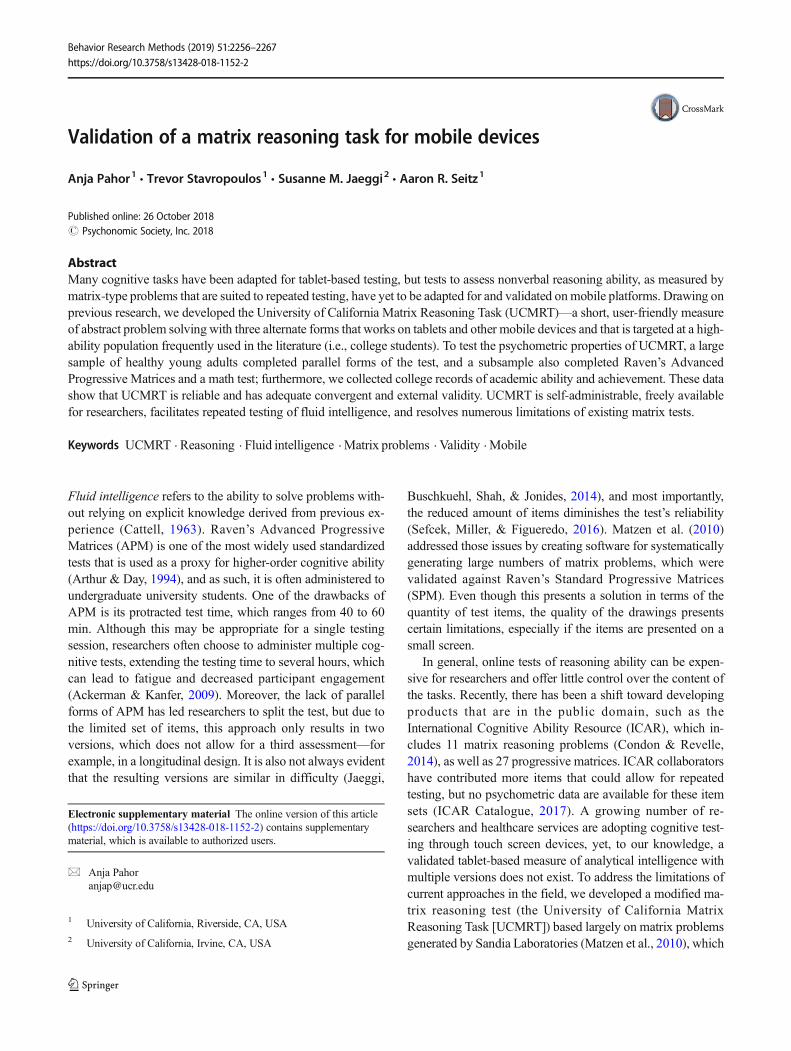
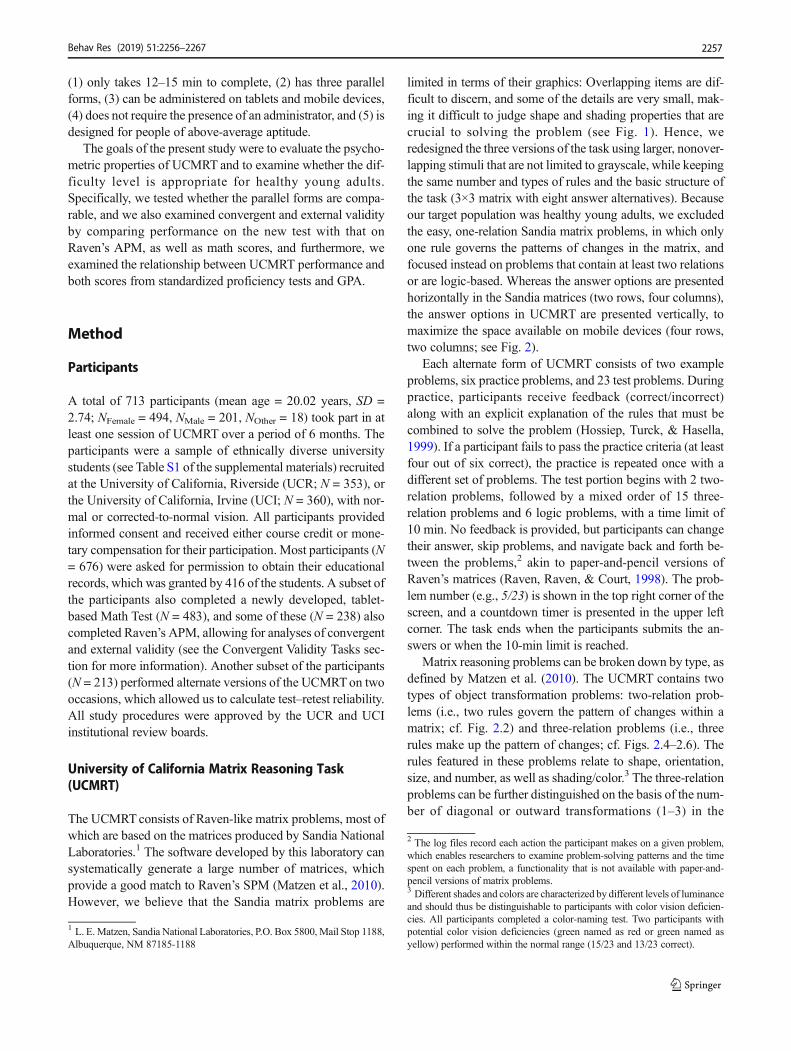
limited in terms of their graphics: Overlapping items are dif-ficult to discern, and some of the details are very small, mak-ing it difficult to judge shape and shading properties that arecrucial to solving the problem (see Fig. 1). Hence, weredesigned the three versions of the task using larger, nonover-lapping stimuli that are not limited to grayscale, while keepingthe same number and types of rules and the basic structure ofthe task (3×3 matrix with eight answer alternatives). Becauseour target population was healthy young adults, we excludedthe easy, one-relation Sandia matrix problems, in which onlyone rule governs the patterns of changes in the matrix, andfocused instead on problems that contain at least two relationsor are logic-based. Whereas the answer options are presentedhorizontally in the Sandia matrices (two rows, four columns),the answer options in UCMRT are presented vertically, tomaximize the space available on mobile devices (four rows,two columns; see Fig. 2).
Each alternate form of UCMRT consists of two exampleproblems, six practice problems, and 23 test problems. Duringpractice, participants receive feedback (correct/incorrect)along with an explicit explanation of the rules that must becombined to solve the problem (Hossiep, Turck, & Hasella,1999). If a participant fails to pass the practice criteria (at leastfour out of six correct), the practice is repeated once with adifferent set of problems. The test portion begins with 2 two-relation problems, followed by a mixed order of 15 three-relation problems and 6 logic problems, with a time limit of10 min. No feedback is provided, but participants can changetheir answer, skip problems, and navigate back and forth be-tween the problems,2 akin to paper-and-pencil versions ofRaven’s matrices (Raven, Raven, & Court, 1998). The prob-lem number (e.g., 5/23) is shown in the top right corner of thescreen, and a countdown timer is presented in the upper leftcorner. The task ends when the participants submits the an-swers or when the 10-min limit is reached.
Matrix reasoning problems can be broken down by type, asdefined by Matzen et al. (2010). The UCMRT contains twotypes of object transformation problems: two-relation prob-lems (i.e., two rules govern the pattern of changes within amatrix; cf. Fig. 2.2) and three-relation problems (i.e., threerules make up the pattern of changes; cf. Figs. 2.4–2.6). Therules featured in these problems relate to shape, orientation,size, and number, as well as shading/color.3 The three-relationproblems can be further distinguished on the basis of the num-ber of diagonal or outward transformations (1–3) in the
1 L. E.Matzen, Sandia National Laboratories, P.O. Box 5800, Mail Stop 1188,Albuquerque, NM 87185-1188
2 The log files record each action the participant makes on a given problem,which enables researchers to examine problem-solving patterns and the timespent on each problem, a functionality that is not available with paper-and-pencil versions of matrix problems.3 Different shades and colors are characterized by different levels of luminanceand should thus be distinguishable to participants with color vision deficien-cies. All participants completed a color-naming test. Two participants withpotential color vision deficiencies (green named as red or green named asyellow) performed within the normal range (15/23 and 13/23 correct).
Behav Res (2019) 51:2256–2267 2257
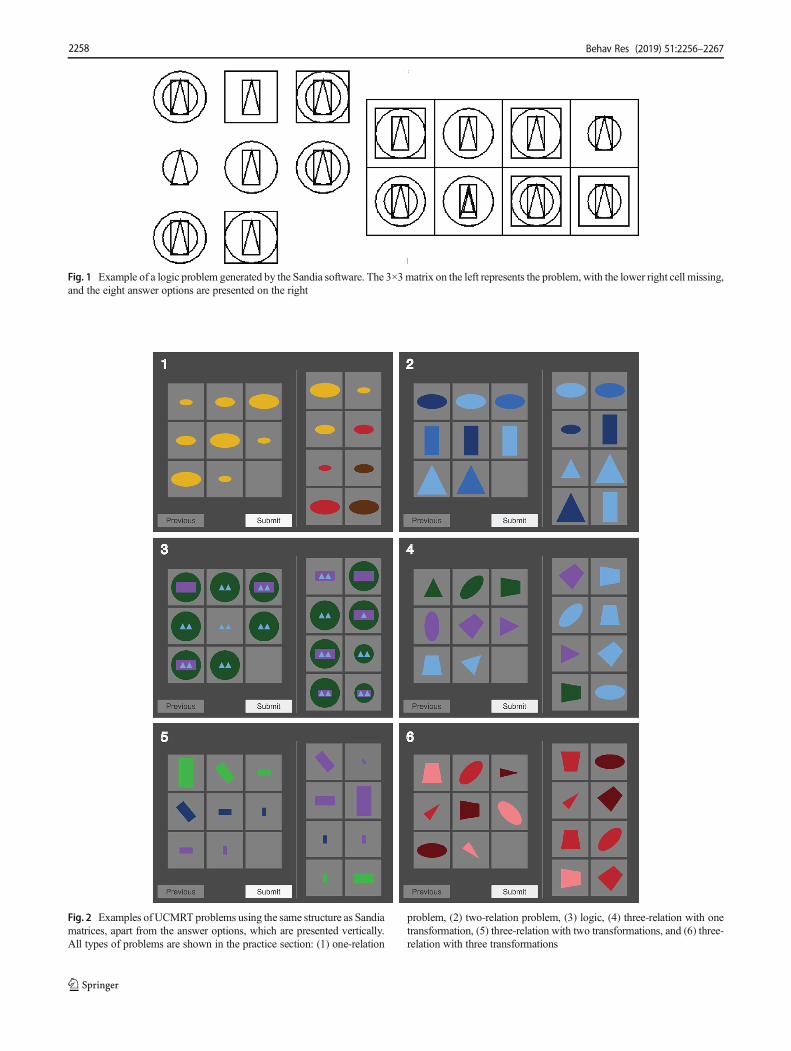
Fig. 1 Example of a logic problem generated by the Sandia software. The 3×3matrix on the left represents the problem, with the lower right cell missing,and the eight answer options are presented on the right
Fig. 2 Examples of UCMRT problems using the same structure as Sandiamatrices, apart from the answer options, which are presented vertically.All types of problems are shown in the practice section: (1) one-relation
problem, (2) two-relation problem, (3) logic, (4) three-relation with onetransformation, (5) three-relation with two transformations, and (6) three-relation with three transformations
Behav Res (2019) 51:2256–22672258
matrix. UCMRT also contains three types of logic problems(see Fig. 2.3): addition/conjunction (AND), disjunction (OR),and exclusive disjunction (XOR). Each alternate version con-sists of 2 two-relation problems, 3 three-relation problemswith one transformation, 6 three-relation problems with twotransformations, 6 three-relation problems with three transfor-mations, and 6 logic problems. To control for context effects,the problems are not ordered by problem type (with the ex-ception of the two-relation problems), nor are they specificallyordered in terms of difficulty—apart from the overall struc-ture, in which two-relation and three-relation problems withfewer transformations are distributed at the beginning, where-as those that require more transformations are distributed to-ward the end. In all three versions, the order is the same withrespect to problem type; however, the rules that govern theproblem type can differ.4
Implementation
UCMRT runs on Unity, which supports multiple platformsand can be utilized to make the test more available over time.Presently, UCRMT is supported by iOS and Android, and itcan be released on other platforms per request. The app sup-ports the creation of usernames that can be used to hide theidentity of the participant. Researchers who wish to useUCMRT are encouraged to contact one of the authors. Datafiles are logged locally (i.e., text files are stored on the deviceitself), and in addition, they are logged on an Amazon-housedserver as long as a wireless Internet connection is maintained.The server-stored data can be made available to researchersupon request.
Convergent validity tasks
Two tasks were used to assess the convergent validity ofUCMRT. The first task was Raven’s APM Set II (Ravenet al., 1998), a valid and widely used measure of fluid intelli-gence (Arthur & Woehr, 1993). APM Set II consists of 36problems in ascending difficulty. Each problem comprises a3×3 matrix with the lower right cell missing, and the partici-pant has to select one out of eight answer options that bestcompletes the matrix. The participants solved a paper-and-pencil version of the task, using Set I as practice (12 problems)and Set II as the test, with a time limit of 25 min. This timerestriction was applied in order to approximate the conditionsfor the UCMRT and to avoid the ceiling performance oftenobserved in our lab with longer or no time restrictions.5 The
second task was a tablet-based Math Test consisting of 21word-based math problems with a time limit of 15 min (seeMath Test in the supplemental materials), administered viaQualtrics software (Qualtrics, Provo, UT, https://www.qualtrics.com).
Educational data
For those participants who gave consent, college grade pointaverage (GPA), high school GPA, and SAT and ACT scoreswere obtained from university records. GPA reflects overallperformance during the academic year and is on a 4.0 scale.The SAT and ACT are standardized tests used for collegeadmission in the United States. The tests are somewhat differ-ent but are universally accepted by colleges and universities;thus, students can decide which test they want to take. Since itwas unclear which scores would be affected by recent majorchanges in the SAT sections, particularly for verbal measures(and furthermore, some scores were not scaled), and also giv-en that the maximum SAT score changed from of 2,400 to1,600 in 2016, we decided to exclude the SAT Verbal/Evidence-Based Reading and Writing and SAT Total mea-sures from the analyses. Although certain changes were im-plemented on the SAT Math measure, its scale has remainedthe same (200–800), and therefore it was not excluded. ForACT, scores on the Reading, Math, Writing, and Science sec-tions were obtained, all of which were included in theanalyses.
Procedure
Performance on UCMRTwas obtained in the context of threestudies. In one study, participants completed a battery oftablet-based cognitive tests, including the Math Test andUCMRT, which were presented together at the beginning ofa session (in that order). In another study, we aimed to estimateimprovement on the battery of cognitive tests (excluding theMath Test) and to assess test–retest reliability; thus, the par-ticipants were asked to attend a second session 10–14 dayslater. Both sessions took place at the same time of day, andUCMRT was completed at the beginning of each session.These participants were divided randomly into three groups:One group completed Version A in Session 1 and Version B inSession 2; another completed Version B in Session 1 andVersion C in Session 2; and the third completed Version Cin Session 1 and Version A in Session 2. In a third study,participants were randomly assigned to complete one of thethree versions of UCMRT (A, B, or C), one of the twoversions of the Math Test (I or II), as well as the APM.The order of the two matrix reasoning tests (APM andUCMRT) was counterbalanced, and they were always sep-arated by the Math Test.
4 For example, the rules that govern a given three-relation problem with threetransformations are shape, shading, and orientation in Version A; shape, size,and number in Version B; and shape, orientation, and size in Version C.5 Timed performance on APM is predictive of untimed performance on thesame test (Frearson & Eysenck, 1986; Hamel & Schmittmann, 2006;Salthouse, 1993; Unsworth & Engle, 2005).
Behav Res (2019) 51:2256–2267 2259
Statistical analyses
SPSS Version 24 and JASP Version 0.9.0.1 (JASP Team,2018) were used to analyze the data. Along with conven-tional null-hypothesis statistical testing, Bayes factors(BFs) were calculated using the default priors in JASP.BFs calculate the probability of the null (H0) or alternative(H1) hypothesis being true, given the present data. Thus,the results of our frequentist analyses were supplementedwith BFs—specifically, BF10, which grades the intensity ofthe evidence that the data provide for H1 versus H0. A BF10value between 1 and 3 is considered to be only anecdotalevidence for H1; 3–10 indicate moderate evidence; 10–30,strong evidence; 30–100, very strong evidence; and > 100,ex t reme evidence (Lee & Wagenmakers , 2013;Wagenmakers et al., 2018).
Bonferroni correction was applied to post-hoc computedStudent’s t tests; note that the reported effect size, Cohen’s d,does not correct for multiple comparisons.
Results
UCMRT performance and reliability
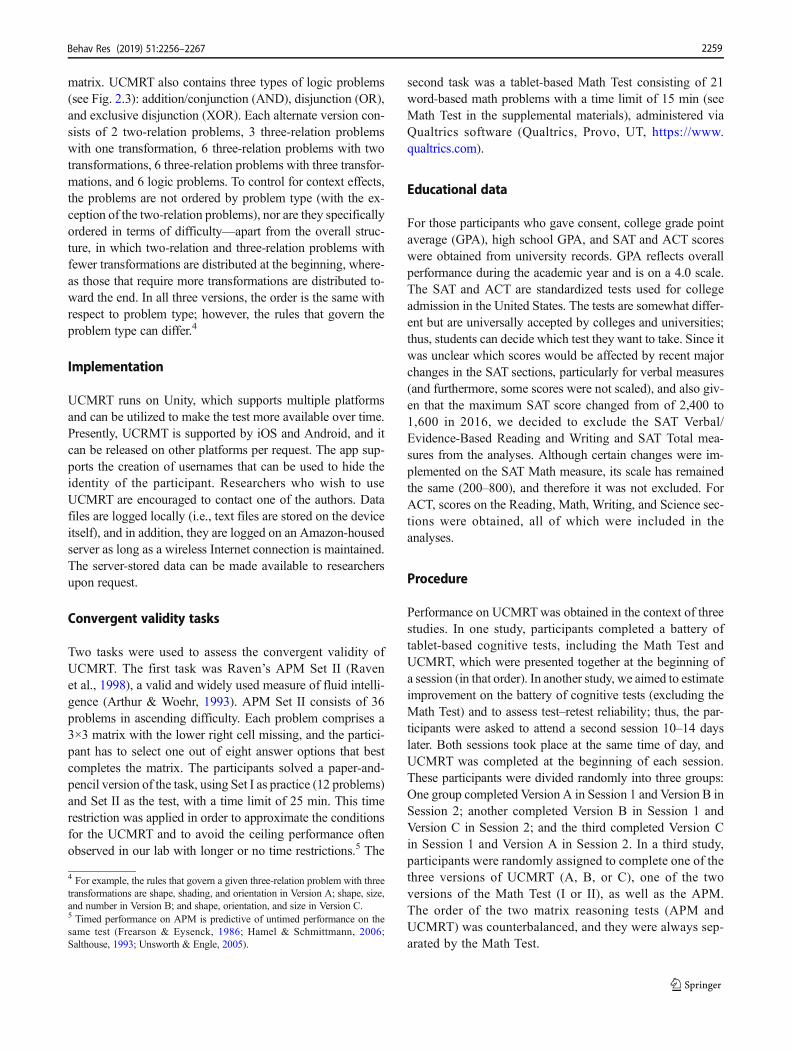
Ten outliers (1.4%) were removed from the sample: six individ-uals on the basis of number of responses (i.e., skipping at least48% of the problems; z> = 4), and four on the basis of number ofcorrectly solved problems (|z| ≥ 2.5). Descriptive statistics arepresented in Table 1. There was no statistical difference in per-formance among the three versions of the UCMRT, as deter-mined by a one-way analysis of variance (ANOVA) [F(2, 700)= 2.70, p = .07, η2 = .01], which was further confirmed by a JZSBayes factor ANOVA with default prior scales (BF10 = 0.21).
Although Bonferroni-corrected post-hoc tests showed no signif-icant differences between the pairs of tests (A–B, p = .63; B–C,p = .82; and A–C, p = .06), Bayesian post-hoc tests revealedanecdotal evidence in favor of H1 for the A–C comparison (A–C: BF10,U = 1.78), but this was not observed for the A–B(BF10,U = 0.21) or B–C (BF10,U = 0.18) comparisons.
The internal consistency of the 23 problems, based onCronbach’s α, was .66, .76, and .72 in Versions A, B, and C,respectively (combined versions: α = .71; cf. Table 1).Similarly, Cronbach’s α for the sets of Sandia matrices,consisting of 42 problems each, was .76 (Matzen et al.,2010). For the 36 items of Raven’s APM, Cronbach’s α was.82 in our sample and .84 in other data sets (Arthur & Day,1994; Bors & Stokes, 1998). For a short version consisting of18 problems, αs of .64 (Unsworth, Redick, Lakey, & Young,2010) and .79 (Sefcek et al., 2016) have been reported.Considering the relatively low number of problems and shorttesting time of the UCMRT, the internal consistency of thethree versions seems adequate.
We also report descriptive statistics for a subsample thatwas subject to more rigorous selection criteria (Table 1).Only participants who correctly solved the first two problemsof UCMRT (i.e., the easy, two-relation problems) were includ-ed in the analysis. Performance on the three versions ofUCMRT was not statistically different, as determined by aone-way ANOVA [F(2, 384) = 0.22, p = .80, η2 = .001,BF10 = 0.04]. Bonferroni-corrected post-hoc tests showed nosignificant differences between the pairs of tests (A–B: p = 1,BF10,U = 0.16; B–C: p = 1, BF10,U = 0.13; and A–C: p = 1,BF10,U = 0.17). Because they demonstrated an understandingof the rules that apply to the two-relation problems, this sub-sample may have been particularly suited to UCMRT testing.Nevertheless, as we demonstrated above, the entire samplealso showed adequate performance.
Table 1 Descriptive statistics for UCMRT scores (maximum = 23)
Entire Sample Subsample*
All Versions Version A Version B Version C Version A Version B Version C
Minimum 3 4 3 3 7 5 4
Maximum 22 20 22 22 20 22 22
Mean 12.55 12.12 12.58 12.98 13.92 14.17 14.22
Std. error .15 .24 .28 .26 .33 .34 .29
Std. deviation 4.02 3.72 4.32 3.94 3.39 3.89 3.49
Median 12 12 13 13 14 13 14.5
Variance 16.14 13.80 18.74 15.52 11.49 15.15 12.15
Skewness .04 .15 .04 – .09 .01 .09 – .13
Kurtosis – .52 – .67 – .47 – .48 – .88 – .52 – .42
Cronbach’s α .71 .66 .76 .72 .62 .74 .67
N 703 234 243 226 105 132 150
*Only includes participants who correctly solved the first two problems of UCRMT.
Behav Res (2019) 51:2256–22672260
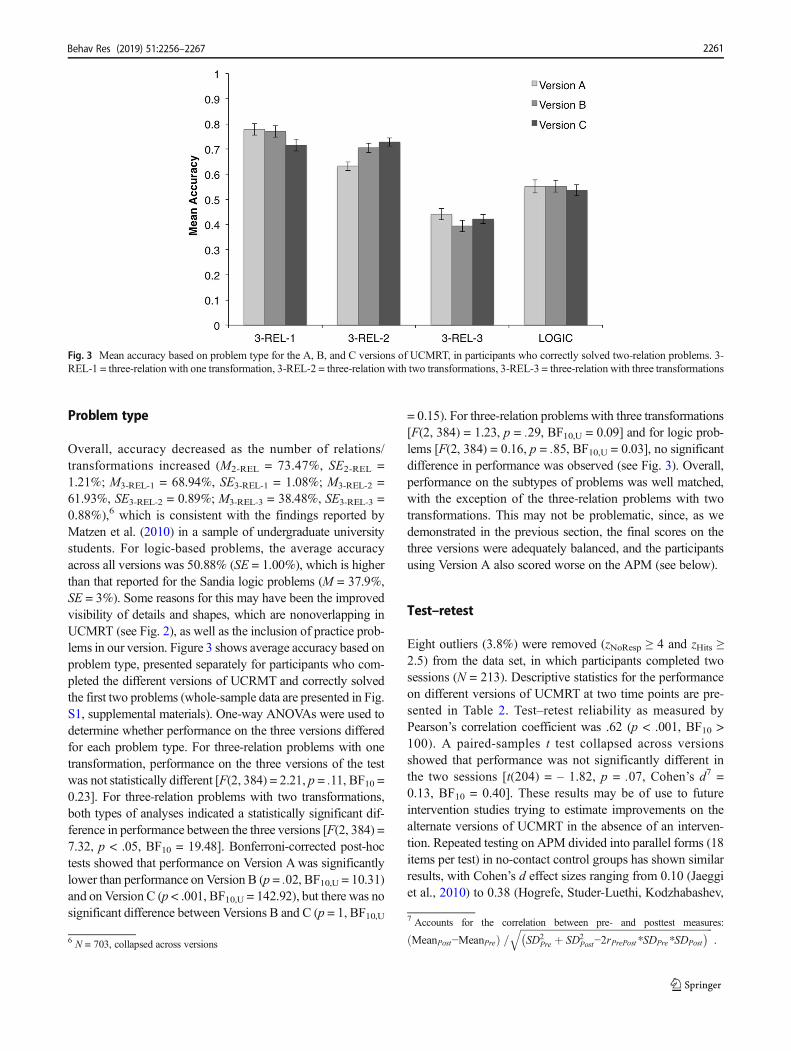
Problem type
Overall, accuracy decreased as the number of relations/transformations increased (M2-REL = 73.47%, SE2-REL =1.21%; M3-REL-1 = 68.94%, SE3-REL-1 = 1.08%; M3-REL-2 =61.93%, SE3-REL-2 = 0.89%; M3-REL-3 = 38.48%, SE3-REL-3 =0.88%),6 which is consistent with the findings reported byMatzen et al. (2010) in a sample of undergraduate universitystudents. For logic-based problems, the average accuracyacross all versions was 50.88% (SE = 1.00%), which is higherthan that reported for the Sandia logic problems (M = 37.9%,SE = 3%). Some reasons for this may have been the improvedvisibility of details and shapes, which are nonoverlapping inUCMRT (see Fig. 2), as well as the inclusion of practice prob-lems in our version. Figure 3 shows average accuracy based onproblem type, presented separately for participants who com-pleted the different versions of UCRMT and correctly solvedthe first two problems (whole-sample data are presented in Fig.S1, supplemental materials). One-way ANOVAs were used todetermine whether performance on the three versions differedfor each problem type. For three-relation problems with onetransformation, performance on the three versions of the testwas not statistically different [F(2, 384) = 2.21, p = .11, BF10 =0.23]. For three-relation problems with two transformations,both types of analyses indicated a statistically significant dif-ference in performance between the three versions [F(2, 384) =7.32, p < .05, BF10 = 19.48]. Bonferroni-corrected post-hoctests showed that performance on Version Awas significantlylower than performance on Version B (p = .02, BF10,U = 10.31)and on Version C (p < .001, BF10,U = 142.92), but there was nosignificant difference between Versions B and C (p = 1, BF10,U
= 0.15). For three-relation problems with three transformations[F(2, 384) = 1.23, p = .29, BF10,U = 0.09] and for logic prob-lems [F(2, 384) = 0.16, p = .85, BF10,U = 0.03], no significantdifference in performance was observed (see Fig. 3). Overall,performance on the subtypes of problems was well matched,with the exception of the three-relation problems with twotransformations. This may not be problematic, since, as wedemonstrated in the previous section, the final scores on thethree versions were adequately balanced, and the participantsusing Version A also scored worse on the APM (see below).
Test–retest
Eight outliers (3.8%) were removed (zNoResp ≥ 4 and zHits ≥2.5) from the data set, in which participants completed twosessions (N = 213). Descriptive statistics for the performanceon different versions of UCMRT at two time points are pre-sented in Table 2. Test–retest reliability as measured byPearson’s correlation coefficient was .62 (p < .001, BF10 >100). A paired-samples t test collapsed across versionsshowed that performance was not significantly different inthe two sessions [t(204) = – 1.82, p = .07, Cohen’s d7 =0.13, BF10 = 0.40]. These results may be of use to futureintervention studies trying to estimate improvements on thealternate versions of UCMRT in the absence of an interven-tion. Repeated testing on APM divided into parallel forms (18items per test) in no-contact control groups has shown similarresults, with Cohen’s d effect sizes ranging from 0.10 (Jaeggiet al., 2010) to 0.38 (Hogrefe, Studer-Luethi, Kodzhabashev,
6 N = 703, collapsed across versions
Fig. 3 Mean accuracy based on problem type for the A, B, and C versions of UCMRT, in participants who correctly solved two-relation problems. 3-REL-1 = three-relation with one transformation, 3-REL-2 = three-relation with two transformations, 3-REL-3 = three-relation with three transformations
7 Accounts for the correlation between pre- and posttest measures:
MeanPost−MeanPreð Þ =ffiffiffiffiffiffiffiffiffiffiffiffiffiffiffiffiffiffiffiffiffiffiffiffiffiffiffiffiffiffiffiffiffiffiffiffiffiffiffiffiffiffiffiffiffiffiffiffiffiffiffiffiffiffiffiffiffiffiffiffiffiffiffiffiffiffiffiffiffiffiffiffiffiffiffiffiffiffiffiffi
SD2Pre þ SD2
Post−2rPrePost*SDPre*SDPost� �
q
.
Behav Res (2019) 51:2256–2267 2261
& Perrig, 2017), and some even reporting worse performancein the second session than in the first (Clark, Lawlor-Savage,& Goghari, 2017; Colom et al., 2013; Redick et al., 2013;Stough et al., 2011).
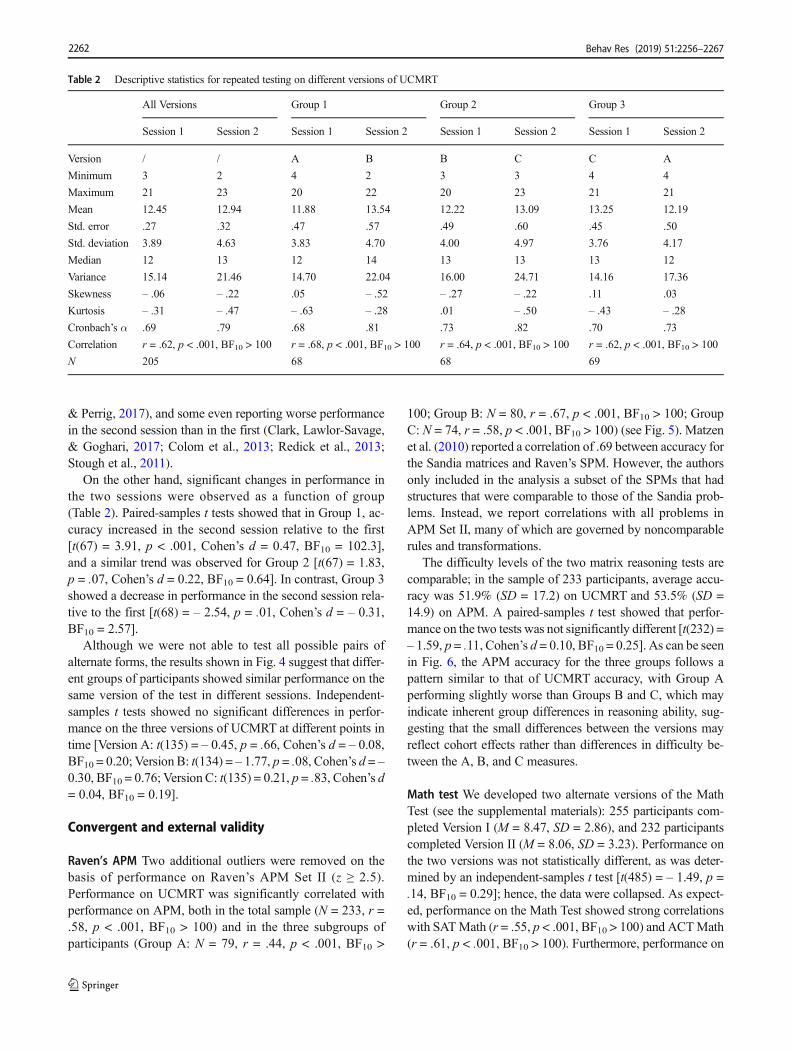
On the other hand, significant changes in performance inthe two sessions were observed as a function of group(Table 2). Paired-samples t tests showed that in Group 1, ac-curacy increased in the second session relative to the first[t(67) = 3.91, p < .001, Cohen’s d = 0.47, BF10 = 102.3],and a similar trend was observed for Group 2 [t(67) = 1.83,p = .07, Cohen’s d = 0.22, BF10 = 0.64]. In contrast, Group 3showed a decrease in performance in the second session rela-tive to the first [t(68) = – 2.54, p = .01, Cohen’s d = – 0.31,BF10 = 2.57].
Although we were not able to test all possible pairs ofalternate forms, the results shown in Fig. 4 suggest that differ-ent groups of participants showed similar performance on thesame version of the test in different sessions. Independent-samples t tests showed no significant differences in perfor-mance on the three versions of UCMRT at different points intime [Version A: t(135) = – 0.45, p = .66, Cohen’s d = – 0.08,BF10 = 0.20; Version B: t(134) = – 1.77, p = .08, Cohen’s d = –0.30, BF10 = 0.76; Version C: t(135) = 0.21, p = .83, Cohen’s d= 0.04, BF10 = 0.19].
Convergent and external validity
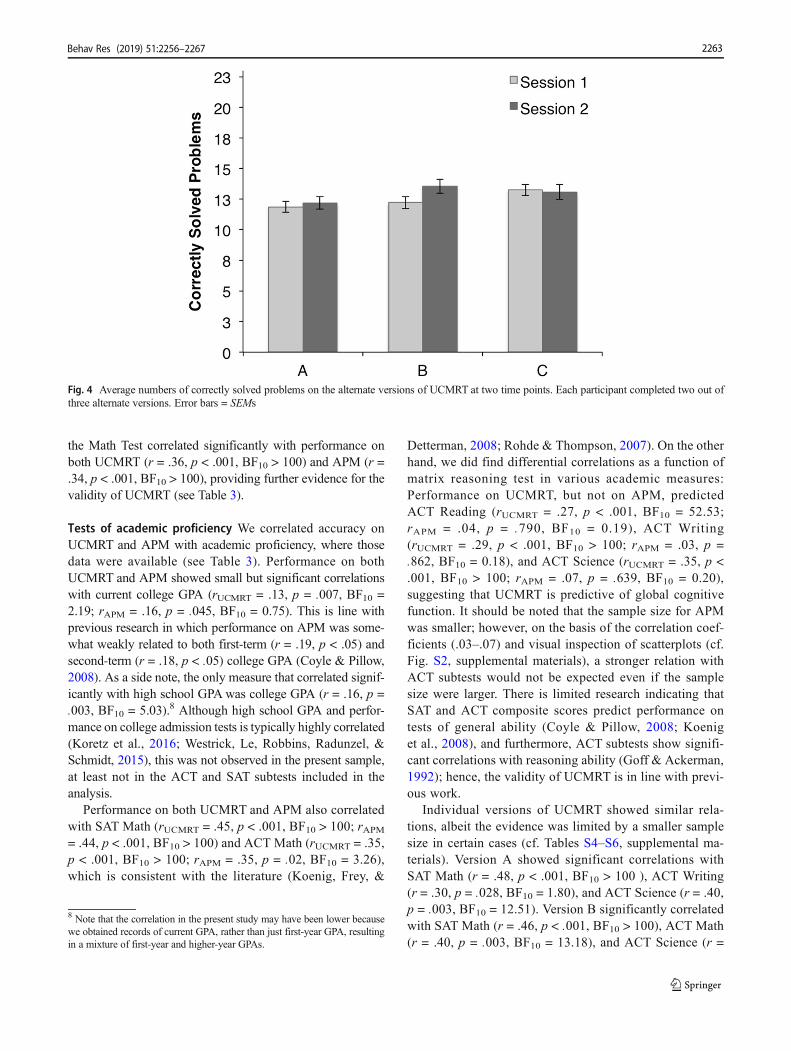
Raven’s APM Two additional outliers were removed on thebasis of performance on Raven’s APM Set II (z ≥ 2.5).Performance on UCMRT was significantly correlated withperformance on APM, both in the total sample (N = 233, r =.58, p < .001, BF10 > 100) and in the three subgroups ofparticipants (Group A: N = 79, r = .44, p < .001, BF10 >
100; Group B: N = 80, r = .67, p < .001, BF10 > 100; GroupC: N = 74, r = .58, p < .001, BF10 > 100) (see Fig. 5). Matzenet al. (2010) reported a correlation of .69 between accuracy forthe Sandia matrices and Raven’s SPM. However, the authorsonly included in the analysis a subset of the SPMs that hadstructures that were comparable to those of the Sandia prob-lems. Instead, we report correlations with all problems inAPM Set II, many of which are governed by noncomparablerules and transformations.
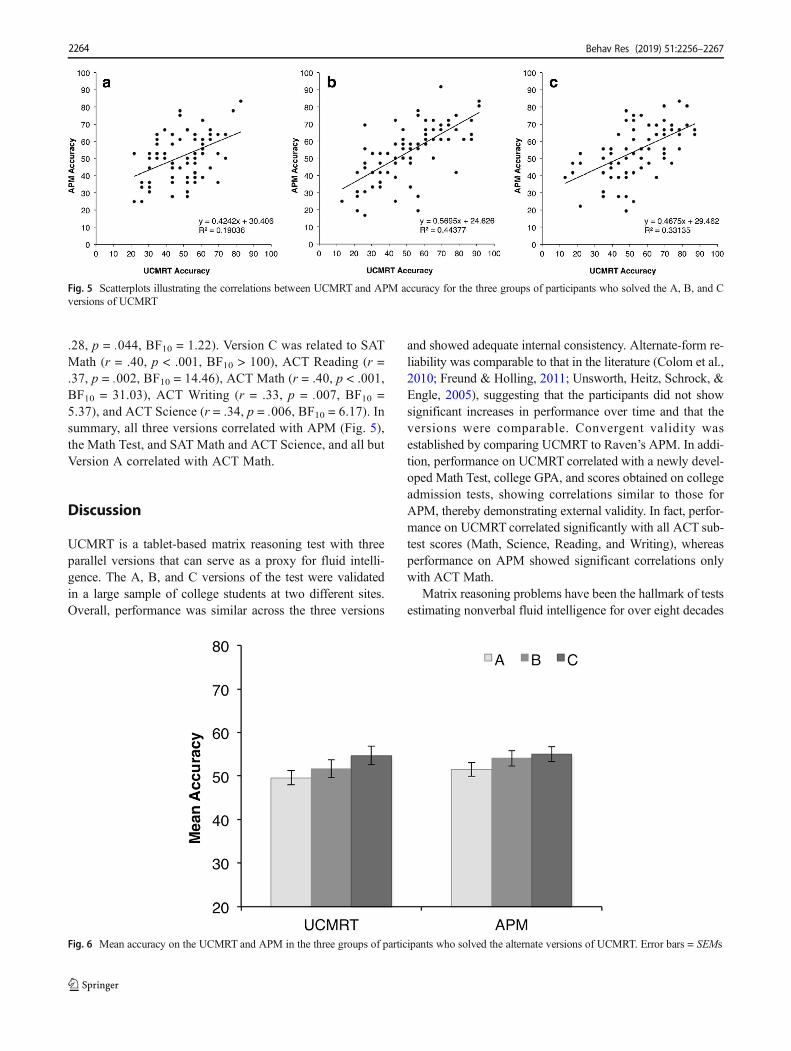
The difficulty levels of the two matrix reasoning tests arecomparable; in the sample of 233 participants, average accu-racy was 51.9% (SD = 17.2) on UCMRT and 53.5% (SD =14.9) on APM. A paired-samples t test showed that perfor-mance on the two tests was not significantly different [t(232) =– 1.59, p = .11, Cohen’s d = 0.10, BF10 = 0.25]. As can be seenin Fig. 6, the APM accuracy for the three groups follows apattern similar to that of UCMRT accuracy, with Group Aperforming slightly worse than Groups B and C, which mayindicate inherent group differences in reasoning ability, sug-gesting that the small differences between the versions mayreflect cohort effects rather than differences in difficulty be-tween the A, B, and C measures.
Math test We developed two alternate versions of the MathTest (see the supplemental materials): 255 participants com-pleted Version I (M = 8.47, SD = 2.86), and 232 participantscompleted Version II (M = 8.06, SD = 3.23). Performance onthe two versions was not statistically different, as was deter-mined by an independent-samples t test [t(485) = – 1.49, p =.14, BF10 = 0.29]; hence, the data were collapsed. As expect-ed, performance on the Math Test showed strong correlationswith SATMath (r = .55, p < .001, BF10 > 100) and ACTMath(r = .61, p < .001, BF10 > 100). Furthermore, performance on
Table 2 Descriptive statistics for repeated testing on different versions of UCMRT
All Versions Group 1 Group 2 Group 3
Session 1 Session 2 Session 1 Session 2 Session 1 Session 2 Session 1 Session 2
Version / / A B B C C A
Minimum 3 2 4 2 3 3 4 4
Maximum 21 23 20 22 20 23 21 21
Mean 12.45 12.94 11.88 13.54 12.22 13.09 13.25 12.19
Std. error .27 .32 .47 .57 .49 .60 .45 .50
Std. deviation 3.89 4.63 3.83 4.70 4.00 4.97 3.76 4.17
Median 12 13 12 14 13 13 13 12
Variance 15.14 21.46 14.70 22.04 16.00 24.71 14.16 17.36
Skewness – .06 – .22 .05 – .52 – .27 – .22 .11 .03
Kurtosis – .31 – .47 – .63 – .28 .01 – .50 – .43 – .28
Cronbach’s α .69 .79 .68 .81 .73 .82 .70 .73
Correlation r = .62, p < .001, BF10 > 100 r = .68, p < .001, BF10 > 100 r = .64, p < .001, BF10 > 100 r = .62, p < .001, BF10 > 100
N 205 68 68 69
Behav Res (2019) 51:2256–22672262
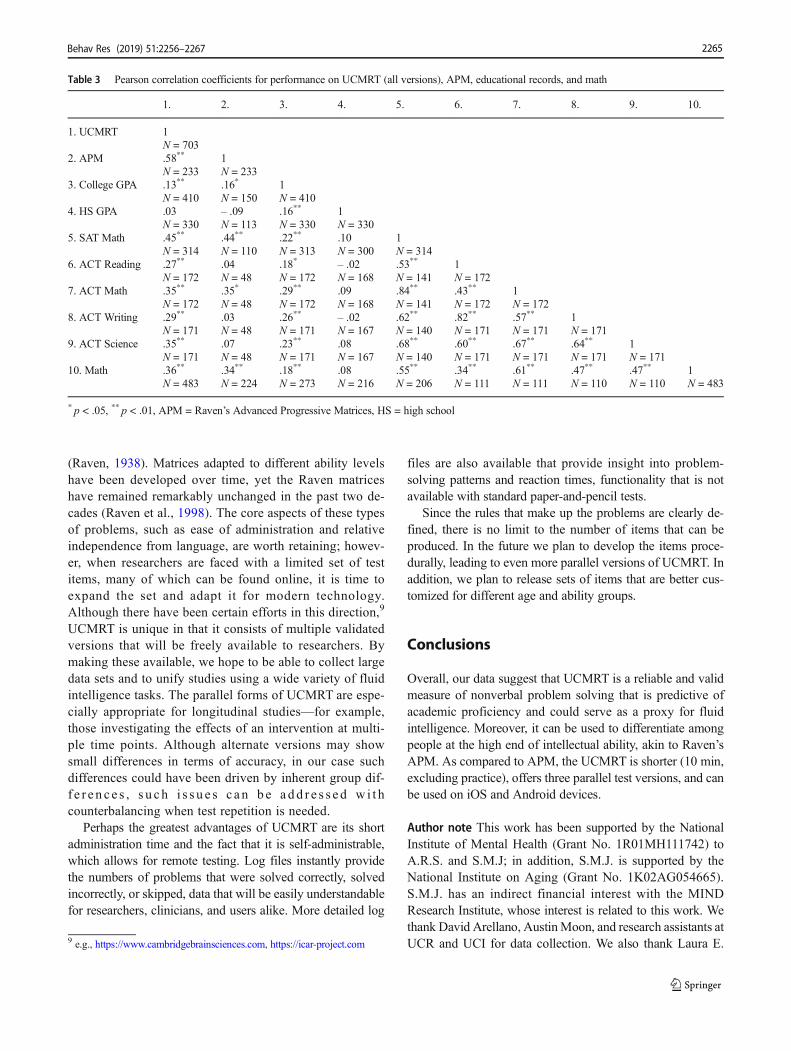
the Math Test correlated significantly with performance onboth UCMRT (r = .36, p < .001, BF10 > 100) and APM (r =.34, p < .001, BF10 > 100), providing further evidence for thevalidity of UCMRT (see Table 3).
Tests of academic proficiency We correlated accuracy onUCMRT and APM with academic proficiency, where thosedata were available (see Table 3). Performance on bothUCMRT and APM showed small but significant correlationswith current college GPA (rUCMRT = .13, p = .007, BF10 =2.19; rAPM = .16, p = .045, BF10 = 0.75). This is line withprevious research in which performance on APM was some-what weakly related to both first-term (r = .19, p < .05) andsecond-term (r = .18, p < .05) college GPA (Coyle & Pillow,2008). As a side note, the only measure that correlated signif-icantly with high school GPA was college GPA (r = .16, p =.003, BF10 = 5.03).8 Although high school GPA and perfor-mance on college admission tests is typically highly correlated(Koretz et al., 2016; Westrick, Le, Robbins, Radunzel, &Schmidt, 2015), this was not observed in the present sample,at least not in the ACT and SAT subtests included in theanalysis.
Performance on both UCMRT and APM also correlatedwith SAT Math (rUCMRT = .45, p < .001, BF10 > 100; rAPM= .44, p < .001, BF10 > 100) and ACT Math (rUCMRT = .35,p < .001, BF10 > 100; rAPM = .35, p = .02, BF10 = 3.26),which is consistent with the literature (Koenig, Frey, &
Detterman, 2008; Rohde & Thompson, 2007). On the otherhand, we did find differential correlations as a function ofmatrix reasoning test in various academic measures:Performance on UCMRT, but not on APM, predictedACT Reading (rUCMRT = .27, p < .001, BF10 = 52.53;rAPM = .04, p = .790, BF10 = 0.19), ACT Writing(rUCMRT = .29, p < .001, BF10 > 100; rAPM = .03, p =.862, BF10 = 0.18), and ACT Science (rUCMRT = .35, p <.001, BF10 > 100; rAPM = .07, p = .639, BF10 = 0.20),suggesting that UCMRT is predictive of global cognitivefunction. It should be noted that the sample size for APMwas smaller; however, on the basis of the correlation coef-ficients (.03–.07) and visual inspection of scatterplots (cf.Fig. S2, supplemental materials), a stronger relation withACT subtests would not be expected even if the samplesize were larger. There is limited research indicating thatSAT and ACT composite scores predict performance ontests of general ability (Coyle & Pillow, 2008; Koeniget al., 2008), and furthermore, ACT subtests show signifi-cant correlations with reasoning ability (Goff & Ackerman,1992); hence, the validity of UCMRT is in line with previ-ous work.
Individual versions of UCMRT showed similar rela-tions, albeit the evidence was limited by a smaller samplesize in certain cases (cf. Tables S4–S6, supplemental ma-terials). Version A showed significant correlations withSAT Math (r = .48, p < .001, BF10 > 100 ), ACT Writing(r = .30, p = .028, BF10 = 1.80), and ACT Science (r = .40,p = .003, BF10 = 12.51). Version B significantly correlatedwith SAT Math (r = .46, p < .001, BF10 > 100), ACT Math(r = .40, p = .003, BF10 = 13.18), and ACT Science (r =
8 Note that the correlation in the present study may have been lower becausewe obtained records of current GPA, rather than just first-year GPA, resultingin a mixture of first-year and higher-year GPAs.
Fig. 4 Average numbers of correctly solved problems on the alternate versions of UCMRT at two time points. Each participant completed two out ofthree alternate versions. Error bars = SEMs
Behav Res (2019) 51:2256–2267 2263
.28, p = .044, BF10 = 1.22). Version C was related to SATMath (r = .40, p < .001, BF10 > 100), ACT Reading (r =.37, p = .002, BF10 = 14.46), ACT Math (r = .40, p < .001,BF10 = 31.03), ACT Writing (r = .33, p = .007, BF10 =5.37), and ACT Science (r = .34, p = .006, BF10 = 6.17). Insummary, all three versions correlated with APM (Fig. 5),the Math Test, and SAT Math and ACT Science, and all butVersion A correlated with ACT Math.
Discussion
UCMRT is a tablet-based matrix reasoning test with threeparallel versions that can serve as a proxy for fluid intelli-gence. The A, B, and C versions of the test were validatedin a large sample of college students at two different sites.Overall, performance was similar across the three versions
and showed adequate internal consistency. Alternate-form re-liability was comparable to that in the literature (Colom et al.,2010; Freund & Holling, 2011; Unsworth, Heitz, Schrock, &Engle, 2005), suggesting that the participants did not showsignificant increases in performance over time and that theversions were comparable. Convergent validity wasestablished by comparing UCMRT to Raven’s APM. In addi-tion, performance on UCMRT correlated with a newly devel-oped Math Test, college GPA, and scores obtained on collegeadmission tests, showing correlations similar to those forAPM, thereby demonstrating external validity. In fact, perfor-mance on UCMRT correlated significantly with all ACT sub-test scores (Math, Science, Reading, and Writing), whereasperformance on APM showed significant correlations onlywith ACT Math.
Matrix reasoning problems have been the hallmark of testsestimating nonverbal fluid intelligence for over eight decades
Fig. 6 Mean accuracy on the UCMRT and APM in the three groups of participants who solved the alternate versions of UCMRT. Error bars = SEMs
Fig. 5 Scatterplots illustrating the correlations between UCMRT and APM accuracy for the three groups of participants who solved the A, B, and Cversions of UCMRT
Behav Res (2019) 51:2256–22672264
(Raven, 1938). Matrices adapted to different ability levelshave been developed over time, yet the Raven matriceshave remained remarkably unchanged in the past two de-cades (Raven et al., 1998). The core aspects of these typesof problems, such as ease of administration and relativeindependence from language, are worth retaining; howev-er, when researchers are faced with a limited set of testitems, many of which can be found online, it is time toexpand the set and adapt it for modern technology.Although there have been certain efforts in this direction,9
UCMRT is unique in that it consists of multiple validatedversions that will be freely available to researchers. Bymaking these available, we hope to be able to collect largedata sets and to unify studies using a wide variety of fluidintelligence tasks. The parallel forms of UCMRT are espe-cially appropriate for longitudinal studies—for example,those investigating the effects of an intervention at multi-ple time points. Although alternate versions may showsmall differences in terms of accuracy, in our case suchdifferences could have been driven by inherent group dif-f e r e n c e s , s u ch i s s u e s c an be a dd r e s s e d w i t hcounterbalancing when test repetition is needed.
Perhaps the greatest advantages of UCMRT are its shortadministration time and the fact that it is self-administrable,which allows for remote testing. Log files instantly providethe numbers of problems that were solved correctly, solvedincorrectly, or skipped, data that will be easily understandablefor researchers, clinicians, and users alike. More detailed log
files are also available that provide insight into problem-solving patterns and reaction times, functionality that is notavailable with standard paper-and-pencil tests.
Since the rules that make up the problems are clearly de-fined, there is no limit to the number of items that can beproduced. In the future we plan to develop the items proce-durally, leading to even more parallel versions of UCMRT. Inaddition, we plan to release sets of items that are better cus-tomized for different age and ability groups.
Conclusions
Overall, our data suggest that UCMRT is a reliable and validmeasure of nonverbal problem solving that is predictive ofacademic proficiency and could serve as a proxy for fluidintelligence. Moreover, it can be used to differentiate amongpeople at the high end of intellectual ability, akin to Raven’sAPM. As compared to APM, the UCMRT is shorter (10 min,excluding practice), offers three parallel test versions, and canbe used on iOS and Android devices.
Author note This work has been supported by the NationalInstitute of Mental Health (Grant No. 1R01MH111742) toA.R.S. and S.M.J; in addition, S.M.J. is supported by theNational Institute on Aging (Grant No. 1K02AG054665).S.M.J. has an indirect financial interest with the MINDResearch Institute, whose interest is related to this work. Wethank David Arellano, AustinMoon, and research assistants atUCR and UCI for data collection. We also thank Laura E.9 e.g., https://www.cambridgebrainsciences.com, https://icar-project.com
Table 3 Pearson correlation coefficients for performance on UCMRT (all versions), APM, educational records, and math
1. 2. 3. 4. 5. 6. 7. 8. 9. 10.
1. UCMRT 1N = 703
2. APM .58**
N = 2331N = 233
3. College GPA .13**
N = 410.16*
N = 1501N = 410
4. HS GPA .03N = 330
– .09N = 113
.16**
N = 3301N = 330
5. SAT Math .45**
N = 314.44**
N = 110.22**
N = 313.10N = 300
1N = 314
6. ACT Reading .27**
N = 172.04N = 48
.18*
N = 172– .02N = 168
.53**
N = 1411N = 172
7. ACT Math .35**
N = 172.35*
N = 48.29**
N = 172.09N = 168
.84**
N = 141.43**
N = 1721N = 172
8. ACT Writing .29**
N = 171.03N = 48
.26**
N = 171– .02N = 167
.62**
N = 140.82**
N = 171.57**
N = 1711N = 171
9. ACT Science .35**
N = 171.07N = 48
.23**
N = 171.08N = 167
.68**
N = 140.60**
N = 171.67**
N = 171.64**
N = 1711N = 171
10. Math .36**
N = 483.34**
N = 224.18**
N = 273.08N = 216
.55**
N = 206.34**
N = 111.61**
N = 111.47**
N = 110.47**
N = 1101N = 483
* p < .05, ** p < .01, APM = Raven’s Advanced Progressive Matrices, HS = high school
Behav Res (2019) 51:2256–2267 2265
Matzen for providing access to the matrices generated bySandia National Laboratories and Gabriella Del Greco forhelping with the design of the interface.
References
Ackerman, P. L., & Kanfer, R. (2009). Test length and cognitive fatigue:An empirical examination of effects on performance and test-takerreactions. Journal of Experimental Psychology. Applied, 15, 163–181. https://doi.org/10.1037/a0015719
Arthur, W, & Day, D. V. (1994). Development of a short form for theRaven Advanced Progressive Matrices test. Educational andPsychological Measurement, 54, 394–403. https://doi.org/10.1177/0013164494054002013
Arthur, W., & Woehr, D. J. (1993). A confirmatory factor analytic studyexamining the dimensionality of the raven’s advanced progressivematrices. Educational and Psychological Measurement, 53, 471–478. https://doi.org/10.1177/0013164493053002016
Bors, D. A., & Stokes, T. L. (1998). Raven’s Advanced ProgressiveMatrices: Norms for first-year university students and the devel-opment of a short form. Educational and PsychologicalMeasurement , 58 , 382–398. ht tps : / /doi .org/10.1177/0013164498058003002
Cattell, R. B. (1963). Theory of fluid and crystallized intelligence: Acritical experiment. Journal of Educational Psychology, 54, 1–22.https://doi.org/10.1037/h0046743
Clark, C. M., Lawlor-Savage, L., & Goghari, V. M. (2017). Workingmemory training in healthy young adults: Support for the null froma randomized comparison to active and passive control groups. PlosOne, 12, e0177707. https://doi.org/10.1371/journal.pone.0177707
Colom, R., Quiroga, M. Á., Shih, P. C., Martínez, K., Burgaleta, M.,Martínez-Molina, A., . . . Ramírez, I. (2010). Improvement in work-ing memory is not related to increased intelligence scores.Intelligence, 38, 497–505. https://doi.org/10.1016/j.intell.2010.06.008
Colom, R., Román, F. J., Abad, F. J., Shih, P. C., Privado, J., Froufe, M., .. . Jaeggi, S. M. (2013). Adaptive n-back training does not improvefluid intelligence at the construct level: Gains on individual testssuggest that training may enhance visuospatial processing.Intelligence, 41, 712–727. https://doi.org/10.1016/j.intell.2013.09.002
Condon, D. M., & Revelle, W. (2014). The international cognitive abilityresource: Development and initial validation of a public-domainmeasure. Intelligence, 43, 52–64. https://doi.org/10.1016/j.intell.2014.01.004
Coyle, T. R., & Pillow, D. R. (2008). SAT and ACT predict college GPAafter removing g. Intelligence, 36, 719–729. https://doi.org/10.1016/j.intell.2008.05.001
Frearson, W., & Eysenck, H. J. (1986). Intelligence, reaction time (RT)and a new Bodd-man-out^ RT paradigm. Personality and IndividualDifferences, 7, 807–817. https://doi.org/10.1016/0191-8869(86)90079-6
Freund, P. A., & Holling, H. (2011). How to get really smart: Modelingretest and training effects in ability testing using computer-generatedfigural matrix items. Intelligence, 39, 233–243. https://doi.org/10.1016/j.intell.2011.02.009
Goff, M., & Ackerman, P. L. (1992). Personality-intelligence relations:Assessment of typical intellectual engagement. Journal ofEducational Psychology, 84, 537–552. https://doi.org/10.1037/0022-0663.84.4.537
Hamel, R., & Schmittmann, V. D. (2006). The 20-minute version as apredictor of the Raven Advanced Progressive Matrices test.
Educational and Psychological Measurement, 66, 1039–1046.https://doi.org/10.1177/0013164406288169
Hogrefe, A. B., Studer-Luethi, B., Kodzhabashev, S., & Perrig, W. J.(2017). Mechanisms underlying N-back training: Response consis-tency during training influences training outcome. Journal ofCognitive Enhancement, 1, 406–418. https://doi.org/10.1007/s41465-017-0042-3
Hossiep, R., Turck, D., & Hasella, M. (1999). Bochumer Matrizentest.BOMAT advanced.
ICAR Catalogue. (2017). Version 1.0, 06 I 17. Retrieved August 19,2018, from https://icar-project.com/ICAR_Catalogue.pdf
Jaeggi, S. M., Buschkuehl, M., Shah, P., & Jonides, J. (2014). Therole of individual differences in cognitive training and transfer.Memory & Cognition, 42, 464–480. https://doi.org/10.3758/s13421-013-0364-z
Jaeggi, S. M., Studer-Luethi, B., Buschkuehl, M., Su, Y.-F., Jonides, J., &Perrig, W. J. (2010). The relationship between n-back performanceand matrix reasoning—Implications for training and transfer.Intelligence, 38, 625–635. https://doi.org/10.1016/j.intell.2010.09.001
JASP Team. (2018). JASP (Version 0.9.0.1) [Computer software].Retrieved from https://jasp-stats.org/download/
Koenig, K. A., Frey, M. C., & Detterman, D. K. (2008). ACTand generalcognitive ability. Intelligence, 36, 153–160. https://doi.org/10.1016/j.intell.2007.03.005
Koretz, D., Yu, C., Mbekeani, P. P., Langi, M., Dhaliwal, T., & Braslow,D. (2016). Predicting freshman grade point average from collegeadmissions test scores and state high school test scores. AERAOpen , 2 , 233285841667060. ht tps: / /doi .org/10.1177/2332858416670601
Lee, M. D., &Wagenmakers, E.-J. (2013). Bayesian cognitive modeling:A practical course. Cambridge, UK: Cambridge University Press.https://doi.org/10.1017/CBO9781139087759
Matzen, L. E., Benz, Z. O., Dixon, K. R., Posey, J., Kroger, J. K., &Speed, A. E. (2010). Recreating Raven’s: Software for systematical-ly generating large numbers of Raven-like matrix problems withnormed properties. Behavior Research Methods, 42, 525–541.https://doi.org/10.3758/BRM.42.2.525
Raven, J. C. (1938). Progressive matrices: A perceptual test of intelli-gence. London: H.K. Lewis.
Raven, J. C., Court, J. H., & Raven, J. (1998). Manual for Raven’sProgressive Matrices and Vocabulary Scales: Section 4. AdvancedProgressive Matrices, Sets I & II. Oxford, UK: OxfordPsychologists Press.
Redick, T. S., Shipstead, Z., Harrison, T. L., Hicks, K. L., Fried, D.E., Hambrick, D. Z., . . . Engle, R. W. (2013). No evidence ofintelligence improvement after working memory training: Arandomized , p l acebo -con t ro l l ed s tudy. Journa l o fExperimental Psychology: General, 142, 359–379. https://doi.org/10.1037/a0029082
Rohde, T. E., & Thompson, L. A. (2007). Predicting academic achieve-ment with cognitive ability. Intelligence, 35, 83–92. https://doi.org/10.1016/j.intell.2006.05.004
Salthouse, T. A. (1993). Influence of working memory on adult age dif-ferences in matrix reasoning. British Journal of Psychology, 84(Part2), 171–199.
Sefcek, J. A., Miller, G. F., & Figueredo, A. J. (2016). Development andvalidation of an 18-item medium form of the Ravens AdvancedProgressive Matrices. SAGE Open, 6, 215824401665191. https://doi.org/10.1177/2158244016651915
Stough, C., Camfield, D., Kure, C., Tarasuik, J., Downey, L., Lloyd, J., . .. Reynolds, J. (2011). Improving general intelligence with a nutrient-based pharmacological intervention. Intelligence, 39, 100–107.https://doi.org/10.1016/j.intell.2011.01.003
Unsworth, N., & Engle, R. (2005). Working memory capacity and fluidabilities: Examining the correlation between Operation Span and
Behav Res (2019) 51:2256–22672266
Raven. Intelligence, 33, 67–81. https://doi.org/10.1016/j.intell.2004.08.003
Unsworth, N., Heitz, R. P., Schrock, J. C., & Engle, R. W. (2005). Anautomated version of the operation span task. BehaviorResearch Methods, 37, 498–505. https://doi.org/10.3758/BF03192720
Unsworth, N., Redick, T. S., Lakey, C. E., & Young, D. L. (2010). Lapsesin sustained attention and their relation to executive control and fluidabilities: An individual differences investigation. Intelligence, 38,111–122. https://doi.org/10.1016/j.intell.2009.08.002
Wagenmakers, E.-J., Love, J., Marsman, M., Jamil, T., Ly, A.,Verhagen, J., . . . Morey, R. D. (2018). Bayesian inference forpsychology: Part II. Example applications with JASP.Psychonomic Bulletin & Review, 25, 58–76. https://doi.org/10.3758/s13423-017-1323-7
Westrick, P. A., Le, H., Robbins, S. B., Radunzel, J. M. R., & Schmidt, F.L. (2015). College Performance and retention: A meta-analysis ofthe predictive validities of ACT® scores, high school grades, andSES. Educational Assessment, 20, 23–45. https://doi.org/10.1080/10627197.2015.997614
Behav Res (2019) 51:2256–2267 2267