Embed Size (px)
Citation preview
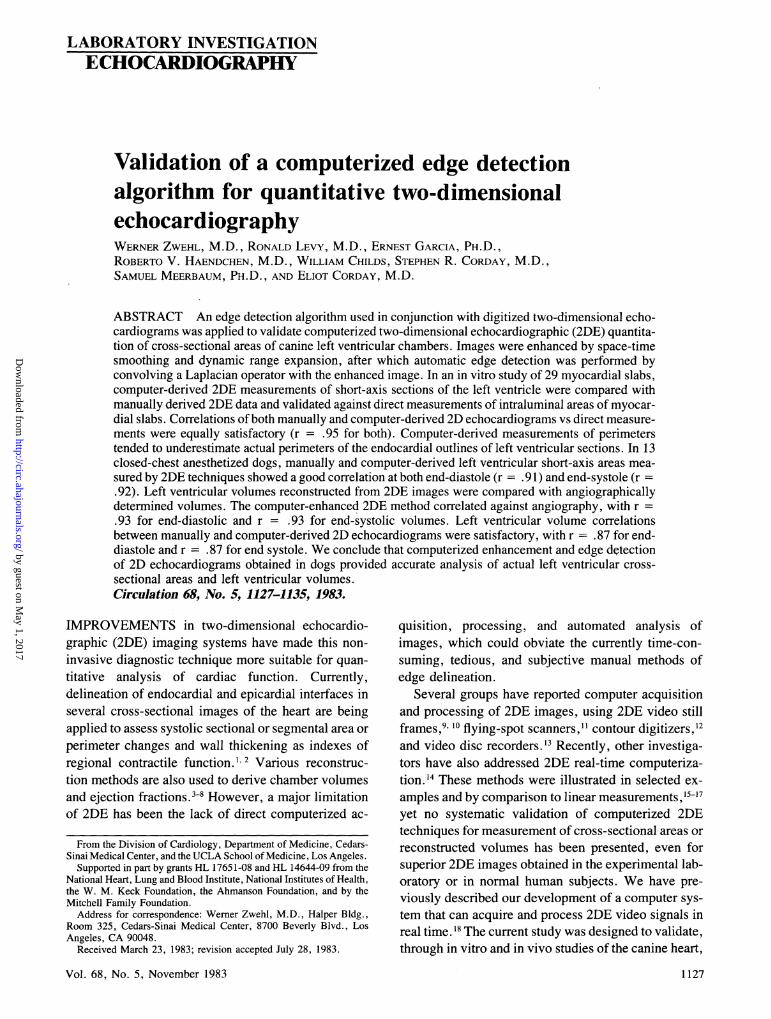
LABORATORY INVESTIGATIONECHOCARDIOGRAPHY
Validation of a computerized edge detectionalgorithm for quantitative two-dimensionalechocardiographyWERNER ZWEHL, M.D., RONALD LEVY, M.D., ERNEST GARCIA, PH.D.,ROBERTO V. HAENDCHEN, M.D., WILLIAM CHILDS, STEPHEN R. CORDAY, M.D.,SAMUEL MEERBAUM, PH.D., AND ELIOT CORDAY, M.D.
ABSTRACT An edge detection algorithm used in conjunction with digitized two-dimensional echo-cardiograms was applied to validate computerized two-dimensional echocardiographic (2DE) quantita-tion of cross-sectional areas of canine left ventricular chambers. Images were enhanced by space-timesmoothing and dynamic range expansion, after which automatic edge detection was performed byconvolving a Laplacian operator with the enhanced image. In an in vitro study of 29 myocardial slabs,computer-derived 2DE measurements of short-axis sections of the left ventricle were compared withmanually derived 2DE data and validated against direct measurements of intraluminal areas of myocar-dial slabs. Correlations of both manually and computer-derived 2D echocardiograms vs direct measure-ments were equally satisfactory (r = .95 for both). Computer-derived measurements of perimeterstended to underestimate actual perimeters of the endocardial outlines of left ventricular sections. In 13closed-chest anesthetized dogs, manually and computer-derived left ventricular short-axis areas mea-
sured by 2DE techniques showed a good correlation at both end-diastole (r = .91) and end-systole (r =.92). Left ventricular volumes reconstructed from 2DE images were compared with angiographicallydetermined volumes. The computer-enhanced 2DE method correlated against angiography, with r =
.93 for end-diastolic and r = .93 for end-systolic volumes. Left ventricular volume correlationsbetween manually and computer-derived 2D echocardiograms were satisfactory, with r = .87 for end-diastole and r = .87 for end systole. We conclude that computerized enhancement and edge detectionof 2D echocardiograms obtained in dogs provided accurate analysis of actual left ventricular cross-
sectional areas and left ventricular volumes.Circulation 68, No. 5, 1127-1135, 1983.
IMPROVEMENTS in two-dimensional echocardio-graphic (2DE) imaging systems have made this non-invasive diagnostic technique more suitable for quan-titative analysis of cardiac function. Currently,delineation of endocardial and epicardial interfaces inseveral cross-sectional images of the heart are beingapplied to assess systolic sectional or segmental area orperimeter changes and wall thickening as indexes ofregional contractile function." 2 Various reconstruc-tion methods are also used to derive chamber volumesand ejection fractions.-8 However, a major limitationof 2DE has been the lack of direct computerized ac-
From the Division of Cardiology, Department of Medicine, Cedars-Sinai Medical Center, and the UCLA School of Medicine, Los Angeles.
Supported in part by grants HL 17651-08 and HL 14644-09 from theNational Heart, Lung and Blood Institute, National Institutes of Health,the W. M. Keck Foundation, the Ahmanson Foundation, and by theMitchell Family Foundation.
Address for correspondence: Werner Zwehl, M.D., Halper Bldg.,Room 325, Cedars-Sinai Medical Center, 8700 Beverly Blvd., LosAngeles, CA 90048.
Received March 23, 1983; revision accepted July 28, 1983.
Vol. 68, No. 5, November 1983
quisition, processing, and automated analysis ofimages, which could obviate the currently time-con-suming, tedious, and subjective manual methods ofedge delineation.
Several groups have reported computer acquisitionand processing of 2DE images, using 2DE video stillframes ,9 '° flying-spot scanners,"' contour digitizers,'2and video disc recorders.'3 Recently, other investiga-tors have also addressed 2DE real-time computeriza-tion.'4 These methods were illustrated in selected ex-amples and by comparison to linear measurements,'5-'7yet no systematic validation of computerized 2DEtechniques for measurement of cross-sectional areas orreconstructed volumes has been presented, even forsuperior 2DE images obtained in the experimental lab-oratory or in normal human subjects. We have pre-viously described our development of a computer sys-tem that can acquire and process 2DE video signals inreal time.1' The current study was designed to validate,through in vitro and in vivo studies of the canine heart,
1127
by guest on May 1, 2017
http://circ.ahajournals.org/D
ownloaded from
ZWEHL et al.
the adequacy of a fully automated endocardial edgedetection method for computerized quantitation of re-gional and global left ventricular function.
MethodsComputer methodologyInstrumentation and image acquisition. The computer sys-
tem used in this study consisted of the following:(1) Nova-3 central processor unit(2) 128 K 16 bit word main-frame memory(3) 256 K 16 bit word remote or auxiliary memory(4) 80 megabyte multiplate storage module (magnetic disc)(5) Keyboard and video display with up to 512 x 512 pixel
resolution, with 256 gray levels(6) Video interface
The video interface consisted of an analog-to-digital convert-er capable of digitizing in real time 100 pixels per video line andstoring them into memory. The input video field consists of a640 and 480 pixel matrix. A window encompassing the 2DEvideo image is digitized into 8 bit pixels in a chosen 64 x 64frame format, which is continuously transferred to the disc at 30frames/sec, as required for real-time acquisition.The window location on the video screen was controlled by
software and operator joystick. Combination of pixel inputs intomemory was done by maximum pixel intensity within a unitarea.
Processing. A 64 x 64 matrix windowed to encompass justthe area of the left x entricle was used to convert an analog 2DE
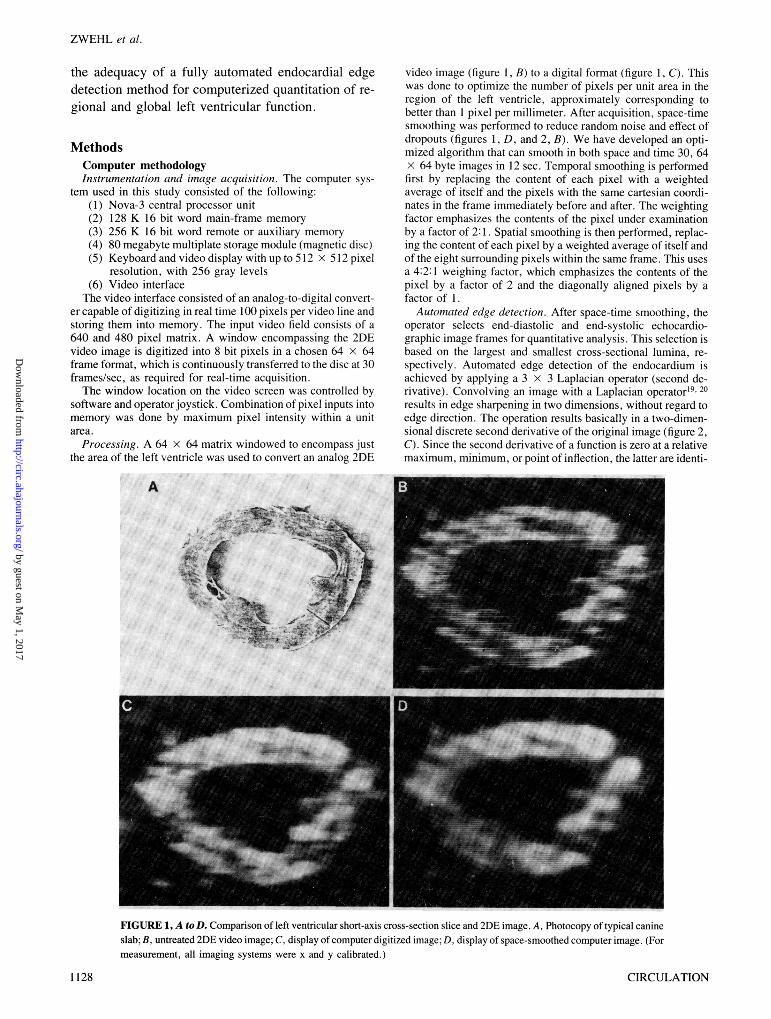
video image (figure 1, B) to a digital format (figure 1, C). Thiswas done to optimize the number of pixels per unit area in theregion of the left ventricle, approximately corresponding tobetter than I pixel per millimeter. After acquisition, space-timesmoothing was performed to reduce random noise and effect ofdropouts (figures 1, D, and 2, B). We have developed an opti-mized algorithm that can smooth in both space and time 30, 64x 64 byte images in 12 sec. Temporal smoothing is performedfirst by replacing the content of each pixel with a weightedaverage of itself and the pixels with the same cartesian coordi-nates in the frame immediately before and after. The weightingfactor emphasizes the contents of the pixel under examinationby a factor of 2:1. Spatial smoothing is then performed, replac-ing the content of each pixel by a weighted average of itself andof the eight surrounding pixels within the same frame. This usesa 4:2:1 weighing factor, which emphasizes the contents of thepixel by a factor of 2 and the diagonally aligned pixels by afactor of 1.Automated edge detection. After space-time smoothing, the
operator selects end-diastolic and end-systolic echocardio-graphic image frames for quantitative analysis. This selection isbased on the largest and smallest cross-sectional lumina, re-spectively. Automated edge detection of the endocardium isachieved by applying a 3 x 3 Laplacian operator (second de-rivative). Convolving an image with a Laplacian operator'9 20results in edge sharpening in two dimensions, without regard toedge direction. The operation results basically in a two-dimen-sional discrete second derivative of the original image (figure 2,C). Since the second derivative of a function is zero at a relativemaximum, minimum, or point of inflection, the latter are identi-
A
x46-
FIGURE 1, A to D. Comparison of left ventricular short-axis cross-section slice and 2DE image. A, Photocopy of typical canineslab; B, untreated 2DE video image; C, display of computer digitized image; D, display of space-smoothed computer image. (Formeasurement, all imaging systems were x and y calibrated.)
CIRCULATION1128
- : - - --- - -I
by guest on May 1, 2017
http://circ.ahajournals.org/D
ownloaded from
LABORATORY INVESTIGATION ECHOCARDIOGRAPHY
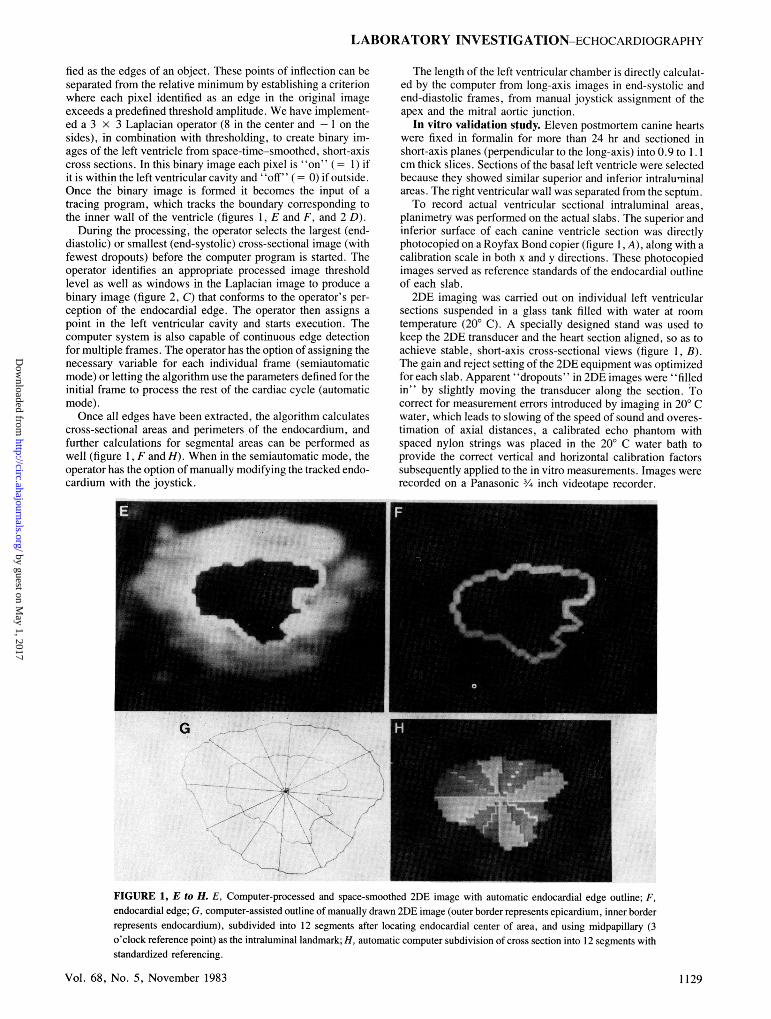
fied as the edges of an object. These points of inflection can beseparated from the relative minimum by establishing a criterionwhere each pixel identified as an edge in the original imageexceeds a predefined threshold amplitude. We have implement-ed a 3 x 3 Laplacian operator (8 in the center and -1 on thesides), in combination with thresholding, to create binary im-ages of the left ventricle from space-time-smoothed, short-axiscross sections. In this binary image each pixel is "on" (= 1) ifit is within the left ventricular cavity and "off ( 0) if outside.Once the binary image is formed it becomes the input of atracing program, which tracks the boundary corresponding tothe inner wall of the ventricle (figures 1, E and F, and 2 D).
During the processing, the operator selects the largest (end-diastolic) or smallest (end-systolic) cross-sectional image (withfewest dropouts) before the computer program is started. Theoperator identifies an appropriate processed image thresholdlevel as well as windows in the Laplacian image to produce abinary image (figure 2, C) that conforms to the operator's per-ception of the endocardial edge. The operator then assigns apoint in the left ventricular cavity and starts execution. Thecomputer system is also capable of continuous edge detectionfor multiple frames. The operator has the option of assigning thenecessary variable for each individual frame (semiautomaticmode) or letting the algorithm use the parameters defined for theinitial frame to process the rest of the cardiac cycle (automaticmode).Once all edges have been extracted, the algorithm calculates
cross-sectional areas and perimeters of the endocardium, andfurther calculations for segmental areas can be performed aswell (figure 1, F and H). When in the semiautomatic mode, theoperator has the option of manually modifying the tracked endo-cardium with the joystick.
The length of the left ventricular chamber is directly calculat-ed by the computer from long-axis images in end-systolic andend-diastolic frames, from manual joystick assignment of theapex and the mitral aortic junction.
In vitro validation study. Eleven postmortem canine heartswere fixed in formalin for more than 24 hr and sectioned inshort-axis planes (perpendicular to the long-axis) into 0.9 to 1. Icm thick slices. Sections of the basal left ventricle were selectedbecause they showed similar superior and inferior intraluminalareas. The right ventricular wall was separated from the septum.To record actual ventricular sectional intraluminal areas,
planimetry was performed on the actual slabs. The superior andinferior surface of each canine ventricle section was directlyphotocopied on a Royfax Bond copier (figure l, A), along with acalibration scale in both x and y directions. These photocopiedimages served as reference standards of the endocardial outlineof each slab.2DE imaging was carried out on individual left ventricular
sections suspended in a glass tank filled with water at roomtemperature (200 C). A specially designed stand was used tokeep the 2DE transducer and the heart section aligned, so as toachieve stable, short-axis cross-sectional views (figure 1, B).The gain and reject setting of the 2DE equipment was optimizedfor each slab. Apparent "dropouts" iln 2DE images were " filledin" by slightly moving the transducer along the section. Tocorrect for measurement errors introduced by imaging in 20 Cwater, which leads to slowing of the speed of sound and overes-timation of axial distances, a calibrated echo phantom withspaced nylon strings was placed in the 20° C water bath toprovide the correct vertical and horizontal calibration factorssubsequently applied to the in vitro measurements. Images wererecorded on a Panasonic 3/4 inch videotape recorder.
G
i..../~~~~~~~~~~~~~~~~~~~~~~~~~~~~~~~~~~~~~~~~~~~~~~~~~~~~~~~~~~~~~~~~~~~~~~~~~~~~~~~~~~~~~~~~~~~~~~~~~~~~~~~~~~....
FIGURE 1, E to H. E, Computer-processed and space-smoothed 2DE image with automatic endocardial edge outline; F,endocardial edge; G, computer-assisted outline of manually drawn 2DE image (outer border represents epicardium, inner borderrepresents endocardium), subdivided into 12 segments after locating endocardial center of area, and using midpapillary (3o'clock reference point) as the intraluminal landmark; H, automatic computer subdivision of cross section into 12 segments withstandardized referencing.
Vol. 68, No. 5, November 1983 1129
by guest on May 1, 2017
http://circ.ahajournals.org/D
ownloaded from
ZWEHL et al.
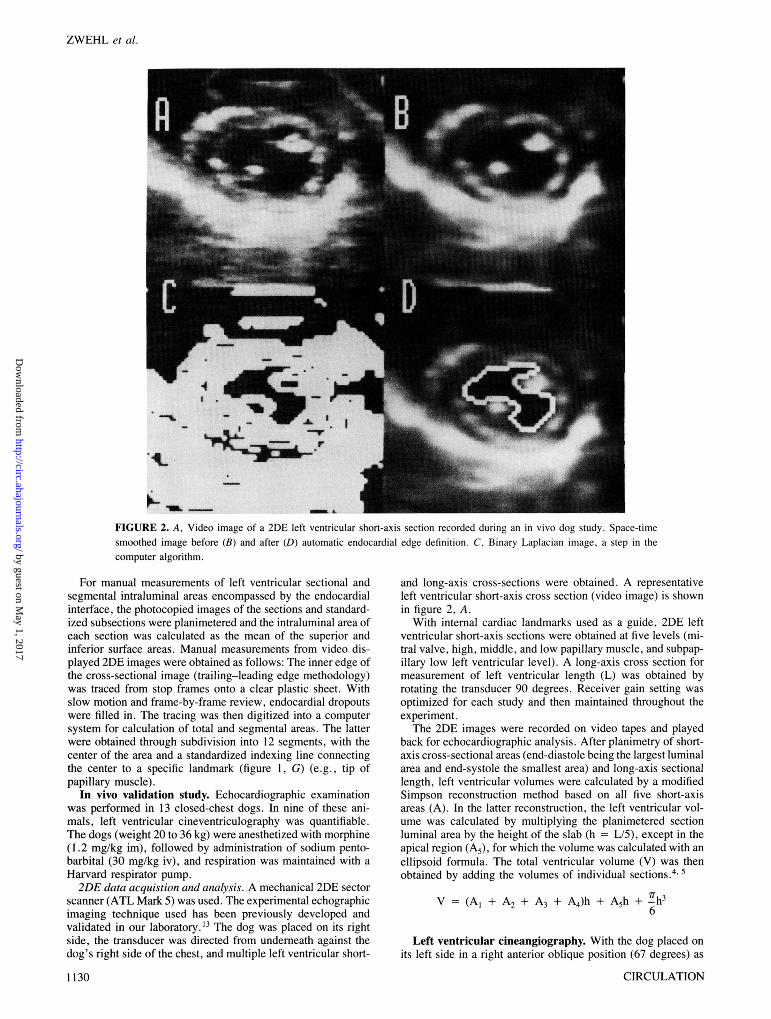
FIGURE 2. A, Video image of a 2DE left ventricular short-axis section recorded during an in vivo dog study. Space-timesmoothed image before (B) and after (D) automatic endocardial edge definition. C. Binary Laplacian image, a step in thecomputer algorithm.
For manual measurements of left ventricular sectional andsegmental intraluminal areas encompassed by the endocardialinterface, the photocopied images of the sections and standard-ized subsections were planimetered and the intraluminal area ofeach section was calculated as the mean of the superior andinferior surface areas. Manual measurements from video dis-played 2DE images were obtained as follows: The inner edge ofthe cross-sectional image (trailing-leading edge methodology)was traced from stop frames onto a clear plastic sheet. Withslow motion and frame-by-frame review, endocardial dropoutswere filled in. The tracing was then digitized into a computersystem for calculation of total and segmental areas. The latterwere obtained through subdivision into 12 segments, with thecenter of the area and a standardized indexing line connectingthe center to a specific landmark (figure 1, G) (e.g., tip ofpapillary muscle).
In vivo validation study. Echocardiographic examinationwas performed in 13 closed-chest dogs. In nine of these ani-mals, left ventricular cineventriculography was quantifiable.The dogs (weight 20 to 36 kg) were anesthetized with morphine(1.2 mg/kg im), followed by administration of sodium pento-barbital (30 mg/kg iv), and respiration was maintained with aHarvard respirator pump.2DE data acquistion and analysis. A mechanical 2DE sector
scanner (ATL Mark 5) was used. The experimental echographicimaging technique used has been previously developed andvalidated in our laboratory.13 The dog was placed on its rightside, the transducer was directed from underneath against thedog's right side of the chest, and multiple left ventricular short-
1130
and long-axis cross-sections were obtained. A representativeleft ventricular short-axis cross section (video image) is shownin figure 2, A.
With internal cardiac landmarks used as a guide, 2DE leftventricular short-axis sections were obtained at five levels (mi-tral valve, high, middle, and low papillary muscle, and subpap-illary low left ventricular level). A long-axis cross section formeasurement of left ventricular length (L) was obtained byrotating the transducer 90 degrees. Receiver gain setting wasoptimized for each study and then maintained throughout theexperiment.
The 2DE images were recorded on video tapes and playedback for echocardiographic analysis. After planimetry of short-axis cross-sectional areas (end-diastole being the largest luminalarea and end-systole the smallest area) and long-axis sectionallength, left ventricular volumes were calculated by a modifiedSimpson reconstruction method based on all five short-axisareas (A). In the latter reconstruction, the left ventricular vol-ume was calculated by multiplying the planimetered sectionluminal area by the height of the slab (h = L/5), except in theapical region (A), for which the volume was calculated with anellipsoid formula. The total ventricular volume (V) was thenobtained by adding the volumes of individual sections.4'5
V - (Al + A2 + A3 + A4)h + A9h + ITh6
Left ventricular cineangiography. With the dog placed onits left side in a right anterior oblique position (67 degrees) as
CIRCULATION
by guest on May 1, 2017
http://circ.ahajournals.org/D
ownloaded from
LABORATORY INVESTIGATION-ECHOCARDIOGRAPHY
suggested by Bentivoglio et al.,21 a 50% hypague solution (1ml/kg) was injected into the left ventricle with an electrocardio-graph-synchronized system in early diastole. Ventriculogramswere recorded at 30 frames/sec on 16 mm film, and end-diastol-ic (largest) and end-systolic (smallest) outlines of the left ventri-cle were subsequently traced.
Left ventricular volumes were calculated with standard for-mulas, assuming left ventricular geometry as an ellipsoid ofrevolution. Volumes were corrected by means of the Kennedyregression equation.22Methods for reproducibility analysis. To determine inter-
observer and intraobserver variability, measurements of man-ually outlined and computer-processed echocardiograms wereanalyzed twice by one observer and by two independent observ-ers.
Statistical analysis. All data were analyzed by linear regres-sion with the method of least squares to obtain estimates of theslopes and intercept parameters.
ResultsIn vitro. A representative photocopied image of a left
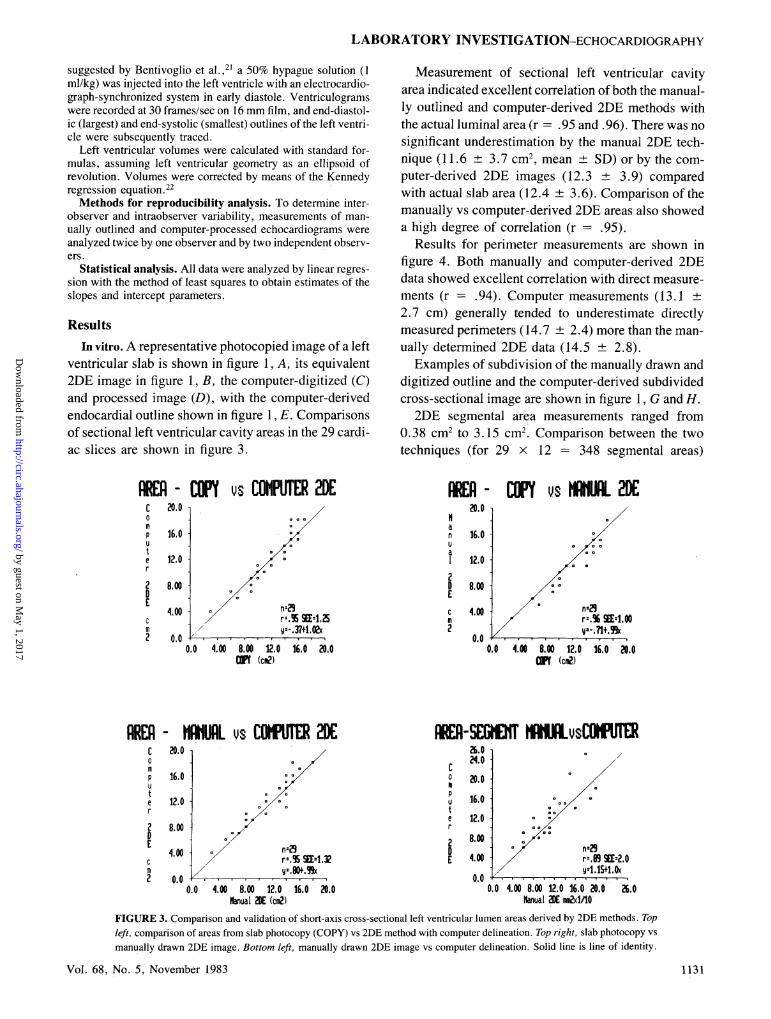
ventricular slab is shown in figure 1, A, its equivalent2DE image in figure 1, B, the computer-digitized (C)and processed image (D), with the computer-derivedendocardial outline shown in figure 1, E. Comparisonsof sectional left ventricular cavity areas in the 29 cardi-ac slices are shown in figure 3.
AREA - COPY vs COMPUTER 2DEc 20.0pmp 16.0t
e/
e 12.0r/H2 8.00D
4.00 <r-.96 SEF1.25m ,yz- 37t1.0E
2 0.0A0.0 4.00 8.00 12.0 16.0 20.0
li (cml2)
Measurement of sectional left ventricular cavityarea indicated excellent correlation of both the manual-ly outlined and computer-derived 2DE methods withthe actual luminal area (r = .95 and .96). There was nosignificant underestimation by the manual 2DE tech-nique (11.6 ± 3.7 cm2mean + SD) or by the com-puter-derived 2DE images (12.3 + 3.9) comparedwith actual slab area (12.4 ± 3.6). Comparison of themanually vs computer-derived 2DE areas also showeda high degree of correlation (r = .95).
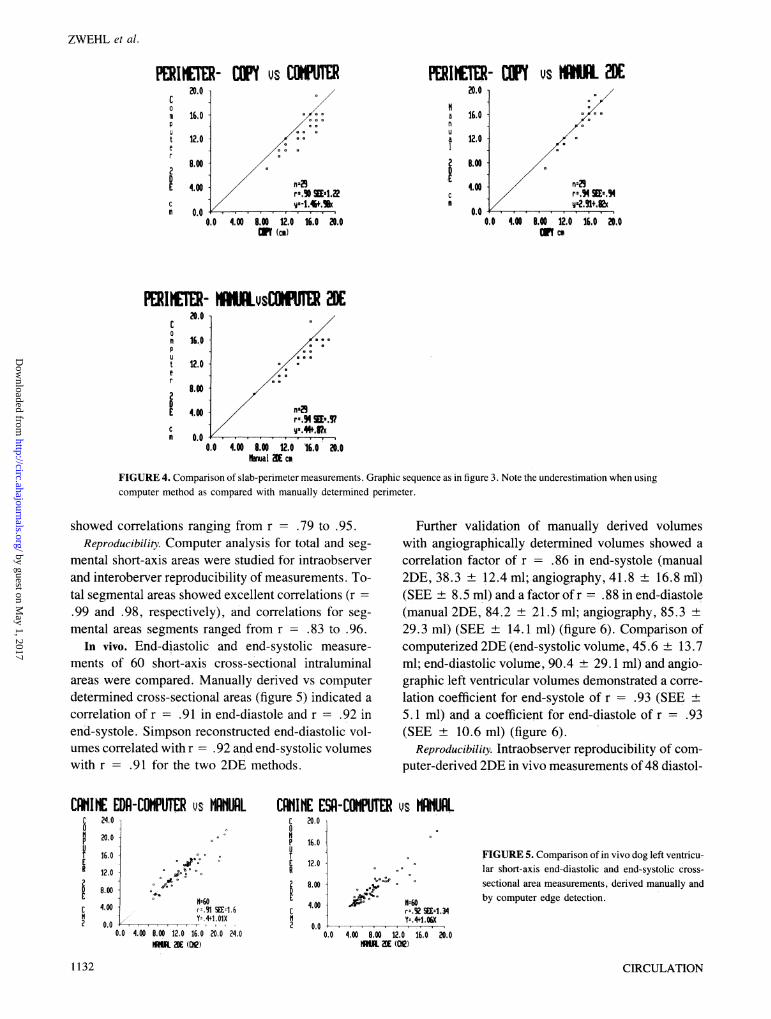
Results for perimeter measurements are shown infigure 4. Both manually and computer-derived 2DEdata showed excellent correlation with direct measure-ments (r = .94). Computer measurements (13.1 ±2.7 cm) generally tended to underestimate directlymeasured perimeters (14.7 + 2.4) more than the man-ually determined 2DE data (14.5 ± 2.8).
Examples of subdivision of the manually drawn anddigitized outline and the computer-derived subdividedcross-sectional image are shown in figure 1, G and H.2DE segmental area measurements ranged from
0.38 cm2 to 3.15 cm2. Comparison between the twotechniques (for 29 x 12 = 348 segmental areas)
Nanual20E
m2
eu.u/
16.0
12.0 -
0.00.0 4.00 8.oo 12.0 16.0 20.0
Cr (t)l
AREA - MNUAL sCMU 2DE aR-SMET AN LvsCMPUC 20.0 26.0p 24.0p 16.0 . ° 20.0umt pe 12.0 u 16.0
2 8.0- r0 .0E 2 8 n--29
c rz.% SEE=1.32 E 4.00 ~~~~~~~~r:.BUSE:2.0c r.09535E11.51A2 0.0 0.0
0.0 4.00 8.00 12.0 16.0 20.0 0.0 4.00 8.00 12.0 16.0 20.0 26.0Manual 21DE (cQ) Nanual 2DE t1/10
FIGURE 3. Comparison and validation of short-axis cross-sectional left ventricular lumen areas derived by 2DE methods. Topleft, comparison of areas from slab photocopy (COPY) vs 2DE method with computer delineation. Top right, slab photocopy vs
manually drawn 2DE image. Bottom left, manually drawn 2DE image vs computer delineation. Solid line is line of identity.
Vol. 68, No. 5, November 1983 1131
mmvn - COPY%6n s WHA 2DE
by guest on May 1, 2017
http://circ.ahajournals.org/D
ownloaded from
PERIETER- CFY vs CWTE20.0 /
cC0m 16.0 Dp
t 12.0/e W
2VE 4.0W-n 2
D / ~~~~~~~~r-.90SEE=1.22c / -1.46o.I
m 0.0 - . . ..
0.0 4W00 8.00 12.0 16.0 20.0W (cm)
PERIME TER- vs 20E20.0 1n/
Ianua
E20
cm
16.0
12.0
W.00
4.00
0.00.0 4.W 8.W 12.0 16.0 20.0
cm cm
PERIMETER- IsC TR 2DE20.0
c
1 16.0p
t 12.0e Ar /
2 .002
E 4.00
0.0
0.0 4.00 8.00 12.0 16.0 20.0OmuI 2DE cm
FIGURE 4. Comparison of slab-perimeter measurements. Graphic sequence as in figure 3. Note the underestimation when usingcomputer method as compared with manually determined perimeter.
showed correlations ranging from r = .79 to .95.Reproducibility. Computer analysis for total and seg-
mental short-axis areas were studied for intraobserverand interoberver reproducibility of measurements. To-tal segmental areas showed excellent correlations (r =.99 and .98, respectively), and correlations for seg-mental areas segments ranged from r = .83 to .96.
In vivo. End-diastolic and end-systolic measure-ments of 60 short-axis cross-sectional intraluminalareas were compared. Manually derived vs computerdetermined cross-sectional areas (figure 5) indicated acorrelation of r = .91 in end-diastole and r = .92 inend-systole. Simpson reconstructed end-diastolic vol-umes correlated with r = .92 and end-systolic volumeswith r = .91 for the two 2DE methods.
CAINIE EDf-COMPUTER vs MEHUAL CNIIHE ESR-COPUTERC 24.0 C 20.0o 0
20.0 Hp p 16.0O IIr 16.0 T
E E ~~~~~~~~~~~~~~~~~~12.0R 12.0 R
2 DE ":60 ~~~~~~~~~~E4.00
C 4.00 Lrz.91 SEE-1.6 CH Y-.4+1.0IX 12 0.0 2 0o.0.0 4.00 8.00 12.0 16.0 20,0 24.0
OMOW 20C (De)
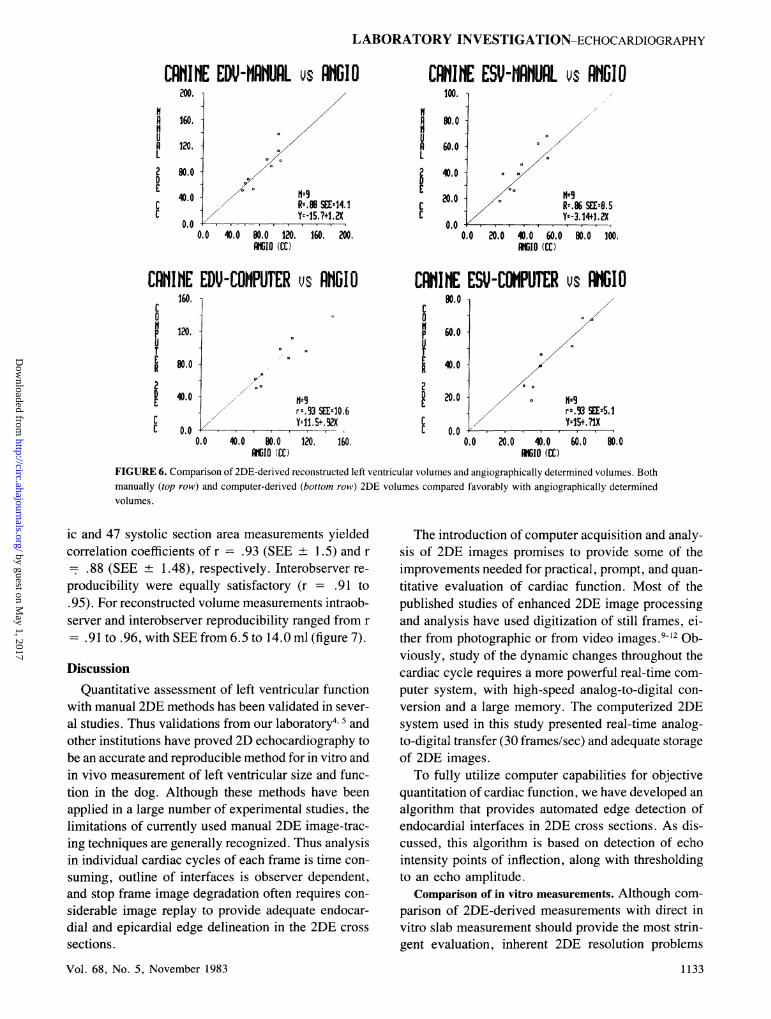
Further validation of manually derived volumeswith angiographically determined volumes showed acorrelation factor of r = .86 in end-systole (manual2DE, 38.3 + 12.4 ml; angiography, 41.8 ± 16.8 ml)(SEE ± 8.5 ml) and a factor of r = .88 in end-diastole(manual 2DE, 84.2 ± 21.5 ml; angiography, 85.3 ±29.3 ml) (SEE ± 14.1 ml) (figure 6). Comparison ofcomputerized 2DE (end-systolic volume, 45.6 ± 13.7ml; end-diastolic volume, 90.4 ± 29.1 ml) and angio-graphic left ventricular volumes demonstrated a corre-lation coefficient for end-systole of r = .93 (SEE +5.1 ml) and a coefficient for end-diastole of r = .93(SEE + 10.6 ml) (figure 6).
Reproducibility. Intraobserver reproducibility of com-puter-derived 2DE in vivo measurements of 48 diastol-
vs
FIGURE 5. Comparison of in vivo dog left ventricu-lar short-axis end-diastolic and end-systolic cross-sectional area measurements, derived manually andby computer edge detection.
rm.92 SE1 34Y -4t1.0,
CIRCULATION
ZWEHL et al.
0.0 4.0 8.0 12.0 16.0 20.00U 2DE (De)
1132
by guest on May 1, 2017
http://circ.ahajournals.org/D
ownloaded from
LABORATORY INVESTIGATION-ECHOCARDIOGRAPHY
CANINE EDUV-AHUAL vs AuGIO
uA
L2DECC
R=.8B S£EE14.1/ Y--15,7t1.2X
0.0 40.0 00.0 120. 160. 200.KID (CC)
CANINE ESU-NAHUAL vs RAGII100.
60.0
20.0
0.0
/ RR.8 SEE8.5Yc-3.14+1.2X
0.0 20.0 4.0 60.0 80.0 100.m1o (CC)
CAHINE EDU-COMPUTER vs AHGIDo .,
p 120. -U D
R 80.0 °
2
DE
CC
CAH1WE ESU-CDHPUTER vs AG0IOC
PU
ER
2D
c
40.0 - 1,I "II rr.93 SEE10.6
YzI.S+.92X00 .--
0.0 40.0 80.0 120. 160.KiD (CC)
60.0
0,
20.0 -0Orz.93 SEEz5.
/0 YY15+,71X
0.0 20.0 40.0 60.0 80.0KID (CC)
FIGURE 6. Comparison of 2DE-derived reconstructed left ventricular volumes and angiographically determined volumes. Both
manually (top row) and computer-derived (bottom row) 2DE volumes compared favorably with angiographically determinedvolumes.
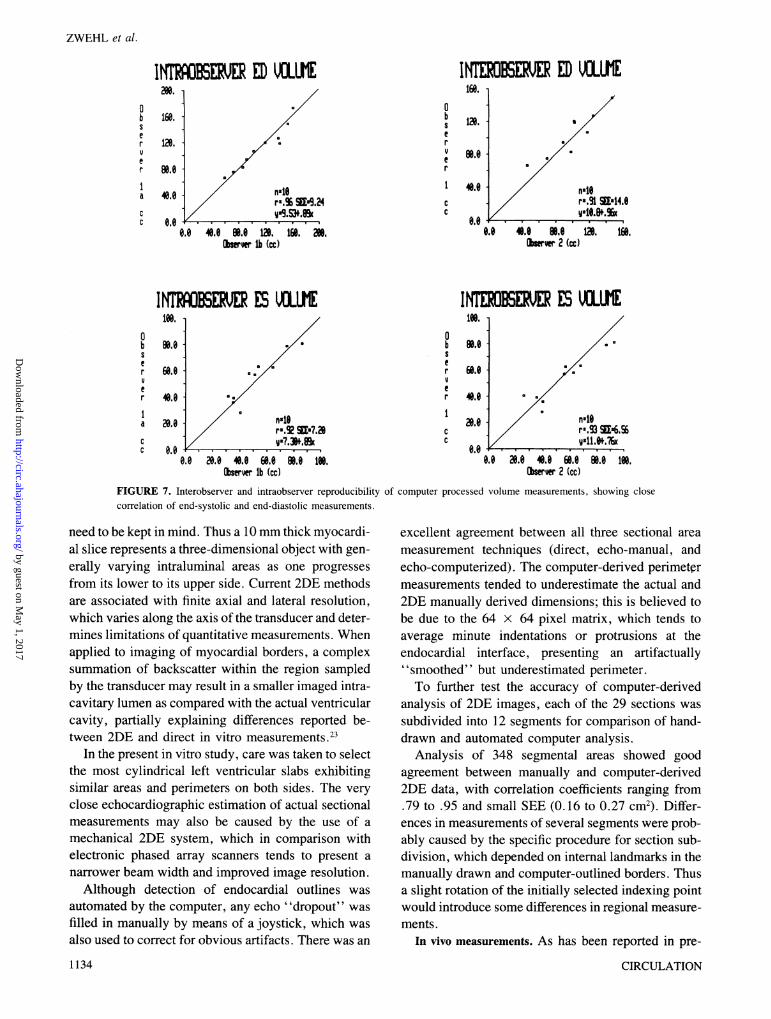
ic and 47 systolic section area measurements yieldedcorrelation coefficients of r = .93 (SEE 1.5) and r
.88 (SEE + 1.48), respectively. Interobserver re-
producibility were equally satisfactory (r = .91 to.95). For reconstructed volume measurements intraob-server and interobserver reproducibility ranged from r
= .91 to .96, with SEE from 6.5 to 14.0 ml (figure 7).
Discussion
Quantitative assessment of left ventricular functionwith manual 2DE methods has been validated in sever-
al studies. Thus validations from our laboratory4 5 andother institutions have proved 2D echocardiography tobe an accurate and reproducible method for in vitro andin vivo measurement of left ventricular size and func-tion in the dog. Although these methods have beenapplied in a large number of experimental studies, thelimitations of currently used manual 2DE image-trac-ing techniques are generally recognized. Thus analysisin individual cardiac cycles of each frame is time con-
suming, outline of interfaces is observer dependent,and stop frame image degradation often requires con-
siderable image replay to provide adequate endocar-dial and epicardial edge delineation in the 2DE cross
sections.
Vol. 68, No. 5, November 1983
The introduction of computer acquisition and analy-sis of 2DE images promises to provide some of theimprovements needed for practical, prompt, and quan-
titative evaluation of cardiac function. Most of thepublished studies of enhanced 2DE image processingand analysis have used digitization of still frames, ei-ther from photographic or from video images.9-12 Ob-viously, study of the dynamic changes throughout thecardiac cycle requires a more powerful real-time com-puter system, with high-speed analog-to-digital con-
version and a large memory. The computerized 2DEsystem used in this study presented real-time analog-to-digital transfer (30 frames/sec) and adequate storageof 2DE images.To fully utilize computer capabilities for objective
quantitation of cardiac function, we have developed an
algorithm that provides automated edge detection ofendocardial interfaces in 2DE cross sections. As dis-cussed, this algorithm is based on detection of echointensity points of inflection, along with thresholdingto an echo amplitude.
Comparison of in vitro measurements. Although com-
parison of 2DE-derived measurements with direct invitro slab measurement should provide the most strin-gent evaluation, inherent 2DE resolution problems
1133
200.
160.
120.
AuAL2DECC
0.0
by guest on May 1, 2017
http://circ.ahajournals.org/D
ownloaded from
INTBSE) ED VOLUMEM. /
160.
10.
0.0
I ED VOLUME160. 1
abserver
cc
0.0 4.0 W.0 12. 160. N0.Chier b (cc)
INERE ES VOLUME1t.' /
60.0
0.0
abser
Cer
cc
nzjor-.92 SE7.28
/ , , , ,7.36t,.,0.0 20.0 4.0 0.e W.0 1t.
bver lb (cc)
1N.
4.0
0.0w0.0 4.0 *.0 1a. 169.
burer 2 (cc)
IE ES VOLUEtoo.
80.0 /
40,0 a 4
20.0 note
0.0 20.0 4.0 60.0 W.0 1W.
(bseruer 2 (cc)
FIGURE 7. Interobserver and intraobserver reproducibility of computer processed volume measurements, showing closecorrelation of end-systolic and end-diastolic measurements.
need to be kept in mind. Thus a 10mm thick myocardi-al slice represents a three-dimensional object with gen-
erally varying intraluminal areas as one progresses
from its lower to its upper side. Current 2DE methodsare associated with finite axial and lateral resolution,which varies along the axis of the transducer and deter-mines limitations of quantitative measurements. Whenapplied to imaging of myocardial borders, a complexsummation of backscatter within the region sampledby the transducer may result in a smaller imaged intra-cavitary lumen as compared with the actual ventricularcavity, partially explaining differences reported be-tween 2DE and direct in vitro measurements.2
In the present in vitro study, care was taken to selectthe most cylindrical left ventricular slabs exhibitingsimilar areas and perimeters on both sides. The very
close echocardiographic estimation of actual sectionalmeasurements may also be caused by the use of a
mechanical 2DE system, which in comparison withelectronic phased array scanners tends to present a
narrower beam width and improved image resolution.Although detection of endocardial outlines was
automated by the computer, any echo "dropout" was
filled in manually by means of a joystick, which was
also used to correct for obvious artifacts. There was an
1134
excellent agreement between all three sectional area
measurement techniques (direct, echo-manual, andecho-computerized). The computer-derived perimetermeasurements tended to underestimate the actual and2DE manually derived dimensions; this is believed tobe due to the 64 x 64 pixel matrix, which tends toaverage minute indentations or protrusions at theendocardial interface, presenting an artifactually"smoothed" but underestimated perimeter.To further test the accuracy of computer-derived
analysis of 2DE images, each of the 29 sections was
subdivided into 12 segments for comparison of hand-drawn and automated computer analysis.
Analysis of 348 segmental areas showed goodagreement between manually and computer-derived2DE data, with correlation coefficients ranging from.79 to .95 and small SEE (0. 16 to 0.27 cm2). Differ-ences in measurements of several segments were prob-ably caused by the specific procedure for section sub-division, which depended on internal landmarks in themanually drawn and computer-outlined borders. Thusa slight rotation of the initially selected indexing pointwould introduce some differences in regional measure-ments.
In vivo measurements. As has been reported in pre-
CIRCULATION
ZWEHL et al.
abSer
er
a
cc
0b
e
r
a
C
by guest on May 1, 2017
http://circ.ahajournals.org/D
ownloaded from
LABORATORY INVESTIGATION-ECHOCARDIOGRAPHY
vious studies, there is good agreement between angio-graphically determined left ventricular volume mea-surements and 2DE measurements with appropriatereconstruction models.3'8 Dynamic computer acquisi-tion of complete cardiac cycles allowed selection of thesmallest and largest short-axis sections for subsequentquantitation. As in the in vitro study, there was excel-lent agreement between automatically derived end-dia-stolic and end-systolic sectional areas and manuallyderived 2DE data. Left ventricular volume reconstruc-tion with both manual and computerized 2DE methodscorrelated well with angiographically determined leftventricular volumes.
In both in vitro and in vivo validations in dogs, 2DEimages of excellent quality were selected to providethe signal-to-noise ratio required for adequate auto-mated computer analysis. Nevertheless, since thecomputer processing for automated edge detection en-tailed two observer-dependent steps, i.e., choosing a"threshold" level for the processed image and appro-priate "windowing" of values in the Laplacian image,an intraobserver and interobserver study was per-formed to determine the variability of the 2DE comput-er processing. Good agreement was found betweenmeasurements by two independent observers.
Implications. For application of this computerized2DE technique in the clinical setting in which 2DEimages are of inferior quality, the following aspectsneed to be considered: (1) general improvement of theactual 2DE imaging equipment and (2) computer en-hancement of 2DE images to overcome echo dropoutsand to improve the signal-to-noise ratio.
We express our appreciation to Mr. Myles Prevost for histechnical assistance with this study, Mrs. Jeanne Bloom for hereditorial assistance in the preparation of the manuscript, andMs. M. Bear and J. Prause for their statistical analysis.
References1. Parisi AF, Moynihan PF, Feldman CL: Quantitative detection of
regional left ventricular contraction abnormalities by two-dimen-sional echocardiography. II. Accuracy in coronary artery disease.Circulation 63: 761, 1981
2. Haendchen RV, Wyatt HL, Maurer G, Zwehl W, Bear M, Meer-baum S, Corday E: Quantitation of regional cardiac function bytwo-dimensional echocardiography. I. Patterns of contraction inthe normal ventricle. Circulation 67: 1234, 1983
3. Eaton LW, Maughan WL, Shoukas AA, Weiss JL: Accurate vol-ume determination in the isolated ejecting canine left ventricle bytwo-dimensional echocardiography. Circulation 60: 320, 1979
4. Wyatt HL, Heng MK, MeerbaumS, Gueret P, Hestenes JD, DulaE, Corday E: Cross-sectional echocardiography. II. Analysis of
mathematic models for quantifying volume of the formalin-fixedleft ventricle. Circulation 61: 1119, 1980
5. Gueret P, Meerbaum S, Wyatt HL, Uchiyama T, Lang TW, Cor-day E: Two-dimensional echocardiographic quantitation of leftventricular volumes and ejection fraction: importance of account-ing for dyssynergy in short-axis reconstruction models. Circulation62: 1308, 1980
6. Schiller NB, Acquatella H, Ports TA, Drew D, Goerke J, RingertzH, Silverman NH, Brundage B, Botvinick EH, Boswell R, CarlsonE, Parmley WW: Left ventricular volume from paired biplane two-dimensional echocardiography. Circulation 60: 547, 1979
7. Folland ED, Parisi AF, Moynihan PF, Jones RJ, Feldman CL,Tow DE: Assessment of left ventricular ejection fraction and vol-umes by real-time two-dimensional echocardiography: a compari-son of cineangiographic and radionuclide technique. Circulation60: 760, 1979
8. Helak J, Reichek N: Quantitation of human left ventricular massand volume by two-dimensional echocardiography: in vitro ana-tomic validation. Circulation 63: 1398, 1981
9. Price RR, Erickson JJ, Jones TB, Fleisher AF, Partain CL, JamesAE Jr: A digital signal and image processing system for ultrasonog-raphy. In Proceedings of the 25th Annual Meeting of the AIUM.American Institute of Ultrasound in Medicine, Oklahoma City,Sept. 1980, p 202
10. Skorton DJ, McNary CA, Child JS, Shah PM: Computerized im-age processing in cross-sectional echocardiography. Am J Cardiol45: 403, 1980
11. Matsumoto M, Matsuo H, Kitabatake A, Inove M, Hamanaka Y,Tamura S, Tanaka K, Hiroshi A: Three-dimensional echocardio-grams and two-dimensional echocardiographic images at desiredplanes by a computerized system. Ultrasound Med Biol 3: 163,1977
12. Garrison JB, Weiss JL, Maughan WL, Tuck OM, Guier WN,Fortuin NJ: Quantifying regional wall motion and thickening intwo-dimensional echocardiography with a computer-aided con-touring system. In Computers in cardiology. Long Beach, 1977,IEEE Computer Society, pp 25-35
13. Skolnick ML: A new approach to ultrasound image recording usinga video disc recorder. Radiology 133: 530, 1979
14. Melton HE, Collins SM, Skorton DJ: Automatic real-time endocar-dial edge detection during two-dimensional echocardiographic ex-amination. Circulation 66 (suppl II): 11-337, 1982
15. Geiser EA, Zhang LD, Buss DD, Franklin BD, Fu KJ, ConetttaDA, Conti CR: Automated border definition from 2D-echocardio-grams. Circulation 66 (suppl II): 11-337, 1982
16. Conetta DA, Geiser EA, Skorton DJ, Pandian N, Kerber RE:Accuracy and reliability of border identification techniques forquantitative 2D echo. Circulation 66 (suppl II): II-337, 1982
17. Skorton DJ, McNary CA, Child JS, Newton FC, Shah PM: Digitalimage processing of two-dimensional echocardiograms: identifica-tion of the endocardium. Am J Cardiol 48: 479, 1981
18. Garcia E, Gueret P, Bennett M, Corday E, Zwehl W, Meerbaum S,Corday S, Swan HJC, Berman D: Real time computerization oftwo-dimensional echocardiography. Am Heart J 101: 783, 1981
19. Rosenfeld A, Kak AC: Digital picture processing, ed 2. New York,1982, Academic Press, Inc., pp283-244, (vol 1), pp 89-91 (vol 2)
20. Hall EL: Computer image processing and recognition. New York,1979, Academic Press, Inc., pp 394-409
21. Bentivoglio LG, Griffith LD, Cuesta AJ, Geczy M: Radiographicevaluation of formulas for left ventricular volume using caninecasts. J Appl Physiol 33: 365, 1972
22. Kennedy JW, Trenholme SE, Kasser IS: Left ventricular volumeand mass from single-plane cineangiocardiogram: a comparison ofanteroposterior and right anterior oblique methods. Am Heart J 80:343, 1970
23. Helak JW, Plappert T, Muhammad A, Reichek N: Two-dimen-sional echocardiographic imaging of the left ventricle: comparisonof mechanical and phased array systems in vitro. Am J Cardiol 48:728, 1981
Vol. 68, No. 5, November 1983 1135
by guest on May 1, 2017
http://circ.ahajournals.org/D
ownloaded from
CordayW Zwehl, R Levy, E Garcia, R V Haendchen, W Childs, S R Corday, S Meerbaum and E
echocardiography.Validation of a computerized edge detection algorithm for quantitative two-dimensional
Print ISSN: 0009-7322. Online ISSN: 1524-4539 Copyright © 1983 American Heart Association, Inc. All rights reserved.
is published by the American Heart Association, 7272 Greenville Avenue, Dallas, TX 75231Circulation doi: 10.1161/01.CIR.68.5.1127
1983;68:1127-1135Circulation.
http://circ.ahajournals.org/content/68/5/1127the World Wide Web at:
The online version of this article, along with updated information and services, is located on
http://circ.ahajournals.org//subscriptions/
is online at: Circulation Information about subscribing to Subscriptions:
http://www.lww.com/reprints Information about reprints can be found online at: Reprints:
document. Permissions and Rights Question and Answer information about this process is available in the
located, click Request Permissions in the middle column of the Web page under Services. FurtherEditorial Office. Once the online version of the published article for which permission is being requested is
can be obtained via RightsLink, a service of the Copyright Clearance Center, not theCirculationpublished in Requests for permissions to reproduce figures, tables, or portions of articles originallyPermissions:
by guest on May 1, 2017
http://circ.ahajournals.org/D
ownloaded from