Embed Size (px)
Citation preview
Human Journals
Research Article
April 2016 Vol.:6, Issue:1
© All rights are reserved by Raghad Saad Hatam Bustan et al.
Validation and Determination of Caffeine Contents in Energy
Drinks Available on the Iraqi Market by Using High Performance
Liquid Chromatography (HPLC)
www.ijppr.humanjournals.com
Keywords: Caffeine, RP-HPLC, UV, RP-HPLC, LOD, LOQ
ABSTRACT
Caffeine was determined by Reversed phase High Performance
Liquid Chromatography (RP-HPLC). The main advantages of
this method are: simple, sensitive and rapid. The separation was
achieved by using HAISIL100A-C18 (150 mm x 4.6mm, 5µm
particle) analytical column at 25oC; the mobile phase water -
methanol (40:60 v/v); respectively; flow rate was applied for
1mL/min (in 2.50min) using UV detection at 273nm. The
retention time of Caffeine was found to be (1.999) min. The
validity of the proposed method was evaluated by determining
the value of linearity, accuracy, recovery, precision, LOD and
LOQ. It was found that the values of linearity and correlation
coefficient of the method was (1-200) µg/mL (r2 = 0.9999). The
percentage recovery for Caffeine was (98.091-100.500) %.
LOD and LOQ were found to be (0.579) μg/mL and (1.809)
μg/mL; respectively. The effect of pH, volume injection and
flow rate were also determined. The results of this study show
that the proposed method was successfully applied to estimate
the Caffeine in energy drinks. Conclusion: The developed
method is suitable for routine quality control analysis of
Caffeine in beverage and in combination of tablet formulation.
Raghad Saad Hatam Bustan
Department of Chemistry, Collage of Science, University
of Karbala, Iraq.
Submission: 2 April 2016
Accepted: 5 April 2016
Published: 25 April 2016
www.ijppr.humanjournals.com
Citation: Raghad Saad Hatam Bustan et al. Ijppr.Human, 2016; Vol. 6 (1): 181-194.
182
INTRODUCTION
Caffeine is a naturally occurring substance found in the leaves, seeds or fruits of over 63 plant
species worldwide. It is an alkaloid of methylxanthine family, Caffeine chemical formula is
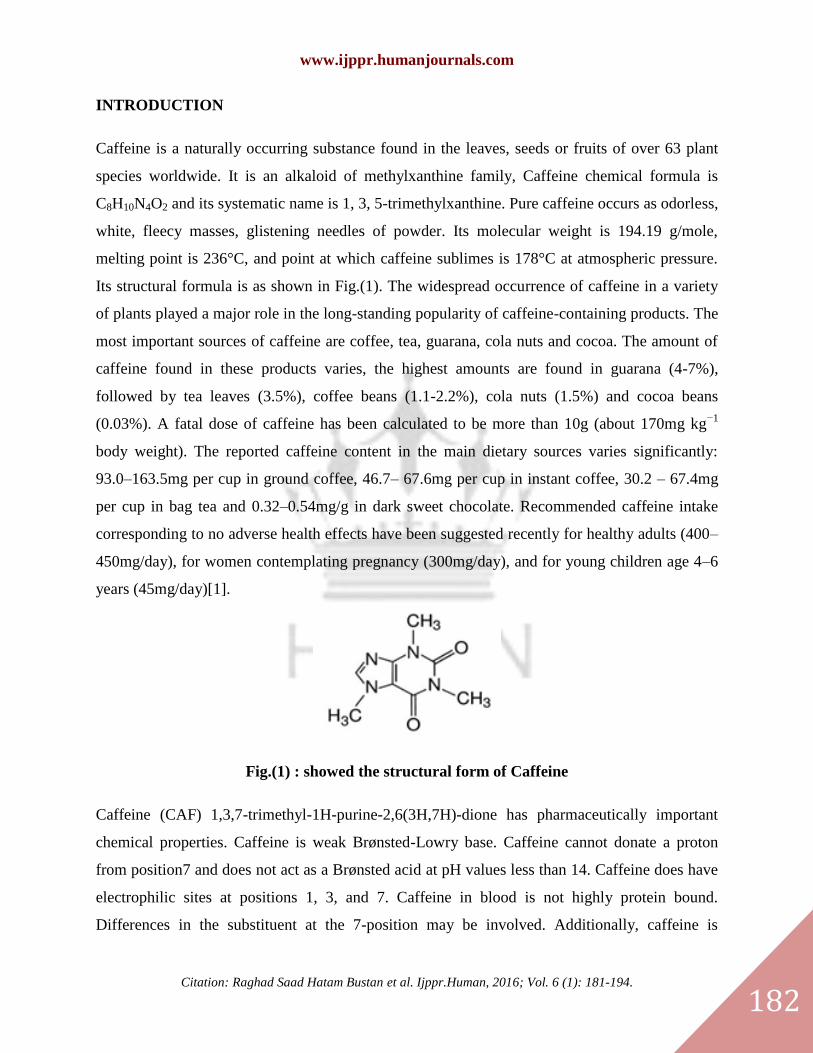
C8H10N4O2 and its systematic name is 1, 3, 5-trimethylxanthine. Pure caffeine occurs as odorless,
white, fleecy masses, glistening needles of powder. Its molecular weight is 194.19 g/mole,
melting point is 236°C, and point at which caffeine sublimes is 178°C at atmospheric pressure.
Its structural formula is as shown in Fig.(1). The widespread occurrence of caffeine in a variety
of plants played a major role in the long-standing popularity of caffeine-containing products. The
most important sources of caffeine are coffee, tea, guarana, cola nuts and cocoa. The amount of
caffeine found in these products varies, the highest amounts are found in guarana (4-7%),
followed by tea leaves (3.5%), coffee beans (1.1-2.2%), cola nuts (1.5%) and cocoa beans
(0.03%). A fatal dose of caffeine has been calculated to be more than 10g (about 170mg kg−1
body weight). The reported caffeine content in the main dietary sources varies significantly:
93.0–163.5mg per cup in ground coffee, 46.7– 67.6mg per cup in instant coffee, 30.2 – 67.4mg
per cup in bag tea and 0.32–0.54mg/g in dark sweet chocolate. Recommended caffeine intake
corresponding to no adverse health effects have been suggested recently for healthy adults (400–
450mg/day), for women contemplating pregnancy (300mg/day), and for young children age 4–6
years (45mg/day)[1].
Fig.(1) : showed the structural form of Caffeine
Caffeine (CAF) 1,3,7-trimethyl-1H-purine-2,6(3H,7H)-dione has pharmaceutically important
chemical properties. Caffeine is weak Brønsted-Lowry base. Caffeine cannot donate a proton
from position7 and does not act as a Brønsted acid at pH values less than 14. Caffeine does have
electrophilic sites at positions 1, 3, and 7. Caffeine in blood is not highly protein bound.
Differences in the substituent at the 7-position may be involved. Additionally, caffeine is
www.ijppr.humanjournals.com
Citation: Raghad Saad Hatam Bustan et al. Ijppr.Human, 2016; Vol. 6 (1): 181-194.
183
lipophilic and reputedly achieves higher brain concentrations[2]. Caffeine has been determined
using, LC-Spectrophotometric[3], Spectrophotometric method[4,5,6], and HPLC[7,8,9].
MATERIALS AND METHODS
Experimental part
Materials and Chemical
Pure sample of Caffeine was obtained from The State Company for Drugs Industry and Medical,
Iraq. All other chemical reagents were of analytical grade. Double beam UV-Visible –
Spectrophotometer -1800, Shimadzu, (Japan). Equipped with quartz cell (1cm), High-
Performance Liquid Chromatography (HPLC), UFLC -Shimadzu, CBM 20A, (Japan), Equipped
with HAISIL100A -C18 (150mm x 4.6mm, 5µm particle) analytical column, UV-Visible detector
and Column oven CTO-20A (4- 85)oC, Shimadzu (Japan), Digital Balance, Denver –TP-214,
(Germany), FT-IR, Bruker, TENSOR 27, (Germany), pH-meter, Hanna-pH211, (Romania) and
Ultrasonic cleaner, KQ200E, (Chain) were employed for the estimation.
Preparation of standard stock solution
Standard stock solutions of CAF were prepared by accurately weighing 0.01g from drug and
qualitatively transferred into a 100ml volumetric flask and complete the volume with mobile
phase. The mixture was sonicated for 15min. From the standard stock solutions, serial dilutions
in mobile phase were made to prepare standard curves.
Sample preparation
Different kinds of energy drinks were purchased from different Iraqi local supermarkets and 10
samples were analyzed using the indicated HPLC method. Once sample bottles were opened, the
drinks were degassed, homogenized and filtered. Then each sample was filtered through a
0.45μm syringe filter with a 5mL syringe. Filtered drink samples of 2 mL were 20 times diluted
in mobile phase.
www.ijppr.humanjournals.com
Citation: Raghad Saad Hatam Bustan et al. Ijppr.Human, 2016; Vol. 6 (1): 181-194.
184
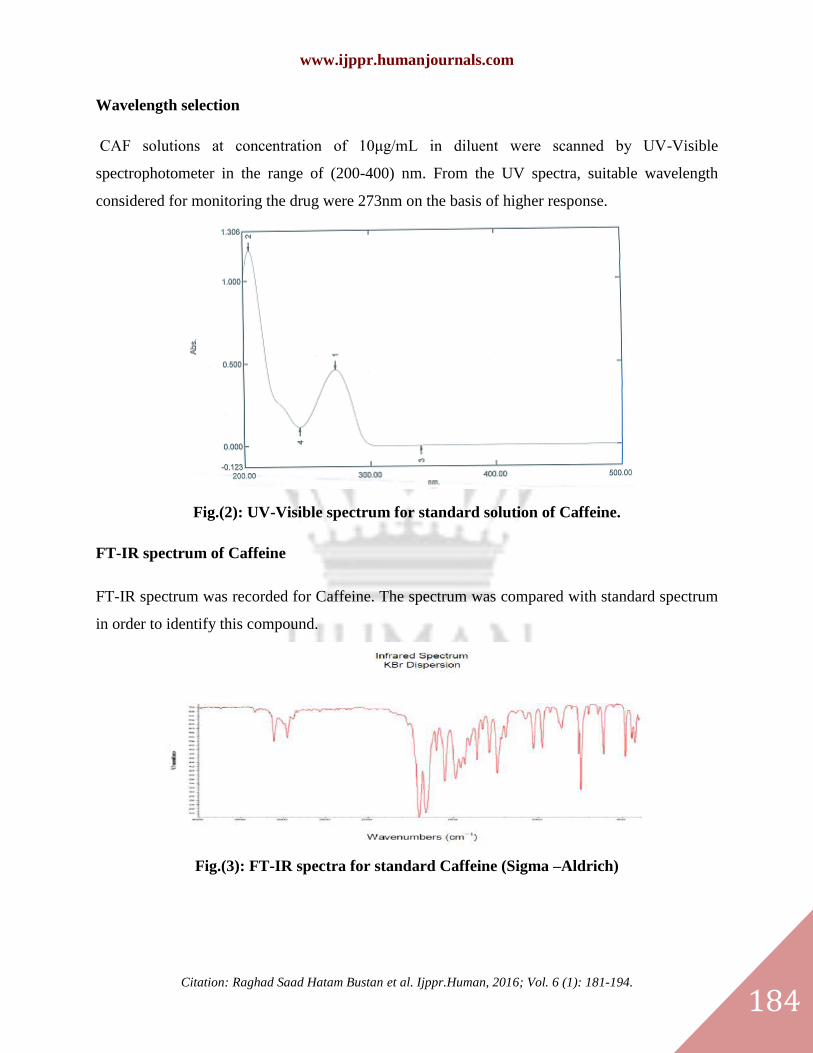
Wavelength selection
CAF solutions at concentration of 10μg/mL in diluent were scanned by UV-Visible
spectrophotometer in the range of (200-400) nm. From the UV spectra, suitable wavelength
considered for monitoring the drug were 273nm on the basis of higher response.
Fig.(2): UV-Visible spectrum for standard solution of Caffeine.
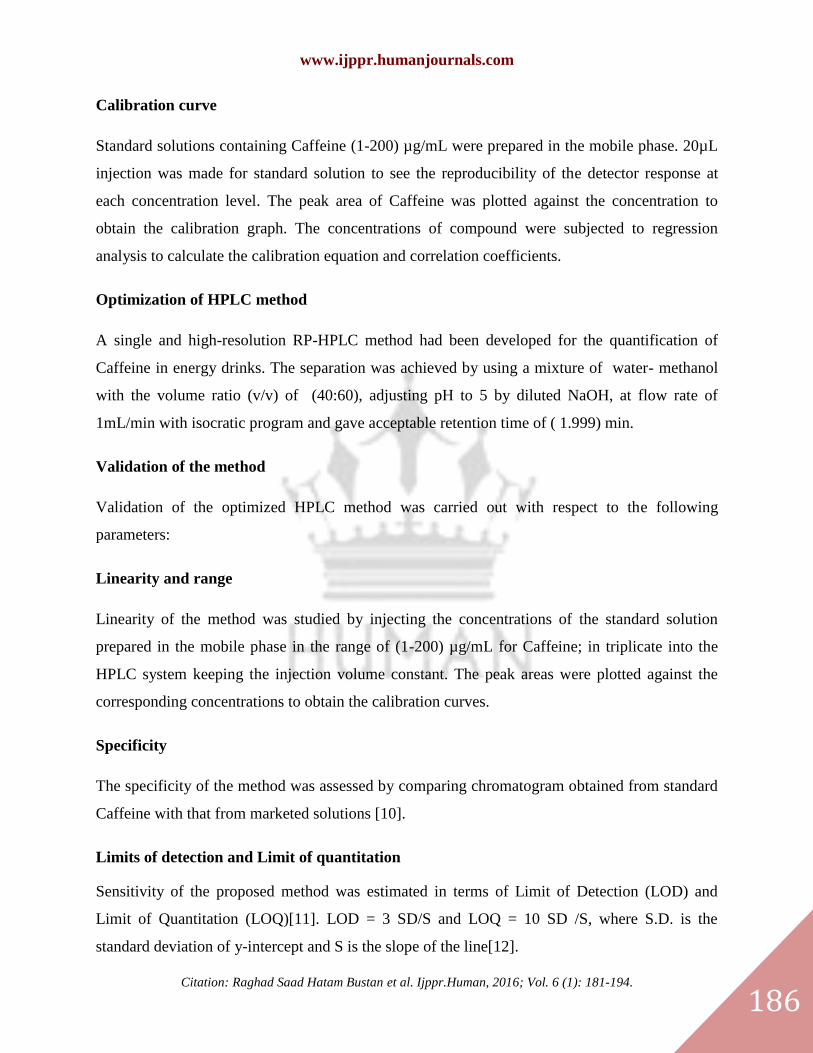
FT-IR spectrum of Caffeine
FT-IR spectrum was recorded for Caffeine. The spectrum was compared with standard spectrum
in order to identify this compound.
Fig.(3): FT-IR spectra for standard Caffeine (Sigma –Aldrich)

www.ijppr.humanjournals.com
Citation: Raghad Saad Hatam Bustan et al. Ijppr.Human, 2016; Vol. 6 (1): 181-194.
185
Fig.(4): FT-IR spectra for standard Caffeine (The State Company for Drugs Industry and
Medical, Iraq)
Chromatographic conditions of isocratic elution system
HPLC analysis was performed by isocratic elution. The flow rate was 1mL/min. The mobile
phase composition was water: methanol (40:60 v/v), adjusting pH to 5 by diluted (HCl / NaOH).
All solvents were filtered through a 0.45µm filter paper and degassed in an ultrasonic bath.
Volumes of 20µL of prepared solutions and samples were injected into the column.
Quantification was effected by measuring at 273nm. The chromatographic run time was less than
3min fig.(5).
Fig.(5): Chromatogram of standard solution of Caffeine.
www.ijppr.humanjournals.com
Citation: Raghad Saad Hatam Bustan et al. Ijppr.Human, 2016; Vol. 6 (1): 181-194.
186
Calibration curve
Standard solutions containing Caffeine (1-200) µg/mL were prepared in the mobile phase. 20µL
injection was made for standard solution to see the reproducibility of the detector response at
each concentration level. The peak area of Caffeine was plotted against the concentration to
obtain the calibration graph. The concentrations of compound were subjected to regression
analysis to calculate the calibration equation and correlation coefficients.
Optimization of HPLC method
A single and high-resolution RP-HPLC method had been developed for the quantification of
Caffeine in energy drinks. The separation was achieved by using a mixture of water- methanol
with the volume ratio (v/v) of (40:60), adjusting pH to 5 by diluted NaOH, at flow rate of
1mL/min with isocratic program and gave acceptable retention time of ( 1.999) min.
Validation of the method
Validation of the optimized HPLC method was carried out with respect to the following
parameters:
Linearity and range
Linearity of the method was studied by injecting the concentrations of the standard solution
prepared in the mobile phase in the range of (1-200) µg/mL for Caffeine; in triplicate into the
HPLC system keeping the injection volume constant. The peak areas were plotted against the
corresponding concentrations to obtain the calibration curves.
Specificity
The specificity of the method was assessed by comparing chromatogram obtained from standard
Caffeine with that from marketed solutions [10].
Limits of detection and Limit of quantitation
Sensitivity of the proposed method was estimated in terms of Limit of Detection (LOD) and
Limit of Quantitation (LOQ)[11]. LOD = 3 SD/S and LOQ = 10 SD /S, where S.D. is the
standard deviation of y-intercept and S is the slope of the line[12].
www.ijppr.humanjournals.com
Citation: Raghad Saad Hatam Bustan et al. Ijppr.Human, 2016; Vol. 6 (1): 181-194.
187
Effect of pH
The effect of changing pH of the mobile phase on the selectivity and retention times of the test
solutes was investigated using mobile phases of pH ranging from (3.00- 6.00) under optimum
condition.
Effect of variation of flow rate
A study was conducted to determine the effect of variation in flow rate under optimum condition.
Standard solution prepared as per the test method was injected into the HPLC system using flow
rates (0.5, 0.7, 1.0 and 1.3) mL/min.
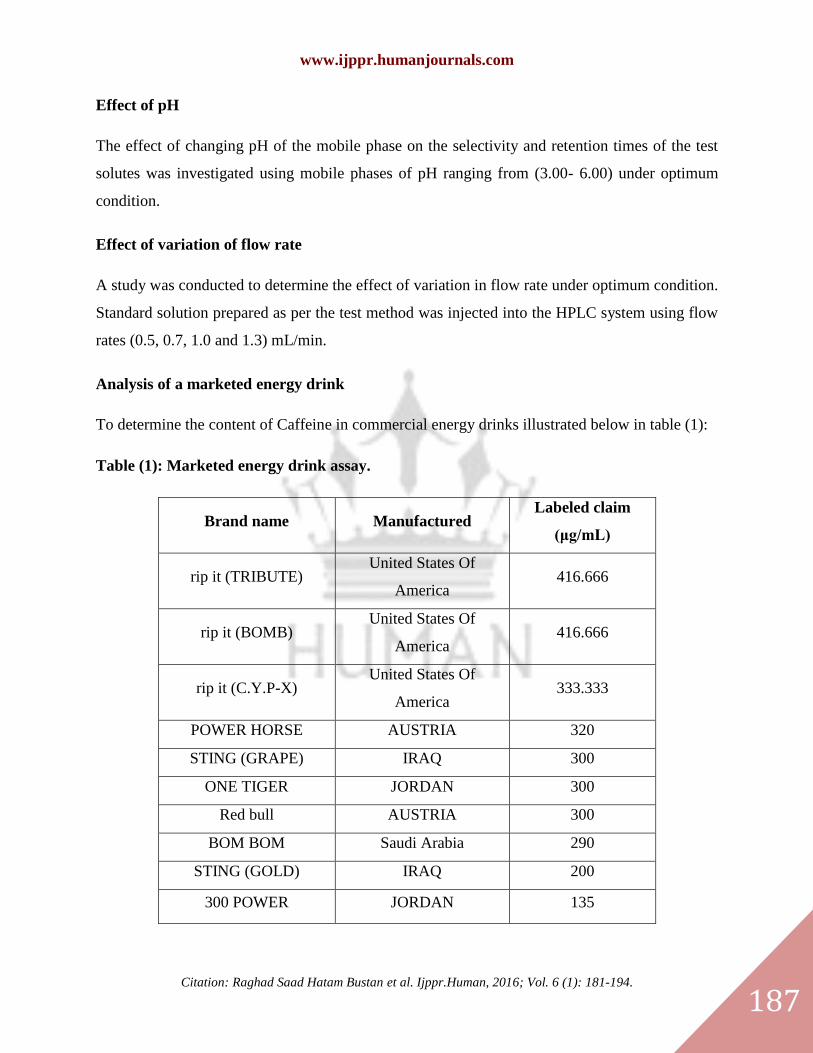
Analysis of a marketed energy drink
To determine the content of Caffeine in commercial energy drinks illustrated below in table (1):
Table (1): Marketed energy drink assay.
Brand name Manufactured Labeled claim
(μg/mL)
rip it (TRIBUTE) United States Of
America 416.666
rip it (BOMB) United States Of
America 416.666
rip it (C.Y.P-X) United States Of
America 333.333
POWER HORSE AUSTRIA 320
STING (GRAPE) IRAQ 300
ONE TIGER JORDAN 300
Red bull AUSTRIA 300
BOM BOM Saudi Arabia 290
STING (GOLD) IRAQ 200
300 POWER JORDAN 135

www.ijppr.humanjournals.com
Citation: Raghad Saad Hatam Bustan et al. Ijppr.Human, 2016; Vol. 6 (1): 181-194.
188
20μL volume of sample solution was injected into HPLC system under the conditions described
above. The peak areas were measured at 273nm and concentrations in the samples were
determined using multilevel calibration developed on the same HPLC system under the same
conditions using linear regression equation.
RESULTS AND DISCUSSION
Validation of the method
Validation of the optimized HPLC method was carried out with respect to the following
parameter:
Calibration curve and linearity study
Caffeine showed good correlation coefficient in concentration range of (1-200) μg/ml. The
detector response over wide range of concentrations of analyte were plotted to obtain the
calibration curve figure (6). The square of the correlation coefficient and equation for the curve
is shown in table (2).
Table (2): Linearity and regression characteristics of standard Caffeine.
Parameters Linearity range
µg/mL Regression equation
Correlation
coefficient (r2)
Linearity range
µg/mL 1-200 Y = 33191x + 98839 r
2 = 0.9999
(r2) value is greater than 0.9997. From this result, it is acceptable to use a single point calibration
in analysis of actual samples [13].

www.ijppr.humanjournals.com
Citation: Raghad Saad Hatam Bustan et al. Ijppr.Human, 2016; Vol. 6 (1): 181-194.
189
Fig.(6): Calibration curve of standard solution of Caffeine.
Precision
Precision was evaluated by carrying out three different sample preparations for Caffeine.
Percentage relative standard deviation (RSD %) was found to be less than 1, and E% less than 2
which proves that the developed method is precise and reproducible [14]. Results were shown in
table (3).
Table (3): Precision for standard Caffeine.
Accuracy
Accuracy of method was confirmed by studying recovery at three different concentrations for all
samples, by replicate analysis (n=3). Samples of known concentration (reference standard
solutions) were analyzed and the measured values, from the respective area counts, were
compared with the true values. The results obtained from the determination of accuracy,
expressed as percentage recovery, are summarized in table (4).
(µg/mL) R.S.D % E%
Caffeine
20.00 0.022 1.930
50.00 0.128 1.411
150.00 0.022 0.472
www.ijppr.humanjournals.com
Citation: Raghad Saad Hatam Bustan et al. Ijppr.Human, 2016; Vol. 6 (1): 181-194.
190
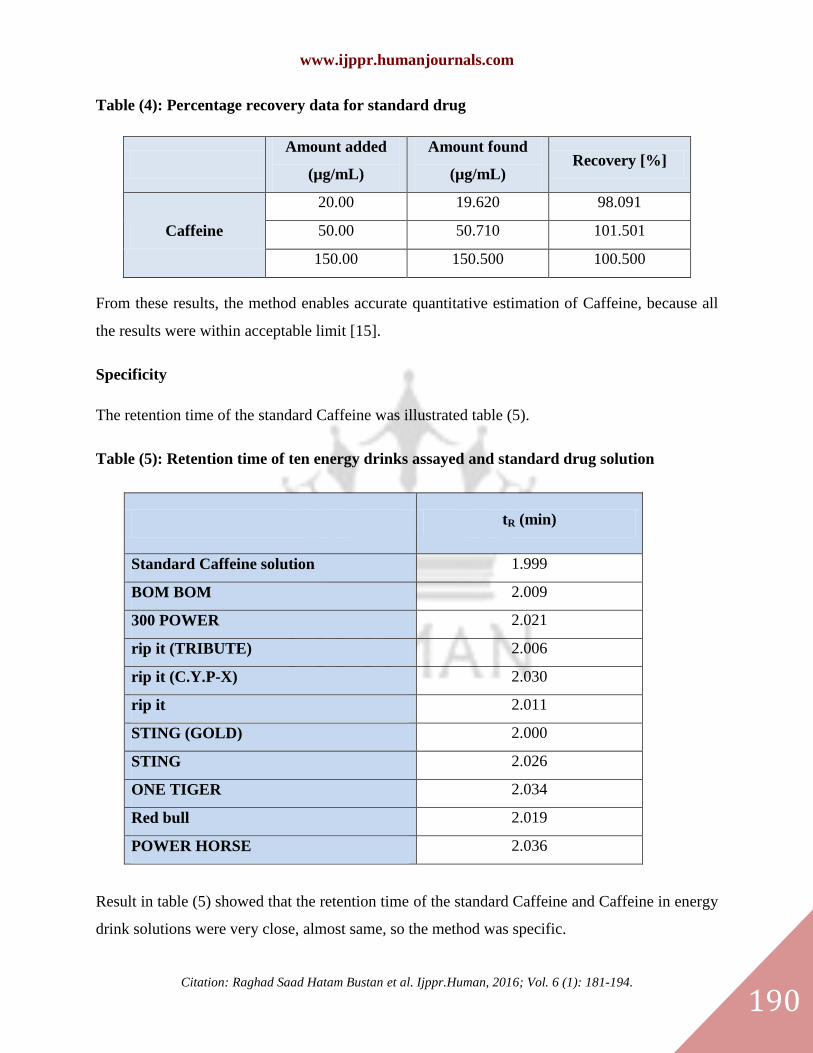
Table (4): Percentage recovery data for standard drug
Amount added
(µg/mL)
Amount found
(µg/mL) Recovery [%]
Caffeine
20.00 19.620 98.091
50.00 50.710 101.501
150.00 150.500 100.500
From these results, the method enables accurate quantitative estimation of Caffeine, because all
the results were within acceptable limit [15].
Specificity
The retention time of the standard Caffeine was illustrated table (5).
Table (5): Retention time of ten energy drinks assayed and standard drug solution
tR (min)
Standard Caffeine solution 1.999
BOM BOM 2.009
300 POWER 2.021
rip it (TRIBUTE) 2.006
rip it (C.Y.P-X) 2.030
rip it 2.011
STING (GOLD) 2.000
STING 2.026
ONE TIGER 2.034
Red bull 2.019
POWER HORSE 2.036
Result in table (5) showed that the retention time of the standard Caffeine and Caffeine in energy
drink solutions were very close, almost same, so the method was specific.

www.ijppr.humanjournals.com
Citation: Raghad Saad Hatam Bustan et al. Ijppr.Human, 2016; Vol. 6 (1): 181-194.
191
Limit of detection (LOD) and Limit of quantitation (LOQ)
The results of limit of detection and limit of quantification were illustrated in table (6). The
values indicate that the method is sensitive.
Table (6): Limit of detection and Limit of Quantification
Caffeine Regression equation Slope
LOD
μg/mL LOQ μg/mL
Y = 33191x + 98839 33191 0.597 1.809
Influence of factors
Effect of pH
The change of pH was tested by decreasing the buffer pH from (6) to strong acidic (3) which
lead to protonation of Caffeine. The high polarity of the resulted compound decreased its (tR) and
sensitivity to the UV detector [16]. Successfully applied a mobile phase with a pH 5.0
Adjustment was performed with the use of 0.1M NaOH. The result in table (7) showed that pH
had only a slight effect on retention time of Caffeine. Resolution was improved when the pH
decreased to 5; also the shape of Caffeine peak was improved in this pH.
Table (7): Effect of pH on separation of standard Caffeine.
pH Caffeine
Area Rt (min)
3.0 244050 1.862
3.5 147722 1.866
4.0 216489 1.976
4.5 84048 1.979
5.0 288587 1.997
5.5 208197 1.976
6.0 282848 1.853

www.ijppr.humanjournals.com
Citation: Raghad Saad Hatam Bustan et al. Ijppr.Human, 2016; Vol. 6 (1): 181-194.
192
Effect of Flow rate
For the present study, flow rate 1mL/min was selected on the basis of less retention time, good
peak shape, Acceptable back pressure, good resolution and better separation of the drug. The
results were presented in table (8).
Table (8): Effect of Flow rate on separation of Caffeine
Flow rate (mL/min) tR (min)
Caffeine
0.5 3.969
0.7 2.862
1.0 1.999
1.3 1.547
Assay of energy drink
The chromatographic method was applied to the determination of Caffeine in energy drink.
Analysis was carried out using optimized mobile phase and HPLC conditions. Results for
Caffeine comparable with its corresponding labeled amount and R.S.D % are shown in table (9).
Table (9): Percentage recovery data for marketed energy drinks.
Caffeine
Name of Energy drink Labeled amount
(µg/mL)
Amount found
(µg/mL)
rip it (TRIBUTE) 416.666 445.429
rip it (BOMB) 416.666 396.292
rip it (C.Y.P-X) 333.333 230.040
POWER HORSE 320.000 347.100
STING (GRAPE) 300.000 295.165
ONE TIGER 300.000 310.733
Red bull 300.000 290.523
BOM BOM 290.000 275.344
STING (GOLD) 200.000 190.776
300 POWER 135.000 130.234
www.ijppr.humanjournals.com
Citation: Raghad Saad Hatam Bustan et al. Ijppr.Human, 2016; Vol. 6 (1): 181-194.
193
Results in table (9) showed that the estimation of energy drink was accurate within the
acceptable level.
CONCLUSION
A reversed-phase HPLC method was developed and validated with UV detection for the
determination of Caffeine and proved to be more convenient and effective for the quality control
of Caffeine in energy drinks. The method gave good resolution for Caffeine with a short analysis
time below 2.5 minutes. The method was found to be simple, economical and useful in good low
detection limit and quantitation limit. Rapidity and capability of quantifying low concentration of
Caffeine, made them useful for variety of analyses, including pure drug analysis and assay of
formulations analysis. The proposed methods did not utilize any extraction step for recovering
the Caffeine from the formulation excipients matrices and their by decreased the degree of error,
time for estimation of Caffeine and the overall cost of the analysis. The solvent system used were
simple mobile phase with isocratic elution and low buffer concentration compared to the
reported method. The method is suitable for the determination of Caffeine in energy drink
without interference from commonly used excipients, and could be used in a quality control
laboratory for routine sample analysis.
REFERENCES
1. Violeta N., Mira E." Original Reaserch Paper Chromatographic Determination of Caffine Contents in soft and
and Energy Drinks Available on The Romanian Market",1University of Craiova, 2010,P.(351-353).
2. John M. Beale, John H. Block ,Wilson and Gisvold’s textbook of organic medicinal and pharmaceutical
chemistry,12th
ed., Lippincott Williams and Wilkins, a Wolters Kluwer business,china,2011.
3. Erdal Dinç , Filiz Yurtsever and Feyyaz Onur, Simultaneous determination of active ingredients in binary
mixtures containing Caffeine using liquid Chromatographic and Spectrophotometric methods, Turkish J. Pharm.
Sci.,2005;1(2):115-138.
4. Ayman M. Mohsen, Hayam M. Lotfy, Amr M. Badawey, Hesham Salem and Sonia Z. Elkhateeb, application of
three novel Spectrophotometric methods manipulating ratio spectra for resolving a pharmaceutical mixture of
Chlorpheniramine hydrochloride and caffeine, IJPPS,2013; Vol-5:478- 487.
5. Kuldeep Delvadiya, Ritu Kimbahune, Prachi Kabra, Sunil K. and Pratik Patel, Spectrophotometric
Simultaneous analysis of Paracetamol, Propyphenazone and Caffeine in tablet dosage forms, IJPPS,2011;Vol-3:
170-174.
6. Sonali S. Bharate and Sandip B. Bharate, Spectrophotometric and Chromatographic determination of
Acetylsalicylic acid and Caffeine in pure and in tablet dosage form, Journal of Advanced Scientific Research, 2012;
3(1):73-81.
7. Sharma S., Sharma M. C., Sharma R., Sharma A. D., High Performance Liquid Chromatographic Assay method
for the determination of Paracetamol and Caffeine in Tablet Formulation-in vitro dissolution studies, Journal of
Pharmacy Research,2011;4(5):1559-1561 .
www.ijppr.humanjournals.com
Citation: Raghad Saad Hatam Bustan et al. Ijppr.Human, 2016; Vol. 6 (1): 181-194.
194
8. Boyka G. T., Bistra D. K., Dimitar R. R., Lily P. P. and Ivanka P. P., HPLC Assay and Stability Studies of
Tablets containing Paracetamol and Caffeine, Int. J. Pharm. Sci. Rev. Res.,2013;18(1):138-142.
9. Milkica C. Branka I., Sote V., Vesna K. and Zorica V., Statistical Optimization of Reverse Phase High
Performance Liquid Chromatography for the Analysis of Caffeine Paracetamol and its Degradation Product p-
aminophenol , Acta Chim. Slov., 2008; 55:665–670.
10. Violeta N., Mira E." Original Reaserch Paper Chromatographic Determination of Caffine Contents in soft and
and Energy Drinks Available on The Romanian Market",1University of Craiova, 2010, P.(351-353).
11. Mei M., Mawahib E., Mohammed I.Badawi A. Abdalla A. ,"Determination of Caffeine in Some Sudanese
Beverages by High Performance Liquid Chromatography", University of hartoum, 2012, P.(336-337 ).
12. Uttam D. P., Abhijit V. N., Aruna V. S.,Tirumal A. D. and Kiran V. M., Simultaneous Determination of
Aceclofenac, Paracetamol and Chlorzoxazone by HPLC in Tablet Dose Form, E-Journal of Chemistry, 2009 ,6(1),
P.289-294.
13. Redasani V. K., Gorle A. P., Badhan R. A., Jain P. S. and Surana S. J., simultaneous determination of
Chlorpheniramine Maleate, Phenylephrine hydrochloride, Paracetamol and Caffeine in pharmaceutical preparation
by Rp-HPLC, R. C. Patel Institute of Pharmaceutical Education and Research, 2012 ,P.1-22.
14. Hornedonunez A., Getek T. A., Korfmacher W. A. and Simenthal F., High-performance liquid-chromatography
of clindamycin and clindamycin phosphate with electrochemical detection, Journal of Chromatography,1990, 503,P.
217-225.
15. Lioyd R. S., Joseph J. K. and John W. D., Introduction to modern liquid chromatography, Third Edition , A John
Wiley & Sons, Inc.,2010 .
16. Asensi D. R., Quesada S. MP., Valverde M. E., De Ramon G. E., Gomez M. J. and Munoz C. I., Comparison of
high-resolution liquid chromatography versus microparticle enzyme immunoassay for the measurement of sirolimus
levels in renal transplantation, Farm Hosp, 2006, 30(3), P.142-8.
17. Braithwaith A. and Smith F. J., Chromatographic method, 5th
edition,Kluwer academic publisher, UK, 1999.