Embed Size (px)
Citation preview
DETERMINATION AND VALIDATION OF THE “WHAT’S MY SCHOOL
MINDSET?” INSTRUMENT FACTOR STRUCTURE
by
Janet Lee Hanson
A dissertation submitted in partial fulfillment of the requirements for the degree
of
Doctor of Education
in
Education Leadership
MONTANA STATE UNIVERSITY Bozeman, Montana
June 2015
©COPYRIGHT
by
Janet Lee Hanson
2015
All Rights Reserved
ii
DEDICATION
I dedicate this paper to my mother, children, Aaron, Chip, and Maryrose, and to
the loving memory of my father. The support of my family and the constant steadfastness of their belief in the possible provided an assurance that I could persist to completion of my dissertation program. The result is a product that I hope will be a worthwhile accomplishment and a reward for both my efforts and their love. I also dedicate this work to Leslie, Grace, and Faith, who provided a home away from home, friendship, and support during my time in Bozeman at Montana State University. The time we spent outside on horseback, in the beautiful Montana countryside, and sharing movie time together provided many hours of peaceful diversion and renewal that contributed immeasurably to my ability to complete this project.

iii
ACKNOWLEDGEMENTS
I write in acknowledgment of my professors, Dr. William Ruff, Dr. Art Bangert,
Dr. David Henderson, and Dr. Godfrey Saunders. The wisdom, abilities, and support
they provided during the process of my transformation to develop a researcher’s mindset
was invaluable. This research study explored the concept of growth mindset, a belief that
one can grow one’s abilities and learn through effort. I hope this dissertation
demonstrates that belief to be true. With all due respect and appreciation for the quality
of the education and support I received during my time at Montana State University,
Bozeman, I submit this paper for review.

iv
TABLE OF CONTENTS
1. INTRODUCTION ...........................................................................................................1
Problem Statement ...........................................................................................................6 Purpose Statement ............................................................................................................7 Research Question ...........................................................................................................8 Significance of the Study .................................................................................................8 Overview of Methods ......................................................................................................9 Limitations .....................................................................................................................10 Delimitations ..................................................................................................................13 Definition of Terms........................................................................................................14 Summary ........................................................................................................................17 2. REVIEW OF RELEVANT LITERATURE ..................................................................19
Background of Mindset Theory ....................................................................................19
Historical Foundations ...........................................................................................19 Cognitive Social Theory and Agency ....................................................................21 Three Types of Agency ..............................................................................22
Influence of Social Systems .......................................................................22 Criticisms of Cognitive Social Theory ......................................................23
Alternative Theories...................................................................................24 Organizational Learning ................................................................................................25
The Organization as an Entity ...............................................................................26 Synthesis of Theory and Practice ..........................................................................28 Framework of Organizational Learning ................................................................29 Systems Thinking ..................................................................................................29
The Five Disciplines ..................................................................................30 Open Systems Model .................................................................................31
Enabling School Structures ........................................................................33 Collective Efficacy .....................................................................................33 Work Locus of Control ..............................................................................34
Individual Mindset .........................................................................................................37 Connection to Cognitive Social Theory .................................................................37
Seminal Studies ..........................................................................................39 Criticisms of the Mindset Theory ..............................................................40
Alternative Theories ...................................................................................41 Academic Mindset .........................................................................................................41 Group Mindset ...............................................................................................................42 Mindset Concepts Compared ........................................................................................44 Influence of Mindset on Organizations .........................................................................45
v
TABLE OF CONTENTS - CONTINUED
Connections of Mindset and Organizational Learning ..........................................49 Connections of Mindset and School Climate .........................................................53 Effects of Mindset on School Transition Success..................................................54
Measurement of School Mindset ...................................................................................56 Rationale for School Mindset Scale ......................................................................57 Conceptual Framework for the What’s My School Mindset? Scale .....................59 Instrument Development .......................................................................................60
Individual Mindset Scale ...........................................................................61 Academic Mindset Scale ............................................................................61 Group Mindset Scale ..................................................................................61 Summary ....................................................................................................62
Conclusion .....................................................................................................................63
3. METHODS ....................................................................................................................66
Research Problem ..........................................................................................................66 Purpose of the Study ......................................................................................................67 Research Question .........................................................................................................67 Research Design.............................................................................................................68 Participants and Sample .................................................................................................68 Data Collection Instruments ..........................................................................................71 Procedures and Data Collection .....................................................................................72 Data Analyses ................................................................................................................73 Evaluating Assumptions ........................................................................................74 Representativeness .................................................................................................74
Exploratory Factor Analysis ..................................................................................75 Confirmatory Factor Analysis................................................................................76
Summary .......................................................................................................................77
4. RESULTS ......................................................................................................................79
Answering the Research Question and Testing the Null Hypothesis ............................79 Data Analysis .................................................................................................................80 Evaluating Assumptions ........................................................................................81
Sample Size ............................................................................................................84 Criteria for Conducting the Exploratory Analysis .................................................84
Criteria for Selecting the Number of Factors .........................................................85 Test of Data Multicollinearity ................................................................................86 Goodness of Fit .....................................................................................................87 Factor Rotation Method ........................................................................................87
vi
TABLE OF CONTENTS - CONTINUED Exploratory Factor Analysis ..................................................................................88 Interpretation of the EFA .......................................................................................89
Factor 1 ......................................................................................................89 Factor 2 ......................................................................................................90 Factor 3 ......................................................................................................90 Factor 4 ......................................................................................................91
Confirmatory Factor Analysis ................................................................................93 Steps in the Analyses .................................................................................97
Validity Evidence ...................................................................................................98 Convergent Validity .................................................................................100 Discriminant Validity...............................................................................100 Discriminant Validity between Factors ...................................................102
Answering the Research Question ......................................................................103 Testing the Null Hypothesis ........................................................................................103
Summary ......................................................................................................................103 5. DISCUSSION ..............................................................................................................105
Introduction ..................................................................................................................105 Growth Mindset ...................................................................................................106 Four-Factor Model from EFA and CFA ......................................................................107
Factor 1 ................................................................................................................110 Factor 2 ................................................................................................................110 Factor 3 ................................................................................................................112 Factor 4 ................................................................................................................116 Discriminant Validity...........................................................................................119
Summary .............................................................................................................121 Implications..................................................................................................................121 Recommendations for Further Research ......................................................................124 Conclusions and Recommendations ............................................................................126 REFERENCES CITED ....................................................................................................129 APPENDICES .................................................................................................................148
APPENDIX A: Subject Consent Form ................................................................149 APPENDIX B: Individual Mindset Scale ............................................................151 APPENDIX C: Online Individual Mindset Scale ................................................154 APPENDIX D: PERTS Academic Mindset Scale ...............................................156 APPENDIX E: What’s My School Mindset? Scale ............................................158

vii
LIST OF TABLES
Table Page
1. Levels of learning in a learning organization and their factors. ...............................................................................................................32
2. Table of percent of public schools by size categories and number of faculty responses proposed by category ..........................................70
3. Table of percent of public schools by size categories and number of faculty responses collected by category ..........................................82
4. Participants by education level. .........................................................................82 5. Participants by gender. .......................................................................................82 6. Participants by years at current school. ..............................................................83 7. Number of participants by school level. ............................................................83 8. Participants by total years’ experience teaching at all
schools.... ...........................................................................................................83 9. Individual item factor loadings, significance, percentage
of variance, and eigenvalues for items on the WMSM scale continued ..................................................................................................94
10. ANOVA results and Pearson Correlations between school
building levels.. .............................................................................................101 11. Components correlation matrix for WMSM scale. ........................................102 12. Comparison and contrasting items of 4-factor structure
with Mindset Works, Inc. five key features of a growth school mindset.. .............................................................................................108

viii
LIST OF FIGURES
Figure Page
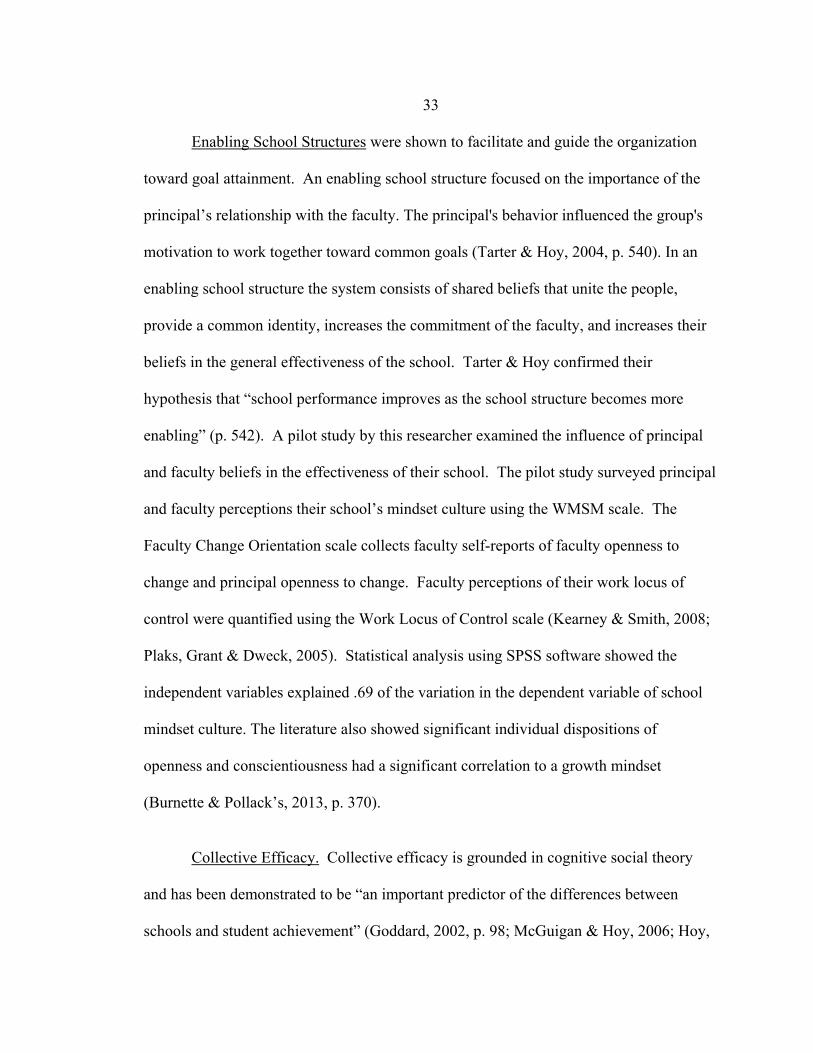
1. A simplified model of collective faculty efficacy ..............................................35
2. Comparable and contrasting concepts with mindset constructs ...........................................................................................................58
3. Proposed factor model from EFA for CFA statistical
analyses. ............................................................................................................96
4. Theoretical factor structure model and results of CFA using Lisrel 8.72 . ..............................................................................................99 5. WMSM means plot at school level (one-tailed test). .......................................101
ix
ABSTRACT
This study used exploratory and confirmatory factor analyses to explore the factor structure of the What’s My School Mindset? (WMSM) scale (Mindset Works, 2008-2012c). Blackwell (2012) asserted that the concept of a growth school mindset culture was operationalized in the WMSM scale using five key features. However, the reliability and validity of this instrument had not been fully explored (S. Rodriguez, personal communication, March 31, 2015). This was the first empirical study that attempted to validate the underlying constructs the WMSM scale is purported to assess by Mindset Works, Inc (Blackwell, 2015). No research was found that had explored the factor structure of the WMSM scale. Without empirical research supporting the factor structure of this instrument its use in interpreting the measurement of school culture may be confounded (Hopko, 2003; Netemeyer, Bearden & Sharma, 2003). Results of the Exploratory Factor Analysis revealed a four-factor structure. In addition, a Confirmatory Factor Analysis (CFA) was conducted to further verify the fit of the four-factor model. The four-factor model produced a root mean square error approximation (RMSEA) of .063. The 90% confidence interval (.049 - .076) surrounding the RMSEA result indicates that the proposed four-factor model identified by the EFA was a “fair” fit to the estimated population model (Browne & Cudek, 1993; MacCallum, Browne & Sugawara, 1996). The accuracy of this fit to the population model was strengthened by a CFI of .96 and a NNFI of .95 (Kim, 2005). The results of this study added to the body of mindset research and are useful for school leaders and researchers who seek to use the WMSM scale to measure growth mindset within a school’s culture (e.g. Hoy, Tarter & Kottkamp, 1991; Kearney, 2007; Murphy & Dweck, 2010; Farrington, Roderick, Allensworth, Nagaoka, Seneca-Keyes, Johnson & Beechum, 2012; Delaney, Dweck, Murphy, Chatman & Kray, 2015; Walton, 2014).

1
CHAPTER ONE
INTRODUCTION A Psalm of Life
Not enjoyment, and not sorrow, Is our destined end or way;
But to act, that each to-morrow Find us farther than to-day.
(Henry Wadsworth Longfellow, 1839, p. 5)
Longfellow poetically sought to inspire his readers to believe that they could
make progress toward their goals through their actions. Dweck (2008) described a
similar concept of the belief in personal growth in her book, Mindset: The New
Psychology of Success. The concept of mindset contributes to the field of educational
leadership by conceptualizing a paradigm premised on an empirically based description
of belief systems that may impact the success of each of our 50 million students, enrolled
in over 98,300 public schools across the United States. However, government
organizations, educational leaders, and researchers continue to debate what variables
constitute reliable and accurate evidence of school and student growth (Tarter & Hoy,
2004; Yeager & Dweck, 2012; Farrington et al., 2012; Briceno, 2013; Department of
Education, 2014; Adams, 2014; Shannon & Bylsma, 2004 & 2007).
In a review of the literature on mindset and organizational learning, many articles
can be found reporting the importance of providing equitable resources to ensure all
students receive a quality education. These resources usually refer to such items as better
facilities and improved school budgets. For example, Gamoran (2001) wrote,

2
“Policymakers increasingly recognize that unequal school financing across school
districts is unfair, and some are taking steps to reduce these inequalities” (para 12).
Gjaja, Puckett & Ryder (2014) wrote of the importance of equity in education funding
and the “proposed redistribution of local property taxes to help…school districts,” (p. 1).
However, fewer studies report the importance of providing equity in psychosocial factors
that have been shown to "have a striking impact on students' achievement" (Dweck 2010,
p. 26). Increasingly researchers have explored the importance of student growth mindsets
on grades and academic behaviors leading to improved achievement on test scores
(Blackwell, Trzesniewski & Dweck, 2007). A growth school mindset culture is defined
as one with a “common vision, sharing knowledge, support, and resources” (Blackwell,
2012, para. 4). Psychosocial factors influence student learning and play a key role in
schools where educational leaders work to create learning environments that prepare
students for college and career readiness in the increasingly complex 21st Century
(Farrington et al., 2012). A faculty’s beliefs in their school’s ability to help all students
learn and grow were shown to develop improved learning behaviors in the students they
served. For example, mindset beliefs were shown to have large influences on the levels
of persistence and choices of strategies teachers and students used to reach their learning
goals (Dweck, 2008, Briceno, 2013). As Blackwell (2012) explained, schools that
develop a growth mindset also develop students who "show greater motivation in school,
[have] better grades, and higher test scores" (para. 5), and “narrow[ed] the gender gap in
mathematics" and "the racial achievement gap" (para.8-9).
3
Bandura’s (1977, 1986 & 2001) cognitive social theory laid the foundation for the
psychosocial mindset theories developed by Dweck (1986). Cognitive social theory
emphasized the importance of human agency and the reciprocal influences of the
environment and social interactions on human learning. Bandura’s theory has become
one of the most influential on research and educational practices in schools to this day
(Martin, 1979; Haggbloom, 2002). In 1977, Bandura wrote Social Learning Theory, in
which he also explained the influence of self-efficacy on learning. By 2008, Bandura and
his colleagues, including Dweck, began to focus research on the self-efficacy of students
in schools. Additional areas of research included the interaction of individual beliefs,
behaviors, the social environment, and the behaviors of others (Spector, 1988; Bandura,
2001; Eccles & Wigfield, 2002; Tarter & Hoy, 2004; Dweck, 2012; Farrington et al.,
2012).
Dweck’s (1986) foundational research with mindset was mostly quasi-
experimental and experimental studies using small sample sizes (Farrington et al., 2012).
She began by exploring the relationships between an individual's mindset and goal
setting. Additional studies framed the construct of mindset within cognitive social
theory, attributional theory, self-efficacy, expectancy theory, and locus of control theory
(Rotter, 1954; Bandura, 1977, 1986, 2001; Weiner, 1986; Dweck & Leggett, 1988; Esses,
Haddock & Zanna, 1993; Taylor & Gollwitzer, 1995). Dweck (1986, 2006, 2010 &
2012) wrote that the social context strongly influenced individual beliefs: mindsets were
found to be malleable, subject to contextual influences, and respond to interventions.
Thus, Dweck expanded her research to explore the group construct of mindset. She
4
worked with a team of researchers to quantify and operationalize a growth school
mindset construct (Blackwell, Trzesniewski & Dweck, 2011). Blackwell, Trzesniewski
& Dweck co-founded Mindset Works, Inc. to develop and distribute interventions that
"enable a world in which people seek and are fulfilled by ongoing learning and growth"
(Mindset Works, 2008-2012a, para. 1). The current cross-disciplinary research in the area
of mindset includes the domains of education, psychology, sociology, organization,
business management, and marketing. Dweck is currently researching organizational
mindsets in schools and in Fortune 1000 companies (Dweck, Chiu, & Hong, 1995;
Nisbett & Miyamoto, 2005; Thomas, 2005; Ruedy & Schweitzer, 2011; Spencer-Rogers,
Williams & Peng, 2012; Blackwell, 2012; Farrington et al., 2012; Adams, 2014; Harvard
Business Review Staff, 2014; Walton, 2014; Delaney et al., 2015).
A review of the literature on organizational learning models revealed variables
similar to those described by Blackwell (2012) in the mindset literature. The five key
features of a growth school mindset were similar to the variables used in Tarter & Hoy's
(2004) Open Systems learning organization model that explained improved school
outcomes. The construct of growth school mindset seems also to be imbued by Senge's
(1990 & 2000) systems thinking model. For example, the influences on organizational
learning include the administrator's behavior, the feedback loop, and collective goal
setting. In sum, a review of the literature revealed school mindset culture compared with
cognitive social theory, learning organization theory, and themes found in the literature
on improving schools (Murphy & Dweck, 2010; Shannon & Bylsma, 2004 & 2007;
Farrington et al., 2012; Delaney et al., 2015).
5
School leaders and stakeholders are increasingly interested in the influence of
psychosocial factors, such as mindset, on school cultures. Therefore, researchers seek to
answer whether these factors are malleable to influence by school administrators for
improving organizational outcomes. Increasingly educational research is seeking to
develop measurement tools for these psychosocial factors (Netemeyer et al., 2003;
Guskey, 2007). The research on mindset theory shows potential to influence improved
student outcomes in schools. Researchers are developing growth markers for meeting
accountability requirements using psychosocial factors of individual and school learning
(Dweck, 2010; Farrington et al., 2012; Adams, 2014). In 2013, the Federal government
awarded an unprecedented waiver from the strictly cognitive-based accountability testing
required under the No Child Left Behind Act of 2001 to 10 California school districts.
Researchers collaborate with school districts to explore the potential for using
psychosocial markers, such as school mindset, to indicate school improvement and
student growth (Adams, 2014).
Therefore, the purpose of this research study was to explore the factor structure of
the WMSM scale purported to operationalize the five key features of a school mindset
culture. The results of this study were used to contribute to the literature, develop
conclusions, describe implications for the use of WMSM scale, and to recommend
potential areas for future studies. Next, follows a description of the problem that was the
focus of this study. A hole in the literature on school mindset was identified and
confirmed via a personal communication with the Director of Research &
Implementation Sylvia Rodriguez at Mindset Works, Inc., (March 31, 2015).
6
Problem Statement
Up to the present time, assessment measures in schools have largely focused on
cognitive variables demonstrating learning outcomes of student and school effectiveness.
However, Weschler (1943), developer of the famed IQ measurement scale stated, "there
are also definite non-intellectual factors which determine intelligent behavior" (p. 103).
The challenge for measuring such factors begins with the development of operational
definitions that are quantified on a scale that is valid and reliable. Duckworth and Yeager
(in press) explained, “Scientific inquiry and organizational improvement begin with data
collection” (p. 29). Interventions based on reliable psychosocial data that supports
improved school cultures, and all students in their efforts to succeed, could be useful to
PK-12 public school administrators. Recent studies support this trend and have focused
on expanding the domain of faculty and student variables that contribute to successful
learning including psychosocial factors. Currently, there exist few measures to assess the
quantity and quality of these factors (Netemeyer et al., 2003; Blackwell, 2012). New
areas of research seek to define and quantify non-cognitive factors in schools and to
operationalize them on a scale. If researchers show psychosocial variables of school
cultures influence learning, the information could be useful. New interventions in this
area could support faculty and students in the belief they can grow and learn (Hoy et al.,
1991; Kearney, 2007; Dweck, 2010; Mindset Works, 2008-2012; Panorama Education,
2014).
A "team of researchers, curriculum specialists and educators with experience in
mindset and its application" worked to develop the WMSM scale (S. Rodriguez, personal

7
communication, March 31, 2015). The new instrument operationalized five key features
of a school growth mindset culture described by Blackwell (2012). The 20-item Likert-
style survey is available on the Mindset Works website (2008-2012c). Educators and
school administrators use the WMSM scale to assess their school’s mindset culture.
Mindset Works (2008-2012) then uses the results of the survey to make recommendations
for a “motivational intervention curriculum” (para. 1-11). Dweck and her cofounders at
Mindset Works, Inc., also provide training and products directed at developing a growth
mindset culture in schools. The factors purported to be operationalized in the WMSM
scale compared favorably with variables of learning organization models that explained
improved school outcomes (Tarter & Hoy, 2014). Additionally, the WMSM factors were
similar to themes found by Shannon & Bylsma (2004) in a meta-analysis of 80 studies of
improved school districts. However, no information was available on the reliability and
validity of the WMSM scale. There were no reports found of studies exploring the factor
structure. Without a clear understanding of the factor structure of this instrument faulty
conclusions may be made by those using the scale’s results to understand and shape a
school's organizational culture. Furthermore, the internal validity of any empirical
studies that use the WMSM may be confounded (Hoy et al., 1991; Hopko, 2003;
Kearney, 2007; Murphy & Dweck, 2010; Farrington et al., 2012; Delaney et al., 2015).
Purpose Statement
This study proposes to explore the factor structure of the What’s My School
Mindset scale used by Mindset Works, Inc. (2008-2012c). The results of the WMSM
8
survey are used to assess school cultures and to provide recommendations to improve the
growth mindset of schools (Blackwell, 2012). This research hopes to add to the
understanding of the relationships between items on the scale that operationalize the
school mindset culture construct and to identify the factors they comprise. The results of
this study may provide insights into variables that contribute to improved school cultures
and additional paths for administrators to help faculty develop the belief they can help all
students learn and grow.
Research Question
The overarching research question of this study was “What is the underlying
factor structure of the WMSM scale?”
H0 = The five-factor structure of shared leadership, open communication, professional
collaboration, clear goals and school plan, and support for and belief that all students can
grow and learn does not represent the underlying factor structure for the WMSM scale.
Ha = The five-factor structure of shared leadership, open communication, professional
collaboration, clear goals and school plan, and support for and belief that all students can
grow and learn does represent the underlying factor structure for the WMSM scale.
Significance of the Study
The proposed factor structure of the WMSM instrument for use in quantifying a
school’s growth mindset culture has not been statistically explored and analyzed (S.
Blackwell, personal communication, October 14, 2014). The use of an instrument that
9
does not have well documented psychometric properties may adversely influence the
internal validity of empirical studies that use the WMSM scale as an outcome measure.
Furthermore, without well-documented psychometric properties, school administrators
using the instrument as a tool to identify perceptions of their school faculty may
misinterpret the impact of systemic interventions related to the development of a school
growth mindset. A valid and reliable instrument designed to measure school mindset
could help educational leaders understand the unique psychosocial variables within their
school culture. The appropriate use of data and interpretation of results from the WMSM
scale may help to shape a school's organization's potential to grow and learn (Hoy et al.,
1991; Kearney, 2007; Gay, 2010). Results from this research study may provide baseline
and intervention impact information needed to gauge implementation efforts for school
change. Research based evidence is necessary to challenge assumptions and to provide
sound reasons for new practices (Sanders & Sheldon, 2009; Marzano, Waters &
McNulty, 2005; Sergiovanni, 2014).
Overview of Methods
This study included a quantitative research design using SPSS version 22
analytical software (IBM, 2013) and Lisrel 8.72 analytical software (Joreskog & Sorbom,
2001) to perform descriptive statistics analysis, an exploratory factor analysis, and a
confirmatory factor analysis. Data collection used a combination of paper-based and
online Likert-style surveys distributed to a stratified random sample of approximately 15
PK-12 schools districts across Montana. The survey used in this study included a brief

10
demographic questionnaire and 20-items from the WMSM scale. The data was collected
and then participant responses were split randomly into two subgroups. The first
subgroup of participant responses underwent an exploratory factor analysis to identify the
underlying constructs representing the WMSM scale. The factor structure identified by
the exploratory analysis was then subject to a confirmatory factor analysis. A null
hypothesis was the basis for the analysis and results from the responses from the second
subgroup were compared to the model and fit against the hypothesized population model
(So€rbom & Jo€reskog, 1982; Reitveld & Van Hout, 1993).
Limitations
The sample data was collected during the 2014/2015 school year. The study used
a combination of paper and pencil and online surveys. School district's administration
made the decision of which delivery method they used. The research methods used in
this study included statistical analysis to identify and adjust for any difference in the
responses between online (n=30) and paper-based surveys (281). This study was a
dissertation research project and the limited time prevented a test-retest design, and no
longitudinal data was collected. A variety of survey administrators delivered the paper
surveys on-site using standardized instructions provided by this researcher in an email, in
the mail, or in person. This researcher also provided clarification of instructions, as
needed during the process of follow-up telephone conversations. A limitation of survey
research includes the voluntary nature of the self-selection process. Human-subject
survey research may contribute to reporter bias resulting in a more positive self-report
11
rating. The subsequent effect could provide a slight left-hand skew to the data. Onsite
observations were not performed to confirm the validity of faculty and administrator self-
reports regarding their perceptions of a growth school mindset culture in their school
context. This study had a limited pool of participants that include mostly rural areas in a
large northwestern state. The results may not generalize to larger more diverse
populations. Another limitation included a change in the protocol of paper and pencil
survey administration at school sites. The procedures for delivering the surveys varied
among schools based upon central administration’s needs and preferences. Some schools
followed the survey administration protocol provided. However, some administrators
expressed difficulty in administering the survey in a faculty meeting due to the timing of
the data collection. Some administrators explained there were no more staff meetings for
the faculty for the remainder of the year and therefore distributed the survey to staff in
school mailboxes and collected the surveys over a period of several days. Various other
factors delayed data collection and reduced the number of participants including faculty
participation in the end-of-year SMARTERbalanced testing, multiple demands from
external sources on faculty and administrators’ time, district-level trainings, and year-end
procedures. Next, psychosocial and cognitive variables are difficult to quantify and
measure due to the latent constructs the observed variables are intended to represent. For
this study the researcher used Likert-style surveys with teacher and administrator self-
reports to capture the organizational climate of a school defined as:
…the relatively enduring quality of the school environment that is experienced by participants, affects their behavior, and is based on their collective perceptions of behavior in schools, or openness of an organization, using a personality metaphor and defined as the health of the
12
interpersonal relationships within the organization (Hoy & Miskel, 2005; Hoy et al., 1991, p. 10).
Blackwell (2012) described, “To survive and thrive, school communities need to work
together with a common vision, sharing knowledge, support, and resources. In other
words they need a growth mindset” (para. 4). Collecting self-reports from Likert-style
surveys about underlying psychosocial constructs has inherent limitations (Ogden (2003).
Further, operationalizing psychosocial factors of mindset that are not observable presents
difficulties. Some critics suggest that measuring a psychosocial construct may actually
create it or change it in the process. Additional validated and reliability studies should be
performed to support the reliability and validity of participants reported beliefs about
behaviors and dispositions of students, faculty, and administrators in their school
buildings. Also, validated and reliable surveys that have similar constructs could be run
with the mindset survey in a future study to identify correlations between validated self-
reported psychosocial constructs and constructs purported to be operationalized on the
WMSM scale. Constructs are cognitive theories and therefore cannot be tested.
Emphasis was put on the abstract nature of cognition and perception; that it is itself a
construct of the mind (Gowin, 1981; Bandura, 2001). Ogden (2003) wrote that the
research methods of survey instruments, questionnaires, or written responses from
participants can actually change or create cognitions in the subjects the researcher is
testing. To confirm what faculty report is actually happening in schools would require
onsite observations of the behaviors of participants in schools. Due to limitations of time
and resources this study did not perform confirmatory onsite observations or test and
retest of the participant responses (Gollwitzer & Wallnau, 2014). These limitations must

13
be taken into consideration when interpreting the results of this study. Finally, a deeper
understanding of the specific behaviors that contribute to the underlying psychosocial
constructs on the WMSM scale may be necessary to operationalize definitions that
capture distinct factors contributing to the construct of growth school mindset.
Delimitations
This research was bounded to the study of PK-12 educators in Montana public
schools. This study collected demographic and attitude data, then performed cross-tabs
statistical analysis to identify any covariates influencing the correlation data. According
to national US Census data (2013/2014 school year), 15% of educators are male and 84%
female. The mean years of experience is 19.6. The percentages of highest degree earned
for educators nationally is; 43% Master's degree, 44% bachelor's degrees, and 1%
doctoral. This study included 311 participants, the percentage of educators in the
Montana school sample was 27.3% male and 71.7% female. The highest degree earned
was 41.3% had master's degrees, 49.8% bachelor's degrees and 1.3% had doctoral
degrees; the mean years of teaching experience was 4.03 years (Feistritzer, 2011; United
States Census Bureau, 2015). This result showed Montana demographics had a greater
proportion of male educators, approximately similar education levels, and significantly
fewer number of years' experience than the national average. According to Wilson,
Plane, Mackun, Fischetti & Goworowska’s (2012) 2010 census, only 6.3% of the U.S.
population lives in metro areas with a population of less than 1.0 million. The Montana
school district population used in this sample may not provide results that generalize to

14
the 93.7% of the U.S. population based upon urbanity demographics. Regarding ethnic
diversity, the state of Montana differed significantly from national diversity. The state's
less diverse population was overwhelmingly white. The dominant minority group in
Montana was Native American. The only urban location identified in Montana was
Billings.
Definition of Terms
A concise study requires clear definitions of the constructs used in the research
(Netemeyer, et al., 2003). The following section provides operational definitions
included in the instruments used to capture the constructs for statistical analysis as well as
the definitions of key terms.
Cognitive Social Theory (CST): This theory provides a framework to explain the way
individuals learn and behave through a triad of reciprocal influences from observing the
behavior of others, influences in their social environment, and their own internal factors
(Bandura, 2001).
Individual Mindset: This construct was developed in the foundational research of Dweck
(1986). Individual mindset is defined as a psychosocial concept of attitudes, or beliefs,
about how the world works that resultantly influence the individual's behaviors and
decisions.
Academic Mindsets: This construct was described by Farrington et al. (2012) as “beliefs,
attitudes, or ways of perceiving oneself in relation to learning and intellectual work that
support academic performance” (p. 28). The four distinct academic mindsets include
15
beliefs of belonging; the ability one can grow through effort; that one can succeed; and
the work required has value.
Growth School Mindset Culture: This concept describes a culture with a, "common
vision, sharing knowledge, support, and resources,” (Blackwell, 2012, para. 6 -10).
Blackwell wrote the five key features of a growth school mindset culture operationalized
on the WMSM scale include: shared leadership where the school provides opportunities
for all faculty to practice leadership roles; tapping into expert skills and knowledge;
shared accountability; and developing team capacities, open communication such as
when members of the school community receive open feedback on “what is working and
what is not” in an atmosphere that is perceived as helpful and non-judgmental,
professional collaboration in a culture of adult learning where the school provides
opportunity to learn from colleagues; investing time and resources such as scheduling
time for developing clear goals and a plan with professional collaboration; peer
observations, feedback, and rewards, clear formative feedback, effective models,
transparent expectations, chunking, and appropriate professional development, and
support for and belief in growth includes the belief in the potential of the entire faculty to
“overcome challenges and work purposefully toward that goal” to help all students
succeed (para. 6 – 10).
Five Key Features of a Growth School Mindset: Blackwell (2012) identified key features
of a growth school mindset as those behaviors of school communities that help schools
grow and thrive. These features are compared and contrasted with the factors identified
in this study.
16
Enabling School Structures: Hoy & Sweetland (2001) explained these structures provide
“places where professional relations are open, collegial, supportive, and empowering” (p.
317).
Collective Efficacy: Collective efficacy is a concept comprised of two constructs: 1) the
faculty perceptions of their group competence in teaching methods, skills, training, and
expertise; and 2) task analysis, influenced by the abilities and motivation of students, and
the support provided by the various contexts of home, school, and community (Goddard,
2002, p. 100).
Observed variable: This term is also called measured variable or manifest variable. This
type of variable is measured directly through self-report Likert scores on the WMSM
survey. Observed variables are rectangles on the models. Two-way arrows may include
correlation values between survey items or covariances between factors (Field, 2000 &
2009; Schreiber, Nora, Stage, Barlow & King, 2010).
Latent variable: This term is also called unobserved variable, factor, or construct. The
latent variables are the subject of this dissertation project. Factors are measured
indirectly through the exploratory and confirmatory factor analysis. Factors are ovals on
the models. Regression coefficients or residuals label one-way arrows on the models.
Correlation: The first step in an exploratory factor analysis is calculating the
correlations between items on the survey and developing a correlation matrix that shows
the relationships between items.
Factor Loadings: SPSS statistical software calculates the shared variations of observed
variables in the unobserved variables (variance and covariance). The pattern matrix
17
shows the factor loadings, which are used to determine how much each item contributes
to each factor.
Factor Extraction: This is a statistical procedure used in the identification of the
unobserved variables operationalized in the items of a survey. Identifying the latent
constructs underlying the items of the survey requires a combination of theory, statistical
analysis, and logic. The terms factors in this study will be used to refer to the results of
the exploratory factor analysis extraction. These factors will be compared to the five key
features of a growth school mindset identified above, which are theoretical constructs that
have not been statistically tested.
Summary
Psychosocial factors have been shown to “have a striking impact on students’
achievement” (Dweck 2010, p. 26; Duckworth & Yeager, in press). A valid and reliable
instrument designed to measure psychosocial factors would be useful to school
administrators and may help identify the unique variables within their schools to improve
student outcomes. The results from a scale such as the WMSM may be useful to help
shape a school organization's potential to help all students grow and learn (Hoy et al.,
1991; Kearney, 2007; Gay, 2010). The research team at Mindset Works, Inc. explored
the psychosocial construct of school mindset and worked with a team of researchers to
quantify and operationalize the construct on the What’s My School Mindset (WMSM)
scale; yet, no empirical research on the factor structure of the scale seems to exist in the
social science or education literature (S. Rodriguez, personal communication, March 31,
18
2015). This study explored the factor structure of the WMSM scale. This research seeks
to add to the understanding of the relationships between items on the scale and identify
the factors they comprise. The use of an instrument that does not have well documented
psychometric properties may adversely influence the internal validity of empirical studies
that use the WMSM scale as an outcome measure. Administrators using the instrument
as a tool to identify perceptions of their school faculty may misinterpret the impact of
school improvement interventions. School administrators would benefit from research-
based evidence that challenges faculty assumptions, provides sound reasons for new
practices, and emphasizes hard work as a key element to good outcomes (Blackwell,
2012). A valid scale quantifying psychosocial factors could be used to engage faculty in
productive discussions about their school mindset (Sanders & Sheldon, 2009). The next
chapter will review the literature regarding the mindset model as situated within the
framework of cognitive social theory.

19
CHAPTER TWO
REVIEW OF RELEVANT LITERTURE
This chapter reviews the literature on the concept of mindset, developed by
Dweck (1986) with a theoretical foundation of cognitive social theory (Bandura, 1977).
Throughout the review, research on the construct of mindset is compared and contrasted
with organizational learning models (Bandura 2001; Hoy et al., 1991; Senge, 1990 &
2000; Tarter & Hoy, 2004; Dweck, 1986, 2010 & 2012). Highlighted topics include the
influences of the school context on mindset, the measurement scales for mindset, and the
five key features of a growth school mindset (Blackwell, 2012). A section will compare
and contrast three constructs of mindset, cognitive social theory and learning organization
model factors. Finally, a summary and synthesis of the literature will explain how these
theories and constructs are used in schools (Senge, 1990 & 2000; Blackwell, 2012;
Mindset Works, 2008-2012a; Delaney et al., 2015).
Background of Mindset Theory
Historical Foundations
Advances in theoretical learning models provided the foundation for the study and
development of mindset theory. The following is a list of influential researchers and
models they developed to explain individual learning processes: Watson (1924), Skinner
(1938, 1953, 1954, 1971, 1978 & 1987), and Pavlov's (1927, 1928, 1932 & 1934) work
in Behaviorism; Piaget's (1952 & 1959) theory of cognitive development using the

20
clinical interview process; Vygotsky's (1962 & 1978) cognitive sociocultural learning
model and zone of proximal development; and Bandura’s (1977 & 2001) cognitive social
theory.
Historical views of the mind were conceptualized at the individual level (Sirotnik,
1980). For example, Kant (1787/1999) declared that the mind constructed the
individual's reality creating the dawn of the constructivist viewpoint. However, Hegel
(1807/1967) broached the topic of the influence of the social group on individual thought.
Marx (1867) followed by advancing a theory including the social context in the creation
of the individual's thought. Theorists in the field of education, such as Dewey
(1938/1997) and Vygotsky (1930), later advanced the concept of reciprocity of the social
environment on individual learning (Stahl, 2013). Similarly, Hong, Morris, Chiu &
Benet-Martínez (2000) described implicit "ways of knowing" resulting from cultural
differences; "individualistic as opposed to collectivist value orientations" (p.709). René
Descartes (1633/1999 & 1988) was most influential in describing a distinction between
the mind and the body. Yet, current organization theories describe an organic model as
opposed to a reductionist model, or mechanistic, model. Collinson and Cooke (2007)
called this change "new ways of thinking" and "new ways of learning" that include
learning as socially constructed and dependent on both implicit and explicit processes of
knowing (p. 3 - 9). The distinction becomes a foundation for understanding Bandura's
social cognitive theory and its triadic model of reciprocal influence of human cognition,
one's environment, and the influence of social modeling on the behavior of the learner
(Bandura, 2001). A seminal work in social cognitive theory was a collection of

21
experiments by Bandura referred to as the bobo doll experiment. Bandura observed the
research subject acting aggressively toward a doll after observing an adult model
inadvertently model that behavior. His conclusions emphasized the social influence of
individual learning through imitation and self-monitoring (Bandura, Ross, Ross & Webb,
2013). Dweck's (1986) development of the concept of mindset is deeply rooted in the
framework and history of cognitive social theory. Similarly, organizational learning
theories such as the Hawthorne Experiments increasingly describe the reciprocal
influence of the individual and social group. These influences affect individual and group
beliefs, choices, and behaviors (Senge, 1990 & 2000; Hoy et al., 1991; Tarter & Hoy,
2004, Collinson & Cook, 2007).
Cognitive Social Theory and Agency
Bandura (2001) explained, "…the essence of humanness" is one's personal agency
to operate within a context of sociocultural influences (p. 1). In his cognitive social
theory he explained that to be "agentic" means to be able to "make things happen by one's
own actions" (p. 2). Self-efficacy and collective efficacy play a large role in explaining
individual agency and the development of the individual. Rather than responding
unconsciously to stimuli, Bandura explained that an individual's internal thoughts, affect,
and biology influenced how one responds. He described how the individual created an
idiosyncratic representation within his mind of his experiences. The core features of
agentic action included: the ability to plan (intentionality), goal setting (forethought),
motivation and self-monitoring (self-reactiveness), and efficacy (self-reflectiveness). A
marked and integral element of human agency is one's ability to manage fortuitous

22
events; socially mediated events that happen by chance. Bandura explained that an
individual’s beliefs, attributes, interests and competencies influence how one behaves and
the choices one makes in response to fortuitous circumstances. Bandura identified three
types of human agency including personal, proxy, and collective (p. 13).
Three Types of Agency. Individuals act socially to accomplish their objectives.
Acting by proxy, or collectively, is also considered a part of human agency. This ability
of humans to act collectively, or in another's behalf, lifts the burden of individual
responsibility and expands the human agency construct to collective agency (Bandura,
1977). As individuals act transactionally within a social system, an “emergent” concept
of collective efficacy emerges. Collective efficacy is not the sum of the individuals’ self-
efficacy but a separate independent group construct. The group's belief in its collective
efficacy serves the group functionally in a like fashion as self-efficacy does the individual
(p. 14). Research on collective efficacy showed that collective efficacy of the group
increased the groups' willingness to set higher goals, persist in the face of setbacks, have
increased motivation, and greater levels of accomplishments. Individual and group
efficacy beliefs are key components in the literature explaining mindset and
organizational learning theories (Blackwell, 2012; Murphy & Dweck, 2010; Hoy et al.,
1991; Tarter & Hoy, 2004). The next section describes the intricate involvement of the
individual and the social system. Bandura did not consider them as separate.
Influence of Social Systems. Bandura (2001) joined the ranks of Marx (1867),
Dewey (1938/1997), and Vygotsky (1962) when he declared, "…human functioning is
23
rooted in social systems." He explained the structure of a system is a model of reciprocal
causality and "a dynamic interplay between individuals and those who preside over the
institutionalized operations of social systems" (p. 15). Therefore, his research
demonstrated that the structure of the system and the individual’s psychological qualities
are not divided into discrete and separate components. Rather, "people achieve the
greatest personal efficacy and productivity when their psychological orientation is
congruent with the structure of the social system" (p. 17). Bandura warned that collective
efficacy is being eroded by rapid technological advancements that have changed the way
individuals and nations relate to their world. The external environment influenced by
media, mobility, and transnational economic and political interdependencies has changed
our social future. He wrote that it is vital we recognize the role individual agency and
collective agency have in shaping the group’s environment for the betterment of all (p.
23).
Criticisms of Cognitive Social Theory. Some criticisms of the cognitive social
theory model suggest that the theory cannot be tested. Behaviorists and recent social
psychological theory developments in the rapidly advancing biotechnological sciences
emphasize the abstract nature of cognition; that it is itself a construct of the mind (Gowin,
1981; Bandura, 2001). Though many research studies explore the pragmatic outcomes of
cognitive theories, little research has been done to test the theory itself. Ogden (2003)
wrote that the research methods of survey instruments, questionnaires, or written
responses from participants can change, or create, cognitions in the subjects the
researcher is testing. For example, when researchers question a subject during an
24
interview they consider this a means to obtain relevant data to verify a hypothesis. The
same method of questioning, set in another experimental study, was shown to "prime" or
influence the individual's cognition and subsequently influenced the choices and behavior
of the subject. Recent psychological interventions in schools use individual cognition, or
one's intentions, to change their behavior. When the researcher asks the individual
participant to write his understanding in a positive, intentional way, the subject's future
behavior was shown to change (Yeager & Walton, 2011; Walton, 2014). The next
section discusses alternative theories to cognitive social theory.
Alternative Theories. Under the behaviorism model, seminal researchers such as
Pavlov, Watson, and Skinner, worked to identify variables used to change the behavior of
animals. The stimulus-response approach, lacked learner agency, though was later
applied in psychological research with humans. These models directed student behaviors
in rote-learning tasks in school settings. The theories promoted external control over the
learner. In progressive models, human cognition became increasingly in focus. Piaget's
earlier cognitive theory focused more on human information processing models than
Bandura's social psychological research. Ausubel's (1963 & 2000) cognitive meaning
making proposed interventions for classroom learning that focused on the individual's
internal construction of knowledge and one's mental map. His research suggested pre-
evaluations of individual’s to determine how they view a topic before teaching new
information. In contrast, Bandura emphasized self-efficacy, agency, and modeling to
improve learning. Human agency became central to the study of cognitive social theory,
though at that time, the independent variables were observable behaviors (Bandura, 1986;

25
Zimmerman, 1989). These models emphasized increasing learner agency though lacked
construct development in the area of the influence of social interactions on the learner’s
choice to engage new knowledge.
As the computer advanced in complexity, a mechanistic model of the brain was
forwarded in Weiner’s (1986) information processing model though his model excluded
considerations of human affect. Affect was an element important to Bandura’s (2001)
cognitive social theory. More recent studies focus on psychosocial factors of learning
that result in meaningful learning (Farrington, 2013). Gowin’s (1981) Knowledge Vee
was closely related to Novak’s work founded on Ausubel’s model. Gowin suggested the
usefulness of evaluating an individual’s cognitive development using mind maps that
were shown to support corrections in individual hierarchal propositions. Bruner
referenced the concept of idiosyncratic cognitive structures in his model and described
three stages of cognitive ability not based on age, as were Piaget’s development stages.
Bruner’s model included enactive, ability to use manipulatives; iconic, recognizing
images; and symbolic, with the use of abstract language and reasoning. The next section
describes the concept of organizational learning and its relationship to the group mindset
construct.
Organizational Learning
For this review, the topic of mindset was situated in the relevant and influential
context of the school as a learning organization. Social, interpersonal, and cultural
factors interact with the individuals in a school to create an organizational entity that can
26
reciprocally influence the individual as described by Bandura (2001) in his model of
cognitive social theory. This perspective is viewed as systemic thinking (Senge, 1990 &
2000). Collinson & Cook (2007) explained, systemic thinking refers to the individual's
ability to see "the whole rather than its parts" (p. 5). Previous organizational models used
a mechanistic systems view, founded on reductionism, or breaking the whole into parts
and focusing on isolated problems and solutions. More recently organizational models
are being replaced with an organic, or human systems, analogy that emphasizes inter-
relationships and the development of collective consciousness or shared mental models.
The concept of shared mental models compares with Dweck's (2012) school mindset
concept of mutual support and shared knowledge making (Ruff, 2002; Kofman & Senge,
2003; Flood, 1999; Hong et al., 2000; Kiedrowski, 2006; Mindset Works, 2008-2012b &
c; Blackwell, 2012). Yeo (2005) claimed organizational learning occurred in three
stages: 1) the individual level involving non-routine tasks and is resistant to change, 2) at
the team level involving non-routine problem-solving with opportunities for action, and
3) the organization level involving complex solutions by the collective through changing
the external environment (p. 379).
The Organization as an Entity
Though organizations are a collective of individuals, the collective actions of the
individuals together can be abstracted and viewed as a single entity with its own separate
characteristics. An organization can be viewed as distinct from the individuals within it.
Research models suggested an organization becomes identifiable as a unique entity when
the individuals that work within it have adopted and agreed to a characteristic set of

27
shared values, actions, and assumptions within the organization (Sanders & Sheldon,
2009). Importantly, these characteristics can be, and often are, different from the
individual's personal beliefs. Two behaviors of organizations demonstrate organizational
learning. First, the individuals within the organization learn from organizational
experience. Secondly, the individual learning then becomes part of the organization's
culture and part of the organizational memory. However, not all organizations are
learning organizations. The key to organizational learning is the opportunity for
individuals to practice new learning in context (Senge, 2000; Bolman & Deal, 2008).
Organizational learning is demonstrated by the persistent actions of the individuals within
the organization (Barnden & Darke, 2000; Senge, 1990 & 2000).
Educational leaders play a key role in influencing the culture of the schools they
lead by "supporting its primary values and aims," (Collinson & Cook, 2007, p. 136).
Developing shared visions and beliefs among its members is accomplished by holding the
focus of the individuals on the goals of the school until new learning has occurred.
Another important aspect of organizational learning is providing a structure where the
individuals can self-organize and practice the new learning in the unique context of their
community and school. School principals can support organizational learning in the
following ways: effective use of resources, developing employee perceptions of control
over their work, developing collegial relationships; providing clear expectations and
feedback; and the appropriate use of rewards for performance (Hoy et al., 1991; Hong,
Chiu, Dweck & Sacks, 1997; Hong, Chiu, Dweck, Lin, & Wan, 1999; Kouzes & Posner,
2002; Tarter & Hoy, 2004; Freitas, Gollwitzer & Trope, 2004; Evans, 2013).

28
Synthesis of Theory and Practice
The study of organizational learning diverges into two streams, the theoretical
(epistemological) and the practical (empirical). The theoretical stream tends to be
researchers focused on understanding the processes of organizational learning, or how
meaning is constructed and integrated into knowledge structures in the individuals and
the organization. The second stream tends to be practitioners attempting to develop
prescriptive practices, or answers, to how to create a learning organization. However, a
review of the literature suggests that the creation of learning and the creation of a
learning organization occur reciprocally. Research revealed individuals project their
identity in the social environment and learn from the consequences of how this influences
the organization, which, in turn, develops the organization's identity. Resultantly, in
successful learning organizations, individuals demonstrate behaviors from their
embodiment of the collective's values, beliefs, and goals (Collinson & Cook, 2007).
A critical question in the theoretical framework of learning organizations and
organizational learning is, “What is the relationship between individual/organizational
learning and the development of a learning organization at the juncture of the empirical
and theoretical perspectives?” Mindset research, viewed through this lens, attempts to
contribute variables, malleable to influence, that bridge the gap between research theory
and practice (Tourangeau, Rasinski, Bradburn & D'andrade, 1989; Dweck, 2012). Key
research in the area of psychosocial factors, such as academic mindset, focuses on
developing interventions to improve school learning, structures, and practices. The Fifth
Discipline (Senge, 1990 & 2000) and Open Systems organizational models (Hoy et al.,

29
1991; Tarter & Hoy, 2004) provide a framework for comparison and contrast with school
mindset theory within a context of organizational learning.
Framework of Organizational Learning
A variety of researchers have developed models contributing to improved
organizational outcomes: the Fifth Discipline (Senge, 1990); Bertalanffy's Open Systems
(Tarter & Hoy, 2004); Argyris & Schon's (1996) Theory-of-Action, Organizational
Ecology, Action Learning Perspective, single and double-loop learning; Checkland's Soft
Systems model and thought-in-use; and Beer's Viable Systems model and participatory
structure (Flood, 1999). A review of the literature of these models provided a variety of
variables shown to correlate with improved organizational outcomes. The literature on
school mindset showed similar constructs with the organizational learning model
factors—especially the construct variables linked with systems thinking and open
systems model.
Systems Thinking
Yeo (2005) described organizational learning as the result of individuals working
together and developing a shared consciousness as a result of that work. He described a
"new form of labor" that takes place while doing the work as opposed to learning a task
separately such as in a classroom (p. 371). He further explained the significance of
systems thinking. Senge (1990) described the process of organizational learning as
developing shared mental models. Shared mental models compared favorably with
school mindset constructs of professional collaborations when faculty believes they are
30
able to help all students learn and grow (Blackwell, 2012). Similarly the Open Systems
model used constructs that include collaborative decision-making, collegial relationships,
and collective efficacy as key to organizational learning and explained improved
organizational outcomes (Hoy et al., 1991). Taken together, these models include three
levels of engagement in organizations that contribute to individual and organizational
learning.
The Five Disciplines. In the Five Disciplines model, a learning organization
included the following key disciplines: personal mastery, mental models, shared vision,
team learning, and systems thinking. Senge defined a discipline as those ideas and
insights that individuals practiced until integrated as part of their personal behaviors.
Under the Five-Disciplines the primary activity of the leader was to provide interventions
that promoted the development of the school as a learning organization. Senge (1990)
explained:
…people are agents, able to act upon the structures and systems of which they are a part. All the disciplines are, in this way, ‘concerned with a shift of mind from seeing parts to seeing wholes, from seeing people as helpless reactors to seeing them as active participants in shaping their reality, from reacting to the present to creating the future’ (p. 69).
This review identified Senge’s 2nd Discipline, mental models, as similar to
Dweck’s (2006, 2012) model of mindset. Senge (2000) explained individuals generate
their beliefs, from inference, through experience. He recommended the processes of
reflection and inquiry as necessary for individuals to continually reconstruct and correct
their mental models. Senge explained that without reflection and inquiry an individual’s
31
mental model might result in bias and incorrect constructs through a process he described
as the “ladder of inference” (p. 68 & 69).
In a learning organization, leaders … are responsible for building organizations w[h]ere people continually expand their capabilities to understand complexity, clarify vision, and improve shared mental models – that is they are responsible for learning… (Senge, 1990, p. 340).
Organizational learning in this model is the development of improved shared mental
models. The concepts of individual mental models, the use of reflection, and a
collaborative network within the organization are consistent with the concepts of
individual and school mindset and yet different.
Open Systems Model. The Open Systems model identified the unit of analysis as
the organization, not the individual. Researchers used Likert-style surveys with faculty
self-reports to capture the organizational climate of a school defined as:
…the relatively enduring quality of the school environment that is experienced by participants, affects their behavior, and is based on their collective perceptions of behavior in schools, or openness of an organization, using a personality metaphor and defined as the health of the interpersonal relationships within the organization (Hoy & Miskel, 2005; Hoy et al., 1991, p. 10).
The Open Systems model identified four organizational elements shown to influence
organizational outcomes. These include the structure of the system; the qualities the
individuals bring to the system; the culture and symbols of the system; and the conflict or
tension between the individual's and the organization's goals. An "open climate" in an
organization is when individuals demonstrate cooperation, respect, and openness between
the individual faculty members and the faculty and the principal. Researchers tested the
validity of the Open Systems model by showing certain critical internal elements of an
32
organizational system positively correlated with school effectiveness. The model
included the factors of an enabling school structure. One factor included principals and
faculty working together as colleagues. Another factor was the individual's desire to gain
control over his work environment and the influence this had on motivation. Next, the
culture of the organization related to the leadership style of the principal. Finally, the
way administrators made decisions influenced individuals and the group (Leithwood,
Anderson, Louis & Wahlstrom, 2004; Tarter & Hoy, 2004, p. 540; Strahan, Spencer &
Zanna, 2002; Spencer-Rogers et al., 2012). School mindset correlated significantly with
variables shown to influence positive organizational outcomes. School mindset included
elements of Open System models within the purported operationalized constructs of a
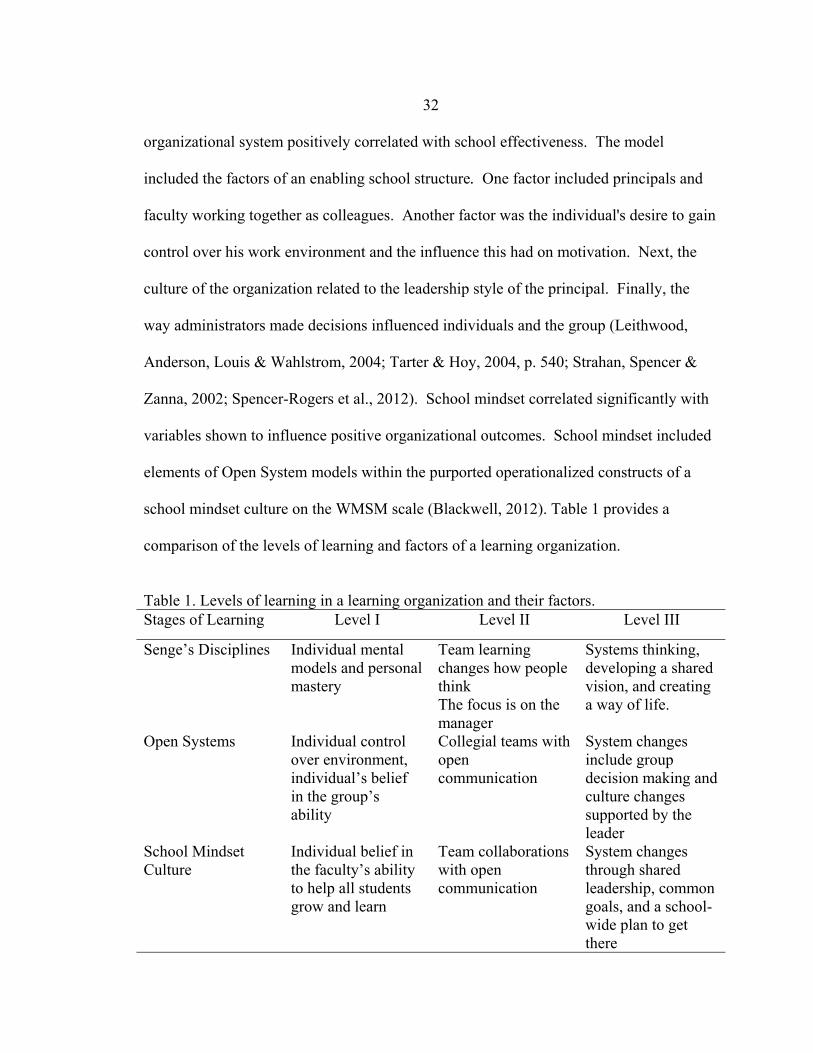
school mindset culture on the WMSM scale (Blackwell, 2012). Table 1 provides a
comparison of the levels of learning and factors of a learning organization.
Table 1. Levels of learning in a learning organization and their factors. Stages of Learning Level I Level II Level III
Senge’s Disciplines Individual mental models and personal mastery
Team learning changes how people think The focus is on the manager
Systems thinking, developing a shared vision, and creating a way of life.
Open Systems Individual control over environment, individual’s belief in the group’s ability
Collegial teams with open communication
System changes include group decision making and culture changes supported by the leader
School Mindset Culture
Individual belief in the faculty’s ability to help all students grow and learn
Team collaborations with open communication
System changes through shared leadership, common goals, and a school-wide plan to get there
33
Enabling School Structures were shown to facilitate and guide the organization
toward goal attainment. An enabling school structure focused on the importance of the
principal’s relationship with the faculty. The principal's behavior influenced the group's
motivation to work together toward common goals (Tarter & Hoy, 2004, p. 540). In an
enabling school structure the system consists of shared beliefs that unite the people,
provide a common identity, increases the commitment of the faculty, and increases their
beliefs in the general effectiveness of the school. Tarter & Hoy confirmed their
hypothesis that “school performance improves as the school structure becomes more
enabling” (p. 542). A pilot study by this researcher examined the influence of principal
and faculty beliefs in the effectiveness of their school. The pilot study surveyed principal
and faculty perceptions their school’s mindset culture using the WMSM scale. The
Faculty Change Orientation scale collects faculty self-reports of faculty openness to
change and principal openness to change. Faculty perceptions of their work locus of
control were quantified using the Work Locus of Control scale (Kearney & Smith, 2008;
Plaks, Grant & Dweck, 2005). Statistical analysis using SPSS software showed the
independent variables explained .69 of the variation in the dependent variable of school
mindset culture. The literature also showed significant individual dispositions of
openness and conscientiousness had a significant correlation to a growth mindset
(Burnette & Pollack’s, 2013, p. 370).
Collective Efficacy. Collective efficacy is grounded in cognitive social theory
and has been demonstrated to be “an important predictor of the differences between
schools and student achievement” (Goddard, 2002, p. 98; McGuigan & Hoy, 2006; Hoy,

34
Tarter, & Woolfolk Hoy, 2006). The collective efficacy model includes two constructs:
group-teaching competency and task analysis. Group-teaching competency refers to
perceptions of the faculty’s “teaching methods, skills, training, and expertise.” Task
analysis refers to perceptions of the characteristics of the actual task, motivations and
abilities of students, and support from home and community (p.100). In school cultures,
collective efficacy is the faculty’s belief about the capacity of the entire staff to work
together to achieve positive effects on students. Collective efficacy as described by
Bandura, and discussed earlier in this paper, included influences from the social group,
culture, and individual responses to social situations. The following Figure 1 shows
variables that comprise the collective efficacy construct and have been shown to
contribute to higher goals, persistence in the face of challenges, and willingness to
increase effort (Bandura, 2001). This concept will be discussed further in this paper as it
relates to the five key features of a growth school mindset and to the factors identified in
this study.
Work Locus of Control. Bandura (2001) demonstrated the individual's need to
gain control over his environment and to have a personal choice (Plaks, et al., 2005).
Tarter & Hoy (2004) confirmed this hypothesis. Research revealed the positive
correlation between control and school effectiveness. Persistence, motivation, and effort
toward goal attainment increased with an increase in the individual's perception that their
actions would produce the desired outcome. The Work Locus of Control Scale captures and quantifies this concept through participant self-report responses (Spector, 1988;
35
Figure 1. A simplified model of collective faculty efficacy, Goddard (2002) p. 101.
Maurer, Wrenn, Pierce, Tross & Collins, 2003; Smith, Wigboldus & Dijksterhuis, 2008).
The literature review revealed the significance of the individual agency as a foundational
factor in improved student outcomes. Work locus of control is domain specific and
captures job-related variables such as job performance, satisfaction, behavior, and
organizational commitment (Wang, Bowling & Eschleman, 2010, p. 762). The higher
the respondent's score, the higher the external locus of control. External locus of control
was considered less favorable and suggested the individual felt their work environment
was influenced more by others than by their efforts. Research revealed one's view of
their control over relationships in their environment influenced an individual's work locus
of control (Furnham & Drakeley, 1993). The better relationships with their supervisors
and co-workers the greater the belief the individual could favorably influence the others'
behaviors, and this increased his or her sense of work locus of control (Spector, 1988).
36
Learner agency is an important factor in the development of meaningful learning.
Cognitive social theory describes the important influence of the individual's environment
on cognition. The influences of social experience and psychosocial factors are consistent
with mindset theory features (Ponton, Derrick, Carr & Hall, n.d.; Zimmerman, 1989;
Farrington, 2013). Thus, meaningful student learning is a sound dependent measure to
evaluate the quality of the school context. A variety of variables contribute to the quality
of the school context and therefore to student learning including organizational learning
and the concept of mindset.
As previously mentioned Ausubel (1963, 1968, and 2000) explored ways to
improve student learning. He identified two distinct types of learning, rote and
meaningful. Rote learning was defined as new knowledge arbitrarily and unsubstantially
acquired by the learner; identified within a specific context; and, because of the passive
nature of the learning, does not transfer to a new context. Therefore, rote learning has
been referred to as situated learning. Meaningful learning required learner choice, or
agency, to engage the new knowledge. The learner actively incorporates new knowledge
into his existing knowledge structure, creating new networks and new meanings (Novak,
2002, p. 549; Ponton & Rhea, 2006). This learning is meaningful because it is
transferrable to new contexts for use in creating new constructs and solving problems.
Schunk (2012) explained, “The basic processes involve setting goals, judging anticipated
outcomes of actions, evaluating progress toward goals, and self-regulating thoughts,
emotions, and actions” (pp. 118 & 119). This process just described can also be used as a
definition of a feedback loop. A feedback loop is comparable to the definition in

37
cognitive social theory for human agency factors (Bandura, 2001), and similar to Senge’s
(1990) Five Disciplines, and compares to features of Tarter & Hoy’s (2004) Open System
constructs of enabling school structures and collective efficacy. Strategies promoting the
development of faculty and student agency in schools were found useful in promoting
growth mindsets (Farrington, et al., 2012; Dweck, 2010; Blackwell, 2012). The same
strategies are related to school practices, grading and the feedback loop (Farrington et al.,
2012; Farrington, 2013; Burnette, O'boyle, Vanepps, Pollack & Finkel, 2013).
Individual Mindset
Connection to Cognitive Social Theory Mindset theory is situated in the cognitive social model of motivation and
learning. Implicit theories of fixed or incremental mindset have been shown to predict
self-regulatory processes of goal setting, similar to constructs of human agency (Hong et
al., 1999; Baumeister, Masicampo & Vohs, 2011). Current research revealed the social
context strongly influenced learner agency (Spector, 1988; Wang et al., 2010; Blackwell,
2012). The group has a powerful influence on whether the learner experiences internal or
external locus of control as described in Bandura's cognitive social theory. Researchers
are currently exploring the usefulness of psychosocial supports within the school
environment that will produce learner choice to engage new knowledge. These supports
included goal alignment, feedback, resources, and skill development (Rottschaefer &
Knowlton, 1979; Martin, 1979; Novak & Gowin, 1984; Dweck, 1986; Bandura, 1986,
2001; Zimmerman, 1989; Dweck & Leggett, 1988; Farrington et al., 2012). These
38
psychosocial supports were consistent with the five features of a growth school mindset
culture (Blackwell, 2012; Mindset Works, 2008-2012a-c). These variables were also
consistent with the research on academic mindset in the Five Categories of Non-
Cognitive factors (Farrington et. al, 2012). These were also factors used in interventions
to develop effective school cultures for supporting all students toward developing
meaningful learning outcomes. The concept of learner agency, or control over one's
environment, was central to the psychological and socio-cognitive processing model of
mindset. Mindset theory explained the learner's need for a belief in "establishing and
maintaining…[a] subjective sense of prediction and control” over one’s experience in the
world (Plaks, et al., 2005, p. 245).
Bandura (2001) explained that the well-being of the individual depended on
individual goal alignment with the system's goals. Effective school leaders, using
mindset interventions, understand the importance of goal alignment between individuals
within the organization (Woike, 2008; Burnette et al., 2013). For example, research in
the area of the concept of mindset showed influences on individual behaviors resulted
from one's belief in personal control. This belief was shown to influence the individual's
subsequent choices and behaviors used during the decision-making processes.
Individuals with fixed mindsets selected performance goals more often than mastery
learning goals. This was the result of an effort to obtain a positive social judgment or
avoid negative evaluations. Kang, Scharmann & Noh (2004) wrote, "motivational
constructs, such as mastery goal orientation, adoption of a constructivist belief about
learning, higher levels of personal interest, self-efficacy, and personal control, should be
39
potential mediators of the process of conceptual change" (p. 91). For example, students
shifted to a fixed mindset when they received negative feedback toward goal attainment.
Resultantly, some students changed their major or dropped out of college (Thornton &
Mcentee, 1995; Dai & Cromley, 2014; Thornton & Mcentee, 1995; Dai & Cromley,
2014). In sum, changes in school climate were shown to leverage improvements in
school outcomes. These changes included individual agency, collaborative decision-
making, recognition of the individual nature of meaning-making, openness to change, and
psychosocial supports, such as mindset interventions. Key aspects of cognitive social
theory are a foundation of mindset theory (Senge, 2000; Bandura, 2001; Tarter & Hoy,
2004; Dweck, 2012; Farrington et al., 2012, Job, Walton, Bernecker & Dweck, in press).
Seminal Studies. Dweck’s (1975) foundational research was in learned
helplessness in children. She noticed during her research that some children viewed
difficult problems as challenges and persisted, using mastery strategies, while others gave
up and viewed themselves as failing. She found students held theories of their
intelligence that influenced their behaviors. Students who felt their intelligence was
unchangeable gave up easily while students who felt they could improve through effort
sought out academic challenges. Dweck labeled these beliefs as implicit self-theories of
intelligence called “entity” and “incremental” (Dweck, 1995; Dweck & Leggett, 1988).
Subsequently she found that faculty who praised students for their intelligence rather than
their effort sent a message to students that they did not have control over their learning.
She began to create interventions that taught faculty to praise students for their effort and
found it changed students’ behavior (Dweck, 1999). Later, Dweck changed the unwieldy
40
terms of “entity” and “incremental” to fixed and growth. An individual with a fixed
mindset believed his intelligence was a trait that did not change. Individuals with growth
mindset beliefs felt that they could improve and grow through effort and practice. Dweck
showed mindset beliefs were malleable and explained variations in student choices of
behaviors and strategies used to meet learning goals (Dweck, 2002 & 2008).
Criticisms of the Mindset Theory. Dweck’s (1986) model may be considered too
narrow by some researchers and educational leaders (Farrington et al., 2012). Her
instruments use only brief questionnaires to identify beliefs of individuals. She uses the
results to create fixed categories that label individual beliefs. She then uses these labels
to explain variations in individual choices and behaviors that result from these beliefs.
Further, the mindset research often excluded the population of individuals who indicated
neither fixed nor growth mindsets. Additionally, current mindset theoretical models may
be too simplistic and exclude other relevant factors related to goal setting and goal
attainment (Plaks et al., 2005). Other research results for individual mindset
interventions showed only modest gains (on average .3 GPA points) for subcategories of
the student population. Mindset intervention benefits were limited to students with low
performance, of a minority race, or of the female gender (Aronson, Cohen & McColskey,
2009). Further, when students became aware of the purpose of the interventions, the
results were compromised (Farrington et al., 2012, p. 36). Therefore, interventions in the
area of mindset at the individual level showed less potential for school improvement than
those focused at the level of the organization.
41
Alternative Theories. Dweck & Leggett's (1988) goal theory, Kirshner &
Whitson's (1998) situated learning and Senge’s mental models and Five Disciplines
(1999) all viewed individual agency and learner choice over goals as critical elements in
learning. Hong et al.'s (1999) meaning framework and the setting, operating, monitoring
and attainment (SOMA) model incorporated mindset research. Researchers explored the
influence of implicit theories such as mindset on the feedback loop in goal attainment
through self-regulation. Researchers found that individuals’ implicit (growth mindset)
theories explained an ability to self-regulate and to gain progress toward goals (Burnette,
et al., 2013). Gollwitzer (1990) added to the literature by describing goal theory.
Mindset is similar but Gollwitzer focused on two stages in the goal attainment process;
decision making and implementation, instead of the individual’s beliefs about one’s
intelligence. The implicit learning theories of Burnette et al. (2013) suggested that the
content and structure of one’s memory differed depending on one’s level of awareness
and the purpose of his motives, or goals. Bandura's (2001) foundational work in
cognitive social theory is a foundational concept for these models and will be shown to
be both similar and different from Dweck’s mindset theory.
Academic Mindset
Researchers described academic mindsets as ways students think of themselves
that make them want to learn (Farrington et al., 2012, p. 9). The concept of academic
mindset adds to the individual mindset construct. Academic mindset includes a student's
belief that he belongs, relevance of the tasks required of him, and a belief that he can

42
perform the tasks (self-efficacy). Students with academic mindset demonstrate academic
behaviors of study, attendance, and homework completion. The Five Categories of Non-
Cognitive Factors includes the concept of academic mindset as well as academic
behaviors, academic perseverance, learning strategies, and social skills. These factors
incorporate many familiar concepts in educational leadership preparation programs and
taught in faculty professional development. A few of the concepts are: persistence,
resilience, grit, goal setting, collaboration, self-efficacy, self-control, self-discipline,
motivation, mindsets, effort, and learning strategies (Farrington et al., 2012, p. 8; Freitas,
Gollwitzer & Trope, 2004). This paper discusses here factor 3, academic mindsets.
Academic mindsets are associated with behaviors that have large effects on student
learning. Osterman (2000) found variables within the school context and instructional
methods that can be influenced by administrators and faculty and shown to develop
academic mindsets in students (Blackwell et al., 2007). The next section provides
examples of how researchers have studied the influence school context has on academic
mindset. The Project for Education Research that Scales (PERTS) provides an example
of how the influence of school context on academic mindset was studied (PERTS,
2014a).
Group Mindset
Murphy & Dweck (2010) explored the dynamic concept of the self and the
influence of the organization on individual beliefs, behaviors, and motivation. Dweck
hypothesized that the individual need to be valued and accepted would influence how
43
people display themselves in a group. Dweck found significant and large effects on
individual behaviors depending on the organization’s theory of intelligence. The concept
of a growth school mindset culture compares and contrasts with organizational and
learning organization factors. These factors are consistent with recent motivational
theory research expanding on the individual concepts of fixed and incremental mindset
begun by Dweck (2006). Dweck’s current research explores the influences of group
mindset on individual and group behavior. For example, Senn Delaney participated with
Dweck and her collaborators to perform interview and survey research with Fortune 1000
companies. The two-year study showed an organization's mindset was a key factor in
developing positive behaviors within the organization. These behaviors included
resilience, innovation, collaboration, engagement, commitment, and trust (Delaney et al.,
2015). Additionally, Murphy & Dweck (2010) performed experimental studies with
university students to determine the effects of group-level mindset on individuals. The
research revealed an organization's environment and norms, or the embodied shared
perceptions, of a fixed versus entity view of intelligence affected the individuals' self-
perceptions, motivation, and behavior toward others. Such studies have implications for
schools as organizations.
For example, the research showed group-level mindset theories influenced the
way people in the group perceived what the organization valued (Delaney et al., 2015).
The group mindset influenced how individuals displayed themselves to the group to gain
acceptance and avoid negative judgment. Further, there were "sticky" effects resulting in
shifts in the individual's values as they internalized the group values. Then "downstream"

44
effects influenced how the individuals later evaluated themselves. Further, "spillover"
effects resulted in shifts in how the individual's evaluated and treated others in unrelated
contexts (Murphy & Dweck 2010, pgs. 292-294). Finally, research showed that because
the organization and individual's mindsets were malleable they reciprocally influenced
the choices of goals, the level of persistence in the face of challenge, and the level of
collaboration with others. This process is comparable to organizational learning and
learning organization models showing the reciprocal influence of the group on
individuals in developing meaningful learning and cultures that influence positive
organizational outcomes. These results have significant implications for school
administrators. Variables shown in organizational learning and school mindset may help
improve school cultures that promote faculty perceptions of their school culture that
include a belief that all faculty can help all students learn and grow (Hoy et al., 1991;
Collinson & Cook, 2007; Kearney, 2007; Sanders & Sheldon, 2009).
Mindset Concepts Compared
Individual, academic, and group mindset concepts are similar and different. Each
level of mindset includes a belief in the ability of the individual or group to grow and
learn. If the individual does not believe an individual's intelligence or trait can change
through one's effort, they are considered to have a fixed mindset. A fixed mindset
orientation has been shown to influence the behaviors of both the individuals and the
organization as a whole (Delaney et al., 2015). The concept of academic mindset
includes additional factors of belonging, relevance, self-efficacy, and motivation.
45
Academic mindsets focus on psychosocial factors of students in schools (Farrington et
al., 2012). However, the concept of a school mindset refers to a shared belief in the
collective consciousness of a school’s faculty. The school’s mindset is measured through
self-report ratings from 1-6 by individual faculty for items on a Likert-style scale. The
items list variables purported by Mindset Works, Inc. to develop a growth mindset
culture in a school. The five key features of a growth school mindset purported to be
operationalized on the WMSM scale include shared leadership, open communication,
professional collaboration, clear goals and a plan, and support for students and belief in
growth (Blackwell, 2012). Learning organization theory suggested an organization could
act as a single entity with its own goals, values, and organizational behaviors (Hoy et al.,
1991; Hoy & Tarter, 2004). The mindset of the organization has consequences for the
behaviors and perceptions of the group and individuals.
Influence of Mindset on Organizations
Individuals experience their world situated within the organizational context. As
individuals interact in the social group they create unique mental representations of how
they perceive their experiences. Individuals want to control and predict what will happen
(Senge, 1990; Dweck & Leggett, 1988; Novak, 2002). Because of limited experience
and cognition, and subject to various psychological and emotional influences, individual
models of the world incorporate limited or inappropriate hierarchal propositions. This
process is individual and influences individual learning. The process of reciprocal
projection is used to correct and improve the individual understandings of how the world

46
works. The organization learns from the individual in the same way and improves the
collective understanding of the individuals in the group. Schools can promote
engagement and meaningful learning by having an open culture. Open cultures provide
opportunities for individuals to project their beliefs and to receive positive feedback.
Open school cultures produce improvements in the construction and reorganization of the
individual and group mental models. Ultimately open school cultures result in effective
adaptation to the changing environment and move the school forward in improvement
(Chui, Dweck, & Sacks, 1996; Senge, 1990; Bandura, 2001; Novak, 2002; Collinson &
Cook, 2007; Dweck, 2012; Burnette et al., 2013). The feedback loop of projection and
re-evaluation is a leverage point for developing individual motivations, affects, and
beliefs. Individual beliefs influence the individual's perceptions, such as their mindset
theory. A person's mindset theory influences his choices in goal setting, and the
behaviors used as strategies to achieve goals. When negative feedback occurs in an
unsupportive context, such as, if the school fails to provide adequate support, clear
expectations, achievable goals, resources, monitoring, appropriate tasks, psychosocial
and metacognitive skills, safety, and opportunity to practice new learning in realistic
settings, the individuals may lose the belief that goals are attainable. This results in a
reduced internal locus of control, a shift to a fixed mindset, and emotional or physical
withdraw from school engagement. Though the individual may outwardly continue to
conform to the group norms, lack of engagement results in failure to develop meaningful
learning or shared meaning making. The result is the individuals use rote learning or
compliance. The purpose is to meet expectations of normative assessments, grading
47
processes, and standardized goals. Rote learning lacks useful individual cognitive
restructuring. When no corrections and improvements occur in the individual cognitive
structure, there is no meaningful learning. Meaningful learning is necessary to transfer to
new contexts (Tourangeau et al., 1989; Novak, 2002; Farrington et al., 2012;
Brandstatter, Herrmann & Schuler, 2013).
Based upon their research in the area of mindset, Mindset Works, Inc. (2008-
2012a-b) provides mindset resources for interventions that align closely with the implicit
theories, goal setting, and feedback loop within a community. Mindset Works, Inc.
provided a variety of recommendations to improve school cultures including reflection on
one's mindset, growth mindset mentoring, focused instruction, allowing others to make
mistakes and creating a safe environment for learning and practice (Blackwell, 2012,
para. 11–15; Carver & Scheier, 2002). The interventions of a growth school mindset
culture align well with Open Systems and The Five Discipline models. The focus is on
the development of collegiate relationships, a supportive environment, and individual
agency. This contrasted with hierarchal external authority models where external
authority dictates the goals (Senge, 1990; Hoy et al., 1991; Tarter & Hoy, 2004; Mindset
Works, 2008-2012a & b). Developing a growth mindset culture in a school influences
the individuals in the school. Research has shown that promoting the factors of a growth
school mindset also developed a growth mindset in the faculty and students. The impact
of a growth mindset in schools was shown to improve student motivation and
achievement. Growth mindset interventions increased math achievement in female
gender students and improved achievement for individuals in minority racial categories

48
(Aronson, Fried & Good, 2002; Good, Aronson & Inzlicht, 2003; Yeager, Purdie-
Vaughns, Garcia, Apfel, Brzustoski, Master, Hessert, Williams & Cohen, 2014).
Students with growth mindsets improved resilience and even increased the density of
neurons in the brain areas accompanied by an increase in IQ-performance (Mindset
Works, 2008-2012). Mindset research in companies showed increased worker
satisfaction, improvements in self-reports of organization culture, increased collaboration
and innovation, ethical behavior, and improved supervisor views of employees (Delaney
et al., 2015). Improving organizational learning through mindset interventions requires
healthy organizational relationships that are open to change. Research suggested that
reciprocal projections of individual beliefs, values, and behaviors co-create shared
meanings within a zone of proximal development.
Administrators may use the information on mindset to promote improved school
cultures. The administrator must first reflect and develop a personal growth mindset and
belief in the importance of integrating psychosocial skills into the learning strategies of
the school. The results of the mindset survey tools can be used to open dialog to discover
the zone of proximal development of faculty. Discussion can begin about how to develop
an openness to change. Administrators can work with faculty to provide training in
psychosocial skills at the identified level of need. Administrators can provide support
and a belief that the recommendations for change and growth are achievable through hard
work. The focus is to develop a school wide belief that the school organization can
develop practices that will help all students be successful (Murphy & Dweck, 2010;
Blackwell, 2012). In sum, the school administrator must believe in the importance of

49
organizational learning. Organizational learning showed the potential for influencing the
individuals in the organization. Openness to learning and a growth school mindset were
shown to promote perseverance in the face of challenges. An openness to change is
necessary during the development of organizational practices that produce improvement.
Schools with teachers and administrators that believe in the potential to grow and learn
were shown to promote student academic mindsets and behaviors. As concisely
expressed by Robert Fritz, the researcher who developed the concept of mastery learning,
“It’s not what the vision is, it’s what the vision does” (Senge, 1990, p. 142; Fulmer &
Keys, 1998, p. 35).
Connection of Mindset and Organizational Learning
The overarching goal for organizational learning in schools is to help faculty help
students in the process of a continuous construction, and reconstruction, of their
individual conceptual frameworks; and to develop attitudes that result in their ability to
become effective lifelong learners, who can meet the challenges of a rapidly changing,
globally influenced, 21st Century world (Novak, 2002; Dweck, 2012). The challenge for
school leaders has always been to develop learning organization cultures that demonstrate
a belief that all students can grow and learn. This belief, called growth mindset, was
identified as one of Five Categories of Non-Cognitive Factors that are key to developing
student agency, was demonstrated in behaviors of academic engagement, and was
required to build effective and accurate knowledge structures in students. Under the
educational philosophy of individual academic mindset, an individual’s belief that he can
50
improve and grow through his own efforts influenced the individual’s subsequent choices
and behaviors. For example, individuals who expressed a belief that traits are fixed
tended to helplessness in the face of challenges, or failure, and chose to withdraw. In
contrast, individuals who expressed a belief that traits are malleable tended to choose
mastery goals and persisted in the face of challenges. The belief that one’s actions will
be successful to obtain a future goal is included in the concept of a successful learning
organizations, in the Five Non-Cognitive Factors of learning, and in learning theory
models that explain the importance of student agency, or control, over the learning
process as key to meaningful learning (Bandura, 2001; Novak, 2002; Farrington et al.,
2012; Spencer-Rogers et al., 2012). Senge’s description of mental models as “deeply
ingrained assumptions, generalizations, or even pictures and images that influence how
we understand the world and how we take action” corresponds to the definition of
mindset (Senge, 1990, p. 8). Dweck’s (1986) research showed an individual’s mindset
influenced perceptions in a cognitive-social processing model of experiential learning
similar to Senge’s ladder of inference. In contrast, mental models incorporate the
individuals’ cognitive mental frameworks, not just the individuals’ beliefs about their
traits, as described in the concept of individual mindset (Senge, 2000, p. 68). A
discussion follows situating these organizational and individual learning concepts within
the school context and their implications to student academic behaviors.
In review, the process of knowledge construction occurs through the creation of
cognitive meaning from a change in an individual or organization’s knowledge
foundation occurring within a “bounded context” that includes emotional connotations

51
(Novak, 2002, p. 551). Woike (2008) explained, “[m]otives interact with situations to
modulate the encoding and the later retrieval of the autobiographical knowledge that
forms specific autobiographical memories” (p. 101). Similarly, Vygotsky (1962)
emphasized the influence of the physical and social context in meaning construction and
the co-creation of meaning within a zone of proximal development such that individual
knowledge structures must be substantially similar in order to promote an affect that is
open to learning from others. This is demonstrated in the fact individuals learn best in
collaborative environments with their peers. Collaborative learning is an important
concept in mindset research. Growth mindsets were shown effective because they
increased openness to new information, willingness to collaborate, student choice to
pursue academic goals, and persistence toward goals in the face of setbacks (John-Steiner
& Mahn, 1996; Murphy & Dweck, 2010; Dweck, 2012; Lindle, 2014).
Improvements in research models of the learning process are not physical
products. Individual mental constructs are mental models developed through the
meaning making process within the researchers themselves as they participate in the
research context. In order to promote organizational learning in schools and to create
schools as learning organizations the research information must be provided in a relevant
context to faculty who are supported in their own choice to engage the information and
create their idiosyncratic understanding within their unique school context. This includes
the importance of recognizing the need for faculty and student participation in setting
school level goals and aligning them with individual goals. A review of the relevant
research in mindset theory, learning organizations, organizational learning, and the
52
processes of meaningful learning suggested research-based practices transfer to school
organizations when the administrator engages the faculty through dialog. This process
can begin by surveying the staff in a supportive environment to identify specific needs in
their particular school. Then the administrator can provide sufficient resources,
demonstrate her own belief in the ability of each staff and student to grow and learn, and
provide opportunities to practice the new learning. The review of the literature suggested
that this process would result in increased openness to change, faculty choice to engage
new information, and meaningful individual and organizational learning (Hoy et al.,
1991; Senge, 2000; Tarter & Hoy, 2004; Sergiovanni, 2009). Farrington et al., 2012;
Dweck, 2012). One-time interventions, new curriculum purchases, external mandates,
directives through hierarchal authority, and annual, normative, cognitive assessments do
not change collective consciousness, nor do they promote individual engagement in
meaningful learning (Popkewitz, 1998; Evans, 2013; Behizadeh, 2014). As Novak
(2002) wrote:
We know in principle why learning…is so ineffectual for most students and how to remediate this problem. What we lack is the commitment, resources, and the political strategies to change schooling…that requires uncompromising commitment to meaningful learning for all students in all subjects” (p. 568). In sum, a review of the literature suggests that developing schools as learning
organizations would result in improved faculty and student learning behaviors. This
requires the recognition of the importance of the psychosocial non-cognitive factors in
learning such as those proposed through the development of growth mindset school
cultures (Mindset Works, 2008-2012a-c).

53
Connections of Mindset and School Climate. The difference between the processes of acquiring rote
versus meaningful learning becomes the leverage point in creating learning organizations
and organizational learning that results in improved outcomes for all students. Arguably,
rote learning has met the expectations of normative outcome-based assessment tools such
as end of year accountability assessments. Situated learning has provided the advantage
of expedience in standardization of time and product-based pedagogies, curriculum, and
learning-product definitions. In additions, there may be a reciprocal benefit of
expedience resulting from the purity of rote learning because situated learning does not
involve integration into the conceptual framework of the individual. By avoiding the
engagement of individual learning differences in the learning environment, the school can
avoid the individual ways student create their understandings. This so-called benefit can
be suggested as a major contributor to the continuation of a school system that falls short
of consistent meaningful learning for all students (Novak, 2002, p. 553).
One conclusion from this review of the literature might suggest that the methods
of evaluation currently used focus more on the products of learning than the
individualistic process of learning. This may be one reason individual learning in schools
has been shown to be non-transferrable rather than meaningful. As Novak explained,
“Thus much of this “high achievement” is really fraudulent or inauthentic” (p. 549).
Behizadeh (2014) emphasized the importance of the assessment model in driving
organizational behaviors, “for instruction to change, assessment needs to change” (p.
133). Novak (2002) wrote that innate intelligence, maturity levels, and quality of
instruction, though significant, are not the most important factors in learning. He

54
recommended developing pedagogies to help students build meaning structures, allowing
for the idiosyncratic process of learning, providing the appropriate framework, strategies,
tools, and recognition of the emotional disposition of individual learners (p. 555). He
explained, “[o]nly the learner can choose to learn meaningfully” (p. 557). Creating
learning organizations requires promoting faculty and student agency, or their choice to
engage new learning using an internal locus of control. These concepts are consistent
with school mindset research, organizational learning, and the Five Categories of Non-
Cognitive Factors describing psychosocial factors of learning such as academic mindset
(Hoy et al., 1991; Senge, 1990; Tarter & Hoy, 2004; Dweck, 1989; Dweck et al., 1995;
Burnette et al., 2013). Following is a discussion of how mindset beliefs can help in
school transition success.
The Effects of Mindset on
School Transition Success. One hypothesis resulting from the research review is
that rote learning, or situated learning, in schools would result in reduced success during
periods of student transitions from elementary to middle school or from middle school to
high school, etc. In fact, mindset researchers have performed studies and revealed this to
be the case. Research showed that individual students who expressed fixed mindset
beliefs showed reduced achievement over the transition periods from elementary to
middle school and middle school to high school (Heyman & Dweck, 1998). Blackwell,
Trzesniewsk & Dweck (2007) performed a two-year study that followed hundreds of
New York City students during their transition to seventh-grade. The students took self-
report surveys at the beginning of the study identifying whether they held fixed or growth
55
beliefs. The results of the study showed students with growth mindsets outperformed
those with fixed mindsets. Students with growth mindsets showed resilience in the face
of challenges; believed their hard work and effort would improve their outcomes; and
took more learning risks. Students with fixed mindsets showed less resilience, were
fearful about taking risks and not looking smart, and said they would consider cheating
on tests. Teacher behaviors were also shown to influence student mindset. Several
replication studies agreed that 9th grade faculty demonstrated reduced monitoring, lack of
feedback to students, and had insufficient skills to address the psychosocial factors
needed to develop student engagement in school. The results were students’ withdrawal
behaviors during the transition year including: increased student absenteeism; incomplete
homework; and failure to study (Harrington et al., 2012; Dweck, 2002). Researchers
reported faculty used behaviorist strategies to motivate disengaged students:
From the faculty perspective, frustration with student behavior is compounded by their own lack of effective strategies to turn things around. Under deteriorating conditions, the threat of failure too often becomes the faculty’ primary tool for addressing students’ poor academic behaviors (p. 64).
In contrast, faculty with a growth mindset were shown more likely to see growth
potential in struggling students, to support persistence to mastery, to praise students for
effort rather than traits, and to support school change efforts (Mueller & Dweck, 1998;
Bryant, 2013; Yeager, Johnson, Spitzer, Trzesniewski, Powers & Dweck, 2014). These
studies revealed the benefits of applying growth mindset theory to develop growth
mindset cultures in schools resulting in improved psychosocial skills in faculty and a
belief all students can grow and learn. Faculty with growth mindset behaviors promoted

56
students with academic mindsets who were more likely to use effective academic
behaviors and to persevere through school transitions (Dweck, 1989; Hong et al., 2000;
Novak, 2002; Maurer et al., 2003). Additionally, researchers reported students developed
a fixed mindset prior to dropping out of STEM majors in college or leaving school all
together (Thornton & Mcentee, 1995; Dai & Cromley, 2014). This is consistent with the
previous discussion supporting the use of psychosocial factors, such as mindset, that
develop student agency and student choice to engage and persistent toward goals
(Farrington et al., 2012). Recommendations include focusing interventions at the school
level, teaching faculty the use of psychosocial skills that support student engagement, and
including growth mindset factors in school improvements. Mindset interventions
recognize the importance of identifying the unique individual and school needs in context
providing information at the time the need is presented. Figure 2 shows a chart
comparing and contrasting the concepts discussed so far with growth school mindset.
Measurement of School Mindset
The concept of a growth school mindset culture became increasingly relevant in
the education literature as researchers sought to identify variables of a model that
promoted faculty working together to help all students grow and learn. Following is a
discussion of the rationale for developing an instrument to measure mindset, the
theoretical foundation of the measurement variables, development of the instruments, and
a summary of the discussion.

57
Rationale for Growth Mindset Scale
There are potential benefits to school leaders to have evidence that the WMSM
instrument is a reliable and valid scale. Administrators that use the WMSM scale to
measures teachers’ perceptions of their school culture want to know if the instrument is
reliable. Administrators need good data to know how to help improve their schools
(Kouzes & Posner, 2002; Novak, 2002; Collinson & Cook, 2007; Senge, 1990; National
Policy Board for Educational Administration, 2008; Farrington et al., 2012). This study
proposed to explore the factor structure of the WMSM scale. The literature on school
mindset suggested five key features of a growth school mindset purported and
operationalized in the WMSM scale of shared leadership, open communication
professional collaboration, clear goals and a plan, and support for students and belief in
growth (Blackwell, 2012). These variables were shown in a review of the literature on
learning organizations and organizational learning to exert influences on school
outcomes.
To ensure all students receive an equitable education takes more than an equitable
distribution of physical resources such as facilities and funding. The beliefs of
administrators, faculty, and students have been shown to have a significant impact on
student achievement. A key goal of researchers in the area of psychosocial factors is to
develop instruments that operationalize, quantify, and measure beliefs that increase
student motivation and academic behaviors. The federal government has provided
exemptions to several school districts from the strictly cognitive-based accountability
testing required under the No Child Left Behind Act to collaborate with researchers.

Figure 2. Comparable and contrasting concepts with mindset constructs.
58

59
Together they seek to explore the potential for using psychosocial markers, such as
school mindset, to indicate school improvement and student growth. For example, the
California Office to Reform Education focuses on the social-emotional factors that
promote improved student learning; including using growth mindset as a competency
indicator for school improvement (Rotter, 1954; Bandura, 1977, 1986, 2001; Weiner,
1986; Dweck & Leggett, 1988; Esses et al., 1993; Taylor & Gollwitzer, 1995; Farrington
et al., 2012, p. 9; Briceno, 2013; Adams, 2014).
Conceptual Framework for the What’s My School Mindset? Scale
The factor structure of the WMSM scale, the current instrument for use in
quantifying a school's growth mindset culture, has not been statistically explored and
analyzed (S. Blackwell, personal communication, October 14, 2014 and March 31, 2015).
Researchers using the scale may have problems with the internal validity of empirical
studies (Hopko, 2003). Administrators using the instrument as a tool to identify attitudes
of their school faculty that are malleable to influence will not be certain of the underlying
factors they are measuring. The results could be errors in the interpretation of the data
when trying to make changes that improve their school cultures. A valid and reliable
instrument with a good fit to the data could help educational leaders understand the
unique variables within their school that could be influenced to develop positive
engagement in school-wide change. Administrators could promote participation in
innovative and challenging organizational goals using accurate variables of faculty
perceptions. Establishing a parsimonious model of the factor structure of the WMSM

60
scale could add to the body of mindset research and help identify recommendations for
future study (Hoy et al., 1991; Kearney, 2007; Murphy & Dweck, 2010; Farrington et al.,
2012; Delaney et al., 2015). Mindset culture variables of shared leadership, open
communication, professional collaboration, clear goals and a plan, and support for
students and belief in growth compared closely with the core features of cognitive social
theory's agentic action, the ability to plan (intentionality), goal setting (forethought),
motivation and self-monitoring (self-reactiveness), and efficacy (self-reflectiveness)
(Bandura, 2001). Additionally, Bandura explained collective efficacy was the direct
result of transactional interactions of the individual with the group. This reciprocal
learning explained the group's ability to choose challenging goals, work together toward
the goal, and achieve higher outcomes. Bandura wrote that an individual's beliefs,
attributes, interests and competencies influence how one behaves and the choices one
makes. Cognitive social theory and individual agency were shown to be a foundational
theoretical base for mindset research (Hoy, Tarter & Kottkamp, 1991; Tarter & Hoy,
2004; Senge, 1990; Blackwell, 2012; Farrington et al., 2012).
Instrument Development Blackwell, Trzesniewski & Dweck (2011) were motivated to develop ways to
help faculty help students develop growth mindsets. They researched, developed, and co-
founded the Mindset Works, Inc. research and educational training organization. Mindset
Works, Inc. develops tools and instruments that assess individual, classroom, and school
level mindset. Mindset Works, Inc. uses the results of these self-report surveys to
recommend "motivational intervention curriculum" (Mindset Works, 2008-2012b, para.

61
1-11). Mindset Works, Inc. is in partnership with the U.S. Department of Education
Institute of Education Sciences, Scholastic, Vision Network, Character Education
Partnership, EdCaliber, St. John's University, and Meta-LUCID, an organization that
provides training to companies to foster a growth mindset culture in the workplace.
Individual Mindset Scale. The first instrument developed to measure mindset
constructs was the individual entity and incremental questionnaire to identify whether an
individual believed his intelligence was fixed or whether it could be changed through
one's effort. The initial surveys used have been validated and shown reliable (Dweck,
1999). Appendix B & C show two versions including the short form Intelligence – Fixed
or Growth which has a Cronbach’s alpha = .90; M = 3.31; SD = 1.04. Dweck, Chiu &
Hong (1995) provide a construct validation study for the instrument.
Academic Mindset Scale. The academic mindset survey developed by PERTS
(2014a) can be found on their website. The Likert-style survey instrument has 15-items
and asks students to rate their beliefs on a scale from 1 - 6 about four factors shown to
profoundly influence student learning. The factors include intelligence mindsets, sense
of belonging, task relevance, and individual self-efficacy. Appendix D contains the
questions of the scale. This scale is currently being given the 10,000 students in an
ongoing study of the influence of academic mindsets on student transition success
(PERTS, 2014b).
Group Mindset Scale. Mindset Works, Inc. developed a group level survey
instrument to measure the level of faculty participation in leadership and decision-making
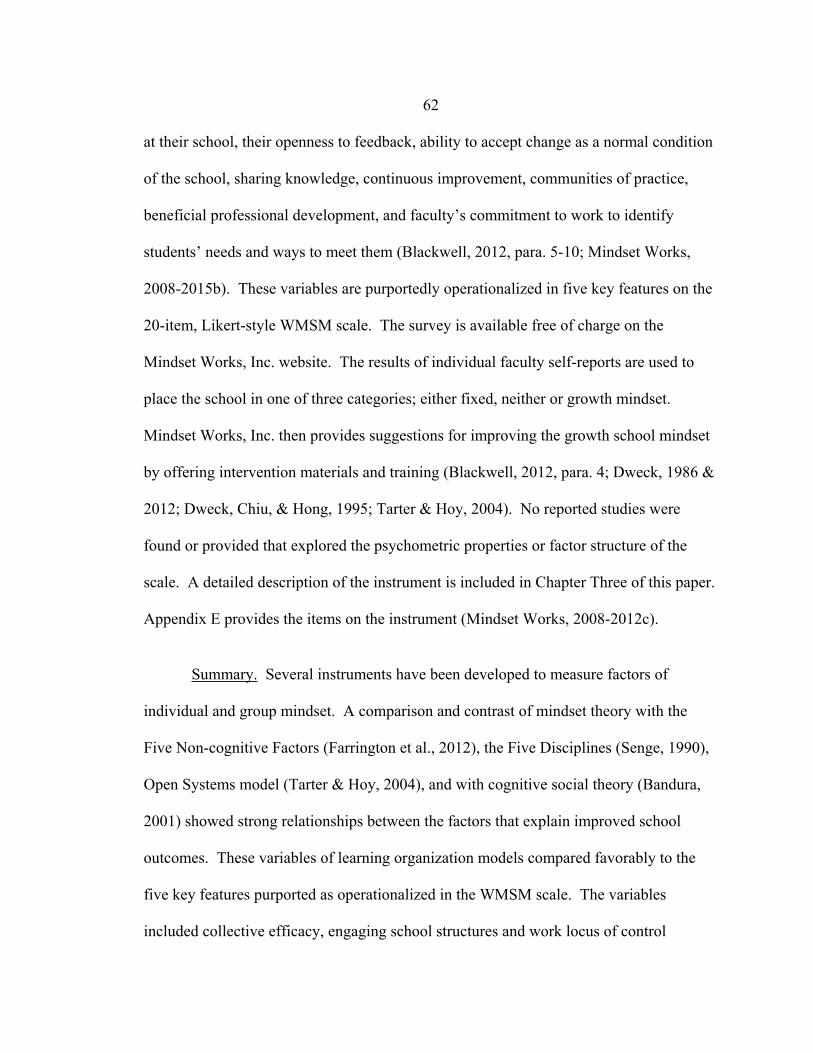
62
at their school, their openness to feedback, ability to accept change as a normal condition
of the school, sharing knowledge, continuous improvement, communities of practice,
beneficial professional development, and faculty’s commitment to work to identify
students’ needs and ways to meet them (Blackwell, 2012, para. 5-10; Mindset Works,
2008-2015b). These variables are purportedly operationalized in five key features on the
20-item, Likert-style WMSM scale. The survey is available free of charge on the
Mindset Works, Inc. website. The results of individual faculty self-reports are used to
place the school in one of three categories; either fixed, neither or growth mindset.
Mindset Works, Inc. then provides suggestions for improving the growth school mindset
by offering intervention materials and training (Blackwell, 2012, para. 4; Dweck, 1986 &
2012; Dweck, Chiu, & Hong, 1995; Tarter & Hoy, 2004). No reported studies were
found or provided that explored the psychometric properties or factor structure of the
scale. A detailed description of the instrument is included in Chapter Three of this paper.
Appendix E provides the items on the instrument (Mindset Works, 2008-2012c).
Summary. Several instruments have been developed to measure factors of
individual and group mindset. A comparison and contrast of mindset theory with the
Five Non-cognitive Factors (Farrington et al., 2012), the Five Disciplines (Senge, 1990),
Open Systems model (Tarter & Hoy, 2004), and with cognitive social theory (Bandura,
2001) showed strong relationships between the factors that explain improved school
outcomes. These variables of learning organization models compared favorably to the
five key features purported as operationalized in the WMSM scale. The variables
included collective efficacy, engaging school structures and work locus of control
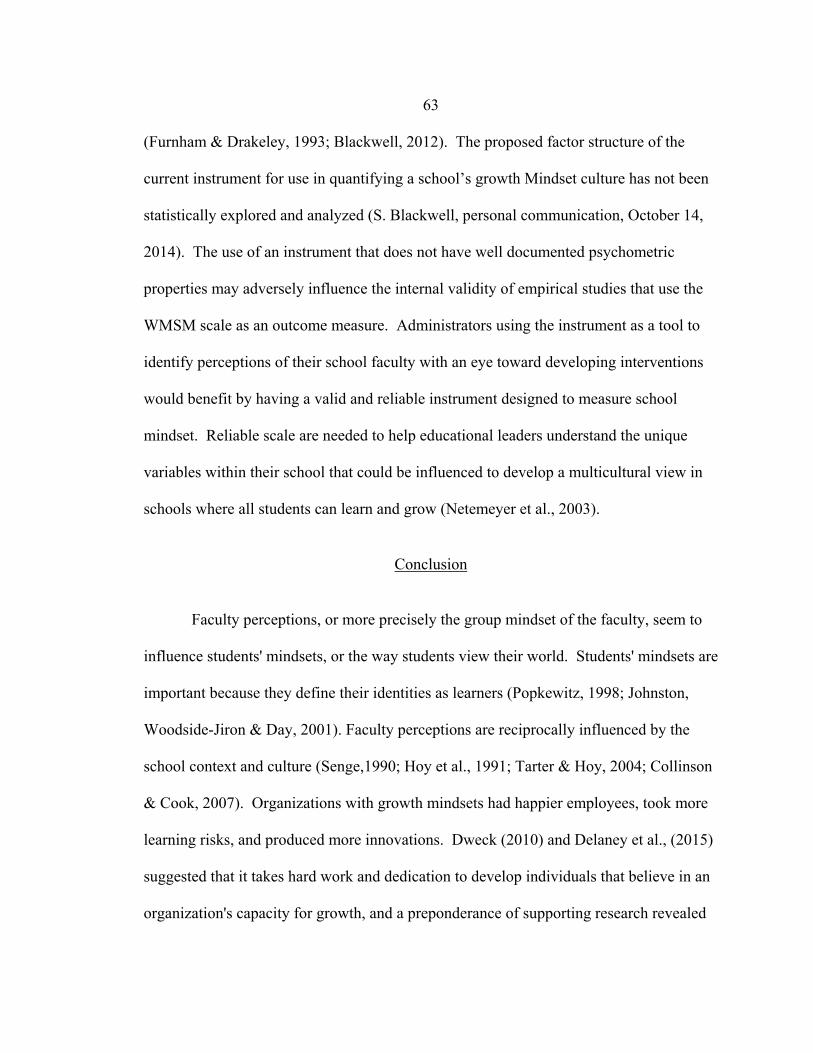
63
(Furnham & Drakeley, 1993; Blackwell, 2012). The proposed factor structure of the
current instrument for use in quantifying a school’s growth Mindset culture has not been
statistically explored and analyzed (S. Blackwell, personal communication, October 14,
2014). The use of an instrument that does not have well documented psychometric
properties may adversely influence the internal validity of empirical studies that use the
WMSM scale as an outcome measure. Administrators using the instrument as a tool to
identify perceptions of their school faculty with an eye toward developing interventions
would benefit by having a valid and reliable instrument designed to measure school
mindset. Reliable scale are needed to help educational leaders understand the unique
variables within their school that could be influenced to develop a multicultural view in
schools where all students can learn and grow (Netemeyer et al., 2003).
Conclusion
Faculty perceptions, or more precisely the group mindset of the faculty, seem to
influence students' mindsets, or the way students view their world. Students' mindsets are
important because they define their identities as learners (Popkewitz, 1998; Johnston,
Woodside-Jiron & Day, 2001). Faculty perceptions are reciprocally influenced by the
school context and culture (Senge,1990; Hoy et al., 1991; Tarter & Hoy, 2004; Collinson
& Cook, 2007). Organizations with growth mindsets had happier employees, took more
learning risks, and produced more innovations. Dweck (2010) and Delaney et al., (2015)
suggested that it takes hard work and dedication to develop individuals that believe in an
organization's capacity for growth, and a preponderance of supporting research revealed
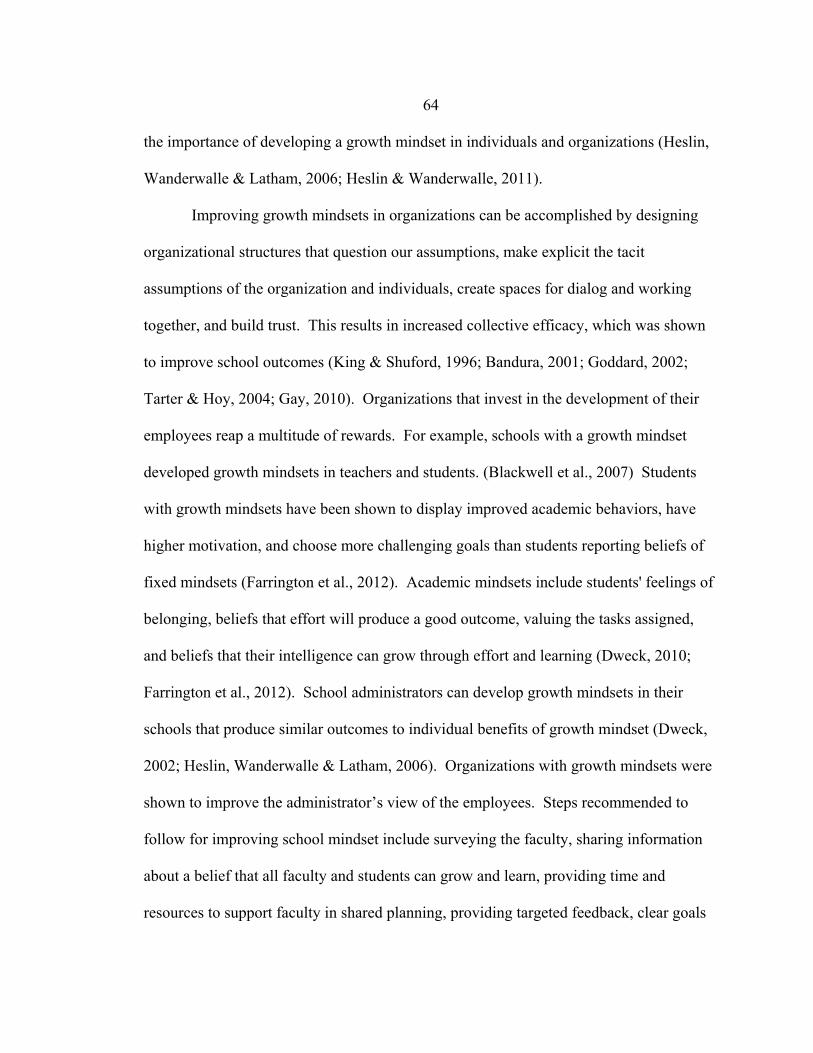
64
the importance of developing a growth mindset in individuals and organizations (Heslin,
Wanderwalle & Latham, 2006; Heslin & Wanderwalle, 2011).
Improving growth mindsets in organizations can be accomplished by designing
organizational structures that question our assumptions, make explicit the tacit
assumptions of the organization and individuals, create spaces for dialog and working
together, and build trust. This results in increased collective efficacy, which was shown
to improve school outcomes (King & Shuford, 1996; Bandura, 2001; Goddard, 2002;
Tarter & Hoy, 2004; Gay, 2010). Organizations that invest in the development of their
employees reap a multitude of rewards. For example, schools with a growth mindset
developed growth mindsets in teachers and students. (Blackwell et al., 2007) Students
with growth mindsets have been shown to display improved academic behaviors, have
higher motivation, and choose more challenging goals than students reporting beliefs of
fixed mindsets (Farrington et al., 2012). Academic mindsets include students' feelings of
belonging, beliefs that effort will produce a good outcome, valuing the tasks assigned,
and beliefs that their intelligence can grow through effort and learning (Dweck, 2010;
Farrington et al., 2012). School administrators can develop growth mindsets in their
schools that produce similar outcomes to individual benefits of growth mindset (Dweck,
2002; Heslin, Wanderwalle & Latham, 2006). Organizations with growth mindsets were
shown to improve the administrator’s view of the employees. Steps recommended to
follow for improving school mindset include surveying the faculty, sharing information
about a belief that all faculty and students can grow and learn, providing time and
resources to support faculty in shared planning, providing targeted feedback, clear goals
65
and expectations, realistic tasks, targeted professional development, opportunities for
shared leadership, and support for faculty in the belief that they can help all students learn
and grow (Blackwell, 2012; Delaney et al., 2015). Research-based evidence is necessary
to challenge assumptions and to provide sound reasons for new practices (Sanders &
Sheldon, 2009; Marzano, Waters & McNulty, 2005; Sergiovanni, 2014). A valid and
reliable instrument designed to measure school mindset could help educational leaders
understand the unique psychosocial variables within their school culture. The appropriate
use of data and the interpretation of results from the WMSM scale may help to shape a
school's organization's potential to grow and learn (Hoy et al., 1991; Kearney, 2007; Gay,
2010). Results from this research study may provide baseline and intervention impact
information needed to gauge implementation efforts for school change.

66
CHAPTER THREE
METHODS
This chapter provides a description of the methods used to answer the overarching
research question of this study and includes: the research question, problem, purpose,
data collection, sample, survey instruments, and the statistical data analysis procedures
used. This study explored the factor structure of the WMSM scale. According to
Mindset Works, Inc., the WMSM instrument assesses five underlying dimensions called
key features of a growth school mindset and include shared leadership, open
communication, professional collaboration, clear goals and a plan, and support for
students and belief in growth (Blackwell, 2012).
Research Problem
The factor structure of the WMSM scale has not undergone empirical studies that
provide validity evidence to support the underlying constructs proposed by Mindset
Works, Inc. (S. Rodriguez, personal communication, March 31, 2015). Not
understanding the underlying constructs representing the WMSM scale may lead to
misinterpretation of results, leading to faulty conclusions by those using the results from
the instrument with the intent to understand and shape a school’s organizational culture.
Lack of information about the WMSM’s psychometric properties also presents a problem
for the internal validity of empirical studies that use this instrument in research to
investigate school culture factors that contribute to or explain improved school outcomes
67
(Hoy et al., 1991; Hopko, 2003; Kearney, 2007; Murphy & Dweck, 2010; Farrington et
al., 2012; Delaney et al., 2015).
Purpose of the Study
The purpose of this study was to explore the factor structure of the WMSM scale.
Developing an understanding of the underlying factor structure of the WMSM scale
could provide a better understanding of the variables that may be useful to school
administrators as they interpret WMSM results in their efforts to develop improved
cultures at their schools. Although the What’s My School Mindset? (WMSM) scale
developed by Dweck and associates (Blackwell, Trzesniewski & Dweck, 2011) has been
used to assess a mindset culture in schools, there have been no empirical studies
providing validity evidence for its use (S. Rodriguez, personal communication, March 31,
2015.
Research Question
The overarching research question of this study was “What is the underlying
factor structure of the WMSM scale?” The hypothesis proposed for the basis of the
analyses performed in this study included:
H0 = The five-factor structure of shared leadership, open communication, professional
collaboration, clear goals and school plan, and support for and belief that all students can
grow and learn does not represent the underlying factor structure for the WMSM scale.

68
Ha = The five-factor structure of shared leadership, open communication, professional
collaboration, clear goals and school plan, and support for and belief that all students can
grow and learn does represent the underlying factor structure for the WMSM scale.
Research Design
This quantitative study explored the factor structure of the WMSM scale using
self-report responses on Likert-style survey by faculty and administrators. The items
developed for the WMSM scale were designed to operationalize five key underlying
latent features, or constructs related to school culture (Blackwell, 2012). Survey data was
collected from faculty and administrators in a stratified random sample of Montana PK-
12 (n =25) schools using a combination of paper and pencil surveys (n=281) administered
in staff meetings, or distributed to staff in teacher mailboxes, and by staff and
administrator participation using the online Qualtrics survey administration tool (n=30)
during the 2014/2015 school year. All identifying data was coded for confidentiality.
Survey data was kept for analysis on a secure computer and paper and pencil responses
were kept in a locked office. Survey data was destroyed when the research study was
completed. The data results of the survey were statistically analyzed using SPSS and
Lisrel path analysis software.
Participants and Sample
The participants included in this study were faculty and administrators (n=311)
from a random, stratified sample of 25 PK-12 schools across Montana. The minimum
69
participant response number determined for an adequate sample size to perform
exploratory factor analysis for the study was set at 200 and was derived from a review of
the literature on determining sample size for instrument development research, calculated
from a 10:1 ratio of responses to survey item (Guilford, 1954; Zhao, 2009). This number
was also used as the minimum total for calculating the distribution of responses from four
category sizes of schools developed for the stratified random sample discussed in the
previous paragraph. The sample was selected from 417 school districts in Montana
including 10,153 teachers and 142,349 students during the 2014/2015 school year.
Approximately 82% of Montana schools are identified as qualifying for Title I status
(Faul, Erdfelder, Buchner & Lang, 2009; Meador, 2015). Urban, suburban, and rural
classifications were considered to coincide with size categories of the schools for the
purposes of this study (Office of the Federal Register, 2012). An approximate stratified
random sample of Montana schools by class size was selected through random number
generator to obtain a representative sample. A calculation was performed to obtain a
sample that would closely represent the distribution of public schools across Montana by
school size. First, categories were created for the different school sizes that
approximated the classification by size categories designated for high school athletic
participation in the state. A list of school districts in Montana was obtained from the
Montana High School Association that also included their student population from OPI
enrollment figures for fall of the 2013/2014 school year. Second, the percentage of total
student population was calculated for each category. Third, the percentage was used to
calculate the minimum number of faculty responses from each category needed for a
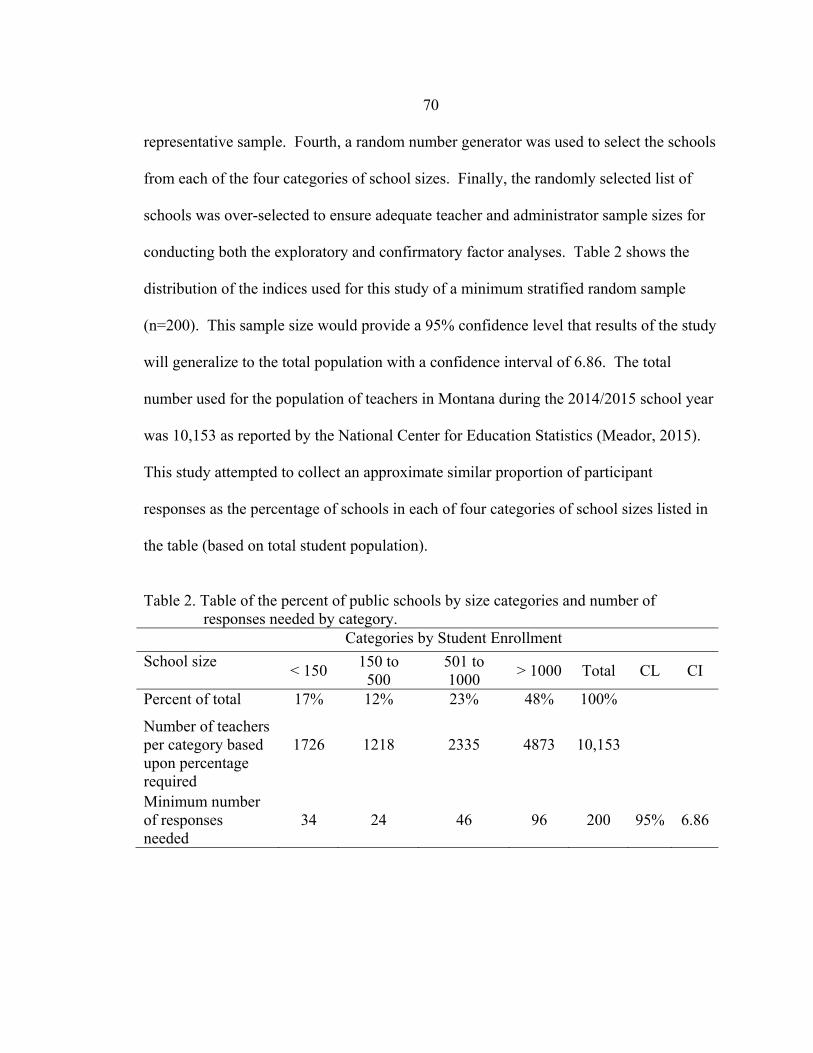
70
representative sample. Fourth, a random number generator was used to select the schools
from each of the four categories of school sizes. Finally, the randomly selected list of
schools was over-selected to ensure adequate teacher and administrator sample sizes for
conducting both the exploratory and confirmatory factor analyses. Table 2 shows the
distribution of the indices used for this study of a minimum stratified random sample
(n=200). This sample size would provide a 95% confidence level that results of the study
will generalize to the total population with a confidence interval of 6.86. The total
number used for the population of teachers in Montana during the 2014/2015 school year
was 10,153 as reported by the National Center for Education Statistics (Meador, 2015).
This study attempted to collect an approximate similar proportion of participant
responses as the percentage of schools in each of four categories of school sizes listed in
the table (based on total student population).
Table 2. Table of the percent of public schools by size categories and number of
responses needed by category. Categories by Student Enrollment School size < 150 150 to
500 501 to 1000 > 1000 Total CL CI
Percent of total 17% 12% 23% 48% 100% Number of teachers per category based upon percentage required
1726 1218 2335 4873 10,153
Minimum number of responses needed
34 24 46 96 200 95% 6.86
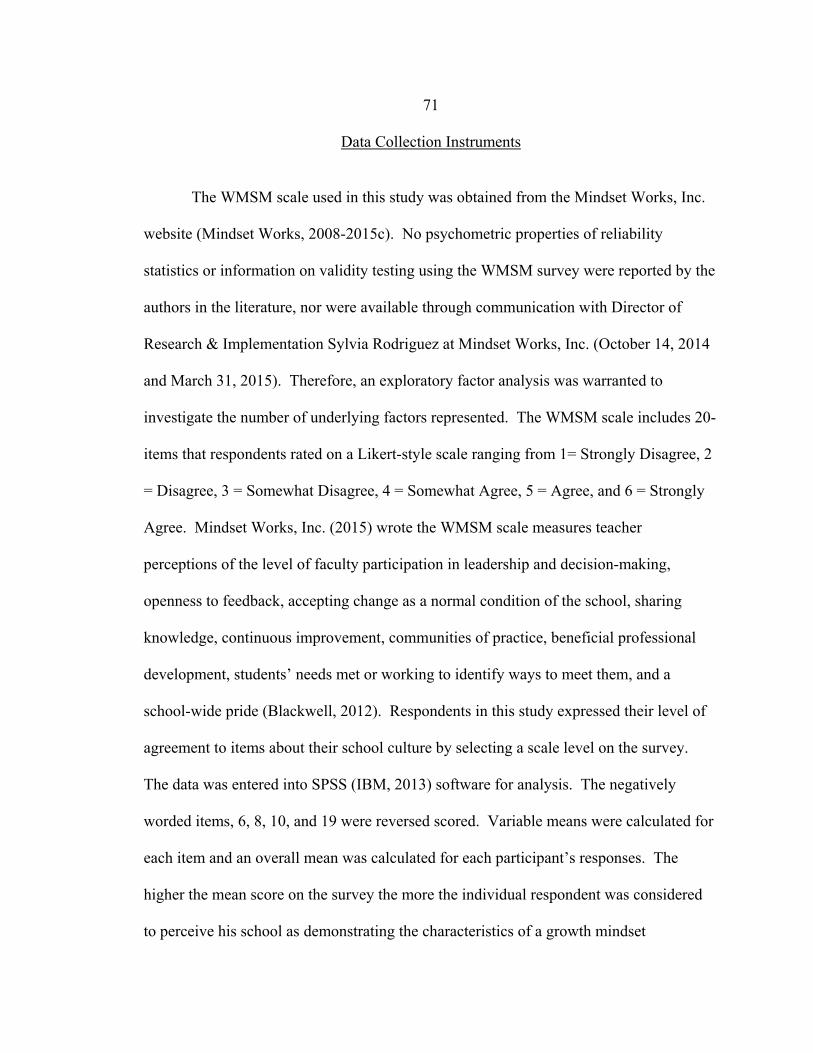
71
Data Collection Instruments
The WMSM scale used in this study was obtained from the Mindset Works, Inc.
website (Mindset Works, 2008-2015c). No psychometric properties of reliability
statistics or information on validity testing using the WMSM survey were reported by the
authors in the literature, nor were available through communication with Director of
Research & Implementation Sylvia Rodriguez at Mindset Works, Inc. (October 14, 2014
and March 31, 2015). Therefore, an exploratory factor analysis was warranted to
investigate the number of underlying factors represented. The WMSM scale includes 20-
items that respondents rated on a Likert-style scale ranging from 1= Strongly Disagree, 2
= Disagree, 3 = Somewhat Disagree, 4 = Somewhat Agree, 5 = Agree, and 6 = Strongly
Agree. Mindset Works, Inc. (2015) wrote the WMSM scale measures teacher
perceptions of the level of faculty participation in leadership and decision-making,
openness to feedback, accepting change as a normal condition of the school, sharing
knowledge, continuous improvement, communities of practice, beneficial professional
development, students’ needs met or working to identify ways to meet them, and a
school-wide pride (Blackwell, 2012). Respondents in this study expressed their level of
agreement to items about their school culture by selecting a scale level on the survey.
The data was entered into SPSS (IBM, 2013) software for analysis. The negatively
worded items, 6, 8, 10, and 19 were reversed scored. Variable means were calculated for
each item and an overall mean was calculated for each participant’s responses. The
higher the mean score on the survey the more the individual respondent was considered
to perceive his school as demonstrating the characteristics of a growth mindset
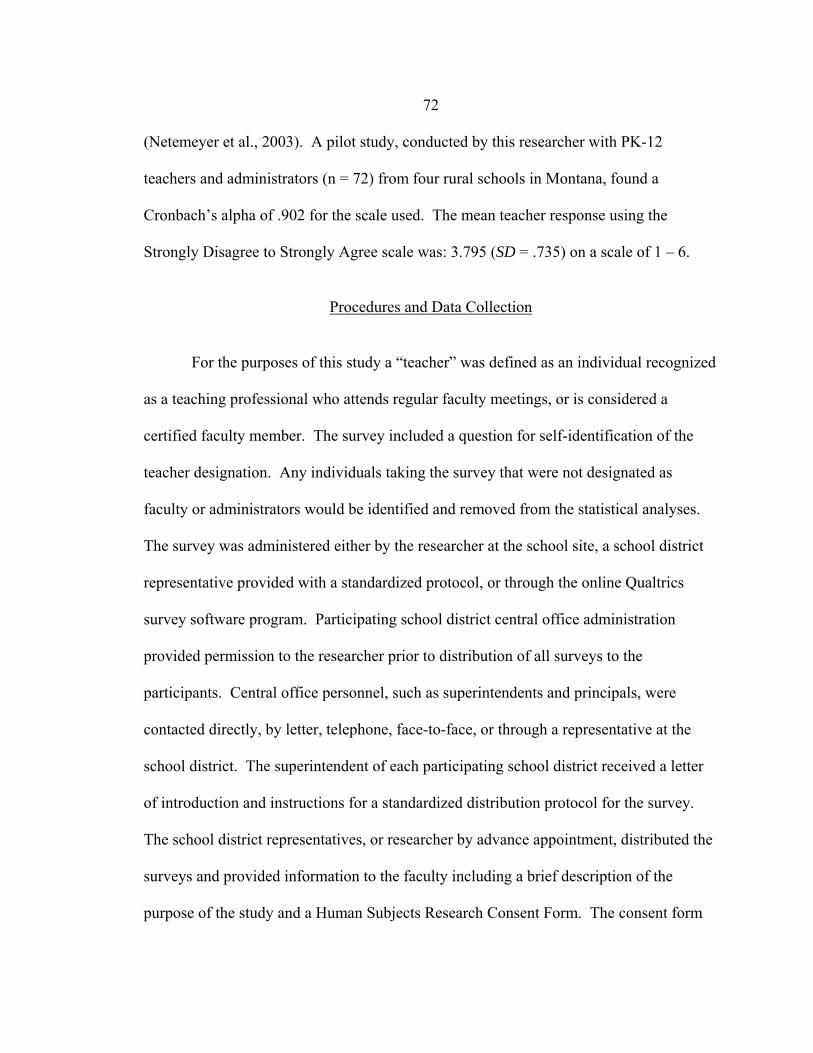
72
(Netemeyer et al., 2003). A pilot study, conducted by this researcher with PK-12
teachers and administrators (n = 72) from four rural schools in Montana, found a
Cronbach’s alpha of .902 for the scale used. The mean teacher response using the
Strongly Disagree to Strongly Agree scale was: 3.795 (SD = .735) on a scale of 1 – 6.
Procedures and Data Collection
For the purposes of this study a “teacher” was defined as an individual recognized
as a teaching professional who attends regular faculty meetings, or is considered a
certified faculty member. The survey included a question for self-identification of the
teacher designation. Any individuals taking the survey that were not designated as
faculty or administrators would be identified and removed from the statistical analyses.
The survey was administered either by the researcher at the school site, a school district
representative provided with a standardized protocol, or through the online Qualtrics
survey software program. Participating school district central office administration
provided permission to the researcher prior to distribution of all surveys to the
participants. Central office personnel, such as superintendents and principals, were
contacted directly, by letter, telephone, face-to-face, or through a representative at the
school district. The superintendent of each participating school district received a letter
of introduction and instructions for a standardized distribution protocol for the survey.
The school district representatives, or researcher by advance appointment, distributed the
surveys and provided information to the faculty including a brief description of the
purpose of the study and a Human Subjects Research Consent Form. The consent form

73
included information for participants that described the purpose of the survey, the
voluntary nature of the study and the right to not participate, to not answer any questions
and that they could stop at any time, the length of the survey, and the confidentiality of
their responses. Subjects received a signed copy of the consent form and were required
to confirm their understanding and willingness to participate in the study by signing and
returning a copy of the consent form, or by clicking the “Next” button on the Qualtrix
online survey. All participant responses were maintained confidential and were
destroyed at the completion of this study.
Data Analysis
The WMSM survey responses collected were entered into the statistical software
program SPSS version 22 for analyses (IBM, 2013). The results of the exploratory factor
analysis were used to propose a model that could be tested against an estimated
population model using with a confirmatory factor analysis using Lisrel 8.72 analytic
software (Joreskog & Sorbom, 2001). The following section includes a brief description
of the statistical analyses performed in this study. Before performing exploratory
statistical procedures, the data collected was examined to evaluate the assumptions of
normality, multicollinearity, and for missing data. The purpose of these analyses was to
identify issues with the data that may adversely impact the exploratory and confirmatory
factor analysis, (Jöreskog, 1999; Netemeyer et al., 2003; Gravetter & Wallnau, 2014).
The methodology used in this study included multiple steps. Theory, logic, and a review
of peer-reviewed articles guided the decisions made in the choice of statistical analytical

74
procedures used. The research study found no prior research data, or study, which
previously tested the underlying factor structure of the WMSM scale. Therefore, no a
priori model was tested in this study. Data analyses for this study consisted of three
phases described following.
Evaluating Assumptions
The first phase was to analyze the normality of data distributions,
multicollinearity among variables, and to calculate descriptive statistics. Statistical
analysis was performed on the results of the WMSM survey sample data to determine if
the data fit a normal distribution and was considered reasonable for parametric analyses.
Means and standard deviations for each variable were also explored for outliers that may
influence the usefulness of the data for drawing valid conclusions that generalize to the
population from which the data was drawn (Tabachnick & Fidell, 2001; Lüdtke,
Robitzsch, Trautwein & Kunter, 2009). Tests for symmetry (skewness) and flatness
(kurtosis) were tested using indices for acceptable limits of ±2 (Trochim & Donnelly,
2006; Field, 2000 & 2009; Gravetter & Wallnau, 2014). All items tested were within
acceptable limits and a further discussion is provided in a future section of this paper.
Representativeness
Next, a cross-tabs statistical analysis was performed to explore the
interdependence of the demographic data variables and to identify statistically significant
differences (p < .05). One-way ANOVA analysis was used to compare the category
means and determine any significant differences between groups that may affect the
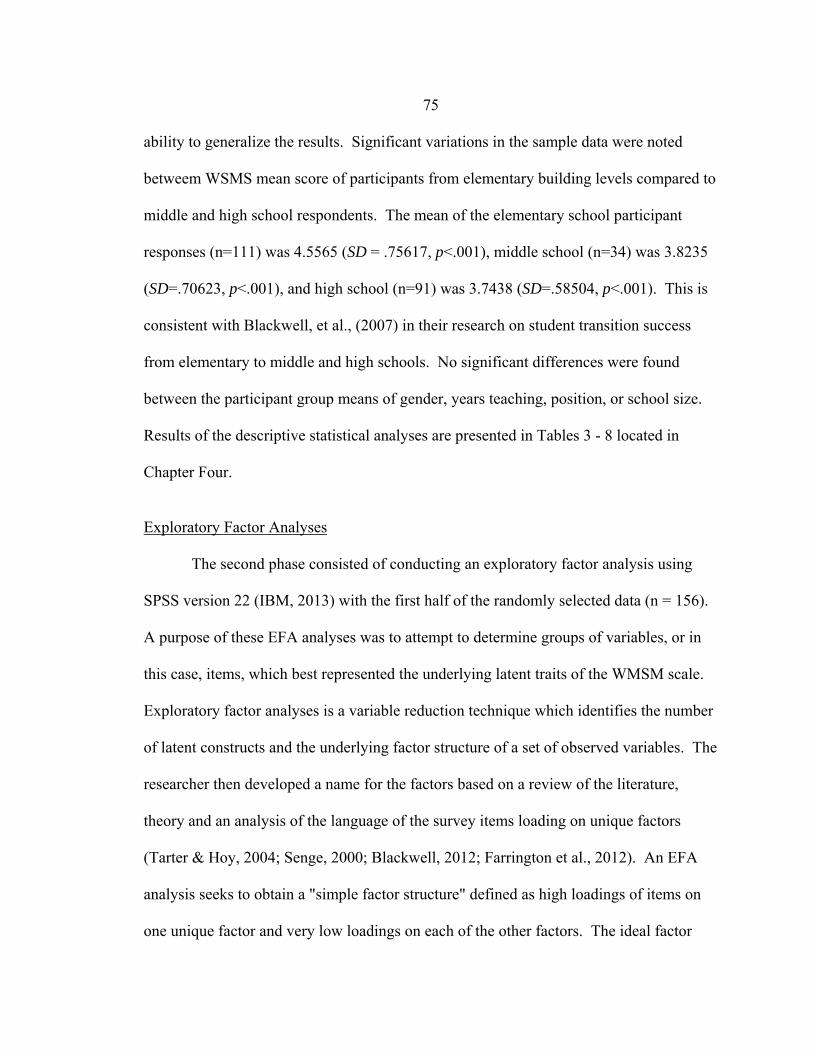
75
ability to generalize the results. Significant variations in the sample data were noted
betweem WSMS mean score of participants from elementary building levels compared to
middle and high school respondents. The mean of the elementary school participant
responses (n=111) was 4.5565 (SD = .75617, p<.001), middle school (n=34) was 3.8235
(SD=.70623, p<.001), and high school (n=91) was 3.7438 (SD=.58504, p<.001). This is
consistent with Blackwell, et al., (2007) in their research on student transition success
from elementary to middle and high schools. No significant differences were found
between the participant group means of gender, years teaching, position, or school size.
Results of the descriptive statistical analyses are presented in Tables 3 - 8 located in
Chapter Four.
Exploratory Factor Analyses
The second phase consisted of conducting an exploratory factor analysis using
SPSS version 22 (IBM, 2013) with the first half of the randomly selected data (n = 156).
A purpose of these EFA analyses was to attempt to determine groups of variables, or in
this case, items, which best represented the underlying latent traits of the WMSM scale.
Exploratory factor analyses is a variable reduction technique which identifies the number
of latent constructs and the underlying factor structure of a set of observed variables. The
researcher then developed a name for the factors based on a review of the literature,
theory and an analysis of the language of the survey items loading on unique factors
(Tarter & Hoy, 2004; Senge, 2000; Blackwell, 2012; Farrington et al., 2012). An EFA
analysis seeks to obtain a "simple factor structure" defined as high loadings of items on
one unique factor and very low loadings on each of the other factors. The ideal factor
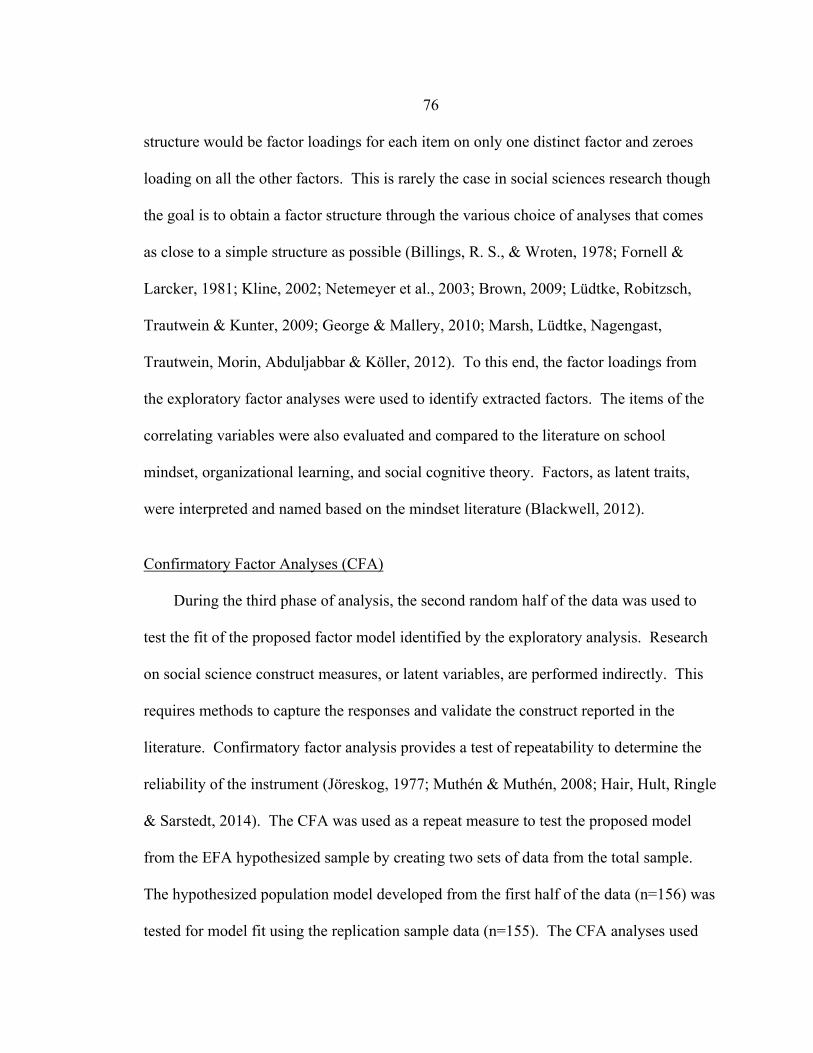
76
structure would be factor loadings for each item on only one distinct factor and zeroes
loading on all the other factors. This is rarely the case in social sciences research though
the goal is to obtain a factor structure through the various choice of analyses that comes
as close to a simple structure as possible (Billings, R. S., & Wroten, 1978; Fornell &
Larcker, 1981; Kline, 2002; Netemeyer et al., 2003; Brown, 2009; Lüdtke, Robitzsch,
Trautwein & Kunter, 2009; George & Mallery, 2010; Marsh, Lüdtke, Nagengast,
Trautwein, Morin, Abduljabbar & Köller, 2012). To this end, the factor loadings from
the exploratory factor analyses were used to identify extracted factors. The items of the
correlating variables were also evaluated and compared to the literature on school
mindset, organizational learning, and social cognitive theory. Factors, as latent traits,
were interpreted and named based on the mindset literature (Blackwell, 2012).
Confirmatory Factor Analyses (CFA)
During the third phase of analysis, the second random half of the data was used to
test the fit of the proposed factor model identified by the exploratory analysis. Research
on social science construct measures, or latent variables, are performed indirectly. This
requires methods to capture the responses and validate the construct reported in the
literature. Confirmatory factor analysis provides a test of repeatability to determine the
reliability of the instrument (Jöreskog, 1977; Muthén & Muthén, 2008; Hair, Hult, Ringle
& Sarstedt, 2014). The CFA was used as a repeat measure to test the proposed model
from the EFA hypothesized sample by creating two sets of data from the total sample.
The hypothesized population model developed from the first half of the data (n=156) was
tested for model fit using the replication sample data (n=155). The CFA analyses used
77
explored the relationship between the observed variables and the underlying latent
variables. A model is developed by the researcher from a combination of theory, results
of the statistical analysis of the research data and tested statistically. A variety of
indicators were used as measures to determine if the model was a good “fit” to evaluate
the model proposed from the EFA phase. Results from the CFA were used to test the null
hypothesis:
H0 = The five-factor structure of shared leadership, open communication, professional
collaboration, clear goals and school plan, and support for and belief that all students can
grow and learn does not represent the underlying factor structure for the WMSM scale.
Summary
The purpose of this study was to explore and test the model fit of the factor
structure of the WMSM scale identified by the exploratory analysis. A stratified random
sample was drawn from the PK-12 public schools in Montana in the effort to ensure a
representative sample of the population tested. The distribution of school sizes in
Montana by student population was the basis for determining the minimum number of
responses per school category. A review of the literature revealed no previous
exploratory factor analyses performed on the WMSM scale and no a priori model of the
factor structure was provided for analysis except for the untested five key feature model
proposed by Mindset, Inc. (S. Rodriguez, personal communication, March 31, 2015). A
null hypothesis was developed as a basis for the analyses of the proposed model
developed from the EFA and tested using CFA. The results of the analyses were
78
compared to the five key features of a growth school mindset culture including shared
leadership, open communication, professional collaboration, clear goals and a plan, and
support for students and belief in growth (Blackwell, 2012).
The methods to collect data for analysis and for developing conclusions and
recommendations from the research included the distribution of WMSM surveys to
faculty in a stratified random sample of PK-12 public schools in Montana, including a
calculated minimum adequate sample size for the analyses of 200 faculty and
administrator responses (Guilford, 1954, p. 533). Besides the previously described
instruments, a demographic questionnaire and Human Research Subject Consent Form
was provided to participants. Instructions included on the survey explained to
participants that the survey was voluntary and that measures were taken to ensure the
confidentiality of their responses. SPSS 22 (IBM, 2013) and Lisrel 8.72 (Joreskog &
Sorbom, 2001) statistical analytic software programs were used to perform a variety of
multivariate analyses and to develop conclusions based on the results. Results from the
exploratory and confirmatory analysis were compared to the five key features of a growth
school culture that were identified from a review of the literature (Netemeyer, 2003;
Blackwell, 2012).
79
CHAPTER FOUR
RESULTS
The purpose of this chapter is to provide the results of the empirical and statistical
analyses of the factor structure of the WMSM scale. For this study, the following three
phases of analyses were used. First, the data was analyzed for normality and
multicollinearity among variables by exploring the item descriptive statistics. Next, an
exploratory factor analysis using maximum likelihood extraction methods was used with
an oblique rotation to explore the underlying factor structure of the WMSM scale
(Michael & Hunka, 1960; Brown, 2009). A proposed factor structure model was
developed from the exploratory factor analysis results based on logic, theory, and a
review of the results of the analysis. The hypothesized model was tested using
confirmatory factor analysis with a replication sample (n=155) to determine its fit to a
hypothesized population model. Confirmatory factor analysis (CFA) was used to test the
model fit using fit indices recommended by the literature. Results from the CFA were
used as the basis to accept or reject the null hypothesis proposed in this study as the basis
for the analyses. Following is a summary of the results.
Answering the Research Question and Testing the Null Hypothesis
The results of the EFA were used to develop a proposed factor structure model
that was tested on the replication sample using the CFA. The results of the test were used
as the basis to answer to the overarching question of this research study, “What is the

80
underlying factor structure of the WMSM scale?” and to accept or reject the null
hypothesis in favor of the alternative.
The following hypothesis was used as a basis for the analyses in this study:
H0 = The five-factor structure of shared leadership, open communication, professional
collaboration, clear goals and school plan, and support for and belief that all students can
grow and learn does not represent the underlying factor structure for the WMSM scale.
Ha = The five-factor structure of shared leadership, open communication, professional
collaboration, clear goals and school plan, and support for and belief that all students can
grow and learn does represent the underlying factor structure for the WMSM scale.
Data Analysis
The first step in the analysis was a screening of the responses for participants not
included in the unit of analysis (teachers and administrators in PK-12 schools) and for
missing data (Hair, Black, Babin & Anderson, 2010). Three respondents failed to
complete the mindset survey, and these responses were eliminated. Several noncertified
individuals were identified and their responses removed from the data set.
Approximately 12 cases had missing data points. The missing data appeared randomly
and an imputation approach was used to complete the data set including entering the
mean of the item value. After entering the data and adjusting for missing data the total
data sample, including a stratified random selection of respondents from the four
different school categories, included 311 usable, complete survey responses. This
included 290 certified professionals designating themselves as faculty attending regular

81
meetings (93.4%) and 21 administrators (6.6%). The total sample would be divided into
two groups for the exploratory and confirmatory factor analyses including an exploratory
(n=156) and a replication sample (n=155). The next step in the exploration of the data
sample was to determine the distribution characteristics of the total sample.
Evaluating Assumptions
Correlation analyses were conducted on the faculty self-report sample data. The
data were found to meet the criteria for normality. Means and standard deviations for
each variable were calculated and explored for outliers that may influence the usefulness
of the data for drawing valid conclusions that generalize to the population from which the
data was drawn. Tests for symmetry (skewness) and flatness (kurtosis) for each survey
item and demographic data fell within acceptable limits of ±2 (Field, 2000 & 2009;
Netemeyer et al., 2003). These results were consistent with the literature on Mindset that
explained characteristics of mindset were independent of demographic influence (Dweck,
2008, 2010 & 2012). A cross-tabs statistical analysis was performed to explore the
interdependence of the demographic data variables and to identify statistically significant
differences (p < .05). One-way ANOVA tests were run on the categorical data to
determine any significant differences between the means of the categories that might
affect the generalizability of the results to the population studied. Differences were
identified and expected between groups by position. Administrators represented a
separate category and the number appropriately represented a smaller proportion than
faculty in the school population. The elementary building level mean was shown
significantly different than the middle and high school means. The sample data were
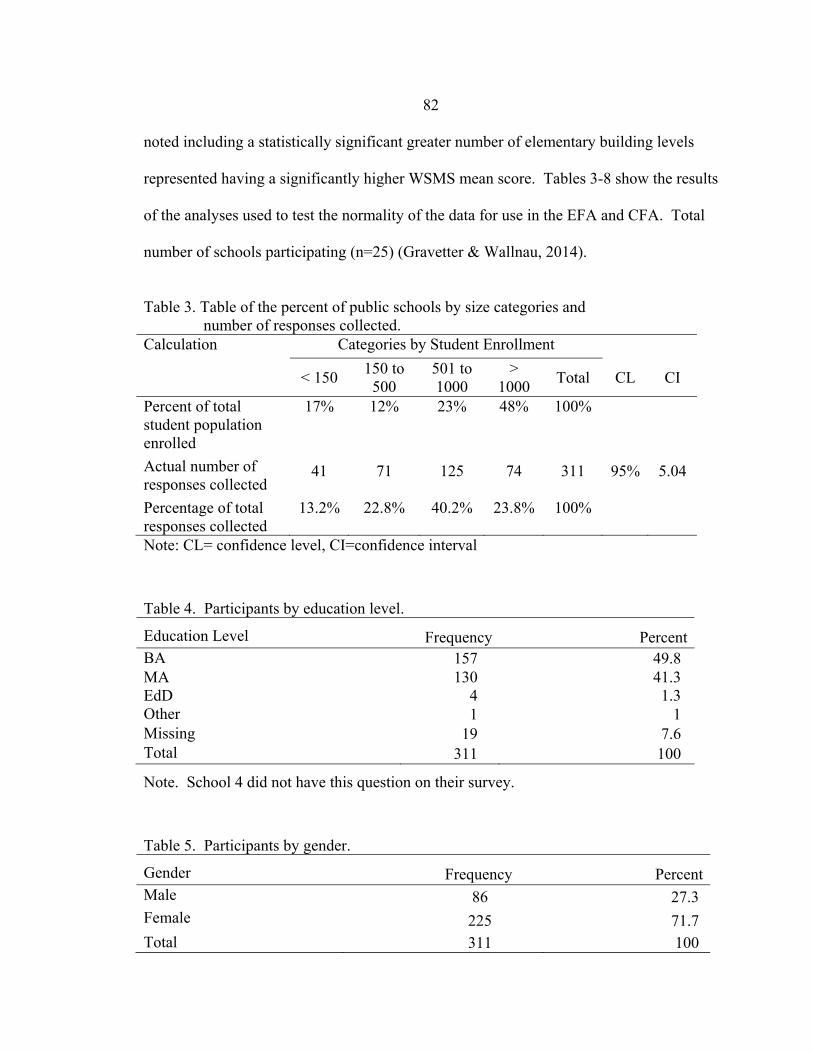
82
noted including a statistically significant greater number of elementary building levels
represented having a significantly higher WSMS mean score. Tables 3-8 show the results
of the analyses used to test the normality of the data for use in the EFA and CFA. Total
number of schools participating (n=25) (Gravetter & Wallnau, 2014).
Table 3. Table of the percent of public schools by size categories and
number of responses collected. Calculation Categories by Student Enrollment < 150 150 to
500 501 to 1000
> 1000 Total CL CI
Percent of total student population enrolled
17% 12% 23% 48% 100%
Actual number of responses collected
41 71 125 74 311 95% 5.04
Percentage of total responses collected
13.2% 22.8% 40.2% 23.8% 100%
Note: CL= confidence level, CI=confidence interval
Table 4. Participants by education level.
Education Level Frequency PercentBA 157 49.8 MA 130 41.3 EdD 4 1.3 Other 1 1 Missing 19 7.6 Total 311 100
Note. School 4 did not have this question on their survey.
Table 5. Participants by gender.
Gender Frequency PercentMale 86 27.3 Female 225 71.7 Total 311 100
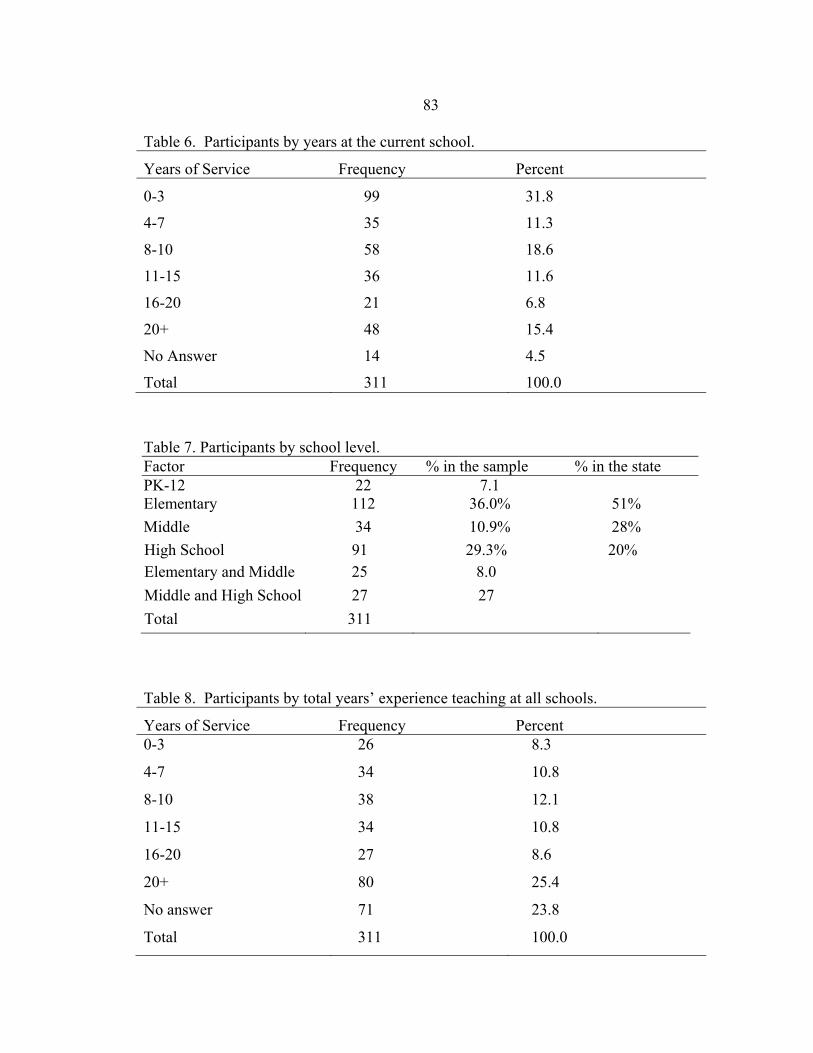
83
Table 6. Participants by years at the current school.
Years of Service Frequency Percent
0-3 99 31.8
4-7 35 11.3
8-10
11-15
16-20
20+
No Answer
Total
58
36
21
48
14
311
18.6
11.6
6.8
15.4
4.5
100.0
Table 7. Participants by school level. Factor Frequency % in the sample % in the state PK-12 22 7.1 Elementary 112 36.0% 51% Middle 34 10.9% 28% High School 91 29.3% 20% Elementary and Middle 25 8.0 Middle and High School 27 27 Total 311 Table 8. Participants by total years’ experience teaching at all schools.
Years of Service Frequency Percent 0-3 26 8.3
4-7 34 10.8
8-10
11-15
16-20
20+
No answer
Total
38
34
27
80
71
311
12.1
10.8
8.6
25.4
23.8
100.0
84
Sample Size
Three hundred and thirty participants returned the WMSM instrument and 311
surveys were found complete and useable for the study. The sample of participants
represented a 95% confidence level and a ±5.04 confidence interval for the population of
teachers and administrators completing the WMSM instrument. A review of the
literature revealed the following indices for sample sizes used in instrument development
research. These indices were used in this study to evaluate the number of responses and
its adequacy for the analyses: adequate=200, good=300, great=500, and excellent=1000.
The ratio of responses to items on the survey was determined as follows: adequate=10:1,
good=20:1 (Guilford, 1954; Zhao, 2009). Field (2000) stated sufficient sample size for a
survey validation should include between 10-15 responses for each item on the scale. For
this study, the minimum sample size to perform the analyses was considered 200
participants. Review of the literature suggested an adequate sample size for instrument
validation is dependent upon the characteristics of the data such as magnitude and
frequency of the factor loadings. Strong and frequent factor loadings require lower
sample sizes (Costello & Osborne, 2007). The n=311 was a good sample size for a
maximum likelihood exploratory factor analysis.
Criteria for Conducting the Exploratory Analysis The method of maximum likelihood requires a large sample size. The sample size
collected in this study was evaluated as a “good to a great size” for obtaining reliable
factor extractions from the exploratory factor analyses (n=311) (Field, 2000). Results of
85
an initial EFA for the data collected from participants in 25 schools provided a Kaiser-
Meyer-Olkin (KMO) test of sampling adequacy. For this study a KMO >.5 was the
indicator that the sample size obtained was adequate for the statistical analyses. The
SPSS software KMO resulted in a value of .908 and was considered excellent for
continuing with the EFA. Values above .80 are sought (Netemeyer et al., 2003). Another
predetermined indicator of sample size adequacy was all diagonal elements of covariance
(indication of heterogeneity between factors) and correlation (indicates factors strength
by association) on the anti-image matrix were >.5 (Introduction to SAS, 2015). A review
of the tables revealed diagonal elements ranged from a low of .458 to .957. Only one,
item 19 was just slightly below the range. A decision was made to consider this
acceptable to continue the analysis. Finally, Bartlett’s Test of Sphericity was used to test
a null hypothesis established for this analyses that the data would produce an identity
matrix; meaning the factors were all perfectly related and therefore not suitable for an
EFA. The indices for an acceptable Bartlett’s value for this study is p < .0001. The
Bartlett’s value for the data set provided from the WMSM survey yielded
( ). The Bartlett's null hypothesis was rejected. The items of the
scale were considered sufficiently related, and the data set useful for performing an
exploratory factor analysis.
Criteria for Selecting the Number of Factors
After running the SPSS analytical software for the exploratory factor analysis
using maximum likelihood extraction method and oblique rotation, the magnitude and
χ1712 =1672, p < .0001
86
frequency of the factor loadings, number of eigenvalues with values ≥ 1.0, communalities
(M ≥.50), and a comparison of the extracted factors with their related items with the
theory was performed. Indices for good factors included frequencies of item loadings per
factor (≥ 3), magnitude of loadings on the factor (≥ .32), and low frequencies and low
value loadings of the item on each of the other factors (minimal cross-loadings for a
simple factor structure). An indices for this study is factor loadings of .80 ≤ item ≥ .32
(Gravetter & Wallnau, 2014; Field, 2000 & 2009; Brown, 2009; Albright & Park, 2009).
Test of Data Multicollinearity
Bartlett’s Test of Sphericity determinant was p < .0001. Bartlett’s tests the
hypothesis that the correlation matrix of the data is an identity matrix. The Bartlett’s test
revealed issues could result in interpretation of the factors due to multicollinearity.
Further analysis showed regression correlations between two factors were above the
normal limits of .32 to .80 (Cohen & Cohen, 2002). This means the factors had items
that contributed to more than one factor and would make it difficult to interpret the
unique contribution of each item to the factors. An overrepresented model can cause
multicollinearity. Omitting variables or adding different variables may help. The factor
structure pattern and the contribution of the factors to the total scale results are stable
even with multicollinearity. Only when attempting to determine the variation in the
influence of each predictor variable on the dependent variable, in this case WMSM mean
does multicollinearity need to be addressed. Various methods are available to reduce the
influence of multicollinearity in the data and are beyond the scope of this study (Guilford,
1954; Greene, 2000; Netemeyer et al., 2003).

87
Goodness of Fit
The Chi-squared value is an indicator used to test the hypothesis the individual
correlations from the matrix and the expected correlations would be significantly
different. A review of the residuals followed. Residuals are the calculated differences
between each correlation coefficient from the analysis and the anticipated coefficient. A
review of the residuals revealed < 20% of the items had residuals > .50 (13%) therefore
the next step in the analysis was to evaluate the significance of the Chi-squared
calculation. The indices for rejecting the null of good fit was p < .001. The Approximate
Chi-square=152.087, df=101, p<.001. Therefore the null was rejected and the data
considered sufficiently correlated and further analyses could proceed (Mulaik, James,
Van Alstine, Bennett, Lind & Stilwell, 1986; Field, 2000 & 2009).
Factor Rotation Method
Factors were rotated after the extraction method was performed in order to “make
the factors more interpretable” (Netemeyer et al., 2003; Brown, 2009). Two criteria were
used to select an oblique rotation for the exploratory factor analysis. First, orthogonal
rotation assumes uncorrelated factors. The factors in the school mindset survey were
anticipated, based upon theory, to be highly interrelated (Tarter & Hoy, 2004, p. 543);
therefore the appropriate choice would be an oblique rotation. Oblique rotation is used
when the factors are correlated. As Tarter & Hoy (2004) explained when describing the
directional form of hypotheses testing of social science psychosocial constructs in
schools, “all the relations are probably reciprocal,” and the variables “are [often]
compatible and reinforce each other,” (p. 543). The statistical calculation used allows for

88
a rotation at any angle to fit the data. Second, an oblique rotation can also produce an
orthogonal rotation but an orthogonal rotation does not produce an oblique result. The
goal of selecting a specific rotation method is the same as for the factor extraction
method, to obtain as close to a simple factor structure as possible. A simple factor
structure is one where individual items load on one factor with a covariance of ≥ .32 and
with loadings of ≤ ± .1 on all other factors. A complex variable cross loads with values
of ≥ .32 on two or more factors (Thurstone, 1947; Gorusch, 1983; Field, 2000 & 2009;
Brown, 2009). Oblique rotation allows for correlation between factors by using statistical
methods, including an arbitrary constant value, to change the rotational values.
According to Kim and Mueller (1978, p. 50) in Brown (2009), one benefit of this method
is the EFA is easier to interpret.
Exploratory Factor Analysis
The results of the exploratory factor analyses yielded four interpretable factors
accounting for a total of 53.894% of the variance. Nineteen of the 20 items from the
WMSM were retained. Item 20, “There is a culture of continuous improvement where
we are constantly looking at our current state and setting improvement goals year-to-
year” was dropped because it had correlations that exceeded acceptable limits (≥ .32) on
three factors. The covariance matrix was calculated using the SPSS analytical statistical
software and used as indicators of how strongly the items on the WMSM scale were
related to a particular factor. This study used the following indices for evaluating the
loadings for retaining a factor: minimum ≥ .32, good ≥.4, strong ≥.5, and if the value is
≥.90 there may be issues with multicollinearity (Costello & Osborne, 2005). Cronbach
89
alpha determinant used as a measure of how reliable the WMSM instrument was based
on a single use. The Cronbach alpha for the 19 retained items was .894 (n=156).
Estimates of internal reliability were calculated using the standard deviation of the entire
scale and the standard deviation of the individual items. Coefficient alphas were
calculated for each factor and used as the measure of their reliability.
Interpretation of the EFA
The observed variables of the scale were grouped according to extracted factors
and were compared to the literature and named (Costello & Osborne, 2008). Following is
the interpretation the four factors extracted by the EFA including a list of the four factors
extracted, names from the review of the Mindset Works, Inc. literature (Blackwell, 2012),
and the variables associated with the factors of the WMSM scale. Figure 3 shows the
proposed factor model from EFA for CFA statistical analyses.
Factor 1 - Shared Leadership included items 1-5 and contributed 40.851% to the
variation in the data structure. This factor’s Cronbach's alpha reliability was .911 and
revealed a strong factor with a good frequency of items loading. The absolute magnitude
of the loading values were strong (.761 to .828). The factor showed a near simple
structure in the data matrix with only three loadings slightly above the .10 maximum for a
simple structure of loadings on other factors (Brown, 2009). Item 2 loaded on factor 1
with the highest loading (.828) and above the indices of ≤ .80 indicating a potential from
some multicollinearity to occur between the factors.
90
Factor 2 - Open Communication and Peer Support (OCPS) included items 6, 8, 10
& 17, and explained 4.678% of the total variance in the items. Cronbach's alpha
reliability was good (.738). A review of the mindset literature showed 6, 8 and 10 were
included in mindset key feature 2 - open communication (Blackwell, 2012). Items 7 and
9 would have been expected to load on this factor as well. A review of the items 6, 8 and
10 descriptions included, "Staff members…support new…teachers," "We have exclusive
cliques or ‘camps’ within our faculty," and "Our teachers protect lessons from one
another," is consistent with the concept of being open to one another and willing to
provide peer support in an informal structure. The name peer support was added to this
factor name to distinguish the factor from structured professional collaboration as it
appeared to represent an informal culture of supportive peer relations (Mintzberg, 1983).
Factor 3 – Clear Goals & a Plan with Professional Collaboration (CGPC) included items 7, 9, 11-16 and contributed
2.923% to the overall variance in the items. The Cronbach's alpha was .866, indicating a
strong internal reliability for this factor. This factor included eight items, more than the
ideal five loading; so some items appear redundant and may not add value to the factor.
This factor represented all or parts of three separate key features discussed in the growth
mindset literature (Blackwell, 2012) including key feature 3 - clear goals and a plan
(items 11, 12 & 13), key feature 4 - professional collaboration (items 14, 15, & 16), and
key feature 2 - open communication (items 7 & 9). A review of the mindset literature
suggested items 11- 13 described administrator behaviors of providing teachers with clear
expectations and feedback including definitions of observable behaviors, “expectations
91
are made clear…in advance,” “Teachers receive clear feedback,” and “work together to
design goals and plans.” Items 14 – 16 reflect teacher behaviors of collaborating and
working together to design…professional development…targeted to…needs and goals,"
and "Time is provided …for coaching, co-planning, co-teaching." A review of the
wording in items 7 & 9 included, "Teachers…give each other feedback," and "Teachers
collaborate …to co-develop…work," is consistent with the description of items of
collaborating to develop clear plans and expectations within a formal hierarchy and
school structure. Item 9, regarding teacher behaviors of collaboration and sharing
lessons, loaded strongly on this factor (.448) and weakly on factor 2 - open
communication and peer support (.216). These loadings were above the maximum ≤ .10
for a simple factor structure. A review of the definition “Administrators communicate a
sincere belief that staff members can develop their teaching skills with practice and
feedback,” gave strong theoretical foundation for retaining the item in CGPC factor
(Blackwell, 2012).
Factor 4 - Student Support included items 18 & 19 and contributed 7.714% to the
overall variance in the items. The Cronbach's alpha reliability index for this factor was
.799, indicating a reliable structure. A weakness of this factor was that only two items
loaded, instead of the preferred five. An acceptable factor has a minimum of three items
loading at values ≥ .32 (Kline, 2002; Netemeyer et al, 2003; Brown, 2009). Item
loadings included strong values (.886 and .751 respectively). This factor demonstrated a
close to simple factor structure with item 18 having only two loadings slightly > .1 on
other factors.
92
A brief discussion is warranted about the correlations of the loadings in the
pattern matrix. As previously discussed a simple factor structure was sought. To this
end, a review of the correlation values revealed the following. Factor 1 was a near simple
factor structure with only items 1, 3 and 4 loading slightly above the ≤ .10 indices on
factor 4 - student support, 2- open communication and peer support, and 3 – clear goals &
a plan with professional collaboration respectively. Next factor 2 – open communication
and peer support shared some of the item variance with factor 3 and factor 1. Again the
correlations were so close to the ≤ .10 indices as to be considered possibly idiosyncratic.
Item 17 contributed .229 to factor 3 – clear goals & a plan with professional
collaboration. Item 17 had the highest mean next to item 20, which had been removed
due to multiple high cross loadings. Item 17’s standard deviation was low suggesting this
item was slightly biased in the positive direction and may have contributed some error
when interpreting the factors. The greatest departure from a simple factor structure in
this EFA however was factor 3 – clear goals & a plan with professional collaboration.
Three items, 11, 12, and 13 all shared variation in loadings with factor 1 – shared
leadership. Items 12 cross-loaded (.386) and item 13 was on the borderline of a cross
load (.308). Item 9 contributed variance to factors 2 – open communication and peer
support and 4 – student support in a small measure (.216 and .122 respectively). Overall
the item loadings can be anticipated to generate some multicollinearity between factor 1 –
shared leadership and factor 3 – clear goals & a plan with professional collaboration.
In sum, the four-factor structure extracted using EFA and oblique rotation (direct
oblimin) provided a good foundation for a proposed model that could be tested using
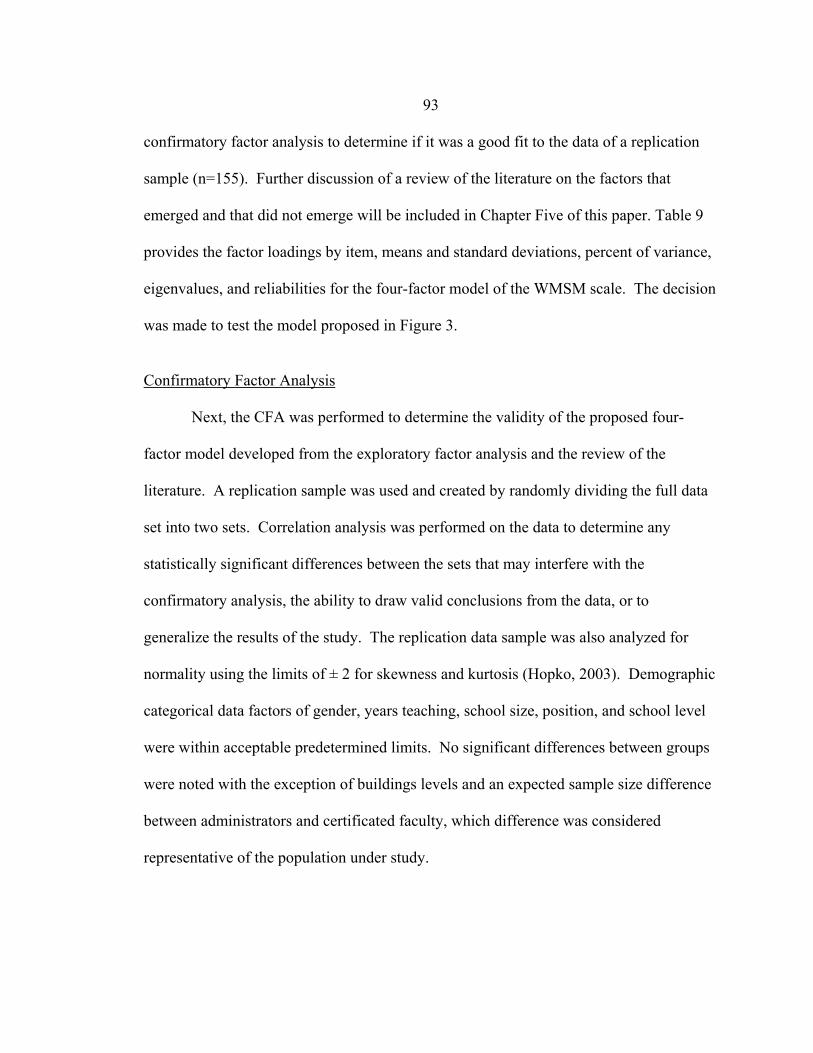
93
confirmatory factor analysis to determine if it was a good fit to the data of a replication
sample (n=155). Further discussion of a review of the literature on the factors that
emerged and that did not emerge will be included in Chapter Five of this paper. Table 9
provides the factor loadings by item, means and standard deviations, percent of variance,
eigenvalues, and reliabilities for the four-factor model of the WMSM scale. The decision
was made to test the model proposed in Figure 3.
Confirmatory Factor Analysis
Next, the CFA was performed to determine the validity of the proposed four-
factor model developed from the exploratory factor analysis and the review of the
literature. A replication sample was used and created by randomly dividing the full data
set into two sets. Correlation analysis was performed on the data to determine any
statistically significant differences between the sets that may interfere with the
confirmatory analysis, the ability to draw valid conclusions from the data, or to
generalize the results of the study. The replication data sample was also analyzed for
normality using the limits of ± 2 for skewness and kurtosis (Hopko, 2003). Demographic
categorical data factors of gender, years teaching, school size, position, and school level
were within acceptable predetermined limits. No significant differences between groups
were noted with the exception of buildings levels and an expected sample size difference
between administrators and certificated faculty, which difference was considered
representative of the population under study.
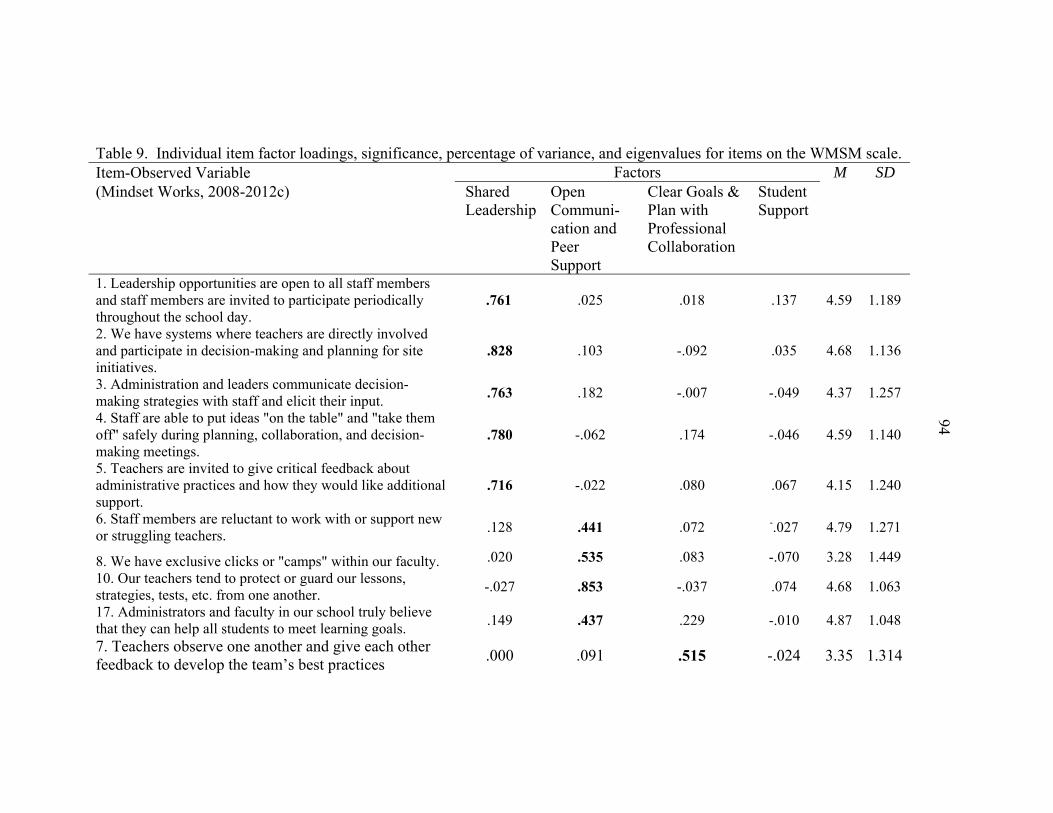
Table 9. Individual item factor loadings, significance, percentage of variance, and eigenvalues for items on the WMSM scale. Item-Observed Variable Factors M SD (Mindset Works, 2008-2012c) Shared
Leadership Open Communi-cation and Peer Support
Clear Goals & Plan with Professional Collaboration
Student Support
1. Leadership opportunities are open to all staff members and staff members are invited to participate periodically throughout the school day.
.761 .025 .018 .137 4.59 1.189
2. We have systems where teachers are directly involved and participate in decision-making and planning for site initiatives.
.828 .103 -.092 .035 4.68 1.136
3. Administration and leaders communicate decision-making strategies with staff and elicit their input. .763 .182 -.007 -.049 4.37 1.257
4. Staff are able to put ideas "on the table" and "take them off" safely during planning, collaboration, and decision-making meetings.
.780 -.062 .174 -.046 4.59 1.140 5. Teachers are invited to give critical feedback about administrative practices and how they would like additional support.
.716 -.022 .080 .067 4.15 1.240
6. Staff members are reluctant to work with or support new or struggling teachers. .128 .441 .072 -.027 4.79 1.271
8. We have exclusive clicks or "camps" within our faculty. .020 .535 .083 -.070 3.28 1.449 10. Our teachers tend to protect or guard our lessons, strategies, tests, etc. from one another. -.027 .853 -.037 .074 4.68 1.063
17. Administrators and faculty in our school truly believe that they can help all students to meet learning goals. .149 .437 .229 -.010 4.87 1.048
7. Teachers observe one another and give each other feedback to develop the team’s best practices .000 .091 .515 -.024 3.35 1.314
94

Table 9 continued Item-Observed Variable Factors M SD
Shared Leadership
Open Communi-cation and Peer Support
Clear Goals &Plan with Professional Collaboration
Student Support
9. Teachers collaborate several times a month, sharing or co-developing lessons, assessments, and student work.
.106 .216 .448 .122 4.21 1.481
11. Instructional expectations, standards, and evaluation protocols are made clear to faculty in advance .218 .204 .422 -.036 4.47 1.118
12. Administrators communicate a sincere belief that staff members can develop their teaching skills with practice and feedback.
.386 -.008 .460 -.128 4.75 1.036
13. Teachers receive clear feedback on an ongoing support for their practice outside of formal evaluations. .308 -.088 .611 -.079 4.26 1.264 14. Teachers, coaches, and administrators work together to design goals and plans for faculty development. .130 .024 .734 -.013 4.06 1.213
15. Teachers receive professional development that is targeted to their professional needs and goals. .062 .070 .535 -.123 4.19 1.207
16. Time is provided in the workday for coaching, co-planning/co-teaching, in structured professional learning.
-.079 .061 .475 .161 3.43 1.366
18. There are structures for faculty and administrators to share information and work together to meet the specific needs of individual students.
.099 -.125 .155 .886 3.67 1.704
19. There is an "us against them" feeling between teachers and students.
.032 .084 -.094 .751 3.99 1.599
20. There is a culture of continuous improvement where we are constantly looking at our current state and setting improvement goals year-to-year.
Would not run with EFA 4.95 .834
% Variance 40.851 4.678 2.923 7.714
Eigenvalue 8.208 1.311 1.156 1.769
Cronbach alpha .911 .738 .866 .799
95
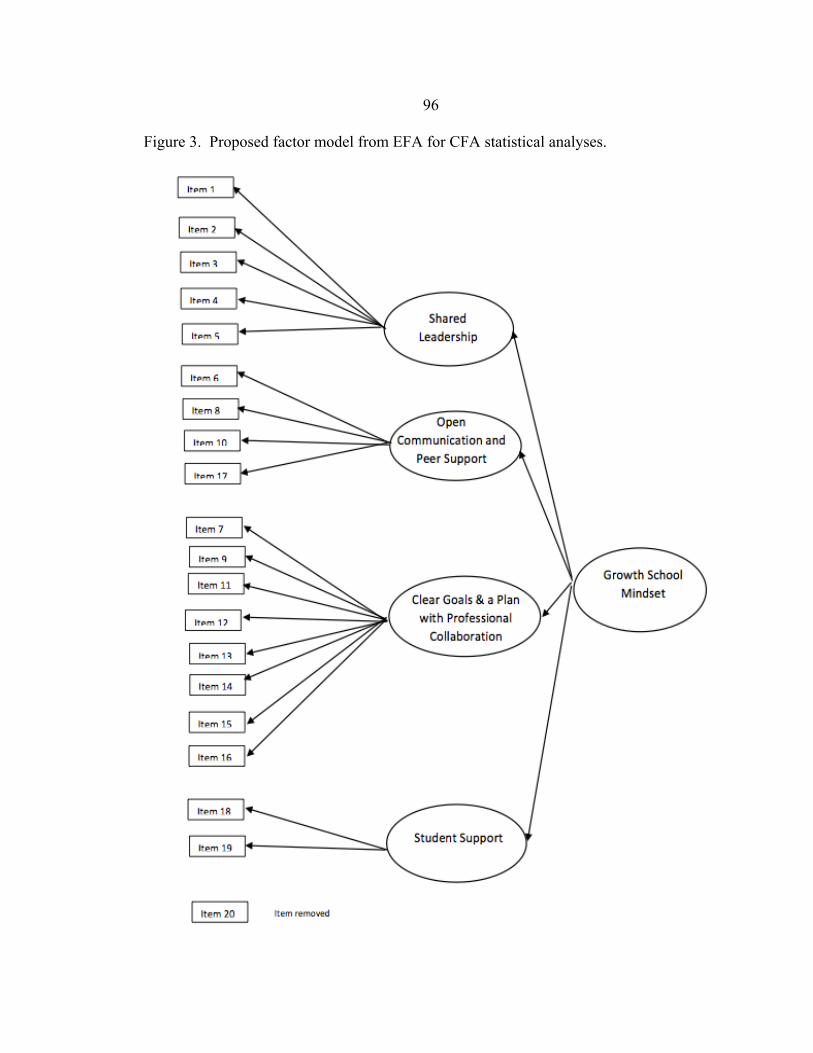
96
Figure 3. Proposed factor model from EFA for CFA statistical analyses.
97
Steps in the Analysis. First, the four-factor model, identified by the exploratory
analysis, was subjected to a confirmatory factor analysis using Lisrel 8.72 (Joreskog &
Sorbom, 2001) to test the closeness of fit to a hypothesized four-factor population model
using several indicators of model fit. The root mean square error of approximation
(RMSEA) is currently recognized as an informative index of fit because it provides a
value that describes the discrepancy or error between the hypothesized model and an
estimated population model derived from the sample. RMSEA values less than .05 are
indicative of a close fit, values ranging from .05 to .08 are indicative of a reasonable fit,
with values ≥.9 considered a poor fit (Browne & Cudek, 1993; MacCallum et al., 1996).
Both the CFI and the NNFI indexes developed by Bentler are also recommended for
evaluating model fit because they consider both sample size and model complexity. CFI
and NNFI values greater than .90 are indicative of a good model.
Next, after completing the exploratory analysis, a CFA was conducted using
Lisrel 8.72 (Joreskog & Sorbom, 2001) with the second random subsample (n = 155).
The purpose of conducting a CFA is to confirm a predicted pattern or one made apparent
by previous analytics (DeVellis, 2003). In this research, the CFA was used to confirm
the factor pattern (latent variable model) that arose from the exploratory analysis with
maximum likelihood extraction (ML). Results from the CFA indicated that the
independence model (which tests the hypothesis that all variables are uncorrelated) could
be rejected = 1774, < .001 . Finally, the four-factor latent variable model that
was developed from the exploratory analysis proved to be a superior fit for the
subsample, = 238, < .001 .
98
The four-factor model produced a RMSEA of .063. The 90% confidence interval
(.049 - .076) surrounding the RMSEA result provided supporting evidence that the
proposed model was a fair fit to the estimated population (Browne & Cudek, 1993;
MacCallum et al., 1996). The accuracy of this fit was strengthened by a CFI of .96 and a
NNFI of .95— degrees of freedom and the noncentrality parameter of 149 was
determined to exceed .90 both well above the suggested threshold. The power of this
model fit based on 225 when consulting tables published (Kim, 2005). Figure 4 shows the
results of the CFA.
Validity Evidence
Convergent and discriminant validity of the WMSM scale were investigated using
exploratory and confirmatory factor analysis. Participant responses were randomly
assigned to two groups: a validation (n = 156) and a replication sample (n = 155).
Exploratory factor analysis (EFA) resulted in factor loadings for the items 1-19 on the
WMSM scale. The Confirmatory Factor Analysis used maximum likelihood (ML) factor
extraction estimates of the observed correlations among variables to identify the most
parsimonious factor structure. Maximum likelihood may be used when the sample is
evaluated to be from a multivariate normal population; such as was determined for the
sample collected from the certified teachers and administrators from the PK-12 school
districts in Montana. The method of ML statistically calculates the correlations between
factors, the statistical significance of the factor loadings, and the indices for goodness-of-
fit evaluation of the observed variables to the factors (Fabrigar, Wegener, MacCallum &
Strahan, 1999, p. 277; Brown, 2009).

99
Figure 4. Theoretical factor structure model and results of CFA using Lisrel 8.72

100
Convergent Validity. The purpose of the EFA was to explore the factor structure
of the WMSM scale. The method of factor extraction uses statistical methods to compare
the results of participant responses on each item of the WMSM scale and identify items
that group together. Items that are theoretically related should have high correlation
coefficients if the scale has convergent validity. A review of Table 9 correlation matrix
revealed convergent validity between items of the extracted factors from the EFA. For
example, Table 9 provided evidence of high correlation coefficients (≥ .32) of the items
loading on factor 1 – shared leadership ranging from .716 to .828 (Brown, 2009;
Gravetter & Wallnau, 2014). This relationship demonstrates empirical evidence of
convergent validity of the WMSM scale for the theoretical and extracted factor 1 – shared
leadership. A further review of Table 9 showed items loadings on each distinct extracted
factor had relatively higher loadings for the factor and lower loadings on the other
factors. Again this demonstrated the discriminant validity of the scale and added to the
construct validity (Netemeyer, et al., 2003). Where the factors demonstrated lower
correlations this would be described as discriminant validity and is discussed in the next
paragraph.
Discriminant Validity. A one-way ANOVA comparing the school means was run
to determine the ability of the WMSM data results to discriminate between groups at the
school level. Table 10 shows the Pearson coefficient, mean of the WMSM scale, and
standard deviation for categories of schools by school grade levels. The test revealed a
significant (p < .001) for between-group differences in growth school mindset when
comparing school mindset means between elementary level and middle and high schools.

101
This is consistent with studies on school transition success discussed in a previous section
of this paper (Mueller & Dweck, 1998; Dweck, 1989; Hong et al., 2000; Novak, 2002;
Maurer et al., 2003; Bryant, 2013; Blackwell et al., 2007). Figure 5 shows a graph of the
means.
Table 10. ANOVA results and Pearson Correlations between school building levels. Factor M SD Pearson’s
Coefficient (one-tailed)
N
Elementary** 4.6468 .72681 <.001 111 PK-12 4.3947 .82737 .637 22 Middle** 4.0279 .80638 <.001 34 High School** 3.8352 .65531 <.001 91 Elementary and Middle 4.2695 .68088 .148 25 Middle and High School 4.1852 .45095 .028 27 Total 4.2521 .75630 310 Note. ** p < .001,R2 =.075, eta2 =.192*, F(5, 304) = 14.442. Groups are not equal. The harmonic mean sample size = 34.904. Figure 5. WMSM means plot at school level (two-tailed test).

102
Discriminant Validity between Factors. Discriminant validity is increased when
factors are unidimensional, or have loadings = 1.0 on only one factor and with zeroes on
all other factors. The goal of developing item descriptions that operationalize key
constructs of the theory is to capture unique constructs. However, this is the ideal.
Cross-loading may create issues of multicollinearity. The results of this study show that
only three items in the WMSM scale cross-loaded on two factors meaning loadings ≥ .32.
Therefore, multicollinearity between factors would not be expected to be high. An
indices for this study is factor loadings in the range of .80 ≥ item ≥ .32 (Gravetter &
Wallnau, 2015; Field, 2000 & 2009; Brown, 2009). Only two factors correlated with a
value outside of these indices. Factor 1 - shared leadership and factor 3 - clear goals & a
plan with professional collaboration correlated at .867. This would be reasonable
considering the loadings from items 12 and 13 (.386 and .308 respectively) loaded on
factor 1 – shared leadership and contributed to this higher factor correlation. Table 11
shows the correlations between factors and demonstrates how well the WMSM scale is
able to discriminate between constructs.
Table 11. Component correlations matrix for WMSM scale. Item - Observed Variable Factors Shared
Leadership Open Communication and Peer Support
Clear Goals & a Plan with Professional Collaboration
Student Support
Shared Leadership 1.00
Open Communication and Peer Support
.704 1.00
Clear Goals & a Plan with Professional Collaboration
.867* .782 1.00
Student support .167 .145 .090 1.00 Note. Values greater than .80 suggest multicollinearity between factors.

103
Answering the Research Question
The overarching question of this research study, “What is the underlying factor
structure of the WMSM scale?” was answered by the results from the EFA and confirmed
by the CFA. The proposed model from the EFA was used as the basis for the CFA to
answer to the research question. A four factor model was developed and included shared
leadership, open communication and peer support, clear goals & a plan with professional
collaboration, and student support. The decision was made to accept the factor pattern
extracted by the EFA.
Testing the Null Hypothesis
The following null hypothesis was used as a basis for the analyses in this study:
H0 = The five-factor structure of shared leadership, open communication, professional
collaboration, clear goals and school plan, and support for and belief that all students can
grow and learn does not represent the underlying factor structure for the WMSM scale.
The four-factor structure for the WMSM extracted using EFA was confirmed using the
CFA and compared to the five key features of a growth school mindset. The null
hypothesis was accepted.
Summary
This chapter provided a summary of the results of the statistical procedures used
to explore the underlying factor structure of the WMSM scale. A stratified random
sample of PK-12 faculty and administrators (n=311) provided data for exploratory and

104
a confirmatory factor analysis. Participant responses were randomly assigned to two
groups: a validation (n = 156) and a replication (n = 155) sample. This study used the
statistical factor extraction methods of maximum likelihood (ML) that estimated the most
likely to be observed correlations. The results of the exploratory factor analyses yielded
four interpretable factors accounting for a total of 56.166% of the variance in all the
items. The factors interpreted were: shared leadership (items 1, 2, 3, 4 & 5), open
communication and peer support (items 6, 8, 10, & 17), clear goals & a plan with
professional collaboration (items 7, 9, 11, 12, 13, 14, 15, & 16), and student support
(items 18 & 19). Interpreting the factors required analysis of the internal consistency
reliability of the four-factor mindset scale. Cronbach alpha was used as a measure of
how reliable the instrument is based on a single use. The Cronbach alpha for the WMSM
scale from this extraction was .894 (n=156) for the 19 retained items. The four-factor
model, identified by the exploratory analysis was subjected to a confirmatory factor
analysis using Lisrel 8.72 (Joreskog & Sorbom, 2001) to test the closeness of fit to the
hypothesized four-factor population model by calculating the RMSEA. The four-factor
model produced a RMSEA of .063. The 90% confidence interval (.054 -.090)
surrounding the RMSEA result provided supporting evidence that the proposed model
was a good fit to the estimated population (Browne & Cudek, 1993; MacCallum et al.,
1996). The accuracy of this fit was strengthened by a CFI of .96 and a NNFI of .95—
both well above the suggested threshold.

105
CHAPTER FIVE
DISCUSSION
Introduction
This study explored the underlying factor structure of the WMSM scale using
exploratory factor analysis (EFA) and confirmatory factor analysis (CFA). A four-factor
structure was identified by the EFA and tested against a four-factor hypothesized
population model using CFA. The four factors identified and interpreted from these
analyses included shared leadership, open communication and peer support, clear goals &
a plan with professional collaboration, and student support. The four-factor structure did
not support five distinct key features of a growth school mindset culture which include
“shared leadership,” “open communication,” “professional collaboration,” “clear goals
and a plan,” and “support for all students to grow and learn,” proposed by Blackwell
(2012, para. 6-10). A distinction is made between the use of the term factors and features
when comparing the results of this study with the literature on mindset. A factor for the
purposes of this study included the results of the exploratory factor analysis in which four
latent constructs were identified. The key features for the purposes of this study were the
theoretical constructs described by Blackwell (2012) in the Mindset Works literature on
their website. Key features have not been identified from empirical study and therefore
the decision has been made to retain the word feature when referring to the school growth
mindset constructs in this paper in contrast to the empirically identified four factors
developed from this study. Next, this chapter will describe and interpret the confirmed
106
factors in the proposed model within the framework of the literature of organizational
learning theories, discuss the theoretical and practical implications of the empirical
findings regarding the factor structure of the WMSM, and make recommendations for
future research.
Growth Mindset
In review, understanding the constructs that contribute to the concept of a growth
mindset school culture is important to school leaders who may seek to use the WMSM
scale to collect accurate data to understand their school culture and to make
recommendations for improvement (Hoy et al., 1991; National Policy Board for
Educational Administration, 2008; Kearney, 2007; Farrington et al., 2012 and 2014;
Blackwell, 2012; Dweck 2012). To meet the challenge of instilling in students a belief in
their abilities to grow and to become life-long learners, school administrators need
current research-based information on the key factors in schools that are malleable to
influence, can be used to engage and develop teachers in creating change, promote
continuous school improvement and student success, and will be critically demonstrated
by the approximately three million high school students, who will graduate this year and
those following them (Yeager, & Dweck, 2012; Yeager, Paunesku, Walton, & Dweck,
2013; Department of Education, 2014). The WMSM scale operationalizes and measures
faculty and administrator perceptions of their school culture and is used to determine
interventions for school improvements (Mindset Works, 2008-2012c; Blackwell, 2012).
A review of the literature in the area of mindset and organizational learning
suggested faculty beliefs about their school plays a key role in school cultures and school

107
outcomes. For example, faculty with a growth mindset were more likely to see growth
potential in struggling students, to support persistence to mastery, to praise students for
effort rather than traits, and to support school change efforts (Mueller & Dweck, 1998;
Bryant, 2013; Yeager et al., 2014). Faculty with growth mindset behaviors were more
likely to develop students that demonstrated effective academic behaviors and who
persevered through school transitions such as from elementary to middles school (Dweck,
1989; Hong et al., 2000; Novak, 2002; Maurer et al., 2003). Key research in the area of
psychosocial factors, such as academic mindset, focused on developing interventions to
improve school learning, structures, and practices. There are implications from the
research that mindset interventions also show potential for developing improved learning
organizations and organizational learning (Farrington et al., 2012; Dweck, 2012; PERTS,
2014a). The purpose of this study was to empirically explore and confirm the underlying
constructs of the WMSM scale developed by Mindset Works (2008-2012c): specifically
answering the question, “What is the underlying factor structure of the WMSM scale?”
Four-Factor Model from EFA and CFA
Table 12 below provides a comparative overview of the differences between the
factor structure of the WMSM instrument described by Blackwell (2012) and the factor
structure evidenced in this study. The key difference between the four-factor model
extracted in this study and the five key features of the growth school mindset was the
collapse of Blackwell’s (2012) five-feature structure to a four-factor structure, which
combined professional collaboration with establishing clear goals and planning.
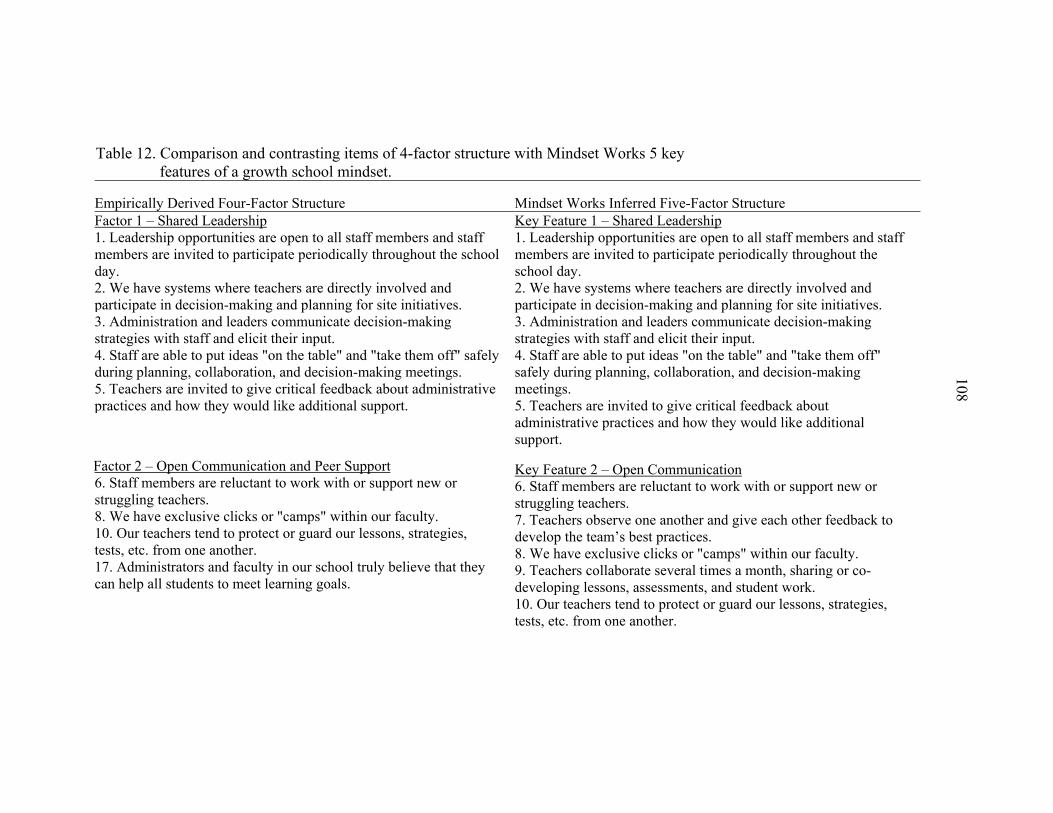
Table 12. Comparison and contrasting items of 4-factor structure with Mindset Works 5 key features of a growth school mindset.
Empirically Derived Four-Factor Structure Mindset Works Inferred Five-Factor Structure Factor 1 – Shared Leadership 1. Leadership opportunities are open to all staff members and staff members are invited to participate periodically throughout the school day. 2. We have systems where teachers are directly involved and participate in decision-making and planning for site initiatives. 3. Administration and leaders communicate decision-making strategies with staff and elicit their input. 4. Staff are able to put ideas "on the table" and "take them off" safely during planning, collaboration, and decision-making meetings. 5. Teachers are invited to give critical feedback about administrative practices and how they would like additional support.
Factor 2 – Open Communication and Peer Support 6. Staff members are reluctant to work with or support new or struggling teachers. 8. We have exclusive clicks or "camps" within our faculty. 10. Our teachers tend to protect or guard our lessons, strategies, tests, etc. from one another. 17. Administrators and faculty in our school truly believe that they can help all students to meet learning goals.
Key Feature 1 – Shared Leadership 1. Leadership opportunities are open to all staff members and staff members are invited to participate periodically throughout the school day. 2. We have systems where teachers are directly involved and participate in decision-making and planning for site initiatives. 3. Administration and leaders communicate decision-making strategies with staff and elicit their input. 4. Staff are able to put ideas "on the table" and "take them off" safely during planning, collaboration, and decision-making meetings. 5. Teachers are invited to give critical feedback about administrative practices and how they would like additional support.
Key Feature 2 – Open Communication 6. Staff members are reluctant to work with or support new or struggling teachers. 7. Teachers observe one another and give each other feedback to develop the team’s best practices. 8. We have exclusive clicks or "camps" within our faculty. 9. Teachers collaborate several times a month, sharing or co-developing lessons, assessments, and student work. 10. Our teachers tend to protect or guard our lessons, strategies, tests, etc. from one another.
108
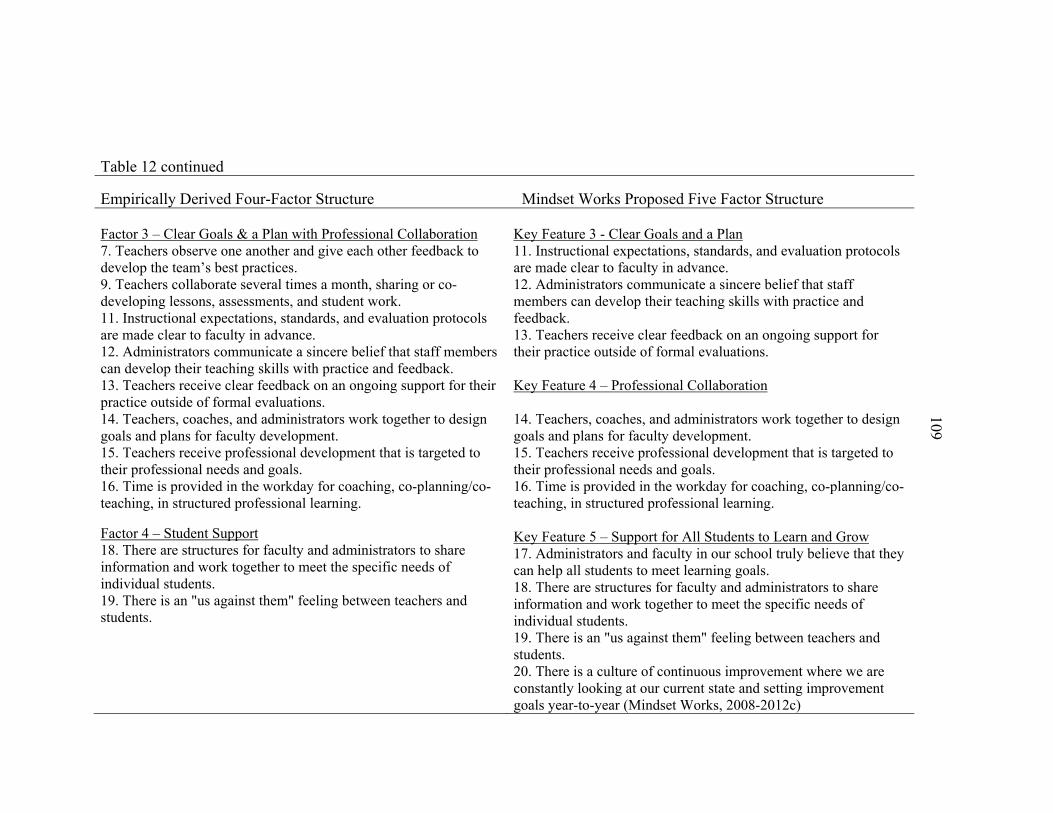
Table 12 continued
Empirically Derived Four-Factor Structure Mindset Works Proposed Five Factor Structure Factor 3 – Clear Goals & a Plan with Professional Collaboration 7. Teachers observe one another and give each other feedback to develop the team’s best practices. 9. Teachers collaborate several times a month, sharing or co-developing lessons, assessments, and student work. 11. Instructional expectations, standards, and evaluation protocols are made clear to faculty in advance. 12. Administrators communicate a sincere belief that staff members can develop their teaching skills with practice and feedback. 13. Teachers receive clear feedback on an ongoing support for their practice outside of formal evaluations. 14. Teachers, coaches, and administrators work together to design goals and plans for faculty development. 15. Teachers receive professional development that is targeted to their professional needs and goals. 16. Time is provided in the workday for coaching, co-planning/co-teaching, in structured professional learning.
Factor 4 – Student Support 18. There are structures for faculty and administrators to share information and work together to meet the specific needs of individual students. 19. There is an "us against them" feeling between teachers and students.
Key Feature 3 - Clear Goals and a Plan 11. Instructional expectations, standards, and evaluation protocols are made clear to faculty in advance. 12. Administrators communicate a sincere belief that staff members can develop their teaching skills with practice and feedback. 13. Teachers receive clear feedback on an ongoing support for their practice outside of formal evaluations. Key Feature 4 – Professional Collaboration 14. Teachers, coaches, and administrators work together to design goals and plans for faculty development. 15. Teachers receive professional development that is targeted to their professional needs and goals. 16. Time is provided in the workday for coaching, co-planning/co-teaching, in structured professional learning. Key Feature 5 – Support for All Students to Learn and Grow 17. Administrators and faculty in our school truly believe that they can help all students to meet learning goals. 18. There are structures for faculty and administrators to share information and work together to meet the specific needs of individual students. 19. There is an "us against them" feeling between teachers and students. 20. There is a culture of continuous improvement where we are constantly looking at our current state and setting improvement goals year-to-year (Mindset Works, 2008-2012c)
109

110
Factor 1 - Shared Leadership (SL) included items describing shared decision
making between teachers and administration and a willingness of the administration to
receive feedback from teachers on administrative practices largely related to decision
making. The factor interpreted as shared leadership captured WMSM items 1-5. A
review of the WMSM items and the five key features of a growth school mindset
suggested these factors would load together (Blackwell, 2012). The name of this factor
was considered reasonable to describe the underlying latent construct of shared
leadership. The construct of shared leadership aligns well concepts found in the literature
such as the framework of systems thinking as discussed by Senge (1990). Also, Hoy &
Tarter’s (2004) enabling school structures included collaborative decision making and
compared to shared leadership. The factors of a growth school mindset are interrelated in
a similar way to the variables in the Open Systems model. For example, shared decision-
making would support the development of professional collaboration and in turn develop
open communication and trust. These factors were shown to lead to improved school
outcomes. A regression of factor 1 - shared leadership (SL) on factor 3 – clear goals & a
plan with professional collaboration (CGPC) supported this relationship. Regression of
SL on CGPC showed that SL explained 52% of the variance of items comprising the
CGPC factor, F(1, 308) = 330.570, p< .001, B =.719, p < .001.
Factor 2 - Open Communication and Peer Support (OCPS). This factor included items (6, 8, 10 & 17) that
described teacher perceptions of faculty willingness to support new teachers, share
lessons, and openness to support all teachers. This factor had a near simple structure
111
showing the variables that loaded on this factor demonstrated the ability to discriminate
between factors. A review of the items’ descriptions revealed supportive and open
communication with peers but used the following negative wording, "Staff are reluctant
to work with or support new or struggling teachers," "We have exclusive cliques or
camps within our faculty," and “Our teachers tend to protect or guard our lessons…from
one another” (Mindset Works, 2008-2012c).
Sergiovanni (2009) wrote, “…teachers, parents and others invest their talents and
energy in the school and its children in exchange for certain benefits.” “When teachers
no longer receive their contacted benefits they are less willing to invest in the school," (p.
108 & 109). Also, he referenced a report by the Institute for Education and
Transformation (1992) explaining school improvements occur through leveraging the
relationships between teachers in the school (p. 113). Open relationships are a feature of
the Open Systems model for enabling school structures. A review of the mindset
literature’s five key features revealed two of the items expected to load on mindset key
feature 2 - open communication actually loaded on factor 3 – clear goals & a plan with
professional collaboration. Results from the EFA found that the open communication
and peer support factor did not capture item 7, “ Teachers observe one another and give
each other feedback to develop the team’s best practices,” and item 9, “Teachers
collaborate several times a month, sharing or co-developing lessons, assessments, and
student work,” (Mindset Works, 2008-2012c). A review of the wording of these items
showed they described teacher behaviors within the formal structures of the school giving
feedback and collaborating professionally, not in an informal structure of peer support.
112
Based on the items that defined factor 2 and a review of the literature, a decision was
made to change the factor name to include peer support. Peer support indicates an
important distinction between communication in the formal structures of the school and
the informal relationships between peers (Tschannen-Moran & Hoy, 2000; Goddard,
2002; Goddard, Hoy & Woolfolk, 2000). Factor 2 - open communication and peer
support was shown to compare and contrast to constructs of a culture of trusting and
supportive peer relations shown by Tarter & Hoy (2004) to contribute to improved
student achievement (p. 548). A culture of trust was shown to explain the development
of collective efficacy in schools. Collective efficacy behaviors of the individuals and the
group are supported by an enabling system in the school that supports faculty and
administrator behaviors to help each other and to help individual students learn and grow
(Hoy & Miskel, 2005; Goddard, 2002; Blackwell, 2012; Farrington et al., 2012; PERTS,
2014a).
Factor 3 – Clear Goals & a Plan with Professional Collaboration (CGPC). This factor was made up of items that
described activities related to clear expectations and feedback for teachers, collaborative
goal setting and structured and targeted professional development. This factor also listed
time provided as a resource for teacher collaboration and training in two of the seven
variables. Factor 3 - clear goals & a plan with professional collaboration captured the
greatest share of variables including seven of the total 19 retained items indicating it may
be overrepresented.

113
A review of the mindset literature and the five key features of a growth mindset
school culture revealed that extracted factor 3 – clear goals & a plan with professional
collaboration, identified from this study, is a combination of several key features
proposed by Mindset Works, Inc. (Blackwell, 2012) including; key feature 3 - clear goals
and a plan (items 11, 12, & 13), key feature 4 - professional collaboration (items 14, 15,
& 16), and items 7 & 9 from key feature 2 – open communication. The results of this
study revealed the items listed from these three key features were shown to contribute to
one latent construct resulting from the exploratory factor analysis. Further review of the
literature on organizational learning provided some explanation for the theoretical basis
of these constructs combining as one factor. In organizational learning theory, the
organization is considered to learn from the projections of individuals into the group and
the organization provides feedback to the individuals. The combination of projection and
feedback develops a common vision and goals that result in organizational behaviors
(Collison & Cook, 2007; Senge, 2000; Blackwell, 2012). This process is demonstrated
most clearly in the organizational routines of goal setting and planning. Tarter & Hoy
(2004) explained a comparable multivariate view of overall effectiveness of schools that
contributed to improved performance. An enabling school structure promoted school
effectiveness by establishing relational trust and organizational routines such that
principals and teachers work together as colleagues. “An enabling school structure helps,
rather than hinders, the teachers in their work” (p. 540). This process occurred through
structured activities for the faculty to collaborate on the vision, learn the skills necessary
to move toward the goals, and time to work together and practice this learning in the

114
work environment. A shared vision occurs as the faculty collaborates toward common
goals (Hoy & Sweetland, 2000 & 2001). Mindset Works, Inc. key feature 3 – clear goals
and a plan seems closely related the concept of shared vision as discussed in leadership
literature. Shared vision does not result in improved schools directly however, and
requires teacher collaboration to implement the goals and plans. Growth school mindset
key feature 3- clear goals and a plan and key feature 4 – professional collaboration can be
explained to combine as one factor theoretically because professional collaboration is
often situated in a goal-setting and planning context. Conversely, creating a shared vision
through professional collaboration is essential to effective organizational goal setting and
planning activities.
Another way to explain the combined factor is that clear goals and a plan is
mediated by professional collaboration to create improved school outcomes as
demonstrated by Tarter & Hoy (2004). The operationalized descriptions of administrator
behaviors described a system that supports teachers. For example, items 11-13 describe,
"Administrators communicate a sincere belief that staff members can develop their
teaching skills with practice and feedback," "Instructional expectations, standards…are
made clear to faculty," and "Teachers receive clear feedback and ongoing support."
These compared favorably to the operationalized teacher behaviors in the five key
features of a growth school mindset items 14-16. These items included,
"Teachers…work together to design goals and plans," "Teachers receive professional
development that is targeted to their professional needs and goals," "Time is provided in
the workday for...co-planning/co-teaching."

115
The combining of key features 3 and 4 are further supported in organizational
learning theory by Bolman and Deal (2008). Bolman and Deal described a framing and
reframing approach to develop improved cultures necessary for collaborative work.
Developing a collaborative culture requires structured time in the schedule for teachers to
work together, and secondly, opportunities must be provided to develop a shared belief
system. An analogy can be seen in the creation of professional learning communities. A
review of the items 11-16 show a description of a structured work environment supported
by administration where teachers work together and develop shared goals and visions
similar to that described by Bolman and Deal’s model.
Next, items 7 and 9 also compared favorably to open communication within the
enabling school structure construct. The five key features operationalized definitions of
items 7 & 9 included "Teachers observe…and give each other feedback to develop best
practices," and "Teachers collaborate several times a month…co-developing lessons…"
A review of the operational definitions suggested the teacher behaviors were described as
occurring within the formal actions and structures of the school organization rather than
in informal interactions between individuals in the school. This may explain why these
two items grouped on factor 3 – clear goals & a plan with professional collaboration
rather than factor 2 – open communication and peer support.
The systems thinking model by Senge (1990) supported the concept of teacher
and administrator behaviors contributing together to create a collective consciousness
within the organization through behaviors of team learning and shared vision. Senge
emphasized the inter-relationships within the organization that promoted the development
116
of the organization’s collective consciousness, in what he termed shared mental models.
Sergiovanni (2009) explained, “Connections among people are made when they are
connected to shared ideas and values. Once achieved this binding of people to ideas and
this bonding of people together forms a fabric of reciprocal roles, duties and obligations
that are internalized by members of the group,” (p. 109). This is consistent with Dweck’s
(2012) school mindset concept of mutual support and shared knowledge making
described in the items included in this factor (Kofman & Senge, 2003; Flood, 1999; Hong
et al., 2000; Kiedrowski, 2006; Mindset Assessments, 2012).
In summary, the theoretical relationships between the items within factor 3 – clear
goals & a plan with professional collaboration revealed overall school effectiveness
resulted from a combination, or multivariate, view of administrator and teacher
behaviors, within an enabling school structure (Hoy & Sweetland, 2000 & 2001; Tarter &
Hoy, 2004). These behaviors included the development of clear goals & a plan with
collegial behaviors of professional collaboration that resulted in a shared vision,
collective consciousness, and shared mental models (Senge, 2000). Finally, factor 3 –
clear goals & a plan with professional collaboration could be given a more parsimonious
name such as collaborative planning.
Factor 4 - Student Support (SS). This factor was made up of items that described
activities related to teachers, administrators, students, and school structures that work
together to support individual student needs. The factor SS included less than the
preferred indices for the number of variables loading on a factor. Only two variables
loaded on factor 4 – student support, items 18 and 19. The mindset literature suggested

117
that student support is an important component of a growth school culture (Blackwell,
2012). The student support factor comprised of items 18 and 19 is consistent with the
Mindset, Inc. key feature 5 – student support and belief in growth (Mindset Works, 2008-
2012c; Blackwell, 2012). Item 18 described structures in the school that supported
student needs, "There are structures for faculty and administrators to share information
and work together to meet the specific needs of individual students." Although item 19
was negatively worded it operationalized an attitude of collaboration and support
between students and teachers, "There is an ‘us against them' feeling between teachers
and students." When reviewing the literature on the five key features of a growth school
mindset, this factor would have been expected to load item 17, "Administrators and
faculty in our school truly believe that they can help all students to meet their learning
goals," and item 20, "There is a culture of continuous improvement where we are
constantly looking at our current state and improvement goals year-to-year" (Blackwell,
2012). However, item 17 seemed to be confounded among three different factors. It had
a small factor loading with this factor and factor 3- clear goals & a plan with professional
collaboration. Item 17’s largest loading was on factor 2 - open communication and peer
support. This outcome can be explained if item 17 is viewed as a collective efficacy
belief developed from working together with teachers in informal and formal settings.
A further review of the organizational learning literature showed that the
WMSM items associated with factor 4 – student support, compared favorably with staff
support in the development of student academic mindset. Academic mindset described a
feeling of belonging and the students' beliefs they can succeed (Farrington et al., 2012).

118
Specifically, teachers with growth mindsets promoted development of individual student
efficacy beliefs and growth mindset. Individual efficacy beliefs are closely connected
with the theory of collective efficacy as described by Bandura (2001). Bandura explained
the individual must act within a group to accomplish one’s objectives. Therefore acting
by proxy or collectively is also considered a part of human agency. This ability of
humans to act collectively or in another’s behalf lifts the burden of individual
responsibility and expands the human agency construct to collective agency (Bandura,
1977). As individuals act transactionally within a social system, an "emergent" concept
of collective efficacy develops. Collective efficacy is not the sum of the individuals’
self-efficacy but a separate independent group construct. The group’s belief in its
collective efficacy serves the group functionally in a like fashion as self-efficacy does the
individual (p. 14). Research on collective efficacy showed that groups with high
collective-efficacy were more likely to set higher goals, persist in the face of setbacks,
demonstrate higher motivation, and have greater levels of accomplishments. Individual
and group efficacy beliefs are key components in explaining mindset concepts
(Blackwell, 2012; Murphy & Dweck, 2010). Collective efficacy of faculty includes two
parts; group competency and task analysis. Group competence is the belief all teachers
have the skills, abilities, and knowledge to help all students. Task analysis is the faculty
belief that the resources, environment, and community of students, parents, and school
are sufficiently supportive to be able to perform the tasks necessary to help all students
learn and grow (Goddard, 2002). Further work is recommended to develop item
definitions that operationalize important teacher and student behaviors in schools that
119
contribute to student support. For example, items found in the PERTS (2014b) survey
might be included such as task relevance, sense of belonging, and self-efficacy beliefs in
the ability to perform the tasks. Blackwell, Trzesniewsk & Dweck (2007) described the
importance of psychosocial skills and a growth mindset in teachers. Teachers with
growth mindset were shown to develop growth mindsets in students and improved
academic behaviors. These skills compare with work locus of control concept and
personal mastery skills in Open Systems and systems thinking models (Spector, 1988;
Furnham & Drakeley, 1993; Senge, 2000; Tarter & Hoy, 2004).
In sum, two items loaded strongly on the construct of student support. This factor
was an underrepresented construct as evidenced in the results of this study. Student
support was shown to be an important part of the growth school mindset construct and
compared favorably with constructs of individual and collective efficacy, supportive
relationships between teachers and students, and task analysis (Blackwell, 2012; Tarter &
Hoy, 2004; Bandura, 2001; Goddard, 2002). The name of this factor seems consistent
with the descriptions of the construct in mindset theory and should be retained as
extracted and described based upon logic, theory, and review of the analyses. Such a
recommendation is consistent with other methodological principles and practices (Field,
2000 & 2009; Netemeyer et al., 2003).
Discriminant Validity. The results of the analysis from this study revealed that
factor 1, shared leadership, demonstrated multicollinearity with factor 3 – clear goals & a
plan with professional collaboration (.867). Indices used in this study for the desired
correlations between items and factors included ±.80 ≥ x ≥ ± .32. (Field, 2000 2009;
120
Brown, 2009; Gravetter & Wallnau, 2014). When variables highly correlate, it may create
issues when using the results of statistical analysis. Variables that contribute to more
than one factor tend to increase error variances resulting in an error in the calculations.
The implications of multicollinearity include difficulty in interpreting the item
contributions to each variable that make up the total construct of WMSM.
Multicollinearity influences coefficient calculations of individual predictor variables by
increasing or compounding the standardized error. Even with the collinearity between
the factors of the mindset model, the results from the overall scale were shown valid and
useful for school administrators and researchers. When using the factors from this study
in multiple regression analysis, or with each other or in combination with other predictor
variables, the model will hold. R2 values (regression coefficients) will be valid (Stevens,
1993).
In sum, caution is recommended regarding the need to account for the
multicollinearity between the factors when attempting to determine the individual
contribution of independent variables given the likelihood of inflated error. Researchers
should use caution when combing items that highly correlate into one factor, or in
combination with other items as independent variables when performing regression
analysis. The result could lead to errors of interpretation. The researcher could
erroneously reject a single factor as insignificant when it is in fact contributing
significantly to the overall mean of the dependent variable mean (Netemeyer et al., 2003).
Further discussion of multicollinearity is outside the scope of this research study.
121
Summary. The underlying four factors extracted from this study were shown to
be reliable and valid constructs that compared and contrasted with factors in the research
literature on organizational learning and mindset culture. The four factors aligned with
the five key features described in a growth school mindset model, as well as other well
established comparable models in organizational learning (Spector, 1988; Hoy &
Sweetland, 2000 & 2001; Senge, 1990 & 2000; Argyris & Schon, 1996; Bandura, 2001;
Goddard, 2002; Dweck, 1988, 2012; Farrington et al., 2012; Blackwell, 2012). Through
statistical analyses and descriptions of conceptual psychosocial factors related to student
learning, many of the variables on the WMSM scale have been shown to combine to form
factors that explain underlying constructs of a growth school mindset culture. Tarter and
Hoy’s (2004) Open Systems theory of learning organizations’ concepts of mindfulness,
collegial behaviors of shared decision-making, shared vision, and open communication
compared favorably with the four factors and with the five key features of a growth
school mindset. The four factors also compared to factors of team learning, shared
mental models, and systems thinking explained by Senge (2000). The concept of a
growth school mindset operationalized on the WMSM scale was show through this study
to be comprised of latent variables that are similar to variables shown by researchers as
important to healthy school cultures.
Implications
The implications of having reliable instruments for gathering and interpreting data
are clearly addressed in the standards for school administrators (National Policy Board
122
for Educational Administration, 2008). Providing sound research-based data for
improving school outcomes is important because the stakes are high for the welfare of the
students, the impact on the economy, the influence on future generations, and the world
(Netemeyer et al., 2003). Therefore, evaluating the variables that may contribute to
improved school performance has become a central area for educational researchers and a
critical policy area for legislators. Current trends include debates over how to accurately
identify school success at the organization level and the student level. Parents,
legislators, teachers, and administrators ask questions about the usefulness and accuracy
of high-stakes testing for school accountability and the singular use of criterion-
referenced cognitive assessments delivered once a year. Furthermore, using the current
approach of increasing standards by strengthening the curriculum alone, and expecting
improved outcomes, lacks rigorous scientific research-based evidence (Behizadeh, 2014).
Therefore, the Federal government has provided exemptions to several school districts
from the strictly cognitive-based accountability testing required under the No Child Left
Behind Act to collaborate with researchers and explore the potential for using psycho-
social markers, such as school mindset, to indicate school improvement and student
growth (Briceno, 2013). The question of what constitutes the factors that influence the
domain of learning and whether these factors are malleable to influence for improving
organizational outcomes is key to the goals of these and other researchers (Rotter, 1954;
Bandura, 1977, 1986, 2001; Weiner, 1986; Dweck & Leggett, 1988; Esses et al., 1993;
Taylor & Gollwitzer, 1995; Nenkov, 2012; Farrington et al., 2012, p. 9). The four factors
identified in this study may provide information to advance the research in this area.

123
School leaders can consider the results of this research study when they want to
identify perceptions of their faculty that contribute to improved school cultures.
Understanding the difficulty of capturing implicit thoughts and processes as explicit
expressions may inform principals in the importance of reflective practices that begin
with sound data on their faculty perceptions of the school culture (Marzano et al., 2005;
Collinson & Cook, 2007; Sergiovanni, 2009; Blackwell et al., 2007; Blackwell, 2012).
Principals may use the surveys and these research results to begin conversations with
their staff on the reasons for their perceptions. Yet, principals must understand that just
recognizing a difference in perceptions exists is not enough to promote a school growth
mindset. School leaders must use their understanding of perceptual differences among
their faculty to establish organizational routines that promote shared leadership, open
communication, clear goals and a plan with professional collaboration, and student
support.
There are many implications for using research-based data from scales such as the
WMSM that quantify faculty and administrator perceptions of their school culture.
School leaders may use their influence and openly engage discussion about faculty
perceptions that could create school-wide opportunities for teacher participation and
involvement. Survey research is just a beginning to finding realistic ways to implement
change in a school. Principals can provide the research-based evidence from the WMSM
scale as a sound reason for exploring new practices, emphasizing that hard work is a key
element to good outcomes, and engaging in productive discussions as a beginning to the
process.

124
Principals can work to develop the four factors of a growth school mindset in their
schools by modeling a growth mindset, being open to change, providing faculty with
opportunities to participate in shared leadership, developing a shared vision with clear
goals, co-developing continuous improvement plans, providing resources of time for
faculty to work together, and supporting development of targeted professional
development that promotes a growth school mindset in teachers where faculty believe all
teachers in their school can help all students learn and grow (Hoy et al., 1991; Kearney,
2007; Sanders & Sheldon, 2009).
Recommendations for Further Research
Netemeyer et al., (2003) explained
…the process of scale development may well be an iterative and ongoing procedure in which restarts are required as researchers learn from their efforts/mistakes and revisions are needed in such steps as conceptual definition, item generation, and defining construct dimensionality (pp. xiii & xiv).
Areas to consider when developing and modifying items for the WMSM scale could
include adding additional items that operationalize latent constructs that are under-
identified on the WMSM scale (specifically factor 4 - student support). Another
recommendation would be to test the factor model on a new sample from another
population to determine measurement invariance. Another useful area for additional
research would be to compare and contrast learning organization constructs with learning
factors identified in psychosocial academic mindset of students in schools. For example,
PERTS (2014a) factors of intelligence beliefs, belonging, relevance, and efficacy could
125
also be factors for schools as learning organizations. Other recommendations for study
include performing observations at school sites to determine if the observed variables
reported by teachers and administrators on the WMSM scale in self reports actually occur
in the school setting; performing research studies to determine if factors of mindset
culture explain school outcomes; identifying what interventions prove effective in
developing a school growth mindset; and identifying what traits of school principals lead
to schools with a growth mindset. Recommendations for future studies could also
include a phenomenological qualitative research study to advance and confirm additional
underlying psychosocial constructs of a growth school mindset culture. Specifically,
developing a research design to record the specific observed behaviors of administrators,
faculty, and students, and observe specific organizational routines to better understand
the differences between espoused theory of practitioners and the theory in use in regard to
the growth mindset school culture (Ruff, 2002; LaLoux, 2014). Identifying the latent, or
underlying factors, such as the five key features of a growth mindset and the four-factor
model developed from this study helped to contribute to the research on what drives the
actions of schools as successful learning organizations. Finally, performing correlational
research using the WMSM scale along with other reliable and valid survey instruments
shown by researchers to explain improved school outcomes such as work locus of
control, collective efficacy, mastery learning, and enabling school structures could
provide validity for the constructs identified in this study (Spector, 1988; Midgley et al.,
1998; Hoy et al., 1991; Tarter & Hoy, 2004).
126
In sum, interventions to improve schools have been shown to target the tacit ways
of knowing described by Dweck (2008, 2010 & 2012) in her theories of growth mindset.
Developing a well-designed scale that quantifies and captures psychosocial and cognitive
perceptions of faculty and administrators requires an understanding of the implicit
processes of individual learning, the reciprocal influence of the group on organizational
learning, as well as the factors underlying the behaviors of individuals and the group
(Netemeyer et al., 2003). Senge’s (1990) Five-Discipline model and Argyris & Schon’s
(1996) theories include the concept of double-loop learning used to describe the process
of learning in organizations. This process of double-loop learning emphasizes the
importance of discovering the underlying assumptions of the collective mind in a school
organization as a leverage point in bringing about meaningful change (Senge, 2000).
Conclusions and Recommendations
In conclusion, the WMSM scale reliably quantifies and captures four underlying
latent factors, or constructs, of a growth school mindset, shared leadership, open
communication and peer support, clear goals and a plan with professional collaboration,
and student support. The WMSM scale has a Cronbach alpha reliability coefficient of
.899 (n=311) for the 19 items retained. Additional study is warranted in the area of
survey research using the mindset construct (Netemeyer et al., 2003). Principals who use
the results of the WMSM scale to determine their faculty’s school mindset can be
confident that the data quantifying their faculty’s perceptions can be used to draw valid
conclusions about their school culture. Principals can provide support to develop a

127
growth school mindset among their faculty by using data from the WMSM scale to open
dialogues about their perceptions of their school culture. Principals can reflect on their
own mindset and openness to collegiality, open opportunities for faculty engagement in
the decision making and change processes, collaborate to develop clear goals, provide
targeted feedback, and provide time for teachers to learn and work together. The results
of this study show potential for the WMSM scale to be a useful tool in support of
continuing processes of school improvement (Dweck, 2012; Adams, 2014).
The underlying factors of the WMSM scale identified in this study align with
organizational learning and learning organization models that are considered critical
contributors to the organizational health of schools. (Blackwell, 2012; Dweck, 2012;
Bandura, 2001; Senge, 2000; Tarter & Hoy, 2004). Senge (1990) explained,
…people are agents, able to act upon the structures and systems of which they are a part. All the disciplines are, in this way, ‘concerned with a shift of mind from seeing parts to seeing wholes, from seeing people as helpless reactors to seeing them as active participants in shaping their reality, from reacting to the present to creating the future’ (p. 69). New ways of thinking about individual and group learning in school organizations
may be developed through research studies in the area of psychosocial markers used for
indicating student and school outcomes (Laloux, 2014). The reciprocal relationships
between the social experiences of the group and the individual teachers, administrators,
and students requires further exploration of the underlying constructs of human ways of
knowing and learning. Looking with new eyes may bring new styles of instruments for
collecting different types of data (Slattery, 1995; Bandura, 2001; Tarter & Hoy, 2004;
Dweck, 2012). Perhaps new ways may be developed to explore the individuals and the
128
group’s intricately interwoven experiences and the implicit ways of knowing in school
settings. The importance of growth school mindset situated in a postmodern world is
captured in a quote from Kummel (1965) in Slattery (1995):
Generally, the future represents the possibility, and the past the basis of a free life in the present. Both are always found intertwined with the present: in the open circle of future and past there exists no possibility which is not made concrete by real conditions, nor any realization which does not bring with it new possibilities. This interrelation of reciprocal conditions is a historical process in which the past never assumes a final shape nor the future ever shuts its doors. (p. 50)
The construct of a growth school mindset is an expanding frontier, just as is survey
instrument research, in exploring the psychosocial factors of student learning (Netemeyer
et al., 2003). An exciting challenge lays ahead in discovery, implications, and
interventions that could lead to further improvements in school organizations to help all
students learn and grow.

129
REFERENCES CITED
130
Adams, J. (2014). Measuring a ‘growth mindset’ in a new school accountability system. EdSource. Retrieved 15 April 2015, from http://edsource.org/2014/measuring-a-growth-mindset-in-a-new-school-accountability-system/63557#.VS2yP5NKY6E
Albright, J., & Park, H. (2009). Confirmatory factor analysis using Amos, LISREL,
Mplus, and SAS/STAT CALIS. Working Paper. The University Information Technology Services (UITS) Center for Statistical and Mathematical Computing, Indiana University.” Retrieved from http://www.indiana.edu/~statmath/stat/all/cfa/index.html
Aldridge, J., & Ala'i, K. (2013). Assessing students' views of school climate: Developing
and validating the What's Happening In This School? (WHITS) questionnaire. Improving Schools, 16(1), 47-66.Cohen, J. (1988). Statistical power analysis for the behavioral sciences (2nd ed.). Hillsdale, N.J.: L. Erlbaum Associates.
Aronson, J., Cohen, G., and McColskey, W. (2009). Reducing stereotype threat in
classrooms: A review of social-psychological intervention studies on improving the achievement of Black students. (Regional Education Laboratory, REL 2009-086) National Center for Education Evaluation and Regional Assistance, Institute for Education Science, U.S. Department of Education.
Argyris, C. & Schon, D (1996). Organizational Learning II: Theory, method and practice.
Addision-Wesley Publishing, Reading, Massachusetts. Aronson, J., Fried, C. B., & Good, C. (2002). Reducing the effects of stereotype threat on
African American college students by shaping theories of intelligence. Journal of Experimental Social Psychology, 38, 113–125.
Ausubel, D. (1963). The psychology of meaningful verbal learning. New York: Grune &
Stratton. Ausubel, D. (1968). Educational psychology; a cognitive view. New York: Holt, Rinehart
and Winston. Ausubel, D. (2000). The acquisition and retention of knowledge: A cognitive view.
Dordrect: Kluwer Academic. Bandura, A. (1977). Social learning theory. Englewood Cliffs, N.J.: Prentice Hall. Bandura, A. (1986). Social foundations of thought and action: A social cognitive theory.
Englewood Cliffs, N.J.: Prentice-Hall. Bandura, A. (1989). Regulation of cognitive processes through perceived self-efficacy.
Developmental Psychology, 25(5), 729-735.

131
Bandura, A. (1997). Self-efficacy: The exercise of control. New York: Freeman. Bandura, A. (2001). Social cognitive theory: An agentic perspective. Annual Review of
Psychology, 52, 1-26. Bandura, A., Ross, D., Ross, S., & Webb, D. (2013). Psychology classics all psychology
students should read: The bobo doll experiment (pp. 1-52). CreateSpace Independent Publishing Platform.
Barnden, A. & Dark, P. (2000). A comparison of SSM with an organizational learning
model. School of information management & systems. Retrieved December 8, 2014 from http://ceur-ws.org/Vol-72/011%20Barnden%20SSM.pdf
Barnes, J. (1984). The complete works of Aristotle: The revised Oxford translation.
Princeton, N.J.: Princeton University Press. Baumeister, R., Masicampo, E., & Vohs, K. (2011). Do conscious thoughts cause
behavior?. Annu. Rev. Psychol., 62(1), 331-361. DOI:10.1146/annurev.psych.093008.131126
Behizadeh, N. (2014). Mitigating the Dangers of a Single Story: Creating Large Scale
Writing Assessments Aligned with Sociocultural Theory. Educational Researcher, 43(3), 125-136. DOI:10.3102/0013189X14529604.
Billings, R. S., & Wroten, S. P. (1978). Use of path analysis in industrial/organizational
psychol- ogy: Criticisms and suggestions. Journal of Applied Psychology, 63, 677-688.
Blackwell, L. (2012, March 28). Developing a Growth Mindset School Culture.
Retrieved December 20, 2014, from http://community.mindsetworks.com/developing-a-growth-mindset-school-culture
Blackwell, L.S., Trzesniewski, K.H., & Dweck, C.S. (2007). Implicit theories of
intelligence predict achievement across an adolescent transition: A longitudinal study and an intervention. Child Development, 78. 246-263, Study 1.
Blackwell, L., Trzesniewski, K. & Dweck, C. S. (2011, January 1). Mindset Works®:
Student Motivation through a Growth Mindset, by Carol Dweck, Ph.D. Retrieved March 15, 2015, from http://www.mindsetworks.com/default.aspx
Bolman, L.G., & Deal, T.E. (2008). Reframing Organizations: Artistry, Choice, and Lead
Ership. (4th Ed). San Francisco, CA: Jossey-Bass.

132
Brandstatter, V., Herrmann, M., & Schuler, J. (2013). The struggle of giving up personal goals: Affective, physiological, and cognitive consequences of an action crisis. Personality and Social Psychology Bulletin, 39(12), 1668-1682.
Briceno, E. (2013). Mindsets and Student Agency. Unboxed, (10), 1-5. Brown, J. D. (2009). Choosing the right type of rotation in pca and efa. Shiken. JALT
Testing & Evaluation SIG Newsletter. (November, 2009) 13 (3), 20 - 25. Retrieved from http://jalt.org/test/PDF/Brown31.pdf
Browne, M. W., & Cudeck, R. (1993). Alternative ways of assessing model fit. In K. A.
Bollen, & J. S. Long (Eds.), Testing Structural Equation Models (pp. 136-192). Newbury Park, CA: Sage.
Bryant, C. (2013, December 13). Growth Mindset and the Common Core Math
Standards. Edutopia. Retrieved October 8, 2014, from http://www.edutopia.org/blog/growth-mindset-common-core-math-cindy-bryant
Burnette, J. L., O'boyle, E. H., Vanepps, E. M., Pollack, J. M., & Finkel, E. J. (2013).
Mind-sets matter: A meta-analytic review of implicit theories and self-regulation. Psychological Bulletin, 139(3), 655-701.
Burnette, J., & Pollack, J. (2013). Implicit Theories of Work and Job Fit: Implications for
Job and Life Satisfaction. Basic and Applied Social Psychology, 35(4), 360-372. doi:10.1080/01973533.2013.803964
Carver, C., & Scheier, M. (2002). Control processes and self-organization as
complementary principles underlying behavior. Personality and Social Psychology Review, 6(4), 304-315. DOI:10.1207/s15327957pspr0604_05
Cohen, P., & Cohen, J. (2002). Applied Multiple Regression/Correlation Analysis for the
Behavioral Sciences (3rd ed., p. 736). Routledge. Collinson, V., & Cook, T. (2007). Organizational learning improving learning, teaching,
and leading in school systems. Thousand Oaks: Sage Publications. Costello, Anna B. & Jason Osborne (2005). Best practices in exploratory factor analysis:
four recommendations for getting the most from your analysis. Practical Assessment Research & Evaluation, 10(7). Available online: http://pareonline.net/getvn.asp?v=10&n=7
Creswell, J. W. (2007). Qualitative inquiry and research design: Choosing among five
approaches (2nd ed.). Thousand Oaks, CA: Sage Publications, Inc.

133
Dai, T., & Cromley, J. (2014). Changes in implicit theories of ability in biology and dropout from STEM majors: A latent growth curve approach. Contemporary Educational Psychology, 39(3), 233-247. DOI: 10.1016/j.cedpsych.2014.06.003
Descartes, R. (1633/1999). Discourse on method and meditations on first
philosophy. New York, NY: Hackett. Descartes, R., & Voss, S. (1989). The passions of the soul: An engl. transl. of Les
passions de l'âme. Indianapolis u.a.: Hackett. Delaney, S., Dweck, C., Murphy, M., Chatman, J., & Kray, L. (2015, January 1). New study findings: Why fostering a growth mindset in organizations matters. Retrieved March 15, 2015, from http://senndelaney.com/SD_growthmindsetstudy.html Department of Education, U. S. (2014, January 1). Back to School Statistics. Retrieved
December 8, 2014, from http://nces.ed.gov/fastfacts/display.asp?id=372 DeVellis, R. F. (2003). Scale development: Theory and applications, (2nd ed.). Newbury
Park, CA: Sage. Dewey, J. (1938/1997). Experience and education. Macmillan. Duckworth, A.L., & Yeager, D.S., (2015). Measurement matters: Assessing personal
qualities other than cognitive ability for educational purposes. Educational Researcher, 44(4), 237-251. DOI: 10.3102/0013189X15584327
Dweck, C.S. (1975). The role of expectations and attributions in the alleviation of learned
helplessness. Journal of Personality and Social Psychology. 31, 674-685. Dweck, C. (1986). Motivational processes affecting learning. American Psychologist,
41(10), 1040-1048. Dweck, C. S. (1999). Self-theories: Their role in motivation, personality and
development. Philadelphia: Psychology Press. Dweck, C. S. (2002). Beliefs that make smart people dumb. In R. J. Sternberg (Ed.), Why
smart people do stupid things. New Haven, CT: Yale University Press. Dweck, C. S. (2008). Mindset: The new psychology of success. New York: Ballantine
Books.
134
Dweck, C. S. (2010). Mind-sets and equitable education. Principal Leadership, 26-29. Retrieved March 15, 2015, from http://www.principals.org/Content.aspx?topic=61219
Dweck, C. S. (2012). Mindsets and human nature: Promoting change in the Middle East,
the schoolyard, the racial divide, and willpower. American Psychologist, 67(8), 614-622.
Dweck, C. S., Chiu, C., & Hong, Y. (1995). Implicit Theories And Their Role In
Judgments And Reactions: A Word From Two Perspectives. Psychological Inquiry, 6(4), 267-285.
Dweck, C. S., & Leggett, E. L. (1988). A social-cognitive approach to motivation and
personality. Psychological Review, 95(2), 256-273. Eccles, J. S. & Wigfield, A. (2002). Motivational beliefs, values, and goals. Annual
Review of Psychology. 53:109–32. Esses, V. M., Haddock, G., & Zanna, M. P. (1993). Values, stereotypes, and emotions as
determinants of intergroup attitudes. In D. M. Mackie & D. L. Hamilton (Eds.), Affect, cognition and stereotyping: Interactive processes in group perception (pp. 137-166). San Diego: Academic Press.
Evans, C. (2013). Making sense of assessment feedback in higher education. Review of
Educational Research, 83(1), 70-120. Fabrigar, L. R., Wegener, D. T., MacCallum, R. C., & Strahan, E. J. (1999). Evaluating
the use of exploratory factor analysis in psychological research. Psychological Methods, 4(3), 272-299.
Farrington, C. (2013, April 1). Academic mindsets as a critical component of deeper
learning. Retrieved March 28, 2015, from http://www.hewlett.org/uploads/documents/Academic_Mindsets_as_a_Critical_Component_of_Deeper_Learning_CAMILLE_FARRINGTON_April_20_2013.pdf
Farrington, C., Roderick, M., Allensworth, E., Nagaoka, J., Seneca-Keyes, T., Johnson,
D., & Beechum, N. (2012, June 1). UChicago consortium on chicago school research. Retrieved December 8, 2014, from https://ccsr.uchicago.edu/sites/default/files/publications/Noncognitive Report.pdf#page=1&zoom=auto,582,813

135
Faul, F., Erdfelder, E., Buchner, A., & Lang, A. (2009). Statistical power analyses using G*Power 3.1: Tests for correlation and regression analyses. Behavior Research Methods, 41(4), 1149-1160. doi: 10.3758/BRM.41.4.1149
Feistritzer, E. (2011, July 29). Profile of teachers in the U.S 2011. Retrieved November
22, 2014, from http://www.edweek.org/media/pot2011final-blog.pdf Field, A. (2000). Discovering statistics using spss for windows. London-Thousand Oaks-
New Delhi: Sage publications. Field, A. (2009). Discovering statistics using SPSS. London: SAGE. Flood, R. (1999). Rethinking the fifth discipline learning within the unknowable. London:
Routledge. Fornell, C. G., and Larcker, D. F. (1981). Evaluating structural equation models with
unobservable variables and measurement error. Journal of Marketing Research, 18(1), 39-50.
Freitas, A. L., Gollwitzer, P., & Trope, Y. (2004). The influence of abstract and concrete
mindsets on anticipating and guiding others' self-regulatory efforts. Journal of Experimental Social Psychology, 40(6), 739-752.
Fulmer, R., & Keys, J. (1998). A conversation with Peter Senge: New developments in
organizational learning. Organizational Dynamics, 33-42. Furnham, A., & Drakeley, R. (1993). Work locus of control and perceived organizational
climate. European Work and Organizational Psychologist, 3(1), 1-9. Gjaja, M., Puckett, J., Ryder, M. (2014). When It Comes to School Funding, Equity Is the
Key. Education Week, 33(21), 30. Gamoran, A. (2001). What will decrease educational inequality? Wisconsin Center for
Education Research School of Education University of Wisconsin-Madison. Retrieved June 10, 2015 from http://www.wcer.wisc.edu/publications/index.php.
Gay, G. (2010). Culturally responsive teaching theory, research, and practice. New
York, NY: Faculty College Press. George, D., & Mallery, M., (2010). SPSS for windows step by step: A simple guide and
reference, 17.0 update (10a ed.) Boston: Pearson.

136
Goddard, R.D., Hoy, W.K., Woolfolk, A. (2000). Collective faculty efficacy: Its meaning, measure, and effect on student achievement. American Education Research Journal, 37(2), 479-507.
Goddard, R.D. (2002). A theoretical and empirical analysis of the measurement of
collective efficacy: The development of a short form. Educational and Psychological Measurement, 93, 467-476.
Gollwitzer, P. M. (1990). Action phases and mind-sets. In E. T. Higgins & R. M.
Sorrentino (Eds.), The handbook of motivation and cognition: Foundations of social behavior (Vol. 2, pp. 53-92). New York: Guilford Press.
Good, C., Aronson, J., & Inzlicht, M. (2003). Improving adolescents’ standardized test performance: An intervention to reduce the effects of stereotype threat. Applied Developmental Psychology, 24, 645–662. Gorusch, R. L. (1983). Factor analysis (2nd ed.). Hillsdale, NJ: Lawrence Erlbaum
Associates. Gowin, D. B. (1981). Educating. Ithaca. NY: Cornell University Press. Gravetter, F., & Wallnau, L. (2014). Essentials of statistics for the behavioral sciences
(8th ed.). Belmont, CA: Wadsworth. Greene, William H. 2000. Econometric Analysis. (Fourth edition). Upper Saddle River,
NJ: Prentice-Hall. Guilford, J. P. (1954). Psychometric methods (2nd ed.). New York: McGraw-Hill. Guskey, T. (2007). Multiple sources of evidence: An analysis of stakeholders'
perceptions of various indicators of student learning. Educational Measurement: Issues and Practice, 19-27.
Haggbloom S.J. (2002). The 100 most eminent psychologists of the 20th century, Review
of General Psychology, 6 (2). 139–152. Hair, J. F., Black, W. C., Babin, B. J., and Anderson, R. E. (2010). Multivariate data
analysis - A global perspective (7th ed.). New Jersey: Pearson Education, Inc. Hair, J.F., G. T. Hult, C. Ringle and M. Sarstedt (2014). A primer on partial least squares
structural equation modeling (PLS-SEM), Sage.

137
Harvard Business Review Staff. (2014, November 1). Talent how companies can profit from a "growth mindset" Retrieved December 8, 2014, from https://hbr.org/2014/11/how-companies-can-profit-from-a-growth-mindset
Hegel, G. W. F. (1807/1967). Phenomenology of spirit (J. B. Baillie, Trans.). New
York, NY: Harper & Row. Heslin, P. A., & VandeWalle, D. (2011). Performance appraisal procedural justice: The
role of a manager's implicit person theory. Journal of Management, 37(6), 1694-1718.
Heslin, P., Wanderwalle, D.and Latham, G. (2007). Engagement in employee coaching:
The role of managers' implicit person theory. Personnel psychology. 42(4), 268-270. DOI:10.1080/00050060701648209
Heyman, G., & Dweck, C. (1998). Children’s thinking about traits: Implications for
judgments of the self and others. Child Development, 64(2), 391-403. Hong, Y., Chiu, C., Dweck, C. S., & Sacks, R. (1997). Implicit theories and evaluative
processes in person cognition. Journal of Experimental Social Psychology, 33(3), 296-323.
Hong, Y., Chiu, C., Dweck, C., Lin, D., & Wan, W. (1999). Implicit theories,
attributions, and coping: A meaning system approach. Journal of Personality and Social Psychology, 77(3), 588-599.
Hong, Y., Morris, M. W., Chiu, C., & Benet-Martínez, V. (2000). Multicultural minds: A
dynamic constructivist approach to culture and cognition. American Psychologist, 55(7), 709-720.
Hopko, D. (2003). Confirmatory factor analysis of the math anxiety rating scale–revised.
Educational and Psychological Measurement, 63(2), 336-351. Hoy, W. K. & Sweetland, S. R. (2000). School bureaucracies that work: Enabling, not
coercive. Journal of School Leadership, 10, 524-541. Hoy, W., & Sweetland, S. (2001). Designing better schools: The meaning and measure of
enabling school structures. Educational Administration Quarterly, 296-321. Hoy, W. K., Tarter, C. J., & Woolfolk Hoy, A. (2006). Academic optimism of schools: A
force for student achievement. American Educational Research Journal, 43(3) 425-446.
Hoy, W., & Miskel, C. (Eds.). (2005). Educational leadership and reform. Greenwich,
138
Conn.: Information Age Publishing. Hoy, W., Tarter, C. & Kottkamp. B. (1991). Open schools/healthy schools measuring
organizational climate. Newbury Park: Sage Publications. IBM Corp. Released 2013. IBM SPSS Statistics for MacIntosh, Version 22.0. Armonk,
NY: IBM Corp. Introduction to SAS. (2015). UCLA: Statistical consulting group. Retrieved June 23,
2015 from http://www.ats.ucla.edu/stat/sas/notes2/ Job, V., Walton, G. M., Bernecker, K., & Dweck, C. S. (in press). Implicit theories about
willpower predict self-regulation and grades in everyday life. Journal of Personality and Social Psychology, in press.
Johnston, P., Woodside-Jiron, H., & Day, J. (2001). Teaching and learning literate
epistemologies. Journal Of Educational Psychology, 93(1), 223-233. doi:10.1037/0022-0663.93.1.223
John-Steiner, V., & Mahn, H. (1996). Sociocultural approaches to learning and
development: A Vygotskian framework. Educational Psychologist, 31(3/4), 191-206. Retrieved June 10, 2009, from http://dx.doi.org/10.1207/s15326985ep3103&4_4
Jöreskog, K. G. (1977). Structural equation models in social sciences: specification,
estimation and testing. In: Krishnaiah PR, editor. Applications of Statistics. Amsterdam: North-Holland, pp. 265-287.
Jöreskog, K. G. (1999). How large can a standardized coefficient be?. Retrieved June 5,
2015 from http://www.ssicentral.com/lisrel/techdocs/HowLargeCanaStandardizedCoefficientbe.pdf
Jöreskog, K. G. and Sörbom, D., 1979. Advances in factor analysis and structural
equation models. New York: University Press of America. Joreskog, K. G.; Sörbom, D. (2001). Lisrel 8.72 a general computer program for
estimating a linear structural equation system involving multiple indicators of unmeasured variables (RB-72-56). Princeton, NJ: Educational Testing Service.
Kang, S., Scharmann, L., & Noh, T. (2004). Reexamining the role of cognitive conflict in
science concept learning. Research in Science Education, 34, 71-96.

139
Kant, I. (1787/1999). Critique of pure reason. Cambridge, UK: Cambridge University Press.
Kearney, S. (2007). Principal Influence: A study of its effect on School Change. (Doctoral
dissertation). The University of Texas at San Antonio. UMI Number 3289296. Kearney, S., & Smith P. A. (2008). A theoretical and empirical analysis of change
orientations in schools. In Wayne K. Hoy & Michael DiPaola (eds.). Studies in School Improvement. Greenwich, CN: Information Age.
Kiedrowski, P. (2006). Quantitative assessment of a Senge learning organization
intervention. The Learning Organization, 13(4), 369-383. DOI 10.1108/09696470610667742.
Kim, K. H. (2005). The relation among fit indexes, power, and sample size in structural
equation modeling. Structural Equation Modeling, 12(3), 368-390. Kim, J.O., & Mueller, C. W. (1978). Introduction to factor analysis: What it is and how
to do it. Beverly Hills, CA: Sag King, P. M. & Shuford, B.C. (1996). A multicultural view is a more cognitively complex
view: cognitive development and multicultural education. American Behavioral Scientist; 40; 153. DOI: 10.1177/0002764296040002006
Kirshner, D., & Whitson. J. A. (1998). Obstacles to understanding learning as situated.
Educational Researcher, Nov. 27(8). 22-28. Kline, P. (2002). An easy guide to factor analysis. London: Routledge. Kofman, F., & Senge, P. (2003). Communities of commitment: The heart of learning
organizations. Organizational Dynamics, 22(3), 5-23. DOI: 10.1016/0090-2616(93)90050-B
Kouzes, J., & Posner, B. (2002). The leadership challenge (3rd ed.). San Francisco:
Jossey-Bass. Kummel, F. (1965). Time as a succession and the problem of duration. In J. T. Fraser
(Ed.), The Voices of Time (pp.31-155). New York: George Braziller.
Laloux, F. (2014). Reinventing organizations. Brussels: Nelson Parker.
140
Leithwood, K., Anderson, S., Louis, K. S., & Wahlstrom, K. (2004). Review of research How leadership influences student learning. Wallace Foundation. Retrieved September 11, 2014, from http://www.wallacefoundation.org/knowledge-center/school-leadership/key- research/Documents/How-Leadership-Influences-Student-Learning.pdf
Lindle, J. C. (2014). Political Contexts of Educational Leadership ISLLC Standard Six.
Hoboken: Taylor and Francis. Lüdtke, O., Robitzsch, A., Trautwein, U., & Kunter, M. (2009). Assessing the impact of
learning environments: How to use student ratings of classroom or school characteristics in multilevel modeling. Contemporary Educational Psychology, 34, 120-131.
MacCallum, R.C., Browne, M.W., Sugawara H.M. (1996). Power analysis and
determination of sample size for covariance structure modeling. Psychological Methods. 1, 130–49.
Marsh, H., Lüdtke, O., Nagengast, B., Trautwein, U., Morin, A., Abduljabbar, A., &
Köller, O. (2012). Classroom climate and contextual effects: Conceptual and methodological issues in the evaluation of group-level effects. Educational Psychologist, 47(2), 106-124.
Martin, J., (1979). Self-regulated learning, social cognitive theory, and agency.
Educational Psychologist, 39(2), 135-145. Marx, K. (1867). Das kapital: Kritik der politischen oekonomie (Vol. I). Hamburg,
Germany: Otto Meisner. Marzano, R. J., Waters, T., McNulty, B. A. (2005). School leadership that works.
Alexandria: ASCD. Maurer, T. J., Wrenn, K. A., Pierce, H. R., Tross, S. A., & Collins, W. C. (2003). Beliefs
about 'improvability' of career-relevant skills: relevance to job/task analysis, competency modelling, and learning orientation. Journal of Organizational Behavior, 24(1), 107-131.
McGuigan, L. & Hoy, W. (2006). Principal leadership: Creating a culture of academic
optimism to improve achievement for all students. Leadership and Policy in Schools, 5, 203-229.
Meador, D. (2015). Profile on Montana education and schools. Retrieved April 23, 2015,
from http://teaching.about.com/od/ProfilesInEducation/a/Montana-Education.htm
141
Michael, W. B. & Hunka, S. (1960). Research tools: Statistical methods. Review of Educational Research. 30(5), The Methodology of Educational Research (Dec., 1960), pp. 440-486. Retrieved from http://www.jstor.org/stable/1168925.
Midgley, C., Kaplan, A., Middleton, M., Urdan, T., Maehr. M. L., Hicks, L., Anderman,
E., & Roeser, R. W. (1998). Development and validation of scales assessing students’ achievement goal orientation. Contemporary Educational Psychology, 23, 113-131.
Mindset Works (2008-2012a). About mindset works. Retrieved 14 April 2015, from
http://www.mindsetworks.com/webnav/about.aspx Mindset Works (2008-2012b). The science: The growth mindset - Mindset Works®:
student motivation through a growth mindset, by Carol Dweck, Ph.D. Retrieved 14 April 2015, from http://www.mindsetworks.com/webnav/whatismindset.aspx
Mindset Works (2008-2012c). What’ my school mindset? Retrieved 14 April 2015, from
http://community.mindsetworks.com/whats-my-school-mindset-survey?quiz_id=16&force=1
Mintzberg, H. (1983). Power in and around organizations. Englewood Cliffs, N.J.:
Prentice- Hall. Mueller, C. M., & Dweck, C. S. (1998). Intelligence praise can undermine motivation and performance. Journal of Personality and Social Psychology, 75, 33–52. Mulaik, S. A., James, R., Van Alstine, J., Bennett, N., Lind, S. & Stilwell, C. (1986).
Evaluation of goodness-of-fit indices for structural equation models. Psychological Bulletin, 105(3), 430-445.
Murphy, M., & Dweck, C. (2010). A culture of genius: How an organization's lay theory
shapes people's cognition, affect, and behavior. Personality and Social Psychology Bulletin, 36(3), 283-296. DOI: 10.1177/0146167209347380
Muthén, L., & Muthén, B. (2008, March 20). EFA, CFA and SEM using Mplus.
Retrieved May 23, 2015, from http://www.ats.ucla.edu/stat/seminars/muthen_08/part2.pdf
National Center for Education Statistics. (2006, January 1). School local definitions.
Retrieved February 21, 2015, from http://nces.ed.gov/surveys/ruraled/definitions.asp
142
National Policy Board for Educational Administration. (2008, January 1). Educational Leadership Policy Standards: 2008. Retrieved December 9, 2014, from http://www.ccsso.org/Resources/Publications/Educational_Leadership_Policy_Standards_ISLLC
Nenkov, G. Y. (2012). It’s all in the mindset: Effects of varying psychological distance in
persuasive messages. Mark Lett 23:615–628. DOI 10.1007/s11002-012-9166-5. Netemeyer, R. G., Bearden, W.O., & Sharma, S. (2003). Scaling Procedures: Issues and
Applications. Thousand Oaks: Sage Publications. Nisbett, R., & Miyamoto, Y. (2005). The influence of culture: Holistic versus analytic
perception. Trends in Cognitive Sciences, 9(10), 467-473.
Novak, J. (2002). Meaningful learning: The essential factor for conceptual change in limited or inappropriate propositional hierarchies leading to empowerment of learners. Science Education, 86(4), 548-571. DOI: 10.1002/sce.10032
Novak, J., & Gowin, D. (1984). Learning how to learn. Cambridge Cambridgeshire:
Cambridge University Press. Office of the Federal Register. (2012, October 12). Methodology for designation of
frontier and remote areas. Retrieved February 21, 2015, from https://www.federalregister.gov/articles/2014/05/05/2014-10193/methodology-for-designation-of-frontier-and-remote-areas
Ogden, J. (2003). Some problems with social cognition models: A pragmatic and
conceptual analysis. Health Psychology, 22(4), 424-428. Osterman, K.F. (2000). Students’ need for belonging in the school community.
Review of Educational Research, 70 (3), 323-367. Panorama Education (2014). CORE SEL pilot overview for district pilot coordinators.
CORE collaboration central. Retrieved from http://collaborate.caedpartners.org/display/CAED/CORE+SEL+Pilot+Overview+for+District+Pilot+Coordinators
Pavlov, I. P. (1927). Conditioned reflexes. (G. V. Anrep, Trans.) London: Oxford
University Press. Pavlov, I. P. (1928). Lectures on conditioned reflexes. (W. H. Grant, Trans.) New York:
International Publishers.
143
Pavlov, I. P. (1932). Neuroses in man and animals. Journal of the American Medical Association, 99, 1012-1013.
Pavlov, I. P. (1934). An attempt at a physiological interpretation of obsessional neurosis
and paranoia. Journal of Mental Science, 80, 187-197. PERTS | Raising academic achievement. (2014a, January 1). Retrieved March 15, 2015, from https://www.perts.net/ PERTS | Raising academic achievement. (2014b, January 1). Retrieved March 15, 2015, from https://www.perts.net/challenge Piaget, J. (1952). The origins of intelligence in children. New York: International
Universities Press. Piaget, J. (1959). The language and thought of the child (3d ed.). New York: Humanities
Press. Plaks, J. E., Grant, H., & Dweck, C. S. (2005). Violations of implicit theories and the
sense of prediction and control: Implications for motivated person perception. Journal of Personality and Social Psychology, 88(2), 245-262.
Ponton, M., Derrick, M., Carr, P., & Hall, J. (n.d.). The relationship between self-efficacy
and autonomous learning. Documents. Retrieved February 5, 2014, from http://docs.exdat.com/docs/index-274666.html
Ponton, M., & Rhea, N. (2006). Autonomous Learning from a Social Cognitive
Perspective. New Horizons in Adult Education and Human Resource Development, 20(2), 38-49.
Popkewitz, T. S. (1998). Knowledge, power, and curriculum: Revisiting a TRSE
argument. Theory and Research in Social Education, 2<S(1), 83-101.
Reitveld, T. & Van Hout, R. (1993). Statistical techniques for the study of language and language behavior. Berline – New York: Mouton de Gruyter.
Rottschaefer, W., & Knowlton, W. (1979). A cognitive social learning theory perspective
on human freedom. Behaviorism, 7(1), 17-22. Rotter, J. (1954). Social learning and clinical psychology. New York: Prentice-Hall. Ruedy, N., & Schweitzer, M. (2011). In the moment: The effect of mindfulness on ethical
decision making. Journal of Business Ethics, 95, 73-87. Schwartz, H. (2003). Mindfulness. Prairie Schooner, 77(3), 139-141.
144
Ruff, W. (2002). Constructing the role of instructional leader: The mental models of urban elementary school principals. (Doctoral dissertation). The University of Texas at San Antonio.
Sanders, M., & Sheldon, S. (2009). Principals matter: A guide to school, family, and
community partnerships. Thousand Oaks, Calif.: Corwin. Schreiber, J. B., Nora, A., Stage, F. K., Barlow, E. A. & King, E. A. (2010). Reporting
Structural Equation Modeling and Confirmatory Factor Analysis Results: A Review. The Journal of Educational Research, 99(16), 323-338. DOI: 10.3200/JOER.99.6.323-338
Schunk, D. (2012). Learning theories: An educational perspective. Boston, MA: Pearson.
Senge, Peter M. (1990, revised 2006) The fifth discipline: The art & practice of the learning organization New York: Doubleday.
Senge, P. (2000). Schools that learn: A fifth discipline fieldbook for educators, parents,
and everyone who cares about education. New York: Doubleday. Sergiovanni, T. J. (2009). The principalship: A reflective practice perspective. Boston:
Pearson. Shannon, G.S. & Bylsma, P. (2004). Characteristics of improved school districts: Themes
from research. Office of Superintendent of Public Instruction. Olympia, WA. Shannon, G.S. & Bylsma, P. (2007). The nine characteristics of high-performing schools:
A research-based resource for schools and districts to assist with improving student learning.(2nd Ed.). Olympia, WA: OSPI.
Sirotnik, K. A. (1980). Psychometric implications of the unit-of-analysis problem (with
examples from the measurement of organizational climate). Journal of Educational Measurement, 17, 245-282.
Skinner, B. F. (1938). The behavior of organisms. New York: Appleton-Century-Crofts. Skinner, B. F. (1953). Science and human behavior. New York: Free Press. Skinner, B. F. (1954). The science of learning and the art of teaching. Harvard Education
Review, 24, 86-97. Skinner, B. F. (1971). Beyond freedom and dignity. New York: Knopf.
145
Skinner, B. F. (1978). Reflections on behaviorism and society. Englewood Cliffs, MJ: Prentice Hall.
Skinner, B. F. (1987). Whatever happened to psychology as the science of behavior?
American Psychologist, 42, 780-786. Slattery, P. (1995). A postmodern vision of time and learning: A response to the national
education commission report prisoners of time. Harvard Educational Review, 65(4), 612-634. DOI:0017-8055/95/1100-612 51 .25/0
Smith, P. K., Wigboldus, D. H. J., & Dijksterhuis, A. (2008). Abstract thinking increases
one’s sense of power. Journal of Experimental Social Psychology, 44, 378-385. So€rbom, D., & Jo€reskog, K. (1982). The use of structural equation models in
evaluation research. In C. Fornell (Ed.), Measurement and evaluation: vol. 2. A second generation of multivariate analysis, 381–418. New York: Praeger.
Sparks, S. (2015). 'Growth mindset' gaining traction as school improvement strategy.
Education Week. Retrieved from http://go.galegroup.com/ps/i.do?&id=GALE|A343619570&v=2.1&u=mtlib_1_1123&it=r&p=AONE&sw=w&authCount=1
Spector, P. E. (1988). Development of the work locus of control scale. Journal of
Occupational Psychology, 61, 335-340. Spencer-Rodgers, J., Williams, M. J., & Peng, K. (2012). Culturally based lay beliefs as a
tool for understanding intergroup and intercultural relations. International Journal of Intercultural Relations, 36(2), 169-178.
Stahl, G. (2013). Theories of collaborative cognition: Foundations for CSCL and CSCW
together. In S. Goggins & I. Jahnke (Eds.), CSCL@work. (Vol. #13 Springer CSCL Book Series). New York, NY: Springer. Web: http://GerryStahl.net/pub/collabcognition.pdf.
Strahan, E. J., Spencer, S. J., & Zanna, M. P. (2002). Subliminal priming and persuasion:
Striking while the iron is hot. Journal of Experimental Social Psychology, 38(6), 556-568.
Tabachnick, B. G., & Fidell, L. S. (2001). Using Multivariate Statistics. Boston: Allyn
and Bacon. Tarter, C., & Hoy, W. (2004). A systems approach To quality in elementary schools: A
theoretical and empirical analysis. Journal of Educational Administration, 42(5), 539-554.
146
Taylor, S. E., & Gollwitzer, P. M. (1995). Effects of mindset on positive illusions. Journal of Personality and Social Psychology, 69(2), 213-226.
Thomas, D. (2005). Domain and development of cultural intelligence. Group &
Organization Management, 31, 78-110. Thornton, L., & McEntee, M. E. (1995). Learner centered schools as a mindset, and the
connection with mindfulness and multiculturalism. Theory Into Practice, 34(4), 250-257.
Thurstone, L. L. (1947). Multiple factor analysis: A development and expansion of vectors of the mind. Chicago: University of Chicago.
Tourangeau, R., Rasinski, K. A., Bradburn, N., & D'andrade, R. (1989). Belief
accessibility and context effects in attitude measurement. Journal of Experimental Social Psychology, 25(5), 401-421.
Trochim, W. M., & Donnelly, J. P. (2006). The research methods knowledge base (3rd
ed.). Cincinnati, OH:Atomic Dog. Tschannen-Moran, M., & Hoy, W. K. (2000). A multidisciplinary analysis of the nature,
meaning, and measurement of trust. Review of Educational Research, 70(4), 547-593.
United States Census Bureau. (2015, February 5). State and county quick facts. Retrieved
February 21, 2015, from http://quickfacts.census.gov/qfd/states/30000.html Vygotskiĭ, L. S. (1962). Thought and language. Cambridge: M.I.T. Press, Massachusetts
Institute of Technology. Vygotsky, L. S. (1978). Mind in society: The development of higher psychological
processes. Cambridge, MA: Harvard University Press. Walton, G. (2014). The new science of wise psychological interventions. Current
Directions in Psychological Science, 23(1), 73-82. DOI: 10.1177/0967321413512856
Wang, Q., Bowling, N. A. & Eschleman, K. J. (2010). A meta-analytic examination of work and general locus of control. Journal of applied Psychology, 95, 761-768.
Watson, J. B. (1924). Behaviorism. New York: Norton. Weschler, D. (1943). Non-intellective factors in general intelligence. Journal of
Abnormal and Social Psychology, 38 (1), 101–103.

147
Weiner, B. (1986). An attributional theory of motivation and emotion. New York: Springer-Verlag.
Wilson, S., Plane, D., Mackun, P., Fischetti, T., & Goworowska, J. (2012, September 1).
Patterns of metropolitan and micropolitan population change: 2000 to 2010. Retrieved February 21, 2015, from http://www.census.gov/population/metro/data/c2010sr-01patterns.html
Woike, B. A. (2008). A functional framework for the influence of implicit and explicit
motives on autobiographical memory. Personality and Social Psychology Review, 12(2), 99-117.
Yeager, D., & Dweck, C. (2012). Mindsets that promote resilience: When students
believe that personal characteristics can be developed. Educational Psychologist, 47(4), 302-314. DOI: 10.1080/00461520.2012.722805
Yeager, D. S., Johnson, R., Spitzer, B. J., Trzesniewski, K. H., Powers, J., & Dweck, C.
S. (2014). The far-reaching effects of believing people can change: Implicit theories of personality shape stress, health, and achievement during adolescence. Journal of Personality and Social Psychology, 106(6), 867-884. doi:http://dx.doi.org/10.1037/a0036335
Yeager, D., Paunesku, D., Walton, G., & Dweck, C. (2013, May 10). How can we instill
productive mindsets at Scale? A review of the evidence and an initial R&D Agenda. Retrieved February 8, 2015, from https://web.stanford.edu/~gwalton/home/Welcome_files/YeagerPauneskuWaltonDweck - White House R&D agenda - 5-9-13.pdf
Yeager, D.S., Purdie-Vaughns, V., Garcia, J., Apfel, N., Brzustoski, P., Master, A.,
Hessert, W.T., Williams, M.E. & Cohen, G.L. (2014). Breaking the cycle of mistrust: Wise interventions to provide critical feedback across the racial divide. Journal of Experimental Psychology: General, 143, 804-824. + In the Washington Monthly
Yeager, D. S. & Walton, G. M. (2011). Social-psychological interventions in education:
They're not magic. Review of Educational Research, 81: 267. DOI: 10.3102/0034654311405999
Yeo, R. (2005). Revisiting the roots of learning organization: A synthesis of the learning
organization literature. The Learning Organization, 12(4), 368-382.

148
Zhao, N. (2009, March 23). The minimum sample size in factor analysis - Nathan Zhao - Wiki of Encorelab Toronto. Retrieved February 5, 2015, from https://www.encorewiki.org/display/~nzhao/The Minimum Sample Size in Factor Analysis.
Zimmerman, B. J. (1989). A social cognitive view of self-regulated academic learning.
Journal of Educational Psychology, 81(3), 329-339.

149
APPENDICES
150
APPENDIX A
SUBJECT CONSENT FORM FOR PARTICIPATION IN HUMAN SUBJECTS RESEARCH AT MONTANA STATE UNIVERSITY
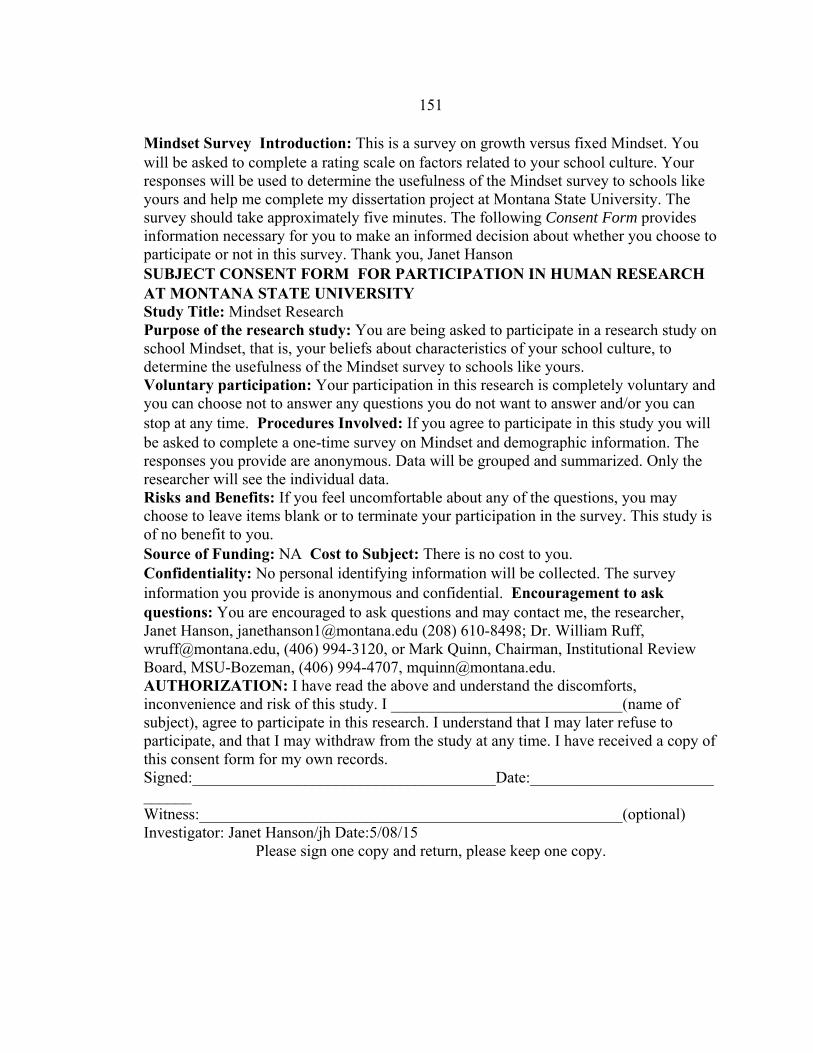
151
Mindset SurveyIntroduction: This is a survey on growth versus fixed Mindset. You will be asked to complete a rating scale on factors related to your school culture. Your responses will be used to determine the usefulness of the Mindset survey to schools like yours and help me complete my dissertation project at Montana State University. The survey should take approximately five minutes. The following Consent Form provides information necessary for you to make an informed decision about whether you choose to participate or not in this survey. Thank you, Janet Hanson SUBJECT CONSENT FORMFOR PARTICIPATION IN HUMAN RESEARCH AT MONTANA STATE UNIVERSITY Study Title: Mindset Research Purpose of the research study: You are being asked to participate in a research study on school Mindset, that is, your beliefs about characteristics of your school culture, to determine the usefulness of the Mindset survey to schools like yours. Voluntary participation: Your participation in this research is completely voluntary and you can choose not to answer any questions you do not want to answer and/or you can stop at any time.Procedures Involved: If you agree to participate in this study you will be asked to complete a one-time survey on Mindset and demographic information. The responses you provide are anonymous. Data will be grouped and summarized. Only the researcher will see the individual data. Risks and Benefits: If you feel uncomfortable about any of the questions, you may choose to leave items blank or to terminate your participation in the survey. This study is of no benefit to you. Source of Funding: NACost to Subject: There is no cost to you. Confidentiality: No personal identifying information will be collected. The survey information you provide is anonymous and confidential.Encouragement to ask questions: You are encouraged to ask questions and may contact me, the researcher, Janet Hanson, [email protected] (208) 610-8498; Dr. William Ruff, [email protected], (406) 994-3120, or Mark Quinn, Chairman, Institutional Review Board, MSU-Bozeman, (406) 994-4707, [email protected]. AUTHORIZATION: I have read the above and understand the discomforts, inconvenience and risk of this study. I _____________________________(name of subject), agree to participate in this research. I understand that I may later refuse to participate, and that I may withdraw from the study at any time. I have received a copy of this consent form for my own records. Signed:______________________________________Date:_____________________________ Witness:_____________________________________________________(optional) Investigator: Janet Hanson/jh Date:5/08/15
Please sign one copy and return, please keep one copy.
152
APPENDIX B
THEORY OF INTELLIGENCE SCALE

153
Theory of Intelligence Scale
Intelligence – Fixed or Growth Mindset – Dweck, 1999 ============================================= α = .90; M = 3.31; SD = 1.04; cf. Dweck, Chiu & Hong, 1995 In the following questions, we ask about your views about intellectual ability, learning and performance. Opinions differ on these matters and your honest, "gut" response will be most helpful.
T1-FM1 1. You have a certain amount of intelligence, and you really can’t do much to change it. [Reverse-scored]
( ) Disagree Strongly ( ) Disagree Somewhat ( ) Disagree Slightly ( ) Agree Slightly ( ) Agree Somewhat ( ) Agree Strongly
T1-GM1 2. You can always substantially change how intelligent you are.
( ) Disagree Strongly ( ) Disagree Somewhat ( ) Disagree Slightly ( ) Agree Slightly ( ) Agree Somewhat ( ) Agree Strongly
T1-FM2 3. You can learn new things, but you can't really change your basic intelligence. [Reverse-scored]
( ) Disagree Strongly ( ) Disagree Somewhat ( ) Disagree Slightly ( ) Agree Slightly ( ) Agree Somewhat ( ) Agree Strongly
T1-GM2 4. You can change even your basic intelligence level considerably.
( ) Disagree Strongly ( ) Disagree Somewhat

154
( ) Disagree Slightly ( ) Agree Slightly ( ) Agree Somewhat ( ) Agree Strongly
APPENDIX – Scoring Guidelines
The survey is coded with scale indicators, meaning that the items with a common prefix go together. The instructions for the first scale, theory of intelligence (i.e., mindset), are below and can give you guidelines on how items within a survey are to be combined. Theory of Intelligence: GM1 & GM2 items are counted as scored (1=1, etc.) FM1 & FM2 items are reverse-scored, so that 1=6, 2=5, 3=4, 4=3, 5=2, 6=1. Add the scores for the 2 GM items + the reversed scores for the 2 FM items and divide by 4 to get the average.

155
APPENDIX C
ONLINE INDIVIDUAL MINDSET SURVEY
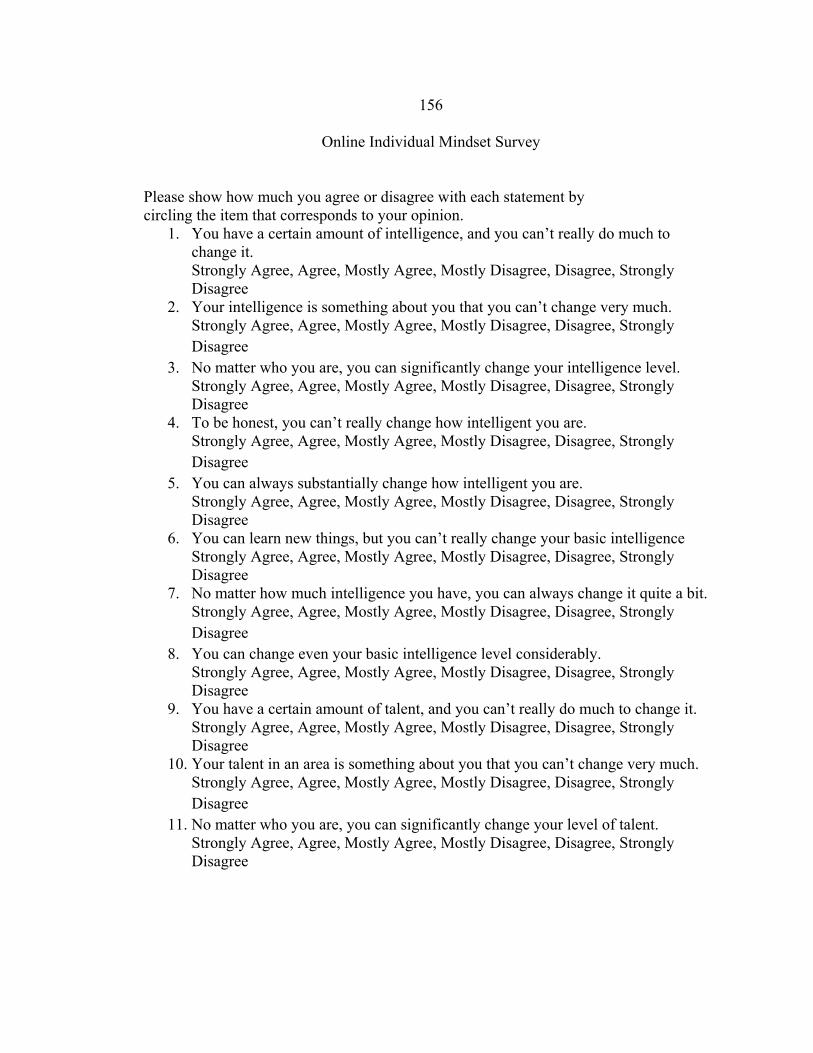
156
Online Individual Mindset Survey
Please show how much you agree or disagree with each statement by circling the item that corresponds to your opinion.
1. You have a certain amount of intelligence, and you can’t really do much to change it. Strongly Agree, Agree, Mostly Agree, Mostly Disagree, Disagree, Strongly Disagree
2. Your intelligence is something about you that you can’t change very much. Strongly Agree, Agree, Mostly Agree, Mostly Disagree, Disagree, Strongly Disagree
3. No matter who you are, you can significantly change your intelligence level. Strongly Agree, Agree, Mostly Agree, Mostly Disagree, Disagree, Strongly Disagree
4. To be honest, you can’t really change how intelligent you are. Strongly Agree, Agree, Mostly Agree, Mostly Disagree, Disagree, Strongly Disagree
5. You can always substantially change how intelligent you are. Strongly Agree, Agree, Mostly Agree, Mostly Disagree, Disagree, Strongly Disagree
6. You can learn new things, but you can’t really change your basic intelligence Strongly Agree, Agree, Mostly Agree, Mostly Disagree, Disagree, Strongly Disagree
7. No matter how much intelligence you have, you can always change it quite a bit. Strongly Agree, Agree, Mostly Agree, Mostly Disagree, Disagree, Strongly Disagree
8. You can change even your basic intelligence level considerably. Strongly Agree, Agree, Mostly Agree, Mostly Disagree, Disagree, Strongly Disagree
9. You have a certain amount of talent, and you can’t really do much to change it. Strongly Agree, Agree, Mostly Agree, Mostly Disagree, Disagree, Strongly Disagree
10. Your talent in an area is something about you that you can’t change very much. Strongly Agree, Agree, Mostly Agree, Mostly Disagree, Disagree, Strongly Disagree
11. No matter who you are, you can significantly change your level of talent. Strongly Agree, Agree, Mostly Agree, Mostly Disagree, Disagree, Strongly Disagree

157
APPENDIX D
PERTS ACADMEIC MINDSET SURVEY

158
PERTS Academic Mindset Survey
• Intelligence Mindsets • Belonging • Relevance • Self-efficacy
1. You can learn new things, but you can't really change your basic intelligence. 2. Your intelligence is something about you that you can't change very much. 3. You have a certain amount of intelligence and you really can't do much to
change it. 4. I feel like I belong in this class. 5. I feel respected in this class. 6. I feel comfortable in this class. 7. I feel like I can be myself in this class. 8. My class gives me useful preparation for what I plan to do in life. 9. This class teaches me valuable skills. 10. Working hard in this class matters for success in the work force. 11. What we learn in this class is necessary for success in the future. 12. I can earn an A in this class. 13. I can do well on tests, even when they’re difficult. 14. I can master the hardest topics in this class. 15. I can meet all the learning goals my faculty sets.
(PERTS, 2014a)
159
APPENDIX E
WHAT’S MY SCHOOL MINDSET? SURVEY
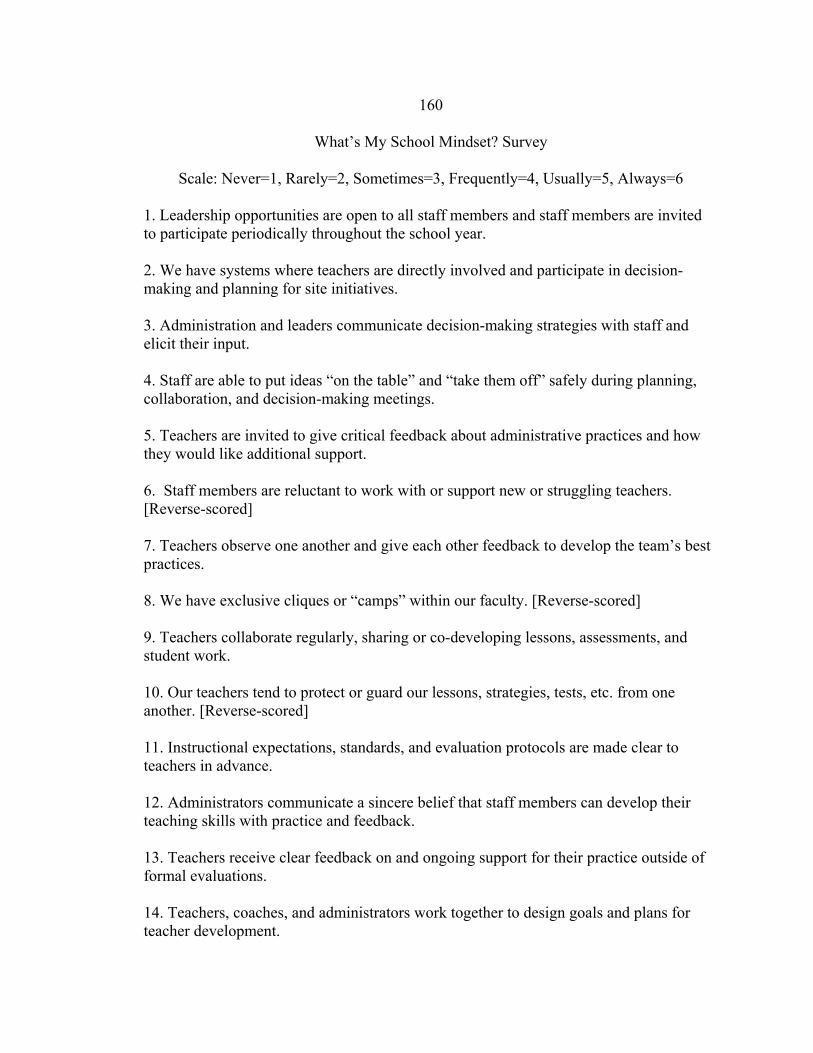
160
What’s My School Mindset? Survey
Scale: Never=1, Rarely=2, Sometimes=3, Frequently=4, Usually=5, Always=6 1. Leadership opportunities are open to all staff members and staff members are invited to participate periodically throughout the school year. 2. We have systems where teachers are directly involved and participate in decision-making and planning for site initiatives. 3. Administration and leaders communicate decision-making strategies with staff and elicit their input. 4. Staff are able to put ideas “on the table” and “take them off” safely during planning, collaboration, and decision-making meetings. 5. Teachers are invited to give critical feedback about administrative practices and how they would like additional support. 6. Staff members are reluctant to work with or support new or struggling teachers. [Reverse-scored] 7. Teachers observe one another and give each other feedback to develop the team’s best practices. 8. We have exclusive cliques or “camps” within our faculty. [Reverse-scored] 9. Teachers collaborate regularly, sharing or co-developing lessons, assessments, and student work. 10. Our teachers tend to protect or guard our lessons, strategies, tests, etc. from one another. [Reverse-scored] 11. Instructional expectations, standards, and evaluation protocols are made clear to teachers in advance. 12. Administrators communicate a sincere belief that staff members can develop their teaching skills with practice and feedback. 13. Teachers receive clear feedback on and ongoing support for their practice outside of formal evaluations. 14. Teachers, coaches, and administrators work together to design goals and plans for teacher development.
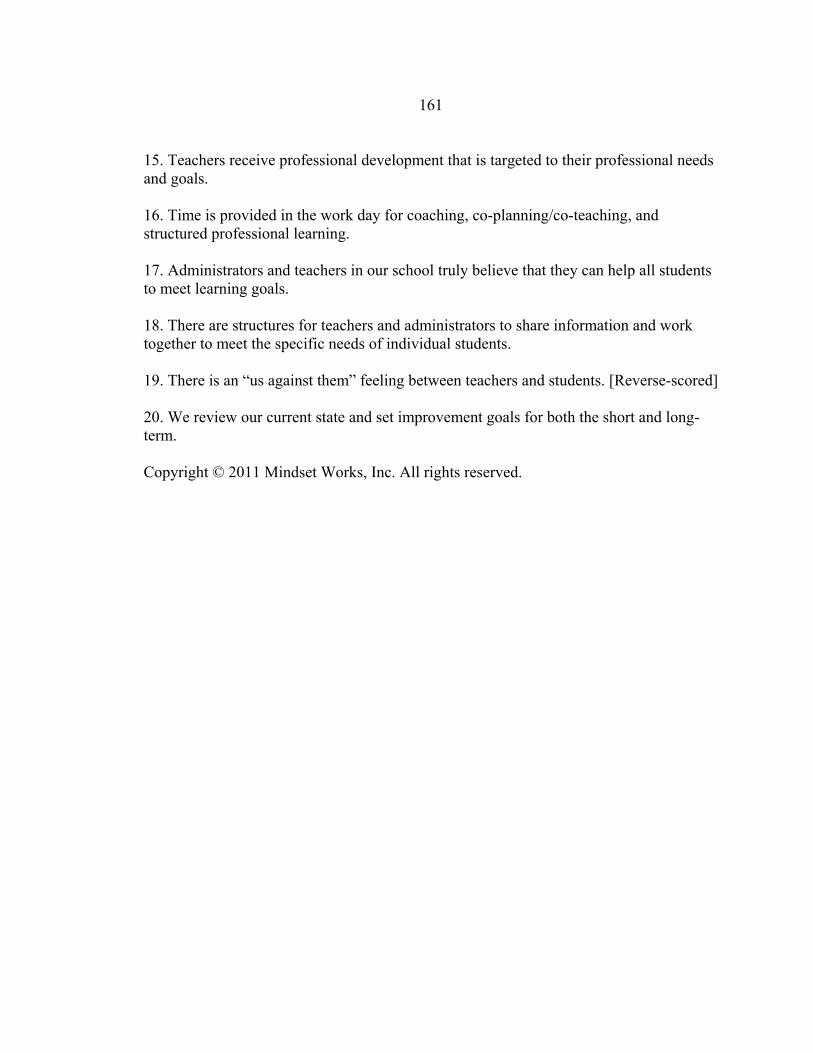
161
15. Teachers receive professional development that is targeted to their professional needs and goals. 16. Time is provided in the work day for coaching, co-planning/co-teaching, and structured professional learning. 17. Administrators and teachers in our school truly believe that they can help all students to meet learning goals. 18. There are structures for teachers and administrators to share information and work together to meet the specific needs of individual students. 19. There is an “us against them” feeling between teachers and students. [Reverse-scored] 20. We review our current state and set improvement goals for both the short and long-term. Copyright © 2011 Mindset Works, Inc. All rights reserved.

162
SCORING & FEEDBACK: Fixed Mindset (20-59 total points) At present, your school probably has many of the following characteristics:
• Administrators and perhaps a few key leaders make most decisions for a site. • Some staff members are frustrated by decisions and may challenge administration
each time there is a change on campus. • Leaders perceive staff to be entrenched and resistant to change. • While there are pockets of excellence, the quality of instruction is quite
inconsistent. • Many teachers work in relative isolation and less-skilled teachers have little
chance to learn from their colleagues. • Teachers who are ineffective may not understand why or what do to about it. • When teachers are unsuccessful, they are generally either gotten rid of, or ignored
and worked around. • Teaching staff generally finds professional development offerings to be
unrewarding. • The needs of many students are not being effectively met and no one is sure what
to do about it. What does this mean? A fixed mindset school community is one in which people lack confidence in their ability to grow and develop together in a positive direction. When a community is working with a primarily fixed mindset orientation, most of its members are focused on preserving their status and avoiding negative judgments. Like an individual with a fixed mindset, a fixed mindset school culture keeps people anxious, striving to either look good or guard against looking bad, rather than working to get better. These conditions can undermine the motivation and morale of everyone in the building—administrators, teachers, and students. Even high-performing schools can exhibit these belief-based dynamics, limiting their potential to engage everyone to their utmost. But school culture CAN be changed! Just as a person can develop a growth mindset, when members of the school community consciously cultivate growth mindset principles and practices, they can transform their collective culture and experience much greater success. ________________________________________________________________________ Mixed Mindset (60-89 total points) At present, your school probably has many of the following characteristics:
• Individual teachers grow leadership skills through their own initiative and the site provides those individuals leadership opportunities.
• Leaders’ perceive staff as wary of change. • Some grade-levels or departments are dynamic and collaborate, but school-wide
there is not a culture of collaboration

163
• There is a mismatch between expectations and opportunities for collaboration. • Teachers are congenial, but do not go out of their way to support one another if
someone is struggling. • When teachers are struggling, intervention efforts are made by administrators or
coaches, but mediocre teaching is generally tolerated. • Teaching staff generally finds professional development offerings to be of mixed
value; it may be seen as not relevant or insufficiently supported in follow through.
• Although the needs of some students are not being met, there is a sense that the site is doing “just fine.”
What does this mean? A school with a mixed mindset is not meeting its full potential. While some staff members are focusing on how they can do better, others are preoccupied with trying to maintain the status quo and avoid the risk of blame or new demands. Like an individual with a mixed mindset, a mixed mindset school culture creates vulnerabilities and weak points where people are striving for a positive judgment or to maintain comfort, rather than to continuously improve. Many middle or high-performing schools fall into this category: content to rest on a positive achievement record, but missing the opportunity to accelerate students’ achievement or to serve the needs of all students at a high level. While there may be a feeling that the site is doing well and there are no glaring issues, a closer look might reveal some areas that are real cause for concern. Unless the school has a system and a culture for supporting growth, those small areas will never resolve themselves. But school culture CAN be changed! Just as a person can develop a growth mindset, when members of the school community consciously cultivate growth mindset principles and practices, they can transform their collective culture and experience much greater success. _________________________________________________________________ Growth Mindset (96-120 total points) At present, your school probably has many of the following characteristics:
• Many or most staff members participate in leadership and decision-making, and all have the opportunity to do so.
• Leaders act as learners and model the growth mindset, including openness to feedback and improvement of their practice; they support their teachers as learners.
• Staff has come to see change as normal and part of the development process, rather than threatening.
• Excellent teachers share their knowledge, and all teachers have the opportunity to contribute to collective learning. The quality of instruction is consistently improving.

164
• Less-skilled teachers are encouraged to learn from their colleagues, and structured time is available for them to do so.
• When teachers are ineffective, they are consistently supported in the areas where they struggle, and most ultimately succeed.
• Teaching staff generally finds professional development offerings to be responsive to their needs and a positive benefit.
• The needs of most students are being met; where they are not, teams are working deliberately to find solutions.
• There is school-wide pride in joint achievements, but no sense of complacency. What does this mean? A school with a growth mindset is one where everyone sees themselves as learners and where they support one another in developing toward individual and common goals. Knowing that all humans can grow their intelligence influences and motivates both adult and adolescent learners. Being in a growth mindset school doesn’t mean that there are no challenges, mistakes, or failures—it means that people are continually striving to overcome them. When students are in an environment that promotes growth and, hopefully, intellectual risk-taking, they excel too. Of course, even a growth-minded school community usually has some areas in which they could develop and be more effective. When members of the school community consciously cultivate growth mindset principles and practices, they can transform their collective culture and experience ever greater success. Copyright © 2011 Mindset Works, Inc. All rights reserved.