Embed Size (px)
Citation preview
Valet Charging: Influence on Load Shifting, Charging Station Utilization
and Prioritizing Queues Hidde P. F. van Heijst
436800
Master Thesis, Msc Business Information Management Erasmus University Rotterdam, Rotterdam School of Management
Coach: M. Kahlen, Co-Readers: Y. Ghiassi-Farrokhfal, B.M.H. de Brey, H.A. Fidder Submitted on the 13th of June 2016
Abstract With the increasing popularity of (plug-in) electric vehicles ((PH)EVs), the demand on the
power grid increases. Research shows that this demand is unevenly distributed, resulting in
higher power variances on the grid, with increased risk of overloading. Additionally,
organizations lack the electrical infrastructure capacity to provide simultaneous charging of the
increasing share of (PH)EVs in their fleet. Creating a sustainable infrastructure to provide
increased capacity is very costly, therefore methods of demand-side management are sought.
One method, called Valet Charging, involves switching (PH)EVs on a charging station,
maximizing utilization of the station and distributing demand. However, no previous research
on Valet Charging addresses methods to introduce prioritized charging. Therefore, this thesis
aims to evaluate the performance of Valet Charging and investigate the elements that should be
used for prioritized (PH)EV charging scheduling. For evaluation, four performance indicators
are framed. These are used as a foundation to draw results from the research, which is performed
at a single organization. The performance indicators are: user satisfaction, service level, load
shifting contribution and charging station utilization. The results show Valet Charging has a
positive effect on charging station utilization (from 40% to 53% and potentially 77%) and load
shifting. Additionally, Valet Charging is perceived generally positive (NPS = 41) by its users.
Keywords: valet charging, (plug-in) electric vehicles, demand-side management, load shifting
The copyright of the master thesis rests with the author. The author is responsible for its contents. RSM is only
responsible for the educational coaching and cannot be held liable for the content.
Master Thesis BIM 2015-2016 – H.P.F. van Heijst
1. Introduction
In the last few decades, surging oil prices, the environmental awareness and impact of the
petroleum-based industry has led to a renewed interest in the use of electricity to power vehicles
(Eberle & von Helmolt, 2010). The use of (plug-in) electric vehicles ((PH)EVs) show various
benefits compared to the traditional combustion-engine based vehicles. (PH)EVs have a low
carbon footprint (if the electricity is not generated from fossil fuels), and can use renewable
energy. Additionally, (PH)EVs show to have less local impact on noise levels and air quality
(Leurent & Windisch, 2011). The major problem of electric vehicles, however, lies in the
limitations of batteries: weight, cost, limited charging capacity which allows for only a short
driving range, and a long recharging time (Chéron & Zins, 1997). Battery recharges imply
plugging the car into the electrical power network at home, office, or wherever accessible.
Consequently, the increase of electric vehicles impose a rising demand on charging-stations.
Providers are struggling to meet those demands as the uncoordinated (PH)EV charging
substantially increases the energy demand peaks, putting the grid under constant strain
(Valogianni, Ketter, & Collins, 2013). With these new developments the Distribution System
Operators (DSOs), who provide the transportation networks for electricity, are seeking methods
to relieve the strain on the grid, such as Smart Charging (SC). By connecting electric usage and
vehicle usage patterns to both consumers and smart meters, SC uses algorithms to not only
charge electric cars, but determine the best moment to do this. This enables off-peak charging
(Johnson, 2015). Thus, with SC, the limited available capacity can be utilised more efficiently,
without (PH)EV owners being unnecessarily aware of this (Enexis, 2011).
Unfortunately, SC systems are very complex and require substantial investments, therefore it
can take years to implement. At a smaller level, organizations face a similar capacity problem
as DSO’s as they need to facilitate charging stations in their office car parks. More (PH)EVs
ask for more charging stations and a higher electricity demand on the buildings’ grid, especially
during peak times (Weiller, 2011). Organizations see their buildings capacity limit being
reached, and face high investment costs. Consequently, by having not enough charging stations,
the Plug-in Hybrid Electric Vehicles (PHEVs) of the organizations’ car fleet only drives 30%
‘electric’ kilometres on average (TNO, 2016). This affects their CO2 emission policies and
therefore corporate responsibility.
As a bright prospect, organizations owning office car park fleets can more quickly tackle
(PH)EV charging problems with a middle-solution: Valet Charging (Bodenhorst Meyer, 2015).
This is because office car park fleets mainly consist of leased, organization-owned, cars. Valet
1
Master Thesis BIM 2015-2016 – H.P.F. van Heijst
charging is especially suitable for these organizations as they often have the critical mass
needed to hire a valet. This charging method involves a valet switching (PH)EV’s on a charging
station to maximize station utilization. Consequently, (PH)EVs may have to wait in ‘queue’ for
a charging station. A valet should prioritize (PH)EVs in this queue in a well-defined strategic
way. If this challenge is abstracted, the valet needs to schedule the production of ‘charged
(PH)EVs’. Therefore, in manufacturing management terms, this challenge is very similar to
Production Scheduling.
Advanced methods of production scheduling are often complex and time-consuming. As
(PH)EVs arrive in a randomly distributed way, an alternative is to dispatch (i.e. schedule
according to a specific criterion) as jobs arrive. Dispatching is especially popular due to the
low-computational requirements and ease of implementation (Dabbas & Fowler, 2003). An
optimal solution, however, is not guaranteed with dispatching, as it focuses on improving a
single performance objective. Instead, it finds a reasonable solution in a short period of time.
There is no previous research done on Valet Charging, and the charging variables it should use
for strategically dispatching the charging of (PH)EVs in office car parks. Therefore, this thesis
will evaluate Valet Charging and investigate these charging variables.
1.1 Aim and Research-question The aim of this thesis is, as described in the introduction, to evaluate the performance of Valet
Charging and investigate the elements Valet Charging should use for prioritized (PH)EV
charging scheduling. In order to achieve this goal, a research question has been formulated
which shall be answered in this thesis. The main research-question is as follows:
1. “Does Valet Charging improve Load Shifting and Charging Station Utilization and how is
Valet Charging perceived by users?”
With the following sub-questions to support the research for the main-questions:
1.1 “What are important charging variables for electric vehicle-owners and organization?”
1.2 “What is the importance of distributing the charging demand of (PH)EVs?”
1.3 “What are suitable scheduling methods to create a tool for valet charging?”
1.2 Scientific Relevance The research conducted by this thesis sheds light on a subject that has not been studied before.
Valet charging is one of the methods organizations are trying to attack the problems they face
with the increasing presence of electric vehicles in their car park buildings. The results of this
2
Master Thesis BIM 2015-2016 – H.P.F. van Heijst
study will provide a deeper understanding of Valet Charging and what elements are important
for a Valet Charger to find the optimal charging order for (PH)EVs.
1.3 Societal Relevance Due to the increasing presence of electric vehicles in office car park fleets, organizations face
reaching the buildings’ electricity-capacity limit. Therefore, they seek more efficient ways of
distributing the charging demand of their electric vehicle fleet and improving the utilization of
their charging infrastructure. This study will give organizations a better understanding on the
important elements of Valet Charging, and provide a tool for organizations to efficiently adopt
Valet Charging.
1.4 Reading directions In the introduction (§1.1) the main problem is disclosed. The theoretical framework, as found
in chapter 2, will elaborate on relevant literature about charging electric vehicles, and the
implications in the electric grid. Further explanation on the used research-methods is to be
found in chapter 3: ‘Methodology’. The results of the research are displayed in chapter 4. In
chapter 5, based on the theory and research-results, a discussion will be held. In this chapter the
answer on the main problem, discussion points, and possible recommendations for further
research will be discussed. Finally, the research will be completed with a conclusion in chapter
6.
2. Theoretical framework
2.1 Charging of Electric Vehicles This part of the theoretical framework aims to introduce the phenomena of charging electric
vehicles. Next, it’s implications on the electric power grid will be explained using relevant
literature. This section is concluded by elaborating on load shifting and consequently Valet
Charging, which attempt to address the issues of the power grid implied by the charging of
electric vehicles.
2.1.1 (PH)EV Charging Infrastructure
As described in the introduction, the popularity of electric vehicles is increasing (Eberle & von
Helmolt, 2010). But creating a sustainable infrastructure for (PH)EV charging is probably as
important as the actual increase of (PH)EVs on the market. If customers do not perceive the
infrastructure suitable for the use of (PH)EVs, they will be reluctant to purchase these type of
3
Master Thesis BIM 2015-2016 – H.P.F. van Heijst
cars (Franke et al., 2012). Consequently, governments are heavily supporting projects to create
these sustainable charging infrastructures (Nègre, 2011).
2.1.2 Range Anxiety
While the charging infrastructure continues to be further developed in most western countries,
the efforts are still rather small compared to the massive fleet of electric vehicles (Bakker,
2011). The limited availability of a comprehensive charging infrastructure results in (PH)EV-
owners not being able to charge their vehicle when needed. This lack of charging infrastructure
availability is a cause of range anxiety, which is described as the fear that a vehicle has
insufficient range to reach its destination (Eberle & von Helmolt, 2010; Tate, Harpster, &
Savagian, 2008). Respectively, Chéron & Zins (1997) suggest that range anxiety can be reduced
by increasing driving range, higher accessibility to recharge and decreasing (PH)EV charging
time, of which the latter is also confirmed in a later research as conducted by Botsford &
Szczepanek (2009). They suggest that a decrease of (PH)EV charging time will likely be a
necessity for many types of fleet drivers, and to consequently achieve a large scale adoption of
(PH)EVs.
2.1.3 The emerging threat of (PH)EVs on the power grid
For power grids, it is important to balance supply and demand at all times (Inage, 2010). With
the increasing popularity of (PH)EVs (Eberle & von Helmolt, 2010), this also implies an
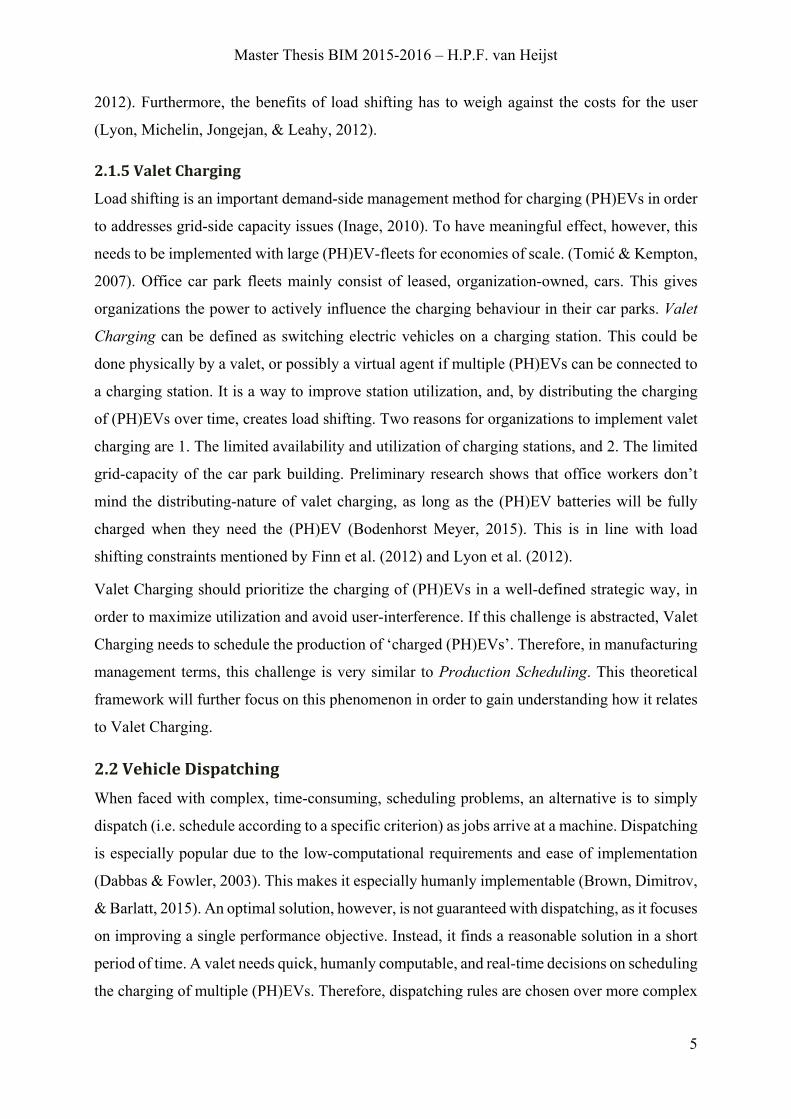
increase in demand for electricity. The main issue arising, is that (PH)EV charging demand is
unevenly distributed across the day, especially when users only charge at home and work, as
shown in figure 1 (Weiller, 2011). This results in higher power variations on the grid.
By adding more and more (PH)EVs to the
grid, this might cause the power grid to
overload. Overloading causes great damage
to the grid, and will drastically increase
maintenance costs (Gu, Yu, Liu, Zhu, &
Xu, 2013).
2.1.4 Load Shifting
To avoid overloading the power grid, the demand side of charging (PH)EVs should be managed
(Strbac, 2008). Managing electricity demand so that peak-demand is shifted to off-peak periods,
is also called load shifting (Inage, 2010). This means that the timeframes to charge (PH)EVs
can vary, but should not be interfering the needs of the user (Finn, Fitzpatrick, & Connolly,
Figure 1: EV Charging distribution (Weiller, 2011)
4
Master Thesis BIM 2015-2016 – H.P.F. van Heijst
2012). Furthermore, the benefits of load shifting has to weigh against the costs for the user
(Lyon, Michelin, Jongejan, & Leahy, 2012).
2.1.5 Valet Charging
Load shifting is an important demand-side management method for charging (PH)EVs in order
to addresses grid-side capacity issues (Inage, 2010). To have meaningful effect, however, this
needs to be implemented with large (PH)EV-fleets for economies of scale. (Tomić & Kempton,
2007). Office car park fleets mainly consist of leased, organization-owned, cars. This gives
organizations the power to actively influence the charging behaviour in their car parks. Valet
Charging can be defined as switching electric vehicles on a charging station. This could be
done physically by a valet, or possibly a virtual agent if multiple (PH)EVs can be connected to
a charging station. It is a way to improve station utilization, and, by distributing the charging
of (PH)EVs over time, creates load shifting. Two reasons for organizations to implement valet
charging are 1. The limited availability and utilization of charging stations, and 2. The limited
grid-capacity of the car park building. Preliminary research shows that office workers don’t
mind the distributing-nature of valet charging, as long as the (PH)EV batteries will be fully
charged when they need the (PH)EV (Bodenhorst Meyer, 2015). This is in line with load
shifting constraints mentioned by Finn et al. (2012) and Lyon et al. (2012).
Valet Charging should prioritize the charging of (PH)EVs in a well-defined strategic way, in
order to maximize utilization and avoid user-interference. If this challenge is abstracted, Valet
Charging needs to schedule the production of ‘charged (PH)EVs’. Therefore, in manufacturing
management terms, this challenge is very similar to Production Scheduling. This theoretical
framework will further focus on this phenomenon in order to gain understanding how it relates
to Valet Charging.
2.2 Vehicle Dispatching When faced with complex, time-consuming, scheduling problems, an alternative is to simply
dispatch (i.e. schedule according to a specific criterion) as jobs arrive at a machine. Dispatching
is especially popular due to the low-computational requirements and ease of implementation
(Dabbas & Fowler, 2003). This makes it especially humanly implementable (Brown, Dimitrov,
& Barlatt, 2015). An optimal solution, however, is not guaranteed with dispatching, as it focuses
on improving a single performance objective. Instead, it finds a reasonable solution in a short
period of time. A valet needs quick, humanly computable, and real-time decisions on scheduling
the charging of multiple (PH)EVs. Therefore, dispatching rules are chosen over more complex
5
Master Thesis BIM 2015-2016 – H.P.F. van Heijst
scheduling methods. There are over a hundred different dispatching rules to be found in
literature, which can be generalized into four categories; 1. Arrival-time (e.g. first in, first out),
2. Processing-time (e.g. shortest processing time), 3. Due date (e.g. earliest due date), and 4.
Composite (combination of rules) (Panwalkar & Iskander, 1977). Each category and it’s
relevancy for (PH)EV charging will be discussed below.
2.2.1 Arrival-time dispatching: First in, First out (FIFO)
Arrival-time dispatching involves ordering the queue by arrival time. A good example of a
dispatching rule in this category is First in, First out (FIFO). For valet charging this implies
that the valet will queue (PH)EVs by time of arrival, where the first (PH)EV to arrive will
consequently be the first to charge. Dispatching by arrival-time is the only method that does not
lead to a reordering of queued lots, and therefore is a very straightforward and easy to adopt
method. Literature shows that FIFO is still often used as a criteria for instances as vehicle
routing (Ichoua et al., 2003; Taillard et al., 1997) and semiconductor manufacturing (Dabbas &
Fowler, 2003). A disadvantage when using FIFO, however, is that it does not allow prioritized
charging (Astuti, 2003), i.e. there is no prioritizing of (PH)EVs that might need charging more
than others. Therefore, this research proposes to use FIFO as a dispatching rule to fill empty
charging stations when there is no queue. When a queue starts to form, other dispatching
methods will be used.
2.2.2 Processing-time dispatching: Longest Processing Time (LPT)
With regards to FIFO, one dispatching rule that does prioritize charging is Longest Processing
Time (LPT). This form of dispatching is often used in job shop scheduling (e.g. Dominic et al.,
2003; Melouk et al., 2004). With LPT, the highest priority is given to the waiting operation with
the longest imminent operation time (Dominic et al., 2003). In other words, the (PH)EV with
the lowest State of Charge (SoC) gets the highest priority to charge, which can be considered a
logical way of prioritizing the charging of (PH)EVs. In contrast, dispatching by Shortest
Processing Time (SPT) would not make sense; a SoC of 80% should not have priority over a
SoC of 20%. Consequently, this research shall use LPT as a dispatching rule to prioritize
charging of (PH)EVs. To increase the understanding of the LPT dispatching rule, some
additional notation will be given. For LPT, a job, j, is chosen from the queue at the charging
stations, q, if it has the most processing time to charge, which is the maximum of processing
time, pcj for j ∈ q (Panwalkar & Iskander, 1977).
6
Master Thesis BIM 2015-2016 – H.P.F. van Heijst
2.2.3 Due date dispatching: Earliest Due Date (EDD)
Earliest Due Date (EDD) dispatching is another dispatching rule that is frequently used by job
shops and internet routing approaches (e.g. Brown et al., 2015; Piro et al., 2012; Vinod &
Sridharan, 2011). The aim of this rule is to prioritize work on a job that is almost due (Panwalkar
& Iskander, 1977). EDD is considered human implementable; a person can determine the next
job in line, using a list of all jobs in queue and their due dates (Brown, 2014). In other words,
with a queue of (PH)EVs, when the event occurs that a charging station becomes available, the
(PH)EV with the earliest due date will be selected to be processed first. This method is
especially useful when jobs have different due dates, and therefore need to be prioritized to
avoid lateness of the jobs. This is the case for (PH)EV charging queues at an office, where users
need to attend meetings and other events at external locations during the day. Prioritizing the
queue by using the earliest due date dispatching rule is therefore considered in this research.
2.2.4 Composite dispatching: LPT + EDD
The above mentioned dispatching methods are focused on “optimizing” a single performance
measure, using single dispatching rules. For example, the LPT rule implies to charge (PH)EVs
that need charging the most first. This is mostly because they are otherwise too complex to
human implement and thus not practical. Consequently, most dispatching rules have not
succeeded in optimizing multiple performance measures (Dabbas & Fowler, 2003). In contrast,
research shows that combining multiple rules are able to outperform a single dispatching rule
(Brown et al., 2015). Following this, organizations need to make a decision between higher
complexity (and costly) scheduling methods or cheap and easy to implement (dispatching)
methods. As a middle solution, this thesis proposes a dispatching method which combines two
dispatching rules in order to optimize multiple performance measures. To address the increased
complexity (due to adding multiple rules), a tool will be provided to calculate the (PH)EV
charging schedule, as further explained in the next chapter.
3. Methodology
In this chapter, the methodology of this research will be described. Certain choices regarding
the research will be explained. Next, the investigated organization, its relevancy and the context
for valet charging will be described. To conclude, an explanation of the method of data
collection will be given.
7
Master Thesis BIM 2015-2016 – H.P.F. van Heijst
3.1 Research Design This research aims to evaluate the performance of Valet Charging and create dispatching
methods, whereas Valet Charging is intended to solve the identified organizational problem as
described in the introduction. To evaluate Valet Charging, four performance indicators are
framed. These will be used as a foundation to draw results from the research, which is
performed at a single organization. The performance indicators are: user satisfaction, service
level, load shifting contribution and charging station utilization. Additionally, the dispatching
methods for Valet Charging are similarly evaluated. The queue of (PH)EVs waiting for a charge
is prioritized based on the dispatching criteria differing per week, for a total of four different
approaches. For the first week the estimated departure time is used as a form of EDD
dispatching. The second week addresses LPT with State of Charge. For the composite
dispatching method in week three a weighted function of LPT and EDD is chosen, which
implies the use of a mathematical device to give LPT or EDD more “weight” or influence on
the result compared to the other (Grossman et al., 1980). The weighting of LPT and EDD will
be 50-50 in week three, and then reconsidered and adjusted for performance improvement in
week four.
The research will be conducted at the parking garage of an organization with on average 56
(PH)EVs requiring a charge each day on a total of 42 charging stations. Two valets are available
in the morning to accommodate with the largest part of the (PH)EVs arriving before 09:00.
From 10:00 onwards, one valet is required to do the rest of the work. To address load shifting,
these valets were asked to distribute the charging of the (PH)EVs over the day, as not all
(PH)EVs immediately require a charge at 09:00. As one (PH)EV becomes charged, the valet is
able to switch this vehicle with a (PH)EV that requires a charge.
3.2 Performance Indicators In this part of the methodology, the four performance indicators are explained.
3.2.1 User satisfaction
User satisfaction is considered as a performance indicator as Valet Charging is about providing
a service to (PH)EV users. Research shows that how the users value the service is an important
aspect to assess a project (Petter et al., 2012; Wixom & Todd, 2005). In this context, user
satisfaction is viewed as the attitude that a user has toward Valet Charging. In order to study
the degree of user satisfaction for users of Valet Charging, a survey is created which contents
are discussed in §3.4. This survey is conducted at an organization, where each respondent filled
8
Master Thesis BIM 2015-2016 – H.P.F. van Heijst
out the same electronic survey. The advantage of this method is that the range is bigger
compared to other methods (such as telephone/personal). By using an electronic survey,
respondents were allowed to pick a suitable moment for themselves to answer the questions,
lowering the threshold to participate. A disadvantage is that respondents sometimes do not or
only partially fill out the survey. Consequentially, the results could be less suited or reliable for
the research.
3.2.2 Service level
The second performance indicator, service level, is chosen to analyse the degree that Valet
Charging is able to meet demand (for each dispatching method), given a limited number of
valets and charging stations. The proposed dispatching methods could have different service
levels, as they follow different dispatching rules.
The service level will be estimated by asking whether the user has experienced his vehicle not
being charged at departure. This question will be included in the user satisfaction survey as
mentioned in §3.2.1.
To calculate the service level, the number of times the survey respondents did not receive a
charge is divided by the relative transaction demand users had during the measured period. By
deducting this from 1, the service level is achieved. The calculation in formula format is shown
below:
𝑆𝑆𝑆𝑆𝑆𝑆𝑆𝑆𝑆𝑆𝑆𝑆𝑆𝑆 𝑙𝑙𝑆𝑆𝑆𝑆𝑆𝑆𝑙𝑙 = 1 − 𝑇𝑇𝑆𝑆𝑇𝑇𝑆𝑆𝑇𝑇 𝑛𝑛𝑛𝑛𝑛𝑛 𝑆𝑆ℎ𝑎𝑎𝑆𝑆𝑎𝑎𝑆𝑆𝑎𝑎𝑇𝑇𝑛𝑛𝑛𝑛𝑎𝑎𝑙𝑙 𝑎𝑎𝑆𝑆𝑇𝑇𝑎𝑎𝑛𝑛𝑎𝑎
3.2.3 Load shifting contribution
As a third performance indicator, the load shifting contribution of Valet Charging and its
different dispatching methods is analysed. As described in the theoretical framework, load
shifting is an important endeavour for Valet Charging, as there is a need for it not only from the
organizations’ power grid perspective, but also the main electrical power grid. To identify the
contribution to load shifting by Valet Charging, the load distribution of the charging stations
after Valet Charging implementation has to be compared to the situation before implementation.
Load distribution can be measured by identifying the number of charging transactions,
including transaction starting and ending times (Bodenhorst Meyer, 2015). A perfect load
distribution would involve all transactions being spread out evenly within a certain timeframe.
9
Master Thesis BIM 2015-2016 – H.P.F. van Heijst
3.2.4 Charging station utilization
Valet Charging assumedly will allow more electric vehicles to be charged on a single charging
station, because a fully charged (PH)EV at a charging station can be swapped by an (PH)EV in
need of charging. If this assumption holds, the utilization per charging station increases
(Bodenhorst Meyer, 2015). The average utilization U of a charging station CS can be measured
by dividing the average number of transactions Ta per day (d) by all charging stations CS(X) in
use:
𝑈𝑈𝐶𝐶𝐶𝐶 = 𝑇𝑇𝑎𝑎(𝑎𝑎) ÷ 𝐶𝐶𝑆𝑆(𝑋𝑋)
3.3 Content of tool The Valet Charging tool is created to support a Valet Charger in registering incoming (PH)EVs
and making a schedule for the charging of (PH)EVs. This tool is designed as a spreadsheet and
is able to facilitate multiple dispatching methods.
The Valet Charging tool is meant to register (PH)EVs upon arrival. Besides the general driver
information that the user-database provides, the valet is required to add time of arrival,
estimated time of departure and state of charge. Once registered the (PH)EVs will be included
in the charging schedule, which calculates a ranking, based on dispatching rules. When the car
is returned to the user, the valet will sign off the car and register the actual departure time.
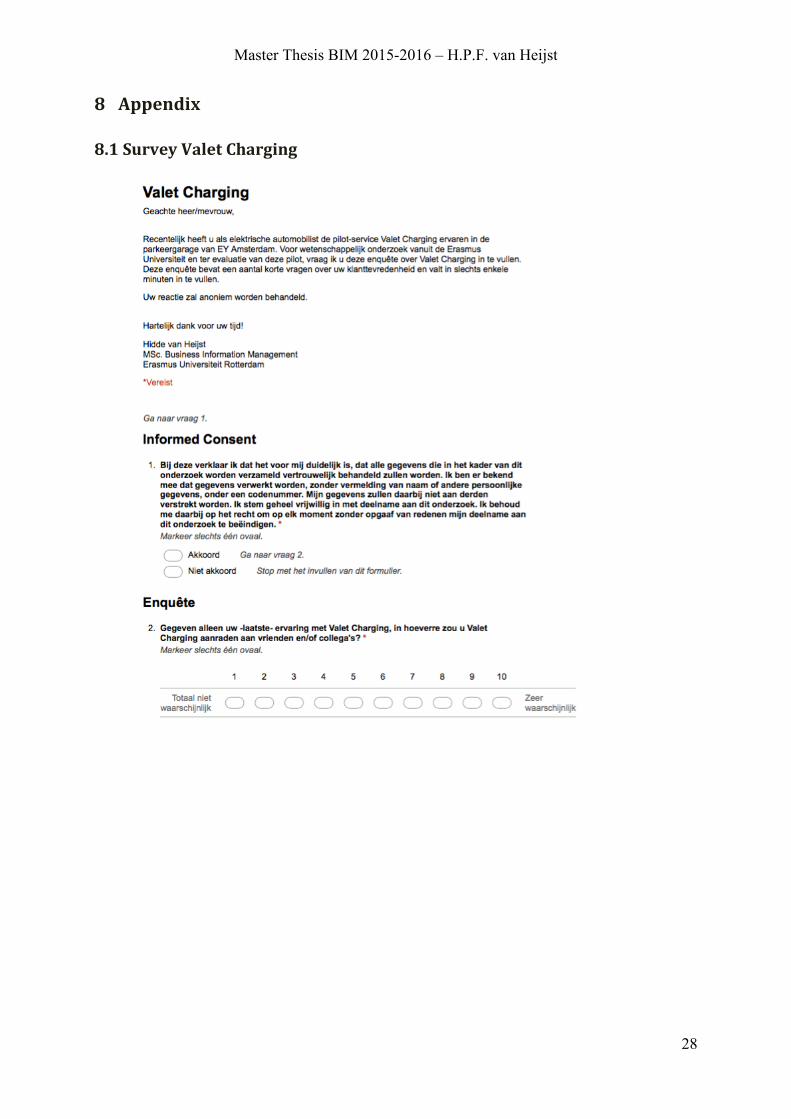
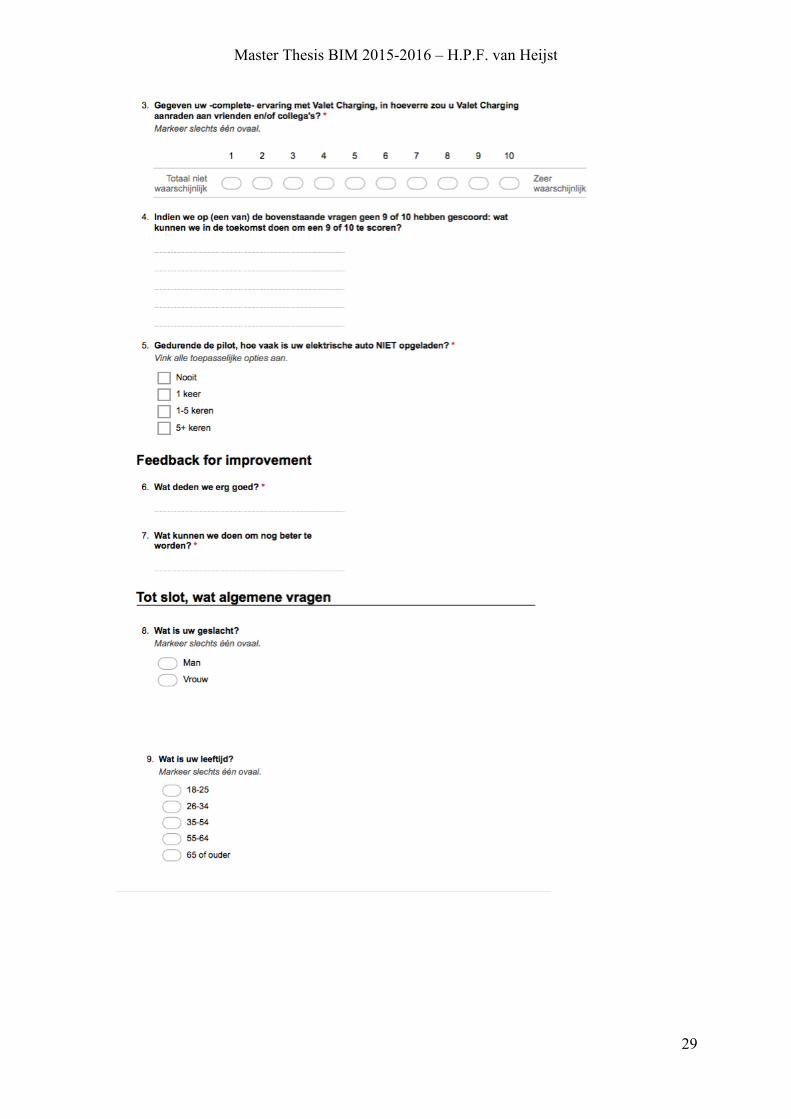
3.4 Content of survey The survey to measure user satisfaction is constructed using the Net Promoter guidelines
(Reichheld & Markey, 2011; Reichheld, 2003). The Net Promoter metric uses recommend
likelihood questions. The Net Promoter score is calculated upon one question, by sorting
respondents into Promoters (9-10), Neutrals (7-8) and Detractors (0-6). After sorting, the
percentage of respondents that are detractors are subtracted from the percentage of respondents
that are promoters. In addition, the survey collects other feedback for service improvement and
contains a question to estimate service level. Generally, a net-promoter score that is positive
(>0%) is considered good, >50% is excellent, and >75% can be considered as a world-class
service (Reichheld, 2003). Although research suggests that rather a variety of measures should
be used instead of simply one measure (Schneider et al., 2008), the Net Promoter has been
chosen for its simple and quick-to answer approach. This is because of the users’ brief moment
of interaction with Valet Charging and time constraints. Additionally, other survey guidelines,
such as the American Customer Satisfaction Index (ACSI) contain a more extensive amount of
questions, but often show similar results (Keiningham et al., 2008). The Net Promoter
10
Master Thesis BIM 2015-2016 – H.P.F. van Heijst
questionnaire is adjusted to fit the context of this research. In this questionnaire it is assumed
that a recommendation of Valet Charging can be seen as a positive user satisfaction. The full
questionnaire can be found in the appendix (§8.1).
3.5 The investigated organization The respondents all originate from the same organization, called Ernst & Young (EY). This
organization has fifteen locations in the Netherlands, and counts 226 partners and 3.600
employees. The core-businesses of the organization is financial services, and targets multiple
industries.
3.5.1 Relevancy of organization
In order to create and evaluate dispatching methods for Valet Charging, an environment is
needed that is confronted with the need for Valet Charging services. EY is endorsing the use of
electric vehicles in order to underline their corporate responsibility. This results in an increased
share of electric vehicles in EY’s car park fleet, which consequently requires EY to increase
charging facilities.
3.5.1.1 Context of valet charging
As a result of the electric vehicle endorsement by EY, their car park faced a lack of charging
stations. Additionally, research shows that their current charging facilities are under-utilized
(Bodenhorst Meyer, 2015). Increasing the number of charging stations is costly, and is limited
by the buildings capacity. In order to avoid substantial investments, EY seeks other solutions,
such as Valet Charging. They hope Valet Charging will realize a higher utilization of their
charging stations, and will be an addition to the customer experience they offer. Additionally,
in the current situation, PHEVs are often left with no charge, and they consequently drive more
kilometres on fossil fuel (Bodenhorst Meyer, 2015). EY expects that their PHEVs are able to
drive more ‘electric miles’ as a result of the increased charging availability. The organization
is therefore interested in the amount of litres gasoline saved versus kW charged, and its change
in emissions.
3.6 Method of data collection Data is collected through different channels. Transaction data generated by charging stations is
obtained from the period before and during the Valet Charging project. This data will be
analysed to address load distribution and utilization.
11
Master Thesis BIM 2015-2016 – H.P.F. van Heijst
The survey used in this research is constructed using Google Forms. This website provides
survey software to design and conduct surveys. All employees of EY using the service received
an e-mail containing a link to the Google Forms web-survey. The results of this survey will be
used to address service level and user satisfaction.
3.6.1 Respondents survey
The employees working at EY Amsterdam, that lease a (PH)EV, are the investigated population
of this thesis. Before selecting the population, some criteria has been set in order to safeguard
the quality of the response:
- The respondents have to be persons that had no influence on the initiation of the Valet
Charging project.
o Doing this, the respondents are not able to influence the choice for Valet
Charging. They are in essence ‘forced’ to submit themselves to the project.
- The respondents have to be able to independently create a positive or negative attitude
towards Valet Charging.
- Managers and other sorts of (high) functions are excluded from participations as they
often already have a positive attitude; they tend to think in the organizations’ favour.
The survey received 42 respondents, which accounts for 58% of the total population (72)
selected for this survey.
4 Results
In this section, the results of the research conducted at EY will be presented. First, the
dispatching methods are discussed, followed by a general evaluation of Valet Charging. The
different performances will be shown using the performance indicators as set in the previous
chapter.
4.1 Dispatching methods The investigated organization intended to start with Valet Charging in March 2016. However,
due to delay on the ‘go’ decision from the management, a delay of one month occurred. The
valets needed a lot of time to learn on their job, because this is the first time they experienced
Valet Charging. For example, the valets need to learn how to work with electric vehicles,
charging stations, the users and how to schedule the charging of (PH)EVs. Additionally, the
users have to get used to Valet Charging. Coming from a situation where the users had to do
the charging of their (PH)EV themselves, the users now were required to hand over their keys
12
Master Thesis BIM 2015-2016 – H.P.F. van Heijst
to the valet and give information such as estimated departure time. All in all, the start-up phase
of Valet Charging took longer than anticipated. Therefore, the different dispatching methods
were not tested in this phase as various dispatching variables needed could not be requested
from the users. The only dispatching variable that is used throughout the project was estimated
departure time. Consequently, the focus of the research results is more on Valet Charging in
general.
4.2 General comparison Valet Charging results will be shown and compared to the situation without Valet Charging,
using data gathered over a period of two months. The comparison will be made with the use of
the set performance indicators. First, the charging station utilization and load shifting
contribution results will be shown, which is calculated using the charging station data. Second,
the survey results will be displayed, elaborating on the service level and user satisfaction.
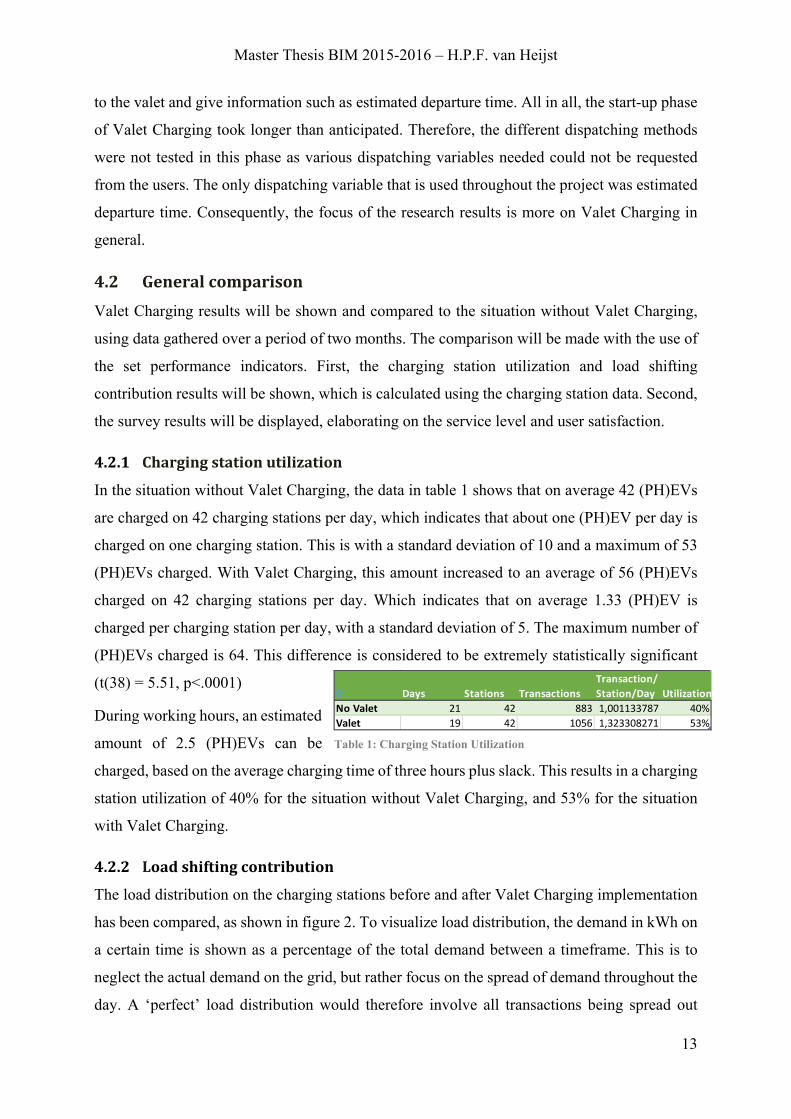
4.2.1 Charging station utilization
In the situation without Valet Charging, the data in table 1 shows that on average 42 (PH)EVs
are charged on 42 charging stations per day, which indicates that about one (PH)EV per day is
charged on one charging station. This is with a standard deviation of 10 and a maximum of 53
(PH)EVs charged. With Valet Charging, this amount increased to an average of 56 (PH)EVs
charged on 42 charging stations per day. Which indicates that on average 1.33 (PH)EV is
charged per charging station per day, with a standard deviation of 5. The maximum number of
(PH)EVs charged is 64. This difference is considered to be extremely statistically significant
(t(38) = 5.51, p<.0001)
During working hours, an estimated
amount of 2.5 (PH)EVs can be
charged, based on the average charging time of three hours plus slack. This results in a charging
station utilization of 40% for the situation without Valet Charging, and 53% for the situation
with Valet Charging.
4.2.2 Load shifting contribution
The load distribution on the charging stations before and after Valet Charging implementation
has been compared, as shown in figure 2. To visualize load distribution, the demand in kWh on
a certain time is shown as a percentage of the total demand between a timeframe. This is to
neglect the actual demand on the grid, but rather focus on the spread of demand throughout the
day. A ‘perfect’ load distribution would therefore involve all transactions being spread out
Table 1: Charging Station Utilization
0 Days Stations TransactionsTransaction/Station/Day Utilization
No Valet 21 42 883 1,001133787 40%Valet 19 42 1056 1,323308271 53%
13
Master Thesis BIM 2015-2016 – H.P.F. van Heijst
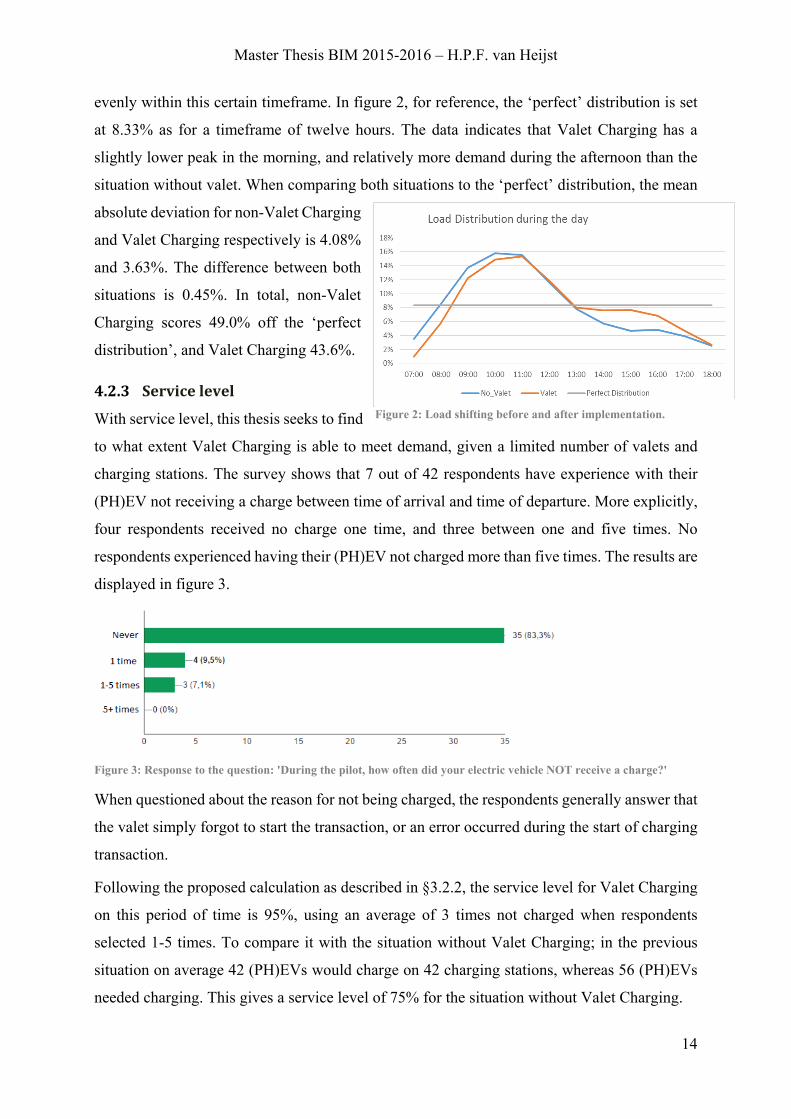
evenly within this certain timeframe. In figure 2, for reference, the ‘perfect’ distribution is set
at 8.33% as for a timeframe of twelve hours. The data indicates that Valet Charging has a
slightly lower peak in the morning, and relatively more demand during the afternoon than the
situation without valet. When comparing both situations to the ‘perfect’ distribution, the mean
absolute deviation for non-Valet Charging
and Valet Charging respectively is 4.08%
and 3.63%. The difference between both
situations is 0.45%. In total, non-Valet
Charging scores 49.0% off the ‘perfect
distribution’, and Valet Charging 43.6%.
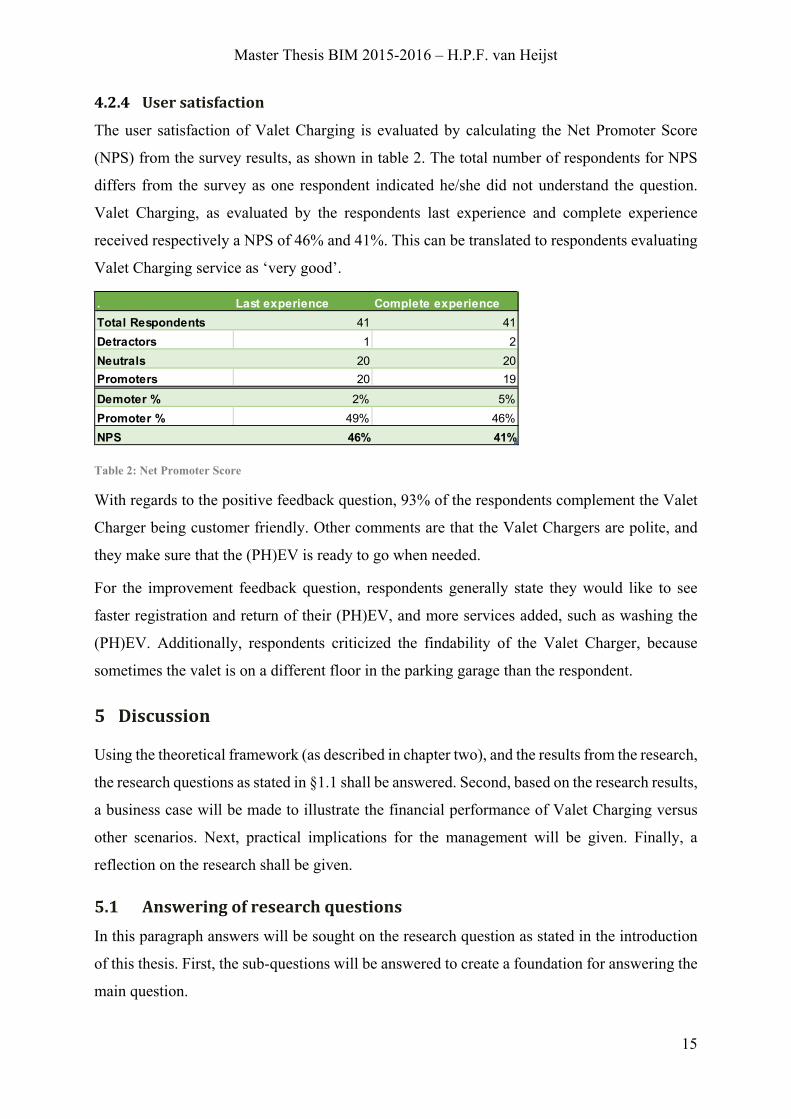
4.2.3 Service level
With service level, this thesis seeks to find
to what extent Valet Charging is able to meet demand, given a limited number of valets and
charging stations. The survey shows that 7 out of 42 respondents have experience with their
(PH)EV not receiving a charge between time of arrival and time of departure. More explicitly,
four respondents received no charge one time, and three between one and five times. No
respondents experienced having their (PH)EV not charged more than five times. The results are
displayed in figure 3.
Figure 3: Response to the question: 'During the pilot, how often did your electric vehicle NOT receive a charge?'
When questioned about the reason for not being charged, the respondents generally answer that
the valet simply forgot to start the transaction, or an error occurred during the start of charging
transaction.
Following the proposed calculation as described in §3.2.2, the service level for Valet Charging
on this period of time is 95%, using an average of 3 times not charged when respondents
selected 1-5 times. To compare it with the situation without Valet Charging; in the previous
situation on average 42 (PH)EVs would charge on 42 charging stations, whereas 56 (PH)EVs
needed charging. This gives a service level of 75% for the situation without Valet Charging.
Figure 2: Load shifting before and after implementation.
14
Master Thesis BIM 2015-2016 – H.P.F. van Heijst
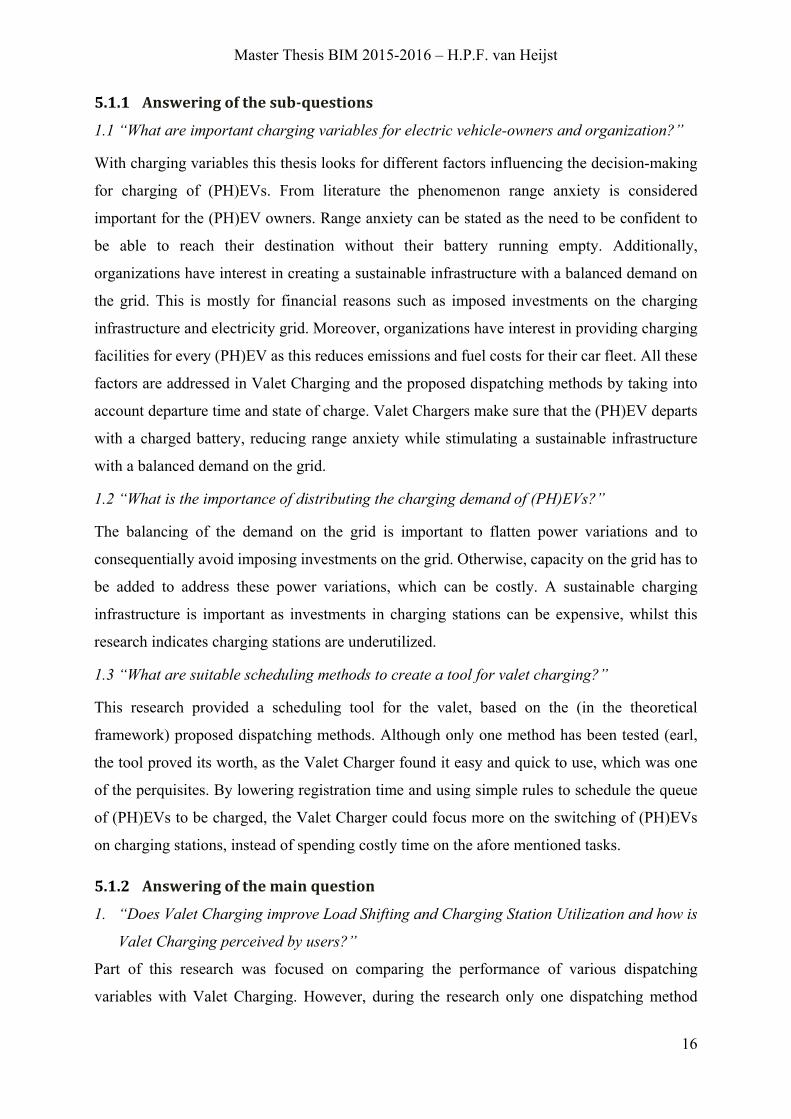
4.2.4 User satisfaction
The user satisfaction of Valet Charging is evaluated by calculating the Net Promoter Score
(NPS) from the survey results, as shown in table 2. The total number of respondents for NPS
differs from the survey as one respondent indicated he/she did not understand the question.
Valet Charging, as evaluated by the respondents last experience and complete experience
received respectively a NPS of 46% and 41%. This can be translated to respondents evaluating
Valet Charging service as ‘very good’.
Table 2: Net Promoter Score
With regards to the positive feedback question, 93% of the respondents complement the Valet
Charger being customer friendly. Other comments are that the Valet Chargers are polite, and
they make sure that the (PH)EV is ready to go when needed.
For the improvement feedback question, respondents generally state they would like to see
faster registration and return of their (PH)EV, and more services added, such as washing the
(PH)EV. Additionally, respondents criticized the findability of the Valet Charger, because
sometimes the valet is on a different floor in the parking garage than the respondent.
5 Discussion
Using the theoretical framework (as described in chapter two), and the results from the research,
the research questions as stated in §1.1 shall be answered. Second, based on the research results,
a business case will be made to illustrate the financial performance of Valet Charging versus
other scenarios. Next, practical implications for the management will be given. Finally, a
reflection on the research shall be given.
5.1 Answering of research questions In this paragraph answers will be sought on the research question as stated in the introduction
of this thesis. First, the sub-questions will be answered to create a foundation for answering the
main question.
. Last experience Complete experienceTotal Respondents 41 41Detractors 1 2Neutrals 20 20Promoters 20 19Demoter % 2% 5%Promoter % 49% 46%NPS 46% 41%
15
Master Thesis BIM 2015-2016 – H.P.F. van Heijst
5.1.1 Answering of the sub-questions
1.1 “What are important charging variables for electric vehicle-owners and organization?”
With charging variables this thesis looks for different factors influencing the decision-making
for charging of (PH)EVs. From literature the phenomenon range anxiety is considered
important for the (PH)EV owners. Range anxiety can be stated as the need to be confident to
be able to reach their destination without their battery running empty. Additionally,
organizations have interest in creating a sustainable infrastructure with a balanced demand on
the grid. This is mostly for financial reasons such as imposed investments on the charging
infrastructure and electricity grid. Moreover, organizations have interest in providing charging
facilities for every (PH)EV as this reduces emissions and fuel costs for their car fleet. All these
factors are addressed in Valet Charging and the proposed dispatching methods by taking into
account departure time and state of charge. Valet Chargers make sure that the (PH)EV departs
with a charged battery, reducing range anxiety while stimulating a sustainable infrastructure
with a balanced demand on the grid.
1.2 “What is the importance of distributing the charging demand of (PH)EVs?”
The balancing of the demand on the grid is important to flatten power variations and to
consequentially avoid imposing investments on the grid. Otherwise, capacity on the grid has to
be added to address these power variations, which can be costly. A sustainable charging
infrastructure is important as investments in charging stations can be expensive, whilst this
research indicates charging stations are underutilized.
1.3 “What are suitable scheduling methods to create a tool for valet charging?”
This research provided a scheduling tool for the valet, based on the (in the theoretical
framework) proposed dispatching methods. Although only one method has been tested (earl,
the tool proved its worth, as the Valet Charger found it easy and quick to use, which was one
of the perquisites. By lowering registration time and using simple rules to schedule the queue
of (PH)EVs to be charged, the Valet Charger could focus more on the switching of (PH)EVs
on charging stations, instead of spending costly time on the afore mentioned tasks.
5.1.2 Answering of the main question
1. “Does Valet Charging improve Load Shifting and Charging Station Utilization and how is
Valet Charging perceived by users?”
Part of this research was focused on comparing the performance of various dispatching
variables with Valet Charging. However, during the research only one dispatching method
16
Master Thesis BIM 2015-2016 – H.P.F. van Heijst
could be tested. Therefore, this thesis is unable to compare different dispatching methods and
answer this research question.
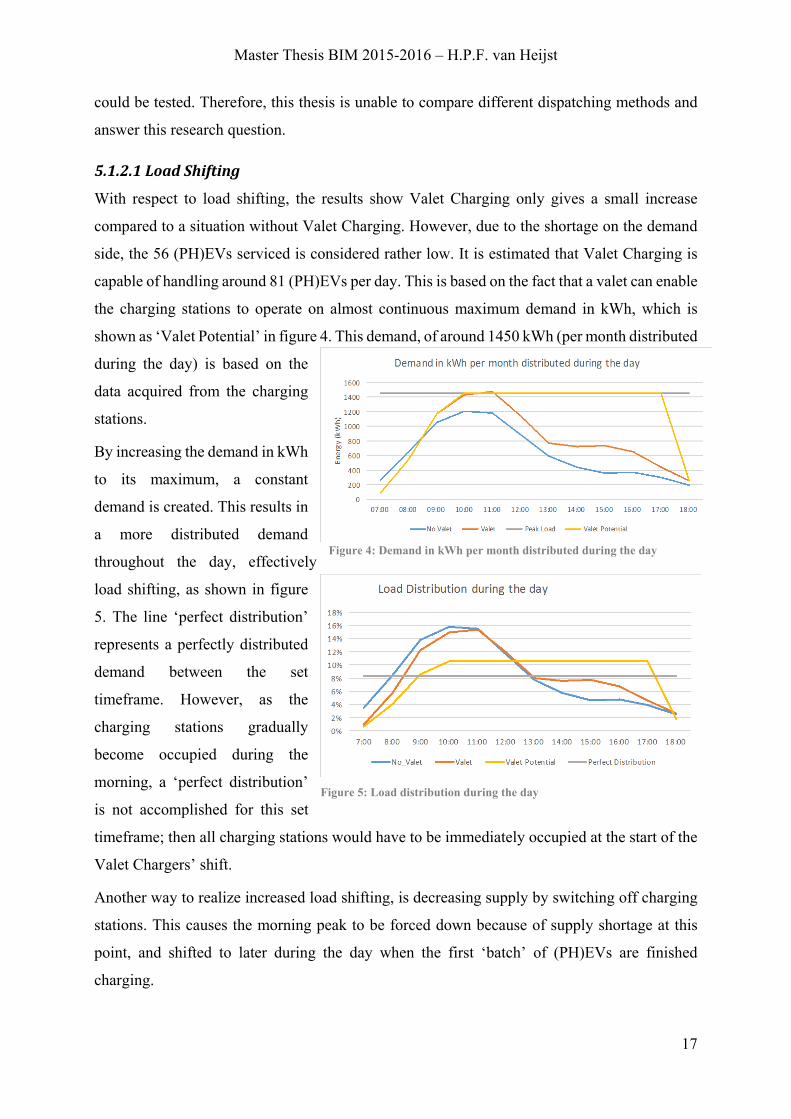
5.1.2.1 Load Shifting
With respect to load shifting, the results show Valet Charging only gives a small increase
compared to a situation without Valet Charging. However, due to the shortage on the demand
side, the 56 (PH)EVs serviced is considered rather low. It is estimated that Valet Charging is
capable of handling around 81 (PH)EVs per day. This is based on the fact that a valet can enable
the charging stations to operate on almost continuous maximum demand in kWh, which is
shown as ‘Valet Potential’ in figure 4. This demand, of around 1450 kWh (per month distributed
during the day) is based on the
data acquired from the charging
stations.
By increasing the demand in kWh
to its maximum, a constant
demand is created. This results in
a more distributed demand
throughout the day, effectively
load shifting, as shown in figure
5. The line ‘perfect distribution’
represents a perfectly distributed
demand between the set
timeframe. However, as the
charging stations gradually
become occupied during the
morning, a ‘perfect distribution’
is not accomplished for this set
timeframe; then all charging stations would have to be immediately occupied at the start of the
Valet Chargers’ shift.
Another way to realize increased load shifting, is decreasing supply by switching off charging
stations. This causes the morning peak to be forced down because of supply shortage at this
point, and shifted to later during the day when the first ‘batch’ of (PH)EVs are finished
charging.
Figure 5: Load distribution during the day
Figure 4: Demand in kWh per month distributed during the day
17
Master Thesis BIM 2015-2016 – H.P.F. van Heijst
5.1.2.2 Charging station utilization
As derived from the results, charging station utilization significantly went up from 40% without
Valet Charging to 53% with Valet Charging. This can be explained by the fact that in the
situation without Valet Charging, the fully charged (PH)EV would occupy the charging station
for the whole day, and now the valet swaps the vehicle for a (PH)EV that requires charging.
However, because there is a shortage on the demand-side (i.e. too few (PH)EVs require
charging), there is room for improvement. When considering the potential of Valet Charging
as described in the previous paragraph, this utilization can go up to 77%. This research therefore
concludes that Valet Charging increases charging utilization. Moreover, charging station
utilization seems to be linked with load shifting, as to improve utilization, (PH)EVs charge one
after another instead of all simultaneously at once, effectively distributing demand throughout
the day.
5.1.2.3 The perception of Valet Charging by users
Valet Charging, as evaluated by the respondents last experience and complete experience
respectively received a NPS of 46% and 41%. This can be translated to respondents evaluating
Valet Charging service as ‘very good’. This is also supported by the estimated service level of
95%, as opposed to the service level of 75% in the situation without Valet Charging. Based on
these results, it can be concluded that Valet Charging is generally very positive perceived by
users of the service.
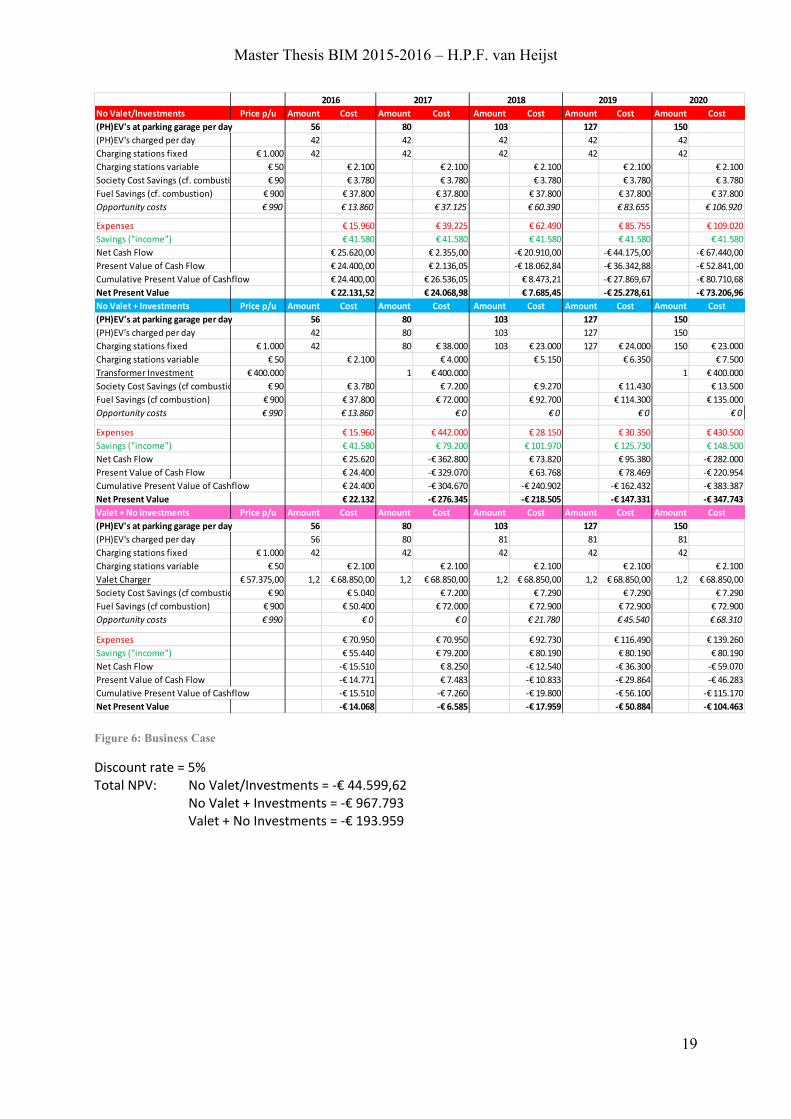
5.2 Business Case Using the research results, a business case has been made to illustrate the financial performance
of Valet Charging versus other scenarios. For this case there are three scenarios used: 1. No
Valet Charging and no investments in the charging infrastructure, 2. No Valet Charging and
only investments in the charging infrastructure, and 3. Valet Charging without investments in
the charging infrastructure. All the costs and benefits are based on calculations on the results,
estimations by experts, and some assumptions. For each cost and benefit an explanation will be
given how they are monetized. The business case can be found on the next page. After, the
explanations are given.
18
Master Thesis BIM 2015-2016 – H.P.F. van Heijst
Figure 6: Business Case
Discount rate = 5% Total NPV: No Valet/Investments = -€ 44.599,62 No Valet + Investments = -€ 967.793 Valet + No Investments = -€ 193.959
No Valet/Investments Price p/u Amount Cost Amount Cost Amount Cost Amount Cost Amount Cost(PH)EV's at parking garage per day 56 80 103 127 150(PH)EV's charged per day 42 42 42 42 42Charging stations fixed € 1.000 42 42 42 42 42Charging stations variable € 50 € 2.100 € 2.100 € 2.100 € 2.100 € 2.100Society Cost Savings (cf. combusti € 90 € 3.780 € 3.780 € 3.780 € 3.780 € 3.780Fuel Savings (cf. combustion) € 900 € 37.800 € 37.800 € 37.800 € 37.800 € 37.800Opportunity costs € 990 € 13.860 € 37.125 € 60.390 € 83.655 € 106.920
Expenses € 15.960 € 39.225 € 62.490 € 85.755 € 109.020Savings ("income") € 41.580 € 41.580 € 41.580 € 41.580 € 41.580Net Cash Flow € 25.620,00 € 2.355,00 -€ 20.910,00 -€ 44.175,00 -€ 67.440,00Present Value of Cash Flow € 24.400,00 € 2.136,05 -€ 18.062,84 -€ 36.342,88 -€ 52.841,00Cumulative Present Value of Cashflow € 24.400,00 € 26.536,05 € 8.473,21 -€ 27.869,67 -€ 80.710,68Net Present Value € 22.131,52 € 24.068,98 € 7.685,45 -€ 25.278,61 -€ 73.206,96No Valet + Investments Price p/u Amount Cost Amount Cost Amount Cost Amount Cost Amount Cost(PH)EV's at parking garage per day 56 80 103 127 150(PH)EV's charged per day 42 80 103 127 150Charging stations fixed € 1.000 42 80 € 38.000 103 € 23.000 127 € 24.000 150 € 23.000Charging stations variable € 50 € 2.100 € 4.000 € 5.150 € 6.350 € 7.500Transformer Investment € 400.000 1 € 400.000 1 € 400.000Society Cost Savings (cf combustio € 90 € 3.780 € 7.200 € 9.270 € 11.430 € 13.500Fuel Savings (cf combustion) € 900 € 37.800 € 72.000 € 92.700 € 114.300 € 135.000Opportunity costs € 990 € 13.860 € 0 € 0 € 0 € 0
Expenses € 15.960 € 442.000 € 28.150 € 30.350 € 430.500Savings ("income") € 41.580 € 79.200 € 101.970 € 125.730 € 148.500Net Cash Flow € 25.620 -€ 362.800 € 73.820 € 95.380 -€ 282.000Present Value of Cash Flow € 24.400 -€ 329.070 € 63.768 € 78.469 -€ 220.954Cumulative Present Value of Cashflow € 24.400 -€ 304.670 -€ 240.902 -€ 162.432 -€ 383.387Net Present Value € 22.132 -€ 276.345 -€ 218.505 -€ 147.331 -€ 347.743Valet + No investments Price p/u Amount Cost Amount Cost Amount Cost Amount Cost Amount Cost(PH)EV's at parking garage per day 56 80 103 127 150(PH)EV's charged per day 56 80 81 81 81Charging stations fixed € 1.000 42 42 42 42 42Charging stations variable € 50 € 2.100 € 2.100 € 2.100 € 2.100 € 2.100Valet Charger € 57.375,00 1,2 € 68.850,00 1,2 € 68.850,00 1,2 € 68.850,00 1,2 € 68.850,00 1,2 € 68.850,00Society Cost Savings (cf combustio € 90 € 5.040 € 7.200 € 7.290 € 7.290 € 7.290Fuel Savings (cf combustion) € 900 € 50.400 € 72.000 € 72.900 € 72.900 € 72.900Opportunity costs € 990 € 0 € 0 € 21.780 € 45.540 € 68.310
Expenses € 70.950 € 70.950 € 92.730 € 116.490 € 139.260Savings ("income") € 55.440 € 79.200 € 80.190 € 80.190 € 80.190Net Cash Flow -€ 15.510 € 8.250 -€ 12.540 -€ 36.300 -€ 59.070Present Value of Cash Flow -€ 14.771 € 7.483 -€ 10.833 -€ 29.864 -€ 46.283Cumulative Present Value of Cashflow -€ 15.510 -€ 7.260 -€ 19.800 -€ 56.100 -€ 115.170Net Present Value -€ 14.068 -€ 6.585 -€ 17.959 -€ 50.884 -€ 104.463
2016 2017 2018 2019 2020
19
Master Thesis BIM 2015-2016 – H.P.F. van Heijst
5.2.1 Explanations for calculations
5.2.1.1 (PH)EVs at parking garage per day
Currently, there are on average 56 (PH)EVs in the parking garage of EY Amsterdam each day,
based on the transaction data. Using the policies by the government and EY, and the current
trend towards electric transportation, this number is estimated to increase to 150 (PH)EVs by
2020. From 2016 on, this translates to an increase of 23 (PH)EVs per year.
5.2.1.2 (PH)EVs charged per day
The amount of (PH)EVs charged are based on the research data, and the estimation of the
potential of the valet. For the situation without a Valet Charger and no investments in the
charging infrastructure, this leads to an estimated average number of 42 (PH)EVs charged per
day.
In the scenario without Valet Charging and with investments on the charging infrastructure, the
same utilization is assumed. So for each charging station, one (PH)EV will be charged per day
on average. In this scenario the assumption has been made that EY will scale the amount of
charging stations equal to the amount of (PH)EVs in the parking garage.
For the situation with Valet Charger and no investments, currently Valet Charging realizes 56
(PH)EVs on average per day, however, the potential shows this could go up to 81 (PH)EVs per
day.
5.2.1.3 Charging stations fixed
The cost of one charging station is estimated to be around €1000, based on indications by the
provider of the charging stations.
5.2.1.4 Charging station variable
The cost of service/maintenance for one charging station is estimated to be around €50, - per
year. This is based on indications by EY Amsterdam.
5.2.1.5 Fuel savings
Fuel savings are realized due to the fact that more (PH)EVs are able to be charged at EY
Amsterdam. Consequentially, (PH)EVs rely less on their range-extender/combustion engine to
reach their destination. These are direct savings for EY. To calculate these savings, the
following assumptions are made:
- Every charged kWh and consequentially electric driven kilometres replace kilometres driven on fossil fuel.
20
Master Thesis BIM 2015-2016 – H.P.F. van Heijst
- The cost of one kWh is based on the electricity peak-tariffs (which apply during working hours) for EY Amsterdam, the cost of one kWh is (incl. taxes) €0.095. Per kWh a (PH)EV on average drives 4.34 km, or 0.23 kWh per km (ZERauto, 2012).
- The cost of one litre of gasoline is based on the five-year average in The Netherlands, which is €1.66 (Centraal Bureau voor de Statistiek, 2016). Per litre fuel a combustion engine on average drives 14 km (or 0.07 litres per km).
- This translates to 1 kWh is worth €0,52 in gasoline. As a result, one kWh driven is €0.42 cheaper than its gasoline counterpart.
- For 42 (PH)EVs, the charged kWh is about 7500 in one month, or 178.57 kWh per PH(EV) charged on average per month. If this is multiplied by the price difference of one kWh compared to gasoline, this saves EY €75 per car per month, or €900 per year.
Due to the rapid development of the (PH)EV market, technology (relatively to combustion
engines) is expected to increase driving-range and battery-efficiency over the next years.
Therefore, the fuel savings are expected to be higher in the future than as of today. However,
as these developments are unpredictable, this expectancy is not accounted for in the
calculations.
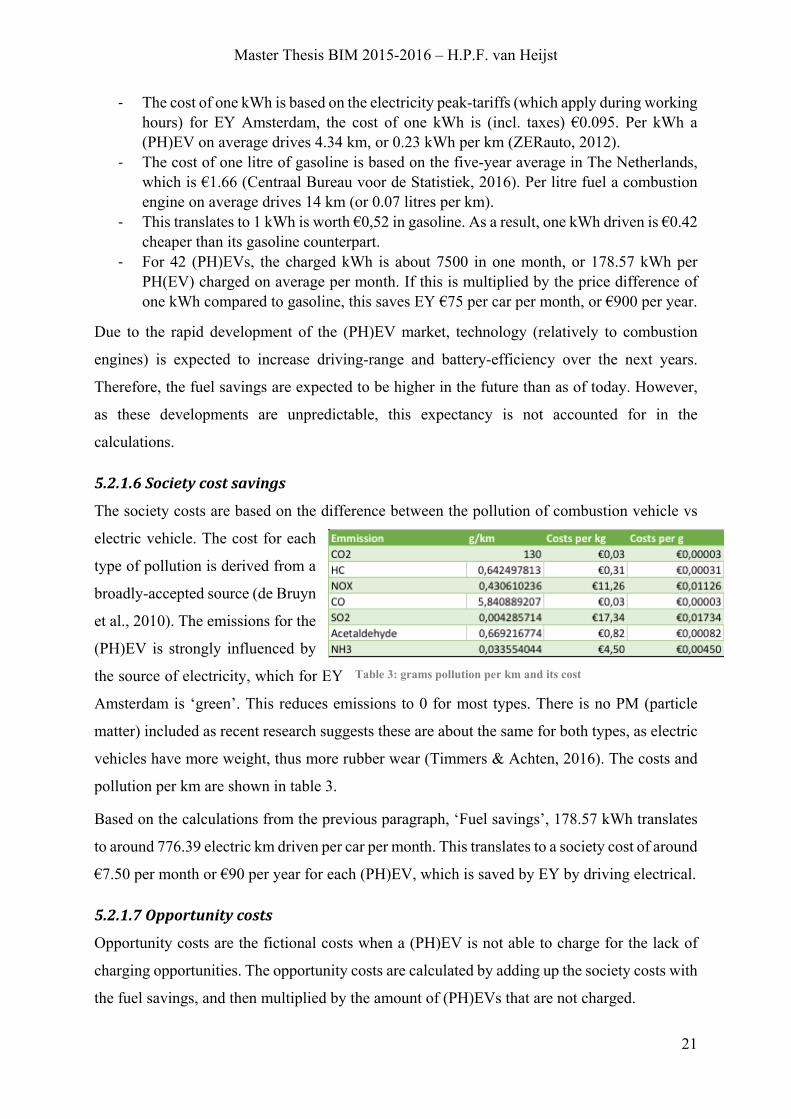
5.2.1.6 Society cost savings
The society costs are based on the difference between the pollution of combustion vehicle vs
electric vehicle. The cost for each
type of pollution is derived from a
broadly-accepted source (de Bruyn
et al., 2010). The emissions for the
(PH)EV is strongly influenced by
the source of electricity, which for EY
Amsterdam is ‘green’. This reduces emissions to 0 for most types. There is no PM (particle
matter) included as recent research suggests these are about the same for both types, as electric
vehicles have more weight, thus more rubber wear (Timmers & Achten, 2016). The costs and
pollution per km are shown in table 3.
Based on the calculations from the previous paragraph, ‘Fuel savings’, 178.57 kWh translates
to around 776.39 electric km driven per car per month. This translates to a society cost of around
€7.50 per month or €90 per year for each (PH)EV, which is saved by EY by driving electrical.
5.2.1.7 Opportunity costs
Opportunity costs are the fictional costs when a (PH)EV is not able to charge for the lack of
charging opportunities. The opportunity costs are calculated by adding up the society costs with
the fuel savings, and then multiplied by the amount of (PH)EVs that are not charged.
Table 3: grams pollution per km and its cost
21
Master Thesis BIM 2015-2016 – H.P.F. van Heijst
5.2.1.8 Transformer investment
The investment cost of a transformer is estimated to be around €400.000 based on a previous
research (Bodenhorst Meyer, 2015). This transformer has to be purchased by EY if they want
to further increase the amount of charging stations to more than 45 (De Brey et al., 2015). The
assumption has been made that this investment is reoccurring for every ~100 charging stations.
5.2.1.9 Valet charger
The valet charger is estimated to cost €57.375 per FTE (full time equivalent). This number is
given by the Valet Charging service (Vervat, 2015). During the first month of the Valet
Charging pilot, the parking garage of EY Amsterdam required 1.2 FTE, and this number is
estimated to hold when the amount of EVs increases, due to the limitation on the supply side
(42 charging stations). The service is estimated to be able to service all 42 stations throughout
the day. If the number of charging stations increases, the amount of required FTE might change.
Social Return
The Valet Charger in the current scenario is a person with an age > 50, with some
distance to the labor market, and therefore would otherwise make use of social security
benefits. This social return is not taken in account in the current calculations
Service
The valet charger can also be seen as an extra feature to provide customer service.
Additionally, the valet charging service could potentially be extended by other features
for (PH)EV users, such as dry-cleaning, car cleaning or checking tire pressure. These
benefits are currently not monetized.
5.3 Practical implications When analyzing the set business case, it becomes apparent that Valet Charging is able to
generate a positive outcome if it is able to meet the demand with its potential efficiency (e.g.
2017 forecast). Therefore, Valet Charging is optimal for situations where enough (PH)EVs are
available to fully make use of the charging infrastructure. When demand exceeds the charging
infrastructure capacity (with a Valet Charger to optimize charging station utilization)
opportunity costs imply a negative outcome (from 2018 on). Moreover, next to financial
incentives it is important to provide charging opportunities for (PH)EV drivers for reasons such
as range anxiety and providing a service as an organization. The results of the survey show a
generally positive perception of Valet Charging as a service.
22
Master Thesis BIM 2015-2016 – H.P.F. van Heijst
Solely investing in charging infrastructure appears to be the most expensive scenario, and the
underutilization of charging stations remain a waste. Therefore, it is wise for organizations to
follow a middle solution by using Valet Charging to increase charging station utilization (and
consequently load distribution), combined with investments in charging infrastructure when the
current infrastructure’s capacity is facing to be exceeded.
5.4 Limitations and suggestions future research Several limitations are found during the execution of this research. First of all, there was a
limited timeframe for the research, and this timeframe was set in the startup phase of the Valet
Charging project at the organization. In theory, variables that matter for reducing anxiety (i.e.
leaving with a fully charged battery) can be addressed by Valet Charging, as it is able to take
into account the departure time and state of charge when creating a charging schedule.
However, due to time constraints, only departure time was used to create (PH)EV charging
schedules. Future research could focus on a later period of a Valet Charging project, where
there is more room for testing dispatching methods.
The investigated organization upgraded their charging infrastructure to significantly more
charging stations. This alleviated the organizations’ shortage in charging infrastructure, and
therefore reduced the need for a solution such as Valet Charging. Therefore, Valet Charging
was not able to show its full potential in reality. Future research could be done at an organization
which truly has a shortage in charging infrastructure, combined with underutilization of this
infrastructure. From this research we suggest an environment where the (PH)EV/charging
station ratio is around 2, which is derived from the potential Valet Charging as described in
§5.1.2.1.
To investigate service level and user satisfaction, a short survey has been used. As it only
represents a small part of the thesis research, service level was represented by only one question,
and the user satisfaction was measured by using the Net Promoter Score system. Future research
could try to use more extensive measuring methods; such as interviews or longer surveys.
Lastly, this research provided the Valet Chargers with a tool to support the registration of
(PH)EVs and to determine a charging schedule. However, the valets had shortcomings in their
computer/excel skills, which lowered the efficiency they were working at. Future research could
look into developing an easier to use program so there is less room for error, increasing
efficiency of the registration of (PH)EVs.
23
Master Thesis BIM 2015-2016 – H.P.F. van Heijst
6 Conclusion
In this thesis, research has focused on Valet Charging, its effect on charging station utilization,
load shifting and the perception of Valet Charging as a service to users. Additionally, this
research tried to compare different dispatching methods for the scheduling of (PH)EVs to be
charged with Valet Charging. Based on the research results can be concluded that Valet
Charging has a positive effect on charging station utilization and load shifting, but it is estimated
that Valet Charging did not reach its full potential during the researched timeframe. The
perception of Valet Charging as a service was generally very positive, with a Net Promoter
Score of 41% on the complete experience, which can be translated as ‘very good’. The service
level of Valet Charging for this research was estimated on 95%.
Organizations can use Valet Charging as a way to increase the utilization of their charging
infrastructure and therefore lower the need for investments in this infrastructure. Additionally,
it can also be seen as providing a service to employees and clients. Financially, a Valet Charger
can generate a positive outcome if performing on its full potential, with no excess demand.
Otherwise opportunity costs imply a negative outcome.
Due to time constraints, the current research was not able to test different dispatching methods,
as well as investigating Valet Charging over a longer period of time. Additionally, due to an
excess of charging infrastructure availability, Valet Charging was not able to perform on its
estimated full potential. Future research could focus on an environment where Valet Charging
can be measured over a longer period of time, and where there is a significant shortage in
charging station infrastructure, combined with underutilization of these charging stations.
24
Master Thesis BIM 2015-2016 – H.P.F. van Heijst
7 References
Astuti, D. (2003). Packet Handling. Seminar on Transport of Multimedia Streams in Wireless Internet.
Bakker, J. (2011). Contesting range anxiety: The role of electric vehicle charging infrastructure in the transportation transition. Eindhoven University of Technology.
Bodenhorst Meyer, B. R. (2015). Motivating flexible charging behavior of electric vehicles at office car parks. Erasmus University Rotterdam.
Botsford, C., & Szczepanek, A. (2009). Fast Charging vs . Slow Charging : Pros and cons for the New Age of Electric Vehicles. Evs24, (May), 1–9. Retrieved from http://www.cars21.com/assets/link/EVS-24-3960315 Botsford.pdf
Brown, A. A. H. (2014). Dispatching Work : Finding the best dispatching method for real job-shops by.
Brown, A. A. H., Dimitrov, S., & Barlatt, A. Y. (2015). Routing distributions and their impact on dispatch rules. Computers & Industrial Engineering, 88, 293–306. http://doi.org/10.1016/j.cie.2015.07.014
Centraal Bureau voor de Statistiek. (2016). Brandstofprijzen van de afgelopen 5 jaar. Retrieved from http://statline.cbs.nl/Statweb/
Chéron, E., & Zins, M. (1997). Electric vehicle purchasing intentions: The concern over battery charge duration. Transportation Research Part A: Policy and Practice, 31(3), 235–243. http://doi.org/10.1016/S0965-8564(96)00018-3
Dabbas, R., & Fowler, J. (2003). A new scheduling approach using combined dispatching criteria in wafer fabs. IEEE Transactions on Semiconductor Manufacturing, 16(3), 501–510. http://doi.org/10.1109/TSM.2003.815201
Daniel Schneider, Matt Berent, Randall Thomas, & Jon Krosnick. (2008). Measuring Customer Satisfaction and Loyalty: Improving the “Net-Promoter” Score, 94. Retrieved from http://www.mattberent.net/Netpromoter_-_AAPOR.pdf
De Brey, B., Driessen, L., & Neervoort, E. (2015). Budget smart charging pilot. de Bruyn, S. M., Korteland, M. H., Markowska, A. Z., Davidson, M. D., de Jong, F. L., Bles,
M., & Sevenster, M. N. (2010). Handboek Schaduwprijzen. Delft: CE Delft. Dominic, P. D. D., Kaliyamoorthy, S., & Kumar, M. S. (2003). Efficient dispatching rules for
dynamic job shop scheduling. The International Journal of Advanced Manufacturing Technology, -1(1), 1–1. http://doi.org/10.1007/s00170-002-1534-5
Eberle, D. U., & von Helmolt, D. R. (2010). Sustainable transportation based on electric vehicle concepts: a brief overview. Energy & Environmental Science, 3(6), 689. http://doi.org/10.1039/c001674h
Enexis. (2011). Smart Charging. Retrieved January 2, 2016, from http://www.smartcharging.nl/en/smart-charging/
Finn, P., Fitzpatrick, C., & Connolly, D. (2012). Demand side management of electric car charging: Benefits for consumer and grid. Energy, 42(1), 358–363. http://doi.org/10.1016/j.energy.2012.03.042
Franke, T., Neumann, I., Bühler, F., Cocron, P., & Krems, J. F. (2012). Experiencing Range in an Electric Vehicle: Understanding Psychological Barriers. Applied Psychology, 61(3), 368–391. http://doi.org/10.1111/j.1464-0597.2011.00474.x
25
Master Thesis BIM 2015-2016 – H.P.F. van Heijst
Grossman, J., Grossman, M., & Katz, R. (1980). The First Systems of Weighted Differential and Integral Calculus. Michael Grossman.
Gu, W., Yu, H., Liu, W., Zhu, J., & Xu, X. (2013). Demand Response and Economic Dispatch of Power Systems Considering Large-Scale Plug-in Hybrid Electric Vehicles/Electric Vehicles (PHEVs/EVs): A Review. Energies, 6(9), 4394–4417. http://doi.org/10.3390/en6094394
Ichoua, S., Gendreau, M., & Potvin, J. Y. (2003). Vehicle dispatching with time-dependent travel times. European Journal of Operational Research, 144(2), 379–396. http://doi.org/10.1016/S0377-2217(02)00147-9
Inage, S.-I. (2010). Modelling Load Shifting Using Electric Vehicles in a Smart Grid Environment. Growth (Lakeland). http://doi.org/10.1787/5km7v0bsmw7k-en
Johnson, S. (2015). Itron Sensing Applications. 2015, 9–10. Retrieved from https://www.itron.com/na/PublishedContent/Itron_Sensing_Applications.pdf
Keiningham, T. L., Aksoy, L., Cooil, B., & Andreassen, T. W. (2008). Linking Customer Loyalty to Growth. MIT Sloan Management Review, 49(4), 51–57. Retrieved from http://search.ebscohost.com/login.aspx?direct=true&db=bth&AN=34793208&site=ehost-live
Lawrie, Matta, & Roberts. (2006). Value speaks louder than words: the management folly of adopting the net promoter score as the “one measure” and why value-for-money provides greater insight. Forethought Research of Science Marketing.
Leurent, F., & Windisch, E. (2011). Triggering the development of electric mobility: a review of public policies. European Transport Research Review, 3(4), 221–235. http://doi.org/10.1007/s12544-011-0064-3
Lyon, T. P., Michelin, M., Jongejan, A., & Leahy, T. (2012). Is “smart charging” policy for electric vehicles worthwhile? Energy Policy, 41, 259–268. http://doi.org/10.1016/j.enpol.2011.10.045
Melouk, S., Damodaran, P., & Chang, P. Y. (2004). Minimizing makespan for single machine batch processing with non-identical job sizes using simulated annealing. International Journal of Production Economics, 87(2), 141–147. http://doi.org/10.1016/S0925-5273(03)00092-6
Nègre, L. (2011). Livre Vert sur les infrastructures de recharge ouvertes au public pour les véhicules « décarbonés ».
Panwalkar, S. S., & Iskander, W. (1977). A Survey of Scheduling Rules. Operations Research, 25(1), 45–61. http://doi.org/10.1287/opre.25.1.45
Petter, S., Delone, W., & Mclean, E. R. (2012). The Past, Present, and Future of “ IS Success .” Journal of the Association for Informaiton Systems, 13(May 2012), 341–362.
Piro, G., Grieco, L. A., Boggia, G., & Camarda, P. (2012). QoS in Wireless LAN : A comparison between feedback-based and earliest due-date approaches. Computer Communications, 35(3), 298–308. http://doi.org/10.1016/j.comcom.2011.10.003
Reichheld, F. F. (2003). The One Number You Need to Grow. Harvard Business Review, 81(12), 46–54+124. http://doi.org/10.1111/j.1467-8616.2008.00516.x
Reichheld, F. F., & Markey, R. (2011). The Ultimate Question 2.0. Harvard Business Review Press.
Strbac, G. (2008). Demand side management: Benefits and challenges. Energy Policy, 36(12),
26
Master Thesis BIM 2015-2016 – H.P.F. van Heijst
4419–4426. http://doi.org/10.1016/j.enpol.2008.09.030 Taillard, É., Badeau, P., Gendreau, M., Guertin, F., & Potvin, J. Y. (1997). A tabu search
heuristic for the vehicle routing problem with soft time windows. Transportation Science, 31(2), 170–186.
Tate, E. D., Harpster, M. O., & Savagian, P. J. (2008). The Electrification of the Automobile: From Conventional Hybrid, to Plug-in Hybrids, to Extended-Range Electric Vehicles. SAE Int. J. Passeng. Cars - Electron. Electr. Syst., 1(1), 156–166. http://doi.org/10.4271/2008-01-0458
Timmers, V. R. J. H., & Achten, P. A. J. (2016). Non-exhaust PM emissions from electric vehicles. Atmospheric Environment, 134, 10–17. http://doi.org/10.1016/j.atmosenv.2016.03.017
TNO. (2016). PHEV Monitor. In Cleaner Car Conference. Amsterdam. Tomić, J., & Kempton, W. (2007). Using fleets of electric-drive vehicles for grid support.
http://doi.org/10.1016/j.jpowsour.2007.03.010 Valogianni, K., Ketter, W., & Collins, J. (2013). Effective Management of Electric Vehicle
Storage Using Smart Charging. Proceedings of the Twenty-Eighth AAAI Conference on Artificial Intelligence, 472–478.
Vervat, F. (2015). Valet charging voorstel 2.0. Rotterdam. Vinod, V., & Sridharan, R. (2011). Int . J . Production Economics Simulation modeling and
analysis of due-date assignment methods and scheduling decision rules in a dynamic job shop production system. Intern. Journal of Production Economics, 129(1), 127–146. http://doi.org/10.1016/j.ijpe.2010.08.017
Weiller, C. (2011). Plug-in hybrid electric vehicle impacts on hourly electricity demand in the United States. Energy Policy, 39(6), 3766–3778. http://doi.org/10.1016/j.enpol.2011.04.005
Wixom, B., & Todd, P. (2005). A theoretical integration of user satisfaction and technology acceptance. Information Systems Research, 16(1), 85–102. http://doi.org/10.1287/isre.1050.0042
ZERauto. (2012). Hoeveel energie verbruikt een elektrisce auto? Retrieved May 26, 2016, from http://www.zerauto.nl/2012/04/26/hoeveel-energie-verbruikt-een-elektrische-auto/
27
Master Thesis BIM 2015-2016 – H.P.F. van Heijst
8 Appendix
8.1 Survey Valet Charging
28
Master Thesis BIM 2015-2016 – H.P.F. van Heijst
29