Embed Size (px)
Citation preview
1
Valero Energy Reports Third Quarter 2016 Results
• Reported net income attributable to Valero stockholders of $613 million, or $1.33 per share.
• Reported adjusted net income attributable to Valero stockholders of $571 million, or $1.24 per
share.
• Returned $778 million in cash to stockholders through dividends and stock buybacks, which
equated to a payout ratio of 148 percent for the first nine months of the year.
• Incurred $198 million of costs to meet biofuel blending obligations, primarily from the
purchase of Renewable Identification Numbers (RINs) in the U.S.
• Expect 2016 capital expenditures to be about $2.4 billion, $200 million lower than previous
guidance.
SAN ANTONIO, October 25, 2016 - Valero Energy Corporation (NYSE: VLO, “Valero”) today
reported net income attributable to Valero stockholders of $613 million, or $1.33 per share, and
adjusted net income attributable to Valero stockholders of $571 million, or $1.24 per share, for the
third quarter of 2016 compared to net income attributable to Valero stockholders of $1.4 billion, or
$2.79 per share, for the third quarter of 2015. Adjusted net income attributable to Valero stockholders
for the third quarter of 2016 excludes an income tax benefit related to the disposition of the Aruba
business of $42 million, or $0.09 per share. Reconciliations of actual to adjusted amounts are shown
in the accompanying earnings release tables.
“Our operations ran well and generated $863 million of cash during the quarter despite a challenging
earnings environment,” said Joe Gorder, Valero Chairman, President and Chief Executive Officer.
“Our team’s focus on safe, reliable, low-cost operations allowed us to deliver solid performance while
executing major turnarounds at our Port Arthur and Ardmore refineries.”
“We exported 329,000 barrels per day (“BPD”) of diesel and gasoline combined during the third
quarter,” said Gorder. “We were pleased to see strong refined product demand continue during the
quarter and we expect consumer demand to remain healthy given low crude oil and refined product
prices.”
2
Refining
The refining segment reported $990 million of operating income for the third quarter of 2016,
compared to $2.3 billion of operating income for the third quarter of 2015. The decline was primarily
attributable to weaker gasoline and distillate margins. Other factors included narrower discounts for
most sweet and sour crude oils relative to the Brent benchmark and higher costs to meet our biofuel
blending obligations (primarily from the purchase of RINs).
Biofuel blending costs were $198 million in the third quarter of 2016, which was $104 million higher
than the third quarter of 2015. Valero continues to expect such costs to be between $750 million and
$850 million for 2016.
Valero’s refineries achieved 95 percent throughput capacity utilization and averaged 2.9 million BPD
of throughput volume in the third quarter of 2016, in line with the third quarter of 2015.
Ethanol
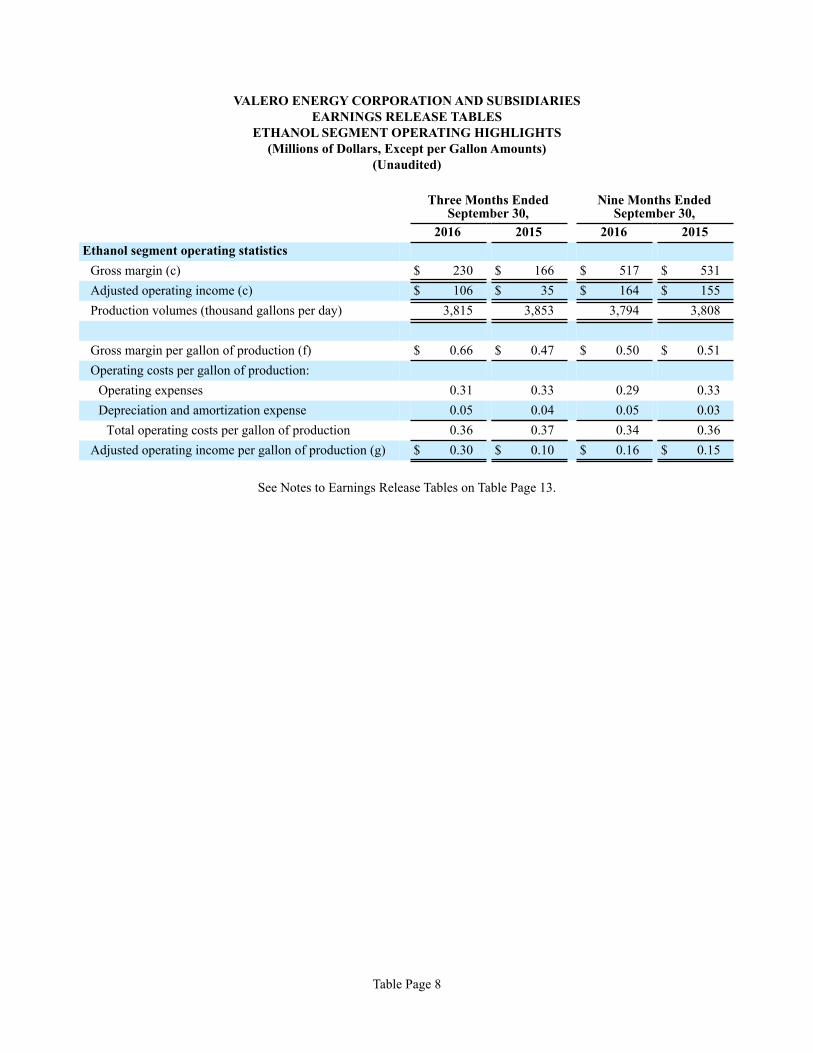
The ethanol segment reported $106 million of operating income for the third quarter of 2016,
compared to $35 million of operating income for the third quarter of 2015. The increase was primarily
due to lower corn prices. Ethanol production volumes averaged 3.8 million gallons per day in the
third quarter of 2016, which was consistent with the third quarter of 2015. Valero expects ethanol
demand to remain strong given high gasoline demand in the U.S. and significant ethanol exports.
Record high corn production in the U.S. is also expected to keep corn prices low in the near term.
Corporate and Other
General and administrative expenses were $192 million in the third quarter of 2016 compared to
$179 million in the third quarter of 2015. The effective tax rate of 18 percent in the third quarter of
2016 was lower than expected primarily due to the tax benefit on the disposition of the Aruba business
noted earlier and the favorable settlement of an income tax audit.
Investing and Financing Activities
Capital investments totaled $453 million in the third quarter of 2016. Valero paid $276 million in
dividends and purchased over 9.2 million shares of its common stock for $502 million, resulting in
3
total cash returned to stockholders of $778 million in the third quarter of 2016. Valero also completed
a $1.25 billion public offering of 3.4 percent senior notes in the third quarter of 2016. In early
October, Valero repaid $950 million of senior notes due in 2017.
“In the third quarter, we continued to focus on improving capital efficiency, investing in our business,
and growing Valero’s earnings power,” said Gorder. “Our team’s efforts in these areas allowed us to
greatly exceed our total payout ratio target.”
Valero defines total payout ratio as the sum of dividends plus stock buybacks divided by adjusted net
income from continuing operations attributable to Valero stockholders. For the first nine months of
2016, Valero delivered a total payout ratio of 148 percent.
Liquidity and Financial Position
Valero ended the third quarter of 2016 with $9.0 billion of total debt and $5.9 billion of cash and
temporary cash investments, of which $35 million was held by Valero Energy Partners LP (NYSE:
VLP, “VLP”). The debt to capital ratio, net of $2.0 billion in cash, was 25 percent. On a pro forma
basis giving effect to the October debt redemption noted earlier, the debt to capital ratio was
22 percent.
Strategic Update
Valero expects 2016 capital investments, including turnarounds, catalyst, and joint venture
investments, to be about $2.4 billion, which is slightly lower than previous guidance.
In September, Valero achieved its stated drop down target for 2016 with the sale of the previously
announced Meraux and Three Rivers Terminal Services Business to VLP.
“We were pleased to see continued growth in VLP through drop downs and incremental organic
projects at VLP,” said Gorder. “Logistics investments are an important part of our strategy to grow
and optimize Valero’s supply chain.”
4
Also in September, the Board of Directors approved an incremental $2.5 billion share repurchase
authorization, resulting in about $2.7 billion of repurchase authority available.
Conference Call
Valero’s senior management will hold a conference call at 11 a.m. ET today to discuss this earnings
release and to provide an update on operations and strategy.
About Valero
Valero Energy Corporation, through its subsidiaries, is an international manufacturer and marketer of
transportation fuels, other petrochemical products and power. Valero subsidiaries employ
approximately 10,000 people, and its assets include 15 petroleum refineries with a combined
throughput capacity of approximately 3 million barrels per day, 11 ethanol plants with a combined
production capacity of 1.4 billion gallons per year, a 50-megawatt wind farm, and renewable diesel
production from a joint venture. Through subsidiaries, Valero owns the general partner of Valero
Energy Partners LP (NYSE: VLP), a midstream master limited partnership. Approximately
7,500 outlets carry the Valero, Diamond Shamrock, Shamrock, and Beacon brands in the United
States; Ultramar in Canada; and Texaco in the United Kingdom and Ireland. Valero is a Fortune 500
company based in San Antonio. Please visit www.valero.com for more information.
Valero Contacts
Investors:
John Locke, Vice President – Investor Relations, 210-345-3077
Karen Ngo, Manager – Investor Relations, 210-345-4574
Media:
Lillian Riojas, Director – Media Relations and Communications, 210-345-5002
Safe-Harbor Statement
Statements contained in this release that state the company’s or management’s expectations or
predictions of the future are forward-looking statements intended to be covered by the safe harbor
provisions of the Securities Act of 1933 and the Securities Exchange Act of 1934. The words
5
“believe,” “expect,” “should,” “estimates,” “intend,” and other similar expressions identify forward-
looking statements. It is important to note that actual results could differ materially from those
projected in such forward-looking statements. For more information concerning factors that could
cause actual results to differ from those expressed or forecasted, see Valero’s annual reports on Form
10-K and quarterly reports on Form 10-Q filed with the SEC and on Valero’s website at
www.valero.com, and VLP’s annual reports on Form 10-K and quarterly reports on Form 10-Q filed
with the SEC and on VLP’s website at www.valeroenergypartners.com.
Use of Non-GAAP Financial Information
This earnings release and the accompanying earnings release tables include references to financial
measures that are not defined under U.S. generally accepted accounting principles (“GAAP”). These
non-GAAP measures include adjusted net income attributable to Valero stockholders, adjusted
earnings per common share – assuming dilution, adjusted operating income, and gross margin. We
have included these non-GAAP financial measures to help facilitate the comparison of operating
results between periods. See the accompanying earnings release tables for a reconciliation of these
non-GAAP measures to their most directly comparable U.S. GAAP measures. In note (c) to earnings
release tables, we disclose the reasons why we believe our use of the non-GAAP financial measures
provides useful information.
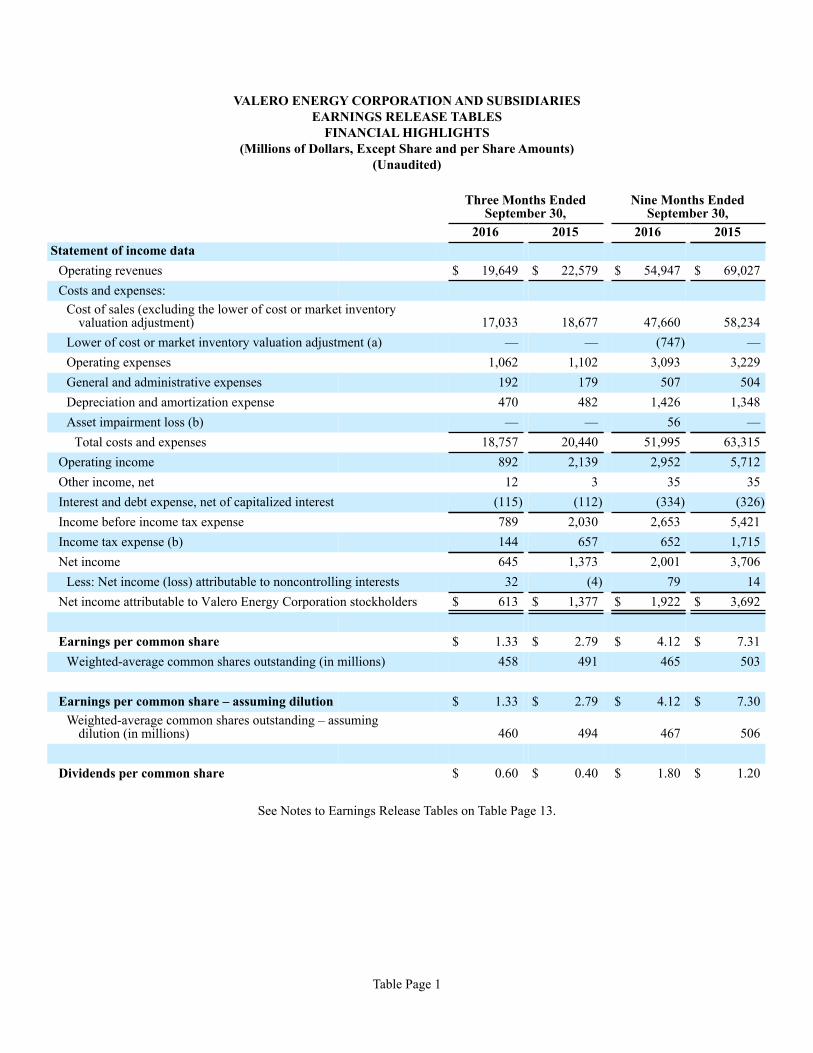
VALERO ENERGY CORPORATION AND SUBSIDIARIESEARNINGS RELEASE TABLES
FINANCIAL HIGHLIGHTS (Millions of Dollars, Except Share and per Share Amounts)
(Unaudited)
Table Page 1
Three Months EndedSeptember 30,
Nine Months EndedSeptember 30,
2016 2015 2016 2015Statement of income data
Operating revenues $ 19,649 $ 22,579 $ 54,947 $ 69,027Costs and expenses:
Cost of sales (excluding the lower of cost or market inventoryvaluation adjustment) 17,033 18,677 47,660 58,234
Lower of cost or market inventory valuation adjustment (a) — — (747) —Operating expenses 1,062 1,102 3,093 3,229General and administrative expenses 192 179 507 504Depreciation and amortization expense 470 482 1,426 1,348Asset impairment loss (b) — — 56 —
Total costs and expenses 18,757 20,440 51,995 63,315Operating income 892 2,139 2,952 5,712Other income, net 12 3 35 35Interest and debt expense, net of capitalized interest (115) (112) (334) (326)Income before income tax expense 789 2,030 2,653 5,421Income tax expense (b) 144 657 652 1,715Net income 645 1,373 2,001 3,706
Less: Net income (loss) attributable to noncontrolling interests 32 (4) 79 14Net income attributable to Valero Energy Corporation stockholders $ 613 $ 1,377 $ 1,922 $ 3,692
Earnings per common share $ 1.33 $ 2.79 $ 4.12 $ 7.31Weighted-average common shares outstanding (in millions) 458 491 465 503
Earnings per common share – assuming dilution $ 1.33 $ 2.79 $ 4.12 $ 7.30Weighted-average common shares outstanding – assuming
dilution (in millions) 460 494 467 506
Dividends per common share $ 0.60 $ 0.40 $ 1.80 $ 1.20
See Notes to Earnings Release Tables on Table Page 13.
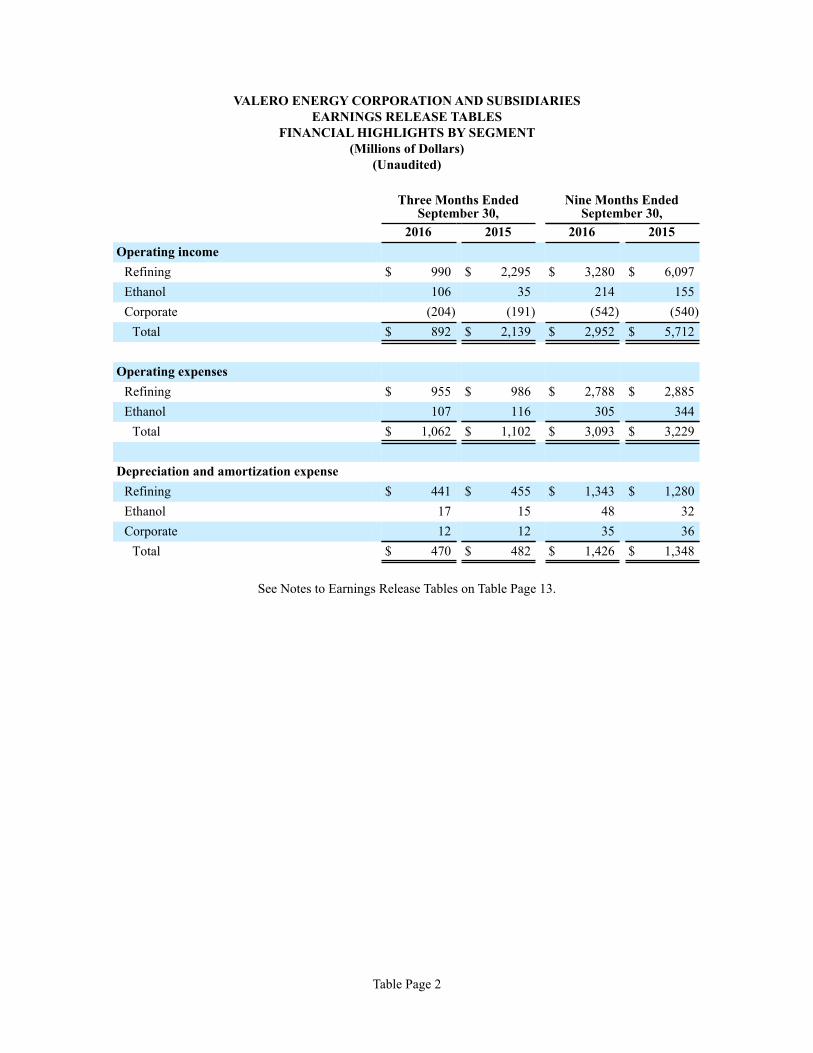
VALERO ENERGY CORPORATION AND SUBSIDIARIESEARNINGS RELEASE TABLES
FINANCIAL HIGHLIGHTS BY SEGMENT(Millions of Dollars)
(Unaudited)
Table Page 2
Three Months EndedSeptember 30,
Nine Months EndedSeptember 30,
2016 2015 2016 2015Operating income
Refining $ 990 $ 2,295 $ 3,280 $ 6,097Ethanol 106 35 214 155Corporate (204) (191) (542) (540)
Total $ 892 $ 2,139 $ 2,952 $ 5,712
Operating expensesRefining $ 955 $ 986 $ 2,788 $ 2,885Ethanol 107 116 305 344
Total $ 1,062 $ 1,102 $ 3,093 $ 3,229
Depreciation and amortization expenseRefining $ 441 $ 455 $ 1,343 $ 1,280Ethanol 17 15 48 32Corporate 12 12 35 36
Total $ 470 $ 482 $ 1,426 $ 1,348
See Notes to Earnings Release Tables on Table Page 13.
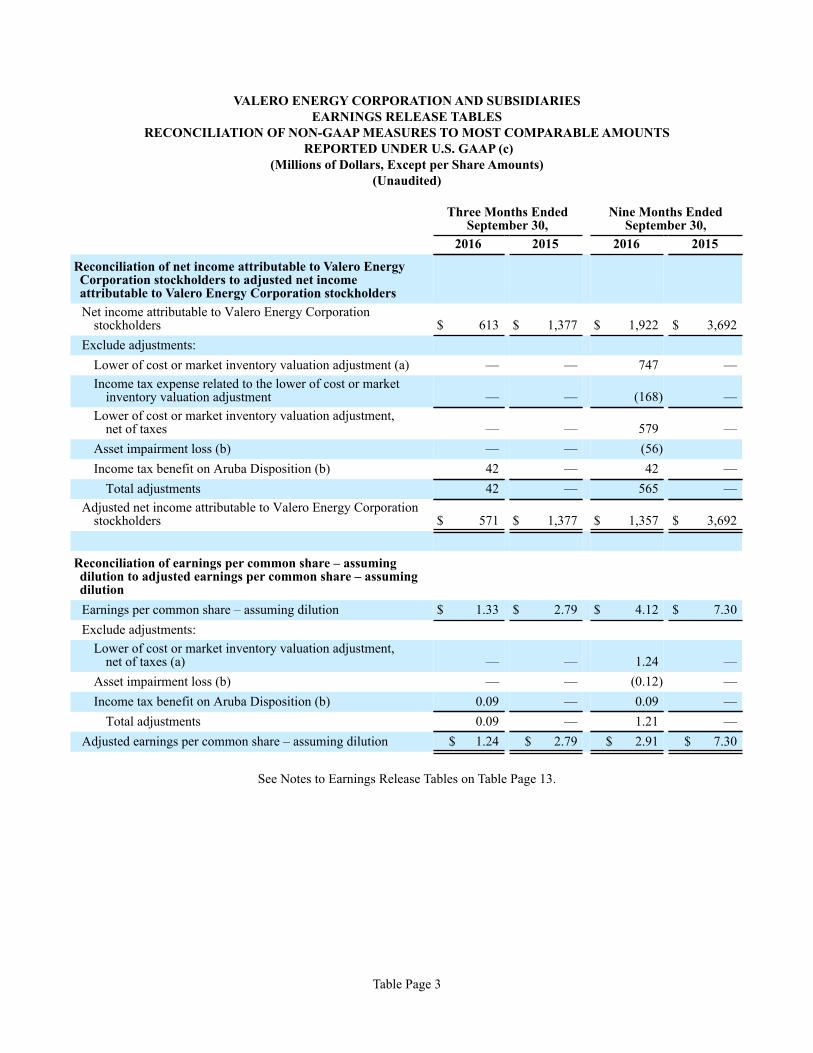
VALERO ENERGY CORPORATION AND SUBSIDIARIESEARNINGS RELEASE TABLES
RECONCILIATION OF NON-GAAP MEASURES TO MOST COMPARABLE AMOUNTS REPORTED UNDER U.S. GAAP (c)
(Millions of Dollars, Except per Share Amounts)(Unaudited)
Table Page 3
Three Months EndedSeptember 30,
Nine Months EndedSeptember 30,
2016 2015 2016 2015
Reconciliation of net income attributable to Valero EnergyCorporation stockholders to adjusted net incomeattributable to Valero Energy Corporation stockholdersNet income attributable to Valero Energy Corporation
stockholders $ 613 $ 1,377 $ 1,922 $ 3,692Exclude adjustments:
Lower of cost or market inventory valuation adjustment (a) — — 747 —Income tax expense related to the lower of cost or market
inventory valuation adjustment — — (168) —Lower of cost or market inventory valuation adjustment,
net of taxes — — 579 —Asset impairment loss (b) — — (56)Income tax benefit on Aruba Disposition (b) 42 — 42 —
Total adjustments 42 — 565 —Adjusted net income attributable to Valero Energy Corporation
stockholders $ 571 $ 1,377 $ 1,357 $ 3,692
Reconciliation of earnings per common share – assumingdilution to adjusted earnings per common share – assumingdilutionEarnings per common share – assuming dilution $ 1.33 $ 2.79 $ 4.12 $ 7.30Exclude adjustments:
Lower of cost or market inventory valuation adjustment,net of taxes (a) — — 1.24 —
Asset impairment loss (b) — — (0.12) —Income tax benefit on Aruba Disposition (b) 0.09 — 0.09 —
Total adjustments 0.09 — 1.21 —Adjusted earnings per common share – assuming dilution $ 1.24 $ 2.79 $ 2.91 $ 7.30
See Notes to Earnings Release Tables on Table Page 13.
VALERO ENERGY CORPORATION AND SUBSIDIARIESEARNINGS RELEASE TABLES
RECONCILIATION OF NON-GAAP MEASURES TO MOST COMPARABLE AMOUNTS REPORTED UNDER U.S. GAAP (c)
(Millions of Dollars)(Unaudited)
Table Page 4
Three Months EndedSeptember 30,
Nine Months EndedSeptember 30,
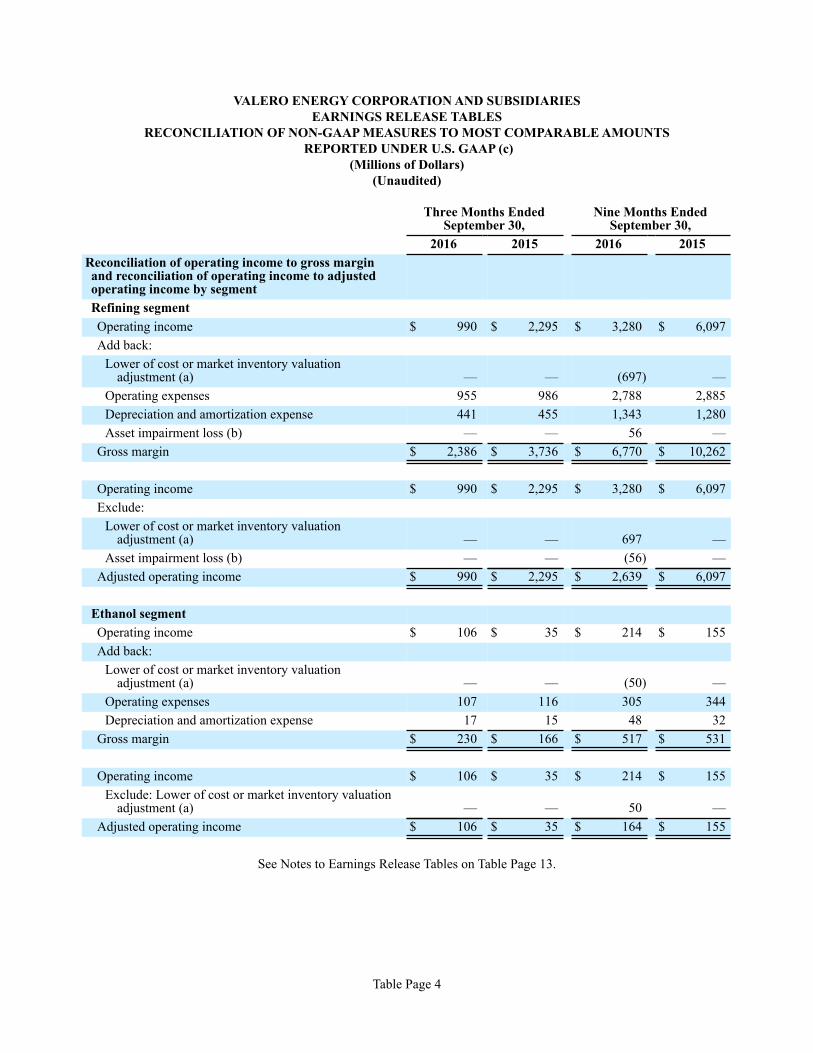
2016 2015 2016 2015Reconciliation of operating income to gross marginand reconciliation of operating income to adjustedoperating income by segmentRefining segmentOperating income $ 990 $ 2,295 $ 3,280 $ 6,097Add back:
Lower of cost or market inventory valuationadjustment (a) — — (697) —
Operating expenses 955 986 2,788 2,885Depreciation and amortization expense 441 455 1,343 1,280Asset impairment loss (b) — — 56 —
Gross margin $ 2,386 $ 3,736 $ 6,770 $ 10,262
Operating income $ 990 $ 2,295 $ 3,280 $ 6,097Exclude:
Lower of cost or market inventory valuationadjustment (a) — — 697 —
Asset impairment loss (b) — — (56) —Adjusted operating income $ 990 $ 2,295 $ 2,639 $ 6,097
Ethanol segmentOperating income $ 106 $ 35 $ 214 $ 155Add back:
Lower of cost or market inventory valuationadjustment (a) — — (50) —
Operating expenses 107 116 305 344Depreciation and amortization expense 17 15 48 32
Gross margin $ 230 $ 166 $ 517 $ 531
Operating income $ 106 $ 35 $ 214 $ 155Exclude: Lower of cost or market inventory valuation
adjustment (a) — — 50 —Adjusted operating income $ 106 $ 35 $ 164 $ 155
See Notes to Earnings Release Tables on Table Page 13.
VALERO ENERGY CORPORATION AND SUBSIDIARIESEARNINGS RELEASE TABLES
RECONCILIATION OF NON-GAAP MEASURES TO MOST COMPARABLE AMOUNTS REPORTED UNDER U.S. GAAP (c)
(Millions of Dollars)(Unaudited)
Table Page 5
Three Months EndedSeptember 30,
Nine Months EndedSeptember 30,
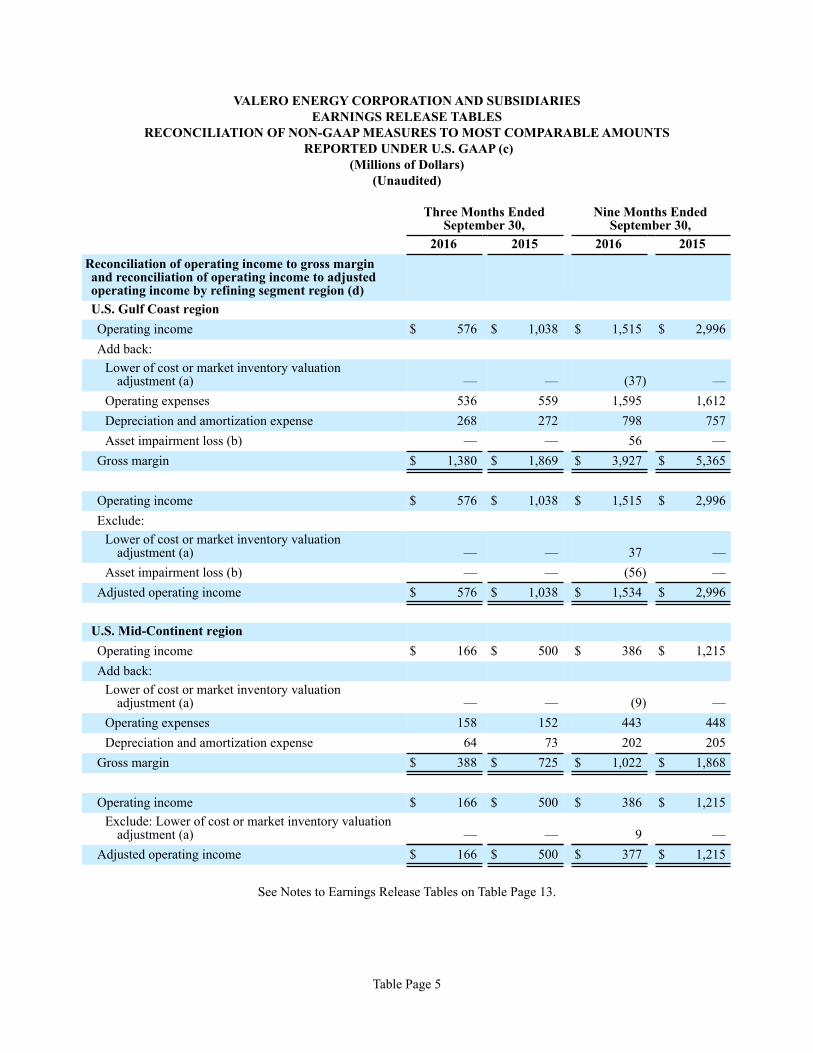
2016 2015 2016 2015Reconciliation of operating income to gross marginand reconciliation of operating income to adjustedoperating income by refining segment region (d)U.S. Gulf Coast regionOperating income $ 576 $ 1,038 $ 1,515 $ 2,996Add back:
Lower of cost or market inventory valuationadjustment (a) — — (37) —
Operating expenses 536 559 1,595 1,612Depreciation and amortization expense 268 272 798 757Asset impairment loss (b) — — 56 —
Gross margin $ 1,380 $ 1,869 $ 3,927 $ 5,365
Operating income $ 576 $ 1,038 $ 1,515 $ 2,996Exclude:
Lower of cost or market inventory valuationadjustment (a) — — 37 —
Asset impairment loss (b) — — (56) —Adjusted operating income $ 576 $ 1,038 $ 1,534 $ 2,996
U.S. Mid-Continent regionOperating income $ 166 $ 500 $ 386 $ 1,215Add back:
Lower of cost or market inventory valuationadjustment (a) — — (9) —
Operating expenses 158 152 443 448Depreciation and amortization expense 64 73 202 205
Gross margin $ 388 $ 725 $ 1,022 $ 1,868
Operating income $ 166 $ 500 $ 386 $ 1,215Exclude: Lower of cost or market inventory valuation
adjustment (a) — — 9 —Adjusted operating income $ 166 $ 500 $ 377 $ 1,215
See Notes to Earnings Release Tables on Table Page 13.
VALERO ENERGY CORPORATION AND SUBSIDIARIESEARNINGS RELEASE TABLES
RECONCILIATION OF NON-GAAP MEASURES TO MOST COMPARABLE AMOUNTS REPORTED UNDER U.S. GAAP (c)
(Millions of Dollars)(Unaudited)
Table Page 6
Three Months EndedSeptember 30,
Nine Months EndedSeptember 30,
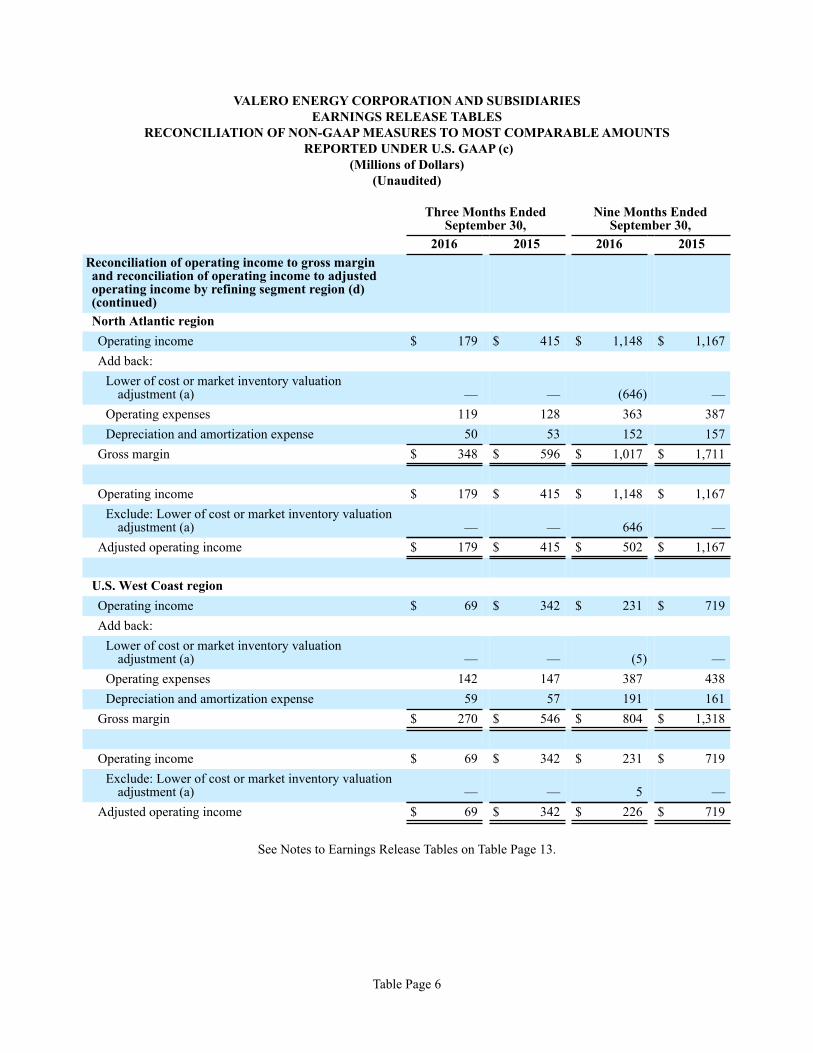
2016 2015 2016 2015Reconciliation of operating income to gross marginand reconciliation of operating income to adjustedoperating income by refining segment region (d)(continued)North Atlantic regionOperating income $ 179 $ 415 $ 1,148 $ 1,167Add back:
Lower of cost or market inventory valuationadjustment (a) — — (646) —
Operating expenses 119 128 363 387Depreciation and amortization expense 50 53 152 157
Gross margin $ 348 $ 596 $ 1,017 $ 1,711
Operating income $ 179 $ 415 $ 1,148 $ 1,167Exclude: Lower of cost or market inventory valuation
adjustment (a) — — 646 —Adjusted operating income $ 179 $ 415 $ 502 $ 1,167
U.S. West Coast regionOperating income $ 69 $ 342 $ 231 $ 719Add back:
Lower of cost or market inventory valuationadjustment (a) — — (5) —
Operating expenses 142 147 387 438Depreciation and amortization expense 59 57 191 161
Gross margin $ 270 $ 546 $ 804 $ 1,318
Operating income $ 69 $ 342 $ 231 $ 719Exclude: Lower of cost or market inventory valuation
adjustment (a) — — 5 —Adjusted operating income $ 69 $ 342 $ 226 $ 719
See Notes to Earnings Release Tables on Table Page 13.
VALERO ENERGY CORPORATION AND SUBSIDIARIESEARNINGS RELEASE TABLES
REFINING SEGMENT OPERATING HIGHLIGHTS(Millions of Dollars, Except per Barrel Amounts)
(Unaudited)
Table Page 7
Three Months EndedSeptember 30,
Nine Months EndedSeptember 30,
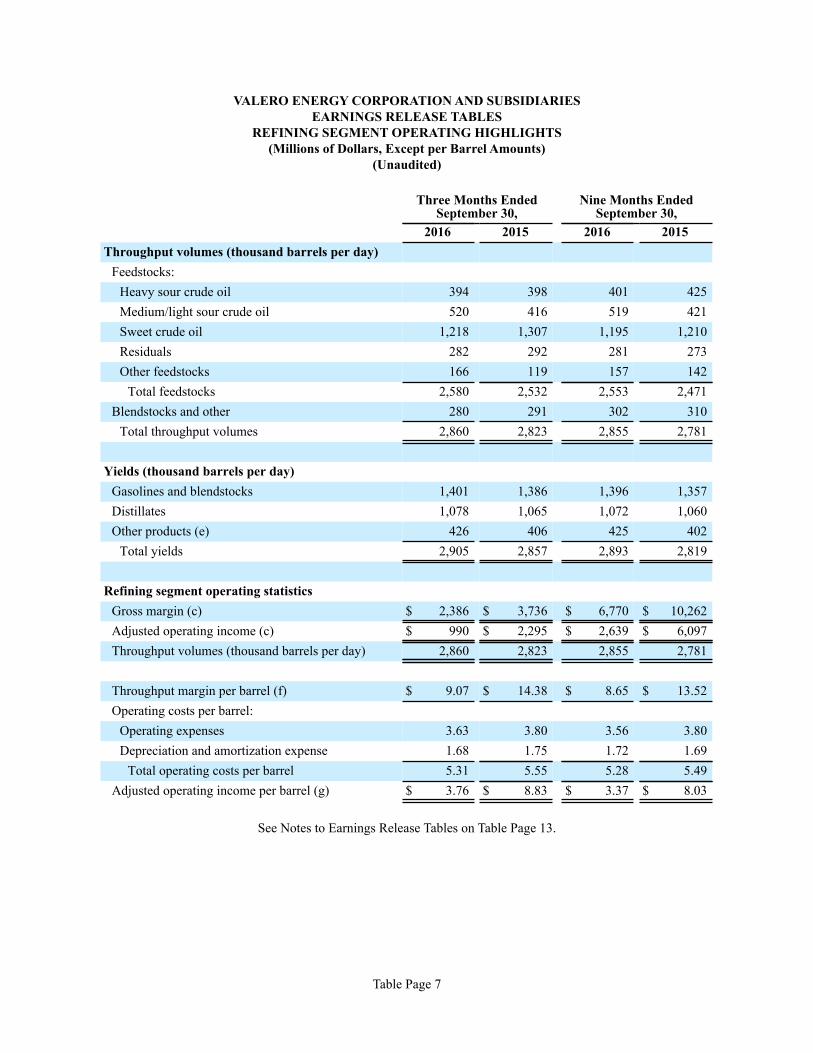
2016 2015 2016 2015Throughput volumes (thousand barrels per day)
Feedstocks:Heavy sour crude oil 394 398 401 425Medium/light sour crude oil 520 416 519 421Sweet crude oil 1,218 1,307 1,195 1,210Residuals 282 292 281 273Other feedstocks 166 119 157 142
Total feedstocks 2,580 2,532 2,553 2,471Blendstocks and other 280 291 302 310
Total throughput volumes 2,860 2,823 2,855 2,781
Yields (thousand barrels per day)Gasolines and blendstocks 1,401 1,386 1,396 1,357Distillates 1,078 1,065 1,072 1,060Other products (e) 426 406 425 402
Total yields 2,905 2,857 2,893 2,819
Refining segment operating statisticsGross margin (c) $ 2,386 $ 3,736 $ 6,770 $ 10,262Adjusted operating income (c) $ 990 $ 2,295 $ 2,639 $ 6,097Throughput volumes (thousand barrels per day) 2,860 2,823 2,855 2,781
Throughput margin per barrel (f) $ 9.07 $ 14.38 $ 8.65 $ 13.52Operating costs per barrel:
Operating expenses 3.63 3.80 3.56 3.80Depreciation and amortization expense 1.68 1.75 1.72 1.69
Total operating costs per barrel 5.31 5.55 5.28 5.49Adjusted operating income per barrel (g) $ 3.76 $ 8.83 $ 3.37 $ 8.03
See Notes to Earnings Release Tables on Table Page 13.
VALERO ENERGY CORPORATION AND SUBSIDIARIESEARNINGS RELEASE TABLES
ETHANOL SEGMENT OPERATING HIGHLIGHTS(Millions of Dollars, Except per Gallon Amounts)
(Unaudited)
Table Page 8
Three Months EndedSeptember 30,
Nine Months EndedSeptember 30,
2016 2015 2016 2015Ethanol segment operating statistics
Gross margin (c) $ 230 $ 166 $ 517 $ 531Adjusted operating income (c) $ 106 $ 35 $ 164 $ 155Production volumes (thousand gallons per day) 3,815 3,853 3,794 3,808
Gross margin per gallon of production (f) $ 0.66 $ 0.47 $ 0.50 $ 0.51Operating costs per gallon of production:
Operating expenses 0.31 0.33 0.29 0.33Depreciation and amortization expense 0.05 0.04 0.05 0.03
Total operating costs per gallon of production 0.36 0.37 0.34 0.36Adjusted operating income per gallon of production (g) $ 0.30 $ 0.10 $ 0.16 $ 0.15
See Notes to Earnings Release Tables on Table Page 13.
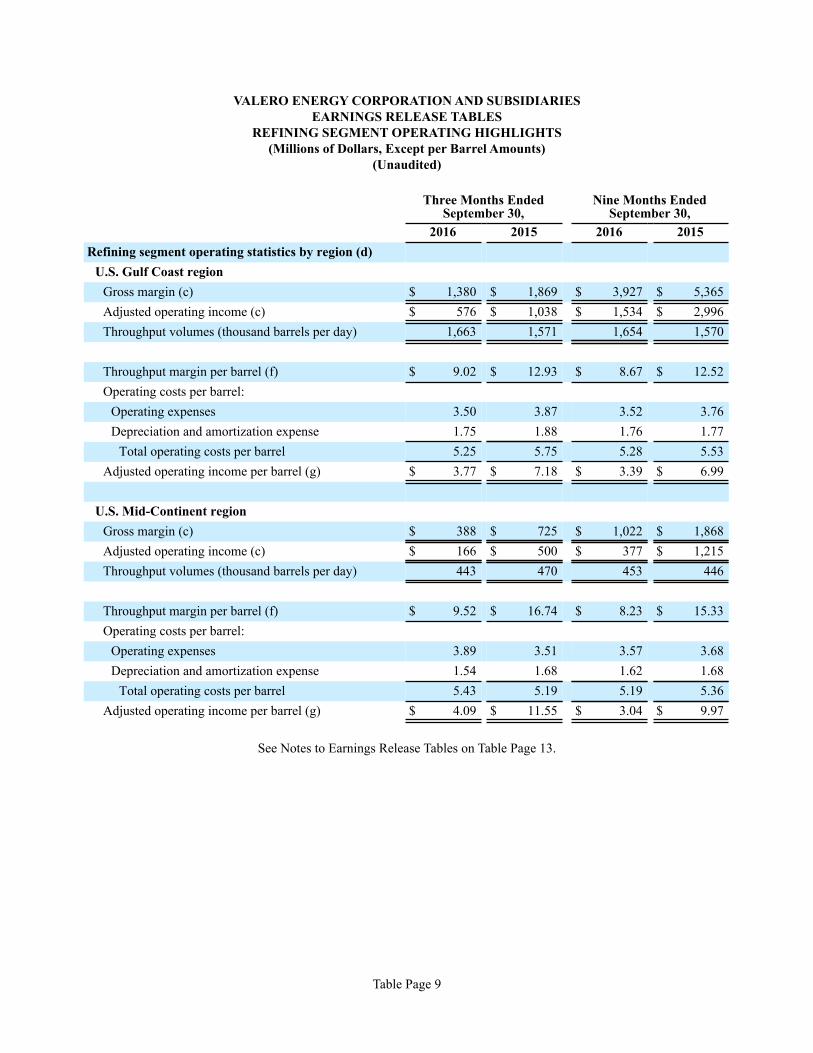
VALERO ENERGY CORPORATION AND SUBSIDIARIESEARNINGS RELEASE TABLES
REFINING SEGMENT OPERATING HIGHLIGHTS(Millions of Dollars, Except per Barrel Amounts)
(Unaudited)
Table Page 9
Three Months EndedSeptember 30,
Nine Months EndedSeptember 30,
2016 2015 2016 2015Refining segment operating statistics by region (d)
U.S. Gulf Coast regionGross margin (c) $ 1,380 $ 1,869 $ 3,927 $ 5,365Adjusted operating income (c) $ 576 $ 1,038 $ 1,534 $ 2,996Throughput volumes (thousand barrels per day) 1,663 1,571 1,654 1,570
Throughput margin per barrel (f) $ 9.02 $ 12.93 $ 8.67 $ 12.52Operating costs per barrel:
Operating expenses 3.50 3.87 3.52 3.76Depreciation and amortization expense 1.75 1.88 1.76 1.77
Total operating costs per barrel 5.25 5.75 5.28 5.53Adjusted operating income per barrel (g) $ 3.77 $ 7.18 $ 3.39 $ 6.99
U.S. Mid-Continent regionGross margin (c) $ 388 $ 725 $ 1,022 $ 1,868Adjusted operating income (c) $ 166 $ 500 $ 377 $ 1,215Throughput volumes (thousand barrels per day) 443 470 453 446
Throughput margin per barrel (f) $ 9.52 $ 16.74 $ 8.23 $ 15.33Operating costs per barrel:
Operating expenses 3.89 3.51 3.57 3.68Depreciation and amortization expense 1.54 1.68 1.62 1.68
Total operating costs per barrel 5.43 5.19 5.19 5.36Adjusted operating income per barrel (g) $ 4.09 $ 11.55 $ 3.04 $ 9.97
See Notes to Earnings Release Tables on Table Page 13.
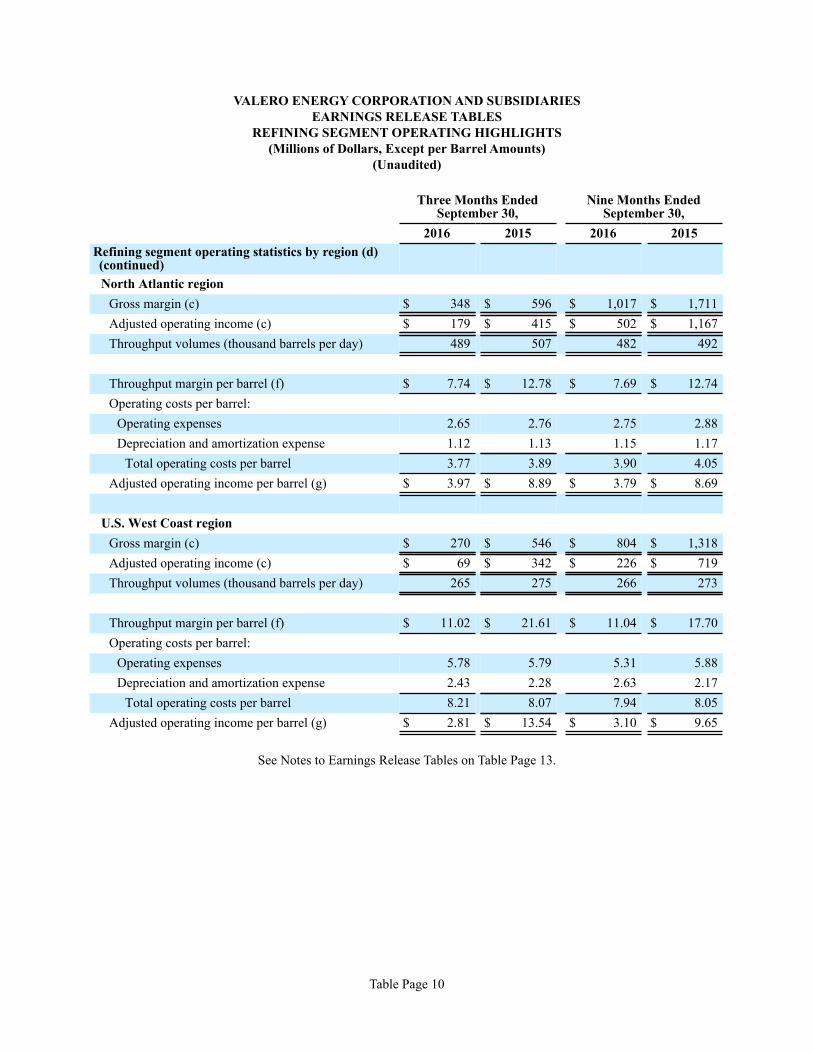
VALERO ENERGY CORPORATION AND SUBSIDIARIESEARNINGS RELEASE TABLES
REFINING SEGMENT OPERATING HIGHLIGHTS(Millions of Dollars, Except per Barrel Amounts)
(Unaudited)
Table Page 10
Three Months EndedSeptember 30,
Nine Months EndedSeptember 30,
2016 2015 2016 2015Refining segment operating statistics by region (d)(continued)North Atlantic region
Gross margin (c) $ 348 $ 596 $ 1,017 $ 1,711Adjusted operating income (c) $ 179 $ 415 $ 502 $ 1,167Throughput volumes (thousand barrels per day) 489 507 482 492
Throughput margin per barrel (f) $ 7.74 $ 12.78 $ 7.69 $ 12.74Operating costs per barrel:
Operating expenses 2.65 2.76 2.75 2.88Depreciation and amortization expense 1.12 1.13 1.15 1.17
Total operating costs per barrel 3.77 3.89 3.90 4.05Adjusted operating income per barrel (g) $ 3.97 $ 8.89 $ 3.79 $ 8.69
U.S. West Coast regionGross margin (c) $ 270 $ 546 $ 804 $ 1,318Adjusted operating income (c) $ 69 $ 342 $ 226 $ 719Throughput volumes (thousand barrels per day) 265 275 266 273
Throughput margin per barrel (f) $ 11.02 $ 21.61 $ 11.04 $ 17.70Operating costs per barrel:
Operating expenses 5.78 5.79 5.31 5.88Depreciation and amortization expense 2.43 2.28 2.63 2.17
Total operating costs per barrel 8.21 8.07 7.94 8.05Adjusted operating income per barrel (g) $ 2.81 $ 13.54 $ 3.10 $ 9.65
See Notes to Earnings Release Tables on Table Page 13.
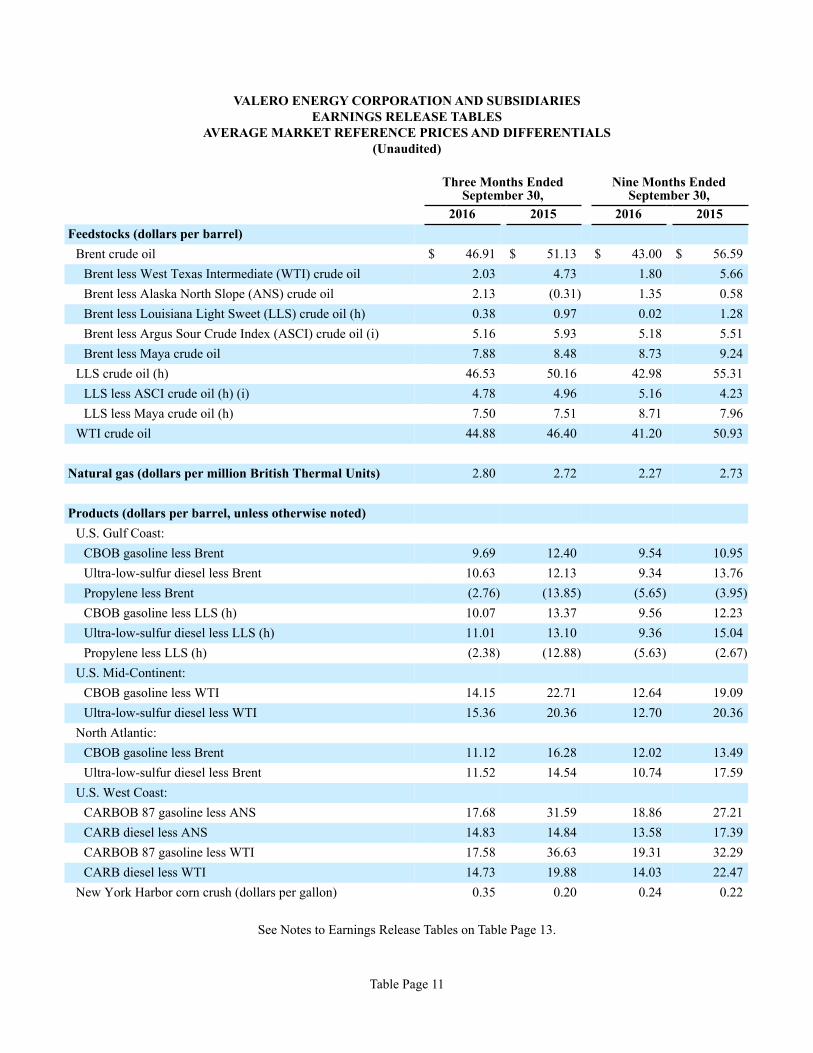
VALERO ENERGY CORPORATION AND SUBSIDIARIESEARNINGS RELEASE TABLES
AVERAGE MARKET REFERENCE PRICES AND DIFFERENTIALS(Unaudited)
Table Page 11
Three Months EndedSeptember 30,
Nine Months EndedSeptember 30,
2016 2015 2016 2015Feedstocks (dollars per barrel)
Brent crude oil $ 46.91 $ 51.13 $ 43.00 $ 56.59Brent less West Texas Intermediate (WTI) crude oil 2.03 4.73 1.80 5.66Brent less Alaska North Slope (ANS) crude oil 2.13 (0.31) 1.35 0.58Brent less Louisiana Light Sweet (LLS) crude oil (h) 0.38 0.97 0.02 1.28Brent less Argus Sour Crude Index (ASCI) crude oil (i) 5.16 5.93 5.18 5.51Brent less Maya crude oil 7.88 8.48 8.73 9.24
LLS crude oil (h) 46.53 50.16 42.98 55.31LLS less ASCI crude oil (h) (i) 4.78 4.96 5.16 4.23LLS less Maya crude oil (h) 7.50 7.51 8.71 7.96
WTI crude oil 44.88 46.40 41.20 50.93
Natural gas (dollars per million British Thermal Units) 2.80 2.72 2.27 2.73
Products (dollars per barrel, unless otherwise noted)U.S. Gulf Coast:
CBOB gasoline less Brent 9.69 12.40 9.54 10.95Ultra-low-sulfur diesel less Brent 10.63 12.13 9.34 13.76Propylene less Brent (2.76) (13.85) (5.65) (3.95)CBOB gasoline less LLS (h) 10.07 13.37 9.56 12.23Ultra-low-sulfur diesel less LLS (h) 11.01 13.10 9.36 15.04Propylene less LLS (h) (2.38) (12.88) (5.63) (2.67)
U.S. Mid-Continent:CBOB gasoline less WTI 14.15 22.71 12.64 19.09Ultra-low-sulfur diesel less WTI 15.36 20.36 12.70 20.36
North Atlantic:CBOB gasoline less Brent 11.12 16.28 12.02 13.49Ultra-low-sulfur diesel less Brent 11.52 14.54 10.74 17.59
U.S. West Coast:CARBOB 87 gasoline less ANS 17.68 31.59 18.86 27.21CARB diesel less ANS 14.83 14.84 13.58 17.39CARBOB 87 gasoline less WTI 17.58 36.63 19.31 32.29CARB diesel less WTI 14.73 19.88 14.03 22.47
New York Harbor corn crush (dollars per gallon) 0.35 0.20 0.24 0.22
See Notes to Earnings Release Tables on Table Page 13.
VALERO ENERGY CORPORATION AND SUBSIDIARIESEARNINGS RELEASE TABLES
OTHER FINANCIAL DATA(Millions of Dollars)
(Unaudited)
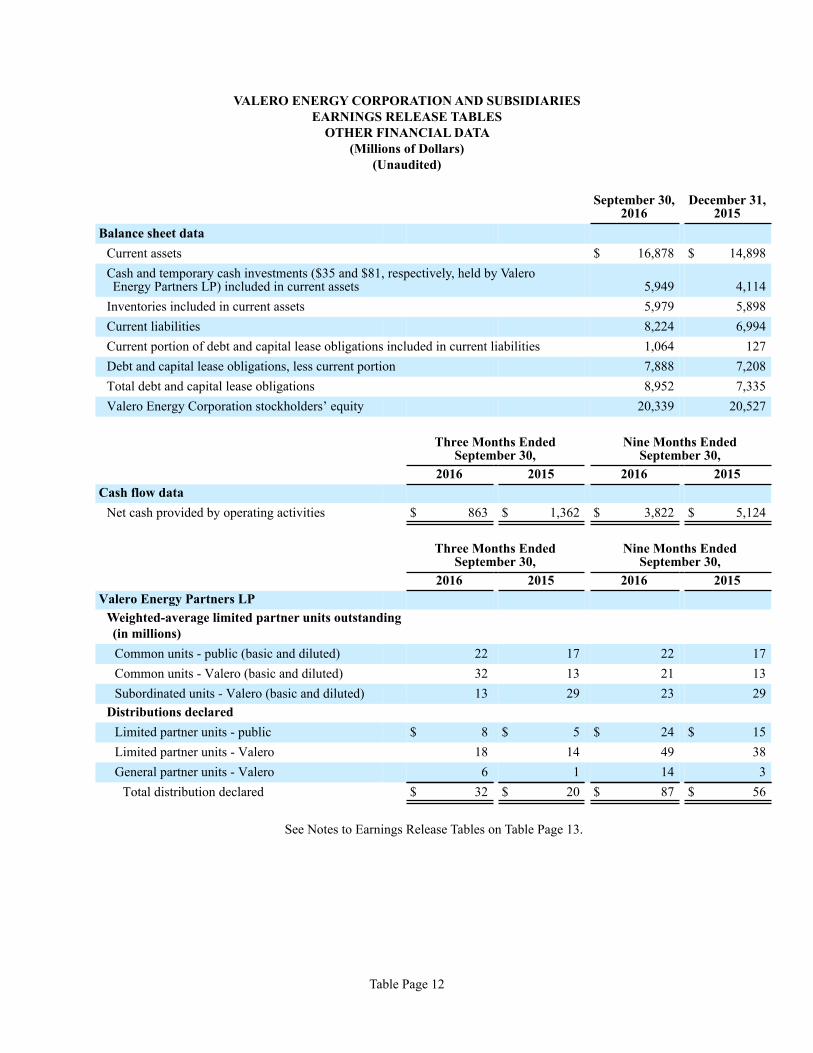
Table Page 12
September 30,2016
December 31,2015
Balance sheet dataCurrent assets $ 16,878 $ 14,898Cash and temporary cash investments ($35 and $81, respectively, held by Valero Energy Partners LP) included in current assets 5,949 4,114
Inventories included in current assets 5,979 5,898Current liabilities 8,224 6,994Current portion of debt and capital lease obligations included in current liabilities 1,064 127Debt and capital lease obligations, less current portion 7,888 7,208Total debt and capital lease obligations 8,952 7,335Valero Energy Corporation stockholders’ equity 20,339 20,527
Three Months EndedSeptember 30,
Nine Months EndedSeptember 30,
2016 2015 2016 2015Cash flow data
Net cash provided by operating activities $ 863 $ 1,362 $ 3,822 $ 5,124
Three Months EndedSeptember 30,
Nine Months EndedSeptember 30,
2016 2015 2016 2015Valero Energy Partners LP
Weighted-average limited partner units outstanding (in millions)Common units - public (basic and diluted) 22 17 22 17Common units - Valero (basic and diluted) 32 13 21 13Subordinated units - Valero (basic and diluted) 13 29 23 29
Distributions declaredLimited partner units - public $ 8 $ 5 $ 24 $ 15Limited partner units - Valero 18 14 49 38General partner units - Valero 6 1 14 3
Total distribution declared $ 32 $ 20 $ 87 $ 56
See Notes to Earnings Release Tables on Table Page 13.
VALERO ENERGY CORPORATION AND SUBSIDIARIESNOTES TO EARNINGS RELEASE TABLES
Table Page 13
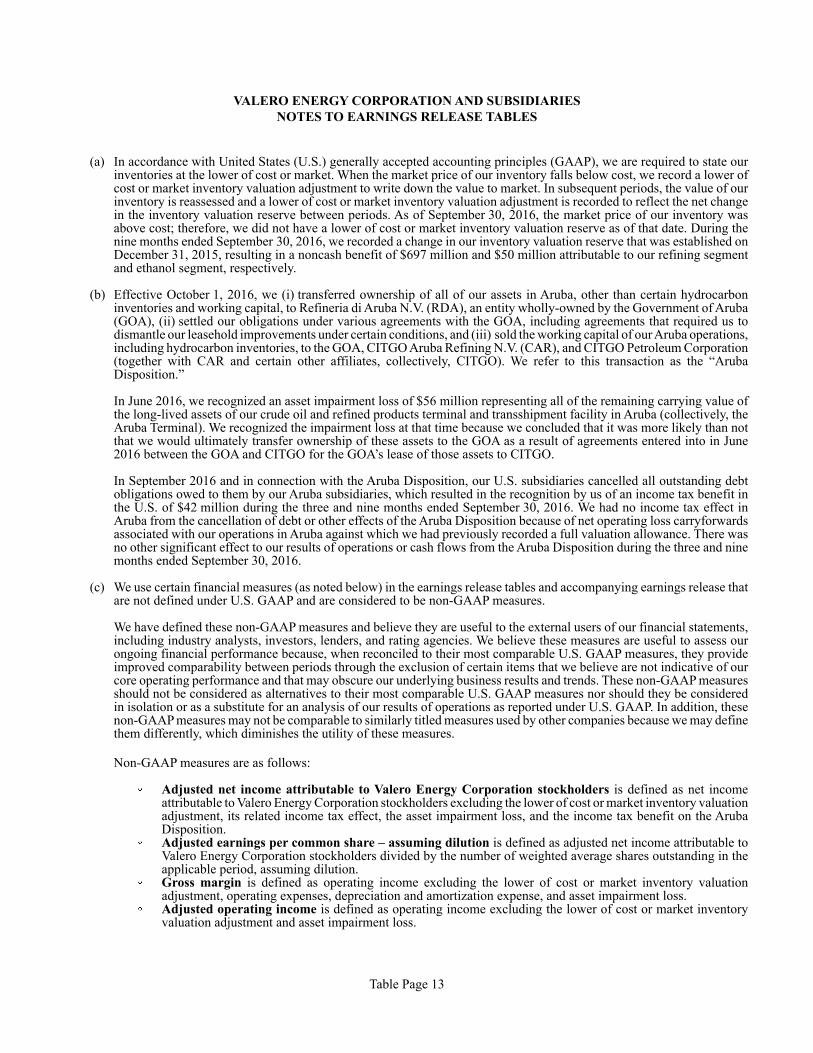
(a) In accordance with United States (U.S.) generally accepted accounting principles (GAAP), we are required to state our inventories at the lower of cost or market. When the market price of our inventory falls below cost, we record a lower of cost or market inventory valuation adjustment to write down the value to market. In subsequent periods, the value of our inventory is reassessed and a lower of cost or market inventory valuation adjustment is recorded to reflect the net change in the inventory valuation reserve between periods. As of September 30, 2016, the market price of our inventory was above cost; therefore, we did not have a lower of cost or market inventory valuation reserve as of that date. During the nine months ended September 30, 2016, we recorded a change in our inventory valuation reserve that was established on December 31, 2015, resulting in a noncash benefit of $697 million and $50 million attributable to our refining segment and ethanol segment, respectively.
(b) Effective October 1, 2016, we (i) transferred ownership of all of our assets in Aruba, other than certain hydrocarbon inventories and working capital, to Refineria di Aruba N.V. (RDA), an entity wholly-owned by the Government of Aruba (GOA), (ii) settled our obligations under various agreements with the GOA, including agreements that required us to dismantle our leasehold improvements under certain conditions, and (iii) sold the working capital of our Aruba operations, including hydrocarbon inventories, to the GOA, CITGO Aruba Refining N.V. (CAR), and CITGO Petroleum Corporation (together with CAR and certain other affiliates, collectively, CITGO). We refer to this transaction as the “Aruba Disposition.”
In June 2016, we recognized an asset impairment loss of $56 million representing all of the remaining carrying value of the long-lived assets of our crude oil and refined products terminal and transshipment facility in Aruba (collectively, the Aruba Terminal). We recognized the impairment loss at that time because we concluded that it was more likely than not that we would ultimately transfer ownership of these assets to the GOA as a result of agreements entered into in June 2016 between the GOA and CITGO for the GOA’s lease of those assets to CITGO.
In September 2016 and in connection with the Aruba Disposition, our U.S. subsidiaries cancelled all outstanding debt obligations owed to them by our Aruba subsidiaries, which resulted in the recognition by us of an income tax benefit in the U.S. of $42 million during the three and nine months ended September 30, 2016. We had no income tax effect in Aruba from the cancellation of debt or other effects of the Aruba Disposition because of net operating loss carryforwards associated with our operations in Aruba against which we had previously recorded a full valuation allowance. There was no other significant effect to our results of operations or cash flows from the Aruba Disposition during the three and nine months ended September 30, 2016.
(c) We use certain financial measures (as noted below) in the earnings release tables and accompanying earnings release that are not defined under U.S. GAAP and are considered to be non-GAAP measures.
We have defined these non-GAAP measures and believe they are useful to the external users of our financial statements, including industry analysts, investors, lenders, and rating agencies. We believe these measures are useful to assess our ongoing financial performance because, when reconciled to their most comparable U.S. GAAP measures, they provide improved comparability between periods through the exclusion of certain items that we believe are not indicative of our core operating performance and that may obscure our underlying business results and trends. These non-GAAP measures should not be considered as alternatives to their most comparable U.S. GAAP measures nor should they be considered in isolation or as a substitute for an analysis of our results of operations as reported under U.S. GAAP. In addition, these non-GAAP measures may not be comparable to similarly titled measures used by other companies because we may define them differently, which diminishes the utility of these measures.
Non-GAAP measures are as follows:
Adjusted net income attributable to Valero Energy Corporation stockholders is defined as net income attributable to Valero Energy Corporation stockholders excluding the lower of cost or market inventory valuation adjustment, its related income tax effect, the asset impairment loss, and the income tax benefit on the Aruba Disposition.Adjusted earnings per common share – assuming dilution is defined as adjusted net income attributable to Valero Energy Corporation stockholders divided by the number of weighted average shares outstanding in the applicable period, assuming dilution. Gross margin is defined as operating income excluding the lower of cost or market inventory valuation adjustment, operating expenses, depreciation and amortization expense, and asset impairment loss.Adjusted operating income is defined as operating income excluding the lower of cost or market inventory valuation adjustment and asset impairment loss.
VALERO ENERGY CORPORATION AND SUBSIDIARIESNOTES TO EARNINGS RELEASE TABLES (Continued)
Table Page 14
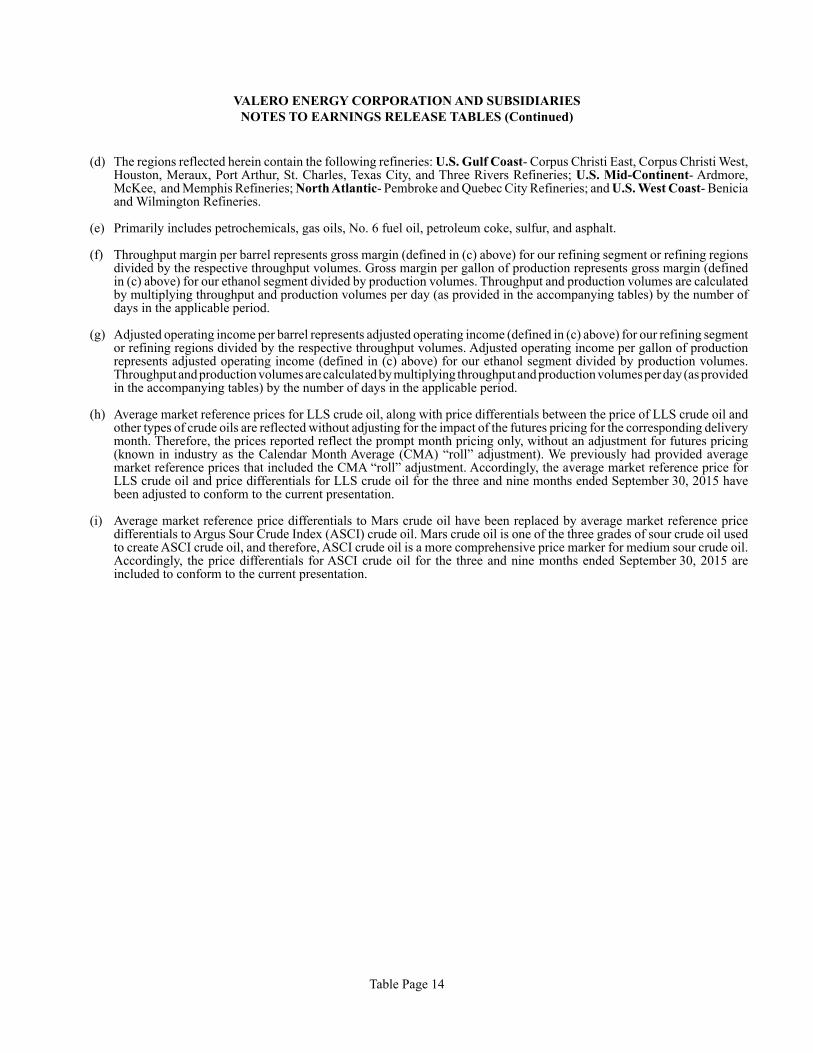
(d) The regions reflected herein contain the following refineries: U.S. Gulf Coast- Corpus Christi East, Corpus Christi West, Houston, Meraux, Port Arthur, St. Charles, Texas City, and Three Rivers Refineries; U.S. Mid-Continent- Ardmore, McKee, and Memphis Refineries; North Atlantic- Pembroke and Quebec City Refineries; and U.S. West Coast- Benicia and Wilmington Refineries.
(e) Primarily includes petrochemicals, gas oils, No. 6 fuel oil, petroleum coke, sulfur, and asphalt.
(f) Throughput margin per barrel represents gross margin (defined in (c) above) for our refining segment or refining regions divided by the respective throughput volumes. Gross margin per gallon of production represents gross margin (defined in (c) above) for our ethanol segment divided by production volumes. Throughput and production volumes are calculated by multiplying throughput and production volumes per day (as provided in the accompanying tables) by the number of days in the applicable period.
(g) Adjusted operating income per barrel represents adjusted operating income (defined in (c) above) for our refining segment or refining regions divided by the respective throughput volumes. Adjusted operating income per gallon of production represents adjusted operating income (defined in (c) above) for our ethanol segment divided by production volumes. Throughput and production volumes are calculated by multiplying throughput and production volumes per day (as provided in the accompanying tables) by the number of days in the applicable period.
(h) Average market reference prices for LLS crude oil, along with price differentials between the price of LLS crude oil and other types of crude oils are reflected without adjusting for the impact of the futures pricing for the corresponding delivery month. Therefore, the prices reported reflect the prompt month pricing only, without an adjustment for futures pricing (known in industry as the Calendar Month Average (CMA) “roll” adjustment). We previously had provided average market reference prices that included the CMA “roll” adjustment. Accordingly, the average market reference price for LLS crude oil and price differentials for LLS crude oil for the three and nine months ended September 30, 2015 have been adjusted to conform to the current presentation.
(i) Average market reference price differentials to Mars crude oil have been replaced by average market reference price differentials to Argus Sour Crude Index (ASCI) crude oil. Mars crude oil is one of the three grades of sour crude oil used to create ASCI crude oil, and therefore, ASCI crude oil is a more comprehensive price marker for medium sour crude oil. Accordingly, the price differentials for ASCI crude oil for the three and nine months ended September 30, 2015 are included to conform to the current presentation.