Embed Size (px)
Citation preview

V t ti i I l t d W tl dV t ti i I l t d W tl dVegetation in Isolated Wetlands and Potential Influence on
Vegetation in Isolated Wetlands and Potential Influence on
Phosphorus Dynamics Phosphorus Dynamics
Mark ClarkMark ClarkMark Clark
Ed Dunne Jeff Smith and Natalie Balcer
Mark Clark
Ed Dunne Jeff Smith and Natalie BalcerEd Dunne, Jeff Smith and Natalie BalcerEd Dunne, Jeff Smith and Natalie Balcer

Hydrologic Zonation of Wetland Vegetation
U l dU l dU l dU l dUplandUplandEdgeEdge
CenterCenter
UplandUplandEdgeEdge
CenterCenter
centercenter
edgeedge
centercenter
uplanduplanduplandupland
DitchDitchDitchDitch

Model of P removal pathwaysModel of P removal pathways
• Assimilation rateAssimilation rate• Decomposition rate

Vegetative Distribution by HydroperiodBeaty Ranch Larson Ranch

Vegetative Shift in Response to Hydrologic RestorationHydrologic Restoration
uplandupland uplanduplandedgeedgeedgeedge centercenter
uplandupland edgeedgeedgeedge centercenter uplandupland
uplandupland uplanduplandedgeedgeedgeedge centercenter

Questions Raised• How will species shift influence
vegetative phosphorus dynamics?
• We assume increased hydroperiod will reduce decomposition rates th f i i P t itherefore increasing P storage in organic matter, but:
• Do all plants have similar P tissue• Do all plants have similar P tissue concentration and uptake rate?
• Once senesced do all plants have• Once senesced, do all plants have similar P retention rates?
• How will increased hydroperiodsHow will increased hydroperiods interact with trampling/grazing pressure to influence species composition?

Dominant Species Aboveground Tissue Ph h C t tiPhosphorus Concentrations
Species Beaty Larson
Andropogon sp. 854 + 549Baccopa carolinana 3340Alternanthera philoxeroides 4360 + 844
--------- mg/kg --------
Alternanthera philoxeroides 4360 + 844Eleocharis spp. 1360 3040Juncus effusus 1020 + 477 1470 + 514Ludwigia spp. 1880 + 305 1790g ppLuziola fluitans & Paspalum acuminatum 2260 + 341 3360 + 731 Paspalum notatum 1370 + 560 1640 + 633 P i h it 1550 + 763 3180 + 689Panicum hemitomon 1550 + 763 3180 + 689 Polygonum spp. 2190 + 678 3130 + 1040Pontederia cordata 2140 2990 + 1100Sagittaria lancifolia 5880Sagittaria lancifolia 5880other 1480 + 721 2510 + 784

Species Aboveground Phosphorus Storage
Larson RanchBeaty Ranch
m2
mg/
m2
mg/
m

Species Recalcitrant’s (tissue fiber quality)Species Recalcitrant s (tissue fiber quality)

Short-term Phosphorus Release( t di d d l hi )(standing dead leaching)
• Species evaluated:Panicum hemitomon Paspalum notatum Juncus effusus Polygonum spp.
• Tissue collected as recently senesced standing dead biomass
250 L t i fill d ith 1 5 f• 250mL containers filled with 1.5g of litter and 200mL of low P site water (90 ppb SRP and 220 ppb NO3)
• Litter misted with DI water 12 hrs before site water added
• Bubbled with air or N2 gas to 2 gmaintain aerobic/anaerobic conditions

Phosphorus in Senesced Tissuep
LowestLowest %P after
Senescence

Short-term Leaching (Aerobic Conditions)
1.2
0.8
1
/g ti
ssue
)
0.6
P flu
x (m
g P
0 2
0.4
Cum
ulat
ive
Panicum
Bahia
0
0.2
0 5 10 15
Bahia
Polygonum
Juncus0 5 10 15
Time (days) Control

Short-term P Leaching17 day Total Cumulative P Flux in Site Water
Species Aerobic % tissue P l d
Anaerobic % tissue P l d(mgP/g tissue) released (mgP/g tissue) released
Panicum hemitomon
0.002 ± .003 a
0.80 0.007 ± .001a
3.55
Paspalum notatum
0.551 ± .126b
66.37 0.414 ± .203b
49.86
Polygonum spp 0 925 ± 149 72 34 0 911 ± 066 71 22Polygonum spp. 0.925 ± .149c
72.34 0.911 ± .066c
71.22
Juncus effuses 0.355 ± .112 44.16 0.461 ± .030 57.33b b
• Significant difference in leaching among speciesN i ifi t diff i l hi t• No significant difference in leaching response to aerobic/anaerobic condition
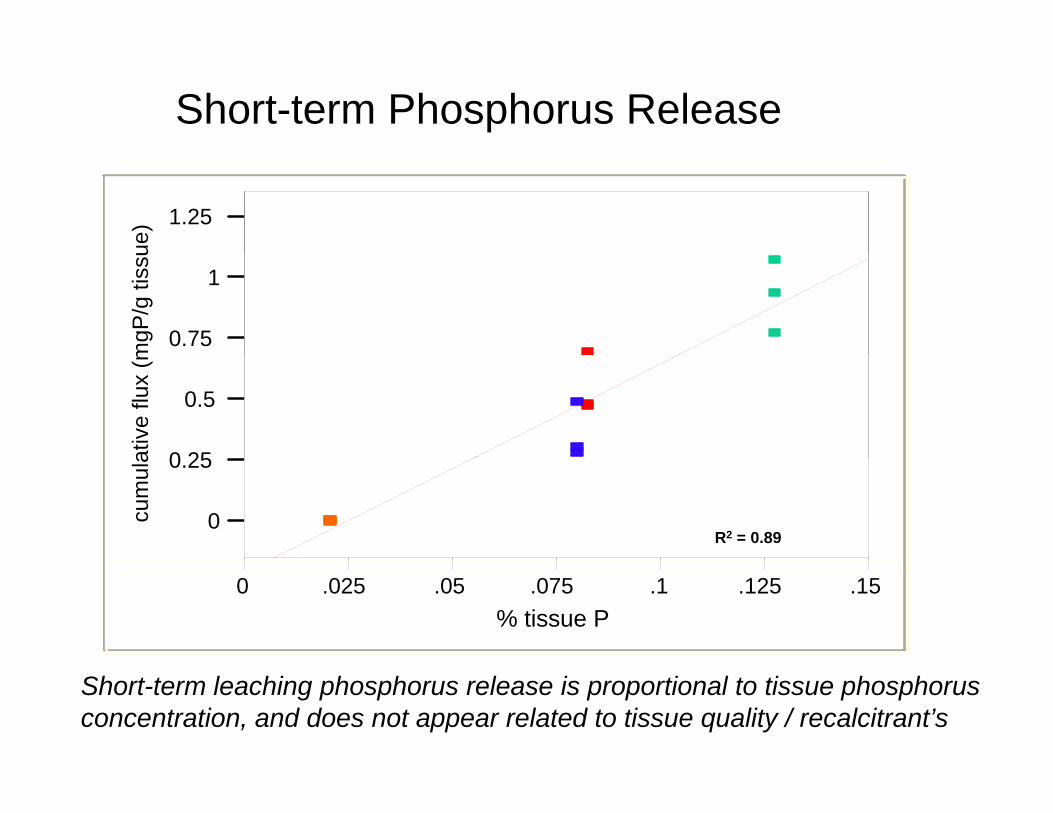
Short-term Phosphorus Release
1.25
ue)
0.75
1
mgP
/g ti
ssu
0 25
0.5
ativ
e flu
x (m
0
0.25
cum
ula
R2 = 0.89
0 .025 .05 .075 .1 .125 .15%P% tissue P
Short-term leaching phosphorus release is proportional to tissue phosphorus concentration, and does not appear related to tissue quality / recalcitrant’s

Mid-term Phosphorus Release(litter phosphorus loss)
• Species evaluated:P i h itPanicum hemitomon Paspalum notatum Juncus effusus Polygonum sppPolygonum spp.
• Senesced biomass from standing deadg
• 6 grams of air dried tissue added to 15 x 15 cm mesh bags (1 mm
Lowest residualcm mesh bags (1 mm
mesh size)residual fraction

Litterbag Deployment– Deployed at four locations equidistant along a
hydrological gradienty g g– Deployed in 3 wetlands within the same
pasture– Litter bags harvested months 2,4,8 and 12
upland
transitional
edge
center

Litter Bag Grazing Deterrent

Litter mass remaining among hydrologic zones
No significant differences among wetlands or hydrologic zones

Litter mass remaining among species
P l t t h d i ifi tl hi h l d t• Paspalum notatum had significantly higher mass losses compared to other species after four months exposure
• No significant difference among other species

Litter phosphorus remaining among species
Short-term P release
Increase in phosphorus mass may be due to high phosphorus concentrations in surface soils or particulate entrainment in litter bags.

Trampling of litter bbags
Some bags recovered 20 gcm below soil surface

Summary• Species distribution within wetland is primarily regulated by hydroperiodhydroperiod.
• Tissue phosphorus concentration and fiber quality are significantly different among species.different among species.
• Short-term leaching of standing dead can be significant and is proportional to tissue P
t ticoncentration.• Litter decomposition rate ranges
from 35% to 55% in first 12 months Bahia decompositionmonths. Bahia decomposition significantly greater then other species.
• Litter loss rate of phosphorus is t i d t h i luncertain due to physical
disturbance of litter bags.• Trampling and soil mixing within
center and edge zones iscenter and edge zones is considerable likely influencing litter carbon and phosphorus dynamics.

Research Direction• Vegetation productivity
– We have standing crop information but no productivityinformation but no productivity rates with and without grazing.
– Critical information for carbon and phosphorous budgetsand phosphorous budgets.
• Interactive effect of grazing/trampling and h d i d t tihydroperiod on vegetation composition is unknown– Intense grazing/trampling g g p g
appears to reduces hydroperiod tolerance of species and in the longest hydroperiod zone may lead to open water conditionslead to open water conditions reducing P retention potential.

Experimental DesignAdd Grazing Exclosures at Larson East


MethodsMethods