Embed Size (px)
Citation preview

1 | P a g e
Institute of Food and Agricultural Sciences (IFAS)
Institute of Food and Agricultural Sciences (IFAS)
Institute of Food and Agricultural Sciences (IFAS)
Comprehensive Analysis and Evaluation of Historical Data and Information for the Stormwater Treatment
Areas (STAs)
(September, 2009)
Final Report Submitted to:
South Florida Water Management District 3301 Gun Club Road
P.O. Box 24680 West Palm Beach
Florida 33416-4680
Wetland Biogeochemistry Laboratory Environmental Hydrology Laboratory
Soil and Water Science Department - IFAS University of Florida
Gainesville, FL 32611-0510
2 | P a g e
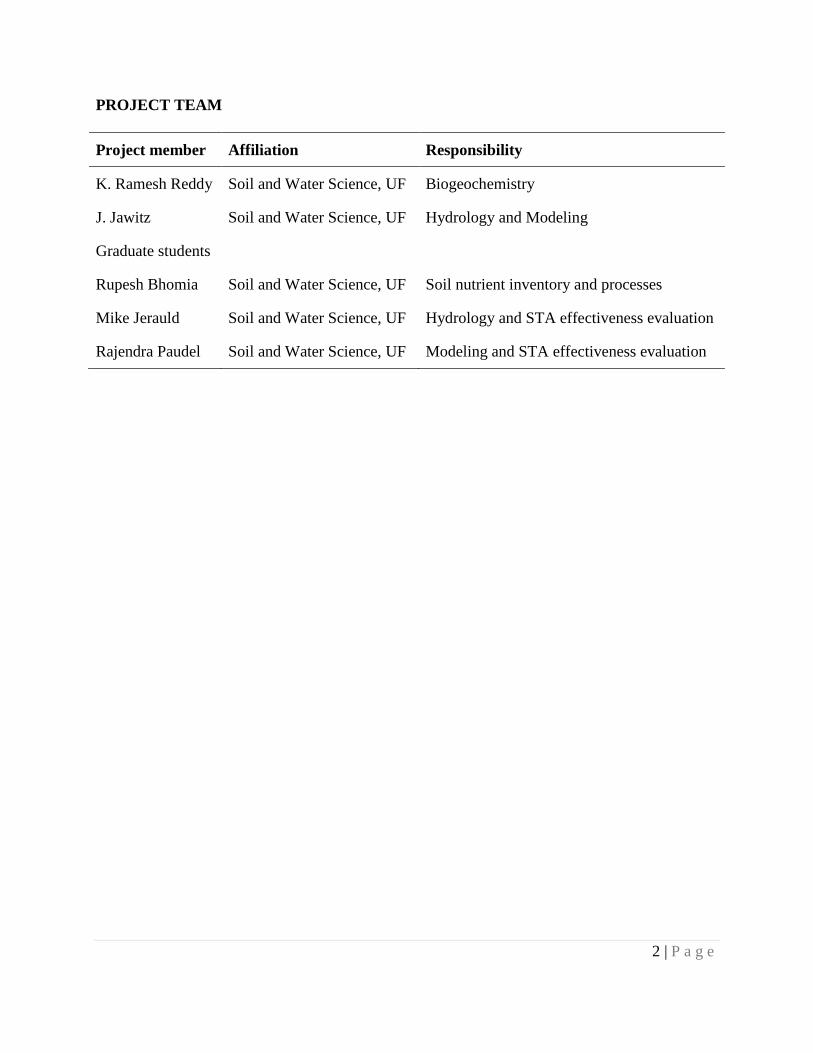
PROJECT TEAM
Project member Affiliation Responsibility
K. Ramesh Reddy Soil and Water Science, UF Biogeochemistry
J. Jawitz Soil and Water Science, UF Hydrology and Modeling
Graduate students
Rupesh Bhomia Soil and Water Science, UF Soil nutrient inventory and processes
Mike Jerauld Soil and Water Science, UF Hydrology and STA effectiveness evaluation
Rajendra Paudel Soil and Water Science, UF Modeling and STA effectiveness evaluation

3 | P a g e
EXECUTIVE SUMMARY
Natural and constructed wetlands are used to treat nutrient enriched waters such as agricultural drainage effluents, or municipal, urban, and industrial waste waters. Constructed wetlands used as buffers to retain nutrients and other contaminants are usually managed to improve their overall performance, and to maintain expected water quality improvement. Stormwater Treatment Areas (STAs) are critical to achieve long-term water quality goals to reduce nutrient loads to the Everglades Protection Area. The South Florida Water Management District (SFWMD) has constructed about 40,000 acres of STAs on former agricultural lands at five strategic locations to reduce nutrient loads entering the Water Conservation Areas. In addition, the U.S. Army Corps of Engineers constructed a sixth STA consisting of about 5,000 acres of wetlands. The SFWMD is responsible for operating, maintaining, and optimizing the nutrient removal performance of all the STAs. The STAs that are in operation include: STA-1E since 2004) and STA-1W (since 1994), STA-2 (since 2000), STA-3/4 (since 2004), STA-5 (since 1999), and STA-6 (since 1998.) The STA performance, compliance, and optimization are summarized in the annual South Florida Environment Report (e.g. Pietro et al., 2009). A special issue of Ecological Engineering recently published a series of papers describing long-term performance of the Everglades Nutrient Removal Project (the precursor to STA-1W) and associated internal processes that regulate system performance (Reddy et al. 2006).
The conclusions and recommendations presented in this report were based on our analysis of the datasets provided by the SFWMD, limitations of the existing data, and our experience in wetland ecosystem research. The following section presents a summary of findings for all STAs and readers may find detailed information on individual cells and STAs in the subsequent chapters.
The first objective of this project was to review current monitoring programs and datasets, including sampling methods, frequencies, durations and other information for all STAs and propose scientifically sound analytical approaches for data interpretation
• Data on hydraulic loading, water quality, and soil nutrients were obtained from SFWMD reports and published documents, and from UF project reports.
• Data were reviewed for the following STA components: water budget, phosphorus (P) mass balance, elevation distribution, effective wetted area (EWA) and water depth, hydraulic retention time (HRT), water column chemical constituents, floc depths, and floc and soil nutrients.
• Standard methods were employed to calculate water and P budgets for STA-5. SFWMD budgets were deemed sufficiently accurate for the purpose of meeting the objectives of this project.
• Other available datasets, including topography and stage, were employed to assess elevation distribution, EWA and water depth. These physical characteristics were assessed for impact on STA performance.
• Water chemistry datasets [P fractions and calcium (Ca)] were compared to overall P removal effectiveness.

4 | P a g e
• Data on floc and soil samples were reviewed for P, nitrogen (N) and carbon (C) status. Floc depth and bulk density data of all samples were collated to calculate nutrient (P, C and N) storages in floc layer and top 10 cm soil layer.
• Nutirent storages in vegetation were calculated for STA-1W using the data provided by DB Envornmental Labs.
• Nutrient storages were normalized for per unit area in order to enable cross-STA comparisons.
• Area weighted averages were used to accurately represent the contribution of each cell to the annual averages of each STA.
The second objective of the study was to summarize the spatial and temporal dynamics of each STA in terms of water, soil, and vegetative characteristics and correlate such information with the observed STA performance
• Period-of-record (POR) outflow total P (TP) flow-weighted mean concentration (FWMC) was positively correlated with inflow TP FWMC and average annual areal TP loading rate. Period-of-record mass removal effectiveness in STAs showed a decreasing trend with STA age (number of years STA was in operation), but this correlation requires further investigation.
• Phosphorus removal effectiveness was not correlated with EWA in any STA. Increased realized areal P loading due to partial flooding may have resulted in elevated outflow concentrations compared to expected values under 100% flooding. Distribution of depths had no observable influence on STA’s long-term performance.
• STA performance was not correlated with HRT, wetted area or depth based on the analyses in this study.
• The relative proportions of soluble reactive P (SRP), particulate P (PP) and dissolved organic P (DOP) within influent TP were not correlated to STA performance. Treatment of SRP, PP and TP were correlated with influent Ca concentration and load. In particular, effluent TP FWMC was well correlated (r2= 0.70) with influent Ca FWMC, suggesting possible role of Ca in P removal. The Ca and P interaction deserves more attention on different temporal and spatial scales.
• Average floc TP concentrations ranged from 726 ± 272 (mg P/kg; mean ± SD; STA-1W, WY2004) to 1192 ±261 (STA-1W, WY2007). These values were consistently higher than soils which ranged from 160 ± 135 (STA-1E, WY2007) to 688 ± 187 (STA-3/4; WY2005).
• Floc P concentrations were directly correlated (r2= 0.64) with the P retained from the water column.
• Soil and floc nutrient storages varied across the STAs and across the sampling years, however a positive correlation was found between total storages of N and P, C and P, and C and N in WY2007 data.
• During WY2007, P storage in floc accounted for 13 to 40 % of total P storage in floc and surface soil (0-10 cm). Floc is a dynamic component of STA and its depth could not be clearly defined as some of this material is constantly consolidated and integrated with underlying soil.

5 | P a g e
• No clear relationship was observed between TP retained in STAs (based on inflow and outflow data) for the whole operational period and TP storage in soils and floc (based on WY2007 soils data).
• Phosphorus retained from the water column until WY2007 accounted for approximately 14 to 64% of TP stored in the floc and soil that year. The balance of TP stored in soils is likely from native P and possibly mining by the vegetation in EAV cells. A positive relationship was observed between the STA age and the proportion of TP stored in floc and soil that was attributable to the TP retained from the water column.
• High N: P ratios and C:P ratios in soils and floc indicates that STAs remains P-limited. • Observations on soils are derived from a relatively small dataset. Given the spatio-
temporal variability that soils exhibit, full confidence on the conclusions cannot be warranted.
• Phosphorus loading resulted in increase in P concentration in floc and surface soils. • Due to limited soil sampling below 10 cm soil depth, it was not possible to accurately
account for the newly accreted material and hence soil nutrient storages likely underestimate actual total accretion. Newly accreted material was defined as the sediments that had accumulated since the beginning of STA operation. This includes all floc and newly formed surface soil.
• The earliest available soil nutrient data were used as background to calculate mass balance; however these did not necessarily represent the time when STAs began operations.
• Floc identification and characterization appeared to be non-uniform between sampling events. Since floc plays an important role in P removal, future sampling procedures should be geared towards a more consistent classification and measurement of the floc layer.
The third objective of the study was to lead and coordinate a technical workshop focusing on the operation and management of the STAs.
• The UF team conducted two workshops presenting the results of the data analysis. In addition, the UF team also met with District staff to discuss the approaches used in the data analysis
Implications for STA Management
• The absence of a clear relationship between P mass removal effectiveness and hydraulic loading rate (HLR), EWA, water depth distribution, HRT, or relative proportions of inflow P fractions was unexpected. The lack of clear relationships between these parameters does not support a management paradigm based any one of these parameters exerting direct control on P removal effectiveness.
• The average annual areal loading rate of TP was correlated with the average outflow TP concentration. Reducing the areal loading rate of P, by either limiting inflow mass or

6 | P a g e
increasing STA land area, could reduce outflow TP concentrations, particularly in STA-1E, STA-1W and STA-5.
• The average inflow Ca concentration was negatively correlated with the average outflow TP concentration. Calcium is known to co-precipitate with dissolved inorganic P and flocculate dissolved organic matter including organic P. Thus, it is possible that increased Ca concentrations support higher TP removal. Investigation of this hypothesis will require internal soil and water chemistry data. The limited capacity of SFWMD to influence Ca concentrations in STA inflow water reduces the managerial possibilities of this finding.
• Long term P removal is mediated by accretion of undecomposed detrital matter and particulate matter, which eventually becomes integral part of suface soil. Therefore steps should be taken for management of recently accreted soil layer. Periodic consolidation of the newly accreted soil material may increase long-term stability of stored P.
Recommendations
Hydrology and water quality
• STAs are monitored extensively with respect to hydraulic loading and water column chemical constituents. Surface water quality data are recommended as the best data available at this time to evaluate the STA performance with respect to P removal effectiveness.
• Improved estimates of groundwater flux may reduce the residuals in calculated STA water budgets, potentially improving the accuracy of other analyses that incorporate water and P mass balance data.
• In our analysis, STA performance was not correlated to HRT, wetted area or water depth therefore SFWMD operations may be revised. However, our ability to assess the long-term chemical and biological impacts of these variables is limited.
• Assessment of residence time distributions (RTDs) within cells and STAs could reveal problematic short-circuiting. Further, incorporation of RTDs could improve the accuracy of P settling-rate calculations.
• Calcium plays a significant role in P removal efficiency of STA. It is recommend that the relationship between inflow Ca concentrations and its interactions with water column P and dissolved organic matter is further explored.
Soils
• Improved monitoring is suggested for internal STA components, including floc, and soils. A systematic monitoring program must be implemented to capture spatial and temporal variability. The UF team has developed a soils monitoring program to meet the current needs of the District (Reddy et al. 2008).
• There is a need to establish a uniform and robust soils reference background information dataset. This reference set would be reliable to compare the outcomes of various subsequent interventions in STA management and would act as a benchmark to have scientifically robust comparisons.

7 | P a g e
• Soils play a critical role in dictating long-term performance of STAs. Once a STA starts accreting organic matter and other particulate matter, the newly accreted material dictates the exchange of P between soil and the water column. Additional studies are needed to determine the stability of P stored in these soils and determine how P retention capacities change with period of operation of the STA. It is recommended that newly accreted material should be monitored regularly for key parameters as presented by Reddy et al. (2008b).
• It is recommended to accurately characterize the rate of accretion of soil. Over time, as STAs go through periods of drought, the transient floc layer dries out and gets consolidated into the soil fraction. Accurate estimation of soil accretion would allow greater precision in quantifying how much P was sequestered by the STA over time. This would provide another metric to evaluate long-term effectiveness of STAs to remove P. It is recommended to develop methods suitable for STAs to determine soil accretion rates. For example, deep cores (at least 30 cm) collected from select locations and sectioned into finer depth increments would enable differentiation of the boundary between native soil and newly accreted material.
• Long-term P storage in newly accreted soil depends on its stability under range of hydrologic conditions. Labile and refractory pools of P in floc and newly accreted soils should be determined periodically and develop strategies to stabilize labile P and increase long-term P retention capacity.
• Assessment of equilibrium P concentration (EPC) for STA soils would be beneficial to estimate the potential P load that these soils can tolerate before releasing P back into the water column. It is recommended that EPC be determined for newly accreted material under varying hydrologic conditions.
• Nitrogen, carbon, and sulfur transformations can have significant effects on long-term storage and stability of P storage in STAs. It is recommended to determine the inter-relationships between P and other elemental cycles and its effect on P removal efficiency of STAs.
Vegetation
• It is recommended to determine the proportion of P stored in different above ground and below ground biomass, as these could be significant storages and need to be accounted when attempting STA P mass balance.
• Floating aquatic plant mats composed of organic matter may result in lower nutrient assimilative capacity and increased flux of nutrients from sediments to the water column. Therefore, in systems designed to optimize nutrient removal, ecosystem factors and management practices that reduce the likelihood of mat formation must be identified and implemented. In addition, strategies to manage floating substrates in systems prone to their formation must be developed. To address these points, it is recommended to determine the processes regulating formation of floating substrates in STAs and to quantify the effects floating substrate formation has on treatment efficacy.

8 | P a g e
Data integration and modeling
• Current knowledge of P retention and release processes in STAs should be integrated into management tools such as DMSTA or RSM. These tools can assist in forecasting STA performance and planning management activities. Processes regulating long-term P retention should be described for variable loading and environmental conditions, and data integration tools should be able to account for coupled interactions between these conditions (e.g., effects of very high flows on floc resuspension and associated effects on vegetative community viability).
• Simple correlations evaluated to date have not fully explained observed variability in STA performance. Several factors are suggested for further analysis to increase explanatory ability. 1) Nominal residence time has been investigated, but further inquiry is warranted using residence time distributions rather than merely the mean nominal residence time. 2) Multi-variate regression of several controlling factors is expected to improve explanatory capabilities. Also, vegetative community data that were insufficiently quantitative for inclusion in the present analysis may be incorporated into the multi-variate regression if the qualitative data available can be used by transformed using indicator statistical approaches. 3) Coupled effects of hydrologic and biogeochemical driving forces can be interpreted using data integration tools such as DMSTA. The ability to rapidly and flexibly adapt such tools using recently acquired process knowledge would further improve explanatory and predictive ability.
• Comprehensive understanding of internal processes functioning in STAs is needed to determine long-term sustainability and performance of STAs to meet desired outflow water quality. Analysis of the surface water quality data alone will not provide insights in determining overall effectiveness of STAs. We recommend that future research be directed develop data on internal processes involving biogeochemistry, vegetation dynamics, and hydrology. These data coupled with predictive models will provide SFWMD tools and metrics needed to determine long-term sustainability of STAs.

9 | P a g e
TABLE OF CONTENTS
1 INTRODUCTION ..................................................................................................................... 37
2 OBJECTIVES AND APPROACH ............................................................................................ 40
2.1 Report Organization ............................................................................................................ 40
2.2 Water Budget....................................................................................................................... 40
2.3 Phosphorus Mass Balance ................................................................................................... 41
2.4 Elevation distribution, wetted area, and depth .................................................................... 41
2.5 Hydraulic Residence Time .................................................................................................. 42
2.6 Water Column Chemical Constituents ................................................................................ 42
2.7 Soil Nutrients....................................................................................................................... 43
2.8 Vegetation ........................................................................................................................... 43
3 DATA SOURCES ..................................................................................................................... 45
3.1 Water and Phosphorus Budgets, and Water Column Chemical Constituents ..................... 45
3.2 Elevation Distribution, Wetted Area and Depth ................................................................. 48
3.3 Hydraulic Residence Time .................................................................................................. 48
3.4 Water Column Chemical Constituents ................................................................................ 48
3.5 Soil Nutrients....................................................................................................................... 48
3.6 Vegetation ........................................................................................................................... 49
4 METHODS ................................................................................................................................ 50
4.1 Water Budget....................................................................................................................... 50
4.2 Phosphorus Mass Balance ................................................................................................... 53
4.3 Elevation Distribution ......................................................................................................... 54
4.4 Wetted Area and Depth ....................................................................................................... 54
4.5 Hydraulic Residence Time .................................................................................................. 55
4.6 Water Column Chemical Constituents ................................................................................ 56
4.7 Soil Nutrients....................................................................................................................... 57
4.8 Phosphorus Mass Balance ................................................................................................... 58
4.9 Vegetation Nutrient Analysis .............................................................................................. 58
5 STORMWATER TREATMENT AREA 1 East (STA-1E)....................................................... 60
5.1 Introduction ......................................................................................................................... 60
5.2 Operational Timeline........................................................................................................... 62
5.3 Water and Phosphorus Budget ............................................................................................ 63
5.4 Elevation Distribution, Wetted Area and Depth ................................................................. 66
10 | P a g e
5.5 Hydraulic Residence Time .................................................................................................. 76
5.6 Water Column Chemical Constituents ................................................................................ 78
5.7 Soil Nutrients....................................................................................................................... 83
5.7.1 Floc and soil physico-chemical properties .............................................................. 83
5.7.2 Phosphorus inventory.............................................................................................. 83
5.7.3 Nitrogen inventory .................................................................................................. 84
5.7.4 Carbon inventory .................................................................................................... 85
5.8 Conclusions ......................................................................................................................... 95
6 STORMWATER TREATMENT AREA 1 West (STA-1W) .................................................... 96
6.1 Introduction ......................................................................................................................... 96
6.2 Operational Timeline........................................................................................................... 98
6.3 Water and Phosphorus Budgets ........................................................................................ 100
6.4 Elevation Distribution, Wetted Area and Depth ............................................................... 105
6.5 Hydraulic Residence Time ................................................................................................ 117
6.6 Water Column Chemical Constituents .............................................................................. 119
6.7 Soil Nutrients..................................................................................................................... 124
6.8 Floc and soil physico-chemical properties ........................................................................ 124
6.8.1 Phosphorus inventory............................................................................................ 124
6.8.2 Nitrogen inventory ................................................................................................ 125
6.8.3 Carbon inventory .................................................................................................. 125
6.9 Vegetation ......................................................................................................................... 145
6.10 Conclusions ..................................................................................................................... 148
7 STORMWATER TREATMENT AREA 2 (STA-2) ............................................................... 150
7.1 Introduction ....................................................................................................................... 150
7.2 Operational Timeline......................................................................................................... 152
7.3 Water and Phosphorus Budgets ........................................................................................ 152
7.4 Elevation Distribution, Wetted Area and Depth ............................................................... 155
7.5 Hydraulic Residence Time ................................................................................................ 165
7.6 Water Column Chemical Constituents .............................................................................. 167
7.7 Soil Nutrients..................................................................................................................... 171
7.7.1 Floc and soil physico-chemical properties ............................................................ 171
7.7.2 Phosphorus inventory............................................................................................ 171
7.7.3 Nitrogen inventory ................................................................................................ 173
7.7.4 Carbon inventory .................................................................................................. 174
11 | P a g e
7.8 Conclusions ....................................................................................................................... 189
8 STORMWATER TREATMENT AREA 3/4 (STA-3/4) ......................................................... 190
8.1 Introduction ....................................................................................................................... 190
8.2 Operational Timeline......................................................................................................... 192
8.3 Water and Phosphorus Budgets ........................................................................................ 193
8.4 Elevation Distribution, Wetted Area and Depth ............................................................... 196
8.5 Hydraulic Residence Time ................................................................................................ 207
8.6 Water Column Chemical Constituents .............................................................................. 208
8.7 Soil Nutrients..................................................................................................................... 212
8.7.1 Floc and soil physico-chemical properties ............................................................ 212
8.7.2 Phosphorus inventory............................................................................................ 212
8.7.3 Nitrogen inventory ................................................................................................ 214
8.7.4 Carbon inventory .................................................................................................. 214
8.8 Conclusions ....................................................................................................................... 231
9 STORMWATER TREATMENT AREA 5 (STA-5) ............................................................... 232
9.1 Introduction ....................................................................................................................... 232
9.2 Operational Timeline......................................................................................................... 234
9.3 Water and Phosphorus Budgets ........................................................................................ 235
9.4 Elevation Distribution, Wetted Area and Depth ............................................................... 241
9.5 Hydraulic Residence Time ................................................................................................ 252
9.6 Water Column Chemical Constituents .............................................................................. 255
9.7 Soil Nutrients..................................................................................................................... 260
9.8 Floc and soil physico-chemical properties ........................................................................ 260
9.8.1 Phosphorus inventory............................................................................................ 260
9.8.2 Nitrogen inventory ................................................................................................ 262
9.8.3 Carbon inventory .................................................................................................. 262
9.9 Conclusions ....................................................................................................................... 282
10 STORMWATER TREATMENT AREA 6 (STA-6) ............................................................. 284
10.1 Introduction ..................................................................................................................... 284
10.2 Operational Timeline....................................................................................................... 286
10.3 Water and Phosphorus Budgets ...................................................................................... 287
10.4 Elevation Distribution, Wetted Area and Depth ............................................................. 290
10.5 Hydraulic Residence Time .............................................................................................. 299
10.6 Water Column Chemical Constituents ............................................................................ 301

12 | P a g e
10.7 Soil Nutrients................................................................................................................... 306
10.7.1 Floc and soil physico-chemical properties ............................................................ 306
10.7.2 Phosphorus inventory............................................................................................ 306
10.7.3 Nitrogen inventory ................................................................................................ 307
10.7.4 Carbon inventory .................................................................................................. 308
10.8 Conclusions ..................................................................................................................... 318
11 CROSS-STA COMPARISONS ............................................................................................ 319
11.1 Water and Phosphorus Budgets ...................................................................................... 319
11.2 Elevation Distribution, Wetted Area and Depth ............................................................. 324
11.3 Hydraulic Residence Time .............................................................................................. 327
11.4 Water Column Chemical Constituents ............................................................................ 329
11.5 Soil Nutrients................................................................................................................... 333
11.5.1 Floc and soil physico-chemical properties ............................................................ 334
11.5.2 Phosphorus inventory............................................................................................ 334
11.5.3 Nitrogen inventory ................................................................................................ 336
11.5.4 Carbon inventory .................................................................................................. 336
11.6 Water Chemistry and Soil Analysis ................................................................................ 336
11.7 Conclusions ..................................................................................................................... 337
12 RECOMMENDATIONS AND FUTURE OUTLOOK ........................................................ 356
12.1 Recommendations ........................................................................................................... 356
12.1.1 Hydrology and water quality ................................................................................ 356
12.1.2 Floc and soil nutrients ........................................................................................... 356
12.1.3 Vegetation ............................................................................................................. 357
12.1.4 Data integration and modeling .............................................................................. 357
12.2 Future Research ............................................................................................................... 358
13 REFERENCES ...................................................................................................................... 361
14 APPENDIX ............................................................................................................................ 363
14.1 Appendix 1 ...................................................................................................................... 363
13 | P a g e
Figure 2-1. Schematic showing the relationship among various components of Stormwater Treatment Areas (STA). ........................................................................................................ 38
Figure 2-2. Map showing locations of Stormwater Treatment Areas within the Everglades basin. (Source: SFWMD) ................................................................................................................ 39
Figure 5-1. Soil core with floc layer on top of the soil (Image: S. Newman, SFWMD) .............. 59
Figure 6-1. STA-1E: Schematic showing plan view of cells and water control structures. (Source: Pietro et al., 2008). ................................................................................................................ 61
Figure 6-2. STA-1E: Topographic map. ....................................................................................... 68
Figure 6-3. STA-1E: Cumulative elevation distribution for Cell 3. Vertical lines indicate period-of-record (WY2005-WY2008) mean stage ± 1 standard deviation. ..................................... 69
Figure 6-4. STA-1E: Cumulative elevation distribution for Cell 4N. Vertical lines indicate period-of-record (WY2005-WY2008) mean stage ± 1 standard deviation. ......................... 69
Figure 6-5. STA-1E: Cumulative elevation distribution for Cell 4S. Vertical lines indicate period-of-record (WY2005-WY2008) mean stage ± 1 standard deviation. ......................... 70
Figure 6-6. STA-1E: Cumulative elevation distribution for Cell 5. Vertical lines indicate period-of-record (WY2005-WY2008) mean stage ± 1 standard deviation. ..................................... 70
Figure 6-7. STA-1E: Cumulative elevation distribution for Cell 6. Vertical lines indicate period-of-record (WY2005-WY2008) mean stage ± 1 standard deviation. ..................................... 71
Figure 6-8. STA-1E: Cumulative elevation distribution for Cell 7. Vertical lines indicate period-of-record (WY2005-WY2008) mean stage ± 1 standard deviation. ..................................... 71
Figure 6-9. STA-1E: Relationship between annual total phosphorus (TP) outflow flow-weighted mean concentration (FWMC; mg/L) and areal TP loading rate (g P/m2/yr). “Low” corresponds to annual inflow TP FWMC ≤ 0.10 mg/L; “Medium,” 0.10 mg/L< TP FWMC ≤ 0.15 mg/L; and “High,” TP FWMC > 0.15mg/L. Each point represents one cell for one water year. ............................................................................................................................. 72
Figure 6-10. STA-1E: Exceedance probability plot of depths for Cell 3. .................................... 73
Figure 6-11. STA-1E: Exceedance probability plot of depths for Cell 4N. ................................. 73
Figure 6-12. STA-1E: Exceedence probability plot of depths for Cell 4S. .................................. 74
Figure 6-13. STA-1E: Exceedance probability plot of depths for Cell 5. .................................... 74
Figure 6-14. STA-1E: Exceedance probability plot of depths for Cell 6. .................................... 75
Figure 6-15. STA-1E: Exceedance probability plot of depths for Cell 7. .................................... 75
Figure 6-16. STA-1E: Comparison of three-month rolling average flow-weighted total phosphorus (TP) outflow concentrations (mg/L) with corresponding average nominal hydraulic residence times (HRT; days). ................................................................................ 77
Figure 6-17. STA-1E: Comparison of three-month total phosphorus (TP) mass removal effectiveness (%) with corresponding average nominal hydraulic residence times (days). . 77

14 | P a g e
Figure 6-18. STA-1E: Fraction of total phosphorus (TP) that is soluble reactive phosphorus (SRP) for outflow water and inflow water. Each point represents one cell for one water year. Points that fall below the 1:1 line indicate preferential removal of SRP from the TP pool. Cell-wise data were unavailable for Cells 5, 6, and 7. ................................................. 79
Figure 6-19. STA-1E: Fraction of total phosphorus (TP) that is dissolved organic phosphorus (DOP) for outflow water and inflow water. Each point represents one cell for one water year. Points that fall below the 1:1 line indicate preferential removal of DOP from the TP pool. Cell-wise data were unavailable for Cells 5, 6, and 7. ................................................. 80
Figure 6-20. STA-1E: Fraction of total phosphorus (TP) that is particulate phosphorus (PP) for outflow water and inflow water. Each point represents one cell for one water year. Points that fall below the 1:1 line indicate preferential removal of PP from the TP pool. Cell-wise data were unavailable for Cells 5, 6, and 7. .......................................................................... 80
Figure 6-21. STA-1E: Relationship between soluble reactive phosphorus (SRP) mass removal effectiveness and annual areal calcium load (g Ca/m2/yr). Each point represents one cell for one water year. ...................................................................................................................... 81
Figure 6-22. STA-1E: Relationship between annual areal soluble reactive phosphorus (SRP) retention (g SRP/m2/yr) and annual areal calcium retention (g Ca/m2/yr). Each point represents one cell for one water year. .................................................................................. 81
Figure 6-23. STA-1E: Relationship between annual soluble reactive phosphorus (SRP) mass removal effectiveness and annual areal calcium retention (g Ca/m2/yr). Each point represents one cell for one water year. .................................................................................. 82
Figure 6-24. STA-1E: Variation in soil TP concentration (mg P/kg soil) across the cells as a function of age. ..................................................................................................................... 89
Figure 6-25. STA-1E: Soil phosphorus concentration (mg P/kg soil) in EAV (Cell 3, 5 and 7) and SAV (Cell 4N, 4S and 6). Error bars represent standard error of the mean. ........................ 89
Figure 6-26. STA-1E: Soil phosphorus storage (g P/m2) in EAV (Cell 3, 5 and 7) and SAV (Cell 4N, 4S and 6). Error bars represent the standard error of the mean. .................................... 90
Figure 6-27. STA-1E: Phosphorus mass balance: soil P storage vis-à-vis net P retained from water quality data. All values are in g P/m2. Arrows indicate flux of P from different compartments. Top row (blue arrows) indicate P movement between water and floc. Phosphorus loading data for the period of record for each specific cell was not available, however STA mean P loading for the total period of operation is shown. Middle row (orange and yellow arrows) show P movement between floc and surface soil (0-10 cm). Bottom row arrows indicate P movement between surface (0-10 cm) and sub-surface soil (10-30 cm). ............................................................................................................................ 91
Figure 6-28. STA-1E: Relationship between soil nitrogen storage (SNS; g N/m2) and soil phosphorus storage (SPS; g P/m2) in top 10 cm soil for all sampling points from WY2005 and WY2007. ........................................................................................................................ 92
Figure 6-29. STA-1E: Ratio of soil nitrogen storage (SNS; g N/m2) to soil phosphorus storage (g P/m2) in top 10 cm (WY2007 data only). Filled triangles indicate EAV cells where as open triangles depicts SAV cells. Filled square indiates N:P ratio for the whole STA. ............... 92

15 | P a g e
Figure 6-30. STA-1E: Relationship between soil phosphorus storage (SPS; g P/m2) and soil carbon storage (SCS; g C/m2) for all sampling points from WY2005 and WY2007. .......... 93
Figure 6-31. STA-1E: Relationship between soil nitrogen storage (SNS; g N/m2) and soil carbon storage (SCS; g C/m2) for all sampling points from WY2005 and WY2007. ...................... 93
Figure 6-32. STA-1E: Ratio of soil carbon storage (SCS; g C/m2) to soil phosphorus storage (SPS; g P/m2) in top 10 cm (WY2007 data only). Filled triangles indicate EAV cells and open triangles depicts SAV cells. Filled square indiates C:P ratio for the whole STA. ....... 94
Figure 6-33. STA-1E: Ratio of soil carbon storage (SCS; g C/m2)to soil nitrogen storage (SNS; g N/m2) in top 10 cm (WY2007 data only). Filled triangles indicate EAV cells where as open triangles depicts SAV cells and filled square indiates C:N ratio for the whole STA. .......... 94
Figure 7-1. STA-1W: Schematic showing plan view of cells and water control structures. (Source: Pietro et al., 2008) .................................................................................................. 97
Figure 7-2. STA-1W: Topographic map, excluding Cell 5 Flow-way. ...................................... 107
Figure 7-3. STA-1W: Topographic map of Cell 5 Flow-way. ................................................... 107
Figure 7-4. STA-1W: Cumulative elevation distribution for Cell 1. Vertical lines indicate period-of-record (WY1994-WY2008) mean stage ± 1 standard deviation. ................................... 107
Figure 7-5. STA-1W: Cumulative elevation distribution for Cell 2A. Vertical lines indicate period-of-record (WY1994-WY2008) mean stage ± 1 standard deviation. ....................... 108
Figure 7-6. STA-1W: Cumulative elevation distribution for Cell 2B. Vertical lines indicate period-of-record (WY1994-WY2008) mean stage ± 1 standard deviation. ....................... 108
Figure 7-7. STA-1W: Cumulative elevation distribution for Cell 3. Vertical lines indicate period-of-record (WY1994-WY2008) mean stage ± 1 standard deviation. ................................... 109
Figure 7-8. STA-1W: Cumulative elevation distribution for Cell 4. Vertical lines indicate period-of-record (WY1994-WY2008) mean stage ± 1 standard deviation. ................................... 109
Figure 7-9. STA-1W: Cumulative elevation distribution for Cell 5A. Vertical lines indicate period-of-record (WY2001-WY2008) mean stage ± 1 standard deviation. ....................... 110
Figure 7-10. STA-1W: Cumulative elevation distribution for Cell 5B. Vertical lines indicate period-of-record (WY2001-WY2008) mean stage ± 1 standard deviation. ....................... 110
Figure 7-11. STA-1W: Timeseries of annual average estimated wetted area. ........................... 111
Figure 7-12. STA-1W: Relationship between outflow total phosphorus (TP) flow-weighted mean concentration (FWMC; mg/L) and areal TP loading rate (g P/m2/yr). Each point represents one cell for one water year. “Low” corresponds to annual inflow TP FWMC ≤ 0.121 mg/L; “Medium,” 0.121< TP FWMC ≤ 0.214; “High,” TP FWMC > 0.214. .............................. 113
Figure 7-13. STA-1W: Exceedance probability plot of depths for Cell 1. ................................. 113
Figure 7-14. STA-1W: Exceedance probability plot of depths for Cell 2A. Stage data not available for WY2005-WY2007 ......................................................................................... 114
Figure 7-15. STA-1W: Exceedance probability plot of depths for Cell 2B. Stage data not available for WY2007. ........................................................................................................ 114

16 | P a g e
Figure 7-16. STA-1W: Exceedance probability plot of depths for Cell 3. ................................. 115Figure 7-17. STA-1W: Exceedance probability plot of depths for Cell 4. ................................. 115
Figure 7-18. STA-1W: Exceedance probability plot of depths for Cell 5A. .............................. 116
Figure 7-19. STA-1W: Exceedance probability plot of depths for Cell 5B. .............................. 116
Figure 7-20. STA-1W: Comparison of three-month rolling average flow-weighted total phosphorus (TP) outflow concentrations (mg/L) with corresponding average nominal hydraulic residence times (HRT; days). .............................................................................. 118
Figure 7-21. STA-1W: Comparison of three-month total phosphorus (TP) mass removal effectiveness (%) with corresponding average nominal hydraulic residence times (HRT; days). Only positive percent removal values were considered. .......................................... 118
Figure 7-22. STA-1W: Proportion of total phosphorus (TP) that is soluble reactive phosphorus (SRP) in outflow water and inflow water. Each point represents one cell for one water year. 1:1 line is shown. Outflow SRP data unavailable for Cell 3. ............................................. 120
Figure 7-23. STA-1W: Proportion of total phosphorus (TP) that is dissolved organic phosphorus (DOP) in outflow and inflow water. Each point represents one cell for one water year. 1:1 line is shown. Outflow DOP data unavailable for Cells 2 and 3. DOP data omitted for Cells 1, and 5. ............................................................................................................................... 120
Figure 7-24. STA-1W: Proportion of total phosphorus (TP) that is particulate phosphorus (PP) in outflow and inflow water. Each point represents one cell for one water year. 1:1 line is shown. PP data not available for Cell 2. PP data omitted for Cell 5. ................................. 121
Figure 7-25. STA-1W: Relationship between annual soluble reactive phosphorus (SRP) removal (by mass) and calcium areal loading rate. Each point represents one cell for one water year. Outflow SRP data not available for Cell 3. ......................................................................... 122
Figure 7-26. STA-1W: Relationship between annual areal soluble reactive phosphorus (SRP) retention (g SRP/m2/yr) and annual areal calcium retention (g Ca/m2/yr). Outflow SRP data unavailable for Cell 3 and outflow Ca data unavailable for Cell 5. .................................... 122
Figure 7-27. STA-1W: Relationship between annual soluble reactive phosphorus (SRP) mass removal effectiveness and annual areal calcium retention (g Ca/m2/yr). Outflow SRP data unavailable for Cell 3 and outflow Ca data unavailable for Cell 5. .................................... 123
Figure 7-28. STA-1W: Relationship between soluble reactive phosphorus (SRP) removal (by mass) and sulfate areal loading rate. Each point represents one cell for one water year. Both cells are dominated by SAV. .............................................................................................. 123
Figure 7-29: STA-1W: Variation in soil TP concentration (mg P/kg soil) across the cells as a function of age .................................................................................................................... 132
Figure 7-30 STA-1W: Change in total phosphorus concentration (mg P/kg soil) in floc and soil (0-10 cm) with time. Error bars represent standard error of the mean ............................... 132
Figure 7-31: STA-1W: Change in phosphorus storage (g P/m2) in floc and soil (0-10 cm) over time. Error bars represent the standard error of the mean. .................................................. 133

17 | P a g e
Figure 7-32. STA-1W: Phosphorus mass balance: soil P storage vis-à-vis net P retained from water quality data. All values are in g P/m2. Arrows indicate flux of P from different compartment. Phosphorus loading for each individaul cells for the whole period of record was not available, however STA mean P loading for the total period of operation is shown. Top row blue arrows indicate direction of P movement between water and floc. Middle row orange arrows show P movement between floc and surface soil (0-10 cm). Lower row blue arrows indicate P movement between surface (0-10 cm) and sub-surface soil (10-30 cm).
............................................................................................................................................. 134
Figure 7-33. STA-1W : Relationship between floc nitrogen storage (FNS; g N/m2) and floc phosphorus storage (FPS; g P/m2) in WY2004 and WY2007. ........................................... 139
Figure 7-34. STA-1W: Relationship between soil nitrogen storage (SNS; g N/m2) and soil phosphorus storage (SPS; g P/m2) for all sampling points from WY1995, WY1996, WY2000, WY2004, WY2006 and WY2007. ..................................................................... 139
Figure 7-35. STA-1W: Ratio of soil nitrogen storage (SNS; g N/m2) to soil phosphorus storage (SPS; g P/m2; WY2007 data only). Filled triangles indicate EAV cells, empty triangles represent SAV cells and filled square indiates N:P ratio for the whole STA ..................... 140
Figure 7-36. STA-1W: Relationship between floc carbon storage (FCS; g C/m2) and floc phosphorus storage (FPS; g P/m2) in WY2004 and WY2007. ........................................... 140
Figure 7-37. STA-1W: Relationship between soil carbon storage (SCS; g C/m2) and soil phosphorus storage (SPS; g P/m2) in soil (0-10 cm) for all sampling points from WY1995, WY1996, WY2000, WY2004, WY2006 and WY2007. .................................................... 141
Figure 7-38. STA-1W: Relationship between floc soil carbon storage (FCS; g C/m2) and floc nitrogen storage (FNS; g N/m2) in WY2004 and WY2007. ............................................... 141
Figure 7-39. STA-1W: Relationship between soil carbon storage (g C/m2) and soil nitrogen storage (g N/m2) soil (0-10 cm) for all sampling points from WY1995, WY1996, WY2000, WY2004, WY2006 and WY2007. ...................................................................................... 142
Figure 7-40. STA-1W: Ratio of soil carbon storage (SCS; g C/m2) to soil phosphorus storage (g P/m2 ; WY2007 data only). Filled triangles indicate EAV cells, empty triangles represent SAV cells and filled square indiates C:P ratio for the whole STA. .................................... 142
Figure 7-41. STA-1W: Ratio of soil carbon storage (SCS; g C/m2) to soil nitrogen storage (g N/m2; WY2007 data only). Filled triangles indicate EAV cells, empty triangles represent SAV cells and filled square indiates C:N ratio for the whole STA .................................... 143
Figure 8-1. STA-2: Schematic showing plan view of cells and water control structures. (Source: Pietro et al., 2008) ............................................................................................................... 151
Figure 8-2. STA-2: Topographic map. ....................................................................................... 157
Figure 8-3. STA-2: Cumulative elevation distribution for Cell 1. Vertical lines indicate period-of-record (WY2003-WY2008) mean stage ± 1 standard deviation. ................................... 158
Figure 8-4. STA-2: Cumulative elevation distribution for Cell 2. Vertical lines indicate period-of-record (WY2003-WY2008) mean stage ± 1 standard deviation. ................................... 158

18 | P a g e
Figure 8-5. STA-2: Cumulative elevation distribution for Cell 3. Vertical lines indicate period-of-record (WY2003-WY2008) mean stage ± 1 standard deviation. This is an SAV cell. . 159
Figure 8-6. STA-2: Time series of annual average estimated wetted area. Cell 3 is SAV. ........ 160
Figure 8-7. STA-2: Relationship between outflow total phosphorus (TP) flow-weighted mean concentration (FWMC; mg/L) and areal TP loading rate. “Low” corresponds to annual inflow TP FWMC ≤ 0.097 mg/L; “Medium,” 0.097< TP FWMC ≤ 0.142; “High,” TP FWMC > 0.142. Each point represents one cell for one water year. .................................. 160
Figure 8-8. STA-2: Intra-annual trends in estimated wetted area*time for each cell. Each month is averaged over the period of record (WY2003-WY2007). .............................................. 161
Figure 8-9. STA-2: Intra-annual trends in estimated wetted area*time (EWA) and total phosphorus (TP) mass removal effectiveness. Points have been averaged across cells. Each month is averaged over the period of record (WY2003-WY2008). ................................... 161
Figure 8-10. STA-2: Relationship between soluble reactive phosphorus (SRP) mass removal effectiveness and estimated wetted area*time (EWA). Each point represents one month. Months with extreme values have been omitted. ................................................................ 162
Figure 8-11. STA-2: Relationship between soluble reactive phosphorus (SRP) mass removal effectiveness and change in monthly average estimated wetted area*time (EWA). Each point represents the change in % EWA for a given month, with respect to the previous month. ................................................................................................................................. 162
Figure 8-12. STA-2: Exceedance probability plot of depths for Cell 1. ..................................... 163
Figure 8-13. STA-2: Exceedance probability plot of depths for Cell 2. ..................................... 163
Figure 8-14. STA-2: Exceedance probability plot of depths for Cell 3. ..................................... 164
Figure 8-15. STA-2: Comparison of three-month rolling average flow-weighted total phosphorus (TP) outflow concentrations (mg/L) with corresponding average nominal hydraulic residence times (HRT; days). Each point represents one cell for three months. ................ 166
Figure 8-16. STA-2: Comparison of three-month total phosphorus (TP) mass removal effectiveness (%) with corresponding average nominal hydraulic residence times (HRT; days). Only positive percent removal values were considered. Each point represents one cell for three months. ................................................................................................................. 166
Figure 8-17. STA-2: Ratio of total phosphorus (TP) that is soluble reactive phosphorus (SRP) for outflow water and inflow water. Points that fall below the 1:1 line indicate preferential removal of SRP from the TP pool. Cell 3 is designated SAV. Each point represents one cell for one water year. .............................................................................................................. 168
Figure 8-18. STA-2: Ratio of total phosphrous (TP) that is dissolved organic phosphorus (DOP) for outflow water and inflow water. Points that fall above the 1:1 line indicate enrichment of DOP in the TP pool. Cell 3 is designated SAV. Each point represents one cell for one water year. ..................................................................................................................................... 168
Figure 8-19. STA-2: Ratio of total phosphorus (TP) that is particulate phosphorus (PP) for outflow water and inflow water. Points that fall above the 1:1 line indicate enrichment of PP

19 | P a g e
in the TP pool. Cell 3 is designated SAV. Each point represents one cell for one water year.............................................................................................................................................. 169
Figure 8-20. STA-2: Relationship between annual soluble reactive phosphorus SRP mass removal effectiveness and areal calcium loading rate. Cell 3 is designated SAV. Each point represents one cell for one water year. ................................................................................ 169
Figure 8-21. STA-2: Relationship between annual areal soluble reactive phosphorus (SRP) retention (g SRP/m2/yr) and annual areal calcium retention (g Ca/m2/yr). Each point represents one cell for one water year. ................................................................................ 170
Figure 8-22. STA-2: Relationship between annual soluble reactive phosphorus (SRP) mass removal effectiveness and annual areal calcium retention (g Ca/m2/yr). Each point represents one cell for one water year. ................................................................................ 170
Figure 8-23. STA-2: Variation in soil TP concentration (mg P/kg soil) across the cells as a function of age .................................................................................................................... 177
Figure 8-24. STA-2: Total phosphorus concentration (mg P/kg soil) in floc each cell. Error bars represent standard error of the mean. .................................................................................. 177
Figure 8-25. STA-2: Total phosphorus concentration (mg P/kg soil) in soil (0-10 cm) for each cell. Error bars represent standard error of the mean. ......................................................... 178
Figure 8-26. STA-2 Change in phosphorus concentration (mg P/kg) in floc and soil (0-10 cm) with time. Error bars represent standard error of the mean. ............................................... 178
Figure 8-27. STA-2 Total phosphorus storage (g P/m2) in floc from the different cells. Error bars represent the standard error of the mean. ............................................................................ 179
Figure 8-28. STA-2: Total phosphorus storage (g P/m2) in soil (0-10) of various cells. Error bars represent the standard error of the mean. ............................................................................ 179
Figure 8-29. STA-2 Change over time in phosphorus storage (g P/m2) in floc and soil (0-10 cm). Error bars represent the standard error of the mean. ........................................................... 180
Figure 8-30. STA-2: Phosphorus mass balance: soil P storage vis-à-vis net P retained from water quality data. All values are in g P/m2. Top row blue arrows indicate direction of P movement between water and floc. Phosphorus loading for each individaul cells for the whole period of record was not available, however STA mean P loading for the total period of operation is shown. Middle row orange arrows show P movement between floc and surface soil (0-10 cm). Lower row blue arrows indicate P movement between surface (0-10 cm) and sub-surface soil (10-30 cm) .................................................................................. 181
Figure 8-31. STA-2: Relationship between floc nitrogen storage (FNS; g N/m2) and floc phosphorus storage (FPS; g P/m2) in WY2007. .................................................................. 183
Figure 8-32. STA-2: Relationship between soil nitrogen storage (SNS; g N/m2) and soil phosphorus storage (SPS; g P/m2) in top 10 cm soil for all sampling points from WY2001, WY2004 and WY2007. ...................................................................................................... 183
Figure 8-33. STA-2: Ratio of soil nitrogen storage (SNS; g N/m2) to soil phosphorus storage (SPS; g P/m2) in top 10 cm (WY2007 data only). Filled triangles indicate EAV cells, empty

20 | P a g e
triangles represent SAV cells where as filled square indiates N:P ratio for the whole STA.............................................................................................................................................. 184
Figure 8-34. STA-2: Relationship between floc carbon storage (FCS; g C/m2) and floc phosphorus storage (FPS; g P/m2) in WY2004 ................................................................... 184
Figure 8-35. STA-2 Relationship between soil carbon storage (SCS; g C/m2) and soil phosphorus storage (SPS; g P/m2) in top 10 cm soil for all sampling points from WY2001, WY2004 and WY2007. ............................................................................................................................. 185
Figure 8-36: STA-2 Relationship between floc carbon storage (FCS, g C/m2) and floc nitrogen storage (FNS, g N/m2) in WY2007. .................................................................................... 185
Figure 8-37 STA-2 Relationship between soil carbon storage (g C/m2) and soil nitrogen storage (g N/m2) for all sampling points from WY2001, WY2004 and WY2007. ......................... 186
Figure 8-38: STA-2: Ratio of soil carbon storage (SCS; g C/m2) to soil phosphorus storage (g P/m2) in top 10 cm (WY2007 data only). Filled triangles indicate EAV cells, empty triangles represent SAV cells and filled square indiates C:P ratio for the whole STA. ..... 188
Figure 8-39: STA-2 Ratio of soil carbon storage (SCS; g C/m2) to soil nitrogen storage (g N/m2) in top 10 cm (WY2007 data only). Filled triangles indicate EAV cells, empty triangles represent SAV cells and filled square indiates C:N ratio for the whole STA. .................... 188
Figure 9-1. STA-3/4: Schematic showing plan view of cells and water control structures. (Source: Pietro et al., 2008). ............................................................................................... 191
Figure 9-2. STA-3/4: Topographic map. .................................................................................... 197
Figure 9-3. STA-3/4: Elevation cumulative distribution function for Cell 1A. Vertical lines represent period-of-record (WY2006-WY2008) mean stage ± 1SD. ................................. 198
Figure 9-4. STA-3/4: Elevation cumulative distribution function for Cell 1B. Vertical lines represent period-of-record (WY2006-WY2008) mean stage ± 1SD. ................................. 198
Figure 9-5. STA-3/4: Elevation cumulative distribution function for Cell 2A. Vertical lines represent period-of-record (WY2006-WY2008) mean stage ± 1SD. ................................. 199
Figure 9-6. STA-3/4: Elevation cumulative distribution function for Cell 2B. Vertical lines represent period-of-record (WY2006-WY2008) mean stage ± 1SD. ................................. 199
Figure 9-7. STA-3/4: Elevation cumulative distribution function for Cell 3A. Vertical lines represent period-of-record (WY2006-WY2008) mean stage ± 1SD. ................................. 200
Figure 9-8. STA-3/4: Elevation cumulative distribution function for Cell 3B. Vertical lines represent period-of-record (WY2006-WY2008) mean stage ± 1SD. ................................. 200
Figure 9-9. STA-3/4: Inter-annual average estimated wetted area*time. ................................... 201
Figure 9-10. STA-3/4: Intra-annual estimated wetted area*time for each cell. .......................... 202
Figure 9-11. STA-3/4: Relationship between outflow total phosphorus flow-weighted mean concentration (TP FWMC; mg P/L) and annual areal TP loading rate (LR; g/m2/yr). “Low” corresponds to annual inflow TP FWMC ≤ 0.075 mg/L; “High,” TP FWMC > 0.075 mg/L. Each point represents one cell for one water year. ............................................................. 202

21 | P a g e
Figure 9-12. STA-3/4: Relationship between soluble reactive phosphorus (SRP) mass removal effectiveness and change in percentage wetted area. Each point represents one cell for one month. No SRP data available for Cell 1A, 2B and 3. ........................................................ 203
Figure 9-13. STA-3/4: Exceedance probability plot of depths for Cell 1A. ............................... 203
Figure 9-14. STA-3/4: Exceedance probability plot of depths for Cell 1B. ............................... 204
Figure 9-15. STA-3/4: Exceedance probability plot of depths for Cell 2A. ............................... 204
Figure 9-16. STA-3/4: Exceedance probability plot of depths for Cell 2B. ............................... 205
Figure 9-17. STA-3/4: Exceedance probability plot of depths for Cell 3A. ............................... 205
Figure 9-18. STA-3/4: Exceedance probability plot of depths for Cell 3B. ............................... 206
Figure 9-19. STA-3/4: Comparison of three-month rolling average flow-weighted total phosphorus (TP) outflow concentrations (mg/L) with corresponding average nominal hydraulic residence times (HRT; days) in the STA-3/4, Eastern, Central and Western Flow-ways. ................................................................................................................................... 207
Figure 9-20. STA-3/4: Ratio of total phosphorus (TP) that is soluble reactive phosphorus (SRP) for outflow water and inflow water. Points that fall below the 1:1 line indicate preferential removal of SRP from the TP pool. Each point represents one cell for one water year. Outflow SRP data unavailable for Cell 1A. SRP data omitted for Cells 2B and 3. ........... 209
Figure 9-21. STA-3/4: Ratio of total phosphorus (TP) that is dissolved organic phosphorus (DOP) for outflow water and inflow water. Points that fall above the 1:1 line indicate enrichment of DOP in the TP pool. Each point represents one cell for one water year. Outflow DOP data unavailable for Cell 1A, DOP data omitted for Cells 2B and 3. .......... 209
Figure 9-22. STA-3/4: Ratio of total phosphorus (TP) that is particulate phosphorus (PP) for outflow water and inflow water. Points that fall above the 1:1 line indicate enrichment of PP in the TP pool. Each point represents one cell for one water year. PP data omitted for Cells 2B and 3. ............................................................................................................................. 210
Figure 9-23. STA-3/4: Relationship between annual soluble reactive phosphorus (SRP) mass removal effectiveness and areal calcium loading rate. Outflow SRP data unavailable for Cell 1A. SRP data omitted for Cells 2B and 3. Each point represents one cell for one water year. ..................................................................................................................................... 211
Figure 9-24. STA-3/4: Annual areal total phosphorus (TP) mass retention (g/m2/yr) against annual areal calcium retention (g/m2/yr). Each point represents one cell for one water year.
............................................................................................................................................. 211
Figure 9-25. STA-3/4: Variation in soil TP concentration (mg P/kg soil) of all cells as a function of age. .................................................................................................................................. 219
Figure 9-26. STA-3/4: Total phosphorus concentration (mg P/kg soil) in floc samples collected from each cell. Error bars represent standard error of the mean. ........................................ 219
Figure 9-27. STA-3/4: Total phosphorus concentration (mg P/kg soil) in soil (0-10 cm) in each cell. Error bars represent standard error of the mean. ......................................................... 220

22 | P a g e
Figure 9-28. STA-3/4: Change in total phosphorus concentration (mg P/kg soil) in floc and soil (0-10 cm) with time. Error bars represent standard error of the mean. .............................. 220
Figure 9-29. STA-3/4 Floc phosphorus storage (g P/m2) for different cells. Error bars represent the standard error of the mean. (Floc samples not available for Cells 3A and 3B) ............ 221
Figure 9-30. STA-3/4: Soil phosphorus storage (g P/m2) for various cells. Error bars represent the standard error of the mean. ........................................................................................... 221
Figure 9-31. STA-3/4: Change over time in soil phosphorus storage (SPS; g P/m2) in floc and soil (0-10 cm). Error bars represent the standard error of the mean. .................................. 222
Figure 9-32. STA-3/4: Phosphorus mass balance: soil P storage vis-à-vis net P retained from water quality data. All values are in g P/m2. Arrows indicate flux of P between compartements. Top row arrows indicate direction of P movement between water and floc. Phosphorus loading for each individaul cells for the whole period of record was not available, however STA mean P loading for the total period of operation is shown. Middle row arrows show P movement between floc and surface soil (0-10 cm). Lower row arrows indicate P movement between surface (0-10 cm) and sub-surface soil (10-30 cm). .......... 223
Figure 9-33. STA-3/4: Relationship between floc nitrogen storage (FNS; g N/m2) and floc phosphorus storage (FPS; g P/m2) for WY2007. ................................................................ 226
Figure 9-34. STA-3/4: Relationship between soil nitrogen storage (SNS; g N/m2) and soil phosphorus storage (SPS; g P/m2) for WY2005 and WY2007. .......................................... 226
Figure 9-35. STA-3/4: Ratio of soil nitrogen storage (SNS; g N/m2) to soil phosphorus storage (SPS; g P/m2; WY2007 data only). Filled triangles indicate EAV cells, empty triangles represent SAV cells and filled square indiates N:P ratio for the whole STA. .................... 227
Figure 9-36. STA-3/4: Relationship between floc carbon storage (FCS; g C/m2) and floc phosphorus storage (FPS; g P/m2) for WY2007 sampling locations. ................................. 227
Figure 9-37. STA-3/4: Relationship between soil carbon storage (SCS; g C/m2) and soil phosphorus storage (SPS; g P/m2) for all sampling locations (WY2005 and WY2007). ... 228
Figure 9-38. STA-3/4: Relationship between floc carbon storage (g C/m2) and floc nitrogen storage (g N/m2) for WY2007. ............................................................................................ 228
Figure 9-39. STA-3/4 Relationship between soil carbon storage (g C/m2) and soil nitrogen storage (g N/m2) for all sampling points for WY2005 and WY2007. ................................ 229
Figure 9-40. STA-3/4 :Ratio of soil carbon storage (SCS; g C/m2) to soil phosphorus storage (g P/m2; WY2007 data only). Filled triangles indicate EAV cells, empty triangles represent SAV cells and filled square indiates C:P ratio for the whole STA. .................................... 229
Figure 9-41. STA-3/4 :Ratio of soil carbon storage (SCS; g C/m2) to soil nitrogen storage (g N/m2; WY2007 data only). Filled triangles indicate EAV cells, empty triangles represent SAV cells and filled square indiates C:N ratio for the whole STA. ................................... 230
Figure 10-1. STA-5: Schematic showing plan view of cells and water control structures. (Source: Pietro et al., 2008) ............................................................................................................... 233
Figure 10-2. STA-5: Topographic map excluding Cell 1A ........................................................ 243

23 | P a g e
Figure 10-3. STA-5: Topographic map of Cell 1A. .................................................................... 243Figure 10-4. STA-5: Cumulative elevation distribution for Cell 1A. Vertical lines indicate POR
(WY2001-WY2008) mean stage ± 1 standard deviation. ................................................... 244
Figure 10-5. STA-5: Cumulative elevation distribution for Cell 1B. Vertical lines indicate POR (WY2001-WY2008) mean stage ± 1 standard deviation. This is an SAV cell. ................. 244
Figure 10-6. STA-5: Cumulative elevation distribution for Cell 2A. Vertical lines indicate POR mean stage ± 1 standard deviation. ..................................................................................... 245
Figure 10-7. STA-5: Cumulative elevation distribution for Cell 2B. Vertical lines indicate POR mean stage ± 1 standard deviation. This is an SAV cell. .................................................... 245
Figure 10-8. STA-5: Estimated wetted area*time over time. Cells 1B and 2B are SAV. .......... 246
Figure 10-9. STA-5: Intra-annual estimated wetted area*time for each cell. Each month is averaged over POR (WY2001-WY2008). .......................................................................... 246
Figure 10-10. STA-5: Relationship between outflow total phosphorus flow-weighted mean concentration (TP FWMC; mg P/L) and annual areal TP loading rate (LR; g/m2/yr). “Low” corresponds to annual inflow TP FWMC ≤ 0.17 mg/L; “Medium,” 0.17 mg/L < TP FWMC ≤ 0.25 mg/L; and “High,” TP FWMC > 0.25 mg/L. Each point represents one cell for one water year. ........................................................................................................................... 247
Figure 10-11. STA-5: Relationship between soluble reactive phosphorus (SRP) mass removal effectiveness and estimated wetted area*time (EWA). Each point represents one flow-way for one month. Months with extreme values have been omitted. ....................................... 248
Figure 10-12. STA-5: Relationship between soluble reactive phosphorus (SRP) mass removal effectiveness and change in percent EWA. Each point represents one flow-way for one month. ................................................................................................................................. 248
Figure 10-13. STA-5: Intra-annual estimated wetted area*time and total phosphorus (TP) mass removal effectiveness. Each point is averaged over the period of record (WY2001-WY2008). ............................................................................................................................ 249
Figure 10-14. STA-5: Exceedance probability of depths for Cell 1A. ....................................... 249
Figure 10-15. STA-5: Exceedance probability of depths for Cell 1B. ....................................... 250
Figure 10-16. STA-5: Exceedance probability of depths for Cell 2A. ....................................... 250
Figure 10-17. STA-5: Exceedance probability of depths for Cell 2B. ....................................... 251
Figure 10-18. STA-5: Comparison of three-month rolling average flow-weighted total phosphorus outflow concentrations (mg/L) with corresponding average nominal hydraulic residence times (days) in the STA -5, Northern and Southern Flow-ways. ....................... 253
Figure 10-19. STA-5: Comparison of three-month total phosphorus removal (%) with corresponding average nominal hydraulic residence times (days) in the STA-5, Northern and Central Flow-ways. ...................................................................................................... 253
24 | P a g e
Figure 10-20. STA-5: Total phosphorus mass removal (kg) compared with corresponding three-month rolling average nominal hydraulic residence times (days) in the STA-5, Northern and Central Flow-ways. ............................................................................................................. 254
Figure 10-21. STA-5: Fraction of total phosphorus (TP) that is soluble reactive phosphorus (SRP) for outflow water and inflow water. Each point represents one flow-way for one water year. Points that fall below the 1:1 line indicate preferential removal of SRP from the TP pool. Both flow-ways have SAV and EAV cells. ......................................................... 256
Figure 10-22. STA-5: Fraction of total phosphorus (TP) that is dissolved organic phosphorus (DOP) for outflow water and inflow water. Each point represents one flow-way for one water year. Points that fall above the 1:1 line indicate enrichment of DOP in the TP pool. This flow-way has SAV and EAV cells. DOP data omitted for the Central Flow-way. .... 256
Figure 10-23. STA-5: Fraction of total phosphorus (TP) that is particulate phosphorus (PP) for outflow water and inflow water. Each point represents one flow-way for one water year. Points that fall below the 1:1 line indicate preferential removal of PP from the TP pool. This flow-ways has SAV and EAV cells. PP data omitted for the Central Flow-way. .............. 257
Figure 10-24. STA-5: Relationship between annual soluble reactive phosphorus (SRP) mass removal effectiveness and calcium areal loading rate. Each point represents one flow-way for one water year. Both flow-ways have SAV and EAV cells. ......................................... 258
Figure 10-25. STA-5: Relationship between annual areal soluble reactive phosphorus (SRP) retention (g SRP/m2/yr) and annual areal calcium retention (g Ca/m2/yr). Each point represents one flow-way for one water year. ...................................................................... 258
Figure 10-26. STA-5: Relationship between annual soluble reactive phosphorus (SRP) mass removal effectiveness and annual areal calcium retention (g Ca/m2/yr). Each point represents one cell for one water year. ................................................................................ 259
Figure 10-27. STA-5: Relationship between annual soluble reactive phosphorus (SRP) mass removal effectiveness and sulfate areal loading rate. Each point represents one flow-way for one water year. Both flow-ways have SAV and EAV cells. .............................................. 259
Figure 10-28. STA-5: Variation in soil TP concentration (mg P/kg) across the cells as a function of age. .................................................................................................................................. 268
Figure 10-29. STA-5: Total phosphorus concentration (mg P/kg) in floc for each cell. Error bars represent standard error of the mean. .................................................................................. 268
Figure 10-30. STA-5: Total phosphorus concentration (mg P/kg) in soil (0-10 cm) in each cell. Error bars represent standard error of the mean. ................................................................. 269
Figure 10-31. STA-5: Change in total phosphorus concentration (mg P/kg) in floc and soil (0-10 cm) with time. Error bars represent standard error of the mean. ........................................ 269
Figure 10-32. STA-5: Total phosphorus storage (g P/m2) in floc from the different cells. Error bars represent the standard error of the mean. .................................................................... 270
Figure 10-33. STA-5: Total phosphorus storage (g P/m2) in soil (0-10 cm) from the different cells. Error bars represent the standard error of the mean. ................................................. 270

25 | P a g e
Figure 10-34. STA-5: Change over time in phosphorus storage (g P/m2) in floc and soil (0-10 cm). Error bars represent the standard error of the mean. .................................................. 271
Figure 10-35. STA-5: Phosphorus mass balance: soil P storage vis-à-vis net P retained from water quality data. All values are in g P/m2. Arrows indicate flux of P from different compartment. Top row blue arrows indicate direction of P movement between water and floc. Phosphorus loading for each individaul flow way for the whole period of record was not available, however STA mean P loading for the total period of operation is shown.Middle row orange arrows show P movement between floc and surface soil (0-10 cm). Lower row blue arrows indicate P movement between surface (0-10 cm) and sub-surface soil (10-30 cm). STA-5 was divided into Northern Flow-way and Central Flow-way. Mean floc P storage for STA-5 is obtained from Northern Flow-way only, and represents an approximate value therefore shown in parenthesis. ............................................................ 272
Figure 10-36. STA-5: Relationship between floc nitrogen storage (FNS, g N/m2) and floc phosphorus storage (FPS, g P/m2). ..................................................................................... 277
Figure 10-37. STA-5: Relationship between soil nitrogen storage (SNS, g N/m2) and soil phosphrous storage (SPS, g P/m2). ..................................................................................... 277
Figure 10-38. STA-5: Ratio of soil nitrogen storage (SNS; g N/m2) to soil phosphorus storage (SPS; g P/m2) in top 10 cm (WY2007 data only). Filled triangles indicate EAV cells, empty triangles represent SAV cells and filled square indiates N:P ratio for the whole STA. ..... 278
Figure 10-39. STA-5: Relationship between floc carbon storage (FCS) and floc phosphorus storage (FPS). ...................................................................................................................... 278
Figure 10-40. STA-5: Relationship between soil carbon storage (SCS) and soil phosphorus storage (SPS). ...................................................................................................................... 279
Figure 10-41. STA-5: Relationship between floc carbon storage (FCS) and floc nitrogen storage (FNS). .................................................................................................................................. 279
Figure 10-42. STA-5: Relationship between soil carbon storage (SCS) and soil nitrogen storage (SNS). .................................................................................................................................. 280
Figure 10-43. STA-5: Ratio of soil carbon storage (SCS; g C/m2) to soil phosphorus storage (g P/m2) in top 10 cm (WY2007 data only). Filled triangles indicate EAV cells, empty triangles represe\nt SAV cells and filled square indiates C:P ratio for the whole STA. .... 280
Figure 10-44. STA-5: Ratio of soil carbon storage (SCS; g C/m2) to soil nitrogen storage (SNS; g N/m2; WY2007 data only). Filled triangles indicate EAV cells, empty triangles represent SAV cells and filled square indiates C:N ratio for the whole STA. ................................... 281
Figure 11-1. STA-6: Schematic showing plan view of cells and water control structures. (Source: Pietro et al., 2008) ............................................................................................................... 285
Figure 11-2. STA-6: Topographic map excluding Section 2. ..................................................... 292
Figure 11-3. STA-6: Cumulative elevation distribution for Cell 3. Vertical lines indicate period-of-record (WY2003-WY2008) mean stage ± 1 standard deviation. ................................... 293
Figure 11-4. STA-6: Cumulative elevation distribution for Cell 5. Vertical lines indicate period-of-record (WY2003-WY2008) mean stage ± 1 standard deviation. ................................... 293

26 | P a g e
Figure 11-5. STA-6: Timeseries of annual average estimated wetted area. Both cells are EAV. ............................................................................................................................................. 294
Figure 11-6. STA-6: Intra-annual estimated wetted area*time (EWA) and soluble reactive phosphorus (SRP) mass removal effectiveness for Cell 3. Each point is averaged over the period of record (WY2003 – WY2008). ............................................................................. 294
Figure 11-7. STA-6: Intra-annual estimated wetted area*time (EWA) and soluble reactive phosphorus (SRP) mass removal effectiveness for Cell 5. Each point is averaged over the period of record (WY2003 – WY2008). ............................................................................. 295
Figure 11-8. STA-6: Plot of annual average outflow total phosphorus (TP) flow-weighted mean concentration (FWMC; mg/L) against annual areal TP loading rate (g P/m2/yr). “Low” corresponds to annual inflow TP FWMC ≤ 0.05 mg/L; “Medium,” 0.05 mg/L < TP FWMC ≤ 0.10 mg/L; “High,” TP FWMC > 0.10 mg/L. Each point represents one cell for one water year. ..................................................................................................................................... 296
Figure 11-9. STA-6: Relationship between soluble reactive phosphorus (SRP) mass removal effectiveness and estimated wetted area*time. Each point represents one cell for one month. Months with extreme values have been omitted. ................................................................ 296
Figure 11-10. STA-6: Relationship between monthly average soluble reactive phosphorus (SRP) mass removal effectiveness and the absolute change in monthly average fractional estimated wetted area*time (EWA). Each point represents one cell for one month. .......................... 297
Figure 11-11. STA-6: Exceedance probability of depths for Cell 3. .......................................... 297
Figure 11-12. STA-6: Exceedance probability of depths for Cell 5. .......................................... 298
Figure 11-13. STA-6: Comparison of three-month rolling average flow-weighted total phosphorus outflow concentrations (mg/L) with corresponding average nominal hydraulic residence times (HRT; days) in Cells 3 and 5. .................................................................... 300
Figure 11-14. STA-6: Comparison of three-month total phosphorus (TP) mass removal effectiveness with corresponding average nominal hydraulic residence times (HRT; days) in Cells 3 and 5. ....................................................................................................................... 300
Figure 11-15. STA-6: Proportion of total phosphorus (TP) that is soluble reactive phosphorus (SRP) for outflow water and inflow water. Each point represents one flow-way for one water year. Points that fall below the 1:1 line indicate preferential removal of SRP from the TP pool. ............................................................................................................................... 302
Figure 11-16. STA-6: Proportion of total phosphorus (TP) that is dissolved organic phosphorus (DOP) for outflow water and inflow water. Each point represents one flow-way for one water year. Points that fall above the 1:1 line indicate enrichment of DOP in the TP pool.
............................................................................................................................................. 302
Figure 11-17. STA-6: Proportion of total phosphorus (TP) that is particulate phosphorus (PP) for outflow water and inflow water. Each point represents one flow-way for one water year. Points that fall below the 1:1 line indicate preferential removal of PP from the TP pool. . 303

27 | P a g e
Figure 11-18. STA-6: Relationship between annual soluble reactive phosphorus (SRP) mass removal effectiveness and annual areal calcium loading rate (g Ca/m2/yr). Each point represents one cell for one water year. ................................................................................ 304
Figure 11-19. STA-6: Relationship between annual areal soluble reactive phosphorus (SRP) retention (g SRP/m2/yr) and annual areal calcium retention (g Ca/m2/yr). Each point represents one cell for one water year. ................................................................................ 304
Figure 11-20. STA-6: Relationship between annual soluble reactive phosphorus (SRP) mass removal effectiveness and annual areal calcium retention (g Ca/m2/yr). Each point represents one cell for one water year. ................................................................................ 305
Figure 11-21. STA-6: Total phosphorus concentration (mg P/kg soil) in floc and soil (0-10 cm) in each cell. Error bars represent standard error of the mean. ............................................ 311
Figure 11-22. STA-6: Change in total phosphorus concentration (mg P/kg soil) in floc and soil (0-10 cm) with time. Error bars represent standard error of the mean. .............................. 311
Figure 11-23. STA-6: Total phosphorus storage (g P/m2) in floc and soil (0-10 cm) from the different cells. Error bars represent the standard error of the mean. ................................... 312
Figure 11-24. STA-6: Change over time in total phosphorus storage (g P/m2) in floc and soil (0-10 cm). Error bars represent the standard error of the mean. ............................................. 312
Figure 11-25: STA-6: Phosphorus mass balance: soil P storage vis-à-vis net P retained from water quality data. All values are in g P/m2. Top row blue arrows indicate direction of P movement between water and floc. Phosphorus loading for each individaul cells for the whole period of record was not available, however STA mean P loading for the total period of operation is shown. Middle rowe orange arrows show P movement between floc and surface soil (0-10 cm). Lower row brown arrows indicate P movement between surface (0-10 cm) and sub-surface soil (10-30 cm). ............................................................................ 313
Figure 11-26:STA-6: Relationship between soil nitrogen storage (SNS; g N/m2) and soil phosphorus storage (SPS; g P/m2) for all sampling points from WY2001 and WY2004. . 314
Figure 11-27:STA-6: Ratio of soil nitrogen storage (SCS; g C/m2) to soil phosphorus storage (g P/m2; WY2004 data only). Filled triangles indicate EAV cells and filled square indiates N:P ratio for the whole STA. ..................................................................................................... 315
Figure 11-28. STA-6: Relationship between soil carbon storage (SCS; g C/m2) and soil phosphorus storage (SPS; g P/m2) for all sampling points from WY2001 (only cell 5) and WY2004. ............................................................................................................................. 315
Figure 11-29: Relationship between soil carbon storage (g C/m2) and soil nitrogen storage (g N/m2) for all sampling points from WY2001(only cell 5) and WY2004. .......................... 316
Figure 11-30: STA-6: Ratio of soil carbon storage (SCS; g C/m2) to soil phosphorus storage (SPS; g P/m2; WY2004 data only). Filled triangles indicate EAV cells and filled square indiates C:P ratio for the whole STA. ................................................................................. 316
Figure 11-31: STA-6: Ratio of soil carbon storage (SCS; g C/m2) to soil nitrogen storage (SNS; g N/m2; WY2004 data only). Filled triangles indicate EAV cells and filled square indiates C:N ratio for the whole STA. .............................................................................................. 317
28 | P a g e
Figure 12-1. Period-of-record (POR) outflow total phosphorus (TP) flow-weighted mean concentration (FWMC; µg/L) as a function of POR average annual TP loading rate (LR; g P/m2/yr). .............................................................................................................................. 322
Figure 12-2. Total phosphorus (TP) mass removal effectiveness (%) as a function of age of STA. Each point represents the period-of-record average TP mass removal effectiveness and the age of a single STA in 2008. ............................................................................................... 322
Figure 12-3. Total phosphorus (TP) mass removal effectiveness (%) as a function of age of cell. Each point represents the period-of-record average TP mass removal effectiveness and the age of a single cell in 2008. ................................................................................................ 323
Figure 12-4. Annual average relative wetted area (EWA) for each STA. Percentages are with respect to reported areas in Pietro et al., 2008. ................................................................... 325
Figure 12-5. Period-of-record probability of depth exceedance curves for each STA. .............. 326
Figure 12-6. Period-of-record (POR) outflow total phorphorus (TP) flow-weighted mean concentration (FWMC; µg/L) with respect to POR average hydraulic residence time (HRT; d). Each point represents one cell for the POR. .................................................................. 328
Figure 12-7. Period-of-record (POR) average proportions of soluble reactive phosphrous (SRP), dissolved organic phosphorus (DOP) and particulate (PP) within the TP pool for outflow and inflow water. Each point represents one STA for the POR. For a given point, shape and shade indicate STA and the internal marker indicates P fraction. Points falling below the 1:1 line indicate preferential removal of that fraction. .............................................................. 330
Figure 12-8. Period-of-record (POR) outflow total phosphorus (TP) flow-weighted mean concentration (FWMC; µg/L) relative to POR inflow Ca FWMC (mg/L). ........................ 331
Figure 12-9. Floc and soil phosphorus storage in WY2007. STA-6 values from WY2004. ...... 348
Figure 12-10. Phosphorus mass balance: soil P storage vis-à-vis net P retained from water quality data. All values are in g P/m2. Arrows indicate flux of P between compartements. Top row arrows indicate direction of P movement between water and floc. Middle row arrows show P movement between floc and surface soil (0-10 cm). Lower row arrows indicate P movement between surface (0-10 cm) and sub-surface soil (10-30 cm). ........................... 349
Figure 12-11 Total nitrogen (N) storage in the STAs for WY2007. *Data for STA-6 is for WY2004. ............................................................................................................................. 350
Figure 12-12. Relationship between total nitrogen storage and total phosphorus storage in all STAs for WY2007. * Data for STA-6 belongs to WY2004. .............................................. 350
Figure 12-13. Total carbon storage in the STAs in WY2007.* Data for STA-6 belongs to WY2004. ............................................................................................................................. 351
Figure 12-14. Relationship between total carbon storage (g C/m2) and total phosphorus storage (g P/m2) in WY2007. *Data for STA-6 belongs to WY2004. ................................................ 351
Figure 12-15. Relationship between total carbon storage (g C/m2) and total nitrogen storage (g N/m2) in WY2007. *Data for STA-6 belongs to WY2004. ................................................ 352

29 | P a g e
Figure 12-16: Percentage of total (floc + soil) phosphorus storage derived from water column phosphorus removed. All STA’s depicts WY2007 data except STA-6 which indicates WY2004. ............................................................................................................................. 352
Figure 12-17 Relationship between total phosphorus retained (g P/m2) from water column till WY2007 and floc P concentration (mg P/kg) in WY2007. ................................................ 353
Figure 12-18: Relationship between total phosphorus removed from water column till WY2007 and total P storage (floc + soil) (g P/m2). 1:1 line differentiates between native P and P retained from water column. ............................................................................................... 353
Figure 12-19. Relationship between total phosphorus (TP) retained (g P/m2) from water column and total P storage (floc + soil) (g P/m2). STA averages used. ........................................... 354
Figure 12-20. Relationship between total phosphorus (TP) retained (g P/m2) from water column and total P storage (floc + soil) (g P/m2). Cell averages used. ............................................ 354
Figure 12-21. Relationship between floc total phosphorus (TP) concentration (mg P/kg) and inflow TP flow-weighted mean concentration (FWMC; µg/L). ......................................... 355
Figure 12-22. Relationship between and floc P storage (g P/m2) and total phosphorus (TP) flow-weighted mean concentration (FWMC; µg/L). ................................................................... 355
Figure 15-1. STA-5: Period of record (WY2000 – WY2008) rainfall recorded at station STA-5WX. ................................................................................................................................... 387
Figure 15-2. STA-5: Period of record (WY2000 – WY2008) evapotranspiration (ET) data used in this study. These are the predicted ET values obtained from DBHydro that is based on the prediction equation (Abtew 1996). ..................................................................................... 387
30 | P a g e
Table 4-1: Hydrologic data monitoring stations used for the data analysis of STA-5 ................. 46Table 4-2: Water quality monitoring stations included in TP analysis of STA-5 ........................ 46
Table 4-3. Summary of available, included and omitted water quality dataA. ............................. 47
Table 5-1. STA-5: Stage monitoring stations used in the calculation of head difference. ........... 52
Table 6-1. STA-1E: Abbreviated operational timeline. ................................................................ 62
Table 6-2. STA-1E: Annual water budgets for Central and Western Flow-ways. Pietro et al., 2009. ...................................................................................................................................... 64
Table 6-3. STA-1E: Annual total phosphorus mass balance (mt) for Central and Western Flow-ways. Pietro et al., 2009. ...................................................................................................... 65
Table 6-4. STA-1E: Areal total phosphorus (TP) loading rates (LR; g P/m2/yr) before and after adjustment for EWA. ............................................................................................................ 72
Table 6-5. STA-1E: Period-of-record (WY2007 – WY2008) flow-weighted mean concentrations (FWMC; mg/L) and average annual areal loading rates (LR; g/m2/yr) of select water column chemicals. ................................................................................................................. 79
Table 6-6. STA-1E: Number of floc and soil samples. ................................................................. 86
Table 6-7. STA-1E: Soil bulk density (g/cm3; mean ± SD). Floc not included.* ........................ 86
Table 6-8. STA-1E: Phosphorus concentration in soils (mg P/kg soil; mean ± SD). Floc not included.* .............................................................................................................................. 86
Table 6-9. STA-1E: Soil phosphorus storage (SPS; g P/m2; mean ± SD) in soil (0-10 cm). Floc not included.* ........................................................................................................................ 87
Table 6-10. STA-1E: Phosphorus accretion rate (PAR; g P/m2/yr) in the soils. Comparison between EAV and SAV cells. Floc not included.* ............................................................... 87
Table 6-11. STA-1E: Nitrogen concentration in soil (g N/kg soil; mean ± SD). Floc not included.* .............................................................................................................................. 87
Table 6-12. STA-1E: Soil nitrogen storage (SNS; g N/m2; mean ± SD) in soil (0-10 cm). Floc not included.* .............................................................................................................................. 88
Table 6-13. STA-1E: Carbon concentration in soil (g C/kg soil; mean ± SD). Floc not included.* ............................................................................................................................................... 88
Table 6-14. STA-1E: Soil carbon storage (SCS; g C/m2; mean ± SD) in soil (0-10 cm). Floc not included.* .............................................................................................................................. 88
Table 7-1. STA-1W: Abbreviated operational timeline. .............................................................. 98
Table 7-2. STA-1W: Annual water budgets (hm3) for Central and Western Flow-ways. Pietro et al., 2009. ............................................................................................................................. 101
Table 7-3. STA-1W: Annual total phosphorus mass balance (mt) for Central and Western Flow-ways. Pietro et al., 2009. .................................................................................................... 103
Table 7-4. STA-1W: Annual areal total phopsorus (TP) loading rates (LR; g P/m2/yr) before and after adjustment for EWA. .................................................................................................. 112

31 | P a g e
Table 7-5. STA-1W: POR flow-weighted mean concentrations (FWMC; mg/L) and average annual areal loading rates (LR; g/m2/yr) of select non-phosphorus chemicals. ................. 121
Table 7-6. STA-1W: Number of floc samples. ........................................................................... 127
Table 7-7. STA-1W: Number of soil samples ............................................................................ 127
Table 7-8. STA-1W: Floc depth (cm) ......................................................................................... 128
Table 7-9: STA-1W: Floc bulk density (g/cm3; mean ± SD) ..................................................... 128
Table 7-10. STA-1W: Soil bulk density (g/cm3; mean ± SD) .................................................... 129
Table 7-11. STA-1W: Phosphorus concentration in floc (mg P/kg soil, mean ± SD) ................ 129
Table 7-12. STA-1W: Phosphorus concentration in soil (mg P/kg soil; mean ± SD) ................ 130
Table 7-13. STA-1W: Floc phosphorus storage (FPS; g P/m2, mean ± SD) .............................. 130
Table 7-14. STA-1W: Soil phosphorus storage (SPS; g P/m2, mean ± SD) in surface soil (0-10 cm). ..................................................................................................................................... 131
Table 7-15. STA-1W: Floc nitrogen concentration (g N/kg, mean ± SD) ................................. 135
Table 7-16. STA-1W: Soil nitrogen concentration (g N/kg, mean ± SD) .................................. 135
Table 7-17. STA-1W: Floc nitrogen storage (FNS, g N/m2, mean ± SD) .................................. 136
Table 7-18. STA-1W: Soil nitrogen storage (SNS, g N/m2, mean ± SD) in soil (0-10 cm). ...... 136
Table 7-19. STA-1W: Floc carbon concentration (TC; g C/kg; mean ± SD) ............................. 137
Table 7-20. STA-1W: Soil carbon concentration (TC; g C/kg; mean ± SD) ............................. 137
Table 7-21. STA-1W: Floc carbon storage (FCS; g C/m2, mean ± SD) ..................................... 138
Table 7-22. STA-1W: Soil carbon storage (SCS; g C/m2, mean ± SD) in soil (0-10 cm). ......... 138
Table 8-1. STA-2: Annual water budgets (hm3). Pietro et al., 2009. ......................................... 153
Table 8-2. STA-2: Annual total phosphorus mass balance (mt). Pietro et al., 2009. ................. 154
Table 8-3. STA-2: Annual TP loading rates before and after adjustment for EWA .................. 159
Table 8-4. STA-2: Period-of-record (WY2003 – WY2008) flow-weighted mean concentrations (FWMC; mg/L) and average annual areal loading rates (LR; g/m2/yr) of select non-phosphorus chemicals. ........................................................................................................ 167
Table 8-5. STA-2: Number of soil and floc samples collected during WY2001, WY2004 and WY2007 .............................................................................................................................. 175
Table 8-6. STA-2 Floc depth (cm; mean ± SD) .......................................................................... 175
Table 8-7. STA-2 Floc and soil bulk density (g/cm3; mean ± SD) ............................................. 175
Table 8-8. STA-2: Floc and soil phosphorus concentration (mg P/kg; mean ± SD) .................. 176
Table 8-9. STA-2: Floc and soil phosphorus storage (g P/m2; mean ± SD) ............................... 176
Table 8-10. STA-2: Phosphorus accretion rate (PAR; g P/m2/yr) in the soils. Comparison between EAV and SAV cells. Floc not included.* ............................................................. 176

32 | P a g e
Table 8-11. STA-2: Floc and soil nitrogen concentration (g N/kg soil; mean ± SD) ................. 182Table 8-12. STA-2: Floc and soil nitrogen storage (g N/m2 ; mean ± SD) ................................ 182
Table 8-13: STA-2: Soil carbon concentration (g C/kg soil; mean ± SD) .................................. 187
Table 8-14: STA-2: Soil carbon storage (g C/m2 mean ± SD) in floc and soil (0- 10 cm). ....... 187
Table 9-1. STA-3/4: Abbreviated operational timeline. ............................................................. 192
Table 9-2. STA-3/4: Annual water budgets (hm3). Pietro et al., 2009. ...................................... 194
Table 9-3. STA-3/4: Annual total phosphorus mass balance (mt). Pietro et al., 2009. .............. 195
Table 9-4. STA-3/4: Annual areal total phosphorus (TP loading ratesa (g P/m2/yr) .................. 201
Table 9-5. STA-3/4: POR flow-weighted mean concentrations (FWMC; mg/L) and average annual areal loading rates (LR; g/m2/yr) of selected non-phosphorus chemicals. .............. 210
Table 9-6. STA-3/4: Number of floc and soil samples collected during WY2005 and WY2007 ............................................................................................................................................. 216
Table 9-7. STA-3/4: Floc depth (cm; mean ± SD), bulk density (g/cm3; mean ± SD) in WY2007 and area of each cell (ha). ................................................................................................... 216
Table 9-8. STA-3/4: Soil bulk density (g/cm3; mean ± SD) from WY2005 and WY2007 ........ 216
Table 9-9. STA-3/4: Concentration of phosphorus in floc and soils (mg P/kg soil; mean ± SD) ............................................................................................................................................. 217
Table 9-10. STA-3/4: Floc and soil phosphorus storage (g P/m2; mean ± SD) in the top 10 cm of soil. ...................................................................................................................................... 217
Table 9-11. STA-3/4: Phosphorus accretion rate (PAR; g P/m2/yr) in the soils. Comparison between EAV and SAV cells. ............................................................................................. 218
Table 9-12. STA-3/4: Soil nitrogen concentration TN (g N/kg soil; mean ± SD) ...................... 224
Table 9-13. STA-3/4: Soil nitrogen storage (SNS; g N/m2; mean ± SD) in floc and soil (0-10 cm). ..................................................................................................................................... 224
Table 9-14. STA-3/4: Total carbon concentration (TC; g C/kg; mean ± SD) in floc and soil (0-10 cm). ..................................................................................................................................... 225
Table 9-15. STA-3/4: Soil carbon storage (SCS, g C/m2; mean ± SD) ...................................... 225
Table 10-1. STA-5: Abbreviated operational timeline. .............................................................. 234
Table 10-2. STA-5: Water budget for North Flow-way (hm3). .................................................. 237
Table 10-3. STA-5: Water budget for North Flow-way. Pietro et al., 2009. ............................. 237
Table 10-4. STA-5: Water budget for Central Flow-way (hm3) ................................................. 238
Table 10-5. STA-5: Water budget for Central Flow-way. Pietro et al., 2009. ........................... 238
Table 10-6. STA-5: Total Phosphorus mass balance for North Flow-way (mt). ........................ 239
Table 10-7. STA-5 Total phosphorus mass balance for North Flow-way (mt) Pietro et al., 2009. ............................................................................................................................................. 239

33 | P a g e
Table 10-8. STA-5: Total phosphorus mass balance for Central Flow-way (mt). ..................... 240Table 10-9. STA-5: Total phosphorus mass balance for Central Flow-way (mt) Pietro et al.,
2009. .................................................................................................................................... 240
Table 10-10. STA-5: Total phosphorus (TP) loading rates (LR) before and after adjustment for estimated wetted area*time. ................................................................................................ 247
Table 10-11. STA-5: POR flow-weighted mean concentrations (FWMC; mg/L) and average annual areal loading rates (LR; g/m2/yr) of selected non-phosphorus chemicals. .............. 257
Table 10-12. STA-5: Number of floc samples collected during WY2003, WY2004 and WY2007. ............................................................................................................................................. 264
Table 10-13. STA-5: Number of soil samples collected for WY2001, WY2003, WY2004 and WY2007. ............................................................................................................................. 264
Table 10-14. STA-5: Floc depth (cm; mean ± SD) for WY2003, 2004 and 2007. .................... 264
Table 10-15. STA-5: Floc bulk den\sity (g/cm3; mean ± SD) .................................................... 265
Table 10-16. STA-5: Soil bulk density (g/cm3; mean ± SD) ...................................................... 265
Table 10-17. STA-5: Phosphorus concentration in floc (mg P/kg floc; mean ± SD) ................. 265
Table 10-18. STA-5: Phosphorus concentration in soil (mg P/kg soil; mean ± SD) .................. 266
Table 10-19. STA-5: Floc phosphorus storage (FPS; g P/m2, mean ± SD) ................................ 266
Table 10-20. STA-5: Soil phosphorus storage (g P/m2, mean ± SD) in soil (0-10 cm). ............ 266
Table 10-21. STA-5: Phosphorus accretion rate (PAR; g P/m2/yr) in floc and soils. Comparison between EAV and SAV cells. ............................................................................................. 267
Table 10-22. STA-5: Floc nitrogen concentration (g N/kg; mean ± SD) ................................... 273
Table 10-23. STA-5: Soil nitrogen concentration (g N/kg; mean ± SD) .................................... 273
Table 10-24. STA-5: Floc nitrogen storage (g N/m2; mean ± SD). ............................................ 274
Table 10-25. STA-5: Soil nitrogen storage (g N/m2; mean ± SD) in soil (0-10 cm). ................. 274
Table 10-26. STA-5: Floc carbon concentration (TC; g C/kg, mean ± SD) ............................... 275
Table 10-27. STA-5: Soil carbon concentration (TC; g C/kg, mean ± SD) ............................... 275
Table 10-28. STA-5: Floc carbon storage (SCS; g C/m2, mean ± SD). ..................................... 276
Table 10-29. STA-5: Soil carbon storage (SCS; g C/m2, mean ± SD) in soil (0-10 cm). .......... 276
Table 11-1. STA-6: Abbreviated operational timeline. .............................................................. 286
Table 11-2. STA-6: Annual water budgets (hm3) for Cell 3 and Cell 5. Pietro et al., 2009. ..... 288
Table 11-3. STA-6: Annual total phosphorus mass balance (mt) for Cell 3 and Cell 5. Pietro et al., 2009. ............................................................................................................................. 289
Table 11-4. STA-6: Annual TP loading rates before and after adjustment for EWA. ............... 295
Table 11-5. STA-6: Period-of-record flow-weighted mean concentrations (FWMC; mg/L) and average annual areal loading rates (LR; g/m2/yr) of selected non-phosphorus chemicals. 303

34 | P a g e
Table 11-6. STA-6: Number of samples collected. .................................................................... 309Table 11-7. STA-6: Floc depth (cm) and bulk density (g/cm3; mean ± SD). ............................. 309
Table 11-8. STA-6: Bulk density of soil (g/cm3; mean ± SD). ................................................... 309
Table 11-9. STA-6: Concentration of phosphorus in floc and soil (0-10 cm) (mg P/kg; mean ± SD). ..................................................................................................................................... 309
Table 11-10. STA-6: Phosphorus storage (g P/m2; mean ± SD) in floc and soil (0-10 cm). ...... 309
Table 11-11. STA-6: Phosphorus accretion rate (PAR; g P/m2yr) in the soils. EAV cells. Floc not included. * ........................................................................................................................... 310
Table 11-12. STA-6: Soil nitrogen concentration (g N/kg soil; mean ± SD) and soil (0-10 cm). ............................................................................................................................................. 310
Table 11-13: STA-6: Soil nitrogen storage (SNS; g N/m2; mean ± SD). ................................... 310
Table 11-14: STA-6: Soil carbon concentration (g C/kg soil; mean ± SD). ............................... 310
Table 11-15: STA-6: Soil carbon storage (SCS; g C/m2; mean ± SD). ...................................... 310
Table 12-1. Period-of-record average hydraulic and chemical characteristics for each STA. ... 321
Table 12-2 Total P inflow and outflow until WY2008. All values are shown in metric tonnes. 321
Table 12-3. Elevation characteristics for each STA. .................................................................. 325
Table 12-4. Coefficients of correlation (r) for variables related to water column phosphorus forms. Units of correlation were period-of-record average values for cells. ...................... 330
Table 12-5. Period-of-record inflow flow-weighted mean concentration (FWMC), average annual areal loading rate and average annual retention of calcium. ................................... 331
Table 12-6. Coefficients of correlation (r) between calcium (Ca) loading and water column soluble reative phosphorus (P), particulate phosphorus (P) and total phosphorus (TP) outflow flow-weighted mean concentrations (FWMCO) and mass removal effectiveness (MRE). Units of correlation were period-of-record averages for STAs. ............................ 331
Table 12-7. Data availablility by cell for total phosphorus (TP), soluble reactive phosphorus (SRP), dissolved organic phosphorus (DOP), particulate phosphorus (PP), and calcium (Ca).
............................................................................................................................................. 332
Table 12-8. Number of floc samples. .......................................................................................... 339
Table 12-9. Number of soil samples. .......................................................................................... 339
Table 12-10: Floc depth (cm; mean ± SD). ................................................................................ 340
Table 12-11. Floc bulk density (g/cm3; mean ± SD). ................................................................. 340
Table 12-12. Soil bulk density (g/cm3; mean ± SD). .................................................................. 340
Table 12-13. Phosphorus concentration in floc (mg P/kg; mean ± SD). .................................... 341
Table 12-14. Phosphorus concentration in soils (mg P/kg; mean ± SD). ................................... 341
Table 12-15. Floc phosphorus storage (FPS, g P/m2; mean ± SD). ............................................ 342
35 | P a g e
Table 12-16. Soil phosphorus strorage (SPS; g P/m2 ; mean ± SD). .......................................... 342Table 12-17 Comparison of P removed from water column and FPS and SPS. Area of STA used
for calculations are also shown. .......................................................................................... 342
Table 12-18. Floc nitrogen concentration (g N/kg; mean ± SD). ............................................... 343
Table 12-19. Soil nitrogen concentration (g N/kg; mean ± SD). ................................................ 343
Table 12-20. Floc nitrogen storage (FNS, g N/m2; mean ± SD). ................................................ 344
Table 12-21. Soil nitrogen storage (SNS, g N/m2 ; mean ± SD). ............................................... 344
Table 12-22 : Total nitrogen (N) storage (mt) in floc and soil in STAs. .................................... 344
Table 12-23. Floc carbon concentration (g C/kg; mean ± SD). .................................................. 345
Table 12-24. Soil carbon concentration (g C/kg; mean ± SD). .................................................. 345
Table 12-25. Floc carbon storage (FCS; g C/m2; mean ± SD). .................................................. 346
Table 12-26. Soil carbon storage (g C/m2; mean ± SD). ............................................................ 346
Table 12-27. Soil carbon storage (SCS; g C/m2; mean ± SD). ................................................... 347
Table 12-28: Total carbon (C) storage (mt) in floc and soil in STAs. ........................................ 347
Table 12-29: Comparision of total (floc+soil) phosphorus storage with phosphorus removed from the water column over POR. ............................................................................................... 347
Table 15-1. Stations used in the compilation of the STA-5 water budget. ................................. 364
Table 15-2. Stations used in the compliation of the STA-5 phosphorus mass balance. ............. 364
Table 15-3. Coefficients for elevation CDF [Equation ( 5-10 )]. ............................................... 365
Table 15-4. Non-cumulative areal*temporal depth distributions ............................................... 366
Table 15-5. Stage stations ........................................................................................................... 372
Table 15-6. Nominal hydraulic residence times for the period of record. .................................. 375
Table 15-7. STA-1E: Three-month rolling average stages, flow rates and estimated nominal hydraulic residence time (HRT) for STA-1E treatment cells. ............................................ 375
Table 15-8. STA-1W: Three-month rolling average stages, flow rates and estimated nominal hydraulic residence time (HRT) for Cell 1. ........................................................................ 377
Table 15-9. STA-1W: Three-month rolling average stages, flow rates and estimated nominal hydraulic residence time (HRT) for Cell 2. ........................................................................ 377
Table 15-10. STA-1W: Three-month rolling average stages, flow rates and estimated nominal hydraulic residence time (HRT) for Cell 3. ........................................................................ 378
Table 15-11. STA-1W: Three-month rolling average stages, flow rates and estimated nominal hydraulic residence time (HRT) for Cell 4. ........................................................................ 379
Table 15-12. STA-1W: Three-month rolling average stages, flow rates and estimated nominal hydraulic residence time (HRT) for Cell 5. ........................................................................ 380

36 | P a g e
Table 15-13. STA-2: Three-month rolling average stages, flow rates and estimated nominal hydraulic residence time (HRT) for Cell 1. ........................................................................ 381
Table 15-14. STA-2: Three-month rolling average stages, flow rates and estimated nominal hydraulic residence time (HRT) for Cell 2. ........................................................................ 381
Table 15-15. STA-2: Three-month rolling average stages, flow rates and estimated nominal hydraulic residence time (HRT) for Cell 3. ........................................................................ 382
Table 15-16. STA-3/4: Three-month rolling average stages, flow rates and estimated nominal hydraulic residence time (HRT) for Eastern Flow-way. ..................................................... 382
Table 15-17. STA-3/4: Three-month rolling average stages, flow rates and estimated nominal hydraulic residence time (HRT) for Central Flow-way. ..................................................... 383
Table 15-18. STA-3/4: Three-month rolling average stages, flow rates and estimated nominal hydraulic residence time (HRT) for Western Flow-way. ................................................... 383
Table 15-19. STA-5: Three-month rolling average stages, flow rates and estimated nominal hydraulic residence time (HRT) for the Northern Flow-way. ............................................ 384
Table 15-20. STA-5: Three-month rolling average stages, flow rates and estimated nominal hydraulic residence time (HRT) for the Central Flow-way. ............................................... 384
Table 15-21. STA-6: Three-month rolling average stages, flow rates and estimated nominal hydraulic residence time (HRT) for Cell 3. ........................................................................ 385
Table 15-22. STA-6: Three-month rolling average stages, flow rates and estimated nominal hydraulic residence time (HRT) for Cell 5. ........................................................................ 386

37 | P a g e
1 INTRODUCTION
Constructed wetlands used as buffers to retain nutrients and other contaminants are usually managed to improve their overall performance, and to maintain expected water quality. The extent of management required depends upon the wetland nutrient/contaminant retention capacity and the desired effluent quality. Management scenarios can vary, depending on wetland type and hydraulic loading rate. For example, small-scale wetlands can be managed effectively by altering hydraulic loading rates or integration with conventional treatment systems, while large-scale systems can be managed by controlling nutrient/contaminant loads.
Management of Stormwater Treatment Areas (STAs) has been a major focus of the South Florida Water Management (SFWMD). STAs are a key component in the Everglades restoration program and are critical to achieve long-term water quality goals to reduce nutrient loads to the Everglades Protection Area. The SFWMD has constructed about 40,000 acres of STAs on former agricultural lands at five strategic locations to reduce nutrient and contaminant loads into the water conservation areas (WCAs) (Figure 1-2). In addition, the US Army Corps of Engineers constructed a sixth STA consisting of about 5,000 acres of wetlands. The SFWMD is responsible for operating, maintaining and optimizing the performance of all 45,000 acres of STAs to retain and store incoming nutrients and contaminants. The six STAs that are in operation include: STA-1E (since 2004) and STA-1W (since 1994), STA-2 (since 2000), STA-3/4 (since 2004), STA-5 (since 1999), and STA-6 (since 1998). The STA performance, compliance, and optimization are summarized in the annual South Florida Environment Report (SFER; e.g. Pietro et al., 2009).
The Everglades Construction Project (ECP) STAs receive stormwater runoff, mainly from the Everglades Agricultural Area (EAA), but also from some urban areas. Most STAs are monitored for water flow, water quality, vegetation composition, and soil characteristics. Since 1994, these wetlands have reduced total phosphorus (TP) loads that would have otherwise discharged into the Everglades Protection Area (EPA) by over 1,000 metric tons and reduced annual average outflow TP flow-weighted mean concentrations (FWMC) from 145 µg/L to 45 µg/L. The STAs were constructed to meet water quality standards mandated by the Everglades Forever Act (EFA) and the discharges are regulated by EFA and National Pollution Discharge Elimination System (NPDES) permits.
A major portion of TP added to treatment wetlands is stored in soils relative to other ecosystem components, such as plant biomass and plant litter. Burial or accretion of organic matter is an important long-term sink for nutrients and other contaminants in wetlands. Wetland soils tend to accumulate organic matter due to the production of detrital material from biota and the suppressed rates of decomposition. Soil accretion rates for constructed wetlands can range from a few millimeters to more than one centimeter per year. Accretion rates in productive natural wetland systems such as the Everglades have been reported as high as one centimeter or more per year (Reddy et al., 1993). The genesis of this new material is a relatively slow process, which may affect the nutrient retention characteristics of the wetland. With time, productive treatment wetland systems will accrete organic matter (which ultimately forms peat) that has different physical and biological characteristics than the underlying soil. Management of newly accreted material by such processes as consolidation, hydrologic manipulation (water level drawdown), application of soil

38 | P a g e
amendments and/or soil removal may increase the overall longevity of STAs to improve water quality.
Figure 1-1. Schematic showing the relationship among various components of Stormwater Treatment Areas (STA).
In wetlands, P cycling is tightly coupled to organic matter turnover and cycling of other nutrients such as nitrogen, carbon, calcium and sulfur (Figure 1-1). A series of papers on STA-1W published in a special issue of Ecological Engineering (Reddy et al., 2006) indicated the importance of hydrology, vegetation, periphyton, and biogeochemical processes regulating long-term retention of P in wetlands. It is critical to understand these fundamental processes and the linkages between them for effective long-term P management in STAs.
For example, consider the effect of nitrogen (N) and sulphur (S) on the retention of P in wetlands. It has long been known that in highly P-enriched areas, biotic growth/productivity is most frequently limited by nitrogen. Also, the process of litter decomposition is known to have a high demand for nitrogen. In this way, nitrogen availability could be a primary factor regulating P storage and stability in wetland systems where a significant uptake of nutrients by biota can be counter-balanced by a release of nutrients during decomposition, resulting in a small fraction of the total material produced being retained in accreted material (Reddy et al., 2005). Similarly, sulfur can interact with soils to affect P retention and stability. In highly anaerobic wetland conditions, excess SO4 can stimulate organic matter decomposition, thus promoting organic P mineralization and increasing porewater soluble reactive phosphorus (SRP). Sulfur can also act through chemical reactions to affect soil binding capacity for P, particularly in calcareous systems where pH directly determines mineral stability and P sorption.
The relative rates of these coupled biogeochemical processes affect long-term accretion of P and vary across time and space, as affected by external forcing functions such as hydraulic and nutrient loading rates. Consequently, a research strategy must adopt a holistic and interdisciplinary approach to understand these processes and provide pertinent information for effective STA management.

39 | P a g e
Figure 1-2. Map showing locations of Stormwater Treatment Areas within the Everglades basin. (Source: SFWMD)

40 | P a g e
2 OBJECTIVES AND APPROACH
The main objectives of this project are to:
1. Review current monitoring programs and datasets, including sampling methods, frequencies, durations and other information for all STAs and propose scientifically sound statistical analytical approaches for data interpretation.
2. Conduct data analysis for each of the six STAs. 3. Summarize the temporal dynamics of each STA in terms of water and soil characteristics and
correlate such information with the observed STA performance. 4. Determine how this information and data may be useful in addressing some key questions
about the STAs. 5. Identify critical data needs to determine long-term sustainability of STAs. 6. Lead and coordinate a technical workshop focusing on the operation and management of the
STAs.
2.1 Report Organization
To address the above objectives, data from the following STA components, processes, and parameters were reviewed and interpreted for each cell of each STA (25 cells total):
1. Water budget 2. Phosphorus mass balance 3. Elevation distribution 4. Wetted area and depth 5. Hydraulic residence time 6. Water column chemical constituents 7. Soil nutrients
This report presents an analysis of available data from abbreviated operating periods for all six STAs with regard to each of the above topics. The information in this report has been compartmentalized to facilitate navigation through this document. This chapter describes the project objectives and the approaches and types of data used. Chapters 4 and 5 describe data sources and methods. Chapters 6 through 11 present findings for each STA. Chapter 12 contains cross-STA comparisons and overall conclusions. Recommendations and suggestions for future research area presented in chapter 13. Chapter 14 lists the references consulted during the analysis. Supporting data are provided in the Appendix. Each chapter contains a subsection dedicated to addressing each of the above subjects.
2.2 Water Budget
The water budget is the foundation for chemical mass balances. The water budgets for STAs are well studied by SFWMD and other organizations, and are known to have error, i.e. unaccounted missing or excess water in the water budget, as high as 50% (Pietro et al., 2009). The objectives of this water budget analysis were to: 1) assess the sources of these errors, 2) evaluate the potential to generate a more accurate budget with modified methods, 3) and validate SFWMD

41 | P a g e
datasets (described in Section 3.1) and our methods (described in Section 4.1) through comparison with findings in SFER 2009.
2.3 Phosphorus Mass Balance
The balance of outflow P against inflow P is a primary metric by which the STA performance is evaluated. Mass balances can be calculated with varying degrees of complexity, either considering (by subtraction of outflow from inflow data) only the mass of P that entered but did not leave the wetland or, through the inclusion of additional datasets, identifying the relative contribution of various compartments within the wetland (soil and biomass) to the storage of P. Even simple P mass balances are useful in determining the sources of P to the wetland (surface water, groundwater, precipitation) and for calculating the gross P removal effectiveness. More complex ‘complete’ mass balances are more difficult to assemble owing to data collection and processing challenges, but may illuminate internal P processes that could potentially be modified through STA management.
Annual mass balances based on inflow and outflow loads are calculated by District scientists, but are subject to a high level of uncertainty due to the observed errors in the water budgets to which they are intimately related. Here the objective was again to evaluate whether the P mass balances uncertainty could be reduced and also validate our approach by comparison to previous analyses.
2.4 Elevation distribution, wetted area, and depth
The STAs have a distribution of elevations arising from both macro-scale ground slope and micro-scale topographic heterogeneity. This variable topography creates a distribution of depths in throughout the wetland. Ecologically, this is beneficial because it promotes a higher diversity of species and communities than would be found in a flat bottom basin. There are two reasons, in many cases with some exceptions, a uniform flat bathymetry is considered ideal for P treatment wetlands. First, a flat bottom wetland is assumed to be more likely to approach plug-flow hydraulic because deep zone short-circuiting may be avoided. Plug-flow is an idealized condition where a mass of water moves through the system without mixing over the course of one nominal residence time. Plug-flow systems maximize treatment effectiveness, but real (as opposed to idealized) systems are always subject to some short-circuiting or mixing (Kadlec and Knight, 1996). Second, current STA design is based on two dominant vegetation types: EAV (e.g. dense monotypic Typha) and SAV. It is easier to maintain uniform coverage of target vegetation when the whole wetland experiences the same depth under any given stage. Truly flat bottoms are nearly impossible to construct on the scale of the STAs, and elevation ranges (maximum minus minimum) in STA cells (based on multi-dimensional interpolation of topographic survey data) vary from about 0.5 ft in STA-3/4 Cell 1B to about 5 ft in STA-5 Cell 1A. The interaction of the spatial elevation distribution and the temporal stage distribution controls the wetted area and depth distribution across area and time in the STAs.
Some cells experience periodic dry-down conditions in whole or in part (Pietro et al., 2008) due to variability in weather conditions in the tributary basins. Low water conditions and variability in the topography result in dry out of sections of the STAs. Drying of portions of cells (or effective wetted area, EWA, of less than 100%) is of particular concern for submerged aquatic vegetation (SAV) that cannot survive dry out. It may be difficult or impossible to maintain SAV

42 | P a g e
in treatment cells that regularly or intermittently dry out. Additionally, reflooding exposed sediments results in a flux of P out of the sediments into the water column (Bostic and White, 2007; Pietro et al, 2008 and 2009). Thus, the changing wetted area due to stage and topographic interaction would be expected to reduce treatment effectiveness.
In this analysis, EWA is calculated in terms of fractional area*time. To clarify, daily flooded fractional areas were averaged over desired periods of time (month, year, period of record) and the resultant values are averages over both time and space. The areal*temporal combination within EWA must be recognized because, for example, a monthly EWA value of 50% may have resulted from 15 days of complete flooding and 15 days of dry out, 30 days of partial (half of the treatment area) flooding, or any situation between.
In recognition of the impacts of dry and deep zones, the SFWMD strives to maintain stages that achieve target water depths (currently 1.25 feet for SAV and EAV cells). Cells with a wide variation in topography may nonetheless have deep or dry zones even when the average depth is on target.
It has been established that a primary control on P outflow concentration in treatment wetlands is the areal P loading rate [M/L2/T] (Kadlec and Wallace, 2008). Reducing effective treatment area both spatially and temporally increases effective TP loading and retention rates on a per area basis such that the realized areal P loading rate may be higher than previously reported values that assume the inflow P load is being equally applied to the full treatment area.
The objective of this analysis was to develop a methodology for extending the management considerations beyond average depth to include the entire distribution of depths across the entire STA area.
2.5 Hydraulic Residence Time
Hydraulic residence time (HRT) is the average time that water remains in the wetland, and is a significant variable in designing and assessing treatment wetland performance (Kadlec and Wallace, 2008). Nominal HRT is the wetland volume divided by the flow rate of the surface water. It has been well-acknowledged that the residence time within the treatment wetland can directly affect its pollutant removal performance. For example, a shorter residence time of water in surface-flow treatment wetlands could result in a poor treatment performance because of lower sedimentation rates at higher current velocities, and less interaction time available between biota and pollutant (Kadlec and Wallace, 2008).
The objectives of analyzing HRT were 1) to develop a method to compute accurate HRT over short (three month) time steps, and 2) to compare treatment performance in STAs with respect to nominal residence time on a shorter timescale than has been examined previously.
2.6 Water Column Chemical Constituents
The pool of TP in the water column is typically subdivided into three functional categories: particulate phosphorus (PP), dissolved organic phosphorus (DOP), and soluble reactive phosphorus (SRP). Particulate phosphorus is any P associated with particles that fail to pass though a 0.45-µm membrane filter. Particulate P may be of organic or mineral origin. Soluble

43 | P a g e
reactive P is the fraction composed of orthophosphate (PO4) and easily hydrolyzed organic P that passes through a 0.45µm filter, while dissolved organic phosphorus (DOP) is the P associated with organic molecules that pass through a 0.45µm filter. Soluble reactive P is generally considered the most reactive and biologically available P fraction, and is often effectively removed by wetland systems. PP is typically also easily retained in wetlands because low water velocities allow the particles to settle and be intercepted by vegetation. The DOP fraction tends not to be readily available to microorganisms and can be difficult to remove in wetlands. In fact, primary production by wetland macrophytes and algae can contribute significant DOP to the water column, creating a situation of net DOP export (Qualls and Richardson,m 2003; Osborne, 2005).
STA inflow water contains a number of nutrients and chemicals besides P. Many of these compounds, including calcium (Ca), iron (Fe), aluminum (Al), and sulfate (SO4) are known to interact with the P biogeochemical cycle (Reddy and Delaune, 2008).
The objective of this analysis was to evaluate the relationship between loads and concentrations of calcium and sulfate on P treatment performance between STAs.
2.7 Soil Nutrients
Soils serve as long term integrators for nutrient storage and soil nutrient status provides an insight into the development and accretion of nutrients with time. The temporal changes in P, N, and C storage provide an indication of the relative stability of accreted material. An understanding of the processes conducive to the long term stability of soil nutrients is critical to maintain the functional role of STAs as a secure sink for extended periods in the future.
Both abiotic and biotic processes regulate P retention in wetlands. The abiotic processes operating in the STAs may be classified into two distinct P retention pathways: sorption and burial. Phosphorus sorption by soils is defined as the removal of phosphate from the soil solution to the solid phase, and includes both adsorption and precipitation reactions. When plants and microbes die off, the P contained in cellular tissue may either recycle within the wetland, or may be buried with refractory organic compounds. Soils therefore are an especially important component of these systems, as soils provide long-term storage for nutrients such as phosphorus (P) and in the short-term soil-water nutrient dynamics can control nutrient concentrations in overlying waters.
The objectives of this soils analysis were to 1) inventory STA soil sampling to date, 2) assess soil nutrient storages in the STAs, and 3) examine relationships between soil storages and water column P retention.
2.8 Vegetation
Emergent and submerged vegetation promote P removal in wetlands by 1) sequestering P in biomass which is retained as peat in the system, 2) altering water chemistry, 3) providing a source of C and energy for the microorganisms that support biogeochemical cycling of P and 4) providing a substrate for said microorganisms.
Information on wetland vegetation, including density, coverage, and biomass is difficult to quantify at the geographic scale of the STAs. The objective of this analysis was to inventory

44 | P a g e
STA vegetation data and quantify P storages in the vegetation component. Limited vegetation analysis was undertaken based on the DB environmental report (D B Environmental, 2002) as a part of this project.

45 | P a g e
3 DATA SOURCES
Detailed information about the operations and management of STAs was obtained from the published South Florida Environment Reports (SFERs).
3.1 Water and Phosphorus Budgets, and Water Column Chemical Constituents
In this study, detailed water and P budgets were calculated for STA-5. The results were sufficiently consistent with previously published analyses (Pietro et al., 2009, Appendix 5-8) that the latter were used for the remaining STAs. Thus, except for STA-5, the water and TP budgets included in this report are reproductions of those from Pietro et al. (2009).
All hydrologic and water quality data were obtained from the SFWMD online database, DBHydro (http://my.sfwmd.gov/dbhydroplsql/show_dbkey_info.main_menu). Table 3-1 summarizes the hydrologic data stations used for the hydrologic analysis of STA-5. See Table 14-1 in the appendix for a full list of surface water stations.
Table 3-2 shows the monitoring stations for which water quality data were retrieved and used in the TP mass balance calculations. See Table 14-2 in the appendix for a full list of stations. Refer to Figure 9-1 for approximate locations of stations within the STA-5. Composite and grab samples were available for TP in DBHydro. A grab sample is a sample taken at a given time and location and is used to obtain a snapshot for a given parameter at an instant in time. A composite sample is a series of grab samples taken over a given time period or area. A composite sample will tend to be more representative of a non-homogeneous media simply because a series of grab samples are mixed to represent a mean value. There are two basic types of composite samples collected by the SFWMD, time proportional and flow proportional. Auto-sampler composite flow proportional (ACF) values were used here for all mass balance parameters except seepage in and seepage out [Ig and Og; Equation ( 4-8 )], as discussed below.
All water quality data except TP were retrieved by SFWMD staff from DBHydro. Some available datasets suffered from internal discrepancies were excluded for cells or STAs. A summary of available, included and omitted water quality datasets is presented in Table 3-3.

46 | P a g e
Table 3-1: Hydrologic data monitoring stations used for the data analysis of STA-5 Data Type Monitoring Stations
Inflow
G-342A, G-342B, G-342C, G-342D, G-349A, G-507, G-350A, G-345
Outflow
G-344A, G-344B, G-345, G-344C, G-344D
Precipitation
STA-5WX
Evapotranspiration
STA1-W (computed for whole STA)
Stage (Seepage calculations only)
G-342A_T, G-349A_T, G-343B_H, G-343B_T, G-344A_H, G-342D_T, G-350_T, G-343_H, G-343_T, and G-344D_H
Table 3-2: Water quality monitoring stations included in TP analysis of STA-5
Inflow Stations Outflow Stations
Northern Flow-way
G-342A, G-342B, G-349A, G-507
G-344A, G-344B, G-345
Central Flow-way
G-342C, G-342D, G-350A, G-345
G-344C, G-344D

47 | P a g e
Table 3-3. Summary of available, included and omitted water quality dataA.
TP SRP TDP DOP PP Ca SO4
STA-1E Cell 3 Inc Inc Inc Inc Inc Inc NA
Cell 4N Inc Inc Inc Inc Inc Inc NA
Cell 4S Inc Inc Inc Inc Inc Inc NA
Cell 5 Inc NA; data not avail at internal levees
NA; data not avail at internal
levees
NA; data not avail at internal levees
NA; data not avail at internal levees
NA; data not avail at internal levees
NA
Cell 6 Inc NA
Cell 7 Inc NA
STA-1W Cell 1 Inc Inc Omitted; outflow
TDP<SRP Omitted Omitted. Inc NA
Cell 2 Inc Inc NA: Outflow TDP NA NA Inc NA
Cell 3 Inc NA: Outflow SRP
Inc; though occasionally
inflow TDP >TP NA Inc Inc NA
Cell 4 Inc Inc Inc Inc Inc Inc Inc
Cell 5 Inc Inc Omitted; outflow TDP<SRP Omitted Omitted Inc
(Inflow only) Inc
STA-2
Cell 1 Inc Inc Inc Inc Inc Omitted; data
incongruous with Cells 2 and 3.
NA
Cell 2 Inc Inc Inc Inc Inc Inc NA
Cell 3 Inc Inc Inc Inc Inc Inc NA
STA-3/4 Cell 1A Inc NA: Outflow
SRP Inc NA Inc Inc NA
Cell 1B Inc Inc Inc Inc Inc Inc NA
Cell 2A Inc Inc Inc Inc Inc Inc NA
Cell 2B Inc Omitted:
some outflow SRP>TDP
Omitted: some outflow
TDP<SRP Omitted Omitted Inc NA
Cell 3 Inc Omitted Omitted: some outflow TDP>TP Omitted Omitted Inc NA

48 | P a g e
STA-5 CFW Inc Inc Omitted; some
outflow TDP>TP Omitted Omitted Inc Inc
NFW Inc Inc Inc Inc Inc Inc Inc
STA-6 Cell 3 Inc Inc Inc Inc Inc Inc NA
Cell 5 Inc Inc Inc Inc Inc Inc NA AInc = Available and included; NA = not available; Omitted = available but excluded for the reason stated.
3.2 Elevation Distribution, Wetted Area and Depth
Both EWA and depth analysis relied upon the daily average stage in each cell. For the estimation of the daily stage in each cell, the maximum number of available stations was used. All stage data were retrieved from DBHydro in January 2009. Table 14-5 provides the DBKeys and periods of record for the stage stations used in each cell. The designations ‘H’ and ‘T’ following the station names indicate ‘headwater’ and ‘tailwater’ respectively; that is, whether the stage was recorded on the upstream or downstream end of the structure.
EWA and depth analyses also required the elevation distributions generated using topographic data for each STA provided by SFWMD. Topographic survey points for STA-5 (Cell 1B, 2A, and 2B) were available in the form of dat files with coordinates x, y and z. The survey was conducted by Wantman group in 2005. STA-5 Cell 1A topographic survey points were provided by SFWMD in GIS shapefile. For the rest of the STAs, topographic survey points were also provided in the form of GIS shapefile. The topographic survey of STA-1W was conducted in 2008 that was used in this analysis.
3.3 Hydraulic Residence Time
For this report, estimates of HRT used three-month rolling average of flow rates, depth, and fraction of flooded area of the treatment cells/flow-ways. All flow and stage data were obtained from the DBHydro. Spatial mean surface elevation of each cells/flow-ways was obtained from the bathymetry map plotted in the ArcGIS. Topographic data were provided by SFWMD.
3.4 Water Column Chemical Constituents
Data for water column chemical constituents including P forms and non-phosphorus chemicals were supplied by SFWMD via DBHydro.
3.5 Soil Nutrients
Floc and soil nutrient data were provided by the SFWMD. Data from earlier research projects conducted by Soil and Water Sciences Department at UF were also used for the analysis. Soil samples were either collected by the SFWMD staff or by contractors employed by the SFWMD. These samples were analyzed for various parameters by various labs. The parameters that were measured on soil samples include water content, bulk density, ash free dry weight (AFDW), organic matter (loss on ignition = LOI), pH, iron content, calcium, sulfur, total C, total P and total N.

49 | P a g e
The earliest available soil samples were taken from STA-1W in WY1994. Soil sampling was carried out in other STAs as they came online in subsequent years. Soil sampling in these STAs were not conducted each year because of the expense associated with sampling on the large geographic scale of the STAs. Therefore, soils were sampled approximately every three years since WY2004. Sometimes the availability of water restricted access to some of the sampling locations and resulted in missing samples or irregular sampling frequencies. As a result of different conducting different sampling events, the methodologies, in terms of sampling depths and floc depth delineation, were inconsistent.
Bulk density and total P were measured for all samples during most of the years except for few cases where bulk density values were missing. As expected, sampling depth for floc was variable but in some events the variation within cells was larger than the variation across cells. Sampling depth for the upper soil layer was generally about 10 cm. Preliminary analysis of the soils data and limitations of the available data are presented by Reddy et al. 2008a.
3.6 Vegetation
Vegetation coverage tables and maps were provided by SFWMD. These data were not sufficiently quantitative or comprehensive (e.g. SAV was often grouped with “open water”) to be analyzed against trends in water quality and P performance. Additionally, SFWMD supplied a vegetation biomass and nutrient analysis report for STA-1W (ENRP) produced by DB Environmental (2002). This consisted of mean biomass and nutrient content of SAV, FAV and EAV species at specific locations. However, due to absence of spatial extent and percentage cover of these species across the STAs, nutrient storages in the vegetation were not calculated.

50 | P a g e
4 METHODS
4.1 Water Budget
The water budget for STA-5 was developed for varying time periods using the following equation:
∆S = Is + Ig + Ip – Os – Og – ET + r ( 4-1 )
where ∆S = Change in storage [L3/T] Is = Surface flow in [L3/T] Ig = Groundwater seepage in [L3/T] Ip = Precipitation [L3/T] Os = Surface flow out [L3/T] Og = Groundwater seepage out [L3/T] ET = Evapotranspiration [L3/T] r = residual; (Σoutflow +∆S)- Σinflow [L3/T]
Error in the water budget was calculated by:
ε = r ÷ [(Σinflow+Σoutflow)/2] x 100 ( 4-2 ) where
ε = % error in water budget
Although the STA-5 Southern Flow-way became flow capable in December 2006, it did not receive flow until July 2007 due to drought. Also, monitoring stations were not expected to be equipped for data collection until late 2007 (Pietro et al., 2008). Due to these conditions, no hydrologic data for the Southern Flow-way were available, so a water budget was not calculated for the Southern Flow-way. In the Northern and Central Flow-ways, flow data prior to WY2008 were not available for stations G-343A-H in the central levee (Figure 9-1) due to construction within STA-5 and refurbishment of the flow structures themselves (Pietro et al., 2007). Without data from stations G-343A-H, water budgets were calculated for Northern and Central Flow-ways only, as opposed to generating cell by cell budgets i.e. Cell 1A or Cell 2B.
Surface inflow (Is), precipitation (IP), surface outflow (Os), and evapotranspiration (ET) were obtained from DBHydro. For the Northern Flow-way, data from culverts G-342A and G-342B, and pumps G-349A and G-507 (Figure 9-1) were used to calculate Is. Data from culverts G-344A, G-344B and G-345 were used to calculate Os. For the Central Flow-way, culverts G-342C, G-342D, and G-345 and pump G-350A were used to calculate Is and culverts G-344C and G-344D were used to calculate Os. Precipitation data were obtained from DBHydro, monitored at weather station STA-5WX. See Appendix for POR daily rainfall (Figure 14-1) and ET (Figure 14-2) time series plots. The ET values were computed from STA-1W using the method of Abtew (1996). Both P and ET data were assigned as spatially constant for both flow-ways.

51 | P a g e
∆S was calculated using the following equation:
∆S = A * ∆h ( 4-3 ) where
A = area [A] ∆h = change in stage [L/T]
Both the Northern and Central Flow-ways have an area of 2,055 acres each (Pietro et al., 2008). Daily average stages were calculated for each flow-way by area-weighting the geometric mean stage in each cell within each flow-way. Table 4-1 records the stage monitoring stations used in the calculation of daily average stages. The approximate locations of the stage monitoring stations are shown in Figure 9-1. For a given day, d: ∆h = hd – hd-1 ( 4-4 )
Groundwater flow was not independently estimated for STA-5, so values for Ig and Og of the water budget equation were not available in DBHydro. Thus, these variables were estimated based on the residual of the water mass balance of the variables for which data were available:
∆S = Is + Ip – Os – ET + r’ ( 4-5 ) where
r’ = Ig – Og + r
In this case, it was assumed that the residual (r’) of the abbreviated water budget [Equation ( 4-5 )], was equal to the net groundwater seepage plus the true residual (i.e. the true error in the water budget calculation). By this method, r was assumed to be 0, thus r’ is simply equal to the net seepage. Daily values for r’ were calculated from Equation ( 4-5 ).
It was assumed that the STA basins intercept the water table, resulting in negligible vertical groundwater movement. To estimate horizontal seepage through the levees using these r’ values, the following permutation of Darcy’s Law was used (Huebner 2007):
Q = Ksp*L*∆Havg ( 4-6 ) In another form:
Ksp = Q / [L*∆Havg] ( 4-7 ) where
Q = volume of groundwater flow [L3/T] ∆Havg = head difference [L] L = length along which the head difference is applied [L] Ksp = coefficient of seepage [L/T]
From Equation ( 4-5 ), r’ was assumed to be the daily net groundwater flow, therefore Q = r’ was used in Equation ( 4-7 ). The daily head difference was determined by subtracting the average daily stage (in ft NGVD29) in the perimeter canals from the average daily stage (in ft NGVD29) in STA-5. To calculate an eight-year (POR) average value for Ksp from Equation ( 4-7 ) Q = ∑r’ and ∆Havg was the length-weighted average of the daily head differences from 1 May 2000 to 31

52 | P a g e
March 2008. See Table 4-1 for the list of monitoring stations used to calculate ∆Havg. The approximate length of STA-5 that is subjected to bank flow was estimated with Google Earth to be 5387 m for both the Northern Flow-way and the Central Flow-way. The Microsoft Excel application Solver was applied to further adjust the POR average Ksp such that, when reapplied to Equation ( 4-6 ), the resultant net groundwater flow minimized the sum of daily residuals in the water budget (∑r ≈ 0; see below). Seepage in and out was assumed to be a function of the head difference between the internal cells and the external canals; the absolute value of Q was termed Ig on days when ∆H < 0 and O g on days when ∆H > 0. These daily Ig and Og values were inserted into Equation ( 4-1 ) to complete the water budget and a set of daily r values was determined.
Table 4-1. STA-5: Stage monitoring stations used in the calculation of head difference. Northern Flow-way Central Flow-way
Internal Stations Seepage Canal
Stations Internal Stations
Seepage Canal
Stations G-342A_T, G-
349A_T, G-343B_H, G-343B_T and G-
344A_H
G-349A_H and
G-349B_H
G-342D_T, G-350A_T, G-343G_H, G-343G_T,
and G-344D_H
G-350A_H and
G-350B_T

53 | P a g e
4.2 Phosphorus Mass Balance
We estimated the TP mass balance for STA-5 Northern and Central Flow-ways. A TP mass balance was not calculated for the Southern Flow-way because no water quality data were available.
The TP mass balance is given as:
Pr = Isp + Igp + Ipp – Osp – Ogp ( 4-8 ) where:
Isp = TP mass entering STA-5 by surface water [M/T] Igp = TP mass entering STA-5 by groundwater [M/T] Ipp = TP mass added by precipitation [M/T] Osp = TP mass leaving STA-5 by surface water [M/T] Ogp = TP mass leaving STA-5 by groundwater [M/T] Pr = mass of TP retained in the system [M/T]
To calculate the mass of TP entering/leaving by surface flow (Isp and Osp), weekly and/or biweekly autosampler composited by flow (ACF) data were interpolated between collection dates to generate a daily time series. TP mass loads were calculated for each inflow and outflow structure on each day i using the following equation:
Mi = Qi x Ci ( 4-9 ) where
Mi = daily TP mass [M] Qi = daily volume of water flow [L3] Ci = daily estimate of TP concentration [M/ L3]
The daily M values were summed for all inflow stations and for all outflow stations of each flow-way to estimate daily Isp and Osp for each flow-way.
In the final mass balance, the precipitation term of Equation ( 4-8 ) was ignored because it has been estimated to account for approximately 0.2% of the total phosphorus load to STA-5 (Pietro et al., 2009).
Estimating values for terms Igp and Ogp of Equation ( 4-8 ) was done by the same procedure as estimating terms Isp and Osp. Daily Igp and Ogp estimated flow values from Equation ( 4-1 ) were used for Qi in Equation ( 4-9 ). TP associated with seepage flow was estimated by using an arbitrary set of Ci values because it is a non-point flow. The average daily surface outflow TP concentration (as measured at outflow stations G-344A-D) was used to estimate seepage inflow and outflow TP mass values. Here, as above, ACF data were preferred. However, ACF data are only collected when surface water flows through the control structures. Periods of up to several months without ACF data are not uncommon. Because seepage was estimated to occur continuously as a function of head difference, strict outflow ACF data could not be used as a reliable estimate of groundwater flow concentrations. Therefore, ACF data were interpolated across periods of up to one week to create a daily time series of TP concentrations (Ci). Gaps in

54 | P a g e
this time series were filled using interpolated data from grab samples to create a continuous daily time series of estimated TP concentrations (Ci).
4.3 Elevation Distribution
The ground surface elevations of STAs were interpolated from the topographic survey data (either in GIS shape files or dat files with coordinates x, y and z) provided by the SFWMD. A continuous bathymetry prediction map of each STA was generated by using kriging interpolation scheme. Initial survey data included extreme elevations at top of the levee, embankments, structures, and bottom of the ditches. However, these points were excluded in order to eliminate the effects of such extreme high and low elevation areas, which does not represent the true marsh areas. All bathymetric elevations were referenced to the NAD83 HARN, State Plane, Florida East Zone, US Survey feet and elevations were NGVD29.
Cumulative elevation distributions for each cell were calculated from an elevation frequency analysis performed in ArcGIS 9.2. These distributions were based on a range of 10 to 15 divisions between the minimum and maximum elevations, depending on the resolution necessary to capture the shape of the distribution curve. The elevation cumulative distribution functions (CDFs) were fit by sixth-order polynomial curve to the elevation distribution for each cell:
y = ax6 + bx5 + cx4 + dx3 + ex2 +fx + g ( 4-10 ) where:
x = elevation, ft NGVD29 [L] y = proportion of cell with elevation ≤ x a-g = constants, unique for each cell
The lowest order curve that produced an acceptable fit was selected. Because all of the curves in this study are the same form, only the coefficients for Equation ( 4-10 ) are presented for each cell in Table 14-3.
The nature of these high-order polynomials dictates that they only describe the elevation CDF over a specified domain. This range of valid elevations (x-values that produce frequency [y] values between 0 and 1 and lie within the range of surveyed elevations) is bounded by the minimum and maximum elevation within each cell.
4.4 Wetted Area and Depth
The wetted area, depth and hydraulic residence time analyses require cell-wise daily average stage values. To account for the heterogeneous distribution of structures and recorders within cells, geometric mean stages were generally not used. Stations proximate to one another relative to other stations in that cell (e.g. inflow stations vs. outflow stations) were averaged together first before averaging with other stations. This was intended to reduce the relative influence of multiple stations that would be expected to experience and report very similar stages and increase the influence of stations reporting from other places in the cell. For example, Cell 1 in STA-2 has one stage recorder at the inflow and five stage recorders at the outflow. The geometric mean of recorders distributed this way would be overly influenced by the stage at the outflow; thus the average of the outflow stations was averaged with the single inflow station to produce a (presumably) representative mean stage for the cell.

55 | P a g e
The EWA is simply the cumulative number of wetted acre*days divided by the total possible acre*days in the wetland over a given period of time (Brown and Caldwell, 1996). To find the percentage of a cell with depth greater than a specified value, n (e.g. 0 ft, which represents wetted area), (x-n) was substituted for x in Equation ( 4-10 ). Traditional analyses of flooding in the STAs were based stage minus average ground elevation; resultant positive values are taken as the average depth of flooding and negative values are interperated to mean the cell/STA was dry. By calculating the wetted area from the elevation distribution, a stage value less than the average ground elevation can return a positive fraction between 0 and 0.5, whereas the same stage value would return a negative or “dry” value by the traditional method. As a result, EWAs reported in this study may not be expected to mirror earlier “wet/dry” assessments.
For each cell, daily values of yn were generated for values of n at 0.5 ft increments from 0 to 4 ft by inserting daily average stage values for x. Because each daily yn value represents a fraction in space at a point in time, when yn is averaged over time (to produce a monthly or annual EWA, for example) it remains dimensionless, but comes to represent area*time. To illustrate, over a one month record, Cell A is found to have 50% wetted area every day, while Cell B is completely wet for 15 days and then completely dry for 15 days; the average EWA for that month would be 50% for both cells.
This technique produces only cumulative values (e.g. the area greater than 3 ft deep, rather than the area that is exactly 3 ft deep or the area with depths between 3 and 3.5 ft). The cumulative yn values can be subtracted from one another to calculate the area between two given depths (say, between 3 and 3.5 ft). In this report, the cumulative depth area*time distributions for each water year are presented graphically in the form of exceedance probability plots. The curves in these plots represent the probability of the depth exceeding the shown value at a random point in the wetland on a random day in the water year. The fractional area under each half-foot increment from 0 to 4 feet is tabulated in Table 14-4.
When EWA is less than 100%, inputs (water, P) to the STAs are concentrated onto less area than was designed. As a result, realized areal loading rates may be higher than when calculated with the full footprint of the STAs. Tables, figures and text in this text report “adjusted” areal loading rates where deemed necessary (that is, when EWA < 100%).
4.5 Hydraulic Residence Time
Nominal HRTs for each cell/flow-way were estimated using three-month rolling average storage volume of the wetland, flow rates and stages, assuming that the entire volume of water in the wetland involved in the flow without any stagnant zones. The three-month rolling average storage volume of water was divided by the volumetric flow rate, and multiplied by the fraction of effective flooded area (i.e. EWA) to obtain three-month average HRTs.
( 4-11 )
where
τ = nominal HRT [T]; Vi = three-month mean storage volume of water [L3]

56 | P a g e
Qi = three-month mean inflow rate [L3/T] Qo = three-month mean outflow rate [L3/T]; η = fractional EWA
The average water volume was computed as the product of the mean depth and surface area of the wetland (i.e. treatment cell or flow-way). The spatial mean ground elevation was deducted from areal average stage to obtain the mean depth for the entire cell/flow-way. Some STAs were frequently dried therefore the total area of the cell was multiplied by the fraction of effective wetted area to only account the flooded portion of the wetland which is presumed to be effective in removing P. Dry out may result from intentional draw down (for internal management activities), unavailability of water (drought), or both. Furthermore, the average flow rate (denominator of Equation ( 4-11 )) was obtained by using the mean values of volumetric inflow and outflow rate.
4.6 Water Column Chemical Constituents
Only TP, total dissolved P (TDP) and orthophosphate (PO4; referred to as soluble reactive P, SRP, in this document) are measured by SFWMD. Other P forms of interest, particulate P (PP) and dissolved organic P (DOP) were calculated using these three P forms. PP was estimated by subtracting TDP from TP, and DOP was calculated by subtracting SRP from TDP.
The monthly mass loads and flow-weighted mean concentrations (FWMC) of various non-phosphorus chemicals were provided by SFWMD. Annual and POR mass loads were simply the sum of the mass loads for the months within the time period of interest. Annual and POR FWMC were calculated by:
( 4-12 )
where:
Cx = FWMC of chemical x [M/ L3] ∑Mix = sum of monthly mass loads of chemical x for all the months, i, within the averaging period [M/T] ∑Qi = sum of monthly flow volumes for all months, i, within the averaging period [L3/T]
Areal loading rates for these chemicals for a given time period (e.g. year, POR) were computed by dividing the inflow mass by the EWA-adjusted area of the cell:
( 4-13 )
where:
LR = areal loading rate [M/A/T] ∑Mix = sum of monthly mass loads of chemical x for all the months, i, within the averaging period [M/T] A = reported area of the wetland of interest η = fractional EWA
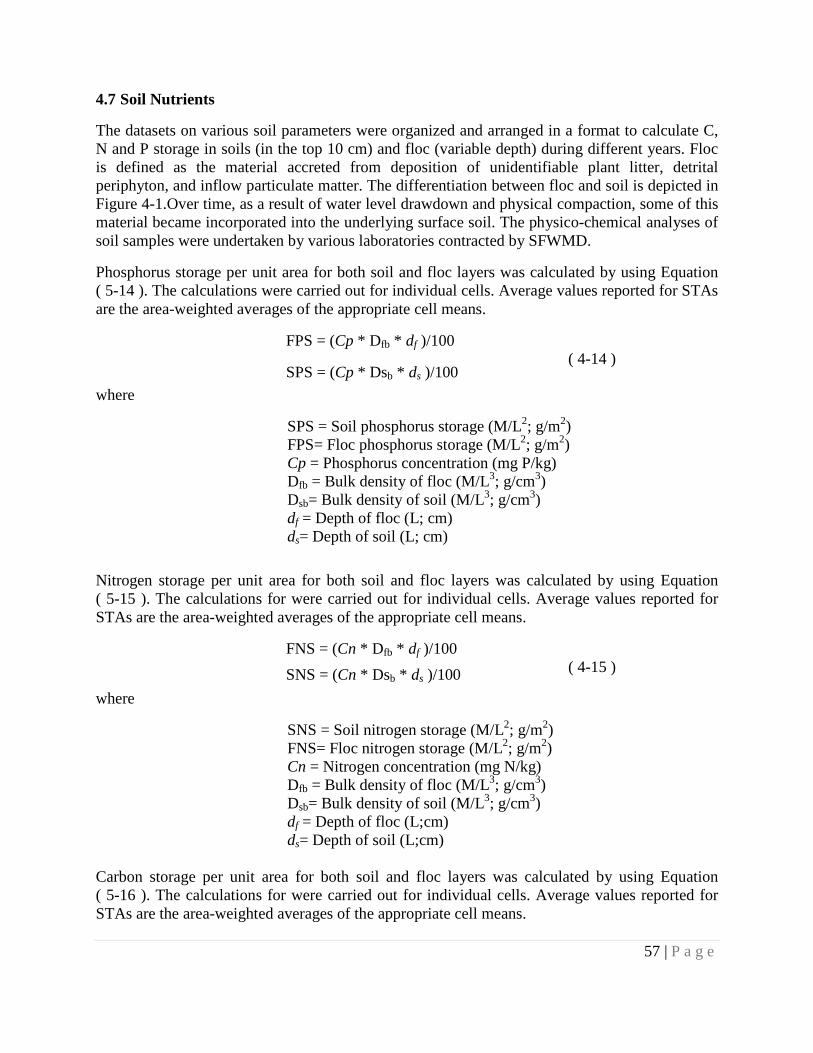
57 | P a g e
4.7 Soil Nutrients
The datasets on various soil parameters were organized and arranged in a format to calculate C, N and P storage in soils (in the top 10 cm) and floc (variable depth) during different years. Floc is defined as the material accreted from deposition of unidentifiable plant litter, detrital periphyton, and inflow particulate matter. The differentiation between floc and soil is depicted in Figure 4-1.Over time, as a result of water level drawdown and physical compaction, some of this material became incorporated into the underlying surface soil. The physico-chemical analyses of soil samples were undertaken by various laboratories contracted by SFWMD.
Phosphorus storage per unit area for both soil and floc layers was calculated by using Equation ( 5-14 ). The calculations were carried out for individual cells. Average values reported for STAs are the area-weighted averages of the appropriate cell means.
FPS = (Cp * Dfb * df )/100
SPS = (Cp * Dsb * ds )/100
( 4-14 )
where
SPS = Soil phosphorus storage (M/L2; g/m2) FPS= Floc phosphorus storage (M/L2; g/m2) Cp = Phosphorus concentration (mg P/kg) Dfb = Bulk density of floc (M/L3; g/cm3) Dsb= Bulk density of soil (M/L3; g/cm3) df = Depth of floc (L; cm) ds= Depth of soil (L; cm)
Nitrogen storage per unit area for both soil and floc layers was calculated by using Equation ( 5-15 ). The calculations for were carried out for individual cells. Average values reported for STAs are the area-weighted averages of the appropriate cell means.
FNS = (Cn * Dfb * df )/100
SNS = (Cn * Dsb * ds )/100 ( 4-15 )
where
SNS = Soil nitrogen storage (M/L2; g/m2) FNS= Floc nitrogen storage (M/L2; g/m2) Cn = Nitrogen concentration (mg N/kg) Dfb = Bulk density of floc (M/L3; g/cm3) Dsb= Bulk density of soil (M/L3; g/cm3) df = Depth of floc (L;cm) ds= Depth of soil (L;cm)
Carbon storage per unit area for both soil and floc layers was calculated by using Equation ( 5-16 ). The calculations for were carried out for individual cells. Average values reported for STAs are the area-weighted averages of the appropriate cell means.

58 | P a g e
FCS = (Cc * Dfb * df )/100 SCS = (Cc * Dsb * ds )/100
( 4-16 )
where
SCS = Soil carbon storage (M/L2; g/m2) FCS = Floc carbon storage (M/L2; g/m2) Cc = Carbon concentration (mg P/kg) Dfb = Bulk density of floc (M/L3; g/cm3) Dsb= Bulk density of soil (M/L3; g/cm3) df = Depth of floc (L; cm) ds= Depth of soil (L;c m)
4.8 Phosphorus Mass Balance
The P mass balance was calculated from cumulative TP retained from the water column and P storage in floc and surface soil (0-10 cm) data for WY2007. We assumed that the cumulative mass of TP removed from water column was stored in the floc. On analysis, if FPS was found to be higher than the net TP retained from the water column it was assumed that surface soils (0-10 cm) fluxed P into the floc layer (by an unspecified combination of possible pathways, including diffusive flux and mining by vegetation). Also, the change in the SPS from the background level (the storage associated with the earliest available sampling data) was calculated. It was assumed that a net positive change indicated that P moved into the surface layer either from the floc above or from the subsurface soils (deeper than 10 cm). A negative change from the background SPS was assumed to indicate that P migrated from the top 10 cm of soil to either the floc or to the subsurface soil (deeper than 10 cm).
The P mass balance is presented in the form of a schematic diagram for each STA. The arrows indicate flux of P from one compartment to another. The values on the arrows represent amount of P flux expressed in g P/m2 and the arrows indicate the direction of P movement.
4.9 Vegetation Nutrient Analysis
Vegetation nutrient storages were estimated based on DB environmental report (DB Environmental, 2002) for EAV, SAV and FAV species from cells of ENR project (STA-1W). The data was collated and relationships between nutrient storages in vegetation from winter and summer months were explored. This was not attempted for other STAs due to unavailability of data and should be considered as an estimate since the actual extent of coverage for the vegetation in each cell was not available.

59 | P a g e
Figure 4-1. Soil core with floc layer on top of the soil (Image: S. Newman, SFWMD)

60 | P a g e
5 STORMWATER TREATMENT AREA 1 EAST (STA-1E)
5.1 Introduction
STA-1E consists of 2077 ha (5132 ac) and is divided into three north-to-south flow-ways comprising a total of 7 cells (Figure 5-1). As of 2008, Cells 1, 3, 5 and 7 were designated EAV, and are managed as such. Cells 4N, 4S and 6 are designated SAV cells. The United States Army Corps of Engineers maintains an experimental Periphyton-based Stormwater Treatment Area (PSTA) within Cell 2. Cells 1 and 2, total area 448 ha (1108 ac), were excluded from this analysis because they are operated to support the PSTA project. STA-1E initially received water in WY2005 as a result of Hurricanes Frances and Jeanne, and normal operation of the Central and Western Flow-ways began in mid-WY2006. All cells in these flow-ways have remained online since operation began (Table 5-1). The POR for STA-1E in this study includes only WY2007 and WY2008, unless otherwise noted. The HLRs for cells in STA-1E increased from WY2007 to WY2008. The arithmetic mean HLR for Cells 3-7 in WY2007 was approximately 19 m/yr, and increased to about 32 m/yr in WY2008. The arithmetic mean TP loading rate decreased from 3.6 to 2.8 g P/m2/yr, though some cells experienced TP loading as high as 8.9 g P/m2/yr (Cell 5, WY2007)).
STA-1E receives stormwater runoff from several different upstream basins. For example, the Western Flow-way receives water mainly from S-5A basin, while the Central Flow-way receives water from the C-51W basin.
In STA-1E, the topography indicates a downward slope from east to west. Because of hydraulic connections between Cells 5, 6 and 7, maintenance of target stages in Cells 5 and 6 can create high water conditions in Cell 7, which negatively impact the health and maintenance of emergent vegetation in that area.

61 | P a g e
Figure 5-1. STA-1E: Schematic showing plan view of cells and water control structures. (Source: Pietro et al., 2008).

62 | P a g e
5.2 Operational Timeline
Table 5-1. STA-1E: Abbreviated operational timeline. 2004 2005 2006
WY2005 WY2006
Jan
Feb
Mar
Apr
May
Jun
Jul
Aug
Sep Oct
Nov
Dec
Jan
Feb
Mar
Apr
May
Jun
Jul
Aug
Sep Oct N
ov
Dec
Jan
Feb
Mar
Apr
Hurricanes Frances
and Jeanne Hurricane
Wilma
Prior to operation Emergency operations, cell hydration Central and Western Flow-ways operational
Eastern Flow-way offline for construction
of PSTA project
2006 2007 2008
WY2007 WY2008
May Jun Jul Aug Sep Oct Nov Dec Jan Feb Mar Apr May Jun Jul Aug Sep Oct Nov Dec Jan Feb Mar Apr
Central and Western Flow-ways operational
All Flow-ways operational; stage increased 15 cm in SAV cells (Cells 4N, 4S and 6) in Sept 2007 for drought contingency purposes.
Eastern Flow-way offline for construction of PSTA project
PSTA project completed

63 | P a g e
5.3 Water and Phosphorus Budget
The annual water budgets for each cell of STA-1E have been calculated previously by SFWMD (Table 5-2; Pietro et al., 2009). The year-to-year hydraulic loading within cells in STA-1E has been comparable with cells in other STAs and did not explain any variation in TP treatment between this and other STAs. In most cells across all STAs, groundwater flux typically accounts for a small, often trivial, portion of total water flow in a specific cell in a given year. STA-1E recorded no groundwater flow (in or out) in all reported water years. There was a marked and non-uniform change in hydraulic loading rate from WY2007 to WY2008 in all cells. In WY2007, all cells received between 14 and 21 m/yr of water. However, in WY2008 water was diverted into the Central Flow-way because of structural failures in the Western Flow-way cells. In WY2008, Central Flow-way processed an average of 57 m/yr of water, while cells in the Western Flow-way were loaded with less than 6 m/yr of water. This change in hydraulic loading is reflected in the TP areal loading rate, but the TP removal effectiveness did not change in a uniform or predictable way. For example, Cells 3 and 4N both experienced a four-fold increase in hydraulic loading from WY2007 to WY2008; TP mass removal effectiveness in Cell 3 decreased from 20% to 0%, but increased from 50% to 70% in Cell 4N. Similarly, the HLR in Cell 6 and Cell 7 decreased by a factor of about 2.5, but Cell 6 removed about 35% of the inflow TP in both water years, while removal increased from -5% to 55% in Cell 7. These non-uniform changes suggest that HLR alone does not control short-term (annual) TP removal performance, though it may play a role in long-term P dynamics by regulating the P loading rate and influencing vegetation communities.
Annual TP mass balances for STA-1E have been prepared previously by SFWMD (Table 5-3; Pietro et al., 2009). Phosphorus mass removal effectiveness varied substantially from cell to cell in this STA. The two-year POR does not allow for a meaningful evaluation of change over time. Total P mass loads into the cells in STA-1E changed dramatically from WY2007 to WY2008, primarily as a result of altered hydraulic loading. From WY2007 to WY2008, the mass load increased 3- to 5-fold in the Central Flow-way, but decreased in the Western Flow-way by a factor of 7 to 20. The POR is too short to make a valid interpretation of the correlation between TP mass removal effectiveness and TP mass loading in STA-1E. The areal TP loading rates for STA-1E are discussed in Section 5.4.

64 | P a g e
Table 5-2. STA-1E: Annual water budgets for Central and Western Flow-ways. Pietro et al., 2009. Is Ig Ip Σinflow HLR Os Og ET Σoutflow ΔS r ε
hm3/yr hm3/yr hm3/yr hm3/yr m/yr hm3/yr hm3/yr hm3/yr hm3/yr hm3/yr hm3/yr Cell 3 WY2007 30.3 0 2.1 32.4 14 51.7 0 3.1 54.8 -0.8 21.7 49.80% WY2008 120.1 0 2.7 122.8 52 152 0 3.1 155.1 1.3 33.6 24.20% POR 150.4 0 4.8 155.2 65 203.7 0 6.3 210 0.5 55.3 30.30% %In 96.90% 0.00% 3.10% %Out 97.00% 0.00% 3.00% 0.30% Cell 4N WY2007 51.7 0 2.3 54 21 58.8 0 3.4 62.2 -0.1 8.1 14.00% WY2008 152 0 2.9 154.9 59 175.1 0 3.4 178.5 0.7 24.4 14.60% POR 203.7 0 5.2 208.9 80 233.9 0 6.9 240.8 0.6 32.5 14.40% %In 97.50% 0.00% 2.50% %Out 97.10% 0.00% 2.90% 0.30% Cell 4S WY2007 58.8 0 2.7 61.5 20 48.2 0 4 52.2 0.1 -9.2 -16.20% WY2008 175.1 0 3.4 178.5 59 146.8 0 4 150.8 0.7 -27.1 -16.40% POR 233.9 0 6.1 240 79 195 0 8 203 0.8 -36.2 -16.40% %In 97.50% 0.00% 2.50% %Out 96.00% 0.00% 4.00% 0.30% Cell 5 WY2007 45.3 0 2 47.4 21 28.3 0 3 31.3 0 -16 -40.70% WY2008 7.5 0 2.6 10.2 4 11.9 0 3 14.9 1.1 5.9 47.20% POR 52.9 0 4.6 57.5 25 40.2 0 6.1 46.3 1.1 -10.1 -19.50% %In 92.00% 0.00% 8.00% %Out 86.80% 0.00% 13.20% 2.00% Cell 6 WY2007 66.7 0 3.7 70.4 17 64.3 0 5.6 69.9 0 -0.6 -0.80% WY2008 19.6 0 4.8 24.4 6 30.3 0 5.6 35.9 0.4 12 39.80% POR 86.3 0 8.5 94.8 22 94.6 0 11.2 105.8 0.4 11.4 11.40% %In 91.00% 0.00% 9.00% %Out 89.40% 0.00% 10.60% 0.50% Cell 7 WY2007 31.6 0 1.5 33 20 38.4 0 2.2 40.7 0 7.6 20.60% WY2008 13 0 1.9 14.9 9 7.7 0 2.2 9.9 0 -5 -39.90% POR 44.6 0 3.4 48 28 46.1 0 4.5 50.6 0 2.6 5.40% %In 92.90% 0.00% 7.10% %Out 91.20% 0.00% 8.80% 0.00% Is = surface water inflow; Ig = groundwater inflow; HLR = hydraulic loading rate; IP = precipitation; Os = surface water outflow; Og = groundwater outflow; ET = evapotranspiration; ∆S = change in storage volume; r = water budget residual; ε = water budget error

65 | P a g e
Table 5-3. STA-1E: Annual total phosphorus mass balance (mt) for Central and Western Flow-ways. Pietro et al., 2009.
Isp Ipp ∑Inflow Osp Ogp ∑Outflow Retained % Ret
Cell 3 WY2007 4.344 0.008 4.353 3.449 0 3.449 0.904 20.80% WY2008 15.659 0.011 15.67 15.623 0 15.623 0.048 0.30% TOTAL 20.004 0.019 20.023 19.071 0 19.071 0.951 4.80%
%In 99.90% 0.10% % Out 100.00% 0.00% Cell 4N
WY2007 3.449 0.009 3.458 1.724 0 1.724 1.734 50.10% WY2008 15.623 0.012 15.634 4.752 0 4.752 10.883 69.60% TOTAL 19.071 0.021 19.092 6.476 0 6.476 12.617 66.10%
%In 99.89% 0.10% % Out 100.00% 0.00% Cell 4S
WY2007 2.756 0.011 2.767 1.055 0 1.055 1.712 61.90% WY2008 6.061 0.014 6.074 2.724 0 2.724 3.35 55.20% TOTAL 8.817 0.024 8.842 3.779 0 3.779 5.063 57.30%
%In 99.72% 0.12% % Out 100.00% 0.00% Cell 5
WY2007 20.578 0.008 20.586 6.894 0 6.894 13.693 66.50% WY2008 1.098 0.01 1.108 1.558 0 1.558 -0.45 -40.60% TOTAL 21.676 0.019 21.694 8.452 0 8.452 13.242 61.00%
%In 99.91% 0.09% % Out 100.00% 0.00% Cell 6
WY2007 15.267 0.015 15.282 10.178 0 10.178 5.103 33.40% WY2008 2.359 0.019 2.378 1.51 0 1.51 0.868 36.50% TOTAL 17.626 0.034 17.66 11.688 0 11.688 5.972 33.80%
%In 99.81% 0.19% % Out 100.00% 0.00% Cell 7
WY2007 8.039 0.006 8.045 8.373 0 8.373 -0.328 -4.10% WY2008 1.759 0.008 1.767 0.801 0 0.801 0.966 54.70% TOTAL 9.798 0.014 9.811 9.174 0 9.174 0.638 6.50%
%In 99.86% 0.14% % Out 100.00% 0.00% Isp = surface water inflow; Igp = groundwater inflow; Ipp = precipitation; Osp = surface water outflow; Ogp = groundwater outflow

66 | P a g e
5.4 Elevation Distribution, Wetted Area and Depth
STA-1E has an average ground elevation of about 13.7 ft NGVD29 (
Figure 5-2). All cells in STA-1E have moderate elevation ranges (about 2 ft; Figure 5-3 through Figure 5-7). In all cells, the POR average daily stage was higher than the maximum elevation. However, only in Cells 6 and 7 was the POR average stage more than one standard deviation higher than the maximum elevation. Some areas with high ground elevation, particularly in Cells 3 and 5 dried occasionally over the POR.

67 | P a g e
Cells 4N, 4S, 6 and 7 experienced approximately 100% temporal*areal flooding over the WY2006-WY2008 (Figure 5-10 through Figure 5-15). Wetted area was about 90-95% in all three water years for Cells 3 and 5. The areal TP loading rate was highly variable from year to year for every cell (Table 5-4), resulting primarily from changing hydraulic loading rates, rather than from changing P concentrations in the inflow water. Total P mass removal effectiveness was not correlated with annual areal TP loading rate. Annual average outflow TP flow-weighted concentration was weakly correlated (r2=0.32) with annual areal TP loading rate (Figure 5-9). Water years were divided into “low”, “medium” and “high” inflow TP FWMC categories by dividing the range of the data into equal thirds. “Low” corresponds to annual inflow TP FWMC ≤ 0.10 mg/L; “Medium,” 0.10 mg/L< TP FWMC ≤ 0.15 mg/L; and “High,” TP FWMC > 0.15mg/L. Note that, generally, for two points with similar areal loading rates, the point with higher inflow TP FWMC will have the greater TP outflow FWMC.
Depth analysis
Probabilities of depths were similar for all years and all cells in STA-1E, except Cells 6 and 7 were slightly deeper than the other 4 cells (Figure 5-10 through Figure 5-15; non-cumulative distribution of depths is reported in Table 14-4 in the appendix). The median depth for each cell was between 1.5 and 3 ft for individual water years. Depth never exceeded 4 ft for more than 2% of the area*time in any cell in any water year.
As was found for other STAs, the distribution of depths did not predict TP removal performance in STA-1E.

68 | P a g e
Figure 5-2. STA-1E: Topographic map.

69 | P a g e
Figure 5-3. STA-1E: Cumulative elevation distribution for Cell 3. Vertical lines indicate period-of-record (WY2005-WY2008) mean stage ± 1 standard deviation.
Figure 5-4. STA-1E: Cumulative elevation distribution for Cell 4N. Vertical lines indicate period-of-record (WY2005-WY2008) mean stage ± 1 standard deviation.
0%
20%
40%
60%
80%
100%
10 11 12 13 14 15 16 17 18
Feet of elevation NGVD
0%
20%
40%
60%
80%
100%
10 11 12 13 14 15 16 17 18
Feet of elevation NGVD

70 | P a g e
Figure 5-5. STA-1E: Cumulative elevation distribution for Cell 4S. Vertical lines indicate period-of-record (WY2005-WY2008) mean stage ± 1 standard deviation.
Figure 5-6. STA-1E: Cumulative elevation distribution for Cell 5. Vertical lines indicate period-of-record (WY2005-WY2008) mean stage ± 1 standard deviation.
0%
20%
40%
60%
80%
100%
10 11 12 13 14 15 16 17 18
Feet of elevation NGVD
0%
20%
40%
60%
80%
100%
10 11 12 13 14 15 16 17 18
Feet of elevation NGVD

71 | P a g e
Figure 5-7. STA-1E: Cumulative elevation distribution for Cell 6. Vertical lines indicate period-of-record (WY2005-WY2008) mean stage ± 1 standard deviation.
Figure 5-8. STA-1E: Cumulative elevation distribution for Cell 7. Vertical lines indicate period-of-record (WY2005-WY2008) mean stage ± 1 standard deviation.
0%
20%
40%
60%
80%
100%
10 11 12 13 14 15 16 17 18
Feet of elevation NGVD
0%
20%
40%
60%
80%
100%
10 11 12 13 14 15 16 17 18
Feet of elevation NGVD

72 | P a g e
Table 5-4. STA-1E: Areal total phosphorus (TP) loading rates (LR; g P/m2/yr) before and after adjustment for EWA.
Cell 3 Cell 4N Cell 4S Water Year TP LRA TP LRB Difference TP LRA TP LRB Difference TP LRA TP LRB Difference
2007 1.82 1.82 0.00 1.32 1.33 0.01 0.91 0.91 0.00 2008 6.57 6.57 0.00 5.99 5.99 0.00 1.99 1.99 0.00
Cell 5 Cell 6 Cell 7
Water Year TP LRA TP LRB Difference TP LRA TP LRB Difference TP LRA TP LRB Difference 2007 8.91 8.93 0.02 3.60 3.60 0.00 4.75 4.75 0.00 2008 0.48 0.49 0.02 0.56 0.56 0.00 1.04 1.04 0.00
Figure 5-9. STA-1E: Relationship between annual total phosphorus (TP) outflow flow-weighted mean concentration (FWMC; mg/L) and areal TP loading rate (g P/m2/yr). “Low” corresponds to annual inflow TP FWMC ≤ 0.10 mg/L; “Medium,” 0.10 mg/L< TP FWMC ≤ 0.15 mg/L; and “High,” TP FWMC > 0.15mg/L. Each point represents one cell for one water year.
R² = 0.3158
0
0.05
0.1
0.15
0.2
0.25
0.3
0 2 4 6 8 10
Out
flow
TP
FWM
C (m
g/L)
Areal TP loading rate (g P/m2/yr)
Cell 3 Cell 4NCell 4S Cell 5Cell 6 Cell 7High MedLow
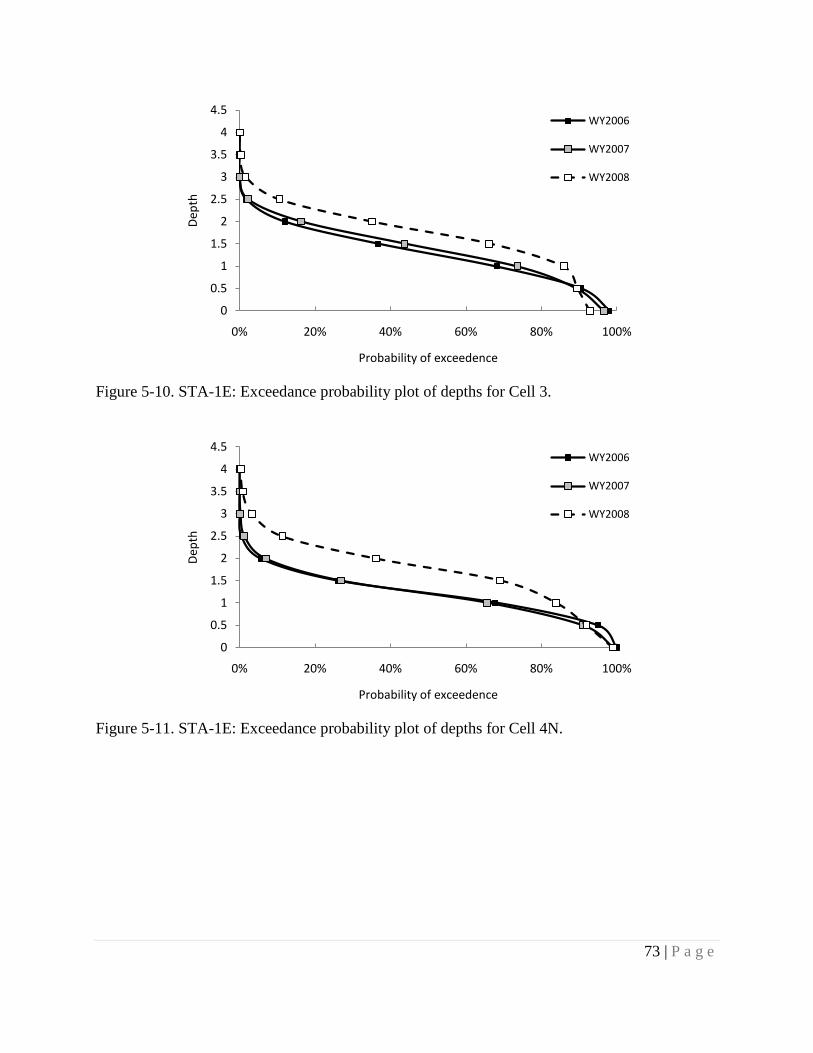
73 | P a g e
Figure 5-10. STA-1E: Exceedance probability plot of depths for Cell 3.
Figure 5-11. STA-1E: Exceedance probability plot of depths for Cell 4N.
0
0.5
1
1.5
2
2.5
3
3.5
4
4.5
0% 20% 40% 60% 80% 100%
Dep
th
Probability of exceedence
WY2006
WY2007
WY2008
0
0.5
1
1.5
2
2.5
3
3.5
4
4.5
0% 20% 40% 60% 80% 100%
Dep
th
Probability of exceedence
WY2006
WY2007
WY2008

74 | P a g e
Figure 5-12. STA-1E: Exceedence probability plot of depths for Cell 4S.
Figure 5-13. STA-1E: Exceedance probability plot of depths for Cell 5.
0
0.5
1
1.5
2
2.5
3
3.5
4
4.5
0% 20% 40% 60% 80% 100%
Dep
th
Probability of exceedence
WY2006
WY2007
WY2008
0
0.5
1
1.5
2
2.5
3
3.5
4
4.5
0% 20% 40% 60% 80% 100%
Dep
th
Probability of exceedence
WY2006
WY2007
WY2008

75 | P a g e
Figure 5-14. STA-1E: Exceedance probability plot of depths for Cell 6.
Figure 5-15. STA-1E: Exceedance probability plot of depths for Cell 7.
0
0.5
1
1.5
2
2.5
3
3.5
4
4.5
0% 20% 40% 60% 80% 100%
Dep
th
Probability of exceedence
WY2006
WY2007
WY2008
0
0.5
1
1.5
2
2.5
3
3.5
4
4.5
0% 20% 40% 60% 80% 100%
Dep
th
Probability of exceedence
WY2006
WY2007
WY2008

76 | P a g e
5.5 Hydraulic Residence Time
There was significant variation in the nominal HRT values for cells in STA-1E. The three-month average stages, flows and volumes, and estimated nominal HRT from May 2006 through April 2008 for each STA-1E treatment cell are reported in Table 14-7 in the appendix. The median HRT ranged from 12 to 130 days in treatment cells, with lowest in the Cell 4N and highest in the Cell 7. Some HRTs are even longer than the 90 days of the averaging period because of low flows during those periods. The upper bounds of the HRTs used in comparison with outflow TP FWMC and TP mass removal effectiveness are illustrated by the x-axes in Figure 5-16 and Figure 5-17.
No correlation was found between either outflow TP FWMC or TP mass removal effectiveness and three-month average nominal residence time (Figure 5-16 and Figure 5-17). Uncertainties in flow and concentration measurements, errors in estimating HRTs, and stochastic variability in other factors (such as vegetation, soil etc.) could have affected these results. In particular, some portion of the wetlands may not be involved in the flow due to the presence of stagnant zones; therefore the considerable errors could also be generated during the estimation of nominal HRTs (Guardo, 1999). Because the entire volume of water within treatment cell/flow-way may not be actively involved in the flow, the actual HRT may be smaller than the nominal HRT (Kadlec and Knight, 1996).

77 | P a g e
Figure 5-16. STA-1E: Comparison of three-month rolling average flow-weighted total phosphorus (TP) outflow concentrations (mg/L) with corresponding average nominal hydraulic residence times (HRT; days).
Figure 5-17. STA-1E: Comparison of three-month total phosphorus (TP) mass removal effectiveness (%) with corresponding average nominal hydraulic residence times (days).
0.00
0.05
0.10
0.15
0.20
0.25
0.30
0 40 80 120 160 200 240
Out
flow
TP
FWM
C (m
g/L)
HRT (days)
Cell 3
Cell 4N
Cell 4S
Cell 5
Cell 6
Cell 7
-150
-100
-50
0
50
100
0 40 80 120 160 200 240
TP m
ass
rem
oval
eff
ectiv
enes
s (%
)
HRT (days)
Cell 3
Cell 4N
Cell 4S
Cell 5
Cell 6
Cell 7

78 | P a g e
5.6 Water Column Chemical Constituents
STA-1E receives stormwater runoff from several different upstream basins. For example, the Western Flow-way receives water mainly from S-5A basin, while the Central Flow-way receives water from the C-51W basin. It is expected that the different basins, with different land uses, will have different types of runoff in terms of chemical constituents.
Cells in STA-1E differentially treated the three fractions of P within the water column, with PP most preferentially removed from the TP pool. Cell-wise data were unavailable for Cells 5, 6 and 7. However, each cell for which data were available had a different dynamic with the P forms (Figure 5-18 through Figure 5-20). In the two years of recorded operation, Cell 3 left the ratios of the P forms unaffected from inflow to outflow. This corresponds with generally poor TP removal as calculated in the P mass balance. Cell 4N, with a POR TP removal rate of about 65%, preferentially removed SRP, and enriched both DOP and PP in the water column TP pool. Finally, Cell 4S preferentially removed PP and enriched SRP and DOP with POR TP removal of about 60% by mass. The source of these differences is unclear. Data were too limited in this STA to determine a clear relationship between the inflow proportions of P species and TP mass removal effectiveness.
Annual areal calcium loading was high (1.9 – 3.2 kg Ca/m2/yr) for Cells 3, 4N, and 4S, relative to cells in other STAs, but did not influence SRP mass removal effectiveness (Figure 5-21). The POR inflow FWMC and annual average areal loading rate were lower in Cell 4S than the upstream cells (Table 5-5), possibly because Cell 4N retained a large amount of Ca in both water years (Figure 5-22).
Soluble reactive P retention and removal effectiveness are correlated with and may be dependent on Ca retention in STA-1E (Figure 5-22 and Figure 5-23), but conclusions are limited by the brief POR.
The magnitude of the net Ca flux in all STAs also deserves note; in various years, STA-1E cells lost or gained as much as 1 kg Ca/m2, based on water chemistry data, which conflicts with soil storage values of roughly 900 and 300 g Ca/m2 (top 10 cm of soil) in water years 2005 and 2007, respectively. Possibly, the Ca associated with periphyton is a significant pool not captured by soil samples or Ca was exported from STA-1E by some pathway not considered by the water budget (e.g. shells and bones of biota).

79 | P a g e
Table 5-5. STA-1E: Period-of-record (WY2007 – WY2008) flow-weighted mean concentrations (FWMC; mg/L) and average annual areal loading rates (LR; g/m2/yr) of select water column chemicals.
Ca SO4 NOx NO2 NH4
FWMC LR FWMC LR FWMC LR FWMC LR FWMC LR Cell 3 83 2772 -- -- 0.08 2.72 -- -- -- --
Cell 4N 81 3190 -- -- 0.02 0.72 -- -- -- -- Cell 4S 43 1887 -- -- -- -- -- -- -- --
Figure 5-18. STA-1E: Fraction of total phosphorus (TP) that is soluble reactive phosphorus (SRP) for outflow water and inflow water. Each point represents one cell for one water year. Points that fall below the 1:1 line indicate preferential removal of SRP from the TP pool. Cell-wise data were unavailable for Cells 5, 6, and 7.
0%
20%
40%
60%
80%
100%
0% 20% 40% 60% 80% 100%
Out
flow
SRP
Pro
port
ion
of T
P
Inflow SRP Proportion of TP
Cell 3
Cell 4N
Cell 4S
1:1 Line

80 | P a g e
Figure 5-19. STA-1E: Fraction of total phosphorus (TP) that is dissolved organic phosphorus (DOP) for outflow water and inflow water. Each point represents one cell for one water year. Points that fall below the 1:1 line indicate preferential removal of DOP from the TP pool. Cell-wise data were unavailable for Cells 5, 6, and 7.
Figure 5-20. STA-1E: Fraction of total phosphorus (TP) that is particulate phosphorus (PP) for outflow water and inflow water. Each point represents one cell for one water year. Points that fall below the 1:1 line indicate preferential removal of PP from the TP pool. Cell-wise data were unavailable for Cells 5, 6, and 7.
0%
20%
40%
60%
80%
100%
0% 20% 40% 60% 80% 100%
Out
flow
DO
P Pr
opor
tion
of T
P
Inflow DOP Proportion of TP
Cell 3
Cell 4N
Cell 4S
1:1 Line
0%
20%
40%
60%
80%
100%
0% 20% 40% 60% 80% 100%
Out
flow
PP
Prop
ortio
n of
TP
Inflow PP Proportion of TP
Cell 3
Cell 4N
Cell 4S
1:1 Line

81 | P a g e
Figure 5-21. STA-1E: Relationship between soluble reactive phosphorus (SRP) mass removal effectiveness and annual areal calcium load (g Ca/m2/yr). Each point represents one cell for one water year.
Figure 5-22. STA-1E: Relationship between annual areal soluble reactive phosphorus (SRP) retention (g SRP/m2/yr) and annual areal calcium retention (g Ca/m2/yr). Each point represents one cell for one water year.
-100%
-50%
0%
50%
100%
0 1000 2000 3000 4000 5000 6000
SRP
mas
s re
mov
al e
ffic
ienc
y
Ca Load In (g/m2/yr)
Cell 3
Cell 4N
Cell 4S
-0.5
0
0.5
1
1.5
2
-1500 -1000 -500 0 500 1000 1500
Ann
ual a
real
SRP
ret
entio
n (g
SRP
/m2/
yr)
Annual areal Ca retention (g Ca/m2/yr)
Cell 3
Cell 4N
Cell 4S

82 | P a g e
Figure 5-23. STA-1E: Relationship between annual soluble reactive phosphorus (SRP) mass removal effectiveness and annual areal calcium retention (g Ca/m2/yr). Each point represents one cell for one water year.
-100%
-50%
0%
50%
100%
-1500 -1000 -500 0 500 1000 1500
Ann
ual S
RP r
emov
al e
ffec
tiven
ess
Annual areal Ca retention (g Ca/m2/yr)
Cell 3
Cell 4N
Cell 4S

83 | P a g e
5.7 Soil Nutrients
5.7.1 Floc and soil physico-chemical properties
STA-1E became operational in WY2005 and there had been two sampling events (WY2005 and WY2007) since then. Only a single floc sample was reported in this STA (Cell 4S, WY2007), while soil sample data were available for Cells 3, 5 and 7 (EAV) and Cells 4S, 4N and 6 (SAV) in both WY2005 and WY2007. Cell 3 was sampled during WY2008 but was included in the WY2007 data as it was part of a continuous sampling event that spanned WY2007 and WY2008. The single floc sample from WY2007 was not included in this analysis. For this study, the absence of floc data was not assumed to indicate absence of floc in the field. The absence of floc values may be due to either dry conditions and consolidation of floc into the surface soil, or mixing of the floc layer with the soil layer during sampling. As discussed above, STA-1E was entirely inundated throughout POR, and it is unlikely that the floc was incorporated into the soil via dry down. Consistently high bulk density values support the hypothesis that floc was not incorporated in the top 10 cm of soil (except possibly in Cell 5). The absence of floc data therefore may have resulted from loss of data during sampling. For this analysis inadequate data on floc may have resulted in an inaccurate estimation of accreted P in STA-1E. Floc is an active sink for P and may potentially serve as key indicator of system performance; therefore its measurement is important for calculating an accurate mass balance of soil nutrients.
The total number of soil samples collected from STA-1E are shown in Table 5-6. The reported floc depth of the single sample in WY2007 was 9 cm but this was not included in any analysis. All soil samples were collected from 0-10 cm depth. The average bulk densities of the soils from Cells 3-7 of STA-1E is shown in Table 5-7. The average bulk density of the soil samples for WY2007 was 1.01 ± 0.37 (g/cm3 ± SD) which was similar to the WY2005 value (1.07 ± 0.43; g/cm3 ± SD). These values are representative of mineral soils (0-10 cm) and appear not to contain the lower density flocculent matter except in Cell 5, where a decrease in bulk density was recorded.
5.7.2 Phosphorus inventory
The average TP concentration (mg P/kg) in soils decreased (non-significantly) from WY2005 to WY2007 (Table 5-8). All cells registered a decrease in soil TP concentration except Cell 5. This cell recorded a decrease in bulk density between the two sampling events that may suggest that lower density floc material with higher TP concentration was incorporated into the top 10 cm of soil, resulting in elevated TP concentrations in the surface soil of Cell 5. In all other cells, bulk density values were more or less consistent, suggesting that the floc layer did not mix in soil fraction. Figure 5-24 shows soil TP concentrations in all cells as a function of age of the STA. Soil TP concentrations in Cells 5 and 7 (both EAV) were higher than the average TP concentration in STA-1E in both sampling events. Conversely, soil TP concentrations in Cell 3 (EAV), Cells 4N and 4S (SAV) were lower than the STA-1E mean value. This may be due to higher TP concentrations in inflow water in EAV cells than SAV cells; however, since no relationship was observed between TP retention and P loading (mass as well as concentration) within cells, it is difficult to conclude that observed results were due to water column P chemistry. Changes in soil TP concentration for all cells are plotted in Figure 5-25. Cell 5 (EAV) alone registered an increase in soil TP concentration.

84 | P a g e
Total soil P storage (SPS) in each cell was calculated per unit area for the top 10 cm of soil and expressed in g P/m2 Where the soil core was shallower or deeper than 10 cm, the SPS values were normalized to 10 cm. Soil P storage decreased from WY2005 to WY2007 in all cells except Cell 5 (Table 5-9). In general, the average SPS was higher in EAV cells than in SAV cells (Figure 5-26). Disturbance by hurricanes Frances and Jeanne (WY2005) and hurricane Wilma (WY2006) may have caused the observed decrease in SPS. It is unclear why Cell 5 did not also decrease in SPS.
The P mass balance was calculated from WY2007 water column TP data (Table 5-3) and WY2007 SPS. That the soil integrated operating conditions over a longer period than water column data were available for, was a limitation of this exercise. Additionally, in the case of STA-1E, floc data were not available, so the mass balance necessarily excluded the floc component. We calculated the change in the SPS from the background level (the earliest available sampling data for STA-1E, WY2005). Any change in SPS in the top 10 cm that was not accounted for by water column P retention, was assumed to have fluxed from the underlying subsurface soil (below 10 cm). Conversely, a net negative change from the background SPS was assumed to indicate that P migrated from surface soil deeper into the soil profile. Figure 5-27 depicts the P mass balance in select compartments of each cell in STA-1E. During WY2007 all cells reported a net positive retention of P from the water column except Cell 7. The arrows in this figure indicate the flux of P between the compartments. The change in SPS observed in 0-10 cm soil was negative in all cells except for the Cell 5. The fate of P lost from surface soil could not be accurately calculated due to absence of floc data. For Cell 5, since SPS in surface soil increased, it is expected that P migrated either from the subsurface soil or from the floc into the surface soil. It is difficult to hypothesize about P transfers without floc data; however the loss of SPS from surface soils in most cells may suggest that some proportion of P was taken up by vegetation and/or moved into subsurface soil. Effect of vegetation on soil phosphorus storage
Changes in soil P storage over time were explored for EAV and SAV cells to characterize which vegetative community accreted P more quickly (Table 5-10). The soil P accretion rate (PAR; g P/m2 /yr) was calculated from the difference in SPS from WY2005 to WY2007. The area-weighted mean for the top 10 cm of soil for EAV and SAV cells showed that neither community type accreted P over the sampling duration. Negative accretion values for EAV (-1.13 g P/m2/yr) and SAV cells (-1.78 g P/m2/yr) were not significantly different from each other. Cells with SAV generally stored less soil P as compared to EAV cells ( Table 5-9) possibly because SAV cells function as polishing cells, that is, water typically passes through SAV cells after being treated in EAV cells. Data were not adequate to conclude on the effects of EAV and SAV communities on SPS.
5.7.3 Nitrogen inventory
The change in nitrogen over the period of operation of STA-1E was analyzed by calculating the soil nitrogen storage (SNS) in the top 10 cm soil. The concentration of nitrogen (g N/kg) is shown in Table 5-11. The storages of nitrogen per unit area the top 10 cm of soil are presented in

85 | P a g e
Table 5-12. The large standard deviations of SNS in each cell suggest that the differences are not significant. Nitrogen and P storages in 0-10 cm soil were not correlated with one another (Figure 5-28). This suggests that a sizeable proportion of P was present in inorganic form.
Nitrogen and P storages in WY2007 for each cell are presented in Figure 5-29. The mean value of N:P ratios for soils was 31:1. The N:P ratios varied from 13:1 for cell 5 to 52:1 for cell 7 (both EAV). N:P ratios for SAV cells ranged from 41:1 to 46:1. Cell 5, with the lowest N:P ratio in WY2007, was the only cell that registered an increase in SPS from the background level (WY2005). The N:P ratio for Cell 5 in WY2005 was 9:1 while the STA mean value was 26:1. This low N:P ratio suggests N rather than P limitation in this cell. High N:P ratios, found for Cells, 4N, 4S, 6 and 7 suggest P limitation. Nitrogen limitation could negatively affect the ability of soils to process and sequester P and this analysis indicated that the ability of soils to process P is not impaired.
5.7.4 Carbon inventory
The change in organic matter was estimated over the period of operation of the STA by calculating the C storage in soil. The concentration of C (g C/kg) is presented in Table 5-13 and SCS in the top 10 cm of soil is shown in Table 5-14. Storage of C followed a similar trend as soil P and soil N in all cells across the sampling period. Average SCS was lower in WY2007, but was not significantly different from WY2005. The values of SCS registered a decrease in all cells except Cell 5. The relationship between P and C storage is shown in Figure 5-30. Soil P storage and SCS data from WY2005 and WY2007 showed no correlation. However, soil C and N storage were found to be strongly correlated as shown in Figure 5-31. This suggested that almost all of the soil nitrogen is either bound in organic forms or are closely associated with the organic matter present in the soil. The source of this closely linked C and N in the top soils could possibly be the detrital matter arising from the wetland vegetation. The mean value of C:P for STA-1E in WY2007 was 451:1 (Figure 5-32). The range of C:P ratios varied from 182:1 for Cell 5 to 767:1 for Cell 7 (both EAV).
Carbon and N storages in WY2007 for each cell are presented in Figure 5-33. The C:N ratios in soils were in the range of 12:1 to 16:1. These ratios are typical for microbial/plankton biomass and for soil organic matter and suggest that STA-1E soils are not N limited.
The existing C and N pools in soils are of crucial importance for maintaining various biogeochemical processes in wetlands. The sum total of these processes determine microbial decomposition rates and control soil formation and long term accretion of nutrients. An adequate balance of these elements plays important role in sequestering P and is critical for ensuring long term sustainability of STAs. This above analysis provided insights into the existing conditions of the STA soils.

86 | P a g e
Table 5-6. STA-1E: Number of floc and soil samples. Floc Soil 2007 2005 2007
EAV Cell-3 -- 12 24 Cell-5 -- 9 7 Cell-7 -- 8 8 SAV
Cell-4N -- 16 16 Cell-4S 1 20 20 Cell-6 -- 29 28 All cells 1 94 103
Table 5-7. STA-1E: Soil bulk density (g/cm3; mean ± SD). Floc not included.* Area (ha) 2005 2007
EAV Cell-3 238 1.39 ± 0.19 1.28 ± 0.2 Cell-5 231 1.16 ± 0.3 0.89 ± 0.3 Cell-7 169 0.54 ± 0.3 0.56 ± 0.33
SAV Cell-4N 261 1.38 ± 0.15 1.13 ± 0.22 Cell-4S 304 1.22 ± 0.34 1.11 ± 0.19 Cell-6 424 0.78 ± 0.42 0.79 ± 0.41 All cells 1628 1.07 ± 0.43 1.01 ± 0.37
* Only one floc sample was recorded in POR and is not included in this table.
Table 5-8. STA-1E: Phosphorus concentration in soils (mg P/kg soil; mean ± SD). Floc not included.*
2005 2007 EAV
Cell-3 108 ± 70 65 ± 81 Cell-5 241 ± 223 409 ± 376 Cell-7 405 ± 213 320 ± 190
SAV Cell-4N 79 ± 60 42 ± 34 Cell-4S 80 ± 65 54 ± 39 Cell-6 221 ± 194 161 ± 144 All cells 177 ± 136 160 ± 135
* Only one floc sample was recorded in POR and is not included in this table.

87 | P a g e
Table 5-9. STA-1E: Soil phosphorus storage (SPS; g P/m2; mean ± SD) in soil (0-10 cm). Floc not included.*
2005 2007 EAV
Cell-3 14.65 ± 10.12 7.09 ± 5.64 Cell-5 22.82 ± 15.27 27.24 ± 17.73 Cell-7 16.23 ± 4.14 12.35 ± 5.14
SAV Cell-4N 10.49 ± 7.54 4.55 ± 3.24 Cell-4S 7.94 ± 5.48 5.49 ± 3.3 Cell-6 11.17 ± 5.92 8.29 ± 4.4 All cells 13.15 ± 7.8 10.1 ± 6.15
* Only one floc sample was recorded in POR and is not included in this table.
Table 5-10. STA-1E: Phosphorus accretion rate (PAR; g P/m2/yr) in the soils. Comparison between EAV and SAV cells. Floc not included.*
2005 SPS
2007 SPS
PAR g P/m2 yr
EAV -1.13 Cell-3 14.65 ± 10.12 7.09 ± 5.64 -3.78 Cell-5 22.82 ± 15.27 27.24 ± 17.73 2.21 Cell-7 16.23 ± 4.14 12.35 ± 5.14 -1.94
SAV -1.78 Cell-4N 10.49 ± 7.54 4.55 ± 3.24 -2.97 Cell-4S 7.94 ± 5.48 5.49 ± 3.3 -1.23 Cell-6 11.17 ± 5.92 8.29 ± 4.4 -1.44
* Only one floc sample was recorded in POR and is not included in this table.
Table 5-11. STA-1E: Nitrogen concentration in soil (g N/kg soil; mean ± SD). Floc not included.*
2005 2007 EAV
Cell-3 1 ± 0.6 1.2 ± 1.5 Cell-5 2.2 ± 2 6.2 ± 7.6 Cell-7 15.6 ± 6.4 16.4 ± 9.3
SAV Cell-4N 1.2 ± 0.8 1.8 ± 1.3
Cell-4S 4 ± 5.9 2.6 ± 2 Cell-6 11.1 ± 11.2 8.1 ± 7.8 All cells 5.9 ± 5.1 5.6 ± 4.8
* Only one floc sample was recorded in POR and is not included in this table.

88 | P a g e
Table 5-12. STA-1E: Soil nitrogen storage (SNS; g N/m2; mean ± SD) in soil (0-10 cm). Floc not included.*
2005 2007 EAV
Cell-3 138 ± 68 133 ± 89 Cell-5 204 ± 149 340 ± 76 Cell-7 798 ± 513 640 ± 177
SAV Cell-4N 154 ± 89 186 ± 122 Cell-4S 350 ± 377 252 ± 142 Cell-6 473 ± 295 389 ± 202 All cells 345 ± 246 312 ± 141
* Only one floc sample was recorded in POR and is not included in this table.
Table 5-13. STA-1E: Carbon concentration in soil (g C/kg soil; mean ± SD). Floc not included.* 2005 2007
EAV Cell-3 14 ± 7 16 ± 20 Cell-5 35 ± 29 89 ± 106 Cell-7 231 ± 97 241 ± 136
SAV Cell-4N 18 ± 14 25 ± 23
Cell-4S 60 ± 89 40 ± 29 Cell-6 162 ± 159 118 ± 116 All cells 87 ± 76 82 ± 71
* Only one floc sample was recorded in POR and is not included in this table.
Table 5-14. STA-1E: Soil carbon storage (SCS; g C/m2; mean ± SD) in soil (0-10 cm). Floc not included.*
* Only one floc sample was recorded in POR and is not included in this table.
2005 2007 EAV Cell-3 1862 ± 767 1643 ± 1320
Cell-5 3314 ± 2028 4953 ± 1064 Cell-7 11926 ± 8181 9473 ± 2877
SAV Cell-4N 2424 ± 1698 2512 ± 2010 Cell-4S 5107 ± 5361 3996 ± 2041 Cell-6 7090 ± 3941 5666 ± 3000 All cells 5172 ± 3551 4553 ± 2128

89 | P a g e
Figure 5-24. STA-1E: Variation in soil TP concentration (mg P/kg soil) across the cells as a function of age.
Figure 5-25. STA-1E: Soil phosphorus concentration (mg P/kg soil) in EAV (Cell 3, 5 and 7) and SAV (Cell 4N, 4S and 6). Error bars represent standard error of the mean.
0
50
100
150
200
250
300
350
400
450
500
0 1 2 3 4
TP m
g P/
kg
Age (yr)
Cell-3
Cell-4N
Cell-4S
Cell-5
Cell-6
Cell-7
0
100
200
300
400
500
600
Cell-3 Cell-5 Cell-7 Cell-4N Cell-4S Cell-6
TP (m
g P/
kg)
Soil (0-10 cm) 2005 2007

90 | P a g e
Figure 5-26. STA-1E: Soil phosphorus storage (g P/m2) in EAV (Cell 3, 5 and 7) and SAV (Cell 4N, 4S and 6). Error bars represent the standard error of the mean.
0
5
10
15
20
25
30
35
Cell-3 Cell-5 Cell-7 Cell-4N Cell-4S Cell-6
SPS
(gP/
m2 )
Soil (0-10 cm) 2005 2007

91 | P a g e
Figure 5-27. STA-1E: Phosphorus mass balance: soil P storage vis-à-vis net P retained from water quality data. All values are in g P/m2. Arrows indicate flux of P from different compartments. Top row (blue arrows) indicate P movement between water and floc. Phosphorus loading data for the period of record for each specific cell was not available, however STA mean P loading for the total period of operation is shown. Middle row (orange and yellow arrows) show P movement between floc and surface soil (0-10 cm). Bottom row arrows indicate P movement between surface (0-10 cm) and sub-surface soil (10-30 cm).

92 | P a g e
Figure 5-28. STA-1E: Relationship between soil nitrogen storage (SNS; g N/m2) and soil phosphorus storage (SPS; g P/m2) in top 10 cm soil for all sampling points from WY2005 and WY2007.
Figure 5-29. STA-1E: Ratio of soil nitrogen storage (SNS; g N/m2) to soil phosphorus storage (g P/m2) in top 10 cm (WY2007 data only). Filled triangles indicate EAV cells where as open triangles depicts SAV cells. Filled square indiates N:P ratio for the whole STA.
0
200
400
600
800
1000
1200
1400
1600
1800
2000
0 10 20 30 40 50 60
SNS
(g N
/m2 )
SPS (g P/m2)
2005 2007
STA1E
Cell-3
Cell-5
Cell-7
Cell-4N
Cell-4S
Cell-6
0
100
200
300
400
500
600
700
0 5 10 15 20 25 30
SN S
(g N
/ m
2 )
SPS (g P/m2)

93 | P a g e
Figure 5-30. STA-1E: Relationship between soil phosphorus storage (SPS; g P/m2) and soil carbon storage (SCS; g C/m2) for all sampling points from WY2005 and WY2007.
Figure 5-31. STA-1E: Relationship between soil nitrogen storage (SNS; g N/m2) and soil carbon storage (SCS; g C/m2) for all sampling points from WY2005 and WY2007.
0
5000
10000
15000
20000
25000
30000
35000
0 10 20 30 40 50 60 70
SCS
(g C
/m2 )
SPS (g P/m2)
Soil (0-10 cm)2005 2007
0
5000
10000
15000
20000
25000
30000
35000
0 500 1000 1500 2000 2500
SCS
(g C
/m2 )
SNS(g N/m2)
Soil (0-10 cm)
2005 2007

94 | P a g e
Figure 5-32. STA-1E: Ratio of soil carbon storage (SCS; g C/m2) to soil phosphorus storage (SPS; g P/m2) in top 10 cm (WY2007 data only). Filled triangles indicate EAV cells and open triangles depicts SAV cells. Filled square indiates C:P ratio for the whole STA.
Figure 5-33. STA-1E: Ratio of soil carbon storage (SCS; g C/m2)to soil nitrogen storage (SNS; g N/m2) in top 10 cm (WY2007 data only). Filled triangles indicate EAV cells where as open triangles depicts SAV cells and filled square indiates C:N ratio for the whole STA.
STA1E
Cell-3
Cell-5
Cell-7
Cell-4N
Cell-4S
Cell-6
0
1000
2000
3000
4000
5000
6000
7000
8000
9000
10000
0 5 10 15 20 25 30
SCS
(g C
/ m
2 )
SPS (g P/m2)
STA1E
Cell-3
Cell-5
Cell-7
Cell-4N
Cell-4S
Cell-6
0
1000
2000
3000
4000
5000
6000
7000
8000
9000
10000
0 100 200 300 400 500 600 700
SCS
(g C
/ m
2 )
SNS (g N/m2)

95 | P a g e
5.8 Conclusions
For the POR analyzed for this report, STA-1E was moderately loaded with water and TP relative to other STAs. Total P mass removal effectiveness, as calculated from the TP mass balance varied significantly from year to year and cell to cell in this STA.
The topography and stage interacted to produce approximately 100% wetted area*time in all cells over the three years of available data (WY2006-WY2008; POR annual minimum was 92% in Cell 5 in WY2008). Cells in STA-1E received an unweighted average 3.6 g P/m2 in WY2007 and 2.8 g P/m2 in WY2008, after adjustment for EWA. Annual average outflow TP flow-weighted mean concentration (FWMC) was weakly correlated (r2=0.32) with annual average areal TP loading rate.
Annual depth distribution was not a predictor of annual TP removal performance.
Three month average outflow TP FWMC was weakly correlated with HRT, when outliers at high HRTs were excluded. However, our results indicated no correlation between HRT and three-month average TP mass removal effectiveness in STA-1E.
Each cell in STA-1E treated different P forms in the water column (SRP, DOP and PP), differently. Generally, cells in STA-1E enriched DOP in the TP pool, preferentially remove PP from the TP pool and no clear trend was present for SRP.
Calcium data were only available for Cells 3, 4N and 4S. The POR Ca FWMC into Cell 4S was approximately half of the FWMC into the upstream cells (Cells 3 and 4N). Other data suggests that Cell 4N is consuming significant Ca in conjunction with SRP.
The soils of STA-1E had higher bulk density values than other STAs suggesting a high mineral content, relative to organic matter. Average bulk density of the soil did not change much, therefore incorporation of low density detrital matter in the surface soils did not appear to have taken place (except for cell 5).
In STA-1E, in all cells except Cell 5, SPS decreased from WY2005 to WY2007. This loss from the surface soil could have been incorporated in the vegetation and redistributed in the floc fraction or buried below the top 10 cm. However, absence of floc data did not allow estimation of these fluxes.
The relationship between soil N and P storages and soil P and C storages suggested that significant proportion of P is stored in inorganic forms. High N:P ratios from all cells except Cell 3 and 5 (EAV) suggest that soils were P limited.

96 | P a g e
6 STORMWATER TREATMENT AREA 1 WEST (STA-1W)
6.1 Introduction
STA-1W totals 2700 ha (6670 ac). It is divided into three flow-ways, Eastern (Cells 1A, 1B and 3), Western (Cells 2A, 2B and 4) and Northern (Cells 5A and 5B; Figure 6-1). The Eastern and Western Flow-ways initially received water in WY1994, when they comprised the Everglades Nutrient Removal Project. In WY2000, the Northern Flow-way was added and the site became STA-1W. Most of the cells in STA-1W have undergone various rehabilitation and Long-Term Plan enhancements construction throughout the operating history. Notably, in WY2006, the Northern Flow-way was rehabilitated, and in WY2007 extensive rehabilitation work, including tilling and demucking, was performed in the Eastern and Western Flow-ways (Table 6-1). As of 2008, Cells 1A, 2A and 5A were designated as emergent marshes (referred to as emergent aquatic vegetation (EAV)), and were managed as such. The remaining cells (Cells 1B, 2B, 3, 4 and 5B) were designated SAV cells.
The POR for analyses of water quality included only data collected from WY2001 through WY2008, unless otherwise noted. Soils data extend through the full operational period. Because the internal berms separating Cell 1A from 1B and 2A from 2B were constructed recently (WY2007 and WY2005, respectively), these sections are generally considered simply as Cell 1 and Cell 2 throughout this study.
The HLR for cells in STA-1W was not consistent over time, due to hurricanes, droughts and internal construction activities. The average annual HLRs were 30, 16, 36, 42, and 12 m/yr for Cells 1, 2, 3, 4, and 5, respectively. The associated average TP loading rates were 4.5, 2.9, 3.5, 7.0, 1.79 g P/m2/yr, after adjustment for EWA. Period-of-record average HRTs differed from cell to cell: Cell 1, 11 d; Cell 2, 15 d; Cell 3, 7 d; Cell 4, 4 d; Cell 5, 20 d. Cells 3 and 4 have two of the three lowest HRTs of all cells in all STAs.

97 | P a g e
Figure 6-1. STA-1W: Schematic showing plan view of cells and water control structures. (Source: Pietro et al., 2008)

98 | P a g e
6.2 Operational Timeline
Table 6-1. STA-1W: Abbreviated operational timeline.
2004 2005 WY2004 WY2005 WY2006
Jan Feb Mar Apr May Jun Jul Aug Sep Oct Nov Dec Jan Feb Mar Apr May Jun Jul Aug Sep Oct Nov Dec
Hurricanes Frances
and Jeanne Hurricane
Wilma
Northern and Eastern Flow-ways operational
All Flow-ways operational (Cell5 restricted capacity (150 cfs) Nov and Dec because of hurricane
damage.
Northern and Eastern Flow-ways operational
Eastern Flow-way operational
Northern and Eastern Flow-ways Operational (Cell 5
restricted flow in Nov and Dec because of hurricane damage)
Western Flow-way offline to remove cattail tussocks in Cell
2 and plant rehab in Cell 4
Western Flow-way offline (Cell 2 divide levee and water control
structures). Northern Flow-way offline (starting in Feb) to degrade the limerock berm and allow for hurricane repairs and plant re-
establishment
Western Flow-way re-hydrated, off-line for plant re-
establishment

99 | P a g e
*Adapted from Pietro et al., 2008.
2006 2007 2008 WY2006 WY2007 WY2008
Jan Feb Mar Apr May Jun Jul Aug Sep Oct Nov Dec Jan Feb Mar Apr May Jun Jul Aug Sep Oct Nov Dec Jan Feb Mar Apr
Eastern Flow-way Operational Northern Flow-way Operational
Northern Flow-way operational (Restricted capacity in May and Jun for SAV re-establishment). Target stages
in SAV cells increased 15 cm in Sept
Northern Flow-way and Western Flow-way offline (Cells 2/4 plant re-
establishment, Cell 5 LTP enhancements construction and sediment and plant
rehab.
Eastern and Western Flow-ways offline for partial water year to allow plant
re-establishment
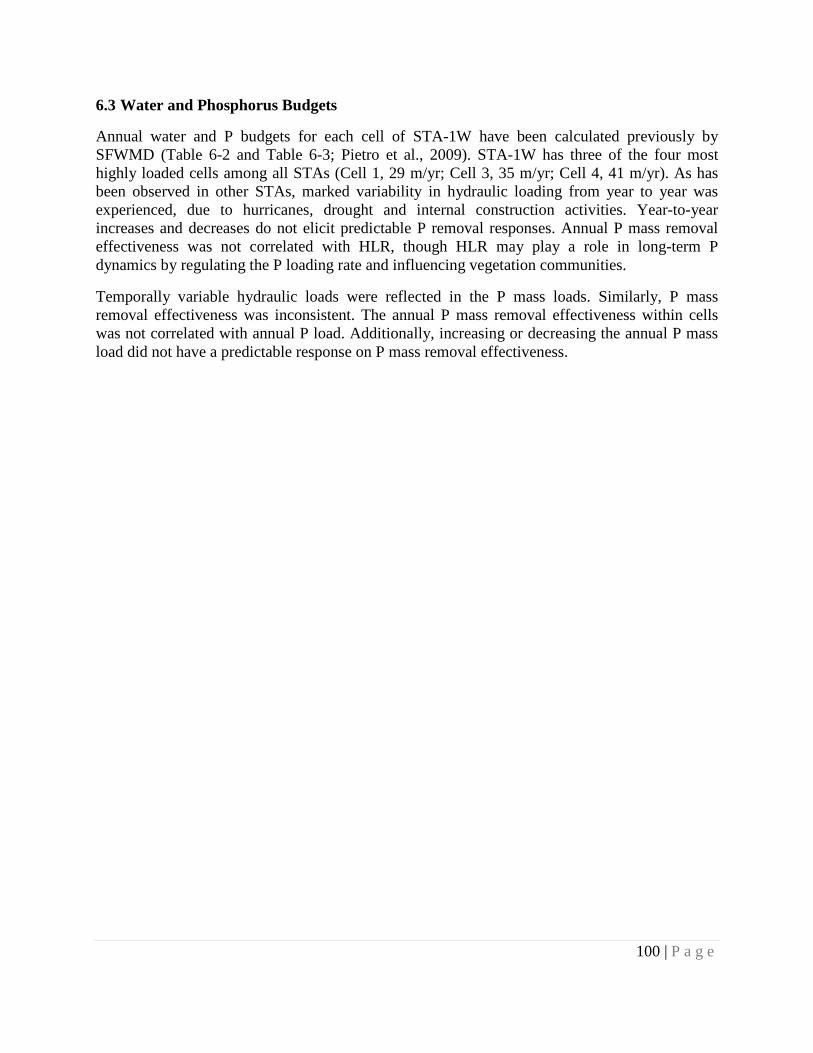
100 | P a g e
6.3 Water and Phosphorus Budgets
Annual water and P budgets for each cell of STA-1W have been calculated previously by SFWMD (Table 6-2 and Table 6-3; Pietro et al., 2009). STA-1W has three of the four most highly loaded cells among all STAs (Cell 1, 29 m/yr; Cell 3, 35 m/yr; Cell 4, 41 m/yr). As has been observed in other STAs, marked variability in hydraulic loading from year to year was experienced, due to hurricanes, drought and internal construction activities. Year-to-year increases and decreases do not elicit predictable P removal responses. Annual P mass removal effectiveness was not correlated with HLR, though HLR may play a role in long-term P dynamics by regulating the P loading rate and influencing vegetation communities.
Temporally variable hydraulic loads were reflected in the P mass loads. Similarly, P mass removal effectiveness was inconsistent. The annual P mass removal effectiveness within cells was not correlated with annual P load. Additionally, increasing or decreasing the annual P mass load did not have a predictable response on P mass removal effectiveness.

101 | P a g e
Table 6-2. STA-1W: Annual water budgets (hm3) for Central and Western Flow-ways. Pietro et al., 2009. Is Ig Ip Σinflow HLR Os Og ET Σoutflow ΔS r ε
hm3/yr hm3/yr hm3/yr hm3/yr m/yr hm3/yr hm3/yr hm3/yr hm3/yr hm3/yr hm3/yr Cell 1 WY2001 125.5 1.9 5.2 132.6 22 94.8 7.7 8.3 110.8 -1.9 -23.7 -19.50% WY2002 157 3.1 7.8 167.8 28 154 6.5 7.8 168.2 0.8 1.2 0.70% WY2003 298.7 3.1 6.2 308 51 316.6 5.9 7.5 330 2.9 24.9 7.80% WY2004 193.7 3 5 201.7 33 193.7 4.6 7.5 205.9 -1.1 3 1.50% WY2005 205.1 2.3 6.4 213.8 35 272.8 2.6 7.8 283.1 -0.1 69.3 27.90% WY2006 139.3 2.1 6.7 148.1 25 136.5 0.4 7.9 144.8 0.9 -2.4 -1.60% WY2007 121.3 0 5.8 127.1 30 100.6 0 7.9 108.5 -3.1 -21.7 -18.40% WY2008 45.4 0 7.2 52.6 10 34.6 0 7.9 42.5 3.2 -6.8 -14.30% POR 1285.9 15.4 50.3 1351.7 236 1303.6 27.7 62.7 1393.9 1.6 43.8 3.20% %In 95.10% 1.10% 3.70% %Out 93.50% 2.00% 4.50% 0.10% Cell 2 WY2001 38.5 0 3.7 42.2 11 47.4 0 5.9 53.3 0 11.1 23.30% WY2002 66.3 0 5.5 71.8 19 61.7 0 5.5 67.2 0 -4.6 -6.60% WY2003 146.7 0 4.4 151.1 40 152.1 0 5.4 157.5 0 6.3 4.10% WY2004 75 0 3.6 78.6 21 136.2 0 5.4 141.6 -1.7 61.3 55.70% WY2005 97.6 0 4.1 101.7 27 48.1 0 4.9 53 -0.9 -49.5 -64.00% WY2006 -- 0 4.2 4.2 1 7 0 5 12 0.6 8.3 102.50% WY2007 -- 0 3.7 3.7 1 -- 0 5 5 -0.6 0.8 17.70% WY2008 30.8 0 4.5 35.3 9 -- 0 5 5 1.6 -28.7 -142% POR 454.9 0 33.8 488.7 129 452.5 0 42.1 494.6 -0.9 5.1 1.00% %In 93.10% 0.00% 6.90% %Out 91.50% 0.00% 8.50% -0.20% Cell 3 WY2001 80.9 2.2 3.6 86.6 21 79.9 7.4 5.7 93 -0.5 5.9 6.60% WY2002 133.3 3.4 5.4 142.2 34 127.5 6.2 5.4 139.1 0.5 -2.6 -1.80% WY2003 250.8 3.4 4.3 258.6 62 205.2 5.6 5.2 216 0.9 -41.6 -17.50% WY2004 154.3 3.3 3.5 161.1 39 131.8 4.4 5.2 141.5 -1.1 -20.7 -13.70% WY2005 187.5 2.5 4.4 194.4 47 161.3 2.3 5.3 168.9 0.2 -25.3 -13.90% WY2006 131.8 2.3 4.6 138.7 33 113.5 0.3 5.5 119.3 0.3 -19.1 -14.80% WY2007 98.3 0 4 102.3 44 101.2 0 5.5 106.7 -1.7 2.7 2.50% WY2008 2.6 0 4.9 7.5 2 14.6 0 5.5 20.1 1.9 14.4 104.40% POR 1039.5 17 34.8 1091.3 284 935 26.2 43.4 1004.6 0.5 -86.3 -8.20% %In 95.30% 1.60% 3.20% %Out 93.10% 2.60% 4.30% <0.1%

102 | P a g e
Is Ig Ip Σinflow HLR Os Og ET Σoutflow ΔS r ε
hm3/yr hm3/yr hm3/yr hm3/yr m/yr hm3/yr hm3/yr hm3/yr hm3/yr hm3/yr hm3/yr Cell 4 WY2001 47.4 0 1.3 48.7 34 38.8 0 2.1 40.9 0 -7.8 -17.50% WY2002 61.7 0 2 63.7 44 80.7 0 2 82.7 0 19 26.00% WY2003 152.1 0 1.6 153.7 107 194.4 0 1.9 196.3 0 42.6 24.40% WY2004 136.2 0 1.3 137.5 95 126.1 0 1.9 128 -0.6 -10.1 -7.60% WY2005 48.1 0 1.5 49.6 40 82.4 0 1.9 84.3 -0.3 34.3 51.20% WY2006 7 0 1.6 8.6 6 0.6 0 1.9 2.5 0.3 -5.8 -104% WY2007 -- 0 1.4 1.4 1 8.3 0 1.9 10.2 -0.3 8.5 147.10% WY2008 -- 0 1.7 1.7 1 29.9 0 1.9 31.8 0.6 30.7 183.30% POR 452.5 0 12.4 464.9 340 561.2 0 15.4 576.6 -0.3 111.4 21.40% %In 97.30% 0.00% 2.70% %Out 0 97.30% 0.00% 2.70% -0.10% Cell 5 WY2001 -14.9 0 10.9 -4 0 17.7 0 17.5 35.2 -10.9 28.2 180.80% WY2002 45 0 16.4 61.4 5 197.9 0 16.5 214.4 3.8 156.7 113.70% WY2003 435.9 0 13.2 449.1 39 427.5 0 15.9 443.4 -2 -7.7 -1.70% WY2004 140.6 0 10.6 151.2 13 130 0 14.9 144.9 -3.6 -9.9 -6.70% WY2005 233.7 0 12.3 246 21 232.4 0 14.9 247.3 -3.6 -2.3 -0.90% WY2006 44.2 0 12.9 57.1 6 51.8 0 15.2 67 -3.6 6.3 10.20% WY2007 1.9 0 11.2 13.1 1 35.5 0 15.2 50.7 -3.6 34 106.70% WY2008 50.9 0 13.7 64.6 6 118.7 0 15.2 133.9 -3.6 65.7 66.20% POR 937.3 0 101.2 1038.5 93 1211.5 0 125.2 1336.7 -27 271.1 22.80% %In 90.30% 0.00% 9.70% %Out %Out 90.60% 0.00% 9.40% -2.60% Is = surface water inflow; Ig = groundwater inflow; IP = precipitation; Os = surface water outflow; Og = groundwater outflow; ET = evapotranspiration; ∆S = change in storage volume; r = water budget residual; ε = water budget error

103 | P a g e
Table 6-3. STA-1W: Annual total phosphorus mass balance (mt) for Central and Western Flow-ways. Pietro et al., 2009.
Isp Ipp ∑Inflow Osp Ogp ∑Outflow Retained % Ret Cell 1 WY2001 13.425 0.021 13.445 6.247 0.648 6.895 6.55 48.70% WY2002 16.34 0.031 16.371 9.467 0.517 9.983 6.387 39.00% WY2003 45.207 0.025 45.232 31.97 0.725 32.695 12.537 27.70% WY2004 23.391 0.02 23.411 22.425 0.549 22.974 0.438 1.90% WY2005 43.326 0.026 43.351 64.154 0.576 64.73 -21.379 -49.30% WY2006 27.867 0.027 27.894 26.613 0.083 26.695 1.198 4.30% WY2007 27.707 0.023 27.731 20.157 0 20.157 7.574 27.30% WY2008 6.374 0.029 6.402 4.293 0 4.293 2.11 33.00% TOTAL 203.636 0.201 203.837 185.323 3.098 188.422 15.416 7.60% %In 99.90% 0.10% %Out 98.36% 1.64% Cell 2 WY2001 4.3 0.015 4.315 3.678 0 3.678 0.637 14.80% WY2002 6.3 0.022 6.323 3.599 0 3.599 2.723 43.10% WY2003 23.266 0.018 23.284 20.733 0 20.733 2.551 11.00% WY2004 10.606 0.014 10.62 18.868 0 18.868 -8.247 -77.70% WY2005 30.353 0.016 30.369 14.222 0 14.222 16.147 53.20% WY2006 0 0.017 0.017 0.922 0 0.922 -0.905 -- WY2007 0 0.015 0.015 0 0 0 0.015 100.00% WY2008 4.075 0.018 4.093 0 0 0 4.093 100.00% TOTAL 78.901 0.135 79.036 62.022 0 62.022 17.014 21.50% %In 99.83% 0.17% %Out 100.00% 0.00% Cell 3 WY2001 2.288 0.014 2.302 2.133 0.203 2.336 -0.034 -1.50% WY2002 3.819 0.022 3.841 3.338 0.169 3.507 0.334 8.70% WY2003 12.48 0.017 12.498 8.405 0.253 8.657 3.84 30.70% WY2004 13.324 0.014 13.338 6.462 0.289 6.751 6.587 49.40% WY2005 33.056 0.018 33.073 18.516 0.324 18.84 14.233 43.00% WY2006 26.34 0.018 26.359 14.53 0.048 14.578 11.781 44.70% WY2007 20.552 0.016 20.568 16.766 0 16.766 3.802 18.50% WY2008 0.134 0.02 0.154 1.713 0 1.713 -1.559 -- TOTAL 111.993 0.139 112.132 71.863 1.286 73.149 38.983 34.80% %In 99.88% 0.12% %Out 98.24% 1.76%

104 | P a g e
Isp Ipp ∑Inflow Osp Ogp ∑Outflow Retained % Ret Cell 4 WY2001 3.678 0.005 3.683 1.028 0 1.028 2.655 72.10% WY2002 3.599 0.008 3.607 2.189 0 2.189 1.418 39.30% WY2003 20.733 0.006 20.739 13.348 0 13.348 7.391 35.60% WY2004 18.868 0.005 18.873 9.327 0 9.327 9.546 50.60% WY2005 14.222 0.006 14.228 12.776 0 12.776 1.452 10.20% WY2006 0.922 0.006 0.928 0.089 0 0.089 0.839 90.40% WY2007 0 0.006 0.006 1.047 0 1.047 -1.042 -- WY2008 0 0.007 0.007 0.779 0 0.779 -0.772 -- TOTAL 62.022 0.049 62.071 40.584 0 40.584 21.487 34.60% %In 99.92% 0.08% %Out 100.00% 0.00% Cell 5 WY2001 -1.27 0.044 -1.226 1.286 0 1.286 -2.512 204.90% WY2002 5.546 0.066 5.612 19.482 0 19.482 -13.87 -247.20% WY2003 67.469 0.053 67.522 29.728 0 29.728 37.794 56.00% WY2004 19.965 0.043 20.007 5.878 0 5.878 14.129 70.60% WY2005 59.251 0.049 59.3 40.753 0 40.753 18.547 31.30% WY2006 9.267 0.051 9.318 11.39 0 11.39 -2.072 -22.20% WY2007 0.412 0.045 0.457 1.267 0 1.267 -0.81 -177.10% WY2008 9.081 0.055 9.136 3.728 0 3.728 5.407 59.20% TOTAL 169.722 0.405 170.127 113.514 0 113.514 56.613 33.30% %In 99.76% 0.24% %Out 100.00% 0.00% Isp = surface water inflow; Igp = groundwater inflow; Ipp = precipitation; Osp = surface water outflow; Ogp = groundwater outflow

105 | P a g e
6.4 Elevation Distribution, Wetted Area and Depth
Cells 1-4 have an average ground elevation of about 9.46 ft NGVD29 and Cell 5 has an average elevation of 8.53 ft NGVD29 (Figure 6-2 and Figure 6-3). Elevation ranges in cells in STA-1W are minor to moderate (<0.5 to 2 feet) relative to other STAs, and is distributed approximately uniformly (Figure 6-4 through Figure 6-10). The POR mean stage was more than one standard deviation higher than the maximum elevation for all cells except for Cell 1, indicating consistent flooding. Regarding the elevation CDFs, neither the shape of the curves nor range of the elevation distribution predicted P mass removal effectiveness. For example, despite the markedly different curves describing Cell 3 and Cell 4 (Figure 6-7 and Figure 6-8), both cells have equivalent POR P mass removal effectiveness (ca. 35%) and similar inter annual variability of the same.
From WY1995 through WY2004, Cells 1 through 4 experienced 100% wetted area*time. During rehabilitation beginning in WY2005 and the drought in WY2007 and WY2008 the EWA in these cells declined. Cell 2 is reported by SFWMD to have dried during the rehabilitation event, but but no stage data were available for this cell for WY2006 and WY2007. Likewise, Cells 5A and 5B were completely flooded from WY2001 until WY2006, when they also experienced some drying (Figure 6-11).
The areal P loading rate was never increased by more than 0.03 g/m2/yr after correction for EWA (Table 6-4), because months with low stage (decreased EWA) coincided with months of low or no flow, typically when cells were offline. The relatively poor annual and POR relative mass removals in STA-1W may result from exceptionally high areal P loading, relative to loading rates in other STAs. For example, in WY2003, Cell 4 received the highest P load per unit area (14.39 g P/m2/yr) among all cells for all years on record. SFWMD recognized the overloading in this STA and now makes efforts to prevent comparable loads in the future. Annual outflow TP FWMC was poorly correlated (r2 = 0.11) with annual areal P loading rate (Figure 6-12). Inflow TP FWMC explains some of the scatter in the relationship; generally, for two points with similar areal loading rates, the point with higher inflow TP FWMC had greater TP outflow FWMC, though this pattern is weak in STA-1W. Water years were divided into “low”, “medium” and “high” inflow TP FWMC categories by dividing the range of the data into equal thirds. “Low” corresponds to annual inflow TP FWMC ≤ 0.121 mg/L; “Medium,” 0.121< TP FWMC ≤ 0.214; and “High,” TP FWMC > 0.214.
No correlation was found between monthly SRP mass removal effectiveness and monthly average EWA. The expected relationship may have been obscured by the consistently high EWA. Similarly, monthly SRP mass removal effectiveness was independent of the change in EWA with respect to the previous month (not shown). That is, the reflooding process did not create a flux of SRP large enough to influence the monthly SRP mass removal effectiveness.
Depth analysis
Annual curves of probability of depth exceedance were similar across cells but varied significantly with time (Figure 6-13 through Figure 6-19). Non-cumulative distributions of depths are reported in Table 14-4 in the appendix. Regarding the probability of depth exceedance plots, neither the shape nor the spread of the curves predicted annual or long term P performance.

106 | P a g e
That is, no particular depth distribution form could be said to to be linked to improved TP removal effectiveness.
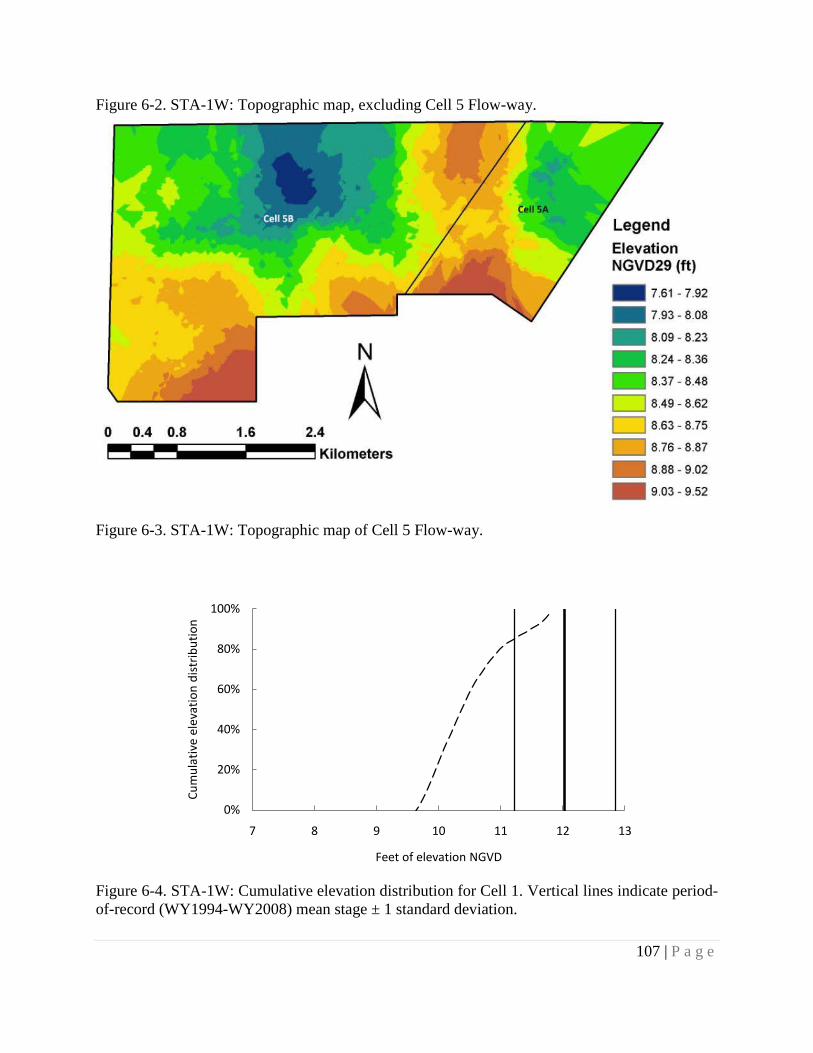
107 | P a g e
Figure 6-2. STA-1W: Topographic map, excluding Cell 5 Flow-way.
Figure 6-3. STA-1W: Topographic map of Cell 5 Flow-way.
Figure 6-4. STA-1W: Cumulative elevation distribution for Cell 1. Vertical lines indicate period-of-record (WY1994-WY2008) mean stage ± 1 standard deviation.
0%
20%
40%
60%
80%
100%
7 8 9 10 11 12 13
Cum
ulat
ive
elev
atio
n di
stri
butio
n
Feet of elevation NGVD

108 | P a g e
Figure 6-5. STA-1W: Cumulative elevation distribution for Cell 2A. Vertical lines indicate period-of-record (WY1994-WY2008) mean stage ± 1 standard deviation.
Figure 6-6. STA-1W: Cumulative elevation distribution for Cell 2B. Vertical lines indicate period-of-record (WY1994-WY2008) mean stage ± 1 standard deviation.
0%
20%
40%
60%
80%
100%
7 8 9 10 11 12 13
Cum
ulat
ive
elev
atio
n di
stri
butio
n
Feet of elevation NGVD
0%
20%
40%
60%
80%
100%
7 8 9 10 11 12 13
Cum
ulat
ive
elev
atio
n di
stri
butio
n
Feet of elevation NGVD

109 | P a g e
Figure 6-7. STA-1W: Cumulative elevation distribution for Cell 3. Vertical lines indicate period-of-record (WY1994-WY2008) mean stage ± 1 standard deviation.
Figure 6-8. STA-1W: Cumulative elevation distribution for Cell 4. Vertical lines indicate period-of-record (WY1994-WY2008) mean stage ± 1 standard deviation.
0%
20%
40%
60%
80%
100%
7 8 9 10 11 12 13
Cum
ulat
ive
elev
atio
n di
stri
butio
n
Feet of elevation NGVD
0%
20%
40%
60%
80%
100%
7 8 9 10 11 12 13
Cum
ulat
ive
elev
atio
n di
stri
butio
n
Feet of elevation NGVD

110 | P a g e
Figure 6-9. STA-1W: Cumulative elevation distribution for Cell 5A. Vertical lines indicate period-of-record (WY2001-WY2008) mean stage ± 1 standard deviation.
Figure 6-10. STA-1W: Cumulative elevation distribution for Cell 5B. Vertical lines indicate period-of-record (WY2001-WY2008) mean stage ± 1 standard deviation.
0%
20%
40%
60%
80%
100%
7 8 9 10 11 12 13
Cum
ulat
ive
elev
atio
n di
stri
butio
n
Feet of elevation NGVD
0%
20%
40%
60%
80%
100%
7 8 9 10 11 12 13
Cum
ulat
ive
elev
atio
n di
stri
butio
n
Feet of elevation NGVD

111 | P a g e
Figure 6-11. STA-1W: Timeseries of annual average estimated wetted area.
0%
20%
40%
60%
80%
100%
Frac
tiona
l Flo
oded
Sur
face
Are
a*Ti
me
Cell 1 Cell 2
Cell 3 Cell 4
Cell 5

112 | P a g e
Table 6-4. STA-1W: Annual areal total phopsorus (TP) loading rates (LR; g P/m2/yr) before and after adjustment for EWA.
Cell 1 Cell 2 Cell 3 Water Year TP LRa TP LRb Difference TP LRa TP LRb Difference TP LRa TP LRb Difference
2000 1.82 1.82 0.00 2.35 2.35 0.00 0.77 0.77 0.00 2001 2.23 2.23 0.00 1.13 1.13 0.00 0.55 0.55 0.00 2002 2.71 2.71 0.00 1.65 1.65 0.00 0.92 0.92 0.00 2003 7.50 7.50 0.00 6.11 6.11 0.00 3.01 3.01 0.00 2004 3.88 3.88 0.00 2.79 2.79 0.00 3.21 3.21 0.00 2005 7.19 7.19 0.00 7.97 7.97 0.00 7.96 7.96 0.00 2006 4.62 4.62 0.00 0.00 0.00 0.00 6.34 6.34 0.00 2007 4.60 4.60 0.00 0.00 0.00 0.00 4.95 4.98 0.03 2008 1.06 1.07 0.01 1.07 1.07 0.00 0.03 0.04 0.01
Cell 4 Cell 5
Water Year TP LRa TP LRb Difference TP LRa TP LRb Difference 2000 3.30 3.30 0.00 0.00 0.00 0.00 2001 2.55 2.55 0.00 -0.11 -0.11 0.00 2002 2.50 2.50 0.00 0.48 0.48 0.00 2003 14.39 14.39 0.00 5.84 5.84 0.00 2004 13.10 13.10 0.00 1.73 1.73 0.00 2005 9.87 9.79 -0.08 5.13 5.13 0.00 2006 0.64 0.64 0.00 0.80 0.80 0.00 2007 0.00 0.00 0.00 0.04 0.04 0.01 2008 0.00 0.00 0.00 0.79 0.79 0.00 aTP LR before EWA adjustment (assumes EWA=100%)
bTP LR after EWA adjustment
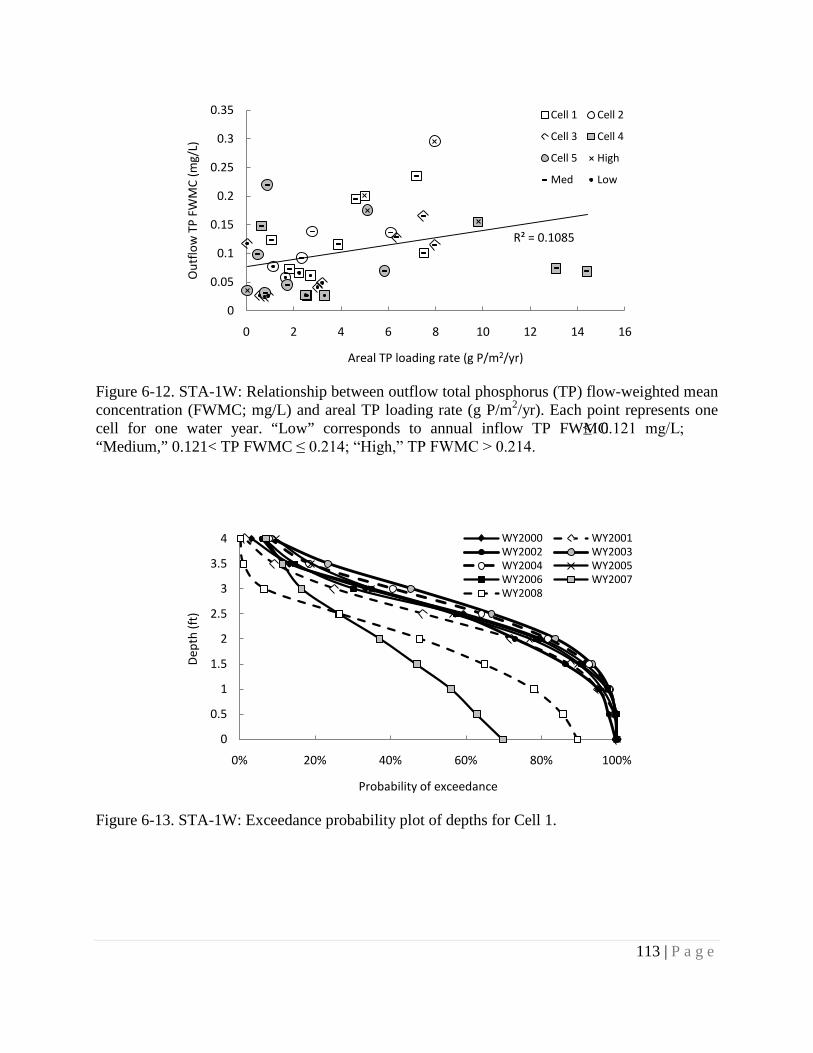
113 | P a g e
Figure 6-12. STA-1W: Relationship between outflow total phosphorus (TP) flow-weighted mean concentration (FWMC; mg/L) and areal TP loading rate (g P/m2/yr). Each point represents one cell for one water year. “Low” corresponds to annual inflow TP FWMC ≤ 0.121 mg/L; “Medium,” 0.121< TP FWMC ≤ 0.214; “High,” TP FWMC > 0.214.
Figure 6-13. STA-1W: Exceedance probability plot of depths for Cell 1.
R² = 0.1085
0
0.05
0.1
0.15
0.2
0.25
0.3
0.35
0 2 4 6 8 10 12 14 16
Out
flow
TP
FWM
C (m
g/L)
Areal TP loading rate (g P/m2/yr)
Cell 1 Cell 2
Cell 3 Cell 4
Cell 5 High
Med Low
0
0.5
1
1.5
2
2.5
3
3.5
4
0% 20% 40% 60% 80% 100%
Dep
th (f
t)
Probability of exceedance
WY2000 WY2001WY2002 WY2003WY2004 WY2005WY2006 WY2007WY2008

114 | P a g e
Figure 6-14. STA-1W: Exceedance probability plot of depths for Cell 2A. Stage data not available for WY2005-WY2007
Figure 6-15. STA-1W: Exceedance probability plot of depths for Cell 2B. Stage data not available for WY2007.
0
0.5
1
1.5
2
2.5
3
3.5
4
0% 20% 40% 60% 80% 100%
Dep
th (f
t)
Probability of exceedance
WY2000
WY2001
WY2002
WY2003
WY2004
WY2008
0
0.5
1
1.5
2
2.5
3
3.5
4
0% 20% 40% 60% 80% 100%
Dep
th (f
t)
Probability of exceedance
WY2000 WY2001WY2002 WY2003WY2004 WY2005WY2006 WY2008

115 | P a g e
Figure 6-16. STA-1W: Exceedance probability plot of depths for Cell 3.
Figure 6-17. STA-1W: Exceedance probability plot of depths for Cell 4.
0
0.5
1
1.5
2
2.5
3
3.5
4
0% 20% 40% 60% 80% 100%
Dep
th (f
t)
Probability of exceedance
WY2000 WY2001WY2002 WY2003WY2004 WY2005WY2006 WY2007WY2008
0
0.5
1
1.5
2
2.5
3
3.5
4
0% 20% 40% 60% 80% 100%
Dep
th (f
t)
Probability of exceedance
WY2000 WY2001 WY2002WY2003 WY2004 WY2005WY2006 WY2007 WY2008

116 | P a g e
Figure 6-18. STA-1W: Exceedance probability plot of depths for Cell 5A.
Figure 6-19. STA-1W: Exceedance probability plot of depths for Cell 5B.
0
0.5
1
1.5
2
2.5
3
3.5
4
0% 20% 40% 60% 80% 100%
Dep
th (f
t)
Probability of exceedance
WY2001 WY2002 WY2003WY2004 WY2005 WY2006WY2007 WY2008
0
0.5
1
1.5
2
2.5
3
3.5
4
0% 20% 40% 60% 80% 100%
Dep
th (f
t)
Probability of exceedance
WY2001 WY2002WY2003 WY2004WY2005 WY2006WY2007 WY2008

117 | P a g e
6.5 Hydraulic Residence Time
The median three-month average HRT ranged from 5 d (Cell 4) to 41 d (Cell 5) in STA-1W treatment cells (Table 14-8 through Table 14-12 in the appendix). Some three-month average HRTs were even longer than the 90 days of the averaging period because of low flow operations during those periods. The range of HRTs included in this study is illustrated by the bounds of the x-axes in Figure 6-20 and Figure 6-21.
No correlation was found between either outflow TP FWMC or TP mass removal effectiveness and three-month average nominal HRT (Figure 6-20 and Figure 6-21). As stated earlier, uncertainties in flow and concentration measurements, errors in estimating HRTs, and stochastic variability in other factors (such as vegetation, soil etc.) could have affected these results. In particular, some portion of the wetlands may not be involved in the flow due to the presence of stagnant zones; therefore the considerable errors could also be generated during the estimation of nominal HRTs (Guardo, 1999). Because the entire volume of water within treatment cell/flow-way may not be actively involved in the flow, the actual HRT may be smaller than the nominal HRT (Kadlec and Knight, 1996). The breakdown of the transient data for particular events/ periods would provide better estimate of the nominal HRTs because STA-1W cells were subjected frequent irregularities in regulating inflows. In some cases, there were extremely low flow operations for long periods of time. The estimate of HRTs could be potentially improved by excluding such events when calculating HRTs.
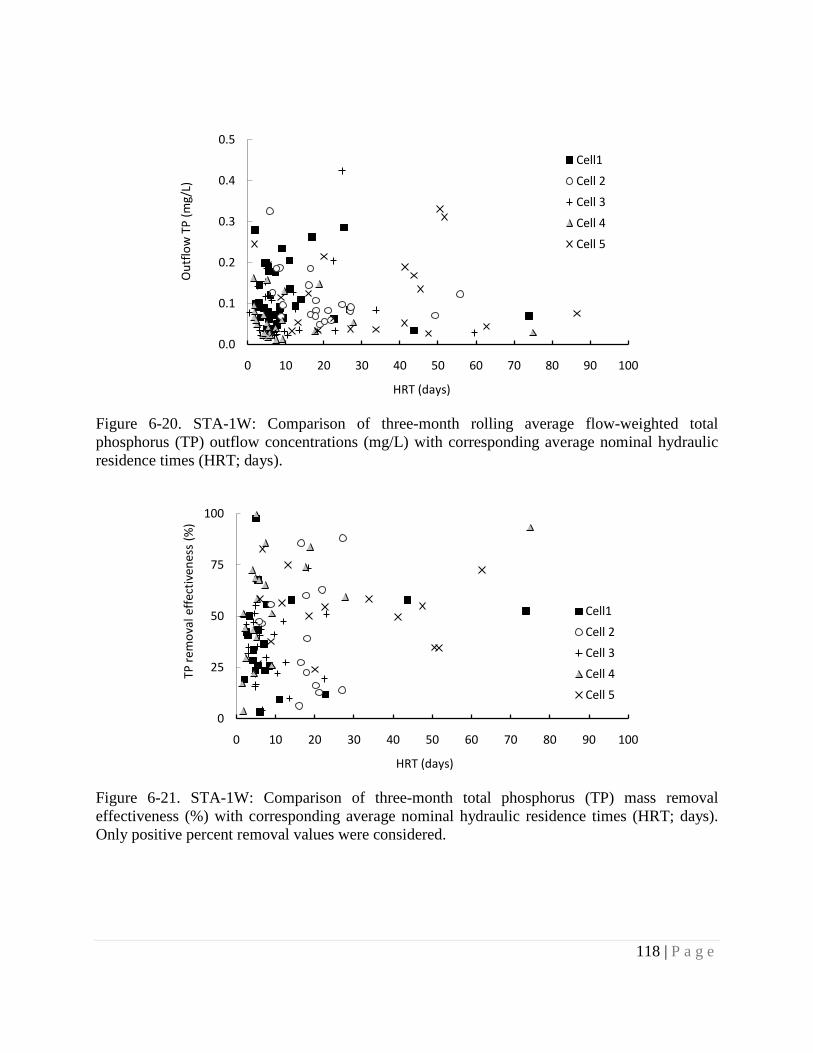
118 | P a g e
Figure 6-20. STA-1W: Comparison of three-month rolling average flow-weighted total phosphorus (TP) outflow concentrations (mg/L) with corresponding average nominal hydraulic residence times (HRT; days).
Figure 6-21. STA-1W: Comparison of three-month total phosphorus (TP) mass removal effectiveness (%) with corresponding average nominal hydraulic residence times (HRT; days). Only positive percent removal values were considered.
0.0
0.1
0.2
0.3
0.4
0.5
0 10 20 30 40 50 60 70 80 90 100
Out
flow
TP
(mg/
L)
HRT (days)
Cell1
Cell 2
Cell 3
Cell 4
Cell 5
0
25
50
75
100
0 10 20 30 40 50 60 70 80 90 100
TP re
mov
al e
ffec
tiven
ess
(%)
HRT (days)
Cell1
Cell 2
Cell 3
Cell 4
Cell 5

119 | P a g e
6.6 Water Column Chemical Constituents
Cells in STA-1W treated the three fractions within water column TP slightly differentially, with SRP most preferentially removed from the TP pool (Figure 6-22, Figure 6-23 and Figure 6-24). Cell 4 enriched DOP in the TP pool in 3 of 6 years, but DOP generally assumed a relatively small fraction of both inflow and outflow TP. In all cells, inflow TP averaged 40-50% SRP and PP, while it was never more than 20% DOP. Because all three fractions were fairly equally through the cells in STA-1W, these relative proportions are roughly maintained in the outflow TP as well.
Period-of-record average areal calcium loading was moderate to high (0.9 to 3.4 kg Ca/m2/yr) for cells in STA-1W (Table 6-5), relative to cells in other STAs, but did not influence SRP mass removal effectiveness (Figure 6-25). Stoichiometrically, Ca availability may not limit SRP removal in this system, and only a small fraction of inflow Ca interacts with P. However, both annual SRP retention and mass removal effectiveness were positively correlated with annual areal Ca retention in Cells 1 and 2 (Figure 6-26 and Figure 6-27). The two Cell 4 outliers that show high SRP retention in years of Ca loss occur represent water years 2003 and 2005. These results suggest that Ca is important to the P dynamics of the STAs and deserves further investigation. Management actions cannot be recommended based on the findings of this study.
The magnitude of the net Ca flux in all STAs also deserves note; in various years, these cells in STA-1W have gained as much as 2 kg Ca/m2, based on water chemistry data. Soil calcium storages in STA-1W varied from 0.7 to about 4 kg Ca/m2 in the top 10 cm in sampling events from WY1994 to WY2008. It is unlikely that Ca fluxes of the observed magnitude transfered in and out of the soil. Additional Ca storage in floc, biofilms and periphyton may account for this discrepency.
Based on data available for Cells 4 and 5, the inflow sulfate concentration was several orders of magnitude higher in Cell 5 compared to Cell 4. The difference may be the result of sampling, lab or data storage error, or possibly, sulfate was removed by cells upstream of Cell 4 in the Western Flow-way. In either case, SRP mass removal effectiveness was not correlated to annual areal sulfate loading in these two cells (Figure 6-28).

120 | P a g e
Figure 6-22. STA-1W: Proportion of total phosphorus (TP) that is soluble reactive phosphorus (SRP) in outflow water and inflow water. Each point represents one cell for one water year. 1:1 line is shown. Outflow SRP data unavailable for Cell 3.
Figure 6-23. STA-1W: Proportion of total phosphorus (TP) that is dissolved organic phosphorus (DOP) in outflow and inflow water. Each point represents one cell for one water year. 1:1 line is shown. Outflow DOP data unavailable for Cells 2 and 3. DOP data omitted for Cells 1, and 5.
0%
20%
40%
60%
80%
100%
0% 20% 40% 60% 80% 100%
Out
flow
SRP
Pro
port
ion
of T
P
Inflow SRP Proportion of TP
Cell 1Cell 2Cell 4Cell 51:1 Line
0%
20%
40%
60%
80%
100%
0% 20% 40% 60% 80% 100%
Out
flow
DO
P Pr
opor
tion
of T
P
Inflow DOP Proportion of TP
Cell 4
1:1 Line

121 | P a g e
Figure 6-24. STA-1W: Proportion of total phosphorus (TP) that is particulate phosphorus (PP) in outflow and inflow water. Each point represents one cell for one water year. 1:1 line is shown. PP data not available for Cell 2. PP data omitted for Cell 5.
Table 6-5. STA-1W: POR flow-weighted mean concentrations (FWMC; mg/L) and average annual areal loading rates (LR; g/m2/yr) of select non-phosphorus chemicals.
Ca SO4 NOx NO2 NH4
FWMC LR FWMC LR FWMC LR FWMC LR FWMC LR Cell 1 90 2342 -- -- 0.58 15.20 0.00 0.07 -- -- Cell 2 84 1276 -- -- 0.68 10.34 0.01 0.20 -- -- Cell 3 85 2867 -- -- 0.24 8.14 0.00 0.06 -- -- Cell 4 83 3394 0.14 5.54 0.42 17.04 0.00 0.16 -- -- Cell 5 92 855 29.10 269.71 0.42 3.91 -- -- 0.43 4.02
0%
20%
40%
60%
80%
100%
0% 20% 40% 60% 80% 100%
Out
flow
PP
Prop
ortio
n of
TP
Inflow PP Proportion of TP
Cell 1
Cell 3
Cell 4
1:1 Line

122 | P a g e
Figure 6-25. STA-1W: Relationship between annual soluble reactive phosphorus (SRP) removal (by mass) and calcium areal loading rate. Each point represents one cell for one water year. Outflow SRP data not available for Cell 3.
Figure 6-26. STA-1W: Relationship between annual areal soluble reactive phosphorus (SRP) retention (g SRP/m2/yr) and annual areal calcium retention (g Ca/m2/yr). Outflow SRP data unavailable for Cell 3 and outflow Ca data unavailable for Cell 5.
-50%
0%
50%
100%
0 2000 4000 6000 8000 10000 12000
SRP
mas
s re
mov
al e
ffec
tiven
ess
Ca Load In (g/m2/yr)
Cell 1Cell 2Cell 4Cell 5
-3
-2
-1
0
1
2
3
4
5
-3000 -2000 -1000 0 1000 2000 3000
Ann
ual a
real
SRP
ret
entio
n (g
SR
P/m
2/yr
)
Annual areal Ca retention (g Ca/m2/yr)
Cell 1
Cell 2
Cell 4
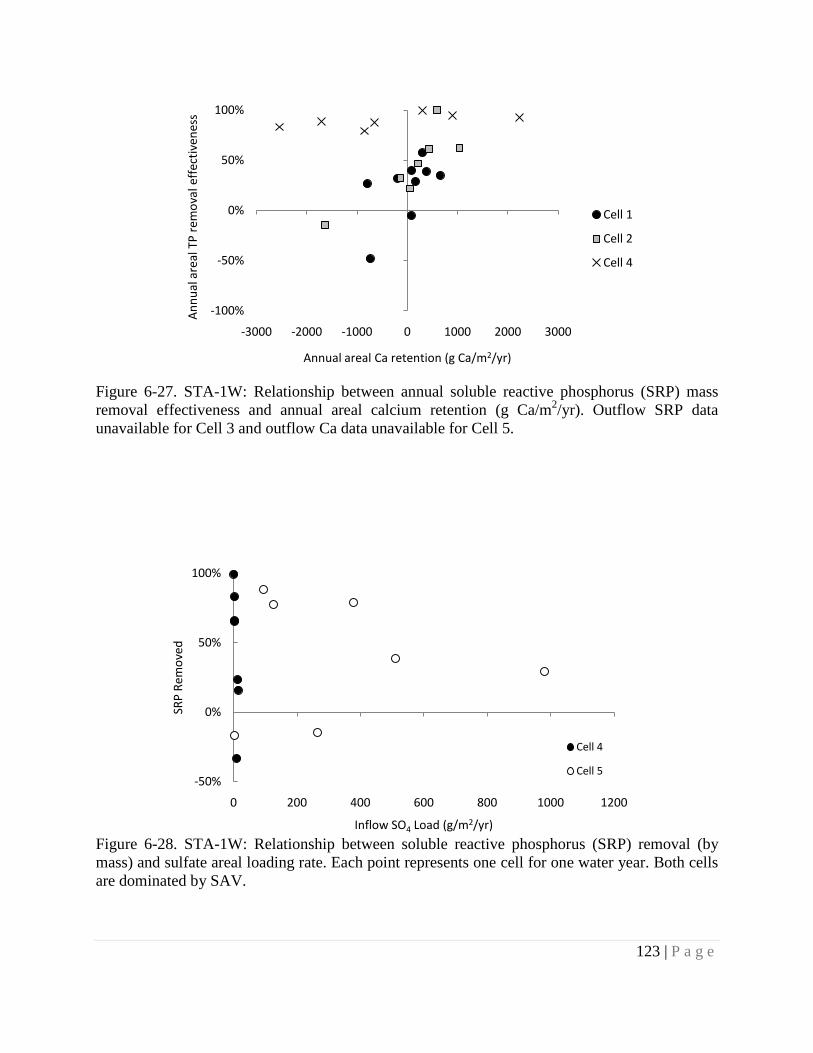
123 | P a g e
Figure 6-27. STA-1W: Relationship between annual soluble reactive phosphorus (SRP) mass removal effectiveness and annual areal calcium retention (g Ca/m2/yr). Outflow SRP data unavailable for Cell 3 and outflow Ca data unavailable for Cell 5.
Figure 6-28. STA-1W: Relationship between soluble reactive phosphorus (SRP) removal (by mass) and sulfate areal loading rate. Each point represents one cell for one water year. Both cells are dominated by SAV.
-100%
-50%
0%
50%
100%
-3000 -2000 -1000 0 1000 2000 3000
Ann
ual a
real
TP
rem
oval
eff
ectiv
enes
s
Annual areal Ca retention (g Ca/m2/yr)
Cell 1
Cell 2
Cell 4
-50%
0%
50%
100%
0 200 400 600 800 1000 1200
SRP
Rem
oved
Inflow SO4 Load (g/m2/yr)
Cell 4
Cell 5

124 | P a g e
6.7 Soil Nutrients
6.8 Floc and soil physico-chemical properties
The Eastern and Western Flow-ways of STA-1W constitute the oldest operational section of STAs. It started in 1989 on a pilot scale and was officially designated at Everglades Nutrient Removal project (ENRP) in year 1994 when NPDES permit was granted. Only Cells 1, 2, 3, and 4 existed then, but a large section of land was added towards the north of ENRP in WY2000 as Cell 5A and Cell 5B. Since then this treatment system has been designated as STA-1W.
Table 6-6 and Table 6-7 show the number of floc and soil samples available for each sampling event. Data on floc samples were only available from WY2004 and WY2007. The absence of floc data may or may not indicate the absence of floc in the field. The absence of floc data was not assumed to indicate absence of floc in the field. The floc values may be absent due to either dry conditions and consolidation of floc into the surface soil, or mixing of the floc with the soil during sampling. Missing floc data can potentially result in erroneous calculation of FPS. Floc is the active layer (the interface between the water column and sediment layer), and often contributes a significant proportion of the total P storage.
During WY1996, WY2000 and WY2006, soils were sampled inconsistently; only Cells 1, 5A and 5B were sampled in these years. This paucity in the existing datasets proved to be a major hindrance for temporal analysis of long term soil P accumulation in soils. This is particularly important for STA-1W since it is the longest operating STA and could provide important information about soil P processes if datasets were more extensive and complete. WY2004 and WY2007 were two years with the largest numbers of soil samples.
The floc depth variation across the cells can be seen in Table 6-8. The mean depth of floc appeared to have decreased from WY2004 to WY2007 but this could be due to the absence of depth data for Cell 1 and Cell 5A. The average floc depth value (6.6 cm) obtained from Cell 2, 4 and 5A was assigned to floc samples from Cell 1 and 5A for which floc depth values were missing.
The bulk density values of floc and soil from STA-1W are shown in Table 6-9 and Table 6-10 respectively. Floc bulk density changed from 0.08 ± 0.03 (g/cm3 ± SD) to 0.1 ± 0.03 (g/cm3 ± SD) from WY2004 to WY2007. This slight increase could be a result of compaction. In the case of soils, the bulk density registered a slight increase from 0.18 ± 0.06 (g/cm3 ± SD) to 0.23 ± 0.05 (g/cm3 ± SD) from WY1995 to WY2008. WY2008 samples registered a slight decrease which could be attributable to the limited number of samples in WY2008 and the exclusion of Cells 5A and 5B.
6.8.1 Phosphorus inventory
Average TP concentrations (mg P/kg) of floc and soils are shown in Table 6-11 and Table 6-12, respectively. Total P concentration for floc and soils increased between sampling events (WY2004 to WY2007). Figure 6-29 presents variation in soil (top 10 cm) TP concentrations as a function of age for all cells. Most cells reported TP concentration close to the mean TP concentration value for STA; however Cell 2 registered a notable decrease in soil TP concentration over the POR. Total P concentration values in WY2008 decreased, possibly due to

125 | P a g e
the rehabilitation work undertaken in Cells 1, 2 and 4 during WY2007. Changes in floc and soil TP concentration for the whole STA across the sampling year are presented Figure 6-30.
Total soil P storage (SPS) in each cell was calculated per unit area for the top 10 cm of soil and expressed in g P/m2. Where the soil core was shallower or deeper than 10 cm, the SPS values were normalized to 10 cm. Floc P storage decreased while SPS increased from WY1995 to WY2007 (Table 6-13, Table 6-14, and Figure 6-31). The decrease in SPS in WY2008 could be attributed to the rehabilitation activities. Soil P storage in WY2001 was considered background storage and was used for analysis in later sections.
The P mass balance was calculated using the cumulative TP retained from the water column from WY2001 to WY2007 (Table 6-3) and the P storage in the floc and surface soil in WY2007. That the soil integrated operating conditions over a longer period than water column data were available for, was a limitation of this exercise. Figure 6-32 shows P mass in select compartments for each cell in STA-1W. In STA-1W, water column P retention data were available only for Cells 1, 2, 3 and 4, so Cell 5A and 5B were excluded from mass balance calculations. The arrows indicate flux of P between compartments. All cells reported net positive retention of P from the water column and the SPS increased in all cells except Cell 3. This increase in P storage in the surface soil seems to have been supported by P flux from subsurface soil.
6.8.2 Nitrogen inventory
The change in N over the period of operation of STA 1-W was analyzed by calculating the floc N storage (FNS) and soil nitrogen storage (SNS) in top 10 cm soil. The concentrations of N (g N/kg) in floc and soil are given in Table 6-15 and Table 6-16 respectively. The FNS and SNS are depicted in Table 6-17 and Table 6-18 respectively. Total N concentration for floc was not available for WY2004 therefore comparison in FNS values across different sampling years was not possible. Soil N storages increased from WY1995 to WY2007, with a slight decrease in WY2008. This slight decrease could be attributed to rehabilitation activities.
The relationships between N and P storages in floc and soils are shown in Figure 6-33 and Figure 6-34 respectively. Results showed increased FNS with an increase in FPS. Approximately 15 g N/m2 was stored per 1g P/m2 in floc fraction. The linear relationship between floc N and P storages suggests that P was stored primarily in organic forms in the floc. Soil N storage and SPS for each cell are presented in Figure 6-35. The relationship between SNS and SPS was not clear and may indicate the presence of inorganic P forms in the soil. N: P ratios in the floc approach the Redfield ratio of 16:1 and do not suggest P limitation. Mean value of N:P ratios for soils in WY2007 were found to be 43:1. The soil N:P ratio varied from 38:1 (Cell 5B) to 62:1 (Cell 4) in STA-1W cells. The soil N:P ratio for WY2004 was found to be 100:1, suggesting that N:P ratios decreased over POR. This decrease could also be attributed to rehabilitation activities carried out in WY2007.
6.8.3 Carbon inventory
The change in organic matter was estimated over the POR by calculating the floc carbon storage (FCS) and soil carbon storage (SCS). The concentrations of C (g C/kg) in floc and soil are presented in Table 6-19 and Table 6-20, respectively. The FCS and SCS are shown in Table 6-21

126 | P a g e
and Table 6-22, respectively. Total C concentrations increased in the soil across the sampling years while C storage did not change over the same period.
The relationships between P and C storages in the floc and soil are shown in Figure 6-36 and Figure 6-37, respectively. This result is based on floc samples from WY2007 and soil samples from WY2001, WY2004 and WY2007. Floc carbon storage was related to FPS. Approximately 290 g C/m2 was stored per 1 g P/m2 (Figure 6-36). However, a clear relationship for soils was not obtained for C and P storages. For both floc and soil, a strong relationship was found between C and N storage as depicted in Figure 6-38 and Figure 6-39, respectively. This suggested that all the N and P fractions are either bound in organic forms or are closely associated with the organic matter present in the soil. The source of this closely linked relationship between C and N in the top soils could be the detrital matter arising from similar wetland vegetation.
Carbon and P storages for each cell are presented in Figure 6-40. The mean value of the C:P ratio for soils was 583:1. The C: P ratios varied from 1035:1 for Cell 2 to 607:1 for Cell 5B. Figure 6-41 depicts C and N storage for each cell. The mean value of C:N ratio for soils was 13:1. These ratios are typical of those observed for microbial/plankton biomass and for soil organic matter. The existing C and N pools in soils are of crucial importance for maintaining various biogeochemical processes in wetlands. The sum total of these processes determine microbial decomposition rates and control soil formation and long term accretion of nutrients. An adequate balance of these elements plays important role in sequestering P and is critical for ensuring long term sustainability of STAs. This above analysis provided insights into the existing conditions of the STA soils.

127 | P a g e
Table 6-6. STA-1W: Number of floc samples.
Floc 2004 2007 EAV Cell-1 30 21 Cell-3 22 -- Cell-5A -- 1 SAV Cell-2 26 4 Cell-4 10 5 Cell-5B -- 16 All cells 88 47
Table 6-7. STA-1W: Number of soil samples Soil
1995 1996 2000 2004 2006 2007 2008 EAV Cell-1 10 23 -- 30 -- 32 -- Cell-3 18 -- -- 22 -- -- 20 Cell-5A -- -- -- -- 28 14 -- SAV Cell-2 4 -- -- 26 -- 4 23 Cell-4 4 -- -- 11 -- 15 9 Cell-5B -- -- 31 -- -- 68 -- All cells 36 23 31 89 28 133 52

128 | P a g e
Table 6-8. STA-1W: Floc depth (cm)
Floc 2004 2007 EAV Cell-1 18.5 ± 7.2 6.6 ± 0* Cell-3 19.6 ± 8.4 -- Cell-5A -- 6.6 ± 0# SAV Cell-2 17.3 ± 7 4.8 ± 3.1 Cell-4 16.7 ± 4.2 12 ± 2.8 Cell-5B -- 3.1 ± 1.9 All cells 18.3 ± 7.2 4.4 ± 2.3£
* Floc depth not provided so mean floc depth from SAV cells 6.6 cm was assigned for floc P, N and C storage calculations # Only one floc sample was recorded from Cell 5A in year 2007, hence SD is zero £ Cell 1 and Cell 5A floc depth values were not taken in account to calculate mean Floc depth for the STA in year 2007
Table 6-9: STA-1W: Floc bulk density (g/cm3; mean ± SD)
Floc 2004 2007 EAV
Cell-1 0.08 ± 0.03 0.04 ± 0.03 Cell-3 0.07 ± 0.04 -- Cell-5A -- 0.11 ± 0* SAV Cell-2 0.1 ± 0.03 0.17 ± 0.04 Cell-4 0.09 ± 0.04 0.22 ± 0.02 Cell-5B -- 0.02 ± 0.02 All cells 0.08 ± 0.03 0.1 ± 0.03
*Only one floc sample was recorded from Cell 5A in year 2007.

129 | P a g e
Table 6-10. STA-1W: Soil bulk density (g/cm3; mean ± SD) Soil
1995 1996 2000 2004 2006 2007 2008 EAV Cell-1 0.16 ± 0.06 0.2 ± 0.06 -- 0.2 ± 0.07 -- 0.15 ± 0.04 -- Cell-3 0.19 ± 0.06 -- -- 0.23 ± 0.05 -- -- 0.21 ± 0.07 Cell-5A -- -- -- -- 0.24 ± 0.05 0.31 ± 0.06 -- SAV Cell-2 0.17 ± 0.04 -- -- 0.22 ± 0.04 -- 0.21 ± 0.03 0.23 ± 0.03 Cell-4 0.21 ± 0.01 -- -- 0.24 ± 0.04 -- 0.27 ± 0.04 0.24 ± 0.04 Cell-5B -- -- 0.26 ± 0.06 -- -- 0.31 ± 0.08 -- All cells 0.18 ± 0.06 0.2 ± 0.06 0.26 ± 0.06 0.22 ± 0.06 0.24 ± 0.05 0.26 ± 0.09 0.23 ± 0.05
Table 6-11. STA-1W: Phosphorus concentration in floc (mg P/kg soil, mean ± SD)
Floc
2004 2007 EAV Cell-1 823 ± 324 1002 ± 248 Cell-3 598 ± 266 --
Cell-5A -- 971 ± 0 SAV Cell-2 657 ± 192 882 ± 62 Cell-4 873 ± 287 803 ± 126
Cell-5B -- 1557 ± 436 All cells 726 ± 272 1192 ± 261

130 | P a g e
Table 6-12. STA-1W: Phosphorus concentration in soil (mg P/kg soil; mean ± SD)
Soil
1995 1996 2000 2004 2006 2007 2008
EAV Cell-1 523 ± 161 353 ± 96 -- 249 ± 64 -- 656 ± 312 -- Cell-3 418 ± 60 -- -- 263 ± 47 -- -- 571 ± 301 Cell-5A -- -- -- -- 452 ± 188 570 ± 155 --
SAV Cell-2 518 ± 193 -- -- 321 ± 143 -- 433 ± 164 444 ± 185 Cell-4 363 ± 31 -- -- 263 ± 42 -- 530 ± 256 443 ± 119 Cell-5B -- -- 507 ± 194 -- -- 595 ± 197 --
All cells 479 ± 130 353 ± 96 507 ± 194 272 ± 77 452 ± 188 598 ± 316 500 ± 226
Table 6-13. STA-1W: Floc phosphorus storage (FPS; g P/m2, mean ± SD)
Floc
2004 2007 EAV Cell-1 10.48 ± 5.86 2.6 ± 1.54 Cell-3 6.55 ± 3.07 -- Cell-5A -- 10.68 ± 0 SAV Cell-2 10.51 ± 5.24 6.68 ± 4.35 Cell-4 12.39 ± 4.23 20.89 ± 5.35 Cell-5B -- 0.6 ± 0.42 All cells 9.6 ± 4.8 4.4 ± 1.6

131 | P a g e
Table 6-14. STA-1W: Soil phosphorus storage (SPS; g P/m2, mean ± SD) in surface soil (0-10 cm).
Soil
1995 1996 2000 2004 2006 2007 2008 EAV Cell-1 7.44 ± 1.76 3.5 ± 1.1 -- 4.9 ± 2.1 -- 8.79 ± 3.06 -- Cell-3 7.8 ± 2.34 -- -- 5.9 ± 2.5 -- ± 11.32 ± 5 Cell-5A -- -- -- -- 11.3 ± 6.13 17.77 ± 7.04 -- SAV Cell-2 7.92 ± 0.48 -- -- 7.2 ± 4.2 -- 13.4 ± 5.1 10.06 ± 4.32 Cell-4 7.68 ± 0.6 -- -- 6.2 ± 1.4 -- 14.6 ± 7.9 10.89 ± 4.65 Cell-5B -- -- 6.9 ± 3 -- -- 18.3 ± 7.7 -- All cells 7.7 ± 1.5 3.5 ± 1.1 6.9 ± 3 5.8 ± 2.6 11.3 ± 6.1 14.6 ± 5.9 10.7 ± 4.7

132 | P a g e
Figure 6-29: STA-1W: Variation in soil TP concentration (mg P/kg soil) across the cells as a function of age
Figure 6-30 STA-1W: Change in total phosphorus concentration (mg P/kg soil) in floc and soil (0-10 cm) with time. Error bars represent standard error of the mean
0
100
200
300
400
500
600
700
800
900
0 1 2 3 4 5 6 7 8 9 10 11 12 13 14 15
TP (m
g P/
kg)
Age (yr)
Cell-1 Cell-2 Cell-3 Cell-4
Cell-5A Cell-5B Avg
0
200
400
600
800
1000
1200
1400
1995 1996 2000 2004 2006 2007 2008
TP (m
g P/
kg)
Floc Soil

133 | P a g e
Figure 6-31: STA-1W: Change in phosphorus storage (g P/m2) in floc and soil (0-10 cm) over time. Error bars represent the standard error of the mean.
0
3
6
9
12
15
18
21
24
1995 1996 2000 2004 2006 2007 2008
P s
tora
ge (g
P/m
2 )
Floc Soil

134 | P a g e
Figure 6-32. STA-1W: Phosphorus mass balance: soil P storage vis-à-vis net P retained from water quality data. All values are in g P/m2. Arrows indicate flux of P from different compartment. Phosphorus loading for each individaul cells for the whole period of record was not available, however STA mean P loading for the total period of operation is shown. Top row blue arrows indicate direction of P movement between water and floc. Middle row orange arrows show P movement between floc and surface soil (0-10 cm). Lower row blue arrows indicate P movement between surface (0-10 cm) and sub-surface soil (10-30 cm).

135 | P a g e
Table 6-15. STA-1W: Floc nitrogen concentration (g N/kg, mean ± SD)
Floc 2007 EAV Cell-1 23 ± 2 Cell-3 -- Cell-5A 19 ± 0 SAV Cell-2 25 ± 2 Cell-4 12 ± 3 Cell-5B 25 ± 3 All cells 23 ± 2
Table 6-16. STA-1W: Soil nitrogen concentration (g N/kg, mean ± SD) Soil
1995 1996 2000 2004 2006 2007 2008 EAV Cell-1 28 ± 1 32 ± 4 -- 29 ± 3 -- 25 ± 3 --
Cell-3 27 ± 3 -- -- 27 ± 4 -- -- 29 ± 5
Cell-5A -- -- -- 27 ± 3 24 ± 4 -- SAV Cell-2 28 ± 1 -- -- 30 ± 2 -- 28 ± 2 29 ± 3
Cell-4 28 ± 1 -- -- 28 ± 3 -- 36 ± 64 24 ± 5
Cell-5B -- -- 30 ± 3 -- -- 26 ± 4 -- All cells 28 ± 2 32 ± 4 30 ± 3 28 ± 3 27 ± 3 26 ± 7 28 ± 4

136 | P a g e
Table 6-17. STA-1W: Floc nitrogen storage (FNS, g N/m2, mean ± SD)
Floc 2007 EAV Cell-1 62 ± 37 Cell-3 -- Cell-5A 209 ±0 SAV Cell-2 192 ± 127 Cell-4 291 ± 52 Cell-5B 11 ± 10 All cells 92 ± 43
Table 6-18. STA-1W: Soil nitrogen storage (SNS, g N/m2, mean ± SD) in soil (0-10 cm).
Soil 1995 1996 2000 2004 2006 2007 2008
EAV Cell-1 436 ± 165 637 ± 133 -- 574 ± 163 -- 371 ± 119 -- Cell-3 504 ± 113 -- -- 610 ± 106 -- -- 600 ± 129 Cell-5A -- -- -- -- 646 ± 123 726 ± 81 -- SAV Cell-2 474 ± 103 -- -- 660 ± 134 -- 584 ± 59 672 ± 123 Cell-4 584 ± 23 -- -- 684 ± 134 -- 522 ± 208 553 ± 53 Cell-5B -- -- 770 ± 163 -- -- 771 ± 150 -- All cells 478 ± 122 637 ± 133 770 ± 163 622 ± 145 646 ± 123 792 ± 159 622 ± 115

137 | P a g e
Table 6-19. STA-1W: Floc carbon concentration (TC; g C/kg; mean ± SD)
Floc 2007 EAV Cell-1 339 ± 27 Cell-3 -- Cell-5A 300 ± 0 SAV Cell-2 398 ± 26 Cell-4 229 ± 36 Cell-5B 327 ± 34 All cells 274 ± 13
Table 6-20. STA-1W: Soil carbon concentration (TC; g C/kg; mean ± SD)
Soil 1995 1996 2000 2004 2006 2007 2008
EAV Cell-1 457 ± 18 510 ± 46 -- 467 ± 44 -- 397 ± 56 --
Cell-3 476 ± 33 -- -- 459 ± 70 -- -- 453 ± 70
Cell-5A -- -- -- -- 450 ± 38 403 ± 69 --
SAV Cell-2 473 ± 12 -- -- 475 ± 23 -- 465 ± 30 461 ± 39
Cell-4 513 ± 7 -- -- 467 ± 32 -- 350 ± 123 415 ± 69
Cell-5B -- -- 483 ± 40 -- -- 405 ± 52 --
All cells 360 ± 12 510 ± 46 483 ± 40 467 ± 47 450 ± 38 398 ± 69 450 ± 60
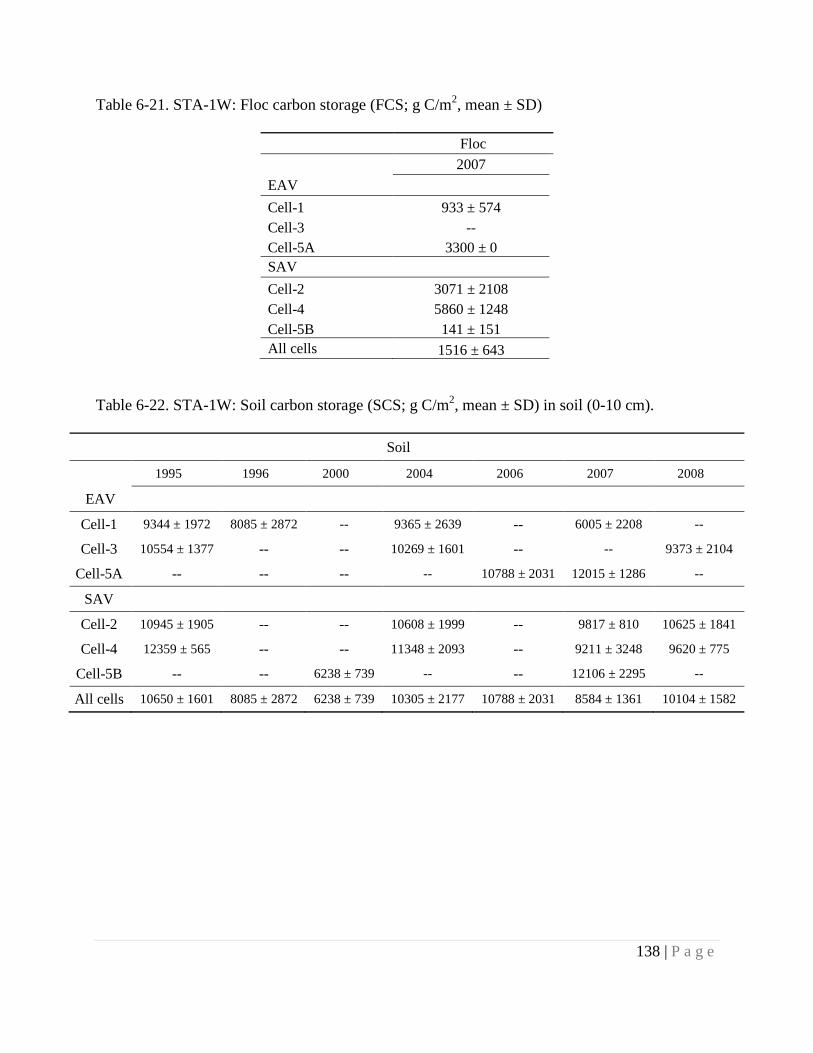
138 | P a g e
Table 6-21. STA-1W: Floc carbon storage (FCS; g C/m2, mean ± SD)
Floc 2007 EAV Cell-1 933 ± 574 Cell-3 -- Cell-5A 3300 ± 0 SAV Cell-2 3071 ± 2108 Cell-4 5860 ± 1248 Cell-5B 141 ± 151 All cells 1516 ± 643
Table 6-22. STA-1W: Soil carbon storage (SCS; g C/m2, mean ± SD) in soil (0-10 cm).
Soil
1995 1996 2000 2004 2006 2007 2008
EAV Cell-1 9344 ± 1972 8085 ± 2872 -- 9365 ± 2639 -- 6005 ± 2208 --
Cell-3 10554 ± 1377 -- -- 10269 ± 1601 -- -- 9373 ± 2104
Cell-5A -- -- -- -- 10788 ± 2031 12015 ± 1286 --
SAV Cell-2 10945 ± 1905 -- -- 10608 ± 1999 -- 9817 ± 810 10625 ± 1841
Cell-4 12359 ± 565 -- -- 11348 ± 2093 -- 9211 ± 3248 9620 ± 775
Cell-5B -- -- 6238 ± 739 -- -- 12106 ± 2295 --
All cells 10650 ± 1601 8085 ± 2872 6238 ± 739 10305 ± 2177 10788 ± 2031 8584 ± 1361 10104 ± 1582

139 | P a g e
Figure 6-33. STA-1W : Relationship between floc nitrogen storage (FNS; g N/m2) and floc phosphorus storage (FPS; g P/m2) in WY2004 and WY2007.
Figure 6-34. STA-1W: Relationship between soil nitrogen storage (SNS; g N/m2) and soil phosphorus storage (SPS; g P/m2) for all sampling points from WY1995, WY1996, WY2000, WY2004, WY2006 and WY2007.
0
50
100
150
200
250
300
350
400
450
0 5 10 15 20 25 30
FNS
(g N
/m2 )
FPS (g P/m2)
Floc
2007
0
200
400
600
800
1000
1200
1400
0 10 20 30 40 50
SNS
(g N
/m2 )
SPS (g P/m2)
Soil (0-10 cm) 1995
1996
2000
2004
2006
2007
2008

140 | P a g e
Figure 6-35. STA-1W: Ratio of soil nitrogen storage (SNS; g N/m2) to soil phosphorus storage (SPS; g P/m2; WY2007 data only). Filled triangles indicate EAV cells, empty triangles represent SAV cells and filled square indiates N:P ratio for the whole STA
Figure 6-36. STA-1W: Relationship between floc carbon storage (FCS; g C/m2) and floc phosphorus storage (FPS; g P/m2) in WY2004 and WY2007.
STA1W
Cell-1
Cell-5A
Cell-2
Cell-4
Cell-5B
0
100
200
300
400
500
600
700
800
900
1000
0 5 10 15 20 25
SNS
(g P
/ m
2 )
SPS (g P/m2)
0
1000
2000
3000
4000
5000
6000
7000
8000
9000
0 5 10 15 20 25 30
SCS
(g C
/m2 )
SPS (g P/m2)
Floc
2007

141 | P a g e
Figure 6-37. STA-1W: Relationship between soil carbon storage (SCS; g C/m2) and soil phosphorus storage (SPS; g P/m2) in soil (0-10 cm) for all sampling points from WY1995, WY1996, WY2000, WY2004, WY2006 and WY2007.
Figure 6-38. STA-1W: Relationship between floc soil carbon storage (FCS; g C/m2) and floc nitrogen storage (FNS; g N/m2) in WY2004 and WY2007.
0
2000
4000
6000
8000
10000
12000
14000
16000
18000
20000
0 10 20 30 40 50
SCS
(g C
/m2 )
SNS (g N/m2)
Soil (0-10 cm) 1995
1996
2000
2004
2006
2007
2008
0
50
100
150
200
250
300
350
400
450
0 100 200 300 400 500
FCS
(g C
/m2 )
FNS (g N/m2)
Floc
2007

142 | P a g e
Figure 6-39. STA-1W: Relationship between soil carbon storage (g C/m2) and soil nitrogen storage (g N/m2) soil (0-10 cm) for all sampling points from WY1995, WY1996, WY2000, WY2004, WY2006 and WY2007.
Figure 6-40. STA-1W: Ratio of soil carbon storage (SCS; g C/m2) to soil phosphorus storage (g P/m2 ; WY2007 data only). Filled triangles indicate EAV cells, empty triangles represent SAV cells and filled square indiates C:P ratio for the whole STA.
0
2000
4000
6000
8000
10000
12000
14000
16000
18000
20000
0 200 400 600 800 1000 1200 1400
SCS
(g C
/m2 )
SNS (g N/m2)
Soil (0-10 cm)1995
1996
2000
2004
2006
2007
2008
STA1WCell-1
Cell-5A
Cell-2 Cell-4
Cell-5B
0
2000
4000
6000
8000
10000
12000
14000
0 5 10 15 20 25
SCS
(g C
/ m
2 )
SPS (g P/m2)
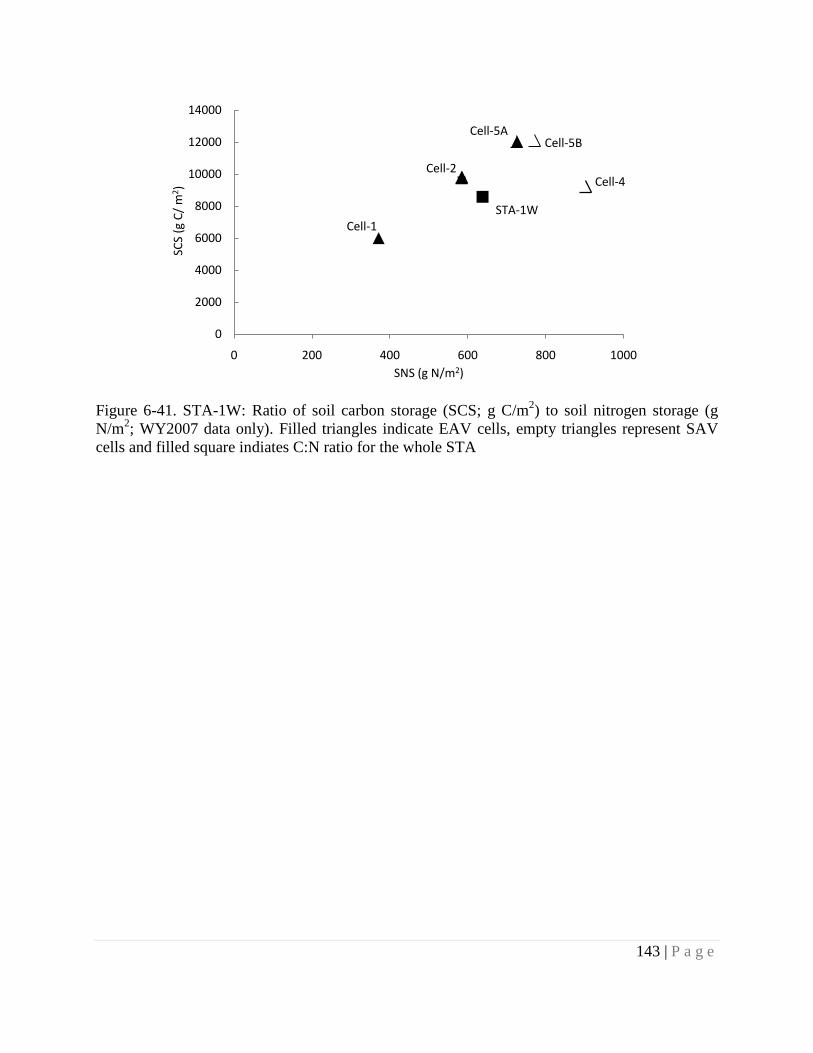
143 | P a g e
Figure 6-41. STA-1W: Ratio of soil carbon storage (SCS; g C/m2) to soil nitrogen storage (g N/m2; WY2007 data only). Filled triangles indicate EAV cells, empty triangles represent SAV cells and filled square indiates C:N ratio for the whole STA
STA-1WCell-1
Cell-5A
Cell-2Cell-4
Cell-5B
0
2000
4000
6000
8000
10000
12000
14000
0 200 400 600 800 1000
SCS
(g C
/ m
2 )
SNS (g N/m2)

144 | P a g e

145 | P a g e
6.9 Vegetation
Nutrient storages in the vegetation biomass were not calculated due to paucity of relevant data. The final report on ‘Vegetation Biomass and Nutrient Analysis for STA-1W’ by DB Environmental (2002) (contract no 12276) provided nutrient content and mean biomass of SAV, FAV and EAV species at various locations along the water flow path for ENR cells of STA-1W. A summary of the findings is reproduced below (Table 6-23 through Table 6-27). These findings were not used for the analysis (P mass balance calculations) due to absence of total extent and vegetation type present in each of the cells. Without the spatial extent of EAV and SAV vegetation it was not possible to calculate total nutrient storages in the vegetation.
Also vegetation nutrient storages varied spatially, responding negatively to the distance from inflow stations. Vegetation nutrient storages also tend to have a seasonal variability, where nutrient storages per unit mass showed decrease in winter season. This seasonal and spatial variability in the vegetation data limited its utility towards accurate P mass balance calculations.
During winter sampling event in year 2002, the Eastern Flow-way mean TP concentrations were 0.450 and 0.447% (dry wt.) at the Cell 1 outflow and Cell 3 mid stations respectively for the Najas-dominated plant beds. Whereas P concentrations for the Ceratophyllum-dominated beds were 0.266% (Cell 3 outflow) to 0.379% (Cell 1 outflow). In Western Flow-way the TP concentrations were 0.271 and 0.175%, respectively at Cell 2 and Cell 4 for Najas-dominated plant beds. The TP concentrations were 0.485 and 0.269%, respectively at Cell 2 and Cell 4 for Ceratophyllum-dominated plant beds.
The Eastern Flow-way mean TP in the Pistia-dominated beds, were 0.260 and 0.293 % dry wt., respectively at the Cell 1 inflow location and Cell 1 outflow location. In case of Eichhornia-dominated beds TP concentrations were 0.222 to 0.163% dry wt. for the Cell 1 inflow location and Cell 1 outflow location respectively. In the Western Flow-way, for Cell 2 Inflow and Cell 2 Outflow locations the TP concentrations were 0.230 to 0.387% dry wt. for the Pistia-dominated beds and 0.155 to 0.174% dry wt. for the Eichhornia-dominated beds, respectively.
During summer sampling event in year 2002, the Eastern Flow-way mean TP concentrations (% dry wt.) in the plants were 0.231% dry wt to 0.163% dry wt for Cell 1 inflow and Cell 1 outflow respectively for the Najas-dominated plant beds. Phosphorus concentrations for the Ceratophyllum-dominated beds were 0.205 and 0.171% dry wt, for Cell 1 inflow and Cell 1 outflow, respectively. Whereas in Western Flow-way P concentrations were 0.161 % dry wt and 0.118 % dry wt for Cell 2 and Cell 4 outflow for Najas-dominated plant beds and 0.184 % dry wt and 0.140 % dry wt at Cell 2 Inflow Cell 2 Outflow for Ceratophyllum-dominated beds.
The Eastern Flow-way mean TP in the Pistia-dominated beds, were 0.174 and 0.186%, respectively at the Cell 1 Inflow and Cell 1 Outflow locations and In case of Eichhornia-dominated beds TP concentrations ranged from 0.109 and 118 %for the Cell 1 Inflow and Cell 1 Outflow respectively. In the Western Flow-way, the TP concentrations ranged from (0.132 and 0.204 %) for Cell 2 Inflow and Cell 2 Outflow the Pistia-dominated beds and 0.136 to 0.133% respectively for the Eichhornia-dominated beds.

146 | P a g e
The quantity of P (g P/m2) reported in Typha ranged from 0.54 ±0.09 to 1.42±1.23 to (g P/m2) in above ground portion and from 0.44 ± 0.09 to 1.64 ± 0.97 (g P/m2) in below ground biomass. These values are relatively smaller in comparison to soil P storage values, and therefore did not seem to affect P mass balance critically.
Table 6-23. STA-1W: Standing crop nutrient composition for Typha at three locations in Eastern and Western Flow-way of STA-1W (mean ± 1 SD) samples in the year 2002. Typha P (g P/m2) N (g N/m2) C (g C/m2) Eastern Flow-way Above Below Above Below Above Below Cell 1 Inflow 1.42 ± 1.23 1.64 ± 0.97 18.5 ± 22 13.5 ± 4.5 463 ± 294 562 ± 244 Cell1 Outflow 0.54 ± 0.09 0.44 ± 0.09 5.58 ± 0.5 8.14 ± 1.5 242 ± 35 367 ± 62 Cell 3 Outflow 0.81 ± 0.31 0.81 ± 0.35 8.29 ± 1.9 6.80 ± 2.5 270 ± 53 377 ± 122 Western Flow-way Cell 2 Inflow 0.97±0.23 1.63±0.75 9.65±3.2 9.39±4.1 322±90 363±185 Cell 2 Outflow 0.88±0.26 0.84±0.32 6.74±2.4 5.46±3.6 306±112 244±124 Cell 4 Outflow 0.94±0.39 0.52±0.18 8.66±2.6 7.53±3.4 379±90 331±108
Table 6-24. STA-1W: Standing crop nutrient composition for Najas dominated plant bed location in Eastern and Western Flow-way of STA-1W (mean ± 1 SD) samples in the year 2002. Najas dominated P (g P/m2) N (g N/m2) C (g C/m2) Eastern Flow-Way Winter Summer Winter Summer Winter Summer Cell 1 Inflow 0.71±0.05 1.32±0.17 6.56±2.00 11.2±1.4 101±28.4 154±16.9 Cell 1 Outflow 0.57±0.05 1.30±0.10 3.17±0.46 15.0±1.3 43.6±7.3 230±46.2 Cell 3 Mid 0.16±0.09 0.413±0.07 1.11±0.62 3.99±0.4 12.7±7.0 60.5±6.6 Cell 3 Outflow 0.08±0.04 0.133±0.05 1.50±0.52 2.12±0.7 18.9±6.1 37.7±14.9 Western Flow-Way Cell 2 Mid 0.36±0.17 0.07±0.04 3.09±1.09 0.94±0.70 45.0±16.7 14.4±11.0 Cell 4 Outflow 1.10±0.20 0.32±0.06 12.63±1.26 5.95±1.25 169.0±35.9 85.9±17.3
Table 6-25. STA-1W: Standing crop nutrient composition for Ceratophyllum dominated plant bed location in Eastern and Western Flow-way of STA-1W (mean ± 1 SD) samples in the year 2002. Ceratophyllum-dominated P (g P/m2) N (g N/m2) C (g C/m2)
Eastern Flow-Way Winter Summer Winter Summer Winter Summer Cell 1 Inflow 1.16±0.32 1.90±0.59 6.99±2.32 14.5±3.31 89.4±28 199±42 Cell 1 Outflow 1.30±0.40 2.00±0.61 7.50±2.46 22.2±7.82 102±34 325±118 Cell 3 Mid 0.24±0.06 0.69±0.18 2.20±0.49 6.58±1.67 27.9±5.6 98.5±24 Cell 3 Outflow 0.97±0.11 0.49±0.04 7.77±1.84 6.64±1.15 127±28 122±22 Western Flow-

147 | P a g e
Way
Cell 2 Inflow 0.41±0.11 0.59±0.07 2.27±0.63 7.26±0.86 30.7±9.4 95.9±15.6 Cell 2 Outflow 0.88±0.36 0.39±0.19 7.68±3.17 5.27±2.63 108.6±39.8 85.4±41.9
Table 6-26. STA-1W: Standing crop nutrient composition for Pistia dominated plant bed location in Eastern and Western Flow-way of STA-1W (mean ± 1 SD) samples in the year 2002. Pistia-dominated P (g P/m2) N (g N/m2) C (g C/m2) Eastern Flow-Way Winter Summer Winter Summer Winter Summer Cell 1 Inflow 0.70±0.24 1.25±0.14 5.81±2.00 10.9±0.57 93.2±30 248±25.6 Cell 1 Outflow 1.12±0.38 1.83±0.13 8.52±1.61 14.2±1.63 128±39 345±21.7 Cell 3 Mid 1.72±0.41 1.99±0.26 9.54±2.08 18.1±2.74 155±40 443±40.5 Cell 3 Outflow 0.83±0.28 0.89±0.18 6.20±2.59 10.6±1.97 89.8±35 211±40.6 Western Flow-Way Cell 2 Mid 1.00±0.21 0.94±0.17 6.70±1.52 11.0±2.36 150±27 230.1±48 Cell 4 Outflow 0.24±0.07 1.05±0.27 1.62±0.55 9.94±2.27 22.4±7.3 180.9±36
Table 6-27. STA-1W: Standing crop nutrient composition for Eichhornia dominated plant bed location in Eastern and Western Flow-way of STA-1W (mean ± 1 SD) samples in the year 2002. Eichhornia-dominated P (g P/m2) N (g N/m2) C (g C/m2)
Eastern Flow-Way Winter Summer Winter Summer Winter Summer Cell 1 Inflow 2.57±0.51 3.06±0.43 24.1±5.2 25.7±1.50 465±113 1,069±140 Cell 1 Outflow 3.10±0.69 2.97±0.72 29.9±9.1 23.9±5.74 763±175 981±275 Cell 3 Mid 2.22±0.57 1.51±0.46 18.6±4.0 16.9±4.69 518±88 448±121 Cell 3 Outflow 1.59±0.47 1.50±0.22 23.6±7.2 23.2±4.28 656±104 661±80 Western Flow-Way Cell 2 Mid 2.05±0.40 3.98±0.75 20.8±3.73 32.6±6.00 494±78 1,115.5±202 Cell 4 Outflow 2.48±0.63 3.53±1.15 16.5±4.56 28.0±7.42 550±137 1,018.7±251

148 | P a g e
6.10 Conclusions
STA-1W was highly loaded with both water and P. TP mass removal effectiveness, as calculated from the TP mass balance varied significantly from year to year and cell to cell in this STA. Over the POR, WY2001 to WY2008, Cells 1, 2, 3, 4, and 5 retained 8%, 22%, 35%, 35%, and 33% of their inflow P, respectively, making it one of the poorest performing STAs over the long term. Recent rehabilitation activities are expected to improve STA-1W performance; future studies will be needed to quantify the impacts of the rehabilitation on water quality improvement in STA-1W.
The analysis of topography and stage data showed a nearly 100% wetted area*time in all cells for the initial water years of the POR. In recent years, drought and rehabilitation activities caused low flows, low stages and incomplete flooding. However, current stage targets are likely still valuable; the data used in this report were not used to comment on stage maintenance practices. It is also recognized that EAV communities require occasional dry-outs to recruit new emergent plants. Areal P loading rates calculated directly from the TP mass balance are generally adequate as loads were minimal during low-EWA years. Annual average outflow TP flow-weighted mean concentration (FWMC) was weakly linearly correlated with annual average areal TP loading rate, but that relationship was influenced by inflow FWMC.
Depth distributions in cells in STA-1W varied annually, and most had portions that experienced dry out or extreme depths in at least one year. Annual depth distribution was not a predictor of annual TP removal performance.
Neither the three-month average outflow TP FWMC nor the three-month TP mass removal effectiveness was notably correlated with hydraulic residence time.
The cells in STA-1W treated various water column P forms, (SRP, DOP, and PP), roughly equivalently. Generally, cells in STA-1W slightly enriched DOP and PP in the TP pool. Soluble reactive P was slightly preferentially removed from the TP pool in most cells.
The POR areal Ca loading rates and Ca FWMC were comparable to those found in other STA cells. Annual SRP mass removal effectiveness was independent of annual areal Ca load, but was positively correlated with annual areal Ca retention in Cells 1 and 2. Results suggest that SRP mass removal effectiveness was independent of annual areal sulfate loading. However, limited data were used in this analysis
The soils of STA-1W have moderate bulk densities suggesting considerable organic matter content. The FPS decreased during the sampling period however soil P storage increased. Data on floc C concentration and floc N concentration were missing for WY2004, which precluded the further analysis of changes in N and C storage in floc over time. However soil N storage increased with time. Soil C storage did not show significant change over the POR.
On calculating P mass balance based on WY2007 data, P appeared to have migrated from the subsurface soil to the surface soil and floc. This movement of P could be mediated by vegetation

149 | P a g e
through P mining from deeper layers or via diffusive flux. Hence as a whole this STA appeared to be functioning as net sink for P.
High N:P ratios were found in STA soils, which suggested P limitation in the system. Soil C and P storage relationship were not conclusive across the whole sampling events.

150 | P a g e
7 STORMWATER TREATMENT AREA 2 (STA-2)
7.1 Introduction
STA-2 has a treatment footprint totaling 3334 ha (8240 ac). It is divided into four north-to-south flow-ways of one cell each (Figure 5-1). The Western Flow-way, Cell 4 (770 ha; 1902 ac), was excluded from all analyses here because it was still in start-up phase. As of 2008, Cells 1 and 2 were designated EAV, and are managed as such. Cell 3 is designated as an SAV system. STA-2 initially received water in WY2000 and all cells in these flow-ways have remained online since this time. The POR for analyses of water quality included only data collected from WY2003 through WY2008, unless otherwise noted.
The hydraulic loading rate (HLR) for cells in STA-2 has been fairly consistent from year to year over the operating period. The average annual HLR was 12, 17 and 16 m/yr for Cells 1, 2 and 3, respectively. The associated average TP loading rates were 0.95, 1.8 and 1.4 g P/m2/yr, after adjustment for estimated wetted area*time.

151 | P a g e
Figure 7-1. STA-2: Schematic showing plan view of cells and water control structures. (Source: Pietro et al., 2008)

152 | P a g e
7.2 Operational Timeline
The three flow-ways considered in this report (Cells 1, 2 and 3) have been online and operational for the entire POR of the STA.
7.3 Water and Phosphorus Budgets
The annual water budgets for each cell of STA-2 have been calculated previously by SFWMD (Table 7-1; Pietro et al., 2009). Annual hydraulic loading in STA-2 has been comparable with cells in other STAs (12 - 17 m/yr, POR annual average) and is unlikely to explain any variation in TP treatment between this and other STAs. Groundwater flow (in or out) was less than 1% of the total water budget for all cells in all reported water years, except that groundwater accounted for about 8% of the Cell 3 outflow, on average. The volume of water delivered to cells in this STA changed by a relatively small fraction each year; except during the drought in WY2007-WY2008, the change from the previous year was never more than 30%, as compared with changes of 100% or more in cells in other STAs. This consistency in hydrologic loading may play a role in the observed better-than-average TP removal effectiveness in STA-2.
Mass balances for Cells 1, 2 and 3 in STA-2 have been prepared previously by SFWMD (Table 7-2; Pietro et al., 2009). STA-2 outperformed all of the five other STAs in P mass removal effectiveness. The P mass loads were less consistent from year to year than the hydraulic loads because the inflow TP FWMC was variable with time for each cell. The annual areal TP loading rates were generally lower compared to the other STAs (POR maximum of 3.1 g P/m2, Cell 2, WY2007) which may contribute to the strong performance observed in STA-2. There were no distinct trends in loading over the POR (such as long term increasing or decreasing loads) and no relationship between TP mass removal effectiveness and annual changes in TP mass loading.

153 | P a g e
Table 7-1. STA-2: Annual water budgets (hm3). Pietro et al., 2009.
Is Ig Ip Σinflow HLR Os Og ET Σoutflow ΔS r ε
hm3/yr hm3/yr hm3/yr hm3/yr m/yr hm3/yr hm3/yr hm3/yr hm3/yr hm3/yr hm3/yr Cell 1 WY2003 57.2 0.3 10.3 67.8 12 36.9 0.3 10.5 47.7 5.7 -14.4 -24.90% WY2004 78.1 0 9.4 87.4 12 61.3 0.4 10.7 72.4 -2.1 -17.2 -21.50% WY2005 67.8 0 8.9 76.8 11 71.4 0.4 10.1 81.9 0.5 5.6 7.10% WY2006 72.6 0 10.4 83.1 11 70.8 0.4 10.9 82 -0.2 -1.2 -1.50% WY2007 72.4 0 8.8 81.2 11 81.8 0.6 10.4 92.8 -2.6 9 10.30% WY2008 94 0 10.8 104.8 15 76.6 0.6 10.5 87.7 2.5 -14.7 -15.20% POR 442.1 0.4 58.7 501.1 72 398.9 2.7 63 464.5 3.8 -32.8 -6.80% %In 88.20% 0.10% 11.70% %Out 85.90% 0.60% 13.60% 0.80% Cell 2 WY2003 149.3 0.3 11.5 161.1 19 123.8 0.4 11.8 135.9 4 -21.2 -14.30% WY2004 111.6 0.1 10.4 122.2 13 110.8 0.6 11.9 123.3 -2 -1 -0.80% WY2005 177.9 0.1 10 188 22 164.3 0.9 11.2 176.4 -1.7 -13.3 -7.30% WY2006 160.3 0 11.6 172 20 121.6 0.8 12.1 134.5 0.2 -37.3 -24.30% WY2007 146.6 0.1 9.9 156.5 19 145.6 1 11.6 158.2 -2.1 -0.5 -0.30% WY2008 74.2 0.2 12.1 86.5 11 76 0.2 11.7 87.9 2.5 3.9 4.50% POR 819.9 0.9 65.4 886.2 104 742.1 3.9 70.2 816.2 0.8 -69.3 -8.10% %In 92.50% 0.10% 7.40% %Out 90.90% 0.50% 8.60% 0.10% Cell 3 WY2003 178.7 0 11.5 190.2 21 144.7 17.1 11.8 173.6 2.1 -14.6 -8.00% WY2004 137.8 0 10.4 148.3 16 129.3 14 11.9 155.2 -3.6 3.3 2.20% WY2005 173.2 0 10 183.1 20 155.9 10 11.2 177.2 -0.4 -6.4 -3.50% WY2006 150.8 0 11.6 162.4 18 133 10 12.1 155.2 -0.7 -8 -5.00% WY2007 75.4 0 9.9 85.2 9 86.2 9.2 11.6 107 -0.1 21.7 22.60% WY2008 109 0 12.1 121 13 116.6 11 11.7 139.3 1.8 20.1 15.40% POR 824.8 0 65.4 890.3 97 765.8 71.4 70.2 907.5 -1 16.1 1.80% %In 92.60% 0.00% 7.40% %Out 84.40% 7.90% 7.70% -0.10% Is = surface water inflow; Ig = groundwater inflow; IP = precipitation; Os = surface water outflow; Og = groundwater outflow; ET = evapotranspiration; ∆S = change in storage volume; r = water budget residual; ε = water budget error

154 | P a g e
Table 7-2. STA-2: Annual total phosphorus mass balance (mt). Pietro et al., 2009.
Isp Ipp ∑Inflow Osp Ogp ∑Outflow Retained % Ret Cell 1 WY2003 3.245 0.041 3.286 0.519 0.008 0.527 2.759 84.00% WY2004 6.061 0.037 6.098 0.831 0.014 0.844 5.254 86.20% WY2005 6.574 0.036 6.61 0.716 0.013 0.73 5.88 89.00% WY2006 6.641 0.042 6.683 0.537 0.011 0.548 6.135 91.80% WY2007 10.96 0.035 10.995 0.766 0.021 0.787 10.208 92.80% WY2008 8.149 0.043 8.192 0.887 0.018 0.905 7.288 89.00% TOTAL 41.631 0.235 41.866 4.257 0.084 4.341 37.525 89.60% %In 99.44% 0.56% %Out 98.05% 1.95% Cell 2 WY2003 10.279 0.046 10.325 2.486 0.013 2.499 7.826 75.80% WY2004 10.571 0.042 10.613 1.75 0.022 1.773 8.84 83.30% WY2005 20.302 0.04 20.342 6.266 0.057 6.324 14.018 68.90% WY2006 17.139 0.046 17.185 3.31 0.044 3.354 13.831 80.50% WY2007 27.211 0.039 27.25 7.98 0.103 8.082 19.168 70.30% WY2008 9.241 0.048 9.289 2.759 0.015 2.774 6.515 70.10% TOTAL 94.743 0.262 95.004 24.551 0.254 24.806 70.199 73.90% %In 99.72% 0.28% %Out 98.97% 1.03% Cell 3 WY2003 9.528 0.046 9.574 2.246 0.493 2.739 6.835 71.40% WY2004 11.368 0.042 11.41 1.701 0.463 2.163 9.246 81.00% WY2005 18.874 0.04 18.913 2.521 0.42 2.941 15.973 84.50% WY2006 13.166 0.046 13.212 2.301 0.39 2.691 10.521 79.60% WY2007 9.716 0.039 9.755 2.203 0.529 2.732 7.023 72.00% WY2008 12.296 0.048 12.344 1.969 0.481 2.45 9.894 80.20% TOTAL 74.947 0.262 75.209 12.941 2.775 15.716 59.493 79.10% %In 99.65% 0.35% %Out 82.34% 17.66% Isp = surface water inflow; Igp = groundwater inflow; Ipp = precipitation; Osp = surface water outflow; Ogp = groundwater outflow

155 | P a g e
7.4 Elevation Distribution, Wetted Area and Depth
STA-2 has an average ground elevation of about 10.5 ft NGVD29 (Figure 7-2). All cells within STA-2 have moderate to large elevation ranges (two to three ft), distributed roughly uniformly, except for deep zones accounting for about 20% of the area in each cell (Figure 7-3 through Figure 7-5). In Cells 1 and 3, the POR mean stage was at least one standard deviation (and about 1 ft) above the maximum elevation of each of those cells, indicating fairly continuous submergence of the cells. In both Cells 1 and 3, the average depth was about 1.5 ft at the POR mean stage, which was approximately the target stage for these cells. About 10% of the area in Cell 3 was deeper than 3 ft when the stage was at the POR average. The relationship between the elevation distribution and POR mean stage in Cell 2 shows that the cell was subjected to intermittent wetting and drying, which may have contributed to the slightly reduced POR TP mass removal effectiveness in that cell (Table 7-2).
The average EWA over the POR was estimated to be 96%, 93% and 100% for Cells 1, 2 and 3, respectively (Figure 7-6). In terms of wetted area, STA-2 was not significantly affected by the drought in WY2007 and WY2008.
The areal P loading rate was never increased by more than about 7% after correction for EWA (Table 7-3). Outflow TP FWMC were moderately correlated (r2 = 0.53) with areal P loading rate (Figure 7-7). Inflow TP FWMC explained some of the scatter in the relationship; generally, for two points with similar areal loading rates, the point with higher inflow TP FWMC will have the greater TP outflow FWMC. Water years were divided into “low”, “medium” and “high” inflow TP FWMC categories by dividing the range of the data into equal thirds. For cells in STA-2, because there were two water years with exceptionally high inflow concentration, only those two points fell into the “high” category, while the rest of the points were divided between “medium” and “low.” “Low” corresponds to annual inflow TP FWMC ≤ 0.097 mg/L; “Medium,” 0.097< TP FWMC ≤ 0.142; and “High,” TP FWMC > 0.142.
Over the POR EWA in Cells 1 and 2 tended to decline during May (coinciding with the end of the dry season), while Cell 3 maintained 100% flooding in all months of the year (Figure 7-8). It was expected that the seasonal exposure of, on average, 20% of the area in Cells 1 and 2 would be marked by a seasonal decline in P removal effectiveness as release P was released from the soils into the water column during re-flooding, but this phenomenon was not observed for either TP (Figure 7-9) or SRP (not shown).
Monthly SRP mass removal effectiveness was independent of monthly average EWA in STA-2 (Figure 7-10). Because the flux of P associated with drying, oxidation and re-flooding will only occur when the wetland transitions from dry to wet, a low EWA value does not necessarily imply an expected low (or negative) P removal value, unless EWA increases in the following time period (in this case, one month). Also, the product of mineralization of organic matter in the soil is expected to be SRP. However, SRP mass removal effectiveness was independent of the change in monthly average EWA (Figure 7-11; Points falling on the positive x-axis represent months that were wetter than the month before and negative x-values indicate months that were drier than the previous month. For example, a point with an x-value of 0.3 could represent a June with an EWA of 80% that followed a May with EWA 50%).

156 | P a g e
Depth analysis
Annual curves of probability of depth exceedance were similar across cells and time (Figure 7-12 through Figure 7-14). Water year 2002 is added to the record to take advantage of available stage data, despite the fact that water quality data from that year is not included in other analyses. Non-cumulative distributions of depths are reported in Table 14-4 in the appendix.
Water years 2002 and 2003 were drier than subsequent years for Cell 1, and 10% of the area*time was greater than 4 ft deep in WY2002-WY2004 in Cell 3, but generally there was little variation from year to year within each of the three cells. The overall similarity between cells and between years within cells makes comparison of TP removal performance relative to the depth distribution difficult.
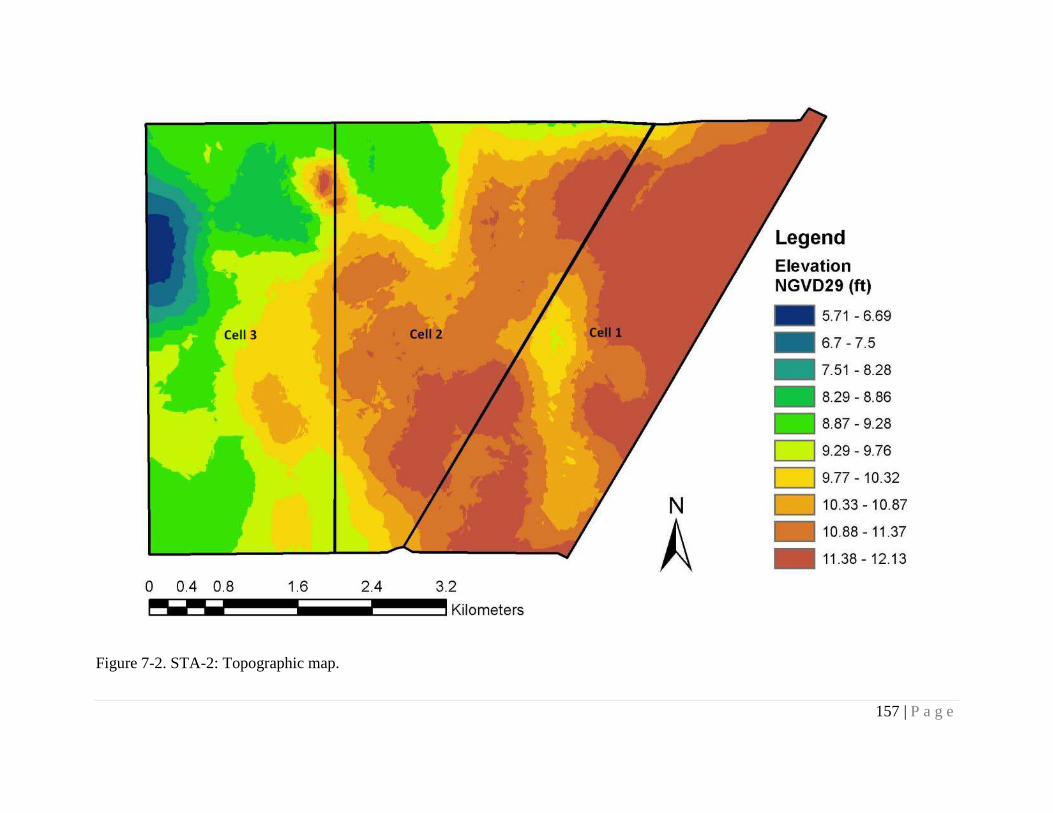
157 | P a g e
Figure 7-2. STA-2: Topographic map.

158 | P a g e
Figure 7-3. STA-2: Cumulative elevation distribution for Cell 1. Vertical lines indicate period-of-record (WY2003-WY2008) mean stage ± 1 standard deviation.
Figure 7-4. STA-2: Cumulative elevation distribution for Cell 2. Vertical lines indicate period-of-record (WY2003-WY2008) mean stage ± 1 standard deviation.
0%
20%
40%
60%
80%
100%
7 8 9 10 11 12 13 14
Cum
ulat
ive
elev
atio
n di
stri
butio
n
Feet of elevation NGVD
0%
20%
40%
60%
80%
100%
7 8 9 10 11 12 13 14
Cum
ulat
ive
elev
atio
n di
stri
butio
n
Feet of elevation NGVD

159 | P a g e
Figure 7-5. STA-2: Cumulative elevation distribution for Cell 3. Vertical lines indicate period-of-record (WY2003-WY2008) mean stage ± 1 standard deviation. This is an SAV cell. Table 7-3. STA-2: Annual TP loading rates before and after adjustment for EWA
Water Year Cell 1 Cell 2 Cell 3
TP LR a TP LR b Difference TP LR a TP LR b Difference TP LR a TP LR b Difference 2003 0.45 0.45 0.01 1.12 1.19 0.07 1.04 1.04 0.00 2004 0.83 0.83 0.00 1.15 1.18 0.02 1.24 1.24 0.00 2005 0.90 0.90 0.00 2.21 2.26 0.05 2.05 2.05 0.00 2006 0.91 0.91 0.00 1.87 2.00 0.13 1.43 1.43 0.00 2007 1.51 1.51 0.00 2.96 3.10 0.13 1.06 1.06 0.00 2008 1.12 1.12 0.00 1.01 1.06 0.05 1.34 1.34 0.00
aTP LR before EWA adjustment (assumes EWA=100%) bTP LR after EWA adjustment
0%
20%
40%
60%
80%
100%
7 8 9 10 11 12 13 14
Cum
ulat
ive
elev
atio
n di
stri
butio
n
Feet of elevation NGVD

160 | P a g e
Figure 7-6. STA-2: Time series of annual average estimated wetted area. Cell 3 is SAV.
Figure 7-7. STA-2: Relationship between outflow total phosphorus (TP) flow-weighted mean concentration (FWMC; mg/L) and areal TP loading rate. “Low” corresponds to annual inflow TP FWMC ≤ 0.097 mg/L; “Medium,” 0.097< TP FWMC ≤ 0.142; “High,” TP FWMC > 0.142. Each point represents one cell for one water year.
0%
20%
40%
60%
80%
100%
Frac
tiona
l Flo
oded
Sur
face
Are
a*Ti
me
Cell 1
Cell 2
Cell 3
R² = 0.5312
0
0.01
0.02
0.03
0.04
0.05
0.06
0 0.5 1 1.5 2 2.5 3 3.5
Out
flow
TP
FWM
C (m
g/L)
Areal TP loading rate (g P/m2/yr)
Cell 1 High
Cell 2 Med
Cell 3 Low

161 | P a g e
Figure 7-8. STA-2: Intra-annual trends in estimated wetted area*time for each cell. Each month is averaged over the period of record (WY2003-WY2007).
Figure 7-9. STA-2: Intra-annual trends in estimated wetted area*time (EWA) and total phosphorus (TP) mass removal effectiveness. Points have been averaged across cells. Each month is averaged over the period of record (WY2003-WY2008).
0%
20%
40%
60%
80%
100%
Frac
tiona
l flo
oded
sur
face
are
a*tim
e
Cell 1
Cell 2
Cell 3
0%
20%
40%
60%
80%
100%
0%
20%
40%
60%
80%
100%
TP m
ass
rem
oval
eff
ectiv
enes
s
EWA
EWA
% TP Mass Removed
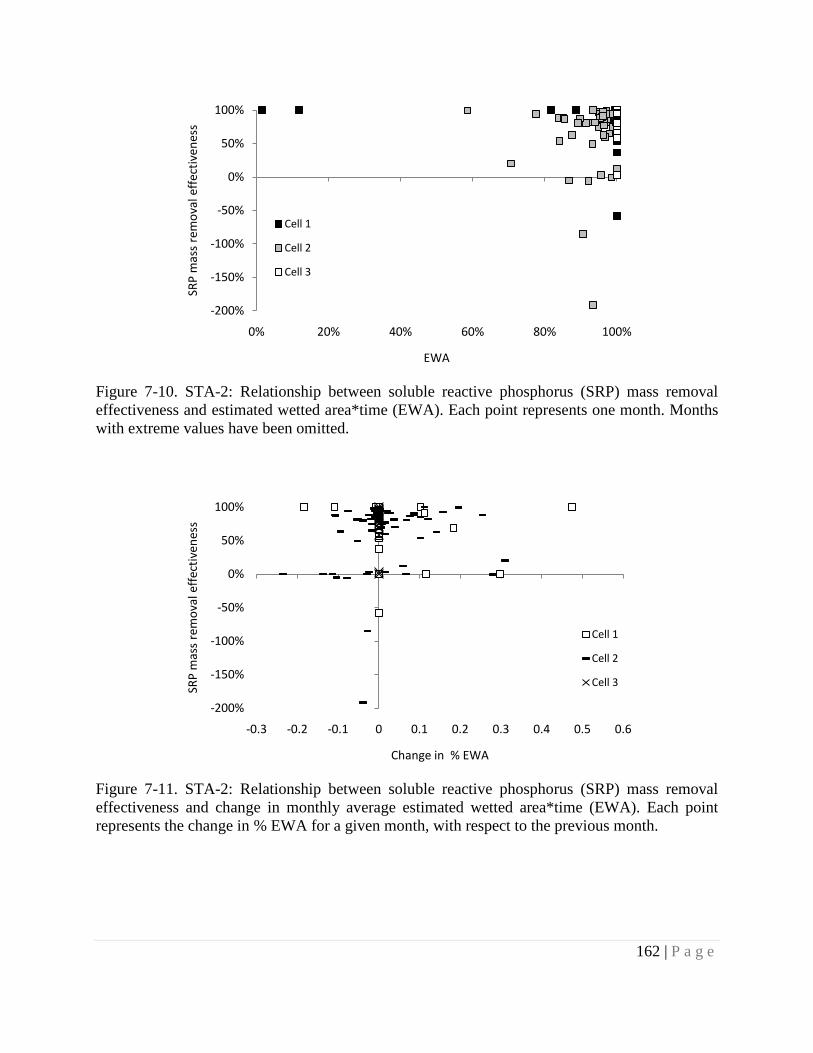
162 | P a g e
Figure 7-10. STA-2: Relationship between soluble reactive phosphorus (SRP) mass removal effectiveness and estimated wetted area*time (EWA). Each point represents one month. Months with extreme values have been omitted.
Figure 7-11. STA-2: Relationship between soluble reactive phosphorus (SRP) mass removal effectiveness and change in monthly average estimated wetted area*time (EWA). Each point represents the change in % EWA for a given month, with respect to the previous month.
-200%
-150%
-100%
-50%
0%
50%
100%
0% 20% 40% 60% 80% 100%
SRP
mas
s re
mov
al e
ffec
tiven
ess
EWA
Cell 1
Cell 2
Cell 3
-200%
-150%
-100%
-50%
0%
50%
100%
-0.3 -0.2 -0.1 0 0.1 0.2 0.3 0.4 0.5 0.6
SRP
mas
s re
mov
al e
ffec
tiven
ess
Change in % EWA
Cell 1
Cell 2
Cell 3

163 | P a g e
Figure 7-12. STA-2: Exceedance probability plot of depths for Cell 1.
Figure 7-13. STA-2: Exceedance probability plot of depths for Cell 2.
0
0.5
1
1.5
2
2.5
3
3.5
4
0% 20% 40% 60% 80% 100%
Dep
th (f
t)
Probability of exceedance
WY2002
WY2003
WY2004
WY2005
WY2006
WY2007
WY2008
0
0.5
1
1.5
2
2.5
3
3.5
4
0% 20% 40% 60% 80% 100%
Dep
th (f
t)
Probability of exceedance
WY2002
WY2003
WY2004
WY2005
WY2006
WY2007
WY2008

164 | P a g e
Figure 7-14. STA-2: Exceedance probability plot of depths for Cell 3.
0
0.5
1
1.5
2
2.5
3
3.5
4
0% 20% 40% 60% 80% 100%
Dep
th (f
t)
Probability of exceedance
WY2002WY2003WY2004WY2005WY2006WY2007WY2008

165 | P a g e
7.5 Hydraulic Residence Time
The median nominal HRT ranged from 13 (Cell 2) to 29 (Cell 1) days in STA-2 treatment cells from May 2002 through April 2008 (Table 14-13 through Table 14-15 in the appendix). The median HRT for Cell 3 was 20 days. Some HRTs are even longer than the 90 days of the averaging period because of low flows during those periods. The range of HRTs included in this analysis is illustrated by the bounds of the x-axes in Figure 7-15 and Figure 7-16.
No correlation (r2 < 0.01) was found between either outflow TP FWMC or TP mass removal effectiveness and three-month average nominal residence time (Figure 7-15 and Figure 7-16). Uncertainties in flow and concentration measurements, errors in estimating HRTs, and stochastic variability in other factors (such as vegetation, soil, etc.) could have affected these results. In particular, some portion of the wetlands may not be involved in the flow due to the presence of stagnant zones; therefore the considerable errors could also be generated during the estimation of nominal HRTs (Guardo, 1999). As stated earlier, the breakdown of the transient data for particular events/ periods would provide better estimate of the nominal HRTs because STA-2 cells were subjected frequent irregularities in regulating inflows. In some cases, there were extremely low flow operations for long periods of time. The estimate of HRTs could potentially be improved by excluding such events when calculating HRTs.

166 | P a g e
Figure 7-15. STA-2: Comparison of three-month rolling average flow-weighted total phosphorus (TP) outflow concentrations (mg/L) with corresponding average nominal hydraulic residence times (HRT; days). Each point represents one cell for three months.
Figure 7-16. STA-2: Comparison of three-month total phosphorus (TP) mass removal effectiveness (%) with corresponding average nominal hydraulic residence times (HRT; days). Only positive percent removal values were considered. Each point represents one cell for three months.
0.00
0.05
0.10
0.15
0 25 50 75 100 125
Out
flow
TP
(mg/
L)
HRT (days)
Cell 1
Cell 2
Cell 3
0
25
50
75
100
0 25 50 75 100 125
TP m
ass
rem
oval
eff
ectiv
enes
s (%
)
HRT (days)
Cell 1
Cell 2
Cell 3

167 | P a g e
7.6 Water Column Chemical Constituents
Cells in STA-2 differentially treated the three P fractions in water column, with SRP most preferentially removed from the TP pool (Figure 7-17 through Figure 7-19). In fact, Cell 3 never experienced a year when SRP contributed a higher fraction to outflow TP than to inflow TP. STA-2 was also consistent in its enrichment of DOP in the TP pool; in every water year, the outflow TP from every cell contained a larger fraction of DOP than the inflow TP pool. In all cells, inflow TP was never less than 40% SRP, while it was never more than 20% DOP. Despite the preferential removal of SRP and enrichment of DOP, SRP still accounted for a larger fraction of outflow TP than did DOP.
Calcium loading was moderate (about 1.5 kg Ca/m2/yr) for Cells 2 and 3, relative to cells in other STAs, but did not influence SRP mass removal effectiveness (Figure 7-20). The low inflow Ca concentration and annual areal Ca loading rate reported for Cell 1 are suspect (Table 7-4) because all three cells receive inflow water from a common distribution canal (Figure 7-1).
Stoichiometrically, Ca availability may not limiting SRP removal in this system, and only a small fraction of the total inflow Ca interacts with P. However, neither annual SRP retention nor mass removal effectiveness were correlated with annual areal Ca retention in STA-2 (Figure 7-21 and Figure 7-22). Generally, in STA-2, unlike some other STAs in this report, annual P removal was independent of annual Ca inputs. Nonetheless, this interaction deserves more investigation, particularly as related to improvement of STA function by manipulating Ca inputs to this STA.
The magnitude of the net Ca flux in all STAs also deserves note; in various years, cells in STA-2 gained as much as 2 kg Ca/m2, based on water chemistry data. However, while no Ca data are available for STA-2, other STAs report soil Ca storages of only several hundred g Ca/m2 in the top 10 cm. Additional Ca storage in floc, biofilms and periphyton may account for this discrepency.
Table 7-4. STA-2: Period-of-record (WY2003 – WY2008) flow-weighted mean concentrations (FWMC; mg/L) and average annual areal loading rates (LR; g/m2/yr) of select non-phosphorus chemicals.
Ca SO4 NOx NO2 NH4
FWMC LR FWMC LR FWMC LR FWMC LR FWMC LR Cell 1 0 1 -- -- 0.69 7.29 -- -- -- -- Cell 2 105 1689 -- -- 0.76 12.17 -- -- -- -- Cell 3 101 1481 -- -- 0.76 11.17 -- -- -- --

168 | P a g e
Figure 7-17. STA-2: Ratio of total phosphorus (TP) that is soluble reactive phosphorus (SRP) for outflow water and inflow water. Points that fall below the 1:1 line indicate preferential removal of SRP from the TP pool. Cell 3 is designated SAV. Each point represents one cell for one water year.
Figure 7-18. STA-2: Ratio of total phosphrous (TP) that is dissolved organic phosphorus (DOP) for outflow water and inflow water. Points that fall above the 1:1 line indicate enrichment of DOP in the TP pool. Cell 3 is designated SAV. Each point represents one cell for one water year.
0%
20%
40%
60%
80%
100%
0% 20% 40% 60% 80% 100%
Out
flow
SRP
Pro
port
ion
of T
P
Inflow SRP Proportion of TP
Cell 1
Cell 2
Cell 3
1:1 Line
0%
10%
20%
30%
40%
50%
0% 10% 20% 30% 40% 50%
Out
flow
DO
P Pr
opor
tion
of T
P
Inflow DOP Proportion of TP
Cell 1
Cell 2
Cell 3
1:1 Line

169 | P a g e
Figure 7-19. STA-2: Ratio of total phosphorus (TP) that is particulate phosphorus (PP) for outflow water and inflow water. Points that fall above the 1:1 line indicate enrichment of PP in the TP pool. Cell 3 is designated SAV. Each point represents one cell for one water year.
Figure 7-20. STA-2: Relationship between annual soluble reactive phosphorus SRP mass removal effectiveness and areal calcium loading rate. Cell 3 is designated SAV. Each point represents one cell for one water year.
0%
20%
40%
60%
80%
100%
0% 20% 40% 60% 80% 100%
Out
flow
PP
Prop
ortio
n of
TP
Inflow PP Proportion of TP
Cell 1
Cell 2
Cell 3
1:1 Line
0%
20%
40%
60%
80%
100%
0 500 1000 1500 2000 2500
SRP
mas
s re
mov
al e
ffec
tiven
ess
Ca Load In (g/m2/yr)
Cell 1
Cell 2
Cell 3

170 | P a g e
Figure 7-21. STA-2: Relationship between annual areal soluble reactive phosphorus (SRP) retention (g SRP/m2/yr) and annual areal calcium retention (g Ca/m2/yr). Each point represents one cell for one water year.
Figure 7-22. STA-2: Relationship between annual soluble reactive phosphorus (SRP) mass removal effectiveness and annual areal calcium retention (g Ca/m2/yr). Each point represents one cell for one water year.
0
0.5
1
1.5
2
0 200 400 600 800 1000
Ann
ual a
real
SRP
ret
entio
n(g
SRP
/m2 /
yr)
Annual areal Ca retention (g Ca/m2/yr)
Cell 1
Cell 2
Cell 3
0
0.2
0.4
0.6
0.8
1
0 200 400 600 800 1000
Ann
ual S
RP r
emov
al e
ffec
tiven
ess
Annual areal Ca retention (g Ca/m2/yr)
Cell 1
Cell 2
Cell 3

171 | P a g e
7.7 Soil Nutrients
7.7.1 Floc and soil physico-chemical properties
STA-2 is divided into four cells, Cells 1 and 2 are EAV while Cells 3 and 4 are designated SAV. Cells 1, 2, and 3 became operational in 2000, whereas Cell 4 became flow capable in Dec 2006. Soil and Water Sciences Department (UF) collected soil samples as a part of research project in year 2000 (WY2001). Samples were collected from 10 sampling locations from all three cells which were operational then. Soils were sampled with an incremental depth of 10 cm and 10-30 cm; however, we used data from only surface soils (0-10 cm) for our analyses. Subsequently, Cells 1, 2 and 3 were sampled in WY2004 and WY2007. Cell 4 was sampled in June 2007, which is in WY2008, but was included in the WY2007 dataset because it was part of a single sampling event.
Floc samples were collected from Cells 1, 2 and 3 from WY2004 and WY2007. There was no floc data for Cell 4 for either sampling event. For this study, the absence of floc data was not assumed to indicate absence of floc in the field. The absence of floc values may be due to either dry conditions and consolidation of floc into the surface soil, or mixing of the floc layer with the soil layer during sampling.
The total numbers of samples collected from STA-2 are shown in Table 7-5. Despite the increase in sampling sites from WY2004 to WY2007 floc samples decreased. This could be a result of localized dry out where the floc may have consolidated within the soil, or mixing of floc with soil fraction. Table 7-6 presents the distribution of floc depths in cells across the two sampling events. Mean floc depth for the STA registered a positive change from WY2004 to WY2007. This increase does not appear to be statistically significant. Cell 2 registered highest increase (from 5.2 cm to 7.7 cm).
The data on mean bulk density of floc and soil from all cells of STA-2 are shown in Table 7-7. Floc bulk density increased slightly from WY2004 to WY2007 from 0.1 ± 0.8 (g/cm3 ± SD) to 0.15 ± 0.04 (g/cm3 ± SD). Cell 1 (EAV) registered high increase in floc bulk density from 0.02 ± 0.01 (g/cm3 ± SD) to 0.12 ± 0.05 (g/cm3 ± SD). This increase is highest across all the cells and could have resulted due to mixing of floc fraction with soils. STA-2 soils showed moderate bulk densities across all cells and registered a slight increase from WY2001 through WY2007. Average bulk density of the soil samples changed from 0.21 ± 0.8 (g/cm3 ± SD) to 0.25 ± 0.8 (g/cm3 ± SD). These values represent high organic content and low mineral content. Soil bulk density for Cell 4 was found highest in comparison to all other cells. It is unlikely that floc was incorporated into the soil in Cell 4, based on elevated bulk density values.
7.7.2 Phosphorus inventory
Data on average TP concentration (mg P/kg) in floc and soils are presented in Table 7-8. It showed a small increase in floc and soils TP concentration from WY2004 to WY2007. Cell 1 registered a slight decrease in floc and soil TP concentration where as all other cells (Cells 2 and 3) showed an increase in TP concentration. Cell 1 recorded an increase in floc bulk density which suggests that some higher density soil fraction with lower TP concentration was incorporated in the floc fraction. On the other hand, the floc in Cell 2 registered an increase in

172 | P a g e
bulk density and also showed increase in TP concentration. This is likely due to mixing of higher bulk density soils in the floc fraction. Surface soil (10 cm) from Cell 1 maintained same bulk density from WY2004 to WY2007, though registered a decrease in TP concentrations which was probably due to migration of TP either to floc layer, or sub surface horizons or uptake by the vegetation.
Figure 7-23 shows change in soil TP concentration in soils of all cells as a function of age of the STA. The mean TP concentration for the STA did not exhibit a large change over the POR, however, Cells 1 and 2 (EAV) have undergone changes in TP concentration over time. Cell 1 TP concentration dropped below the STA-2 mean value while Cell 2 registered an increase over the same time period. Soils from Cell 3 (SAV) recorded a decrease in soil TP concentration but maintained higher values than the STA mean. It may appear that the increase in soil TP was due to higher TP concentration in the inflow water in EAV cells than SAV cells, however, since no relationship was observed between the TP retention in a cell and P loading (mass as well as concentration) it is difficult to conclude that observed results were due to water column phosphorus chemistry. Additionally, Cell 3 (SAV) receives water directly from the inflow canal, and did not undergo prior treatment in an EAV cell. Changes in floc and soil TP concentration for all cells are plotted in Figure 7-24 and Figure 7-25, respectively. Cell 1 (EAV) registered slight decrease in floc TP concentration where as all other cells experienced an increase in TP concentration. Cell 2 (EAV) registered an increase in soil TP concentration from WY2001 values whereas TP concentration decreased in all other cells. No data were available for Cell 4 from earlier years for comparison. Changes in floc and soil TP concentration for the whole STA across the sampling years are presented in Figure 7-26. The mean floc and soil TP concentration for whole STA did not show considerable change over time.
Total soil P storage (SPS) in each cell was calculated per unit area for the top 10 cm of soil and expressed in g P/m2. Where the soil core was shallower or deeper than 10 cm, the SPS values were normalized to 10 cm. The values are shown in Table 7-9. Mean FPS increased considerably over the sampling period, where as the SPS did not show similar changes. Cell 1 and 2 (EAV) recorded high increase in FPS from WY2004 to WY2007. However, the soil showed a slight decrease in P storage over the same period. Cell 3 (SAV) also followed a similar trend where FPS increased and SPS decreased. WY2001 SPS data was considered as background SPS and used for P mass balance analysis.
The time period between WY2005 to WY2007 coincides with hurricanes Frances and Jeanne (WY2005) and hurricane Wilma (WY2006), which may have resulted in the observed decrease in SPS and increase in FPS. It indicated that soil P either fluxed into the floc layer or increased detrital material enhanced P storage in the floc. Figure 7-27 and Figure 7-28 present floc and soil P storages across the cells of STA-2. High P storage in floc in WY2007 in comparison to WY2004 was observed (Figure 7-27). Slight decrease in soil P storages over the sampling period is shown in Figure 7-28. Figure 7-29 presents changes in floc and soil P storages over time for the entire STA-2.
The P mass balance was calculated using the cumulative TP retained from the water column from WY2003 to WY2007 (Table 7-2 ) and the P storage in the floc and surface soil in WY2007. That the soil integrated operating conditions over a longer period than water column data were available for, was a limitation of this exercise. Figure 7-30 shows a schematic depicting mass of
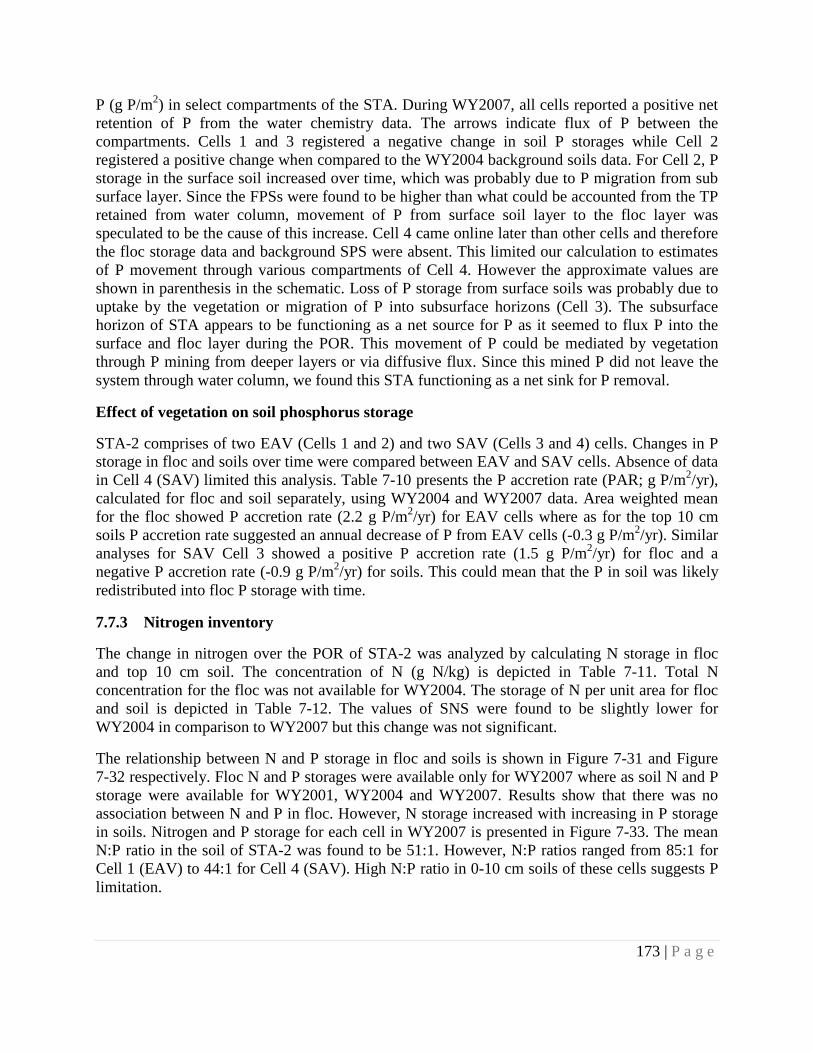
173 | P a g e
P (g P/m2) in select compartments of the STA. During WY2007, all cells reported a positive net retention of P from the water chemistry data. The arrows indicate flux of P between the compartments. Cells 1 and 3 registered a negative change in soil P storages while Cell 2 registered a positive change when compared to the WY2004 background soils data. For Cell 2, P storage in the surface soil increased over time, which was probably due to P migration from sub surface layer. Since the FPSs were found to be higher than what could be accounted from the TP retained from water column, movement of P from surface soil layer to the floc layer was speculated to be the cause of this increase. Cell 4 came online later than other cells and therefore the floc storage data and background SPS were absent. This limited our calculation to estimates of P movement through various compartments of Cell 4. However the approximate values are shown in parenthesis in the schematic. Loss of P storage from surface soils was probably due to uptake by the vegetation or migration of P into subsurface horizons (Cell 3). The subsurface horizon of STA appears to be functioning as a net source for P as it seemed to flux P into the surface and floc layer during the POR. This movement of P could be mediated by vegetation through P mining from deeper layers or via diffusive flux. Since this mined P did not leave the system through water column, we found this STA functioning as a net sink for P removal.
Effect of vegetation on soil phosphorus storage
STA-2 comprises of two EAV (Cells 1 and 2) and two SAV (Cells 3 and 4) cells. Changes in P storage in floc and soils over time were compared between EAV and SAV cells. Absence of data in Cell 4 (SAV) limited this analysis. Table 7-10 presents the P accretion rate (PAR; g P/m2/yr), calculated for floc and soil separately, using WY2004 and WY2007 data. Area weighted mean for the floc showed P accretion rate (2.2 g P/m2/yr) for EAV cells where as for the top 10 cm soils P accretion rate suggested an annual decrease of P from EAV cells (-0.3 g P/m2/yr). Similar analyses for SAV Cell 3 showed a positive P accretion rate (1.5 g P/m2/yr) for floc and a negative P accretion rate (-0.9 g P/m2/yr) for soils. This could mean that the P in soil was likely redistributed into floc P storage with time.
7.7.3 Nitrogen inventory
The change in nitrogen over the POR of STA-2 was analyzed by calculating N storage in floc and top 10 cm soil. The concentration of N (g N/kg) is depicted in Table 7-11. Total N concentration for the floc was not available for WY2004. The storage of N per unit area for floc and soil is depicted in Table 7-12. The values of SNS were found to be slightly lower for WY2004 in comparison to WY2007 but this change was not significant.
The relationship between N and P storage in floc and soils is shown in Figure 7-31 and Figure 7-32 respectively. Floc N and P storages were available only for WY2007 where as soil N and P storage were available for WY2001, WY2004 and WY2007. Results show that there was no association between N and P in floc. However, N storage increased with increasing in P storage in soils. Nitrogen and P storage for each cell in WY2007 is presented in Figure 7-33. The mean N:P ratio in the soil of STA-2 was found to be 51:1. However, N:P ratios ranged from 85:1 for Cell 1 (EAV) to 44:1 for Cell 4 (SAV). High N:P ratio in 0-10 cm soils of these cells suggests P limitation.

174 | P a g e
7.7.4 Carbon inventory
The change in organic matter was estimated over the period of operation of STA by calculating the C storage in floc and soil. The concentration of C (g C/kg) is depicted in Table 7-13 and C storage is shown in Table 7-14. Total C concentration for the floc for WY2004 were not available in the dataset, therefore FPS for that WY could not be calculated. Storage of C followed the same trend as soil P and soil N in all the cells across the sampling period. An increase in average FCS and SCS was found in WY2007.
Data on relationship between P and C storage in floc and soil is shown in Figure 7-34 and Figure 7-35, respectively. This result is based on floc samples from WY2007 and soil samples from WY2001, WY2004 and WY2007. Carbon storage in floc was related to P storage. Approximately 250 g C/m2 was stored per 1 g P/m2 (Figure 7-34). Similarly, 800 g C/m2 was stored in all cells per 1 g P/m2 in soils (Figure 7-35). For both floc and soil, a strong relationship was found between C and N storage. (Figure 7-36 and Figure 7-37), which suggested that all the N and P fractions were either bound in organic forms or are closely associated with the organic matter present in the soil. The source of this closely linked relationship between C and N in the top soils could possibly be the detrital matter arising from similar wetland vegetation
Carbon and P storage for each cell is presented in Figure 7-38. The mean value of C: P ratio for soils was found to be 823:1. The C: P ratios varied from 1283:1 for Cell 1 (EAV) to 660:1 for Cell 4 (SAV). Figure 7-39 depicts C and N storage for each cell. The mean value of C:N ratio for soils was found to be 16:1. The C:N ratios are typical of those observed for microbial/plankton biomass andfor soil organic matter. The existing C and N pools in soils are of crucial importance for maintaining various biogeochemical processes in wetlands. The sum total of these processes determine microbial decomposition rates and control soil formation and long term accretion of nutrients. An adequate balance of these elements plays important role in sequestering P and is critical for ensuring long term sustainability of STAs. This above analysis provided insights into the existing conditions of the STA soils.

175 | P a g e
Table 7-5. STA-2: Number of soil and floc samples collected during WY2001, WY2004 and WY2007
Floc Soil 2004 2007 2001 2004 2007 EAV Cell-1 7 3 3 9 9 Cell-2 23 17 4 23 18 SAV
Cell-3 40 42 3 42 46 Cell-4 -- -- -- -- 42
All cells 70 62 10 74 115 Table 7-6. STA-2 Floc depth (cm; mean ± SD)
2004 2007 EAV
Cell-1 5.7 ± 2.4 6.0 ± 0.8 Cell-2 5.2 ± 2.7 7.7 ± 4.3
SAV Cell-3 5.1 ± 2.2 6.9 ± 3.3 Cell-4 -- -- All cells 5.2 ± 2.4 7.1 ± 3.5
Table 7-7. STA-2 Floc and soil bulk density (g/cm3; mean ± SD) Floc Soil 2004 2007 2001 2004 2007 EAV Cell-1 0.02 ± 0.01 0.12 ± 0.05 0.14 ± 0.02 0.17 ± 0.02 0.17 ± 0.01 Cell-2 0.09 ± 0.06 0.14 ± 0.05 0.2 ± 0.02 0.23 ± 0.04 0.22 ± 0.03 SAV Cell-3 0.11 ± 0.1 0.16 ± 0.04 0.31 ± 0.07 0.24 ± 0.07 0.23 ± 0.05 Cell-4 -- -- -- -- 0.3 ± 0.1 All cells 0.1 ± 0.08 0.15 ± 0.04 0.21 ± 0.08 0.23 ± 0.06 0.25 ± 0.08

176 | P a g e
Table 7-8. STA-2: Floc and soil phosphorus concentration (mg P/kg; mean ± SD) Floc Soil 2004 2007 2001 2004 2007
EAV Cell-1 904 ± 258 764 ± 174 558 ± 115 400 ± 46 355 ± 85 Cell-2 921 ± 280 1044 ± 163 293 ± 63 568 ± 188 555 ± 216
SAV Cell-3 754 ± 463 781 ± 166 722 ± 284 527 ± 148 536 ± 216 Cell-4 -- -- -- -- 577 ± 210
All cells 856 ± 339 870 ± 167 521 ± 157 506 ± 133 511 ± 186 Table 7-9. STA-2: Floc and soil phosphorus storage (g P/m2; mean ± SD)
Floc Soil 2004 2007 2001 2004 2007
EAV Cell-1 1 ± 0.65 6.21 ± 3.7 7.73 ± 0.6 6.71 ± 0.7 6.13 ± 1.73 Cell-2 3.38 ± 2.0 11.09 ± 6.6 5.77 ± 0.8 13.48 ± 5.33 12.45 ± 5.31
SAV Cell-3 3.67 ± 3.4 8.17 ± 4.2 23.67 ± 14.29 15.36 ± 16.97 12.65 ± 5.82 Cell-4 -- -- -- -- 18.36 ± 11.11 All cells 2.81 ± 2.1 8.7 ± 4.9 12.7 ± 5.6 12.2 ± 8.2 12.5 ± 6
Table 7-10. STA-2: Phosphorus accretion rate (PAR; g P/m2/yr) in the soils. Comparison between EAV and SAV cells. Floc not included.*
Floc SPS
Floc PAR g P/m2 yr
Soil SPS
Soil PAR g P/m2 yr
2004 2007 2004 2007 EAV 2.2 -0.3 Cell-1 1 ± 0.65 6.21 ± 3.7 1.7 6.71 ± 0.7 6.13 ± 1.73 -0.2 Cell-2 3.38 ± 2.0 11.09 ± 6.6 2.6 13.48 ± 5.33 12.45 ± 5.31 -0.3 SAV 1.5 -0.9
Cell-3 3.67 ± 3.4 8.17 ± 4.2 1.5 15.36 ± 16.97 12.65 ± 5.82 -0.9 Cell-4 -- -- -- -- 18.36 ± 11.11 --

177 | P a g e
Figure 7-23. STA-2: Variation in soil TP concentration (mg P/kg soil) across the cells as a function of age
Figure 7-24. STA-2: Total phosphorus concentration (mg P/kg soil) in floc each cell. Error bars represent standard error of the mean.
0
100
200
300
400
500
600
700
800
0 1 2 3 4 5 6 7 8 9
TP (m
g P/
kg)
Age (yr)
Cell-1
Cell-2
Cell-3
Cell-4
AVG
0
200
400
600
800
1000
1200
Cell-1 Cell-2 Cell-3
TP (m
g P/
kg)
Floc2004 2007

178 | P a g e
Figure 7-25. STA-2: Total phosphorus concentration (mg P/kg soil) in soil (0-10 cm) for each cell. Error bars represent standard error of the mean.
Figure 7-26. STA-2 Change in phosphorus concentration (mg P/kg) in floc and soil (0-10 cm) with time. Error bars represent standard error of the mean.
0
100
200
300
400
500
600
700
800
900
Cell-1 Cell-2 Cell-3 Cell-4
TP (m
g P/
kg)
Soil (0-10 cm) 2001 2004 2007
0
100
200
300
400
500
600
700
800
900
1000
2001 2004 2007
TP (m
g P/
kg)
Floc Soil

179 | P a g e
Figure 7-27. STA-2 Total phosphorus storage (g P/m2) in floc from the different cells. Error bars represent the standard error of the mean.
Figure 7-28. STA-2: Total phosphorus storage (g P/m2) in soil (0-10) of various cells. Error bars represent the standard error of the mean.
0
2
4
6
8
10
12
14
Cell-1 Cell-2 Cell-3
TP (m
g P/
kg)
Floc 2004 2007
0
5
10
15
20
25
30
35
Cell-1 Cell-2 Cell-3 Cell-4
SPS
(g P
/m2 )
Soil (0-10 cm) 2001 2004 2007

180 | P a g e
Figure 7-29. STA-2 Change over time in phosphorus storage (g P/m2) in floc and soil (0-10 cm). Error bars represent the standard error of the mean.
0
3
6
9
12
15
18
2001 2004 2007
SPS(
g P
/m2)
Floc PS Soil PS

181 | P a g e
Figure 7-30. STA-2: Phosphorus mass balance: soil P storage vis-à-vis net P retained from water quality data. All values are in g P/m2. Top row blue arrows indicate direction of P movement between water and floc. Phosphorus loading for each individaul cells for the whole period of record was not available, however STA mean P loading for the total period of operation is shown. Middle row orange arrows show P movement between floc and surface soil (0-10 cm). Lower row blue arrows indicate P movement between surface (0-10 cm) and sub-surface soil (10-30 cm)

182 | P a g e
Table 7-11. STA-2: Floc and soil nitrogen concentration (g N/kg soil; mean ± SD) STA-2 Floc Soil 2007 2001# 2004 2007
EAV Cell-1 16 ± 1 3 ± 0 29 ± 2 30 ± 3 Cell-2 15 ± 4 3 ± 0 29 ± 2 28 ± 2
SAV Cell-3 10 ± 3 3 ± 0 27 ± 5 28 ± 2 Cell-4 -- -- -- 27 ± 4 All cells 14 ± 3 3 ± 0 28 ± 3 28 ± 2
# The variation in TN concentration is so little that rounding off makes it zero. Table 7-12. STA-2: Floc and soil nitrogen storage (g N/m2 ; mean ± SD) Floc Soil
2007 2001 2004 2007 EAV
Cell-1 124 ± 56 445 ± 64 498 ± 79 518 ± 46 Cell-2 146 ± 95 559 ± 53 662 ± 93 612 ± 79
SAV Cell-3 105 ± 45 778 ± 144 643 ± 170 634 ± 145 Cell-4 -- -- -- 803 ± 220 All cells 125 ± 66 605 ± 89 609 ± 117 642 ± 123

183 | P a g e
Figure 7-31. STA-2: Relationship between floc nitrogen storage (FNS; g N/m2) and floc phosphorus storage (FPS; g P/m2) in WY2007.
Figure 7-32. STA-2: Relationship between soil nitrogen storage (SNS; g N/m2) and soil phosphorus storage (SPS; g P/m2) in top 10 cm soil for all sampling points from WY2001, WY2004 and WY2007.
0
50
100
150
200
250
300
350
400
450
500
0 1 2 3 4 5 6 7
FNS
(g N
/m2 )
FPS (g P/m2)
Floc 2007
0
200
400
600
800
1000
1200
1400
0 20 40 60 80
SNS
(g N
/m2 )
SPS (g P/m2)
Soil (0-10 cm)
2001
2004
2007

184 | P a g e
Figure 7-33. STA-2: Ratio of soil nitrogen storage (SNS; g N/m2) to soil phosphorus storage (SPS; g P/m2) in top 10 cm (WY2007 data only). Filled triangles indicate EAV cells, empty triangles represent SAV cells where as filled square indiates N:P ratio for the whole STA.
Figure 7-34. STA-2: Relationship between floc carbon storage (FCS; g C/m2) and floc phosphorus storage (FPS; g P/m2) in WY2004
STA2
Cell-1
Cell-2
Cell-3
Cell-4
0
100
200
300
400
500
600
700
800
900
0 5 10 15 20
SNS
(g N
/ m
2 )
SPS (g P/m2)
0
3000
6000
9000
0 5 10 15 20 25 30 35
FCS
(g C
/m2 )
FPS (g P/m2)
Floc
2007

185 | P a g e
Figure 7-35. STA-2 Relationship between soil carbon storage (SCS; g C/m2) and soil phosphorus storage (SPS; g P/m2) in top 10 cm soil for all sampling points from WY2001, WY2004 and WY2007.
Figure 7-36: STA-2 Relationship between floc carbon storage (FCS, g C/m2) and floc nitrogen storage (FNS, g N/m2) in WY2007.
0
4000
8000
12000
16000
20000
0 20 40 60 80
SCS
(g C
/m2 )
SPS (g P/m2)
Soil (0-10 cm)2001 2004 2007
0
1000
2000
3000
4000
5000
6000
7000
8000
9000
0 100 200 300 400 500
FCS
(g C
/m2 )
FNS (g N/m2)
Floc
2007

186 | P a g e
Figure 7-37 STA-2 Relationship between soil carbon storage (g C/m2) and soil nitrogen storage (g N/m2) for all sampling points from WY2001, WY2004 and WY2007.
0
2000
4000
6000
8000
10000
12000
14000
16000
18000
20000
0 200 400 600 800 1000 1200 1400
SCS
(g C
/m2 )
SNS (g N/m2)
Soil (0-10 cm )
2001
2004
2007
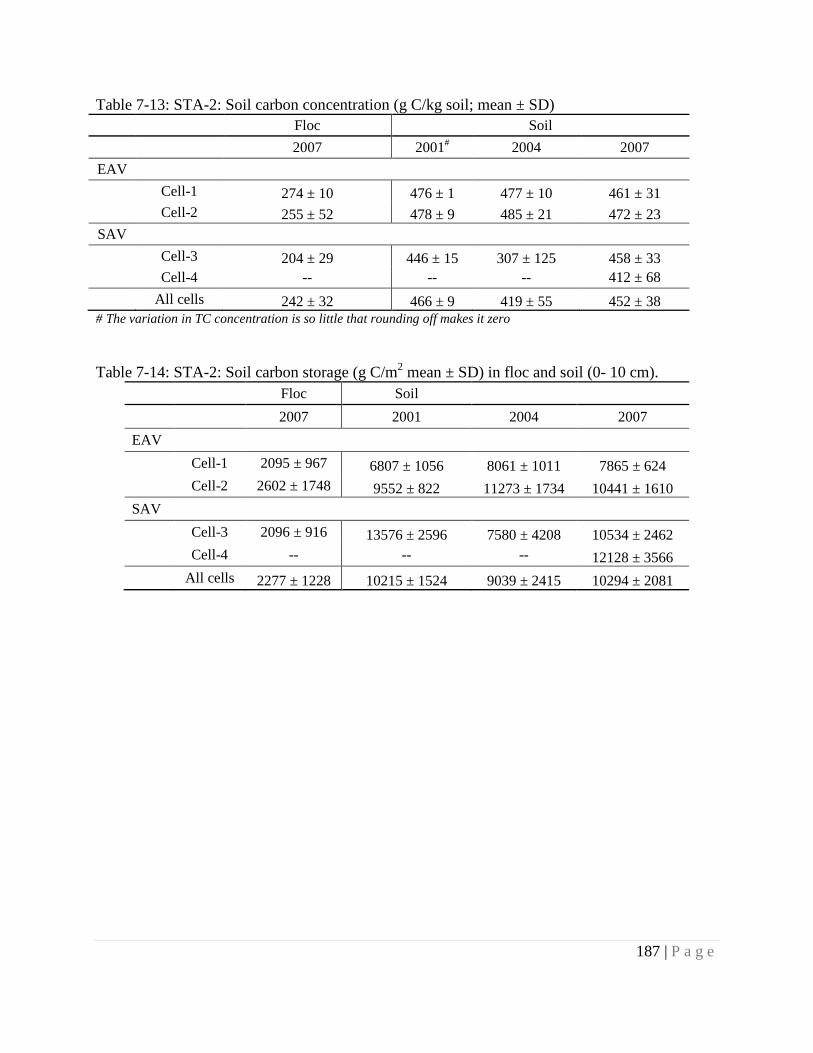
187 | P a g e
Table 7-13: STA-2: Soil carbon concentration (g C/kg soil; mean ± SD) Floc Soil 2007 2001# 2004 2007 EAV
Cell-1 274 ± 10 476 ± 1 477 ± 10 461 ± 31 Cell-2 255 ± 52 478 ± 9 485 ± 21 472 ± 23
SAV Cell-3 204 ± 29 446 ± 15 307 ± 125 458 ± 33
Cell-4 -- -- -- 412 ± 68 All cells 242 ± 32 466 ± 9 419 ± 55 452 ± 38 # The variation in TC concentration is so little that rounding off makes it zero Table 7-14: STA-2: Soil carbon storage (g C/m2 mean ± SD) in floc and soil (0- 10 cm).
Floc Soil 2007 2001 2004 2007 EAV
Cell-1 2095 ± 967 6807 ± 1056 8061 ± 1011 7865 ± 624 Cell-2 2602 ± 1748 9552 ± 822 11273 ± 1734 10441 ± 1610 SAV Cell-3 2096 ± 916 13576 ± 2596 7580 ± 4208 10534 ± 2462 Cell-4 -- -- -- 12128 ± 3566 All cells 2277 ± 1228 10215 ± 1524 9039 ± 2415 10294 ± 2081

188 | P a g e
Figure 7-38: STA-2: Ratio of soil carbon storage (SCS; g C/m2) to soil phosphorus storage (g P/m2) in top 10 cm (WY2007 data only). Filled triangles indicate EAV cells, empty triangles represent SAV cells and filled square indiates C:P ratio for the whole STA.
Figure 7-39: STA-2 Ratio of soil carbon storage (SCS; g C/m2) to soil nitrogen storage (g N/m2) in top 10 cm (WY2007 data only). Filled triangles indicate EAV cells, empty triangles represent SAV cells and filled square indiates C:N ratio for the whole STA.
STA2
Cell-1
Cell-2 Cell-3
Cell-4
0
2000
4000
6000
8000
10000
12000
14000
0 5 10 15 20
SCS
(g C
/ m
2 )
SPS (g P/m2)
STA2
Cell-1
Cell-2
Cell-3
Cell-4
0
2000
4000
6000
8000
10000
12000
14000
0 200 400 600 800 1000
SCS
(g C
/ m
2 )
SNS (g N/m2)

189 | P a g e
7.8 Conclusions
STA-2 was moderately loaded with water and P. Based on year-to-year and POR TP mass removal effectiveness (Cell 1: 89%, Cell 2: 73% and Cell 3: 80%), STA-2 is one of the best performing STAs. TP mass removal effectiveness, as calculated from the TP mass balance did not vary significantly from year to year or cell to cell in this STA.
The analysis of topography and stage data over the POR showed an average of 96%, 93%, and 100% wetted area*time for Cells 1, 2 and 3, respectively. As a result, areal P loading rates calculated directly from the TP mass balance are generally adequate, except possibly in Cell 2 which saw as much as a 7% increase in areal loading rate after adjustment for estimated wetted area*time (EWA). Annual average outflow TP flow-weighted mean concentration (FWMC) was weakly non-linearly correlated with annual average areal TP loading rate, but that relationship was influenced by inflow FWMC.
Annual average depths approached SFWMD target stages. Annual depth distribution was not a predictor of annual TP removal performance.
Neither the three-month average outflow TP FWMC nor the three-month TP mass removal effectiveness was notably correlated with hydraulic residence time.
Each cell in STA-2 treats various water column P forms, soluble reactive phosphorus (SRP), dissolved organic phosphorus (DOP) and particulate phosphorus (PP), similarly. Generally, cells in STA-2 enriched DOP in the TP pool, and preferentially removed SRP from the TP pool. No clear trend is present for PP.
No correlation was found for any relationship between SRP and Ca in STA-2.
The soils of STA-2 have moderate bulk densities suggesting considerable organic matter content. The soil P storage in the soils did not undergo appreciable change during the sampling period however FPS increased.
On comparing EAV and SAV cells, P sequestration was found higher in case of EAV cells. Both EAV and SAV cells showed a positive change in FPS from WY2004 to WY2007, while soil P storage registered negative change. This suggested that the fraction of P lost from soil, might have migrated into the floc layer. Since this mined P did not leave the system through water column, we found this STA functioning as a net sink for P removal.
Floc C and N concentration data were missing for WY2004, which limited efforts to analyze the changes in N and C storage in floc over time.
High N: P ratios in this STA soils suggest P limitation. Soil C and P storage relationship suggested that larger fraction of P was present in organic compartment.
190 | P a g e
8 STORMWATER TREATMENT AREA 3/4 (STA-3/4)
8.1 Introduction
STA-3/4 is the largest of the six STAs, totaling 6695 ha (16543 ac). It is divided into three north-to-south flow-ways of two cells each (Figure 8-1). For most of this analysis, Cells 1A, 1B, 2A, and 2B were considered individually, while the Western Flow-way (Cells 3A and 3B) was taken as one unit (Cell 3) because it was operated as such for the early part of its record. As of 2008, Cells 1A, 1B, 2A and 3A were designated as EAV, and were managed as such. Cells 2B and 3B were designated SAV. SFWMD is in the process of converting Cells 1B and 2B to SAV, but the conversion is not yet complete. STA-3/4 initially received water in WY2004. The Eastern Flow-way operated continuously since operation began, but the Western and Central Flow-ways were occasionally offline for vegetation conversion and Long-Term Plan enhancements construction (Table 8-1). The POR for analyses of water quality included only data collected from WY2006 through WY2008, unless otherwise noted.
The HLR for cells in STA-3/4 was fairly inconsistent from year to year, with the highest hydraulic loading rates in WY2006 in Cells 1A and 2A (25 and 41 m/yr) and in Cells 2A and 2B (27 and 36 m/yr). The average annual HLR for the POR was 20, 20, 17, 12, and 8 m/yr for Cells 1A, 1B, 2A, 2B and 3, respectively. The associated average phosphorus (P) loading rates were 2.13, 1.03, 1.70, 0.71, and 0.52 g P/m2/yr, after adjustment for EWA. Period-of-record average hydraulic residence times were 18, 28 and 21 days for the Eastern, Central and Western Flow-ways, respectively.

191 | P a g e
Figure 8-1. STA-3/4: Schematic showing plan view of cells and water control structures. (Source: Pietro et al., 2008).

192 | P a g e
8.2 Operational Timeline
Table 8-1. STA-3/4: Abbreviated operational timeline.
2004 2005 WY2004 WY2005 WY2006
Jan Feb Mar Apr May Jun Jul Aug Sep Oct Nov Dec Jan Feb Mar Apr May Jun Jul Aug Sep Oct Nov Dec
Hurricanes Frances and
Jeanne Hurricane
Wilma
Eastern and Western Flow-ways operational All Flow-
ways operational
Eastern and Central Flow-ways operational All Flow-ways operational (Cell 3 restricted flow/stage)
Central Flow-way offline for vegetation conversion
Western Flow-way offline for LTP enhancements construction
Western Flow-way rehydrated, partial operation for plant re-establishment
2006 2007 2008 WY2006 WY2007 WY2008
Jan
Feb
Mar
Apr
May
Jun
Jul
Aug
Sep
Oct
Nov
Dec
Jan
Feb
Mar
Apr
May
Jun
Jul
Aug
Sep
Oct
Nov
Dec
Jan
Feb
Mar
Apr
Eastern and Central Flow-way operational All Flow-ways operational
All flow-ways operational
Under Drought Contingency operations
All Flow-ways operational. Target stage increased 15 cm in SAV cells (Cells 1B, 2B & 3B) in Sept. Same in WY2007
Western Flow-way offline for LTP enhancements
construction

193 | P a g e
8.3 Water and Phosphorus Budgets
The annual water and P budgets for each cell of STA-3/4 have been calculated previously by SFWMD (Table 8-2 and Table 8-3; Pietro et al., 2009). Annual hydraulic loading rates were moderate relative to other STAs (6-20 m/yr, POR annual average). In fact, Cell 3 received the lowest POR hydraulic load (8 m/yr) among all STA cells. In Cells 1A through 2B, HLR was highest in WY2006, which was likely because of the drought in WY2007 and WY2008. Hydraulic loading rate was uncorrelated with TP mass removal effectiveness in all cells in STA-3/4, but the large water budget residuals contributed uncertainty to the relationship. It appears that most of the errors were generated by the stations along the levee between Cells 1A and 1B and between Cells 2A and 2B, and more accurate information may be gleaned from the combination of the cell-wise data into flow-way figures.
Both annual P mass loads and mass removal effectiveness were highly variable with time. Evaluation of TP mass removal effectiveness with respect to annual P mass loading rate was difficult because of the large water budget residuals. For example, Cell 1A was reported to have removed 97% of the inflow TP in WY2007. However, the water budget based on inflow and outflow data, showed that 187 hm3 of water were unaccounted for, artificially removing unknown tons of P from the mass balance.

194 | P a g e
Table 8-2. STA-3/4: Annual water budgets (hm3). Pietro et al., 2009. Is Ig Ip ΣInflow HLR Os Og ET ΣOutflow ΔS r ε
Cell 1A WY2006 284 0 16.9 300.9 25 548.8 0 16.5 565.4 -8.6 255.9 59.10% WY2007 207.1 0 12.8 219.9 18 19.5 0 16.4 35.9 -3.1 -187 -146% WY2008 155.5 0 14.4 169.9 15 223.5 0 16.6 240.1 6.4 76.6 37.40%
POR 646.6 0 44.2 690.8 59 791.9 0 49.5 841.4 -5.2 145.4 19.00% %In 93.60% 0.00% 6.40% %Out 94.10% 0.00% 5.90% -0.80%
Cell 1B WY2006 548.6 0 19.4 568 41 467.2 0 19 486.1 -10.1 -91.9 -17.40% WY2007 22.2 0 14.7 36.9 3 189.6 0 18.8 208.4 3.9 175.4 143.00% WY2008 223.5 0 16.6 240.1 17 158.7 0 19 177.7 3.7 -58.7 -28.10%
POR 794.3 0 50.7 845 60 815.5 0 56.8 872.3 -2.5 24.7 2.90% %In 94.00% 0.00% 6.00% %Out 93.50% 0.00% 6.50% -0.30%
Cell 2A WY2006 261.7 0 14.1 275.9 27 399.6 0 13.8 413.5 -4.8 132.8 38.50% WY2007 121.8 0 10.7 132.6 13 49.3 0 13.7 63 -3.2 -72.8 -74.50% WY2008 98.1 0 12.1 110.1 11 -79 0 13.9 -65.1 5.8 -169.5 -753%
POR 481.6 0 37 518.6 51 369.9 0 41.4 411.3 -2.2 -109.5 -23.50% %In 92.90% 0.00% 7.10% %Out 89.90% 0.00% 10.10% -0.40%
Cell 2B WY2006 399.6 0 16.1 415.7 36 323.5 0 15.7 339.3 -1.7 -78.2 -20.70% WY2007 49.3 0 12.2 61.5 5 147.7 0 15.6 163.3 -2.1 99.7 88.70% WY2008 -79 0 13.8 -65.3 -6 94 0 15.8 109.8 3.9 179 803.80%
POR 369.9 0 42.1 412 35 565.3 0 47.2 612.4 0.2 200.6 39.20% %In 89.80% 0.00% 10.20% %Out 92.30% 0.00% 7.70% <0.1%
Cell 3 WY2006 94.6 0 25.5 120.1 7 117.7 0 24.9 142.6 -3.7 18.8 14.30% WY2007 102.2 0 19.4 121.6 7 101.1 0 24.7 125.8 -0.2 4 3.20% WY2008 151 0 21.8 172.8 9 112.6 0 25 137.6 7 -28.2 -18.10%
POR 347.9 0 66.6 414.4 23 331.4 0 74.6 406 3.1 -5.4 -1.30% %In 83.90% 0.00% 16.10% %Out 81.60% 0.00% 18.40% 0.70%
Is = surface water inflow; Ig = groundwater inflow; IP = precipitation; HRL = hydraulic loading rate; Os = surface water outflow; Og = groundwater outflow; ET = evapotranspiration; ∆S = change in storage volume; r = water budget residual; ε = water budget error

195 | P a g e
Table 8-3. STA-3/4: Annual total phosphorus mass balance (mt). Pietro et al., 2009.
Isp Ipp ∑Inflow Osp Ogp ∑Outflow Retained % Ret Cell 1A WY2006 35.7 0.068 35.767 33.199 0 33.199 2.569 7.20% WY2007 28.233 0.051 28.284 0.861 0 0.861 27.423 97.00% WY2008 14.137 0.058 14.195 9.046 0 9.046 5.148 36.30% TOTAL 78.07 0.177 78.246 43.106 0 43.106 35.14 44.90% %In 99.77% 0.23% %Out 100.00% 0.00% Cell 1B WY2006 33.188 0.078 33.266 11.909 0 11.909 21.357 64.20% WY2007 0.959 0.059 1.018 4.299 0 4.299 -3.281 -322.20% WY2008 9.046 0.066 9.113 3.107 0 3.107 6.006 65.90% TOTAL 43.194 0.203 43.397 19.314 0 19.314 24.083 55.50% %In 99.53% 0.47% %Out 100.00% 0.00% Cell 2A WY2006 33.974 0.057 34.03 24.156 0 24.156 9.874 29.00% WY2007 13.262 0.043 13.305 1.124 0 1.124 12.181 91.60% WY2008 5.176 0.048 5.225 -0.999 0 -0.999 6.223 119.10% TOTAL 52.412 0.148 52.559 24.281 0 24.281 28.278 53.80% %In 99.72% 0.28% %Out 100.00% 0.00% Cell 2B WY2006 24.392 0.064 24.456 8.088 0 8.088 16.368 66.90% WY2007 1.499 0.049 1.548 3.282 0 3.282 -1.734 -112.10% WY2008 -1.174 0.055 -1.119 2.14 0 2.14 -3.259 291.30% TOTAL 24.717 0.168 24.885 13.511 0 13.511 11.374 45.70% %In 99.32% 0.68% %Out 100.00% 0.00% Cell 3 WY2006 9.072 0.102 9.174 2.562 0 2.562 6.612 72.10% WY2007 11.509 0.077 11.586 2.584 0 2.584 9.002 77.70% WY2008 8.449 0.087 8.536 1.981 0 1.981 6.555 76.80% TOTAL 29.029 0.266 29.296 7.127 0 7.127 22.169 75.70% %In 99.09% 0.91% %Out 100.00% 0.00% Isp = surface water inflow; Igp = groundwater inflow; Ipp = precipitation; Osp = surface water outflow; Ogp = groundwater outflow

196 | P a g e
8.4 Elevation Distribution, Wetted Area and Depth
STA-3/4 has an average ground elevation of about 9.5 ft NGVD (Figure 8-2). The elevation ranges found in cells in this STA were relatively small (≤1 ft) compared to cells in other STAs (Figure 8-3 through Figure 8-8). In most cells, the POR mean stage was one or more standard deviations above the maximum elevation within the cell, indicating consistently flooded conditions. Neither the shape nor the range of the elevation distributions predicted the TP mass removal effectiveness for STA-3/4 cells.
Cells in STA-3/4 generally operated at or near 100% EWA over the three-year POR (Figure 8-9). As in other STAs, some cells in STA-3/4 experienced seasonal partial dry down in May (Figure 8-10). In contrast to other STAs, Cell 3B tended to dry down earlier in the year (January, February and March).
STA-3/4 received areal TP loads comparable to other STAs (Table 8-4). Only values that have been adjusted for EWA are shown, as the correction never increased the loading rate by more than 3% or 0.04 g P/m2/yr. Annual outflow TP FWMC was moderately correlated (r2=0.64) with annual areal TP loading rate (Figure 8-11). Inflow TP FWMC explains some of the scatter about the regression line; for points with similar loading rates, the point with higher outflow FWMC tended to have the higher inflow FWMC. Water years were divided into “low” and “high” inflow TP FWMC categories by dividing the range of the data into equal halves. “Low” corresponds to annual inflow TP FWMC ≤ 0.075 mg/L; and “High,” TP FWMC > 0.075 mg/L. The relationship holds only when all cells are taken together; the correlation is much weaker within cells.
No correlation was found between monthly SRP mass removal effectiveness and monthly average EWA. The expected relationship may have been obscured by the consistently high EWA. Similarly, monthly SRP mass removal effectiveness was independent of the change in EWA with respect to the previous month (Figure 8-12). That is, the reflooding process did not a flux of SRP large enough to influence the monthly SRP mass removal effectiveness.
Depth analysis
Annual curves of probability of depth exceedance were similar across cells and time in STA-3/4 (Figure 8-13 through Figure 8-18). Non-cumulative depth distributions may be found in Table 14-4 in the appendix. Most cells had significant portions of their area*time submerged within a half foot or so of the target stage in most water years, but POR TP mass removal effectiveness was only about 50% for cells in the Eastern and Central Flow-ways and about 75% for the Western Flow-way. Shape and distribution of curves did not predict annual or long term P removal performance.

197 | P a g e
Figure 8-2. STA-3/4: Topographic map.

198 | P a g e
Figure 8-3. STA-3/4: Elevation cumulative distribution function for Cell 1A. Vertical lines represent period-of-record (WY2006-WY2008) mean stage ± 1SD.
Figure 8-4. STA-3/4: Elevation cumulative distribution function for Cell 1B. Vertical lines represent period-of-record (WY2006-WY2008) mean stage ± 1SD.
0%
20%
40%
60%
80%
100%
8 9 10 11 12 13
Cum
ulat
ive
elev
atio
n di
stri
butio
n
Feet of elevation NGVD
0%
20%
40%
60%
80%
100%
8 9 10 11 12 13
Cum
ulat
ive
elev
atio
n di
stri
butio
n
Feet of elevation NGVD
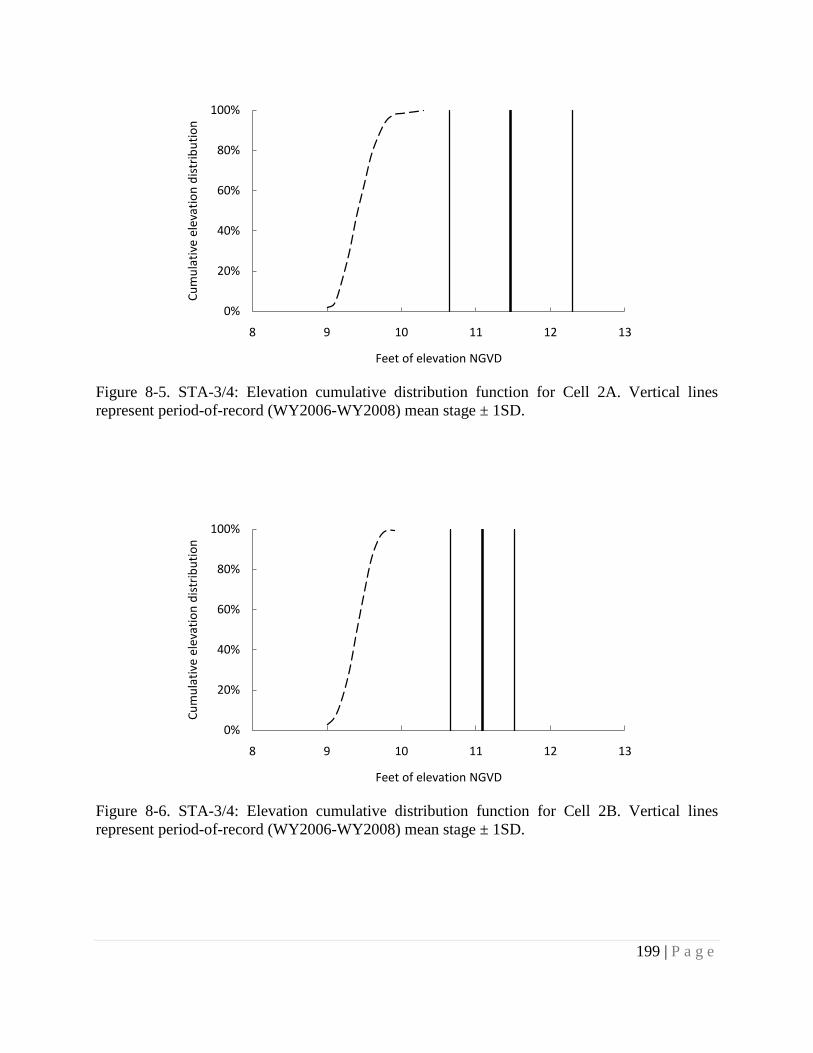
199 | P a g e
Figure 8-5. STA-3/4: Elevation cumulative distribution function for Cell 2A. Vertical lines represent period-of-record (WY2006-WY2008) mean stage ± 1SD.
Figure 8-6. STA-3/4: Elevation cumulative distribution function for Cell 2B. Vertical lines represent period-of-record (WY2006-WY2008) mean stage ± 1SD.
0%
20%
40%
60%
80%
100%
8 9 10 11 12 13
Cum
ulat
ive
elev
atio
n di
stri
butio
n
Feet of elevation NGVD
0%
20%
40%
60%
80%
100%
8 9 10 11 12 13
Cum
ulat
ive
elev
atio
n di
stri
butio
n
Feet of elevation NGVD

200 | P a g e
Figure 8-7. STA-3/4: Elevation cumulative distribution function for Cell 3A. Vertical lines represent period-of-record (WY2006-WY2008) mean stage ± 1SD.
Figure 8-8. STA-3/4: Elevation cumulative distribution function for Cell 3B. Vertical lines represent period-of-record (WY2006-WY2008) mean stage ± 1SD.
0%
20%
40%
60%
80%
100%
8 9 10 11 12 13
Cum
ulat
ive
elev
atio
n di
stri
butio
n
Feet of elevation NGVD
0%
20%
40%
60%
80%
100%
8 9 10 11 12 13
Cum
ulat
ive
elev
atio
n di
stri
butio
n
Feet of elevation NGVD

201 | P a g e
Table 8-4. STA-3/4: Annual areal total phosphorus (TP loading ratesa (g P/m2/yr) Water Year Cell 1A Cell 1B Cell 2A Cell 2B Cell 3
2006 2.92 2.38 3.32 2.09 0.49 2007 2.30 0.07 1.29 0.13 0.62 2008 1.19 0.64 0.50 -0.10 0.46
aValues shown have been adjusted for EWA.
Figure 8-9. STA-3/4: Inter-annual average estimated wetted area*time.
0%
20%
40%
60%
80%
100%
Estim
ated
wet
ted
area
*tim
e
Cell 1A Cell 1B
Cell 2A Cell 2B
Cell 3A Cell 3B

202 | P a g e
Figure 8-10. STA-3/4: Intra-annual estimated wetted area*time for each cell.
Figure 8-11. STA-3/4: Relationship between outflow total phosphorus flow-weighted mean concentration (TP FWMC; mg P/L) and annual areal TP loading rate (LR; g/m2/yr). “Low” corresponds to annual inflow TP FWMC ≤ 0.075 mg/L; “High,” TP FWMC > 0.075 mg/L. Each point represents one cell for one water year.
0%
20%
40%
60%
80%
100%
Estim
ated
wet
ted
area
*tim
e
Cell 1A Cell 1B
Cell 2A Cell 2B
Cell 3A Cell 3B
R² = 0.6432
0
0.01
0.02
0.03
0.04
0.05
0.06
0.07
0 0.5 1 1.5 2 2.5 3 3.5
Ann
ual o
utflo
w T
P FW
MC
(mg/
L)
Annual areal TP loading rate (g P/m2/yr)
Cell 1ACell 1BCell 2ACell 2BCell 3HighLow

203 | P a g e
Figure 8-12. STA-3/4: Relationship between soluble reactive phosphorus (SRP) mass removal effectiveness and change in percentage wetted area. Each point represents one cell for one month. No SRP data available for Cell 1A, 2B and 3.
Figure 8-13. STA-3/4: Exceedance probability plot of depths for Cell 1A.
-200%
-150%
-100%
-50%
0%
50%
100%
-0.15 -0.1 -0.05 0 0.05 0.1 0.15
SRP
mas
s re
mov
al e
ffec
tiven
ess
Change in % EWA
Cell 1B
Cell 2A
0
0.5
1
1.5
2
2.5
3
3.5
4
0% 20% 40% 60% 80% 100%
Dep
th (f
t)
Probability of exceedance
WY2006
WY2007
WY2008

204 | P a g e
Figure 8-14. STA-3/4: Exceedance probability plot of depths for Cell 1B.
Figure 8-15. STA-3/4: Exceedance probability plot of depths for Cell 2A.
0
0.5
1
1.5
2
2.5
3
3.5
4
0% 20% 40% 60% 80% 100%
Dep
th (f
t)
Probability of exceedance
WY2006
WY2007
WY2008
0
0.5
1
1.5
2
2.5
3
3.5
4
0% 20% 40% 60% 80% 100%
Dep
th (f
t)
Probability of exceedance
WY2006
WY2007
WY2008

205 | P a g e
Figure 8-16. STA-3/4: Exceedance probability plot of depths for Cell 2B.
Figure 8-17. STA-3/4: Exceedance probability plot of depths for Cell 3A.
0
0.5
1
1.5
2
2.5
3
3.5
4
0% 20% 40% 60% 80% 100%
Dep
th (f
t)
Probability of exceedance
WY2006
WY2007
WY2008
0
0.5
1
1.5
2
2.5
3
3.5
4
0% 20% 40% 60% 80% 100%
Dep
th (f
t)
Probability of exceedance
WY2006
WY2007
WY2008

206 | P a g e
Figure 8-18. STA-3/4: Exceedance probability plot of depths for Cell 3B.
0
0.5
1
1.5
2
2.5
3
3.5
4
0% 20% 40% 60% 80% 100%
Dep
th (f
t)
Probability of exceedance
WY2006
WY2007
WY2008

207 | P a g e
8.5 Hydraulic Residence Time
All treatment cells in STA-3/4 had median three-month average HRTs of 26 d, though they varied from 9 to 878 d (Table 14-16 through Table 14-18 in the appendix). Taken by flow-way, the median HRTs were 25 d (Eastern Flow-way), 29 d (Central Flow-way) and 45 d (Western Flow-way). The range of HRTs included in this study is illustrated by the bounds of the x-axis in Figure 8-19.
No correlation was found between outflow TP FWMC and three-month HRT (Figure 8-19). As mentioned earlier, uncertainties in flow and concentration measurements, errors in estimating HRTs, and stochastic variability in other factors (such as vegetation, soil etc.) could have affected these STA-3/4 HRT values. In particular, some portion of the wetlands may not be involved in the flow due to the presence of stagnant zones; therefore the considerable errors could be generated during the estimation of nominal HRTs (Guardo, 1999). Additionally, STA-3/4 tended to contribute DOP to the TP pool (Chimney, 2008) and it is possible that production of this recalcitrant fraction increased with increasing HRT.
Nominal HRTs could be better estimated by breaking down the transient data over any specific period or events. Because of extremely low flow operation in some three-month periods, HRTs values tended to be unreasonably high. Also, the estimates of nominal HRTs in STA-3/4 could be significantly reduced by considering longer period average (such as yearly average) because this will reduce the uncertainty of the measured data. Results suggest that the short period (three-month) is not suitable to estimate nominal HRTs from the given data of STA-3/4.
Figure 8-19. STA-3/4: Comparison of three-month rolling average flow-weighted total phosphorus (TP) outflow concentrations (mg/L) with corresponding average nominal hydraulic residence times (HRT; days) in the STA-3/4, Eastern, Central and Western Flow-ways.
0.00
0.02
0.04
0.06
0.08
0.10
0 25 50 75 100 125
Out
flow
TP
FWM
C (m
g/L)
HRT (days)
EFW
CFW
WFW

208 | P a g e
8.6 Water Column Chemical Constituents
Cells in STA-3/4 slightly differentially treated the three fractions of water column TP (Figure 8-20 through Figure 8-22). STA-3/4 was consistent only in enriching DOP in the TP pool. SRP tended to be preferentially removed and the proportion of PP remained approximately the same from inflow to outflow. Inflow and outflow TP tended to be dominated by PP (ca. 50% in and out). Phosphorus mass removal effectiveness was not determined by the proportion of inflow P species.
Calcium loading was moderate (between 0.6 and 2 kg Ca/m2/yr POR average) for cells in STA-3/4 (Table 8-5), but did not influence SRP mass removal effectiveness (Figure 8-23). Cells 1B and 2B likely received lower inflow Ca FWMC because of Ca retention in upstream cells (Cells 1A and 2A).
Stoichiometrically, Ca availability may not limiting SRP removal in this system, and only a small fraction of inflow Ca interacts with P. However, annual areal TP retention was positively correlated with annual areal Ca retention in STA-3/4 (Figure 8-24). Further investigation is required to address the possibility of manipulating Ca inputs to regulate P retention in STAs.
The magnitude of the net Ca flux in all STAs also deserves note; in various years, STA-3/4 cells have gained or lost as much as 1.5 kg Ca/m2, based on water chemistry data. These fluxes conflict with the value of 1.5 kg Ca/m2 reported for the top 10 cm of STA-3/4 soils in WY2005. Additional Ca storage in floc, biofilms and periphyton may account for this discrepency.
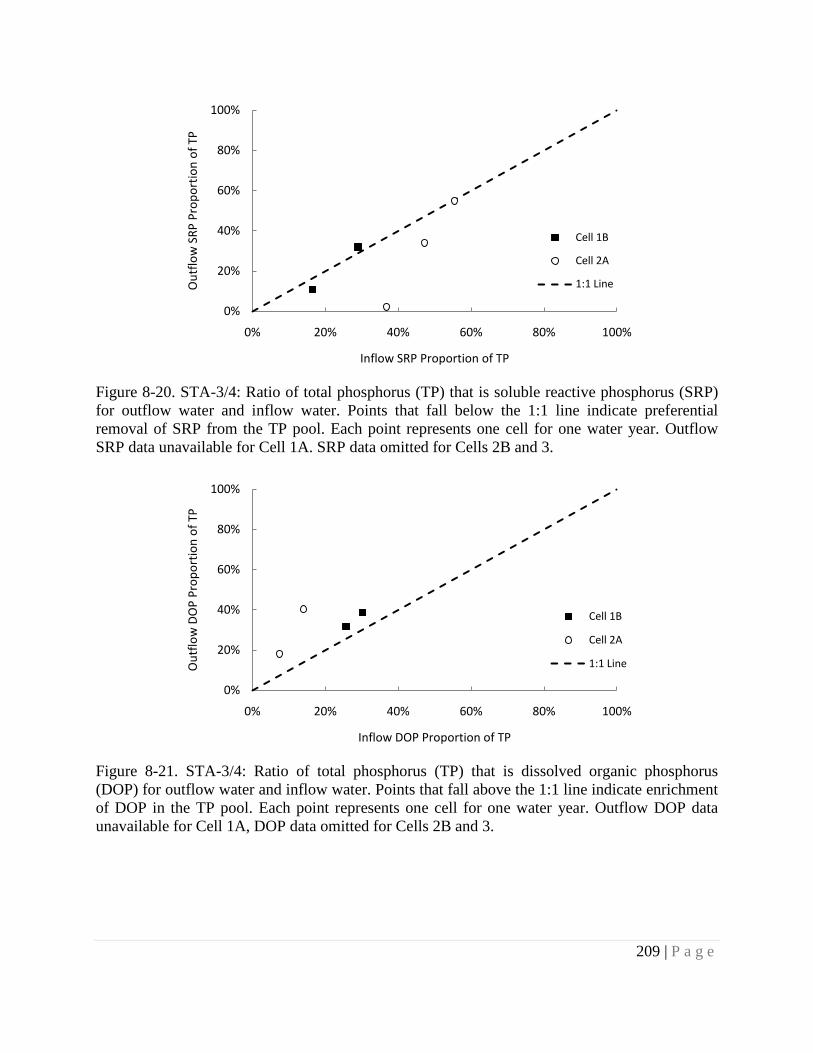
209 | P a g e
Figure 8-20. STA-3/4: Ratio of total phosphorus (TP) that is soluble reactive phosphorus (SRP) for outflow water and inflow water. Points that fall below the 1:1 line indicate preferential removal of SRP from the TP pool. Each point represents one cell for one water year. Outflow SRP data unavailable for Cell 1A. SRP data omitted for Cells 2B and 3.
Figure 8-21. STA-3/4: Ratio of total phosphorus (TP) that is dissolved organic phosphorus (DOP) for outflow water and inflow water. Points that fall above the 1:1 line indicate enrichment of DOP in the TP pool. Each point represents one cell for one water year. Outflow DOP data unavailable for Cell 1A, DOP data omitted for Cells 2B and 3.
0%
20%
40%
60%
80%
100%
0% 20% 40% 60% 80% 100%
Out
flow
SRP
Pro
port
ion
of T
P
Inflow SRP Proportion of TP
Cell 1B
Cell 2A
1:1 Line
0%
20%
40%
60%
80%
100%
0% 20% 40% 60% 80% 100%
Out
flow
DO
P Pr
opor
tion
of T
P
Inflow DOP Proportion of TP
Cell 1B
Cell 2A
1:1 Line

210 | P a g e
Figure 8-22. STA-3/4: Ratio of total phosphorus (TP) that is particulate phosphorus (PP) for outflow water and inflow water. Points that fall above the 1:1 line indicate enrichment of PP in the TP pool. Each point represents one cell for one water year. PP data omitted for Cells 2B and 3. Table 8-5. STA-3/4: POR flow-weighted mean concentrations (FWMC; mg/L) and average annual areal loading rates (LR; g/m2/yr) of selected non-phosphorus chemicals.
Ca SO4 NOx NO2 NH4
FWMC LR FWMC LR FWMC LR FWMC LR FWMC LR Cell 1A 110 2007 -- -- 0.94 17.07 -- -- -- -- Cell 1B 95 1783 -- -- 0.11 6.44 -- -- -- -- Cell 2A 103 1592 -- -- 1.81 84.24 -- -- -- -- Cell 2B 93 954 -- -- 0.10 2.99 -- -- -- -- Cell 3 109 695 -- -- 1.62 31.14 -- -- -- --
0%
20%
40%
60%
80%
100%
0% 20% 40% 60% 80% 100%
Out
flow
PP
Prop
ortio
n of
TP
Inflow PP Proportion of TP
Cell 1A
Cell 1B
Cell 2A
1:1 Line

211 | P a g e
Figure 8-23. STA-3/4: Relationship between annual soluble reactive phosphorus (SRP) mass removal effectiveness and areal calcium loading rate. Outflow SRP data unavailable for Cell 1A. SRP data omitted for Cells 2B and 3. Each point represents one cell for one water year.
Figure 8-24. STA-3/4: Annual areal total phosphorus (TP) mass retention (g/m2/yr) against annual areal calcium retention (g/m2/yr). Each point represents one cell for one water year.
0%
50%
100%
0 1000 2000 3000 4000
SRP
mas
s re
mov
al e
ffec
tiven
ess
Ca Load In (g/m2/yr)
Cell 1B
Cell 2A
-1
0
1
2
3
-2000 -1500 -1000 -500 0 500 1000 1500 2000
Ann
ual a
real
TP
rete
ntio
n (g
TP/
m2 /
yr)
Annual areal Ca retention (g Ca/m2/yr)
Cell 1A
Cell 1B
Cell 2A
Cell 2B
Cell 3

212 | P a g e
8.7 Soil Nutrients
8.7.1 Floc and soil physico-chemical properties
STA-3/4 became operational in WY2004. This STA comprises of four EAV cells (1A, 1B, 2A and 3A) and two SAV cells (2B and 3B). Data on floc samples were available only for WY2007. Soil samples were collected in WY2005 and WY2007 (Table 8-6). A single floc sample was available from Cell 1B but it was not used for calculating the STA mean since one sample could not be considered as a correct representative of the cell. However, the values for various parameters (P concentration, storages, etc.) were reported in the respective tables. The small amount of floc data collected in Cells 3A and 3B posed limitations for adequate mass balance analysis. For other cells too, number of floc samples was not sufficiently large to calculate accurate mass balance. However, an estimated P mass balance was attempted with the available dataset. The importance of floc as an effective sink for P cannot be overstated because it could potentially serve as key indicator of system performance; therefore its measurement is crucial for proper accounting of soil nutrients. The absence of floc data was not assumed to indicate absence of floc in the field. The absent floc values may have resulted either due to dry conditions and consolidation of floc into the surface soil, or due to mixing of floc layer into soil layer during sampling. Table 8-7 presents depth and bulk density of the floc in cells of STA-3/4. Average floc depth was found to be 7.25 ± 3.73 cm (mean ± SD). Floc depth varied between EAV and SAV cells however, floc bulk density did not change across the two vegetation types. Data on soil represented 0-10 cm depth. Average bulk density of soil samples for WY2007 for the entire STA was found to be 0.27 ± 0.09 (g/cm3 ± SD) which was significantly different from the WY2005 average value of 0.34 ± 0.1 (g/cm3 ± SD) (Table 8-8). The mean bulk density of soils for STA-3/4 indicated high organic content in the soils. Slight decrease in soil bulk density value from WY2005 suggested the possibility of incorporation of recently accreted material in soils fraction. This decrease was observed for every cell of the STA.
8.7.2 Phosphorus inventory
Data on average TP concentration (mg P/kg) in floc and soils are shown in Table 8-9. Floc TP values were found higher than the soil values in WY2007 for all cells. The range of floc and soil TP values across different cells was found to be small. Soils TP concentration decreased from WY2005 to WY2007, however this difference was not statistically significant. This decrease in TP concentration from 0-10 cm soil was probably due to mining of P by vegetation. Figure 8-25 presents the variation in soil (top 10 cm) TP concentration as a function of age for all cells in this STA. Over time, the mean TP concentration for the STA decreased. This temporal decrease in TP concentration was found for each cell. Cell 3A experienced larger decrease in TP concentration in comparison to other cells. (Possibly due to long term plan enhancements which resulted in conversion of Cell 3B into a SAV cell and Cell 3A was offline for some period of time) Data on P concentration (mg P/kg soil) in each cell for floc and surface soil are shown in Figure 8-26 and Figure 8-27 respectively. Changes in total P concentration in floc and soil in all cells are shown in Figure 8-28.
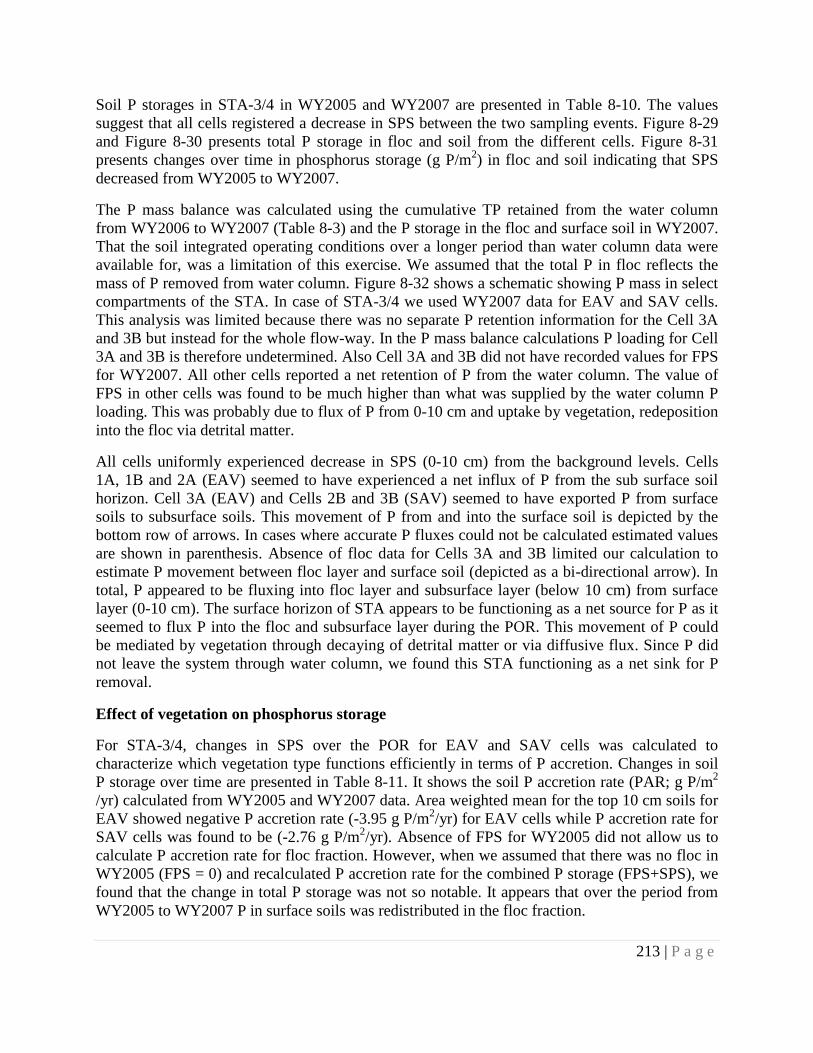
213 | P a g e
Soil P storages in STA-3/4 in WY2005 and WY2007 are presented in Table 8-10. The values suggest that all cells registered a decrease in SPS between the two sampling events. Figure 8-29 and Figure 8-30 presents total P storage in floc and soil from the different cells. Figure 8-31 presents changes over time in phosphorus storage (g P/m2) in floc and soil indicating that SPS decreased from WY2005 to WY2007.
The P mass balance was calculated using the cumulative TP retained from the water column from WY2006 to WY2007 (Table 8-3) and the P storage in the floc and surface soil in WY2007. That the soil integrated operating conditions over a longer period than water column data were available for, was a limitation of this exercise. We assumed that the total P in floc reflects the mass of P removed from water column. Figure 8-32 shows a schematic showing P mass in select compartments of the STA. In case of STA-3/4 we used WY2007 data for EAV and SAV cells. This analysis was limited because there was no separate P retention information for the Cell 3A and 3B but instead for the whole flow-way. In the P mass balance calculations P loading for Cell 3A and 3B is therefore undetermined. Also Cell 3A and 3B did not have recorded values for FPS for WY2007. All other cells reported a net retention of P from the water column. The value of FPS in other cells was found to be much higher than what was supplied by the water column P loading. This was probably due to flux of P from 0-10 cm and uptake by vegetation, redeposition into the floc via detrital matter.
All cells uniformly experienced decrease in SPS (0-10 cm) from the background levels. Cells 1A, 1B and 2A (EAV) seemed to have experienced a net influx of P from the sub surface soil horizon. Cell 3A (EAV) and Cells 2B and 3B (SAV) seemed to have exported P from surface soils to subsurface soils. This movement of P from and into the surface soil is depicted by the bottom row of arrows. In cases where accurate P fluxes could not be calculated estimated values are shown in parenthesis. Absence of floc data for Cells 3A and 3B limited our calculation to estimate P movement between floc layer and surface soil (depicted as a bi-directional arrow). In total, P appeared to be fluxing into floc layer and subsurface layer (below 10 cm) from surface layer (0-10 cm). The surface horizon of STA appears to be functioning as a net source for P as it seemed to flux P into the floc and subsurface layer during the POR. This movement of P could be mediated by vegetation through decaying of detrital matter or via diffusive flux. Since P did not leave the system through water column, we found this STA functioning as a net sink for P removal.
Effect of vegetation on phosphorus storage
For STA-3/4, changes in SPS over the POR for EAV and SAV cells was calculated to characterize which vegetation type functions efficiently in terms of P accretion. Changes in soil P storage over time are presented in Table 8-11. It shows the soil P accretion rate (PAR; g P/m2 /yr) calculated from WY2005 and WY2007 data. Area weighted mean for the top 10 cm soils for EAV showed negative P accretion rate (-3.95 g P/m2/yr) for EAV cells while P accretion rate for SAV cells was found to be (-2.76 g P/m2/yr). Absence of FPS for WY2005 did not allow us to calculate P accretion rate for floc fraction. However, when we assumed that there was no floc in WY2005 (FPS = 0) and recalculated P accretion rate for the combined P storage (FPS+SPS), we found that the change in total P storage was not so notable. It appears that over the period from WY2005 to WY2007 P in surface soils was redistributed in the floc fraction.

214 | P a g e
8.7.3 Nitrogen inventory
The change in N over the period of operation of STA-3/4 was analyzed by calculating the floc and soil N storage (SNS). The concentration of N (g N/kg) is depicted in Table 8-12. The FNS and SNS per unit area are depicted in Table 8-13. Floc values were not present from WY2005 to provide comparison across time. The SNS decreased from WY2005 to WY2007. This decrease was observed for soils of each cell of the STA.
The relationship between N and P storage in floc and soils is shown in Figure 8-33 and Figure 8-34 respectively. Floc N storages were positively related to floc P storage for WY2007 data from the sampling points in Cells 1A, 1B, 2A and 2B. Also, soil N storages showed positive relationship with soil P storage for both WY2005 and WY2007 data from all cells of the STA. Approximately 16 g N/m2 was stored per 1g P/m2 in floc fraction. Linear relationship between N and P storage suggest that P stored primarily in organic form. Low N: P ratios in the floc suggest no P limitation, as these ratios are similar to the suggested value of Redfield ratio (16:1).
Soil N and P storage for each cell is presented in Figure 8-35. Mean value of N:P ratios for soils were found to be 40: 1. The range of N:P varied from 37:1 (Cell 2A) to 44:1 (Cell 1B). Soils N: P ratio for WY2005 was 36:1, which indicated an increase overt time. High N:P ratio (30 to 40) in 0-10 cm soils suggests P limitation.
8.7.4 Carbon inventory
The change in organic matter was estimated over the period of operation for this STA by calculating the C storage in floc and soil. Since only WY2005 data was present for floc, across time comparisons were not possible where as WY2005 and WY2007 datasets were used for SCS comparison over time. The concentration of C (g C/kg) is shown in Table 8-14 and the C storage is presented in Table 8-15. Storage of C in soil followed the same trend as soil P and soil N in all the cells across the sampling period. Data on relationship between P and C storage in floc and soil is shown in Figure 8-36 and Figure 8-37 respectively. Floc C storage and FPS for WY2007 showed a fair positive relationship (Figure 8-36). Approximately 250 g C/m2 was stored per 1g P/m2 in floc fraction for WY2007. The relationship between SCS and SPS for WY2005 and WY2007 suggested approximately 550 g C/m2 stored per 1g P/m2 in soils (Figure 8-37). Strong relationship was observed between C and N storage in floc and soil samples (Figure 8-38 and Figure 8-39). This suggested that all the N and P fractions are either bound in organic forms or are closely associated with the organic matter present in the soil. The source of this closely linked C and N in the top soils could possibly be the detrital matter arising from the wetland vegetation. Carbon and P storage in soils for each cell for WY2007 is presented in Figure 8-40. The mean value of C: P ratios for soils increased from 544:1 in WY2005 to 603:1 in WY2007. In WY2007 C: P ratios varied from 535:1 for Cell 2A to 674:1 for Cell 1B (both EAV). Figure 8-41 depicts Carbon and N storage in soils for each cell from WY2007. The mean value of C: N ratio for soils was found to be 15:1 for WY2007. The C: N ratio in floc and soils are in the range of 10 to 15. These ratios are typical of those observed for microbial/plankton biomass and for soil organic matter. The existing C and N pools in soils are of crucial importance for maintaining various

215 | P a g e
biogeochemical processes in wetlands. The sum total of these processes determine microbial decomposition rates and control soil formation and long term accretion of nutrients. An adequate balance of these elements plays important role in sequestering P and is critical for ensuring long term sustainability of STAs. This above analysis provided insights into the existing conditions of the STA soils.

216 | P a g e
Table 8-6. STA-3/4: Number of floc and soil samples collected during WY2005 and WY2007 Floc Soil 2007 2005 2007
EAV Cell-1A 4 74 64 Cell-1B 1* 75 43 Cell-2A 7 60 47 Cell-3A -- 39 24
SAV Cell-2B 16 59 60 Cell-3B -- 16 51 All cells 28 323 289
* Only one floc sample is recorded for cell 1B for the WY2007. It has not been included in the subsequent analysis
Table 8-7. STA-3/4: Floc depth (cm; mean ± SD), bulk density (g/cm3; mean ± SD) in WY2007 and area of each cell (ha).
Area (ha) Floc depth (cm) Floc bulk density EAV (g/cm3)
Cell-1A 1230 8.25 ± 5.54 0.1 ± 0.02 Cell-1B 1411 4 ± 0* 0.13 ± 0* Cell-2A 1028 8.43 ± 3.11 0.13 ± 0.06 Cell-3A 871 -- --
SAV Cell-2B 1171 6.69 ± 3.25 0.1 ± 0.03 Cell-3B 982 -- -- All cells 6693 7.25 ± 3.73 0.11 ± 0.04
* Only one floc sample is recorded for cell 1B therefore SD equals to zero.
Table 8-8. STA-3/4: Soil bulk density (g/cm3; mean ± SD) from WY2005 and WY2007 Soil 2005 2007
EAV Cell-1A 0.34 ± 0.12 0.27 ± 0.09 Cell-1B 0.29 ± 0.1 0.24 ± 0.11 Cell-2A 0.34 ± 0.09 0.25 ± 0.08 Cell-3A 0.39 ± 0.06 0.3 ± 0.08
SAV Cell-2B 0.4 ± 0.1 0.32 ± 0.1 Cell-3B 0.26 ± 0.07 0.22 ± 0.05 All cells 0.34 ± 0.1 0.27 ± 0.09
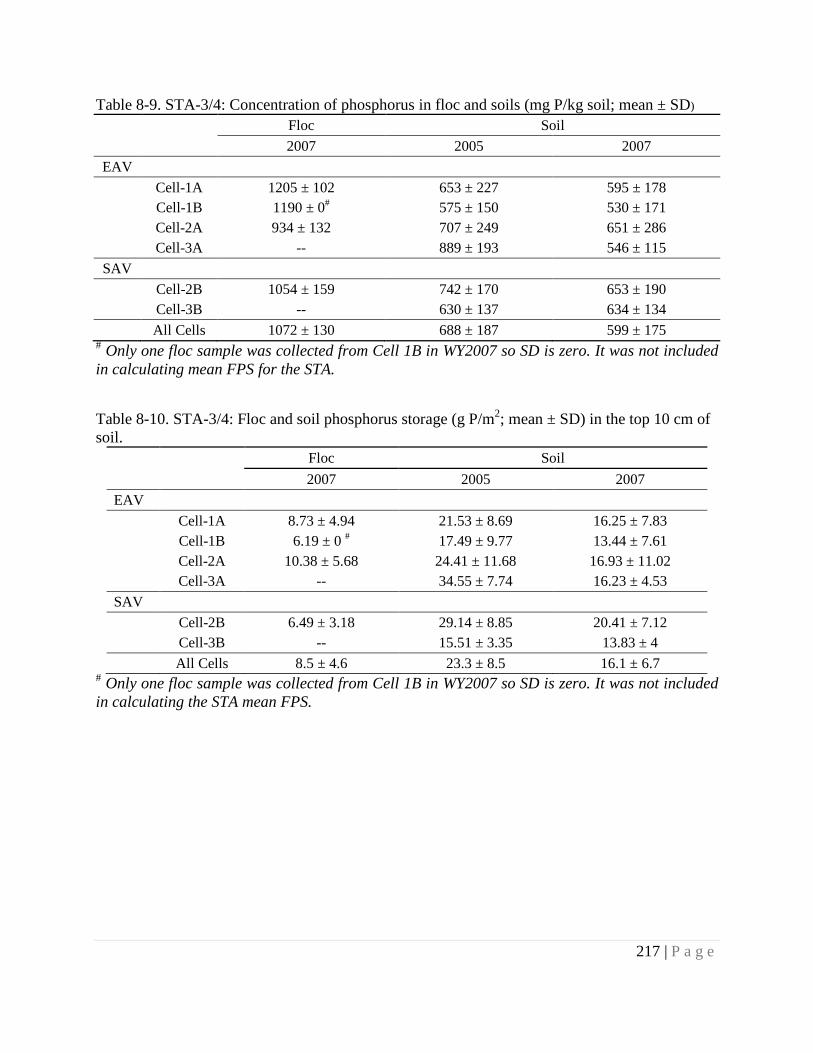
217 | P a g e
Table 8-9. STA-3/4: Concentration of phosphorus in floc and soils (mg P/kg soil; mean ± SD) Floc Soil 2007 2005 2007
EAV Cell-1A 1205 ± 102 653 ± 227 595 ± 178 Cell-1B 1190 ± 0# 575 ± 150 530 ± 171 Cell-2A 934 ± 132 707 ± 249 651 ± 286 Cell-3A -- 889 ± 193 546 ± 115
SAV Cell-2B 1054 ± 159 742 ± 170 653 ± 190 Cell-3B -- 630 ± 137 634 ± 134 All Cells 1072 ± 130 688 ± 187 599 ± 175
# Only one floc sample was collected from Cell 1B in WY2007 so SD is zero. It was not included in calculating mean FPS for the STA.
Table 8-10. STA-3/4: Floc and soil phosphorus storage (g P/m2; mean ± SD) in the top 10 cm of soil.
Floc Soil 2007 2005 2007 EAV Cell-1A 8.73 ± 4.94 21.53 ± 8.69 16.25 ± 7.83 Cell-1B 6.19 ± 0 # 17.49 ± 9.77 13.44 ± 7.61 Cell-2A 10.38 ± 5.68 24.41 ± 11.68 16.93 ± 11.02 Cell-3A -- 34.55 ± 7.74 16.23 ± 4.53 SAV Cell-2B 6.49 ± 3.18 29.14 ± 8.85 20.41 ± 7.12 Cell-3B -- 15.51 ± 3.35 13.83 ± 4 All Cells 8.5 ± 4.6 23.3 ± 8.5 16.1 ± 6.7
# Only one floc sample was collected from Cell 1B in WY2007 so SD is zero. It was not included in calculating the STA mean FPS.

218 | P a g e
Table 8-11. STA-3/4: Phosphorus accretion rate (PAR; g P/m2/yr) in the soils. Comparison between EAV and SAV cells.
2005 SPS
2007 SPS
PAR g P/m2 yr
EAV -3.95 Cell-1A 21.53 ± 8.69 16.25 ± 7.83 -2.64 Cell-1B 17.49 ± 9.77 13.44 ± 7.61 -2.03 Cell-2A 24.41 ± 11.68 16.93 ± 11.02 -3.74 Cell-3A 34.55 ± 7.74 16.23 ± 4.53 -9.16
SAV -2.76 Cell-2B 29.14 ± 8.85 20.41 ± 7.12 -4.37 Cell-3B 15.51 ± 3.35 13.83 ± 4 -0.84
* Limited floc samples were recorded for only WY2007and so change in FPS over time was not possible.

219 | P a g e
Figure 8-25. STA-3/4: Variation in soil TP concentration (mg P/kg soil) of all cells as a function of age.
Figure 8-26. STA-3/4: Total phosphorus concentration (mg P/kg soil) in floc samples collected from each cell. Error bars represent standard error of the mean.
500
550
600
650
700
750
800
850
900
950
0 1 2 3 4 5
TP (m
g P/
kg)
Age (yr)
Avg
Cell-1A
Cell-1B
Cell-2A
Cell-3A
Cell-2B
Cell-3B
0
200
400
600
800
1000
1200
1400
Cell-1A Cell-1B Cell-2A Cell-3A Cell-2B Cell-3B
TP (m
g P/
kg)
Floc
2007

220 | P a g e
Figure 8-27. STA-3/4: Total phosphorus concentration (mg P/kg soil) in soil (0-10 cm) in each cell. Error bars represent standard error of the mean.
Figure 8-28. STA-3/4: Change in total phosphorus concentration (mg P/kg soil) in floc and soil (0-10 cm) with time. Error bars represent standard error of the mean.
0
200
400
600
800
1000
1200
1400
Cell-1A Cell-1B Cell-2A Cell-3A Cell-2B Cell-3B
TP (m
g P/
kg)
Soil (0-10 cm) 2005 2007
0
200
400
600
800
1000
1200
2005 2007
TP (m
g P/
kg)
Floc Soil

221 | P a g e
Figure 8-29. STA-3/4 Floc phosphorus storage (g P/m2) for different cells. Error bars represent the standard error of the mean. (Floc samples not available for Cells 3A and 3B)
Figure 8-30. STA-3/4: Soil phosphorus storage (g P/m2) for various cells. Error bars represent the standard error of the mean.
0
2
4
6
8
10
12
14
Cell-1A Cell-1B Cell-2A Cell-3A Cell-2B Cell-3B
SPS
(g P
/m
2 )
Floc 2007
0
5
10
15
20
25
30
35
40
Cell-1A Cell-1B Cell-2A Cell-3A Cell-2B Cell-3B
SPS
(g P
/m
2 )
Soil (0-10 cm) 2005 2007

222 | P a g e
Figure 8-31. STA-3/4: Change over time in soil phosphorus storage (SPS; g P/m2) in floc and soil (0-10 cm). Error bars represent the standard error of the mean.
0
3
6
9
12
15
18
21
24
27
2005 2007
SPS
(g P
/ m
2 )
Floc Soil

223 | P a g e
Figure 8-32. STA-3/4: Phosphorus mass balance: soil P storage vis-à-vis net P retained from water quality data. All values are in g P/m2. Arrows indicate flux of P between compartements. Top row arrows indicate direction of P movement between water and floc. Phosphorus loading for each individaul cells for the whole period of record was not available, however STA mean P loading for the total period of operation is shown. Middle row arrows show P movement between floc and surface soil (0-10 cm). Lower row arrows indicate P movement between surface (0-10 cm) and sub-surface soil (10-30 cm).

224 | P a g e
Table 8-12. STA-3/4: Soil nitrogen concentration TN (g N/kg soil; mean ± SD) Floc Soil
2007 2005 2007 EAV
Cell-1A 17 ± 1 25 ± 6 25 ± 5 Cell-1B 23 ± 0 * 26 ± 4 25 ± 5 Cell-2A 16 ± 3 24 ± 5 26 ± 5 Cell-3A -- 27 ± 7 24 ± 5
SAV Cell-2B 21 ± 3 26 ± 5 26 ± 5 Cell-3B -- 26 ± 6 26 ± 4 All cells 18 ± 2 26 ± 5 25 ± 5
* Only one floc sample was recorded and is not included in this table. Table 8-13. STA-3/4: Soil nitrogen storage (SNS; g N/m2; mean ± SD) in floc and soil (0-10 cm).
Floc Soil 2007 2005 2007 EAV
Cell-1A 123 ± 71 784 ± 170 640 ± 167 Cell-1B 117 ± 0* 740 ± 214 588 ± 221 Cell-2A 173 ± 87 814 ± 167 618 ± 144 Cell-3A -- 1038 ± 210 701 ± 109
SAV Cell-2B 128 ± 61 1013 ± 188 789 ± 199 Cell-3B -- 646 ± 117 547 ± 108
All cells 139 ± 72 832 ± 179 646 ± 178 * Only one floc sample was recorded and is not included in this table.

225 | P a g e
Table 8-14. STA-3/4: Total carbon concentration (TC; g C/kg; mean ± SD) in floc and soil (0-10 cm).
Floc Soil 2007 2005 2007
EAV Cell-1A 253 ± 4 381 ± 96 382 ± 77 Cell-1B 326 ± 0* 410 ± 78 395 ± 81 Cell-2A 257 ± 25 360 ± 75 374 ± 78 Cell-3A -- 415 ± 108 348 ± 71
SAV Cell-2B 314 ± 39 405 ± 70 406 ± 81
Cell-3B -- 383 ± 92 368 ± 68 All cells 275 ± 22 391 ± 85 381 ± 79
* Only one floc sample was recorded and is not included in this table.
Table 8-15. STA-3/4: Soil carbon storage (SCS, g C/m2; mean ± SD) Floc Soil 2007 2005 2007 EAV
Cell-1A 1882 ± 1138 12254 ± 2753 9794 ± 2699 Cell-1B 1695 ± 0* 11490 ± 3374 9061 ± 3303 Cell-2A 2796 ± 1454 11995 ± 2529 9061 ± 2370 Cell-3A -- 15970 ± 3319 10094 ± 1509
SAV Cell-2B 1907 ± 892 15589 ± 2728 12249 ± 2930
Cell-3B -- 9315 ± 1890 7843 ± 1491 All cells 2164 ± 1148 12689 ± 2792 9709 ± 2655
* Only one floc sample was recorded and is not included in this table.

226 | P a g e
Figure 8-33. STA-3/4: Relationship between floc nitrogen storage (FNS; g N/m2) and floc phosphorus storage (FPS; g P/m2) for WY2007.
Figure 8-34. STA-3/4: Relationship between soil nitrogen storage (SNS; g N/m2) and soil phosphorus storage (SPS; g P/m2) for WY2005 and WY2007.
0
50
100
150
200
250
300
350
0 5 10 15 20
FNS
(g N
/m2 )
FPS (g P/m2)
Floc 2007
0
500
1000
1500
2000
2500
0 10 20 30 40 50 60 70 80
SNS
(g N
/m2 )
SPS (g P/m2)
Soil (0-10 cm ) 2005 2007

227 | P a g e
Figure 8-35. STA-3/4: Ratio of soil nitrogen storage (SNS; g N/m2) to soil phosphorus storage (SPS; g P/m2; WY2007 data only). Filled triangles indicate EAV cells, empty triangles represent SAV cells and filled square indiates N:P ratio for the whole STA.
Figure 8-36. STA-3/4: Relationship between floc carbon storage (FCS; g C/m2) and floc phosphorus storage (FPS; g P/m2) for WY2007 sampling locations.
STA-3/4Cell-1A
Cell-1BCell-2A
Cell-3A
Cell-2B
Cell-3B
500
550
600
650
700
750
800
850
11 13 15 17 19 21
SNS
(g N
/ m
2 )
SPS (g P/m2)
0
1000
2000
3000
4000
5000
0 5 10 15 20
FCS
(g C
/m2 )
FPS (g P/m2)
Floc
2007

228 | P a g e
Figure 8-37. STA-3/4: Relationship between soil carbon storage (SCS; g C/m2) and soil phosphorus storage (SPS; g P/m2) for all sampling locations (WY2005 and WY2007).
Figure 8-38. STA-3/4: Relationship between floc carbon storage (g C/m2) and floc nitrogen storage (g N/m2) for WY2007.
0
5000
10000
15000
20000
25000
30000
35000
0 20 40 60 80
SCS
(g C
/m2 )
SPS (g P/m2)
Soil (0-10 cm) 2005 2007
0
500
1000
1500
2000
2500
3000
3500
4000
4500
5000
0 50 100 150 200 250 300 350
FCS
(g C
/m2 )
FNS (g N/m2)
Floc
2007

229 | P a g e
Figure 8-39. STA-3/4 Relationship between soil carbon storage (g C/m2) and soil nitrogen storage (g N/m2) for all sampling points for WY2005 and WY2007.
Figure 8-40. STA-3/4 :Ratio of soil carbon storage (SCS; g C/m2) to soil phosphorus storage (g P/m2; WY2007 data only). Filled triangles indicate EAV cells, empty triangles represent SAV cells and filled square indiates C:P ratio for the whole STA.
0
5000
10000
15000
20000
25000
30000
35000
0 500 1000 1500
SCS
(g C
/m2 )
SNS (g N/m2)
Soil (0-10 cm ) 2005 2007
STA-3/4
Cell-1A
Cell-1B Cell-2A
Cell-3A
Cell-2B
Cell-3B
6000
7000
8000
9000
10000
11000
12000
13000
11 13 15 17 19 21
SCS
(g C
/ m
2 )
SPS (g P/m2)

230 | P a g e
Figure 8-41. STA-3/4 :Ratio of soil carbon storage (SCS; g C/m2) to soil nitrogen storage (g N/m2; WY2007 data only). Filled triangles indicate EAV cells, empty triangles represent SAV cells and filled square indiates C:N ratio for the whole STA.
STA-3/4
Cell-1A
Cell-1B Cell-2A
Cell-3A
Cell-2B
Cell-3B
6000
7000
8000
9000
10000
11000
12000
13000
500 550 600 650 700 750 800 850
SCS
(g C
/ m
2 )
SNS (g N/m2)

231 | P a g e
8.8 Conclusions
STA-3/4, the largest STA, was moderately loaded with water and P. Based on year-to-year and POR TP mass removal effectiveness (Cell 1A: 45%, Cell 1B: 55%, Cell 2A: 55%, Cell 2B: 45% and Cell 3: 75%), STA-3/4 was a moderately performing STA. TP mass removal effectiveness, as calculated from the TP mass balance varied significantly from year to year within cells, as did hydraulic and P loading.
The analysis of topography and stage data over the POR showed greater than 96% wetted area*time in all cells. As a result, areal P loading rates calculated directly from the TP mass balance were generally adequate. Annual average outflow TP flow-weighted mean concentration (FWMC) was linearly correlated (r2 = 0.64) with annual areal TP loading rate, and inflow TP FWMC was shown to contribute to the scatter.
Annual average depths approached SFWMD target stages. Dry outs and extreme depths were not common, though small portions (up to 10%) of Cells 1A and 2A occasionally experienced depths greater than 4 ft. An evaluation of the frequency and duration of these events could be used to assess the impacts of high stages on the EAV in these cells. Annual depth distribution was not a predictor of annual TP removal performance.
Outflow TP FWMC was slightly positively correlated with HRT, which was not expected.
Despite limited data, it appeared that each cell in STA-3/4 treated various water column P forms (SRP, DOP and PP), similarly. Generally, cells in STA-3/4 enriched DOP in the TP pool, preferentially remove SRP from the TP pool and no clear trend was evident for PP.
Though annual SRP mass removal effectiveness was independent of annual areal Ca loading rate, annual areal TP retention was related to annual areal Ca retention. Possibly, Ca and P were retained jointly via a single process (presumably co-precipitation of P with the precipitation of Ca) in this STA.
The soils of STA-3/4 have relatively higher bulk densities suggesting high mineral fractions than organic matter. The soil P storage was found to be high during the first sampling event.
EAV and SAV cells both registered decrease in soil P storage, however, the rate of P loss per year was higher in case of SAV cells in comparison to EAV cells. High N: P ratios suggest that the soils are not N limited. Most of the P seems to be found associated with the organic fraction.
Phosphorus mass balance indicated that in some cells P moved from subsurface horizon to surface and to floc layer, however it did not leave the system through water column. This suggested that STA was functioning as a net sink for P removal.
Relationship between N and P storage showed that P is stored primarily in organic form. High N/P ratios in the soil suggested P limitation. Relationship between C and P storage showed approximately 300 g C/m2 was stored per 1g P/m2 in floc fraction, whereas 500 g C/m2 was stored per 1g P/m2 in soils.

232 | P a g e
9 STORMWATER TREATMENT AREA 5 (STA-5)
9.1 Introduction
STA-5 totals 2465 ha (6095 ac). It is divided into three west-to-east flow-ways of two cells each (Figure 9-1). The Southern Flow-way (Cells 3A and 3B), an area of 800 ha (1985 ac) was excluded from this study because data were unavailable. When possible, Cells 1A, 1B, 2A, and 2B were considered individually, but in many cases data were only available for whole flow-ways. As of 2008, Cells 1A and 2A were designated as EAV and are managed as such. Cells 1B and 2B were designated SAV, though the conversion of Cell 2B to SAV occurred in WY2007. STA-5 initially received water in WY1999. The POR for analyses of water quality included only data collected from WY2001 through WY2008, unless otherwise noted. Both the Northern Flow-way and the Central Flow-way were occasionally offline for vegetation conversion and Long Term Plan enhancements construction (Table 9-1).
The HLR for cells in STA-5 was relatively consistent from year to year. The average annual HLRs were 16 and 13 m/yr for Northern and Central Flow-ways, respectively. The associated average TP loading rates were 2.25 and 2.20 g P/m2/yr, after adjustment for EWA. POR average hydraulic residence times were 13 and 15 days for Northern and Central Flow-ways, respectively.

233 | P a g e
Figure 9-1. STA-5: Schematic showing plan view of cells and water control structures. (Source: Pietro et al., 2008)
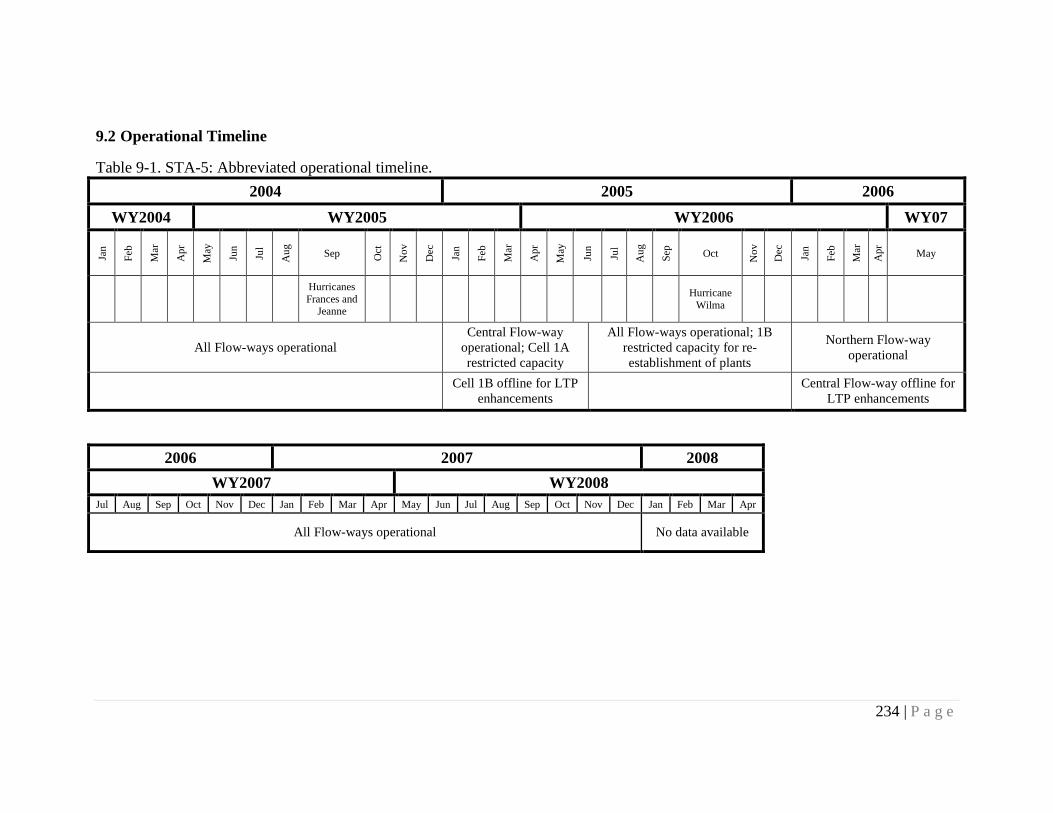
234 | P a g e
9.2 Operational Timeline
Table 9-1. STA-5: Abbreviated operational timeline. 2004 2005 2006
WY2004 WY2005 WY2006 WY07
Jan
Feb
Mar
Apr
May
Jun
Jul
Aug
Sep Oct
Nov
Dec
Jan
Feb
Mar
Apr
May
Jun
Jul
Aug
Sep Oct N
ov
Dec
Jan
Feb
Mar
Apr
May
Hurricanes Frances and
Jeanne Hurricane
Wilma
All Flow-ways operational Central Flow-way
operational; Cell 1A restricted capacity
All Flow-ways operational; 1B restricted capacity for re-establishment of plants
Northern Flow-way operational
Cell 1B offline for LTP
enhancements Central Flow-way offline for
LTP enhancements
2006 2007 2008 WY2007 WY2008
Jul Aug Sep Oct Nov Dec Jan Feb Mar Apr May Jun Jul Aug Sep Oct Nov Dec Jan Feb Mar Apr
All Flow-ways operational No data available

235 | P a g e
9.3 Water and Phosphorus Budgets
The annual water budgets for cells and flow-ways in all STAs, including each flow-way of STA-5, have been calculated previously by SFWMD (Pietro et al., 2009). Juston and DeBusk (2006) reported that long-term flow data are likely to be accurate within ~±15%. However, a number of the SFWMD yearly budgets had an error exceeding ±100% (e.g. 113% for STA-1W, WY2002). To identify the source of this error, the annual water budgets were recalculated for STA-5 for each water year from WY2001 to WY2008.
Our yearly water budgets for each flow-way in STA-5 for water years 2001 through 2008 are compared to water budgets provided by the SFWMD in Table 9-2 through Table 9-5. Data were available for partial water years preceding and following this date range, but computations were limited to these eight years to provide comparison to SFWMD computations. While the sum of the residuals and the average annual error for the eight years was forced to 0, there was still high error for some individual years. For example, in the Central Flow-way errors observed for the WY2005 and WY2007 were 35.5% and -52.4%, respectively. Net seepage [Q = Ig – Og from Equation ( 4-1 )] was considered groundwater inflow at times when the head difference between the water in the STA and the water in the boundary canals was negative. This situation was not observed in Northern Flow-way and only infrequently in the Central Flow-way.
The primary source of errors in the water budgets was likely inaccurate estimation of groundwater flows, though surface water measurement errors may contribute as well. An independent measure of groundwater and bank flow may relieve some of the calculated error.
The annual water budgets for STA-5 show that both flow-ways operated at fairly steady hydraulic loadings (after WY2001) until the drought of WY2007-WY2008. Hydraulic loading rate was not correlated with TP mass removal effectiveness; STA-5 was similarly effective at removing TP mass in water year, with both large and small volumetric water loads.
Annual mass balances for flow-ways in STA-5 have been prepared previously by SFWMD (Table 9-7 and Table 9-9; Pietro et al., 2009). However, as part of the investigation of the large residuals in the water budget, the TP mass balances for the Northern Flow-way and the Central Flow-way of STA-5 were calculated as part of this study.
Our yearly TP mass balances for each flow-way in STA-5 for water years 2001 through 2008 are given in Table 9-6 and Table 9-8. Despite the slight differences in the groundwater flow in the water budgets, our TP mass balances are similar to those supplied by SFWMD. Our results indicate that between the period of WY2001 and WY2008 the Northern Flow-way retained 55 mt TP (41% of the total inflow load), and the Central Flow-way retained 70 mt TP (50%). SFWMD estimated that the TP retention in the Northern Flow-way was 58 mt TP (42% of inflow load), and 75 mt TP (53%) in the Central Flow-way. As with the water budgets, the relative magnitudes and general trends from water year to water year for the mass removal effectiveness were similar in both sets of balances. As stated previously, precipitation inputs of TP (Ipp) were assumed to be 0 due to their relative insignificance in the TP mass balance. Also, groundwater was estimated to provide minimal TP loading (Northern Flow-way: 0.0%, Central Flow-way: 0.15%), principally because the volume of groundwater entering STA-5 was estimated to be minimal.

236 | P a g e
From the overall similarity between both sets of water and P budgets, flow and P mass data calculated by SFWMD staff were deemed sufficient to achieve the objectives of this study.
Though TP loads were roughly correlated between the Northern Flow-way and the Central Flow-way from year to year, the annual values for TP mass removal effectiveness were not. For example, from WY2004 to WY2006, the Northern Flow-way removed 55%, 58% and 50% of the inflow mass each year; over the same three years, the Central Flow-way removed 50%, 0% and 45%.

237 | P a g e
Table 9-2. STA-5: Water budget for North Flow-way (hm3).
Inflowsb Outflowsb
Is Ig P ∑inflow Os Og ET ∑outflow ∆S r ε WY2001 45.8 0.0 8.1 53.9 25.4 12.9 11.9 50.1 -3.0 -6.7 -12.98%
WY2002 122.7 0.0 7.5 130.2 103.3 14.9 11.2 129.4 1.8 1.0 0.80%
WY2003 127.6 0.0 10.1 137.7 124.5 15.0 10.8 150.3 2.8 15.4 10.67%
WY2004 139.5 0.0 9.6 149.1 124.6 15.6 10.8 151.0 -1.3 0.7 0.45%
WY2005 114.6 0.0 8.9 123.4 90.4 13.3 10.7 114.5 -3.7 -12.7 -10.65%
WY2006 171.8 0.0 8.5 180.3 139.1 12.2 10.9 162.3 0.1 -18.0 -10.49%
WY2007 70.2 0.0 8.9 79.1 79.8 9.3 11.0 100.1 -3.7 17.2 19.23%
WY2008 15.2 0.0 9.5 24.8 4.8 8.2 11.0 23.9 3.9 3.1 12.65%
POR 807.4 0.0 71.1 878.5 691.9 101.4 88.3 881.6 -3.1 0.0 0.00% % In 91.9% 0.0% 8.1% % out 78.5% 11.5% 10.0%
bIs = surface water inflow; Ig = groundwater inflow; IP = precipitation; Os = surface water outflow; Og = groundwater outflow; ET = evapotranspiration; ∆S = change in storage volume; r = water budget residual; ε = water budget error
Table 9-3. STA-5: Water budget for North Flow-way. Pietro et al., 2009.
Is Ig P ∑inflow HLR Os Og ET ∑outflow ∆S r ε
hm3/yr hm3/yr hm3/yr hm3/yr m/yr hm3/yr hm3/yr hm3/yr hm3/yr hm3/yr hm3/yr WY2001 45.5 0 8.1 53.6 8 25.4 10.5 11.9 47.7 -2.4 -8.3 -16.30% WY2002 122.7 0 7.5 130.2 18 103.3 11.4 11.2 125.9 2.4 -1.9 -1.50% WY2003 127.6 0 10.1 137.7 18 124.5 9.3 10.8 144.6 -0.1 6.8 4.80% WY2004 139.5 0 9.6 149.1 19 124.6 10.6 10.8 146 1.2 -1.9 -1.30% WY2005 114.6 2 8.9 125.4 16 90.4 7.8 10.7 108.9 -3.4 -19.9 -17.00% WY2006 171.8 0.5 8.5 180.8 34 139.1 12.7 10.9 162.7 0 -18.1 -10.50% WY2007 70.2 0 8.9 79.1 15 79.8 8.8 11.1 99.7 0.1 20.6 23.00% WY2008 15.2 1.2 9.5 25.9 4 4.8 2.9 10.9 18.5 1.8 -5.6 -25.20% POR 807.1 3.6 71.1 881.9 130 691.9 73.8 88.3 854 -0.4 -28.3 -3.30% %In 91.50% 0.40% 8.10% %Out 81.00% 8.60% 10.30% bIs = surface water inflow; Ig = groundwater inflow; IP = precipitation; HLR = hydraulic loading rate; Os = surface water outflow; Og = groundwater outflow; ET = evapotranspiration; ∆S = change in storage volume; r = water budget residual; ε = water budget error

238 | P a g e
Table 9-4. STA-5: Water budget for Central Flow-way (hm3)
Inflowsb Outflowsb
Is Ig P ∑inflow Os Og ET ∑outflow ∆S r ε WY2001 57.4 0.0 8.1 65.5 23.9 33.7 11.9 69.5 -3.7 0.3 0.44%
WY2002 114.7 0.0 7.5 122.2 52.3 37.3 11.2 100.8 3.5 -18.0 -16.13%
WY2003 119.6 0.0 10.1 129.7 73.5 41.6 10.8 125.9 -0.4 -4.2 -3.31%
WY2004 92.1 0.0 9.6 101.8 46.7 41.6 10.8 99.1 1.5 -1.3 -1.25%
WY2005 68.4 0.0 8.9 77.3 59.6 41.5 10.7 111.9 -1.0 33.6 35.52%
WY2006 123.4 0.4 8.5 132.2 109.0 30.5 10.9 150.5 -8.6 9.6 6.81%
WY2007 36.7 0.3 8.9 45.8 3.9 7.9 11.0 22.8 5.1 -18.0 -52.36%
WY2008 9.8 1.1 9.5 20.5 4.0 2.0 11.0 17.0 1.4 -2.1 -11.15%
POR 622.1 1.8 71.1 695.0 372.8 236.1 88.3 697.2 -2.2 0.0 0.00% %In 89.5% 0.3% 10.2% % out 53.5% 33.9% 12.7% bIs = surface water inflow; Ig = groundwater inflow; IP = precipitation; Os = surface water outflow; Og = groundwater outflow; ET = evapotranspiration; ∆S = change in storage volume; r = water budget residual; ε = water budget error
Table 9-5. STA-5: Water budget for Central Flow-way. Pietro et al., 2009.
Is Ig P ∑inflow HLR Os Og ET ∑outflow ∆S r ε
hm3/yr hm3/yr hm3/yr hm3/yr m/yr hm3/yr hm3/yr hm3/yr hm3/yr hm3/yr hm3/yr WY2001 57.4 1.3 8.1 66.8 9 23.9 25.5 11.9 61.3 -2.6 -8.2 -12.80% WY2002 114.7 0.4 7.5 122.6 16 52.3 23.3 11.2 86.8 2.1 -33.8 -32.20% WY2003 119.6 0 10.1 129.7 16 73.5 33.3 10.8 117.6 -0.3 -12.3 -10.00% WY2004 92.1 0 9.6 101.8 12 46.7 27.9 10.8 85.4 1.5 -15 -16.00% WY2005 68.4 0 8.9 77.3 11 59.6 33.8 10.7 104.1 -1.1 25.8 28.40% WY2006 123.4 18.2 8.5 150.1 22 109 19.7 10.9 139.7 -3.2 -13.7 -9.50% WY2007 36.6 5.8 8.9 51.3 8 3.9 4 11.1 18.9 0.7 -31.7 -90.30% WY2008 9.8 7.1 9.5 26.4 5 4 0.7 10.9 15.5 1.1 -9.8 -46.70%
POR 622 32.9 71.1 726.1 101 372.8 168.1 88.3 629.2 -1.8 -98.6 -14.60% %In 85.70% 4.50% 9.80% %Out 59.30% 26.70% 14.00% bIs = surface water inflow; Ig = groundwater inflow; IP = precipitation; HLR = hydraulic loading rate; Os = surface water outflow; Og = groundwater outflow; ET =
evapotranspiration; ∆S = change in storage volume; r = water budget residual; ε = water budget error

239 | P a g e
Table 9-6. STA-5: Total Phosphorus mass balance for North Flow-way (mt).
Inflowsb Outflowsb
Isp Igp Ipp ∑inflow Osp Ogp ∑outflow Retained % Ret
WY2001 4.7 0.0 0.0 4.7 2.9 2.4 5.2 -0.5 -10% WY2002 23.2 0.0 0.0 23.2 9.5 0.9 10.4 12.7 55% WY2003 23.3 0.0 0.0 23.3 18.0 2.5 20.5 2.9 12% WY2004 21.1 0.0 0.0 21.1 8.5 1.2 9.7 11.5 54% WY2005 15.2 0.0 0.0 15.2 6.1 0.9 7.0 8.2 54% WY2006 28.0 0.0 0.0 28.0 12.6 1.7 14.3 13.7 49% WY2007 19.0 0.0 0.0 19.0 11.2 0.9 12.0 6.9 37% WY2008 1.1 0.0 0.0 1.1 0.5 0.9 1.3 -0.2 -18% POR 135.6 0.0 0.0 135.6 69.1 11.3 80.4 55.2 41% % in 100% 0% 0% % out 86% 14%
bIs = surface water inflow; Ig = groundwater inflow; IP = precipitation; Os = surface water outflow; Og = groundwater outflow
Table 9-7. STA-5 Total phosphorus mass balance for North Flow-way (mt) Pietro et al., 2009.
Inflowsb Outflowsb
Isp Igp Ipp ∑inflow Osp Ogp ∑outflow Retained % Ret
WY2001 5.6 0.0 0.0 5.6 3.6 1.4 5.0 0.6 11%
WY2002 23.6 0.0 0.0 23.6 8.8 1.5 10.2 13.4 57%
WY2003 23.4 0.0 0.0 23.5 18.0 1.5 19.5 4.0 17%
WY2004 21.0 0.0 0.0 21.1 8.4 1.1 9.5 11.6 55%
WY2005 15.0 0.0 0.0 15.1 5.7 0.7 6.4 8.7 58%
WY2006 28.0 0.0 0.0 28.0 12.4 1.5 14.0 14.0 50%
WY2007 18.6 0.0 0.0 18.6 11.9 1.8 13.7 5.0 27%
WY2008 1.3 0.0 0.0 1.3 0.4 0.2 0.7 0.6 48%
POR 136.5 0.0 0.3 136.8 69.2 9.6 78.8 58.0 42% %In 100% 0% 0% %Out 88% 12% bIs = surface water inflow; Ig = groundwater inflow; IP = precipitation; Os = surface water outflow; Og = groundwater outflow

240 | P a g e
Table 9-8. STA-5: Total phosphorus mass balance for Central Flow-way (mt).
Inflowsb Outflowsb Isp Igp Ipp ∑inflow Osp Ogp ∑outflow Retained % Ret WY2001 10.5 0.0 0.0 10.5 1.1 3.7 4.9 5.7 54% WY2002 25.8 0.0 0.0 25.8 4.2 3.8 8.0 17.8 69% WY2003 35.1 0.0 0.0 35.1 8.7 5.5 14.2 20.9 60% WY2004 27.5 0.0 0.0 27.5 8.1 6.3 14.4 13.1 48% WY2005 11.0 0.0 0.0 11.0 6.6 4.0 10.6 0.5 4% WY2006 25.4 0.1 0.0 25.5 11.3 3.7 15.1 10.4 41% WY2007 3.6 0.0 0.0 3.6 0.8 2.0 2.9 0.7 21% WY2008 1.1 0.1 0.0 1.2 0.5 0.2 0.6 0.6 47% POR 140.1 0.2 0.0 140.3 41.4 29.2 70.6 69.7 50% % in 100% 0% 0% % out 59% 41% bIs = surface water inflow; Ig = groundwater inflow; IP = precipitation; Os = surface water outflow; Og = groundwater outflow
Table 9-9. STA-5: Total phosphorus mass balance for Central Flow-way (mt) Pietro et al., 2009.
Inflowsb Outflowsb Isp Igp Ipp ∑inflow Osp Ogp ∑outflow Retained % Ret WY2001 10.8 0.0 0.0 10.8 1.3 2.6 3.9 7.0 65% WY2002 26.2 0.0 0.0 26.2 4.1 3.1 7.2 19.0 72% WY2003 35.3 0.0 0.0 35.3 8.5 6.2 14.6 20.7 59% WY2004 28.3 0.0 0.0 28.4 8.0 6.4 14.4 14.0 49% WY2005 10.9 0.0 0.0 11.0 6.6 4.5 11.0 -0.1 -1% WY2006 25.4 0.0 0.0 25.4 11.2 2.9 14.1 11.4 45% WY2007 3.6 0.0 0.0 3.7 0.9 0.6 1.6 2.1 57% WY2008 1.3 0.0 0.0 1.4 0.4 0.1 0.5 0.9 64% POR 141.9 0.0 0.3 142.2 41.0 26.3 67.3 74.9 53% %In 100% 0% 0% %Out 61% 39% bIs = surface water inflow; Ig = groundwater inflow; IP = precipitation; Os = surface water outflow; Og = groundwater outflow
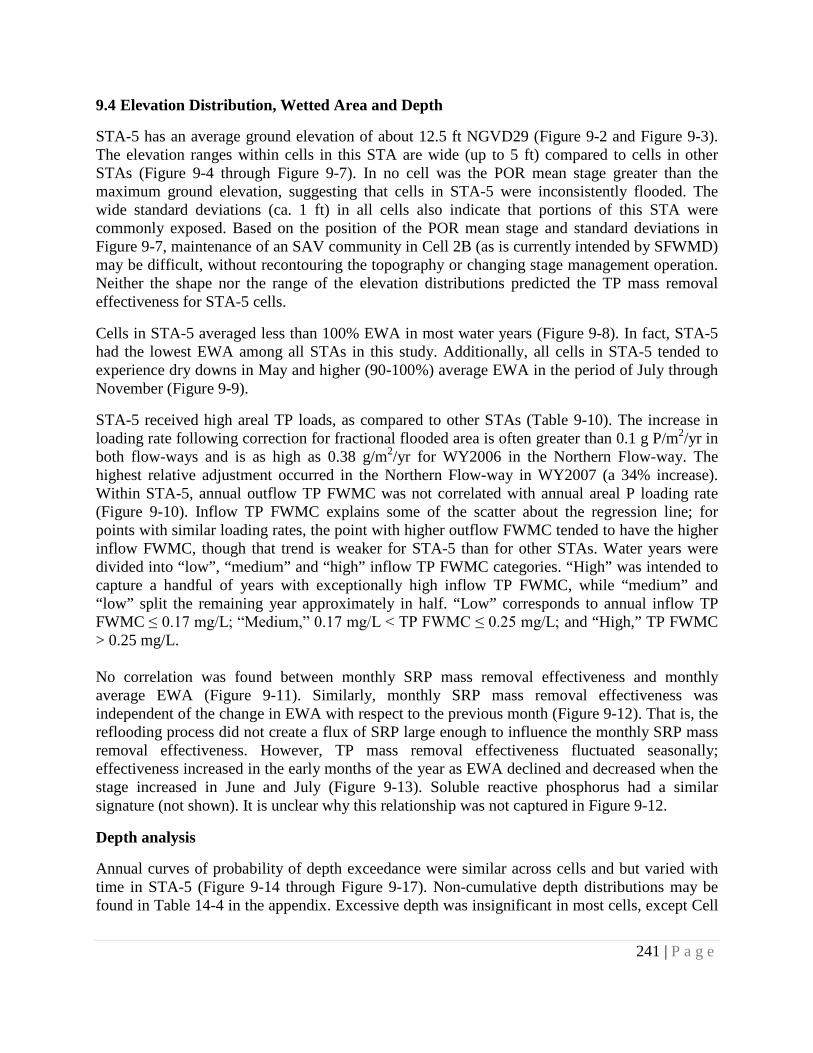
241 | P a g e
9.4 Elevation Distribution, Wetted Area and Depth
STA-5 has an average ground elevation of about 12.5 ft NGVD29 (Figure 9-2 and Figure 9-3). The elevation ranges within cells in this STA are wide (up to 5 ft) compared to cells in other STAs (Figure 9-4 through Figure 9-7). In no cell was the POR mean stage greater than the maximum ground elevation, suggesting that cells in STA-5 were inconsistently flooded. The wide standard deviations (ca. 1 ft) in all cells also indicate that portions of this STA were commonly exposed. Based on the position of the POR mean stage and standard deviations in Figure 9-7, maintenance of an SAV community in Cell 2B (as is currently intended by SFWMD) may be difficult, without recontouring the topography or changing stage management operation. Neither the shape nor the range of the elevation distributions predicted the TP mass removal effectiveness for STA-5 cells.
Cells in STA-5 averaged less than 100% EWA in most water years (Figure 9-8). In fact, STA-5 had the lowest EWA among all STAs in this study. Additionally, all cells in STA-5 tended to experience dry downs in May and higher (90-100%) average EWA in the period of July through November (Figure 9-9).
STA-5 received high areal TP loads, as compared to other STAs (Table 9-10). The increase in loading rate following correction for fractional flooded area is often greater than 0.1 g P/m2/yr in both flow-ways and is as high as 0.38 g/m2/yr for WY2006 in the Northern Flow-way. The highest relative adjustment occurred in the Northern Flow-way in WY2007 (a 34% increase). Within STA-5, annual outflow TP FWMC was not correlated with annual areal P loading rate (Figure 9-10). Inflow TP FWMC explains some of the scatter about the regression line; for points with similar loading rates, the point with higher outflow FWMC tended to have the higher inflow FWMC, though that trend is weaker for STA-5 than for other STAs. Water years were divided into “low”, “medium” and “high” inflow TP FWMC categories. “High” was intended to capture a handful of years with exceptionally high inflow TP FWMC, while “medium” and “low” split the remaining year approximately in half. “Low” corresponds to annual inflow TP FWMC ≤ 0.17 mg/L; “Medium,” 0.17 mg/L < TP FWMC ≤ 0.25 mg/L; and “High,” TP FWMC > 0.25 mg/L. No correlation was found between monthly SRP mass removal effectiveness and monthly average EWA (Figure 9-11). Similarly, monthly SRP mass removal effectiveness was independent of the change in EWA with respect to the previous month (Figure 9-12). That is, the reflooding process did not create a flux of SRP large enough to influence the monthly SRP mass removal effectiveness. However, TP mass removal effectiveness fluctuated seasonally; effectiveness increased in the early months of the year as EWA declined and decreased when the stage increased in June and July (Figure 9-13). Soluble reactive phosphorus had a similar signature (not shown). It is unclear why this relationship was not captured in Figure 9-12.
Depth analysis
Annual curves of probability of depth exceedance were similar across cells and but varied with time in STA-5 (Figure 9-14 through Figure 9-17). Non-cumulative depth distributions may be found in Table 14-4 in the appendix. Excessive depth was insignificant in most cells, except Cell

242 | P a g e
1A which saw much as 15% area*time under more than 4 ft of water in some years. Shape and distribution of curves did not predict annual or long term P removal performance.

243 | P a g e
Figure 9-2. STA-5: Topographic map excluding Cell 1A
Figure 9-3. STA-5: Topographic map of Cell 1A.

244 | P a g e
Figure 9-4. STA-5: Cumulative elevation distribution for Cell 1A. Vertical lines indicate POR (WY2001-WY2008) mean stage ± 1 standard deviation.
Figure 9-5. STA-5: Cumulative elevation distribution for Cell 1B. Vertical lines indicate POR (WY2001-WY2008) mean stage ± 1 standard deviation. This is an SAV cell.
0%
20%
40%
60%
80%
100%
9 10 11 12 13 14 15 16
Cum
ulat
ive
elev
atio
n di
stri
butio
n
Feet of elevation NGVD
0%
20%
40%
60%
80%
100%
9 10 11 12 13 14 15 16
Cum
ulat
ive
elev
atio
n di
stri
butio
n
Feet of elevation NGVD

245 | P a g e
Figure 9-6. STA-5: Cumulative elevation distribution for Cell 2A. Vertical lines indicate POR mean stage ± 1 standard deviation.
Figure 9-7. STA-5: Cumulative elevation distribution for Cell 2B. Vertical lines indicate POR mean stage ± 1 standard deviation. This is an SAV cell.
0%
20%
40%
60%
80%
100%
9 10 11 12 13 14 15 16
Cum
ulat
ive
elev
atio
n di
stri
butio
n
Feet of elevation NGVD
0%
20%
40%
60%
80%
100%
9 10 11 12 13 14 15 16
Cum
ulat
ive
elev
atio
n di
stri
butio
n
Feet of elevation NGVD

246 | P a g e
Figure 9-8. STA-5: Estimated wetted area*time over time. Cells 1B and 2B are SAV.
Figure 9-9. STA-5: Intra-annual estimated wetted area*time for each cell. Each month is averaged over POR (WY2001-WY2008).
0%
20%
40%
60%
80%
100%
Floo
ded
Surf
ace
Are
a*Ti
me
Cell 1A Cell 1B
Cell 2A Cell 2B
0%
20%
40%
60%
80%
100%
Frac
tiona
l Flo
oded
Sur
face
Are
a*Ti
me
Cell 1A Cell 1B
Cell 2A Cell 2B

247 | P a g e
Table 9-10. STA-5: Total phosphorus (TP) loading rates (LR) before and after adjustment for estimated wetted area*time.
Central Flow-way Northern Flow-way
Water Year TP LR (g/m2)a
TP LR (g/m2)b Difference TP LR
(g/m2)a TP LR (g/m2)b Difference
2001 1.30 1.41 0.11 0.67 0.68 0.01 2002 3.15 3.31 0.16 2.84 3.03 0.19 2003 4.24 4.37 0.13 2.82 2.87 0.06 2004 3.41 3.49 0.08 2.53 2.54 0.01 2005 1.32 1.36 0.04 1.81 2.09 0.28 2006 3.05 3.24 0.19 3.36 3.74 0.38 2007 0.44 0.59 0.15 2.24 2.43 0.19 2008 0.16 0.21 0.05 0.15 0.20 0.05
a TP LR before (assuming EWA=100%) EWA adjustment b TP LR after EWA adjustment
Figure 9-10. STA-5: Relationship between outflow total phosphorus flow-weighted mean concentration (TP FWMC; mg P/L) and annual areal TP loading rate (LR; g/m2/yr). “Low” corresponds to annual inflow TP FWMC ≤ 0.17 mg/L; “Medium,” 0.17 mg/L < TP FWMC ≤ 0.25 mg/L; and “High,” TP FWMC > 0.25 mg/L. Each point represents one cell for one water year.
R² = 0.0179
0.00
0.05
0.10
0.15
0.20
0.25
0.30
0 1 2 3 4 5
Out
flow
TP
FWM
C (m
g/L)
Areal TP loading rate (g P/m2/yr)
NFW
CFW
High
Med
Low
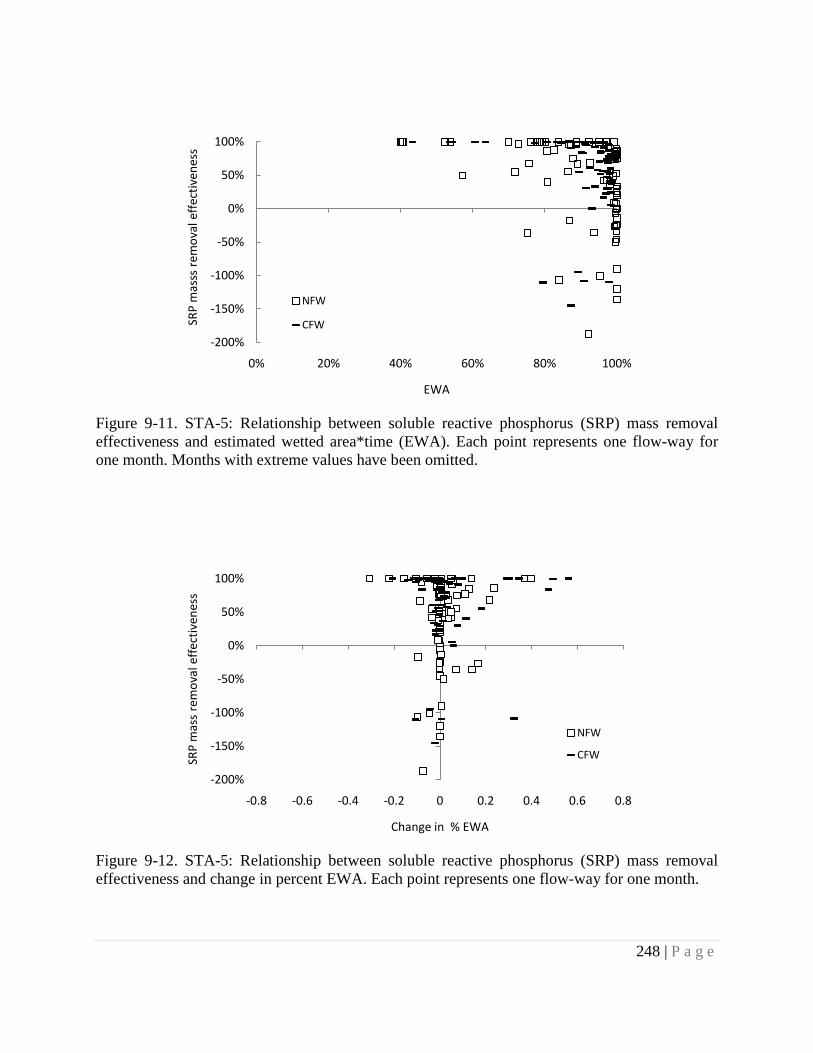
248 | P a g e
Figure 9-11. STA-5: Relationship between soluble reactive phosphorus (SRP) mass removal effectiveness and estimated wetted area*time (EWA). Each point represents one flow-way for one month. Months with extreme values have been omitted.
Figure 9-12. STA-5: Relationship between soluble reactive phosphorus (SRP) mass removal effectiveness and change in percent EWA. Each point represents one flow-way for one month.
-200%
-150%
-100%
-50%
0%
50%
100%
0% 20% 40% 60% 80% 100%
SRP
mas
ss r
emov
al e
ffec
tiven
ess
EWA
NFW
CFW
-200%
-150%
-100%
-50%
0%
50%
100%
-0.8 -0.6 -0.4 -0.2 0 0.2 0.4 0.6 0.8
SRP
mas
s re
mov
al e
ffec
tiven
ess
Change in % EWA
NFW
CFW

249 | P a g e
Figure 9-13. STA-5: Intra-annual estimated wetted area*time and total phosphorus (TP) mass removal effectiveness. Each point is averaged over the period of record (WY2001-WY2008).
Figure 9-14. STA-5: Exceedance probability of depths for Cell 1A.
0%
20%
40%
60%
80%
100%
0%
20%
40%
60%
80%
100%
TP m
ass
rem
oval
eff
ectiv
enss
EWA
EWA
% TP Mass Removed
0
0.5
1
1.5
2
2.5
3
3.5
4
0% 20% 40% 60% 80% 100%
Dep
th (f
t)
Probability of exceedance
WY2000WY2001WY2002WY2003WY2004WY2005WY2006WY2007WY2008

250 | P a g e
Figure 9-15. STA-5: Exceedance probability of depths for Cell 1B.
Figure 9-16. STA-5: Exceedance probability of depths for Cell 2A.
0
0.5
1
1.5
2
2.5
3
3.5
4
0% 20% 40% 60% 80% 100%
Dep
th (f
t)
Probability of exceedance
WY2000WY2001WY2002WY2003WY2004WY2005WY2006WY2007WY2008
0
0.5
1
1.5
2
2.5
3
3.5
4
0% 20% 40% 60% 80% 100%
Dep
th (f
t)
Probability of exceedance
WY2000WY2001WY2002WY2003WY2004WY2005WY2006WY2007WY2008

251 | P a g e
Figure 9-17. STA-5: Exceedance probability of depths for Cell 2B.
0
0.5
1
1.5
2
2.5
3
3.5
4
0% 20% 40% 60% 80% 100%
Dep
th (f
t)
Probability of exceedance
WY2000WY2001WY2002WY2003WY2004WY2005WY2006WY2007WY2008

252 | P a g e
9.5 Hydraulic Residence Time
The median nominal three-month average HRT for the Northern Flow-way and the Central Flow-way from May 2000 through April 2008 were 28 d and 18 d, respectively (Table 14-19 and Table 14-20 in the appendix). Nominal HRTs ranged from 5 to 495 days for the Northern Flow-way, and 7 to 108 days for the Central Flow-way. The upper bounds of the HRTs included in this study are illustrated by the x-axes in Figure 9-18 and Figure 9-19.
No correlation was found between either outflow TP FWMC or TP mass removal effectiveness and three-month average nominal HRT (Figure 9-18 and Figure 9-19). Gross TP mass removal was negatively correlated with three-month average HRT (Figure 9-20). This colinearity was expected because both low mass loads and high HRTs result from low flows. As in the previous STAs, uncertainties in flow and concentration measurements, errors in estimating HRTs, and stochastic variability in other factors (such as vegetation, soil, etc.) could have affected these results. In particular, some portion of the wetlands may not be involved in the flow due to the presence of stagnant zones; therefore the considerable errors could also be generated during the estimation of nominal HRTs (Guardo, 1999).
Nominal HRTs could be better estimated by breaking down the transient data over any specific period or events. In some instances, HRTs values tended to be unreasonably high because of extremely low flow operations for a long period of time. Also, the estimates of nominal HRTs in STA-5 could be significantly reduced by considering longer period average (such as yearly average) because this will reduce the uncertainty of the measured data. Results suggest that the short period (three-month) is not suitable to estimate nominal HRTs from the given data of STA-5.

253 | P a g e
Figure 9-18. STA-5: Comparison of three-month rolling average flow-weighted total phosphorus outflow concentrations (mg/L) with corresponding average nominal hydraulic residence times (days) in the STA -5, Northern and Southern Flow-ways.
Figure 9-19. STA-5: Comparison of three-month total phosphorus removal (%) with corresponding average nominal hydraulic residence times (days) in the STA-5, Northern and Central Flow-ways.
0.0
0.1
0.2
0.3
0.4
0 25 50 75 100 125
Out
flow
TP
(mg/
L)
HRT (days)
NFW
CFW
0
25
50
75
100
0 25 50 75 100 125
TP m
ass
rem
oval
eff
ectiv
enes
s (%
)
HRT (days)
NFW
CFW

254 | P a g e
Figure 9-20. STA-5: Total phosphorus mass removal (kg) compared with corresponding three-month rolling average nominal hydraulic residence times (days) in the STA-5, Northern and Central Flow-ways.
0
4000
8000
12000
16000
20000
0 25 50 75 100 125
Mas
s re
mov
al (k
g)
HRT (days)
NFW
CFW

255 | P a g e
9.6 Water Column Chemical Constituents
Flow-ways in STA-5 treated the three fractions within water column TP differentially, with PP most preferentially removed from the TP pool (Figure 9-21 through Figure 9-23). Both flow-ways were inconsistent in their relative treatment of SRP. For DOP data were only available for the Northern Flow-way, which consistently enriched that fraction in the TP pool. In most years in the Northern Flow-way, PP was preferentially removed from the TP pool in STA-5. Inflow water tended to be rich in SRP and PP (annual averages for both constituents range from 40% to approximately 60% of TP) and poor in DOP (annual averges for the Northern Flow-way were consistently below 20%). The relatively poor treatment of SRP in STA-5 may be attributable to drying-flooding cycles.
Calcium loading was slightly lower (about 600 g Ca/m2/yr) in the Northern Flow-way and the Central Flow-way than in cells in other STAs (Table 9-11), but did not influence SRP mass removal effectiveness (Figure 9-24). The inflow Ca FWMCs for flow-ways in STA-5 (POR average approximately 50 mg/L) were among the lowest observed in all cells in all STAs. Stoichiometrically, Ca availability may not limiting SRP removal in this system, and only a small fraction of inflow Ca interacts with P. However, both annual SRP retention and mass removal effectiveness were moderately correlated with annual areal Ca retention in STA-5 (Figure 9-25 and Figure 9-26). The positive correlations alone are insufficient to prove cause-and-effect, but do suggest that the conditions that promote Ca removal also promote P removal in STA-5.
The magnitude of the net Ca flux in STA-2 also deserves note; in various years, these cells have gained as much as 1 kg Ca/m2, based on water chemistry data. However, while no Ca data are available for STA-5, other STAs report soil Ca storages of only several hundred g Ca/m2 in the top 10 cm. It is unlikely that Ca fluxes of this magnitude were transfered to and from the soil when soil Ca storages were so comparatively low. Additional Ca storage in floc, biofilms and periphyton may account for this discrepency.
Because of the limited sulfate data for other STAs, it is difficult to assess the significance of the observed SO4 FWMC (9.2 and 7.3 mg/L in the Northern Flow-way and the Central Flow-way, respectively) and areal loading rates (ca. 100 g/m2/yr in both flow-ways). Annual SRP mass removal effectiveness was independent of annual areal SO4 loading rate in STA-5 (Figure 9-27).
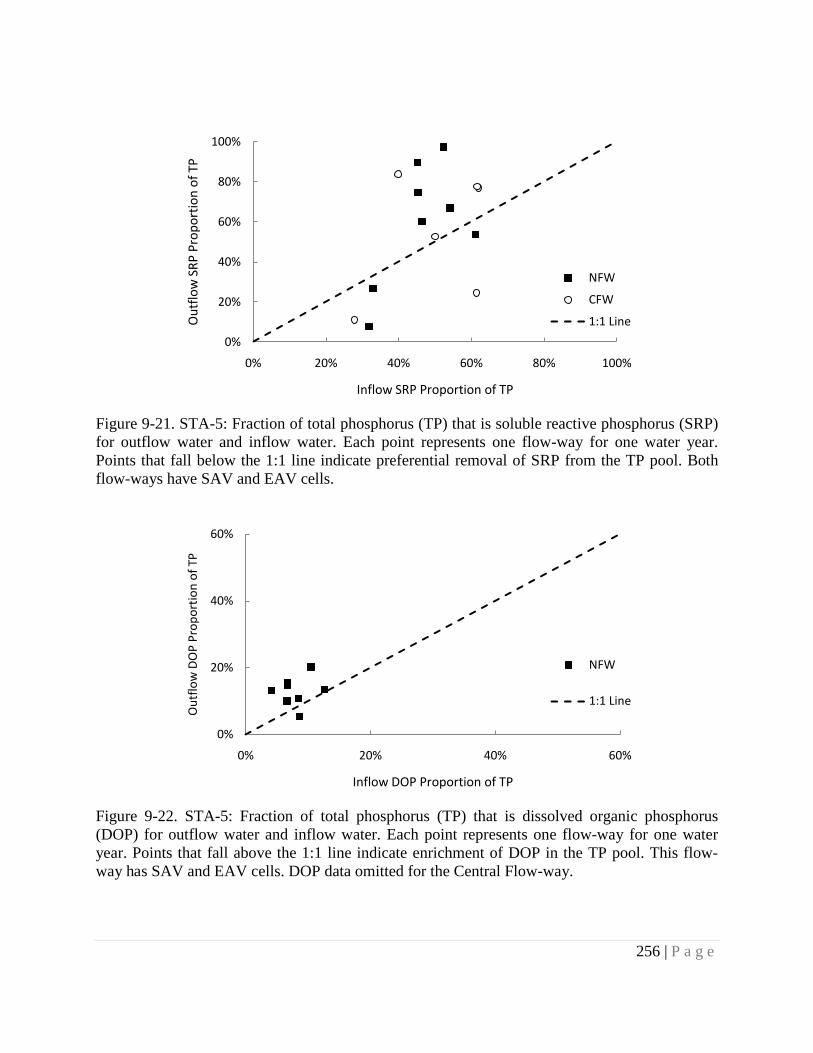
256 | P a g e
Figure 9-21. STA-5: Fraction of total phosphorus (TP) that is soluble reactive phosphorus (SRP) for outflow water and inflow water. Each point represents one flow-way for one water year. Points that fall below the 1:1 line indicate preferential removal of SRP from the TP pool. Both flow-ways have SAV and EAV cells.
Figure 9-22. STA-5: Fraction of total phosphorus (TP) that is dissolved organic phosphorus (DOP) for outflow water and inflow water. Each point represents one flow-way for one water year. Points that fall above the 1:1 line indicate enrichment of DOP in the TP pool. This flow-way has SAV and EAV cells. DOP data omitted for the Central Flow-way.
0%
20%
40%
60%
80%
100%
0% 20% 40% 60% 80% 100%
Out
flow
SRP
Pro
port
ion
of T
P
Inflow SRP Proportion of TP
NFW
CFW
1:1 Line
0%
20%
40%
60%
0% 20% 40% 60%
Out
flow
DO
P Pr
opor
tion
of T
P
Inflow DOP Proportion of TP
NFW
1:1 Line

257 | P a g e
Figure 9-23. STA-5: Fraction of total phosphorus (TP) that is particulate phosphorus (PP) for outflow water and inflow water. Each point represents one flow-way for one water year. Points that fall below the 1:1 line indicate preferential removal of PP from the TP pool. This flow-ways has SAV and EAV cells. PP data omitted for the Central Flow-way. Table 9-11. STA-5: POR flow-weighted mean concentrations (FWMC; mg/L) and average annual areal loading rates (LR; g/m2/yr) of selected non-phosphorus chemicals.
Ca SO4 NOx NO2 NH4
FWMC LR FWMC LR FWMC LR FWMC LR FWMC LR CFW 57 635 9.18 102.36 0.06 0.66 -- -- 0.08 0.88 NFW 51 693 7.30 98.60 0.07 1.00 -- -- 0.10 1.34
0%
20%
40%
60%
80%
100%
0% 20% 40% 60% 80% 100%
Out
flow
PP
Prop
ortio
n of
TP
Inflow PP Proportion of TP
NFW
1:1 Line
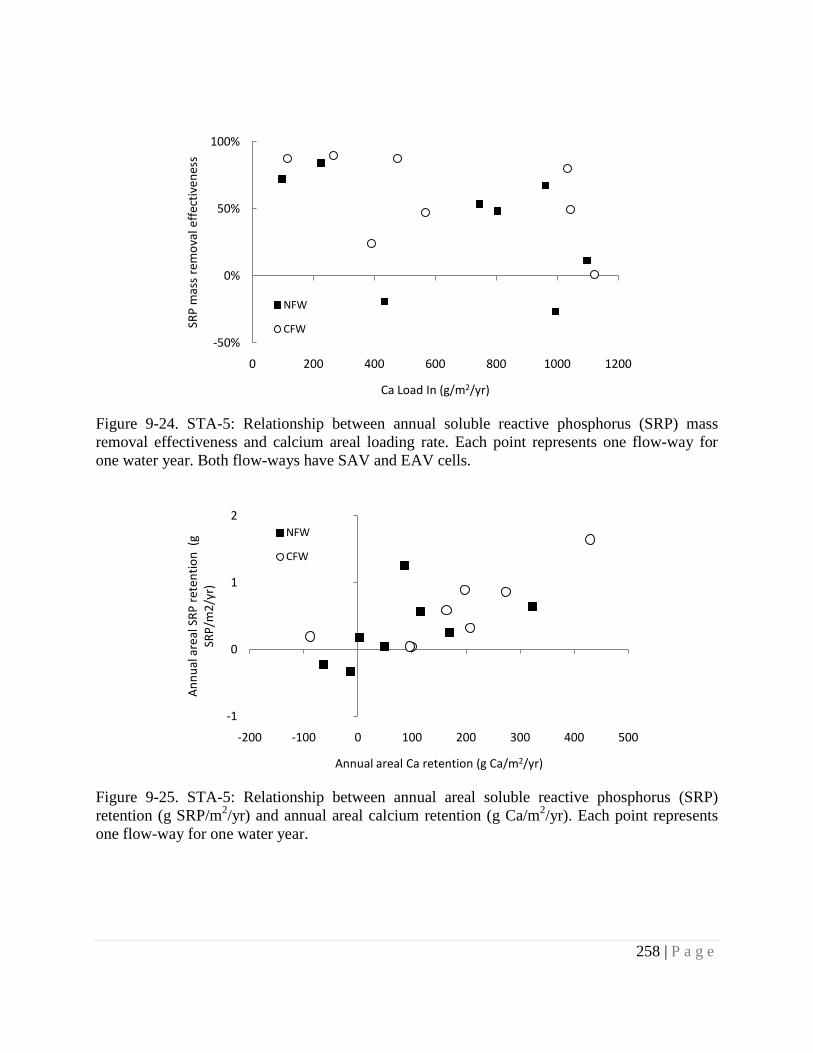
258 | P a g e
Figure 9-24. STA-5: Relationship between annual soluble reactive phosphorus (SRP) mass removal effectiveness and calcium areal loading rate. Each point represents one flow-way for one water year. Both flow-ways have SAV and EAV cells.
Figure 9-25. STA-5: Relationship between annual areal soluble reactive phosphorus (SRP) retention (g SRP/m2/yr) and annual areal calcium retention (g Ca/m2/yr). Each point represents one flow-way for one water year.
-50%
0%
50%
100%
0 200 400 600 800 1000 1200
SRP
mas
s re
mov
al e
ffec
tiven
ess
Ca Load In (g/m2/yr)
NFW
CFW
-1
0
1
2
-200 -100 0 100 200 300 400 500
Ann
ual a
real
SRP
ret
entio
n (g
SR
P/m
2/yr
)
Annual areal Ca retention (g Ca/m2/yr)
NFW
CFW

259 | P a g e
Figure 9-26. STA-5: Relationship between annual soluble reactive phosphorus (SRP) mass removal effectiveness and annual areal calcium retention (g Ca/m2/yr). Each point represents one cell for one water year.
Figure 9-27. STA-5: Relationship between annual soluble reactive phosphorus (SRP) mass removal effectiveness and sulfate areal loading rate. Each point represents one flow-way for one water year. Both flow-ways have SAV and EAV cells.
-50%
0%
50%
100%
-200 -100 0 100 200 300 400 500
Ann
ual S
RP r
emov
al e
ffec
tiven
ess
Annual areal Ca retention (g Ca/m2/yr)
NFW
CFW
-50%
0%
50%
100%
0 50 100 150 200
SRP
mas
s re
mov
al e
ffec
tiven
ess
Inflow SO4 Load (g/m2/yr)
NFW
CFW

260 | P a g e
9.7 Soil Nutrients
9.8 Floc and soil physico-chemical properties
STA-5 is divided into four cells, Cells 1A and 1B (Northern Flow-way) while Cells 2A and 2B (Central Flow-way). The Southern Flow-way comprises of Cells 3A and 3B. Data were not available for Southern Flow-way. Soil and Water Sciences Department (UF) collected soil samples from 10 sampling locations as a part of research project in WY2001. Soils were sampled with an incremental depth of 10 cm and 10-30 cm; however only surface soils (0-10 cm) were used for analyses. Subsequent soil sampling for STA-5 was undertaken in WY2002, WY2003, and WY2007.
Floc samples were collected in WY2003, WY2004 and WY2007. Central Flow-way was not sampled in WY2007 due to enhancement and construction activities during WY2006. The absence of floc data may or may not indicate the absence of floc in the field. The absent floc values may have resulted either due to dry conditions and consolidation of floc into the surface soil, or due to mixing of floc layer into soil layer during sampling. Missing floc data can potentially result in erroneous calculation of FPS. Floc is the active layer (the interface between the water column and sediment layer), and often contribute a significant proportion of the total P storage.
Table 9-12 and Table 9-13 present the number of floc and soil samples, respectively, collected for STA-5. The number of floc samples decreased from WY2004 to WY2007. Number of soil samples also decreased from WY2004 to WY2007. Floc samples had different depth intervals (Table 9-14). Mean floc depth for the STA increased from WY2003 to WY2004. This increase was not statistically significant. Cell 2B registered highest increase (from 5.8 cm to 10.6 cm). Decrease in mean floc depth was observed for WY2004 to WY2007, but this could be due to absence of data from Cell 2A and 2B. Soil samples were obtained for 0-10 cm depth.
The bulk density values of floc and soil from all cells of STA-5 are shown in Table 9-15 and Table 9-16 respectively. Floc bulk density increased from 0.06 ± 0.05 (g/cm3 ± SD) to 0.11 ± 0.03 (g/cm3 ± SD) over the period of WY2003 to WY2007. Cell 1A (EAV) and Cell 1B (SAV) showed similar bulk density values for WY2003 and WY2007 but not for WY2004. STA-5 soils showed moderate bulk density across all cells. Mean soil bulk density was found highest in WY2003, which did not change much in subsequent years. However in case of Cell 2A soil bulk density doubled from WY2001 (0.38 ± 0.12; g/cm3 ± SD) to WY2007 (0.8 ± 0.21; g/cm3 ± SD). This cell seemed to have contributed to the increase in mean bulk density for the STA for WY2007. These values represent relatively higher proportion of mineral content in predominantly organic soils.
9.8.1 Phosphorus inventory
Data on average TP concentration (mg P/kg) in floc and soils are shown in Table 9-17 and Table 9-18, respectively. Floc TP values were found to be higher than corresponding soil values for a given water year. STA mean P concentration values in floc were found similar for WY2003 and WY2007, however lower value was reported for WY2004 samples. Figure 9-28 presents variation in soil (0-10 cm) TP concentration as a function of age for STA-5. Mean soil TP

261 | P a g e
concentration for the STA remained unchanged from WY2001 (465 ± 74; mg P/kg) to WY2004 (445 ± 139; mg P/kg), but increased substantially from WY2004 to WY2007 (615 ± 396; mg P/kg). Soil TP concentration increased in Cells 1A, 1B and 2B across the sampling years. This suggested P enrichment of the STA soils over time.
Change in floc and soil TP concentration for all cells of the STA are plotted in Figure 9-29 and Figure 9-30 respectively. Lowest values for floc TP was recorded in WY2004 while lowest soil TP values were recorded in WY2001 with the exception of Cell 2A (EAV). Figure 9-31 shows change in floc and soil TP concentration for the whole STA across the sampling years. The STA as a whole did not show much change in floc and soil TP concentration over time (WY2003 to WY2007).
Total P storage in each cell was calculated on a per unit area basis expressed in g P/m2. For floc samples the total floc depth was used for calculating FPS while depth of 10 cm was taken for calculating SPS. Where the soil core was shallower or deeper than 10 cm, the SPS values were normalized to 10 cm. Floc and soil P storage in STA-5 is presented in Table 9-19 and Table 9-20 respectively. Figure 9-32 and Figure 9-33 presents cell-wise FPS and SPS, respectively. Figure 9-34 presents changes in FPS and SPS over time indicating that both FPS and SPS increased from WY2001 to WY2007. Soil P storage data from WY2001 was considered as background storage and was used for P mass balance analysis (in later section).
The P mass balance was calculated using the cumulative TP retained from the water column from WY2001 to WY2007 (Table 9-7 and Table 9-9) and the P storage in the floc and surface soil in WY2007. That the soil integrated operating conditions over a longer period than water column data were available for, was a limitation of this exercise. We assumed that the total P in floc reflects the mass of P removed from water column. Figure 9-35 presents a schematic showing P mass in select compartments of the STA. For STA-5, P retained from water column data was available for each flow way therefore P mass balance was carried out for each flow way. The arrows indicate flux of P between compartments. Unavailability of FPS values for Central Flow-way rendered our analysis somewhat limited. The mean value of FPS for STA-5 was estimated using available data from Northern Flow-way. The approximate values are shown in parenthesis in the schematic. Soil P storage increased in both flow ways from the background value. This increased SPS in the surface soil was probably due to influx of P from sub surface soil or from the floc layer. The estimated P movement between floc layer and surface soil in Central Flow-way is depicted as a bi-directional arrow as accurate direction of P movement could not be determined. The sub surface horizon (below 10 cm) of STA appeared to be functioning as a net source for P as it seemed to flux P into the floc and surface layer during the POR. This movement of P could be mediated by vegetation through P mining from deeper soil layers or via diffusive flux. Since P did not leave the system through water column, the STA is functioning as a net sink for P removal.
Effect of vegetation on soil phosphorus storage
Changes in soil P storage over time were compared between EAV (Cell 1A and 2A) and SAV (Cells 1B and 2B) however absence of floc data from Cell 2A and 2B made this attempt somewhat limited. Table 9-21 presents soil P accretion rate (PAR; g P/m2/yr) calculated from WY2004 and WY2007 data. This was calculated separately for floc and soil. The floc P

262 | P a g e
accretion rate (1.9 g P/m2/yr) for EAV cell was found to be different from SAV cells (0.3 g P/m2/yr). In case of 0-10 cm soils, P accretion rate was found to be positive, 0.3 g P/m2/yr for EAV cells and 0.84 g P/m2/yr for SAV cells. In this particular case, floc P accretion values suggested EAV community accreting more P over time with comparison to SAV community. For soils, SAV-dominated cells appeared to accrete more P per unit time compared to EAV-dominated cells.
9.8.2 Nitrogen inventory
The change in N over the POR of STA-5 was analyzed by calculating the floc N storage (FNS) and soil N storage (SNS). The concentration of nitrogen (g N/kg) in floc and soil is depicted in Table 9-22 and Table 9-23, respectively. The FNS and SNS are depicted in Table 9-24 and Table 9-25, respectively. Total N concentration for floc was not available for WY2004. The values of FNS increased from WY2003 to WY2007, whereas SNS values decreased from WY2001 values. The relationship between FNS and FPS is shown in Figure 9-36, and between SNS and SPS in Figure 9-37. Results show positive relationship between FNS and FPS for WY2003 samples but did not show any plausible relationship between SNS and SPS for every sampling year.
Nitrogen and P storage for each cell is presented in Figure 9-38. The low N: P ratios in the floc suggested that P was not limited. Mean value of N: P ratios for soils of STA-5 in WY2007 were found to be 33: 1. The N:P across the cells of STA-5 range from 27:1 (Cell 2A) to 50:1 (Cell 1B). Soils N: P ratio for WY2001 was found to be 54:1, suggesting an increase in the ratio from WY2001 to WY2007. High N:P ratio (30:1 to 40:1) in soils (0-10 cm) suggested P limitation.
9.8.3 Carbon inventory
The change in organic matter was estimated over the POR of the STA by calculating the floc C storage (FCS) and soil C storage (SCS). The concentration of C (g C/kg) in floc and soil is depicted in Table 9-26 and Table 9-27. Total C concentration for floc was not available for WY2004. Floc and soil carbon storage is shown in Table 9-28 and Table 9-29. Soil C storage followed the same trend as SPS and SNS in all cells across the sampling period.
Data on relationship between FPS and FCS is shown in Figure 9-39 and that between SPS and SCS is shown in Figure 9-40. No discernable relationship was found in P and C storages in floc and soil fraction across the sampling years. Strong relationship was observed between FCS and FNS as well as SCS and SNS as shown in Figure 9-41 and Figure 9-42. This suggested that all N fractions are either bound in organic forms or are closely associated with the organic matter present in the soil. The source of this closely linked C and N in the surface soil could possibly be the detrital matter accumulating from the wetland vegetation.
Carbon and P storage in soils for each cell is presented in Figure 9-43. The mean value of C: P ratios for soils decreased from 777:1 in WY2001 to 471:1 in WY2007. In WY2007 C: P ratios varied from 375:1 for Cell 2A to 717:1 for Cell 1B. Figure 9-44 depicts SCS and SNS for each cell from WY2007. The mean value of C: N ratio for soils was found to be 14:1. The C:N ratio in floc and soils are in the range of 13:1 to 14:1. These ratios are typical of those observed for microbial/plankton biomass and for soil organic matter. The existing C and N pools in soils are of crucial importance for maintaining various biogeochemical processes in wetlands. The sum

263 | P a g e
total of these processes determine microbial decomposition rates and control soil formation and long term accretion of nutrients. An adequate balance of these elements plays an important role in sequestering P and is critical for ensuring long term sustainability of STAs. This above analysis provided insights into the existing conditions of the STA soils.
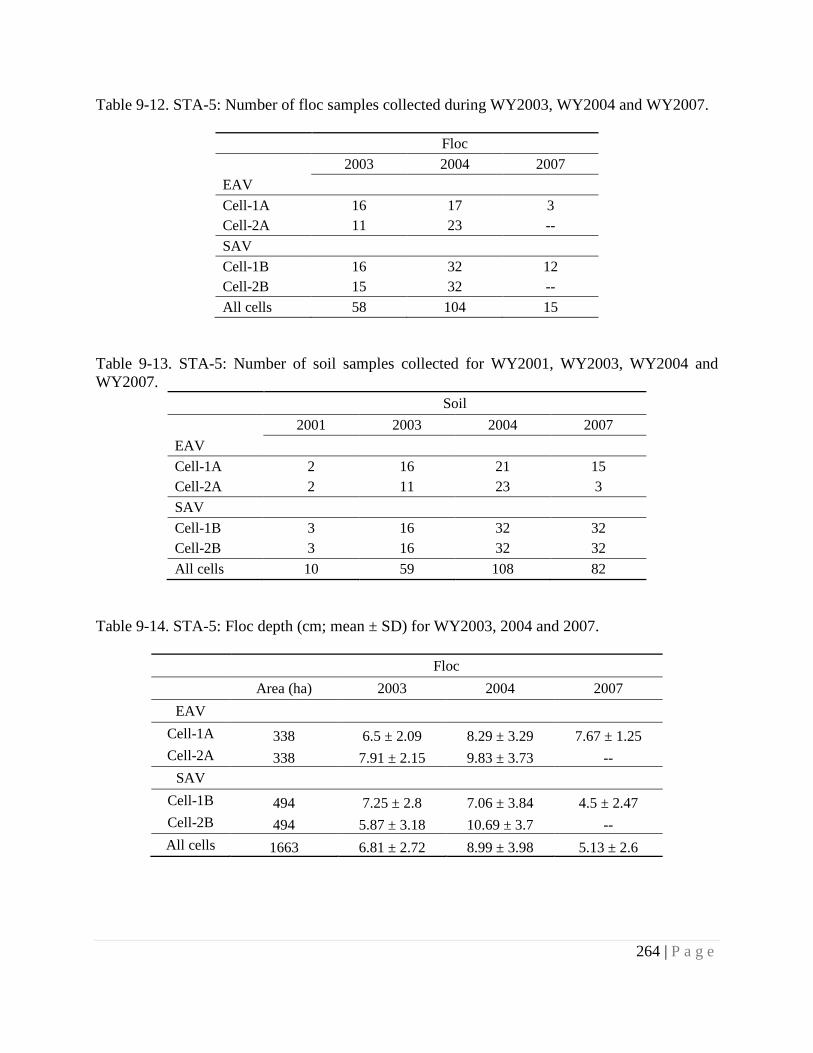
264 | P a g e
Table 9-12. STA-5: Number of floc samples collected during WY2003, WY2004 and WY2007.
Floc 2003 2004 2007 EAV Cell-1A 16 17 3 Cell-2A 11 23 -- SAV Cell-1B 16 32 12 Cell-2B 15 32 -- All cells 58 104 15
Table 9-13. STA-5: Number of soil samples collected for WY2001, WY2003, WY2004 and WY2007.
Soil 2001 2003 2004 2007
EAV Cell-1A 2 16 21 15 Cell-2A 2 11 23 3 SAV Cell-1B 3 16 32 32 Cell-2B 3 16 32 32 All cells 10 59 108 82
Table 9-14. STA-5: Floc depth (cm; mean ± SD) for WY2003, 2004 and 2007.
Floc Area (ha) 2003 2004 2007
EAV Cell-1A 338 6.5 ± 2.09 8.29 ± 3.29 7.67 ± 1.25 Cell-2A 338 7.91 ± 2.15 9.83 ± 3.73 --
SAV Cell-1B 494 7.25 ± 2.8 7.06 ± 3.84 4.5 ± 2.47 Cell-2B 494 5.87 ± 3.18 10.69 ± 3.7 -- All cells 1663 6.81 ± 2.72 8.99 ± 3.98 5.13 ± 2.6

265 | P a g e
Table 9-15. STA-5: Floc bulk den\sity (g/cm3; mean ± SD)
Floc 2003 2004 2007 EAV Cell-1A 0.06 ± 0.08 0.05 ± 0.04 0.11 ± 0.03 Cell-2A 0.02 ± 0.02 0.06 ± 0.04 -- SAV Cell-1B 0.06 ± 0.04 0.12 ± 0.06 0.11 ± 0.03 Cell-2B 0.09 ± 0.06 0.07 ± 0.04 -- All cells 0.06 ± 0.05 0.08 ± 0.05 0.11 ± 0.03
Table 9-16. STA-5: Soil bulk density (g/cm3; mean ± SD) Soil 2001 2003 2004 2007
EAV Cell-1A 0.39 ± 0.25 0.66 ± 0.27 0.64 ± 0.35 0.34 ± 0.16 Cell-2A 0.38 ± 0.12 0.73 ± 0.16 0.64 ± 0.17 0.8 ± 0.21 SAV Cell-1B 0.32 ± 0.01 0.32 ± 0.06 0.35 ± 0.1 0.29 ± 0.07 Cell-2B 0.31 ± 0.05 0.36 ± 0.15 0.36 ± 0.12 0.34 ± 0.13 All cells 0.34 ± 0.09 0.48 ± 0.15 0.47 ± 0.17 0.42 ± 0.13
Table 9-17. STA-5: Phosphorus concentration in floc (mg P/kg floc; mean ± SD)
Floc 2003 2004 2007 EAV Cell-1A 1283 ± 704 880 ± 499 1102 ± 505 Cell-2A 1502 ± 608 939 ± 384 -- SAV Cell-1B 979 ± 283 647 ± 142 1245 ± 472 Cell-2B 1090 ± 316 884 ± 349 -- All cells 1180 ± 444 824 ± 325 1187 ± 485

266 | P a g e
Table 9-18. STA-5: Phosphorus concentration in soil (mg P/kg soil; mean ± SD)
Soil 2001 2003 2004 2007
EAV Cell-1A 519 ± 58 381 ± 293 446 ± 212 803 ± 599 Cell-2A 387 ± 147 252 ± 117 319 ± 125 330 ± 296 SAV Cell-1B 522 ± 53 532 ± 207 509 ± 119 554 ± 135 Cell-2B 425 ± 56 602 ± 177 468 ± 120 741 ± 586 All cells 465 ± 74 465 ± 197 445 ± 139 615 ± 396
Table 9-19. STA-5: Floc phosphorus storage (FPS; g P/m2, mean ± SD)
Floc 2003 2004 2007 EAV Cell-1A 2.52 ± 1.08 2.6 ± 1.85 8.28 ± 3.73 Cell-2A 2.18 ± 0.82 4.11 ± 2.45 -- SAV Cell-1B 3.77 ± 2.12 4.74 ± 1.84 5.55 ± 2.6 Cell-2B 4.12 ± 2.41 5.35 ± 3.04 -- All cells 3.3 ± 1.73 4.36 ± 2.32 6.1 ± 3.1
Table 9-20. STA-5: Soil phosphorus storage (g P/m2, mean ± SD) in soil (0-10 cm).
Soil 2001 2003 2004 2007
EAV Cell-1A 18.76 ± 10.69 19.53 ± 7.42 23.76 ± 14.41 22.08 ± 10.04 Cell-2A 12.79 ± 0.9 17.35 ± 7.73 18.91 ± 6.66 22.12 ± 18.13 SAV Cell-1B 16.51 ± 1.42 16.9 ± 7.3 17.61 ± 6.32 15.61 ± 3.36 Cell-2B 13.12 ± 0.25 22.34 ± 14.49 16.82 ± 6.36 23.86 ± 23.62 All cells 15.21 ± 2.85 19.14 ± 9.55 18.89 ± 8.04 20.7 ± 13.73

267 | P a g e
Table 9-21. STA-5: Phosphorus accretion rate (PAR; g P/m2/yr) in floc and soils. Comparison between EAV and SAV cells.
Floc SPS
Floc PAR g P/m2 /yr
Soil SPS
Soil PAR g P/m2 /yr
2004 2007 2004 2007 EAV 0.26 Cell-1A 2.6 ± 1.85 8.28 ± 3.73 1.89 23.76 ± 14.41 22.08 ± 10.04 -0.56 Cell-2A 4.11 ± 2.45 -- -- 18.91 ± 6.66 22.12 ± 18.13 1.07 SAV
0.84
Cell-1B 4.74 ± 1.84 5.55 ± 2.6 0.27 17.61 ± 6.32 15.61 ± 3.36 -0.67 Cell-2B 5.35 ± 3.04 -- -- 16.82 ± 6.36 23.86 ± 23.62 2.34

268 | P a g e
Figure 9-28. STA-5: Variation in soil TP concentration (mg P/kg) across the cells as a function of age.
Figure 9-29. STA-5: Total phosphorus concentration (mg P/kg) in floc for each cell. Error bars represent standard error of the mean.
150
250
350
450
550
650
750
850
0 1 2 3 4 5 6 7 8 9
TP (m
g P/
kg)
Age (yr)
Avg
Cell-1A
Cell-2A
Cell-1B
Cell-2B
0
200
400
600
800
1000
1200
1400
1600
1800
Cell-1A Cell-2A Cell-1B Cell-2B
TP (m
g P/
kg)
Floc 2003 2004 2007

269 | P a g e
Figure 9-30. STA-5: Total phosphorus concentration (mg P/kg) in soil (0-10 cm) in each cell. Error bars represent standard error of the mean.
Figure 9-31. STA-5: Change in total phosphorus concentration (mg P/kg) in floc and soil (0-10 cm) with time. Error bars represent standard error of the mean.
0
100
200
300
400
500
600
700
800
900
1000
Cell-1A Cell-2A Cell-1B Cell-2B
TP (m
g P/
kg)
Soil (0-10 cm) 2001 2003
2004 2007
0
200
400
600
800
1000
1200
1400
2001 2003 2004 2007
TP (m
g P/
kg)
Floc Soil

270 | P a g e
Figure 9-32. STA-5: Total phosphorus storage (g P/m2) in floc from the different cells. Error bars represent the standard error of the mean.
Figure 9-33. STA-5: Total phosphorus storage (g P/m2) in soil (0-10 cm) from the different cells. Error bars represent the standard error of the mean.
0
2
4
6
8
10
12
Cell-1A Cell-2A Cell-1B Cell-2B
FPS
(g P
/m2 )
Floc 2003 2004 2007
0
5
10
15
20
25
30
35
Cell-1A Cell-2A Cell-1B Cell-2B
SPS
(g P
/m2 )
Soil (0-10 cm) 2001 2003
2004 2007

271 | P a g e
Figure 9-34. STA-5: Change over time in phosphorus storage (g P/m2) in floc and soil (0-10 cm). Error bars represent the standard error of the mean.
0
3
6
9
12
15
18
21
24
2001 2003 2004 2007
SPS
(g P
/m2 )
Floc Soil

272 | P a g e
Figure 9-35. STA-5: Phosphorus mass balance: soil P storage vis-à-vis net P retained from water quality data. All values are in g P/m2. Arrows indicate flux of P from different compartment. Top row blue arrows indicate direction of P movement between water and floc. Phosphorus loading for each individaul flow way for the whole period of record was not available, however STA mean P loading for the total period of operation is shown.Middle row orange arrows show P movement between floc and surface soil (0-10 cm). Lower row blue arrows indicate P movement between surface (0-10 cm) and sub-surface soil (10-30 cm). STA-5 was divided into Northern Flow-way and Central Flow-way. Mean floc P storage for STA-5 is obtained from Northern Flow-way only, and represents an approximate value therefore shown in parenthesis.

273 | P a g e
Table 9-22. STA-5: Floc nitrogen concentration (g N/kg; mean ± SD)
Floc 2003 2007 EAV Cell-1A 27 ± 8 24 ± 1 Cell-2A 33 ± 3 -- SAV Cell-1B 30 ± 4 30 ± 3 Cell-2B 29 ± 5 -- All cells 30 ± 5 28 ± 2
Table 9-23. STA-5: Soil nitrogen concentration (g N/kg; mean ± SD)
Soil 2001 2003 2004 2007
EAV Cell-1A 22 ± 10 15 ± 9 18 ± 12 20 ± 7 Cell-2A 23 ± 11 16 ± 6 16 ± 6 9 ± 5
SAV Cell-1B 31 ± 2 28 ± 4 27 ± 6 28 ± 5 Cell-2B 27 ± 3 23 ± 8 25 ± 6 23 ± 8 All cells 26 ± 6 22 ± 7 23 ± 7 21 ± 6

274 | P a g e
Table 9-24. STA-5: Floc nitrogen storage (g N/m2; mean ± SD).
Floc
2003 2007 EAV
Cell-1A 61 ± 36 205 ± 78 Cell-2A 55 ± 31 --
SAV Cell-1B 122 ± 69 146 ± 80 Cell-2B 122 ± 89 -- All cells 96 ± 61 170 ± 79
Table 9-25. STA-5: Soil nitrogen storage (g N/m2; mean ± SD) in soil (0-10 cm).
Soil 2001 2003 2004 2007
EAV Cell-1A 614 ± 156 798 ± 232 783 ± 317 631 ± 314 Cell-2A 723 ± 133 1104 ± 294 954 ± 238 593 ± 339
SAV Cell-1B 966 ± 63 877 ± 122 919 ± 136 786 ± 130 Cell-2B 843 ± 79 735 ± 168 847 ± 167 698 ± 176 All cells 809 ± 100 865 ± 193 877 ± 203 689 ± 223

275 | P a g e
Table 9-26. STA-5: Floc carbon concentration (TC; g C/kg, mean ± SD)
Floc
2003 2007 EAV
Cell-1A 340 ± 105 349 ± 28 Cell-2A 402 ± 14 --
SAV Cell-1B 409 ± 44 394 ± 28 Cell-2B 395 ± 62 -- All cells 389 ± 56 375 ± 28
Table 9-27. STA-5: Soil carbon concentration (TC; g C/kg, mean ± SD)
Soil 2001 2003 2004 2007
EAV Cell-1A 318 ± 131 217 ± 126 252 ± 155 278 ± 104 Cell-2A 310 ± 143 215 ± 82 218 ± 80 122 ± 75
SAV Cell-1B 443 ± 31 413 ± 59 396 ± 85 395 ± 72 Cell-2B 411 ± 51 342 ± 104 367 ± 97 332 ± 122 All cells 381 ± 80 312 ± 91 322 ± 102 297 ± 94
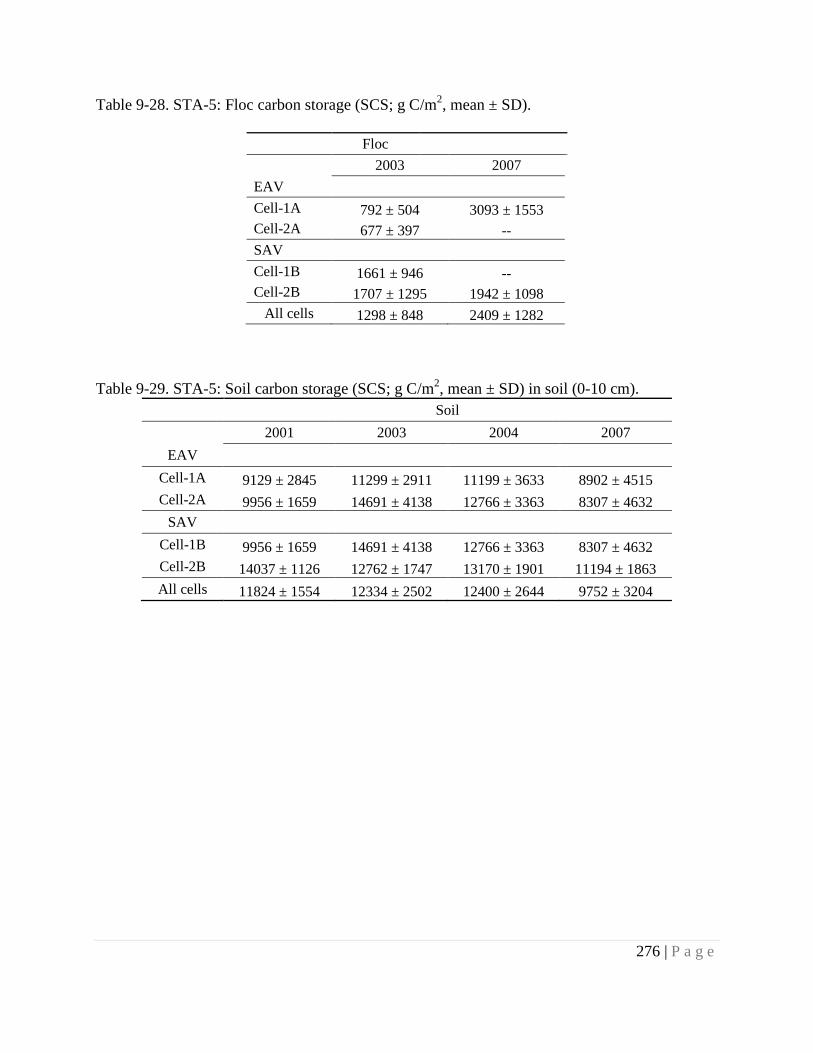
276 | P a g e
Table 9-28. STA-5: Floc carbon storage (SCS; g C/m2, mean ± SD).
Floc 2003 2007 EAV Cell-1A 792 ± 504 3093 ± 1553 Cell-2A 677 ± 397 -- SAV Cell-1B 1661 ± 946 -- Cell-2B 1707 ± 1295 1942 ± 1098
All cells 1298 ± 848 2409 ± 1282
Table 9-29. STA-5: Soil carbon storage (SCS; g C/m2, mean ± SD) in soil (0-10 cm). Soil 2001 2003 2004 2007
EAV Cell-1A 9129 ± 2845 11299 ± 2911 11199 ± 3633 8902 ± 4515 Cell-2A 9956 ± 1659 14691 ± 4138 12766 ± 3363 8307 ± 4632
SAV Cell-1B 9956 ± 1659 14691 ± 4138 12766 ± 3363 8307 ± 4632 Cell-2B 14037 ± 1126 12762 ± 1747 13170 ± 1901 11194 ± 1863 All cells 11824 ± 1554 12334 ± 2502 12400 ± 2644 9752 ± 3204

277 | P a g e
Figure 9-36. STA-5: Relationship between floc nitrogen storage (FNS, g N/m2) and floc phosphorus storage (FPS, g P/m2).
Figure 9-37. STA-5: Relationship between soil nitrogen storage (SNS, g N/m2) and soil phosphrous storage (SPS, g P/m2).
0
200
400
600
800
1000
1200
0 2 4 6 8 10 12
FNS
(g N
/m2 )
FPS (g P/m2)
Floc 2003 2007
0
200
400
600
800
1000
1200
1400
1600
1800
2000
0 20 40 60 80 100 120 140
SNS
(g N
/m2 )
SPS (g P/m2)
Soil (0-10 cm) 2001 2003
2004 2007

278 | P a g e
Figure 9-38. STA-5: Ratio of soil nitrogen storage (SNS; g N/m2) to soil phosphorus storage (SPS; g P/m2) in top 10 cm (WY2007 data only). Filled triangles indicate EAV cells, empty triangles represent SAV cells and filled square indiates N:P ratio for the whole STA.
Figure 9-39. STA-5: Relationship between floc carbon storage (FCS) and floc phosphorus storage (FPS).
STA-5
Cell-1A
Cell-2A
Cell-1B
Cell-2B
400
450
500
550
600
650
700
750
800
850
0 5 10 15 20 25 30
SNS
(g N
/ m
2 )
SPS (g P/m2)
0
1000
2000
3000
4000
5000
6000
0 2 4 6 8 10 12
FCS
(g C
/m2 )
FPS (g P/m2)
Floc 2003 2007

279 | P a g e
Figure 9-40. STA-5: Relationship between soil carbon storage (SCS) and soil phosphorus storage (SPS).
Figure 9-41. STA-5: Relationship between floc carbon storage (FCS) and floc nitrogen storage (FNS).
0
5000
10000
15000
20000
25000
30000
0 20 40 60 80 100 120 140
SCS
(g C
/m2 )
SPS (g P/m2)
Soil (0-10 cm) 2001 2003
2004 2007
0
2000
4000
6000
0 100 200 300 400
FCS
(g C
/m2 )
FNS (g N/m2)
Floc
2003
2007

280 | P a g e
Figure 9-42. STA-5: Relationship between soil carbon storage (SCS) and soil nitrogen storage (SNS).
Figure 9-43. STA-5: Ratio of soil carbon storage (SCS; g C/m2) to soil phosphorus storage (g P/m2) in top 10 cm (WY2007 data only). Filled triangles indicate EAV cells, empty triangles represe\nt SAV cells and filled square indiates C:P ratio for the whole STA.
0
5000
10000
15000
20000
25000
30000
0 500 1000 1500 2000
SCS
(g C
/m2 )
SNS (g N/m2)
Soil (0-10 cm)
2001 2003
2004 2007
STA-5
Cell-1A
Cell-2A
Cell-1B
Cell-2B
4000
5000
6000
7000
8000
9000
10000
11000
12000
0 5 10 15 20 25 30
SCS
(g C
/ m
2 )
SPS (g P/m2)

281 | P a g e
Figure 9-44. STA-5: Ratio of soil carbon storage (SCS; g C/m2) to soil nitrogen storage (SNS; g N/m2; WY2007 data only). Filled triangles indicate EAV cells, empty triangles represent SAV cells and filled square indiates C:N ratio for the whole STA.
STA-5
Cell-1A
Cell-2A
Cell-1B
Cell-2B
4000
5000
6000
7000
8000
9000
10000
11000
12000
400 500 600 700 800 900
SCS
(g C
/ m
2 )
SNS (g N/m2)

282 | P a g e
9.9 Conclusions
STA-5 was moderately loaded with water and P. Based on year-to-year and POR TP mass removal effectiveness (Northern Flow-way: 42%; Central Flow-way: 52%) STA-5 was a moderately performing STA. TP mass removal effectiveness, as calculated from the TP mass balance varied somewhat from year to year within cells, despite significant variability in hydraulic and P loading.
The analysis of topography and stage data over the POR showed approximately 85%, 87%, 88% and 77% EWA, in Cells 1A, 1B, 2A, and 2B, respectively. As a result, areal TP loading rates calculated directly from the TP mass balance were generally inaccurate by a few percent. However, in contrast with other STAs, even after correction for EWA, annual average outflow TP flow-weighted mean concentration (FWMC) was not correlated with annual areal TP loading rate. Inflow TP FWMC was shown to contribute to the scatter.
Depth analysis confirmed that in STA-5 cells, dryouts were common but extreme depths generally were not. Annual depth distribution was not a predictor of annual TP removal performance.
Three-month average outflow TP FWMC and TP mass removal effectiveness were not correlated with three-month hydraulic residence time (HRT).
It appears that each flow-way in STA-5 treated various water column P forms, soluble reactive phosphorus (SRP), dissolved organic phosphorus (DOP) and particulate phosphorus (PP), similarly. Generally, STA-5 enriched SRP and DOP in the water column TP pool, and preferentially removed PP from the TP pool.
Though annual SRP mass removal effectiveness was independent of annual areal Ca loading rate, annual areal SRP retention was positively to annual areal Ca retention. Possibly, Ca and P were retained jointly via a single process (presumably co-precipitation of P with the precipitation of Ca) in this STA.
STA-5 soils showed moderate to high bulk densities across all cells. These values represent high mineral content and low organic content.
Mean soils TP concentration for the STA remained unchanged from WY2001 to WY2004, but increased substantially from WY2004 to WY2007. Both FPS and SPS increased from WY2001 to WY2007. P mass balance conducted using floc and soil storages and water column TP retained dataset showed that P did not leave the system, we found this STA functioning as a net sink for P removal.
The low N: P ratios in the floc suggested that P was not limited. Mean value of N: P ratios for soils of STA-5 in WY2007 were found to be 33: 1. The range of N:P across the cells of STA-5 span from 27:1 (Cell 2A) to 50:1 (Cell 1B). N fractions are either bound in organic forms or are closely associated with the organic matter present in the soil. High N:P ratio (30:1 to 40:1) in soils (0-10 cm) suggested P limitation.

283 | P a g e
The mean value of C: N ratio for soils was found to be 14:1. The C:N ratio in floc and soils are in the range of 13 to 14. These ratios are typically of those observed for microbial/plankton biomass and for soil organic matter.

284 | P a g e
10 STORMWATER TREATMENT AREA 6 (STA-6)
10.1 Introduction
STA-6 is the smallest of the six STAs with a footprint of 915 ha (2257 ac). It is divided into three east-to-west flow-ways of one cell each (Figure 10-1). Only the two southern cells (Section 1: Cells 3 and 5) were considered in this analysis, as Section 2 was still in start-up. As of 2008, both Cells 3 and 5 were designated as emergent marshes (referred to as emergent aquatic vegetation (EAV)), and were managed as such. Section 1 initially received water in WY1998 and both cells were generally in operation throughout the POR, except when Section 1 was closed briefly in spring of 2007 for Long Term Plan enhancements construction (Pietro et al., 2008, Table 10-1). The POR for analyses of water quality included only data collected from WY2003 through WY2008, unless otherwise noted. The HLR for cells in STA-6 varied with time. The POR average HLRs for Cells 3 and 5 were approximately 30 m/yr and 10 m/yr, respectively. The associated POR average annual areal TP loading rates were 1.1 g P/m2/yr and 0.6 g/m2/yr, after correction for EWA. POR average hydraulic residence times were 4.5 d and 16.5 d for Cell 3 and Cell 5, respectively.

285 | P a g e
Figure 10-1. STA-6: Schematic showing plan view of cells and water control structures. (Source: Pietro et al., 2008)
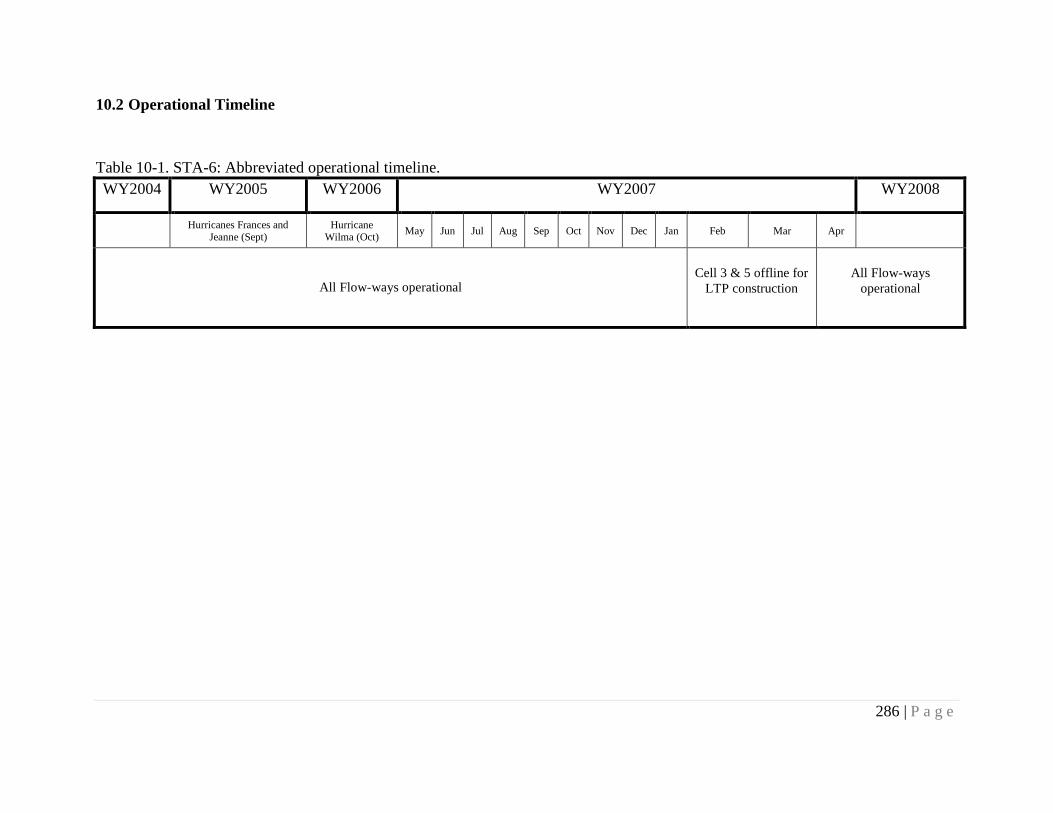
286 | P a g e
10.2 Operational Timeline
Table 10-1. STA-6: Abbreviated operational timeline. WY2004 WY2005 WY2006 WY2007 WY2008
Hurricanes Frances and
Jeanne (Sept) Hurricane
Wilma (Oct) May Jun Jul Aug Sep Oct Nov Dec Jan Feb Mar Apr
All Flow-ways operational Cell 3 & 5 offline for
LTP construction All Flow-ways
operational
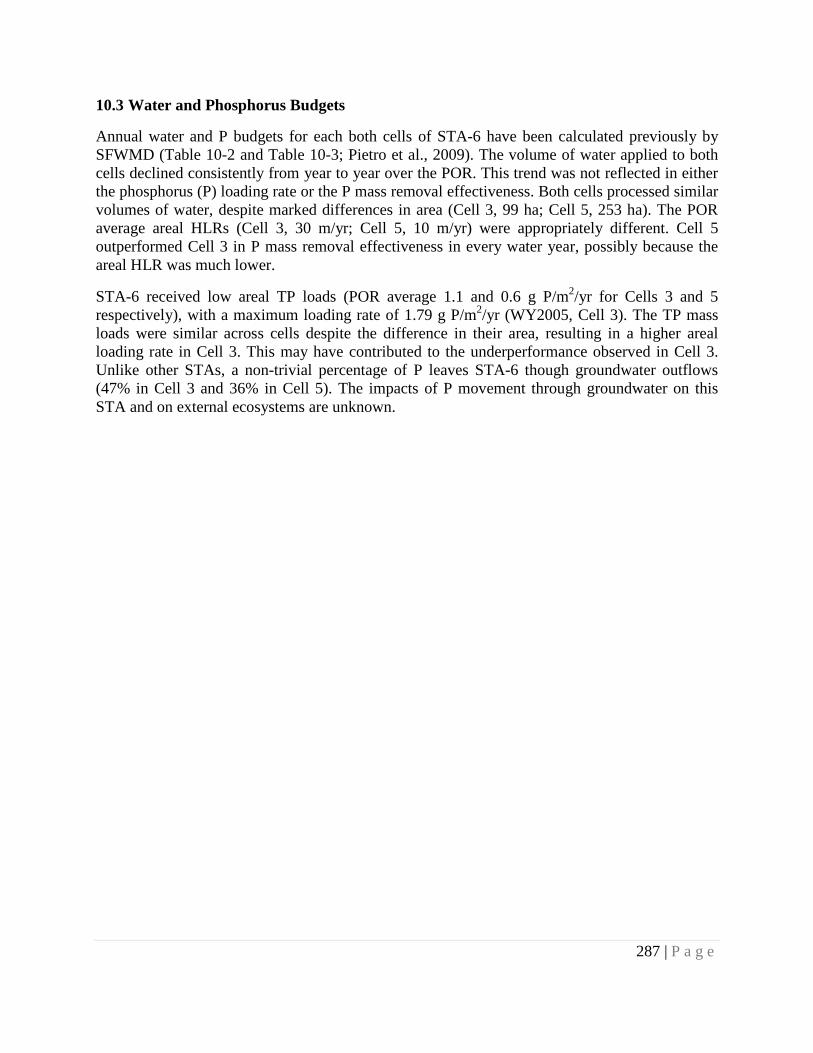
287 | P a g e
10.3 Water and Phosphorus Budgets
Annual water and P budgets for each both cells of STA-6 have been calculated previously by SFWMD (Table 10-2 and Table 10-3; Pietro et al., 2009). The volume of water applied to both cells declined consistently from year to year over the POR. This trend was not reflected in either the phosphorus (P) loading rate or the P mass removal effectiveness. Both cells processed similar volumes of water, despite marked differences in area (Cell 3, 99 ha; Cell 5, 253 ha). The POR average areal HLRs (Cell 3, 30 m/yr; Cell 5, 10 m/yr) were appropriately different. Cell 5 outperformed Cell 3 in P mass removal effectiveness in every water year, possibly because the areal HLR was much lower.
STA-6 received low areal TP loads (POR average 1.1 and 0.6 g P/m2/yr for Cells 3 and 5 respectively), with a maximum loading rate of 1.79 g P/m2/yr (WY2005, Cell 3). The TP mass loads were similar across cells despite the difference in their area, resulting in a higher areal loading rate in Cell 3. This may have contributed to the underperformance observed in Cell 3. Unlike other STAs, a non-trivial percentage of P leaves STA-6 though groundwater outflows (47% in Cell 3 and 36% in Cell 5). The impacts of P movement through groundwater on this STA and on external ecosystems are unknown.

288 | P a g e
Table 10-2. STA-6: Annual water budgets (hm3) for Cell 3 and Cell 5. Pietro et al., 2009.
Is Ig Ip ∑Inflow HLR Os Og ET ∑Outflow ΔS r ε
hm3/yr hm3/yr hm3/yr hm3/yr m/yr hm3/yr hm3/yr hm3/yr hm3/yr hm3/yr hm3/yr Cell 3 WY2003 30.9 1 1.2 33.2 38 19.1 8.5 1.3 28.9 0.4 -3.9 -12.70% WY2004 24.1 0.1 1.4 25.6 27 22.4 11.7 1.3 35.4 -0.4 9.4 30.80% WY2005 23 0.5 1.3 24.7 28 13 8.3 1.3 22.7 0.2 -1.8 -7.50% WY2006 20.5 1.6 1.1 23.3 27 15.9 5 1.3 22.2 -0.1 -1.1 -5.00% WY2007 18.3 1.5 0.7 20.5 41 10.2 8.8 1.3 20.3 -0.1 -0.3 -1.40% WY2008 3.4 3.2 1.1 7.7 15 1.2 5 1.3 7.6 0.3 0.2 2.20% POR 120.2 7.9 6.9 134.9 178 81.8 47.2 8 137 0.3 2.4 1.80% %In 89.10% 5.80% 5.10% %Out 59.70% 34.50% 5.80% 0.20% Cell 5 WY2003 34.7 0 3.1 37.9 16 24.9 5.5 3.4 33.8 0.8 -3.3 -9.20% WY2004 24.1 0 3.5 27.6 11 25.4 4.3 3.4 33 -0.8 4.6 15.20% WY2005 19.9 0.1 3.2 23.2 10 14.3 3.9 3.4 21.7 0 -1.5 -6.90% WY2006 14.4 1 2.9 18.3 8 14.6 2 3.4 20 0.1 1.8 9.50% WY2007 17 0.3 1.8 19.2 10 10.5 5 3.4 18.8 0 -0.3 -1.80% WY2008 4.9 1.1 2.9 8.8 4 1.8 2 3.4 7.2 0.3 -1.3 -16.50% POR 114.9 2.5 17.5 135 58 91.4 22.8 20.4 134.6 0.3 -0.1 -0.10% %In 85.10% 1.90% 13.00% %Out 67.90% 17.00% 15.10% 0.20%
Is = surface water inflow; Ig = groundwater inflow; IP = precipitation; HLR = hydraulic residence time; Os = surface water outflow; Og = groundwater outflow; ET = evapotranspiration; ∆S = change in storage volume; r = water budget residual; ε = water budget error
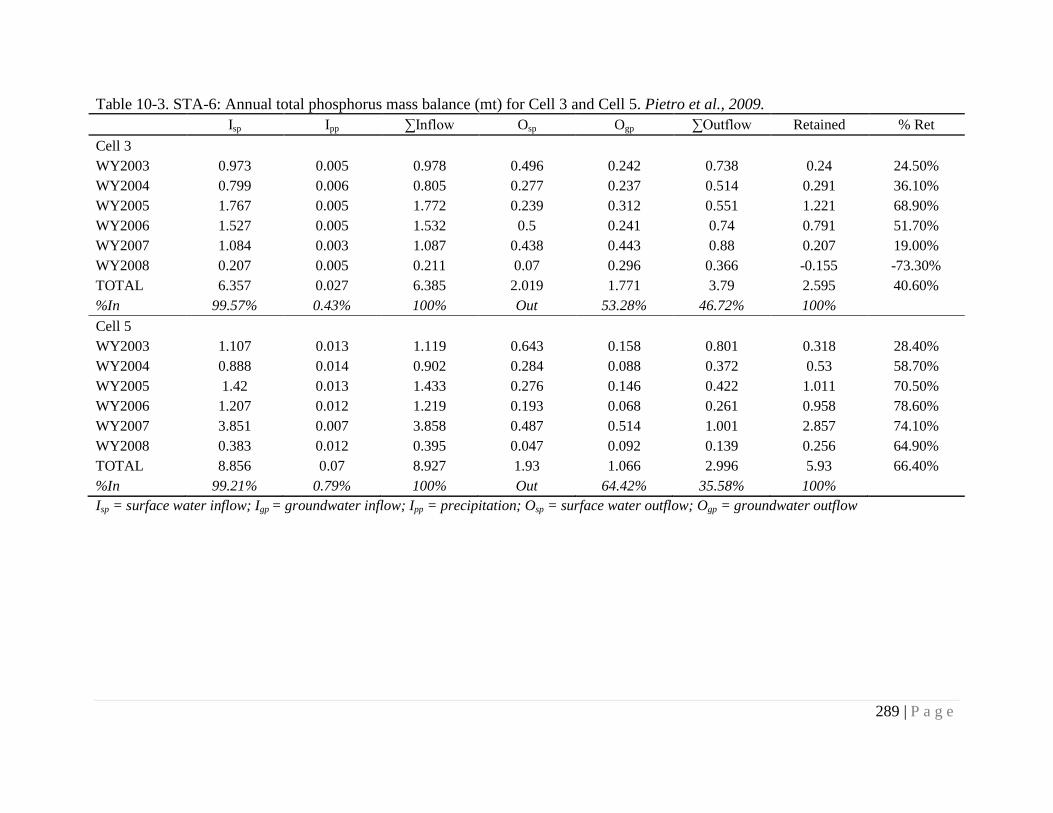
289 | P a g e
Table 10-3. STA-6: Annual total phosphorus mass balance (mt) for Cell 3 and Cell 5. Pietro et al., 2009.
Isp Ipp ∑Inflow Osp Ogp ∑Outflow Retained % Ret Cell 3 WY2003 0.973 0.005 0.978 0.496 0.242 0.738 0.24 24.50% WY2004 0.799 0.006 0.805 0.277 0.237 0.514 0.291 36.10% WY2005 1.767 0.005 1.772 0.239 0.312 0.551 1.221 68.90% WY2006 1.527 0.005 1.532 0.5 0.241 0.74 0.791 51.70% WY2007 1.084 0.003 1.087 0.438 0.443 0.88 0.207 19.00% WY2008 0.207 0.005 0.211 0.07 0.296 0.366 -0.155 -73.30% TOTAL 6.357 0.027 6.385 2.019 1.771 3.79 2.595 40.60% %In 99.57% 0.43% 100% Out 53.28% 46.72% 100% Cell 5 WY2003 1.107 0.013 1.119 0.643 0.158 0.801 0.318 28.40% WY2004 0.888 0.014 0.902 0.284 0.088 0.372 0.53 58.70% WY2005 1.42 0.013 1.433 0.276 0.146 0.422 1.011 70.50% WY2006 1.207 0.012 1.219 0.193 0.068 0.261 0.958 78.60% WY2007 3.851 0.007 3.858 0.487 0.514 1.001 2.857 74.10% WY2008 0.383 0.012 0.395 0.047 0.092 0.139 0.256 64.90% TOTAL 8.856 0.07 8.927 1.93 1.066 2.996 5.93 66.40% %In 99.21% 0.79% 100% Out 64.42% 35.58% 100% Isp = surface water inflow; Igp = groundwater inflow; Ipp = precipitation; Osp = surface water outflow; Ogp = groundwater outflow

290 | P a g e
10.4 Elevation Distribution, Wetted Area and Depth
STA-6 has a mean ground elevation of about 13 ft NGVD29 (Figure 10-2). The elevation ranges in cells in this STA moderate (> 2ft) compared to cells in other STAs (Figure 10-3 and Figure 10-4). In no cell was the POR mean stage greater than the maximum ground elevation, suggesting that flooding was inconsistent in STA-6 cells. The wide standard deviations (ca. 1 ft) of stage in all cells also indicate that water levels were variable and wetting and drying was common. Neither the shape nor the range of the elevation distributions predicted the TP mass removal effectiveness for STA-6 cells.
The average annual EWA in STA-6 cells was less than 100% in most water years (Figure 10-5). In this study, STA-6 had the second lowest EWA among all STAs, after STA-5. The drought in WY2007 and WY2008 impacted EWA in STA-6. Additionally, all cells in STA-6 tended to partially dry in May and operate at higher average EWA in the period of July through November (Figure 10-6 and Figure 10-7).
STA-6 received low areal TP loads, as compared to other STAs (Table 10-4). The increase in loading rate following correction for EWA was often insignificant, except in WY2007 in Cell 3 (TP LR increased by 0.34 g/m2 [30%.]) Within STA-6, annual outflow TP FWMC was not correlated with annual areal P loading rate (Figure 10-8Figure 9-10). Water years were divided into “low”, “medium” and “high” inflow TP FWMC categories. “High” captured a single year with exceptionally high inflow TP FWMC (0.22 mg/L), while “medium” and “low” two distinct groups of inflow values. “Low” corresponds to annual inflow TP FWMC ≤ 0.05 mg/L; “Medium,” 0.05 mg/L < TP FWMC ≤ 0.10 mg/L; and “High,” TP FWMC > 0.10 mg/L. The outlier in the upper left region that disrupts the apparent relationship between these variables represents Cell 3 in WY2008. In that year, Cell 3 experienced a prolonged dry down period that may have allowed the oxidation of soil organic matter and the release of soluble P. A flush of P upon reflooding could have raised the outflow TP concentration. The r2 increases to 0.41 when data from that year is removed from the regression.
No correlation was found between monthly SRP mass removal effectiveness and monthly average EWA (Figure 10-9). Similarly, monthly SRP mass removal effectiveness was independent of the change in EWA with respect to the previous month (Figure 10-10). That is, the reflooding process did not create a flux of SRP large enough to influence the monthly SRP mass removal effectiveness. One weakness of Figure 10-10 is that it fails to capture the duration of dry-out periods. Simply knowing that a certain fraction of a cell is drying or flooding is not as useful as knowing how long that fraction had been dry and oxidizing before the reflooding occurred. A dry-down analysis of STA-6 to be included in the 2010 SFER may shed light on the matter (Pietro et al., 2010, in review). SRP mass removal effectiveness fluctuated seasonally; effectiveness increased in the early months of the year as EWA declined and decreased when the stage increased in June and July (Figure 10-6 and Figure 10-7). It is unclear why this trend is not captured by Figure 10-10.

291 | P a g e
Depth analysis
Annual probability of depth exceedance varied across cells and time in STA-6 (Figure 10-11 and Figure 10-12). Non-cumulative depth distributions may be found in Table 14-4 in the appendix. The curves for drought years WY2007 and WY2008 are shifted down, relative to other water years in each cell. In Cell 3, was remarkably shallow relative to cells in other STAs; maximum depth was never more than about 3 ft and at least 90% of the area*time was less than 2.5 ft deep. Shape and distribution of curves did not predict annual or long term P removal performance.
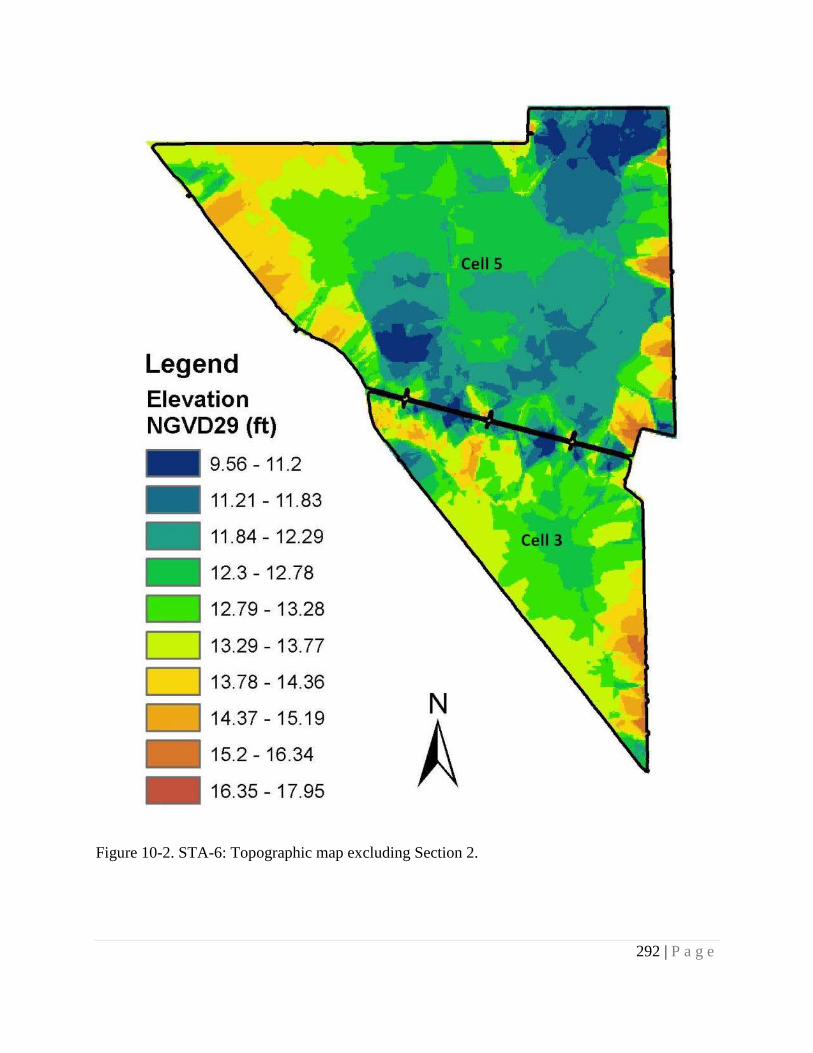
292 | P a g e
Figure 10-2. STA-6: Topographic map excluding Section 2.

293 | P a g e
Figure 10-3. STA-6: Cumulative elevation distribution for Cell 3. Vertical lines indicate period-of-record (WY2003-WY2008) mean stage ± 1 standard deviation.
Figure 10-4. STA-6: Cumulative elevation distribution for Cell 5. Vertical lines indicate period-of-record (WY2003-WY2008) mean stage ± 1 standard deviation.
0%
20%
40%
60%
80%
100%
10 11 12 13 14 15
Cum
ulat
ive
elev
atio
n di
stri
butio
n
Feet of elevation NGVD
0%
20%
40%
60%
80%
100%
10 11 12 13 14 15
Cum
ulat
ive
elev
atio
n di
stri
butio
n
Feet of elevation NGVD

294 | P a g e
Figure 10-5. STA-6: Timeseries of annual average estimated wetted area. Both cells are EAV.
Figure 10-6. STA-6: Intra-annual estimated wetted area*time (EWA) and soluble reactive phosphorus (SRP) mass removal effectiveness for Cell 3. Each point is averaged over the period of record (WY2003 – WY2008).
0%
20%
40%
60%
80%
100%
Floo
ded
Surf
ace
Are
a*Ti
me
Cell 3
Cell 5
-500%
-400%
-300%
-200%
-100%
0%
100%
200%
0%
20%
40%
60%
80%
100%
SRP
mas
s re
mov
al e
ffec
tiven
ess
Wet
ted
Are
a*Ti
me
EWA
SRP Mass Removal Efficiency

295 | P a g e
Figure 10-7. STA-6: Intra-annual estimated wetted area*time (EWA) and soluble reactive phosphorus (SRP) mass removal effectiveness for Cell 5. Each point is averaged over the period of record (WY2003 – WY2008).
Table 10-4. STA-6: Annual TP loading rates before and after adjustment for EWA.
Water Year Cell 3 Cell 5
TP LR (g/m2)a
TP LR (g/m2)b Difference TP LR
(g/m2)a TP LR (g/m2)b Difference
2003 0.98 1.07 0.09 0.44 0.44 0.01 2004 0.81 0.81 0.01 0.35 0.35 0.00 2005 1.78 1.79 0.01 0.56 0.56 0.00 2006 1.54 1.56 0.02 0.48 0.48 0.00 2007 1.09 1.43 0.34 1.52 1.59 0.07 2008 0.21 0.22 0.01 0.15 0.15 0.00
a TP LR before EWA adjustment (assuming EWA=100%) b TP LR after EWA adjustment
-60%
-40%
-20%
0%
20%
40%
60%
80%
100%
0%
20%
40%
60%
80%
100%
SRP
mas
s re
mov
al e
ffec
tiven
ess
Wet
ted
Are
a*Ti
me
EWA
SRP Mass Removal Efficiency
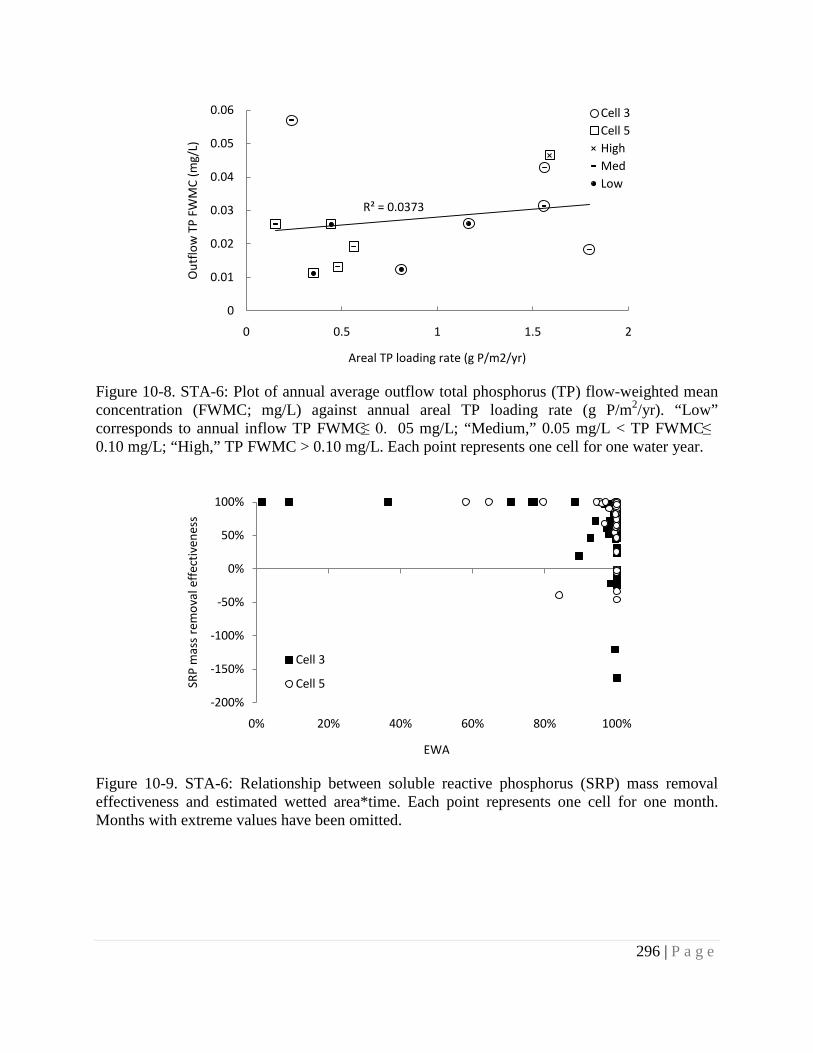
296 | P a g e
Figure 10-8. STA-6: Plot of annual average outflow total phosphorus (TP) flow-weighted mean concentration (FWMC; mg/L) against annual areal TP loading rate (g P/m2/yr). “Low” corresponds to annual inflow TP FWMC ≤ 0. 05 mg/L; “Medium,” 0.05 mg/L < TP FWMC ≤ 0.10 mg/L; “High,” TP FWMC > 0.10 mg/L. Each point represents one cell for one water year.
Figure 10-9. STA-6: Relationship between soluble reactive phosphorus (SRP) mass removal effectiveness and estimated wetted area*time. Each point represents one cell for one month. Months with extreme values have been omitted.
R² = 0.0373
0
0.01
0.02
0.03
0.04
0.05
0.06
0 0.5 1 1.5 2
Out
flow
TP
FWM
C (m
g/L)
Areal TP loading rate (g P/m2/yr)
Cell 3Cell 5HighMedLow
-200%
-150%
-100%
-50%
0%
50%
100%
0% 20% 40% 60% 80% 100%
SRP
mas
s re
mov
al e
ffec
tiven
ess
EWA
Cell 3
Cell 5

297 | P a g e
Figure 10-10. STA-6: Relationship between monthly average soluble reactive phosphorus (SRP) mass removal effectiveness and the absolute change in monthly average fractional estimated wetted area*time (EWA). Each point represents one cell for one month.
Figure 10-11. STA-6: Exceedance probability of depths for Cell 3.
-200%
-150%
-100%
-50%
0%
50%
100%
-0.8 -0.6 -0.4 -0.2 0 0.2 0.4 0.6 0.8
SRP
mas
s re
mov
al e
ffec
tiven
ess
Change in % EWA
Cell 3
Cell 5
0
0.5
1
1.5
2
2.5
3
3.5
4
0% 20% 40% 60% 80% 100%
Dep
th
Probability of exceedance
WY2003
WY2004
WY2005
WY2006
WY2007
WY2008

298 | P a g e
Figure 10-12. STA-6: Exceedance probability of depths for Cell 5.
0
0.5
1
1.5
2
2.5
3
3.5
4
0% 20% 40% 60% 80% 100%
Dep
th
Probability of exceedance
WY2003
WY2004
WY2005
WY2006
WY2007
WY2008

299 | P a g e
10.5 Hydraulic Residence Time
The median nominal three-month average HRT for Cell 3 and Cell 5 from May 2002 through April 2008 were 6 d and 26 d, respectively (Table 14-21 and Table 14-22 in the appendix). Nominal HRTs ranged from 1 to 22 days for Cell 3, and 5 to 101 days for Cell 5. The range of HRTs included in this study is illustrated by the bounds of the x-axes in Figure 10-13 and Figure 10-14.
Weak correlations were found for outflow TP FWMC and TP mass removal effectiveness against three-month average nominal residence time (Figure 10-13 and Figure 10-14). In Cell 5, TP removal effectiveness increased with increasing HRT (r2 = 0.28), but in Cell 3, there was no correlation between these variables (r2 = 0.09). In general, uncertainties in flow and concentration measurements, errors in estimating HRTs, and stochastic variability in other factors (such as vegetation, soil, etc.) could have affected these results. In particular, some portion of the wetlands may not be involved in the flow due to the presence of stagnant zones; therefore the considerable errors could also be generated during the estimation of nominal HRTs (Guardo, 1999).
Nominal HRTs could be better estimated by breaking down the transient data over any specific period or events. In some instances, HRTs values tended to be unreasonably high because of extremely low flow operations during that period. Also, errors in the estimates of nominal HRTs in STA-6 could be significantly reduced by considering longer period average (such as yearly average) because this will reduce the uncertainty of the measured data. Results suggest that the short period (i.e., three-month) is not suitable to estimate nominal HRTs from the given data of STA-6.

300 | P a g e
Figure 10-13. STA-6: Comparison of three-month rolling average flow-weighted total phosphorus outflow concentrations (mg/L) with corresponding average nominal hydraulic residence times (HRT; days) in Cells 3 and 5.
Figure 10-14. STA-6: Comparison of three-month total phosphorus (TP) mass removal effectiveness with corresponding average nominal hydraulic residence times (HRT; days) in Cells 3 and 5.
0.00
0.02
0.04
0.06
0.08
0 15 30 45 60 75
Out
flow
TP
FWM
C (m
g/L)
HRT (days)
Cell 3
Cell 5
0
25
50
75
100
0 15 30 45 60 75
TP m
ass
rem
oval
eff
ectiv
enes
s (%
)
HRT (days)
Cell 3
Cell 5

301 | P a g e
10.6 Water Column Chemical Constituents
Cells in STA-6 treated the three fractions within water column TP differentially, with PP consistently preferentially removed from the TP pool (Figure 10-15 through Figure 10-17). Across both cells, SRP and DOP were consistently enriched in the TP pool from inflow to outflow. Enrichment of SRP may have arisen from wetting and drying in this STA, or from the comparatively strong treatment of PP. SRP took up a smaller fraction of inflow TP (ca. 10-40%) and DOP comprised a larger fraction of outflow TP (ca. 20-60%) than was observed for other STAs. The inflow proportion of P species did not predict the P mass removal effectiveness for cells in STA-6.
Calcium loading was comparable in Cell 3 (2.7 kg Ca/m2/yr) and Cell 5 (0.6 kg Ca/m2/yr) to cells in other STAs (Table 10-5), but did not influence SRP mass removal effectiveness (Figure 10-18). The inflow Ca FWMCs for cells in STA-6 (POR average approximately 100 mg/L) were similar to those observed in all cells in all STAs. Stoichiometrically, Ca availability may not limiting SRP removal in this system, and only a small fraction of inflow Ca interacts with P. However, neither annual SRP retention and mass removal effectiveness were correlated with annual areal Ca retention in STA-6 (Figure 10-19 and Figure 10-20). Though both cells in STA-6 retained Ca at areal rates comparable to cells in other STAs, that Ca evidently did not remove SRP simultaneously.
The magnitude of the net Ca flux in all STAs also deserves note; in various years, these cells have gained as much as 1 kg Ca/m2, based on water chemistry data. However, while no Ca data are available for STA-6, other STAs report soil Ca storages of only several hundred g Ca/m2 in the top 10 cm. It is unlikely that Ca fluxes of this magnitude were transfered to and from the soil when soil Ca storages were so comparatively low. Additional Ca storage in floc, biofilms and periphyton may account for this discrepency. Only STA-2 and STA-6 experienced positive net Ca retention in every year of the record.

302 | P a g e
Figure 10-15. STA-6: Proportion of total phosphorus (TP) that is soluble reactive phosphorus (SRP) for outflow water and inflow water. Each point represents one flow-way for one water year. Points that fall below the 1:1 line indicate preferential removal of SRP from the TP pool.
Figure 10-16. STA-6: Proportion of total phosphorus (TP) that is dissolved organic phosphorus (DOP) for outflow water and inflow water. Each point represents one flow-way for one water year. Points that fall above the 1:1 line indicate enrichment of DOP in the TP pool.
0%
20%
40%
60%
80%
100%
0% 20% 40% 60% 80% 100%
Out
flow
SRP
Pro
port
ion
of T
P
Inflow SRP Proportion of TP
Cell 3
Cell 5
1:1 Line
0%
20%
40%
60%
80%
100%
0% 20% 40% 60% 80% 100%
Out
flow
DO
P Pr
opor
tion
of T
P
Inflow DOP Proportion of TP
Cell 3
Cell 5
1:1 Line

303 | P a g e
Figure 10-17. STA-6: Proportion of total phosphorus (TP) that is particulate phosphorus (PP) for outflow water and inflow water. Each point represents one flow-way for one water year. Points that fall below the 1:1 line indicate preferential removal of PP from the TP pool.
Table 10-5. STA-6: Period-of-record flow-weighted mean concentrations (FWMC; mg/L) and average annual areal loading rates (LR; g/m2/yr) of selected non-phosphorus chemicals.
Ca SO4 NOx NO2 NH4 STA-6 FWMC LR FWMC LR FWMC LR FWMC LR FWMC LR Cell 3 102 2696 -- -- 0.16 4.25 -- -- -- -- Cell 5 105 874 -- -- 0.22 1.79 -- -- -- --
0%
20%
40%
60%
80%
100%
0% 20% 40% 60% 80% 100%
Out
flow
PP
Prop
ortio
n of
TP
Inflow PP Proportion of TP
Cell 3
Cell 5
1:1 Line
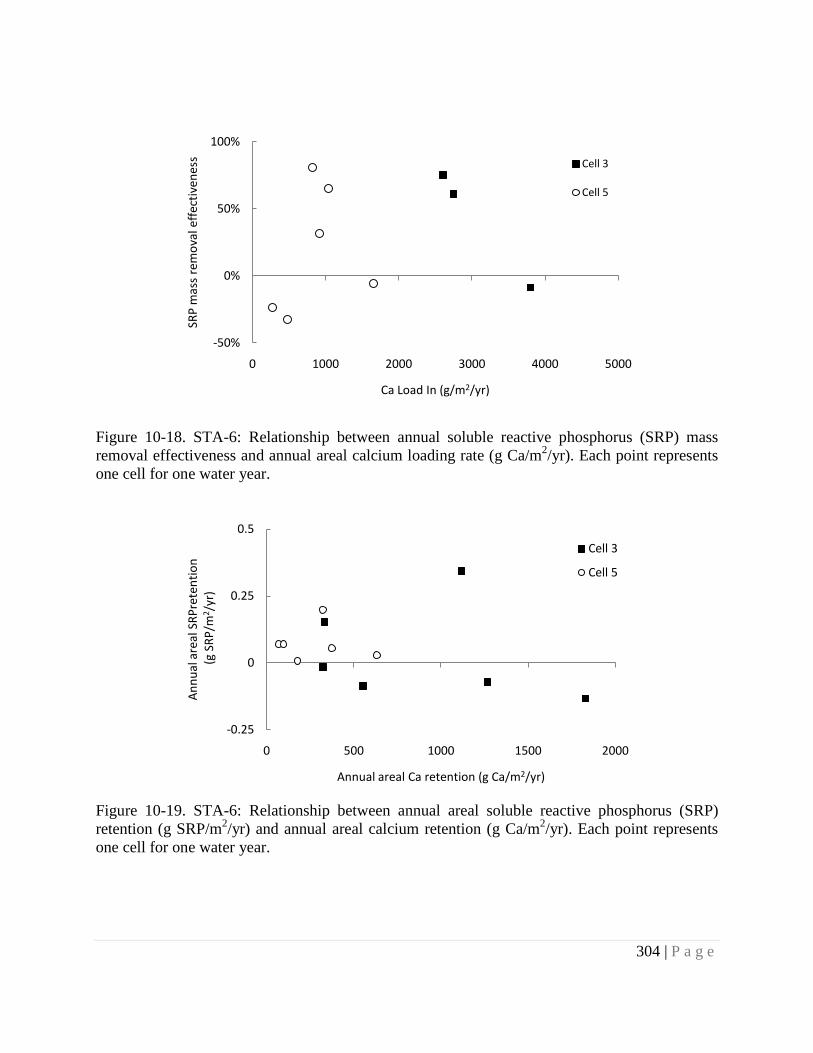
304 | P a g e
Figure 10-18. STA-6: Relationship between annual soluble reactive phosphorus (SRP) mass removal effectiveness and annual areal calcium loading rate (g Ca/m2/yr). Each point represents one cell for one water year.
Figure 10-19. STA-6: Relationship between annual areal soluble reactive phosphorus (SRP) retention (g SRP/m2/yr) and annual areal calcium retention (g Ca/m2/yr). Each point represents one cell for one water year.
-50%
0%
50%
100%
0 1000 2000 3000 4000 5000
SRP
mas
s re
mov
al e
ffec
tiven
ess
Ca Load In (g/m2/yr)
Cell 3
Cell 5
-0.25
0
0.25
0.5
0 500 1000 1500 2000
Ann
ual a
real
SRP
rete
ntio
n(g
SRP
/m2 /
yr)
Annual areal Ca retention (g Ca/m2/yr)
Cell 3
Cell 5

305 | P a g e
Figure 10-20. STA-6: Relationship between annual soluble reactive phosphorus (SRP) mass removal effectiveness and annual areal calcium retention (g Ca/m2/yr). Each point represents one cell for one water year.
-200%
-100%
0%
100%
0 500 1000 1500 2000
Ann
ual S
RP r
emov
al e
ffec
tiven
ess
Annual areal Ca retention (g Ca/m2/yr)
Cell 3
Cell 5

306 | P a g e
10.7 Soil Nutrients
10.7.1 Floc and soil physico-chemical properties
STA-6 became operational in WY1998; however the soil sampling frequency during the POR had been minimal. Soils data used for the analysis was collated from two sampling events (WY2001 and WY2004). Soil and floc samples were collected from Cells 3 and 5 (both EAV) in WY2004. These are depicted in Table 10-6. In WY2001, Soil and Water Sciences Department (UF) collected soil samples as a part of research project. These 10 samples were collected from Cell 5 only and therefore our ability to compare temporal changes in soil characteristics, including floc depth, bulk density and soil phosphorus storage across the whole STA was limited. Floc functions as an effective sink for P and could potentially serve as key indicator of system performance; therefore its measurement is crucial for calculating accurate mass balance of soil nutrients. Table 10-7 presents depth and bulk density of the floc in the cells of STA-6. Average floc depth was found to be 7.77 ± 2.98 cm (mean ± SD). Both floc depth and floc bulk density did not change much across two cells. This observation could be due to the fact that both are EAV cells and the source of floc could be similar type of vegetation. All soil samples represented surface soils (0-10 cm). The bulk density of soils from the cells is shown in Table 10-8. Average bulk density of the soil samples for WY2001 was found to be 0.52 ± 0.17 (g/cm3 ± SD) which was not significantly different from WY2004 value 0.58 ± 0.24 (g/cm3 ± SD). These values are representative of higher mineral content in soils (0-10 cm) and do not indicate presence of lower density floc matter. A slight increase from WY2001 value in the soil bulk density was noted for Cell 5.
10.7.2 Phosphorus inventory
Data on average TP concentration (mg P/kg) for floc and soils is shown in Table 10-9. Floc TP values were found to be higher in Cell 3 than Cell 5, but not significant. Floc TP values were higher than soil TP concentration. Soils TP concentration increased from WY2001 to WY2004 however the average value for WY2001 may not be a true representative since it is based on only 10 soil samples collected from Cell 5 only. Cell 5 soil P concentration showed marked increase from WY2001 to WY2004. But high variation in the data indicated this difference as non significant. This increase in TP concentration was followed by increase in bulk density, which could have resulted due to compaction and consolidation of surface soil. It could also be due to migration of P from water column and sub surface horizons to the top 10 cm of soil. Phosphorus concentration (mg P/kg soil) in floc and soil (0-10 cm) in each cell is shown in Figure 10-21. Changes in total phosphorus concentration in floc and soil with time in all the cells are shown in Figure 10-22.
Phosphorus storage in each cell was calculated on a per unit area basis expressed in g P/m2. For floc samples the total floc depth was used for calculating FPS while depth of 10 cm was taken for calculating SPS. Floc and soil P storage in STA-6 for WY2001 (Cell 5) and WY2004 is presented in Table 10-10. The values suggested that Cell 5 had higher SPS in comparison to Cell 3 although both were EAV cells. Floc P storage was higher in Cell 3 than Cell 5. This may be

307 | P a g e
due to higher TP concentration in the inflow water in EAV cells than SAV cells, however since no relationship was observed between the TP retention in a cell and phosphorus loading (mass as well as concentration) it is difficult to conclude that observed results are due to water column phosphorus chemistry. Figure 10-23 presents FPS and SPS from different cells. Figure 10-24 presents changes over time in FPS and SPS indicating that SPS increased from WY2001 to WY2004. Soil P storage data from WY2001 was considered as background storage and was used for P mass balance analysis (later section).
The P mass balance was calculated using the cumulative TP retained from the water column from WY2003 to WY2004 (Table 10-3) and the P storage in the floc and surface soil in WY2004. That the soil integrated operating conditions over a longer period than water column data were available for, was a limitation of this exercise. We assumed that the total P in floc reflects the mass of P removed from water column. Figure 10-25 presents a schematic showing P mass in select compartments of STA. The arrows indicate flux of P between compartments. Both cells reported a net positive retention of P from the water column. The value of FPS was found to be much higher than what is supplied by the water column, this increased P in floc is likely to be fluxed from the underlying surface soil (0-10cm). Middle row arrows indicate the movement of P from surface soil to floc layer.
Both cells of STA-6 showed similar changes in P storage in surface soils. Since we do not have background SPS for Cell 3, the amount of P (g P/m2) that migrated from subsurface horizon could not be calculated accurately. Approximate values are shown in parenthesis in the schematic. Cell 5 showed an increase in SPS from WY2001. To account for this increase in SPS, P appeared to have fluxed from subsurface layer (10-20 cm). This upward movement is shown in lower row of arrows with the associated values adjacent to each arrow. The subsurface horizons of this STA appear to be functioning as net source for P as it was found to be fluxing P into the surface horizon. This movement of P could be mediated by vegetation through P mining from deeper soil layers or via diffusive flux. Since P did not leave the system through water column, we found this STA functioning as a net sink for P removal.
Effect of vegetation on soil phosphorus storage
Data on SPS from STA-6 represents only EAV cells. This did not allow any comparisons between EAV and SAV cells. Table 10-11 presents the soil P accretion rate (PAR; g P/m2/yr) calculated from WY2001 and 2004 data. Since data from Cell 5 were only collected for WY2001 and WY2004, P accretion rate was calculated for Cell 5 only. Area weighted mean for the top 10 cm soils showed P accretion rate (5.11 g P/m2/yr) for EAV.
10.7.3 Nitrogen inventory
The change in soil nitrogen over the POR of STA-6 was analyzed by calculating the soil nitrogen storage (SNS) in the top 10 cm soil. Total N concentration for floc was not available for WY2004. The concentration of nitrogen (g N/kg) in soil is depicted in Table 10-12. The storage of nitrogen per unit area of soil (0-10 cm) is depicted Table 10-13. The values of SNS were found to be higher for WY2004 in comparison to WY2001. This increase may not be a true representation as the values for WY2001 were based on 10 samples collected from Cell 5 only.

308 | P a g e
The relationship between N and P storage in soils is shown in Figure 10-26. Nitrogen and P storage for each cell is presented in Figure 10-27.
Results show that SNS increased with increase in SPS. Approximately 50 g N/m2 was stored per 1g P/m2 in soils (0-10 cm) of STA-6. Linear relationship between N and P storage suggested that P stored primarily in organic form. Mean value of N: P ratios for soils were found to be 44:1. High N:P ratios suggested P limitation in STA soils. The N:P ratios for Cell 3 and Cell 5 were 74:1 and 37:1 respectively.
10.7.4 Carbon inventory
The change in organic matter was estimated over the POR of the STA by calculating soil C storage. The concentration of C (g C/kg) for soil is depicted in Table 10-14 and SCS is shown in Table 10-15. Total C concentration for floc was not available for WY2004. Storage of C followed the same trend as SPS and SNS in all cells across the sampling period.
Data on relationship between SPS and SCS is shown in Figure 10-28. This result is based on soil samples from WY2001 and WY2004 across the cells of STA-6. Approximately, 550 g C/m2 is stored in all cells per 1g P/m2 in soils. Strong relationship was observed between SCS and SNS as shown in Figure 10-29. This suggested that majority of nitrogen fractions are either bound in organic forms or are closely associated with organic matter present in soil. The source of this closely linked C and N in the top soils could possibly be the detrital matter arising from the wetland vegetation
Carbon and P storage in soils for each cell is presented in Figure 10-30. The mean value of C:P for soils was found to be 592:1. The C:P ratios varied from 924:1 for Cell 3 to 512:1 for Cell 5 (both EAV). Figure 10-31 depicts C and N storage in soils for each cell. C:N ratio for STA-6 soils was found to be 13:1. These ratios are typically of those observed for microbial/plankton biomass and for soil organic matter. The existing C and N pools in soils are of crucial importance for maintaining various biogeochemical processes in wetlands. The sum total of these processes determine microbial decomposition rates and control soil formation and long term accretion of nutrients. An adequate balance of these elements plays important role in sequestering P and is critical for ensuring long term sustainability of STAs. This above analysis provided insights into the existing conditions of the STA soils.

309 | P a g e
Table 10-6. STA-6: Number of samples collected. Floc Soil 2004 2001 2004
Cell-3 10 -- 10 Cell-5 12 10 21
22 10 31
Table 10-7. STA-6: Floc depth (cm) and bulk density (g/cm3; mean ± SD).
Floc (WY2004)
Area (ha) Depth (cm) Bulk density Cell-3 99 8.3 ± 3.2 0.04 ± 0.03 Cell-5 253 7.33 ± 2.72 0.04 ± 0.03
All cells 352 7.77 ± 2.98 0.04 ± 0.03 Table 10-8. STA-6: Bulk density of soil (g/cm3; mean ± SD).
Soil
Area (ha) 2001 2004 Cell-3 99 -- 0.54 ± 0.29 Cell-5 253 0.52 ± 0.17 0.6 ± 0.22
All cells 352 0.52 ± 0.17 0.58 ± 0.24 Table 10-9. STA-6: Concentration of phosphorus in floc and soil (0-10 cm) (mg P/kg; mean ± SD).
Floc Soil
2004 2001 2004 Cell-3 1242 ± 845 -- 362 ± 178 Cell-5 944 ± 392 236 ± 103 492 ± 259 Total 1028 ± 520 236 ± 103 455 ± 235
Table 10-10. STA-6: Phosphorus storage (g P/m2; mean ± SD) in floc and soil (0-10 cm).
Floc Soil
2004 2001 2004 Cell-3 4.58 ± 4.84 -- 16.01 ± 9.41 Cell-5 2.61 ± 1.79 10.81 ± 2.35 26.14 ± 12.75 Total 3.16 ± 2.65 10.81 ± 2.35 23.29 ± 11.81

310 | P a g e
Table 10-11. STA-6: Phosphorus accretion rate (PAR; g P/m2yr) in the soils. EAV cells. Floc not included. *
EAV 2001 SPS
2004 SPS
PAR g P/m2 yr
Cell-3 -- 16.01 ± 9.41 -- Cell-5 10.81 ± 2.35 26.14 ± 12.75 5.11
Table 10-12. STA-6: Soil nitrogen concentration (g N/kg soil; mean ± SD) and soil (0-10 cm).
Soil 2001 2004
Cell-3 -- 25.45 ± 6.2 Cell-5 12.6 ± 3.2 18.91 ± 5.4 Total 12.6 ± 3.2 20.75 ± 5.6
Table 10-13: STA-6: Soil nitrogen storage (SNS; g N/m2; mean ± SD).
Soil
2001 2004 Cell-3 -- 1181.41 ± 478.2 Cell-5 623.2 ± 171.5 969.7 ± 304.1 Total 623.2 ± 171.5 1029.3 ± 353.1
Table 10-14: STA-6: Soil carbon concentration (g C/kg soil; mean ± SD).
Soil
2001 2004 Cell-3 -- 323 ± 94 Cell-5 169 ± 46 244 ± 74 Total 169 ± 46 266 ± 79
Table 10-15: STA-6: Soil carbon storage (SCS; g C/m2; mean ± SD).
Soil
2001 2004 Cell-3 -- 14787 ± 5024 Cell-5 8264 ± 2088 13396 ± 3247 Total 8264 ± 2088 13787 ± 3747

311 | P a g e
Figure 10-21. STA-6: Total phosphorus concentration (mg P/kg soil) in floc and soil (0-10 cm) in each cell. Error bars represent standard error of the mean.
Figure 10-22. STA-6: Change in total phosphorus concentration (mg P/kg soil) in floc and soil (0-10 cm) with time. Error bars represent standard error of the mean.
0
200
400
600
800
1000
1200
1400
1600
Cell-3 Cell-5
Soil (2001)
Floc (2004)
Soil (2004)
0
200
400
600
800
1000
1200
2001 2004
Floc TP conc Soil TP conc

312 | P a g e
Figure 10-23. STA-6: Total phosphorus storage (g P/m2) in floc and soil (0-10 cm) from the different cells. Error bars represent the standard error of the mean.
Figure 10-24. STA-6: Change over time in total phosphorus storage (g P/m2) in floc and soil (0-10 cm). Error bars represent the standard error of the mean.
0
5
10
15
20
25
30
35
Cell-3 Cell-5
Soil (2001)
Soil (2004)
Floc (2004)
0
3
6
9
12
15
18
21
24
2001 2004
Floc PS Soil PS

313 | P a g e
Figure 10-25: STA-6: Phosphorus mass balance: soil P storage vis-à-vis net P retained from water quality data. All values are in g P/m2. Top row blue arrows indicate direction of P movement between water and floc. Phosphorus loading for each individaul cells for the whole period of record was not available, however STA mean P loading for the total period of operation is shown. Middle rowe orange arrows show P movement between floc and surface soil (0-10 cm). Lower row brown arrows indicate P movement between surface (0-10 cm) and sub-surface soil (10-30 cm).

314 | P a g e
Figure 10-26:STA-6: Relationship between soil nitrogen storage (SNS; g N/m2) and soil phosphorus storage (SPS; g P/m2) for all sampling points from WY2001 and WY2004.
0
200
400
600
800
1000
1200
1400
1600
1800
2000
0 10 20 30 40 50 60 70
SNS
(g N
/m2 )
SPS (g P/m2)
Soil (0-10 cm) 2001 2004

315 | P a g e
Figure 10-27:STA-6: Ratio of soil nitrogen storage (SCS; g C/m2) to soil phosphorus storage (g P/m2; WY2004 data only). Filled triangles indicate EAV cells and filled square indiates N:P ratio for the whole STA.
Figure 10-28. STA-6: Relationship between soil carbon storage (SCS; g C/m2) and soil phosphorus storage (SPS; g P/m2) for all sampling points from WY2001 (only cell 5) and WY2004.
STA6
Cell-3
Cell-5
800
900
1000
1100
1200
0 5 10 15 20 25 30
SNS
(g N
/ m
2 )
SPS (g P/m2)
0
5000
10000
15000
20000
25000
0 10 20 30 40 50 60 70
SCS
(g C
/m2 )
SPS g P/m2)
Soil (0-10 cm)
2001
2004

316 | P a g e
Figure 10-29: Relationship between soil carbon storage (g C/m2) and soil nitrogen storage (g N/m2) for all sampling points from WY2001(only cell 5) and WY2004.
Figure 10-30: STA-6: Ratio of soil carbon storage (SCS; g C/m2) to soil phosphorus storage (SPS; g P/m2; WY2004 data only). Filled triangles indicate EAV cells and filled square indiates C:P ratio for the whole STA.
0
5000
10000
15000
20000
25000
0 500 1000 1500 2000
SCS
(g C
/m2 )
SNS (g N/m2)
Soil (0-10 cm) 2001 2004
STA6
Cell-3
Cell-5
13200
13400
13600
13800
14000
14200
14400
14600
14800
15000
0 5 10 15 20 25 30
SCS
(g C
/ m
2 )
SPS (g P/m2)

317 | P a g e
Figure 10-31: STA-6: Ratio of soil carbon storage (SCS; g C/m2) to soil nitrogen storage (SNS; g N/m2; WY2004 data only). Filled triangles indicate EAV cells and filled square indiates C:N ratio for the whole STA.
STA6
Cell-3
Cell-5
13200
13400
13600
13800
14000
14200
14400
14600
14800
15000
800 900 1000 1100 1200
SCS
(g C
/ m
2 )
SNS (g N/m2)

318 | P a g e
10.8 Conclusions
As the smallest STA by area, STA-6 processed some of the smallest loads of water and phosphorus. Per unit area, its hydraulic loading was moderate (though about 2-fold higher in Cell 3 than in Cell 5) and P loading was fairly low (0.5-1.5 g P/m2/yr in most water years). Cell 3 had POR TP mass removal effectiveness of about 40% and Cell 5 about 65%, as calculated from the P mass balance.
The interaction between topography and stage caused annual average EWA to be less than 100%. Annual areal P loading rate was generally not affected (except for a 0.34 g/m2/yr increase in WY2007 in Cell 3. Monthly SRP mass removal effectiveness was not directly correlated with monthly average EWA. In most years, partial dry outs occurred in both cells (though most severely in Cell 3) which may have led to P flux and reduced observed P removal rates during reflood months. Concerning depth, Cell 3 is quite shallow and even in the wettest years saw only about 90% annual average EWA. In neither cell was the shape or spread of annual depth exceedance probability curves useful for predicting P removal performance.
Three-month outflow TP FWMC was essentially unrelated to three-month HRT. Hydraulic residence time does appear to have been influential on TP mass removal effectiveness, but the relationship is not very strong, especially at low HRT.
In most years, inflow TP has been primarily PP. Both cells of STA-6 enrich soluble reactive phosphorus (SRP) and dissolved organic phosphorus (DOP), but preferentially remove particulate phosphorous (PP) from the TP pool.
Annual SRP mass removal effectiveness was apparently independent of annual areal calcium loading. Additionally, both annual areal SRP mass removal and annual SRP mass removal effectiveness were independent of annual areal Ca mass retention.
The soils of STA-6 have moderate bulk densities suggesting some mineral fractions in organic soils. Only EAV cells were operational in this STA and registered annual P accretion rate of 5.11 g P/m2/yr.
High N:P ratios suggested that the soils were P limited. The increase in SPS over the POR suggested that this STA is functioning as net P sink.

319 | P a g e
11 CROSS-STA COMPARISONS
In previous sections we have presented an evaluation of the available datasets to identify factors controlling short- and long-term P removal in each of the six STAs. In this section we present a comparison of STAs with respect to their effectiveness in P retention. The STAs that are discussed in this chapter include: STA-1E (2 years) and STA-1W (14 years), STA-2 (6 years), STA-3/4 (3 years), STA-5 (6 years), and STA-6 (9 years). Phosphorus mass removal effectiveness and outflow TP FWMC were used as metrics of STA performance. Water and P budgets were briefly evaluated to determine differences between STAs, and to assess whether any components of these budgets (HLR, phosphorus loading rate, etc.) had any bearing on STA performance. Physical attributes of cells and STAs were then characterized through elevation, EWA, depth and HRT analyses. We related STA performance to EWA, depth, and HRT over various time steps to identify correlations. Next, the chemical properties of STAs, such as differential removal of water column P forms, other chemical constituents including calcium loading, were summarized and compared with STA performance. Finally, following an inventory of P, N, and C and characterization of soil physical and chemical attributes, STA performance was reviewed with respect to soil properties and long-term nutrient storages.
11.1 Water and Phosphorus Budgets
The stated objectives of the water and P budget analyses were to: 1) assess the sources of the errors in the annual budgets, 2) evaluate the potential to generate more accurate budgets with modified methods, 3) and validate SFWMD datasets (described in Section 3.1) and our methods (described in Section 4.1) through comparison with findings in SFER 2009. Regarding objectives 1 and 2, the sources of water and P mass balance errors remain unclear, but it is probable that the known uncertainty in surface flow measurements is amplified by the deductive method of groundwater flow estimation. With currently available datasets (that is, without an independent measure of groundwater flux) it was not possible to improve the accuracy of budgets for STA-5. Objective 3 was fully achieved; the similarity between the water and P budgets produced for this study and those calculated by SFWMD confirmed the validity of the datasets and methods used.
The POR HLRs varied from 7 m/yr (STA-3/4) to 14 m/yr (STA-2) across all STAs (Table 11-1). In all STAs, the water budget was dominated by surface flows. Precipitation contributed between 5 and 9% of the total inflow across all STAs. Groundwater inflow accounted for 4% (STA-5) or less of the inflow water in every STA. Less than 5% of the outflow volume in every STA was groundwater, except in STA-5 (16%), and STA-6 (26%). In STAs, surface water delivered the bulk of P loads. Phosphorus loading by groundwater was assumed to be 0 and precipitation contributed less than 1% of the POR P mass load in STA. Total mass of P retained from the water column (mt) is presented in Table 11-2. These values refer to the POR used for calculating water and P budgets and do not reflect total period of operations for each STA.
Period-of-record inflow FWMCs varied from 65 µg/L (STA-6) to 208 µg/L (STA-1E; Table 11-1). Average annual areal TP loading rates varied from 0.8 g P/m2/yr (STA-3/4) to 2.5 g P/m2/yr (STA-5). Period-of-record TP concentration reduction effectiveness was similar for all cells (arithmetic mean 66% ± 14%) and uncorrelated with POR inflow TP FWMC (r2=0.19). Though POR outflow TP FWMC was well correlated with POR inflow TP FWMC (r2=0.65),

320 | P a g e
POR annual average areal TP loading rate was a better predictor of POR outflow TP FWMC (r2=0.80; Figure 11-1). These results justify the high POR outflow TP FWMC for STA-5, but several new questions are raised. First, why did STA-1E produce a markedly lower POR outflow TP FWMC than STA-1W despite receiving a similar loading rate but a much higher POR inflow TP FWMC? Second, why did STA-2 produce such a low POR outflow TP FWMC relative to the linear regression of outflow TP FWMC on average annual TP LR for all six STAs?
STA age (refers to duration or number of years STA was in operation) may play a role in P treatment performance in STAs. Period-of-record TP mass removal effectiveness was negatively linearly correlated (r2=0.54) with the age of each STA in 2008 (Figure 11-2). However, when the same variables were regressed for individual cells, the correlation was absent (r2=0.09; Figure 11-3). STA performance as a function of age of each STA needs further evaluation. This may provide some insight for STA management to improve system performance.
Of the components of water and P budgets considered here, only inflow TP FWMC and areal TP loading rate were correlated with outflow TP FWMC. In addition, STA age may impact P performance, but that association requires further investigation.
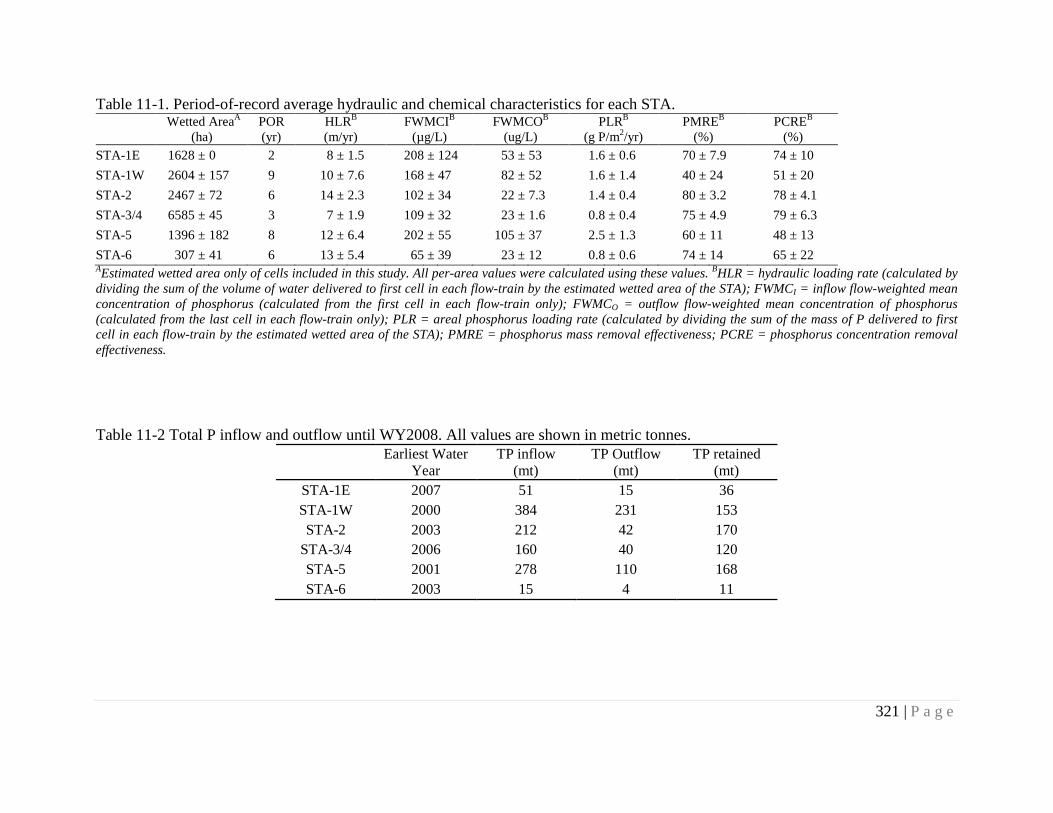
321 | P a g e
Table 11-1. Period-of-record average hydraulic and chemical characteristics for each STA.
Wetted AreaA (ha)
POR (yr)
HLRB (m/yr)
FWMCIB (µg/L)
FWMCOB (ug/L)
PLRB (g P/m2/yr)
PMREB (%)
PCREB (%)
STA-1E 1628 ± 0 2 8 ± 1.5 208 ± 124 53 ± 53 1.6 ± 0.6 70 ± 7.9 74 ± 10 STA-1W 2604 ± 157 9 10 ± 7.6 168 ± 47 82 ± 52 1.6 ± 1.4 40 ± 24 51 ± 20 STA-2 2467 ± 72 6 14 ± 2.3 102 ± 34 22 ± 7.3 1.4 ± 0.4 80 ± 3.2 78 ± 4.1 STA-3/4 6585 ± 45 3 7 ± 1.9 109 ± 32 23 ± 1.6 0.8 ± 0.4 75 ± 4.9 79 ± 6.3 STA-5 1396 ± 182 8 12 ± 6.4 202 ± 55 105 ± 37 2.5 ± 1.3 60 ± 11 48 ± 13 STA-6 307 ± 41 6 13 ± 5.4 65 ± 39 23 ± 12 0.8 ± 0.6 74 ± 14 65 ± 22 AEstimated wetted area only of cells included in this study. All per-area values were calculated using these values. BHLR = hydraulic loading rate (calculated by dividing the sum of the volume of water delivered to first cell in each flow-train by the estimated wetted area of the STA); FWMCI = inflow flow-weighted mean concentration of phosphorus (calculated from the first cell in each flow-train only); FWMCO = outflow flow-weighted mean concentration of phosphorus (calculated from the last cell in each flow-train only); PLR = areal phosphorus loading rate (calculated by dividing the sum of the mass of P delivered to first cell in each flow-train by the estimated wetted area of the STA); PMRE = phosphorus mass removal effectiveness; PCRE = phosphorus concentration removal effectiveness.
Table 11-2 Total P inflow and outflow until WY2008. All values are shown in metric tonnes.
Earliest Water
Year TP inflow
(mt) TP Outflow
(mt) TP retained
(mt) STA-1E 2007 51 15 36 STA-1W 2000 384 231 153 STA-2 2003 212 42 170
STA-3/4 2006 160 40 120 STA-5 2001 278 110 168 STA-6 2003 15 4 11
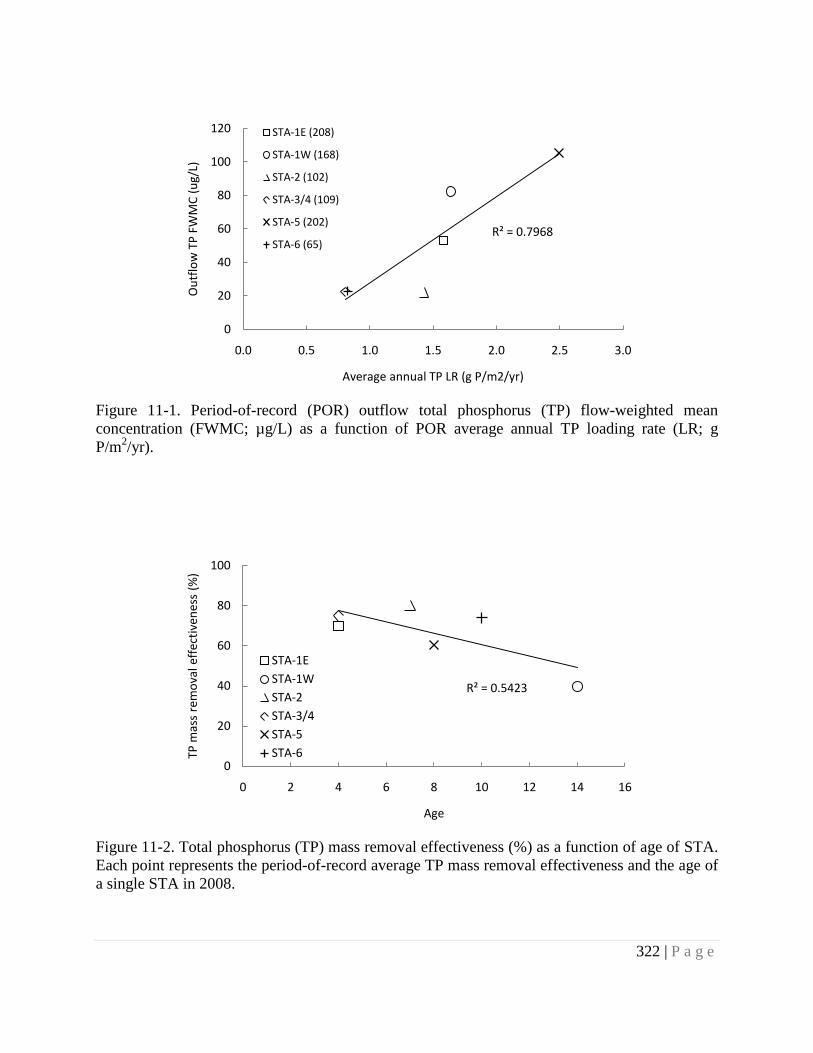
322 | P a g e
Figure 11-1. Period-of-record (POR) outflow total phosphorus (TP) flow-weighted mean concentration (FWMC; µg/L) as a function of POR average annual TP loading rate (LR; g P/m2/yr).
Figure 11-2. Total phosphorus (TP) mass removal effectiveness (%) as a function of age of STA. Each point represents the period-of-record average TP mass removal effectiveness and the age of a single STA in 2008.
R² = 0.7968
0
20
40
60
80
100
120
0.0 0.5 1.0 1.5 2.0 2.5 3.0
Out
flow
TP
FWM
C (u
g/L)
Average annual TP LR (g P/m2/yr)
STA-1E (208)
STA-1W (168)
STA-2 (102)
STA-3/4 (109)
STA-5 (202)
STA-6 (65)
R² = 0.5423
0
20
40
60
80
100
0 2 4 6 8 10 12 14 16
TP m
ass
rem
oval
eff
ectiv
enes
s (%
)
Age
STA-1ESTA-1WSTA-2STA-3/4STA-5STA-6

323 | P a g e
Figure 11-3. Total phosphorus (TP) mass removal effectiveness (%) as a function of age of cell. Each point represents the period-of-record average TP mass removal effectiveness and the age of a single cell in 2008.
R² = 0.0935
0
20
40
60
80
100
0 2 4 6 8 10 12 14 16
TP m
ass
rem
oval
eff
ectiv
enes
s (%
)
Age
STA-1E
STA-1W
STA-2
STA-3/4
STA-5
STA-6
324 | P a g e
11.2 Elevation Distribution, Wetted Area and Depth
The stated objective of this analysis was to develop a methodology for extending the management considerations beyond average depth to include the entire distribution of depths across the entire STA area. This objective was successfully achieved in that elevation, wetted area and depth were characterized across space and time for each cell included in this study, an expansion on previous SFWMD analyses. However, based on the methods applied to the datasets included in this study, P removal effectiveness was not affected by any of these parameters, so the management implications of our findings are unclear.
Wetlands with wide elevation ranges will necessarily have wide distribution of depths, therefore, deep zones and dry areas should be more prevalent in STAs with higher elevation standard deviations. However, POR TP mass removal effectiveness was not correlated with either the standard deviation or coefficient of variation of elevation (r2=0.04 and r2=0.07, respectively) for any of the STAs (Table 11-3). Elevation distribution alone did not affect TP removal effectiveness. This is likely because wetted area and depth did not control P treatment (see below).
Estimated wetted area*time was about 100% over the POR for all STAs except STA-5 (84%) and STA-6 (87%). Over the POR, EWA across all STAs was lowest in water years 2006 – 2008 (Figure 11-4). In earlier chapters, P mass removal effectiveness was shown to be independent of EWA over the short term (monthly to annually). However, EWA may have influenced P dynamics by effectively increasing the realized areal P loading rates. For example, if the mass of P received by STA-5 over the POR had been distributed over the design footprint (rather than the wetted area) by the same volume of water, the LR would have been 2.1 g P/m2/yr (instead of 2.5) and the expected outflow FWMC would have been 84 µg/L (based on the linear regression equation in Figure 11-1), a 20% reduction from the observed 105 µg/L. Though STA-6 had a POR average EWA similar to STA-5, it is unclear whether an analogous reduction in outflow concentration would be expected under 100% flooded conditions. Three STAs (STA-2, 3/4 and 6) had POR outflow TP FWMC of approximately 20 µg/L, which may indicate the existence of a long-term “background” concentration. If so, the outflow concentration from STA-6, even below 100% EWA conditions, may still have been approximately 20 µg/L.
Regarding depth, the 6 STAs were generally similar to one another (Figure 11-5). Long-term phosphorus mass removal effectiveness was independent of POR depth distribution. For example, STA-2 outperformed STA-5 in both TP mass and concentration removal/reduction effectiveness, yet they had nearly identical probability of depth exceedance curves.
In brief, EWA was notably less than 100% only in STA-5 and 6, and was not correlated with performance in any STA. Possibly, in the case of STA-5, increased realized areal P loading due to partial flooding contributed to the high outflow concentrations observed in that STA. Distribution of depths did not have an observable influence on STA performance.

325 | P a g e
Table 11-3. Elevation characteristics for each STA. AreaA
(ha) MeanB Range (ft)
St. Dev. (ft)
Coef. of Var.
STA-1E (C1-7) 2077 13.66 8.04 1.89 0.14 STA-1W (C1-4) 1544 9.46 2.54 0.56 0.06 STA-1W (C5) 1155 8.53 1.91 0.29 0.03 STA-2 (C1-3) 2565 10.37 6.42 1.12 0.11 STA-3/4 6695 9.47 1.71 0.28 0.03 STA-5 (C1A) 338 12.51 5.95 1.06 0.08 STA-5 (C1B-2B) 1325 12.41 4.12 0.93 0.07 STA-6 (C3 & 5) 352 12.78 8.39 0.94 0.07
ATotal area reported in Pietro et al., 2008. BMean elevations given in feet NGVD29.
Figure 11-4. Annual average relative wetted area (EWA) for each STA. Percentages are with respect to reported areas in Pietro et al., 2008.
0.5
0.6
0.7
0.8
0.9
1
WY2000 WY2001 WY2002 WY2003 WY2004 WY2005 WY2006 WY2007 WY2008
STA-1E (100) STA-1W (97)
STA-2 (96) STA-3/4 (98)
STA-5 (84) STA-6 (87)
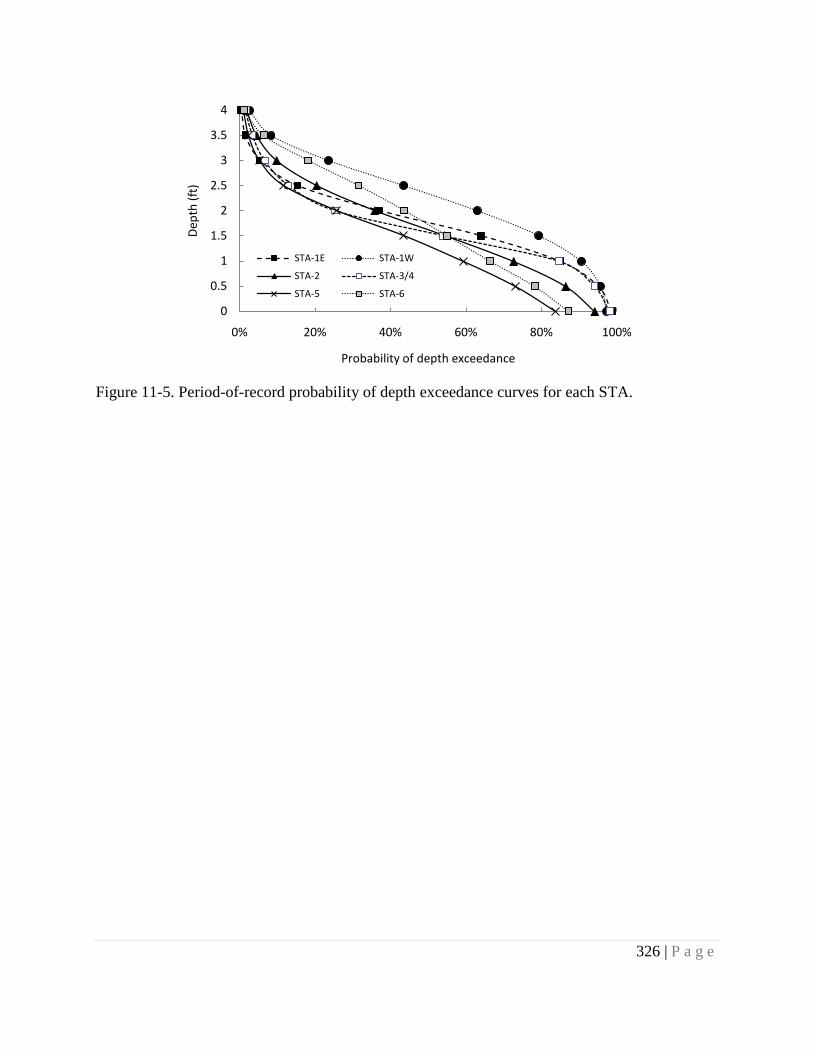
326 | P a g e
Figure 11-5. Period-of-record probability of depth exceedance curves for each STA.
0
0.5
1
1.5
2
2.5
3
3.5
4
0% 20% 40% 60% 80% 100%
Dep
th (f
t)
Probability of depth exceedance
STA-1E STA-1W
STA-2 STA-3/4
STA-5 STA-6

327 | P a g e
11.3 Hydraulic Residence Time
The outlined objectives of analyzing HRT were 1) to develop a method to compute accurate HRT over short (three month) time steps, and 2) to compare treatment performance in STAs with respect to nominal residence time on a shorter timescale than has been examined previously. Objective 1 was moderately successful. Three-month average nominal HRTs were calculated for each cell using the standard hydrological equation, however, a novel method for eliminating problematic low flow periods was not developed. Segmenting the flow record into discrete flow events, not bound by a uniform averaging time step, may be successful in future investigations. The second objective was fully achieved, though no strong correlations between HRT and P performance were identified.
Within cells and STAs, HRT was not a strong determinant of either outflow TP FWMC or TP mass removal effectiveness. However, the POR outflow TP FWMC was weakly positively correlated (r2=0.35) with the POR average HRT when all cells were taken together (Figure 11-6). There appear to be two distinct groups of points; in the first (STA-1E, STA-1W and STA-5), POR outflow TP FWMC was positively correlated with HRT. In the second, (STA-2 and STA-6), the relationship is negative. The correlation appeared strong for both groups, but the cause of dichotomy is unclear. Additionally, POR TP mass removal effectiveness was uncorrelated (r2=.00) with POR average HRT. As mentioned previously, these unexpected results may be generated by discrepancies between these calculated nominal HRT values and realized HRTs in the STAs. Actual HRT, as determined by tracer tests, would likely show a stronger correlation with all treatment parameters.
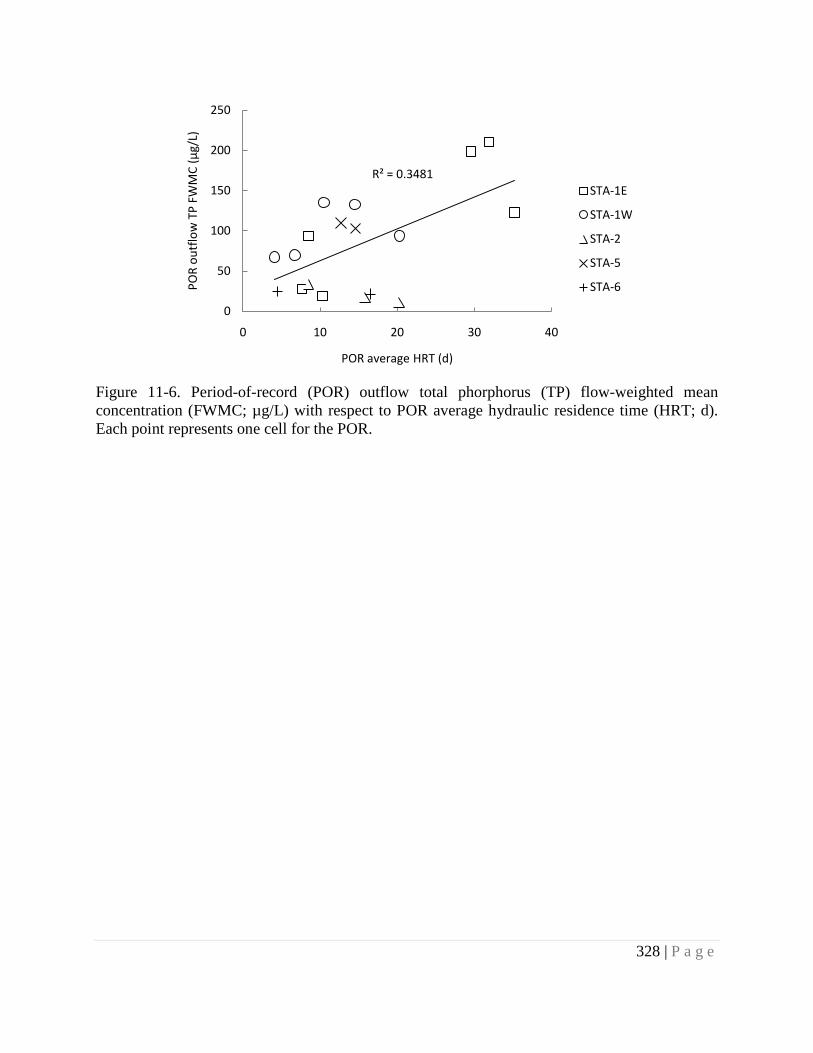
328 | P a g e
Figure 11-6. Period-of-record (POR) outflow total phorphorus (TP) flow-weighted mean concentration (FWMC; µg/L) with respect to POR average hydraulic residence time (HRT; d). Each point represents one cell for the POR.
R² = 0.3481
0
50
100
150
200
250
0 10 20 30 40
POR
outf
low
TP
FWM
C (µ
g/L)
POR average HRT (d)
STA-1E
STA-1W
STA-2
STA-5
STA-6

329 | P a g e
11.4 Water Column Chemical Constituents
The objective of this analysis was to evaluate the relationship between loads and concentrations of calcium and sulfate on P treatment performance between STAs. This objective was not fully realized, because SO4 data were unavailable for most cells. The correlations between available Ca and P datasets were explored at length. Briefly, STAs with high POR inflow Ca concentrations also had low POR TP outflow concentrations, but causation cannot be established without the collection of internal soil and water chemistry data.
In all STAs, DOP took up a small portion of TP in both inflow and outflow water in all STAs (box 1, Figure 11-7). Across all STAs, SRP and PP proportions of TP were variable in inflow and outflow water, and the relative treatment was inconsistent as well (box 2, Figure 11-7).
When POR averages of all cells were considered, the relative proportions of SRP, DOP and PP were not well correlated with the either the outflow FWMC or the mass removal effectiveness of any of those fractions, or of TP (Table 11-4). Averages were based on cells with available data (Table 11-7). Inflow FWMCs of the three fractions were weakly correlated with their respective outflow FWMCs and with outflow TP FWMC. Wetlands typically retain PP and SRP more effectively than DOP. Accumulation of organic matter in STAs typically results in production of dissolved organic matter (DOM) and associated DOP.
STA-3/4 had the highest POR inflow Ca FWMC (107 mg/L) and STA-5 had the lowest (54 mg/L; Table 11-5). Average annual areal Ca loading rates were similarly variable, ranging from 665 g Ca/m2/yr (STA-5) to 1581 g Ca/m2/yr (Cells 2 and 3 of STA-2). Only STA-1W had a negative POR average annual areal Ca retention rate. A matrix of correlation coefficients between Ca parameters and P performance parameters is presented in Table 11-6. Correlations were based on n = 4-7 STAs (whose averags were often based on a subset of all cells) depending on data availability for each parameter (Table 11-7). Within the matrix, the best correlation occurs between inflow Ca FWMC and outflow TP FWMC. STAs with high inflow calcium concentrations tend to produce lower outflow TP concentrations (Figure 11-8). This relationship requires further investigation on both finer temporal and spatial scales.
In summary, the specific composition of inflow TP had no bearing on STA performance. It is somewhat unexpected that inflow TP rich in SRP was not more effectively treated than TP rich in PP or DOP. Treatment of SRP, PP and TP were correlated with inflow Ca concentration and load. In particular, outflow TP FWMC was well correlated with inflow Ca FWMC. This relationship requires further research to address the possibility of Ca manipulation to promote P removal.

330 | P a g e
Figure 11-7. Period-of-record (POR) average proportions of soluble reactive phosphrous (SRP), dissolved organic phosphorus (DOP) and particulate (PP) within the TP pool for outflow and inflow water. Each point represents one STA for the POR. For a given point, shape and shade indicate STA and the internal marker indicates P fraction. Points falling below the 1:1 line indicate preferential removal of that fraction.
Table 11-4. Coefficients of correlation (r) for variables related to water column phosphorus forms. Units of correlation were period-of-record average values for cells.
SRP DOP PP TP
FWMCO MRE FWMCO MRE FWMCO MRE FWMCO MRE
% SRPI 0.27 0.48 -0.19 0.20 0.02 -0.06 0.25 0.19
% DOPI -0.43 -0.23 0.01 0.11 -0.27 0.05 -0.46 -0.03
% PPI -0.20 -0.50 0.23 -0.27 0.08 0.05 -0.09 -0.29
SRP FWMCI 0.69 0.16 0.15 -0.05 0.33 -0.28 0.69 -0.22
DOP FWMCI 0.50 -0.15 0.54 -0.13 0.40 -0.42 0.59 -0.43
PP FWMCI 0.56 -0.36 0.57 -0.45 0.69 -0.49 0.71 -0.61
0%
20%
40%
60%
80%
100%
0% 20% 40% 60% 80% 100%
Prop
ortio
n of
out
flow
TP
Proportion of inflow TP
STA-1E
STA-1W
STA-2
STA-3/4
STA-5
STA-6
1:1 Line
SRP
DOP
PP
2
1

331 | P a g e
Figure 11-8. Period-of-record (POR) outflow total phosphorus (TP) flow-weighted mean concentration (FWMC; µg/L) relative to POR inflow Ca FWMC (mg/L).
Table 11-5. Period-of-record inflow flow-weighted mean concentration (FWMC), average annual areal loading rate and average annual retention of calcium.
Ca FWMCI Areal Ca Load Areal Ca Retention
(mg/L) (g Ca/m2/yr) (g Ca/m2/yr)
STA-1E (Central Flow-way) 83 795 127 STA-1W 91 887 -93 STA-2 (Cells 2 and 3) 103 1581 414 STA-3/4 107 797 47 STA-5 54 665 112 STA-6 104 1326 490
Table 11-6. Coefficients of correlation (r) between calcium (Ca) loading and water column soluble reative phosphorus (P), particulate phosphorus (P) and total phosphorus (TP) outflow flow-weighted mean concentrations (FWMCO) and mass removal effectiveness (MRE). Units of correlation were period-of-record averages for STAs.
SRP PP TP
Areal Ret. FWMCO MRE Areal Ret. FWMCO MRE Areal Ret. FWMCO MRE
Areal Ca Load 0.34 -0.57 0.28 -0.61 -0.34 0.04 -0.03 -0.49 0.30
Ca FWMCI 0.01 -0.52 0.45 -0.81 -0.07 -0.23 -0.70 -0.84 0.31
Areal Ca Ret -0.03 -0.45 -0.02 -0.04 -0.75 0.60 0.07 -0.45 0.55
R² = 0.7026
0
20
40
60
80
100
120
50 60 70 80 90 100 110
Out
flow
TP
FWM
C (µ
g/L)
Inflow Ca FWMC (mg/L)
STA-1E (Central Flow-way)
STA-1W (Cells 1-4)
STA-2 (Cells 2-3)
STA-3/4
STA-5
STA-6

332 | P a g e
Table 11-7. Data availablility by cell for total phosphorus (TP), soluble reactive phosphorus (SRP), dissolved organic phosphorus (DOP), particulate phosphorus (PP), and calcium (Ca).
STA-1E STA-1W STA-2 STA-3/4 STA-5 STA-6
TP
Cell 3 Cell 4N Cell 4S Cell 5 Cell 6 Cell 7
Cell 1 Cell 2 Cell 3 Cell 4 Cell 5
Cell 1 Cell 2 Cell 3
Cell 1A Cell 1B Cell 2A Cell 2B Cell 3
CFW NFW
Cell 3 Cell 5
SRP Cell 3
Cell 4N Cell 4S
Cell 1 Cell 2 Cell 4 Cell 5
Cell 1 Cell 2 Cell 3
Cell 1B Cell 2A
CFW NFW
Cell 3 Cell 5
DOP Cell 3
Cell 4N Cell 4S
Cell 4 Cell 1 Cell 2 Cell 3
Cell 2A Cell 2B NFW Cell 3
Cell 5
PP Cell 3
Cell 4N Cell 4S
Cell 1 Cell 3 Cell 4
Cell 1 Cell 2 Cell 3
Cell 1A Cell 1B Cell 2A
NFW Cell 3 Cell 5
Ca Cell 3
Cell 4N Cell 4S
Cell 1 Cell 2 Cell 3 Cell 4
Cell 5 - (inflow only)
Cell 2 Cell 3
Cell 1A Cell 1B Cell 2A Cell 2B Cell 3
CFW NFW
Cell 3 Cell 5
333 | P a g e
11.5 Soil Nutrients
The specific objectives of this soils analysis were to 1) inventory STA soil sampling to date, 2) assess soil nutrient storages in the STAs, and 3) examine relationships between soil storages and water column P retention. This study successfully achieved all three soil analysis objectives. Because of the heterogeneity of soil sampling in both space and time, the temporal evalution of soil properties was inconclusive, as were comparisons between P performance and soil nutrient storages.
Burial or accretion of organic matter has been reported as a major mechanistic long-term sink for nutrients and other contaminants in wetlands. Wetland soils tend to accumulate organic matter due to the production of detrital material from biota and the suppressed rates of decomposition. Soil accretion rates for constructed wetlands can range between a few millimeters to more than one centimeter per year. Accretion rates in productive natural wetland systems such as the Everglades have been reported as high as one centimeter or more per year. The genesis of this new material is a relatively slow process, which may affect the nutrient retention characteristics of the wetland. With time, productive wetland systems will accrete organic matter that has different physical and biological characteristics than the underlying soil. Floc is defined as unconsolidated material consisting undistinguishable detrital matter, plankton biomass, and other suspended particulate matter. Underlying floc layer is the soil, upper layers formed from the floc and native soil below. Soils provide long-term record of nutrient accumulation, thus serve as an excellent indicator of system performance.
The network of six STAs currently in place, started off with four cells of STA-1W in the year 1989. With time new cells were added to STA-1W and five other STAs were added to form the current network. The most recent addition is STA-1E, which started functioning in WY2004. However, this long operational history is not reflected in the floc and soil samples. The earliest floc samples were collected from STA-5 in WY2003 while the earliest soil samples were obtained from STA-1W (Cells 1, 2, 3 and 4 only) from WY1995. The detailed sampling years and the number of samples are shown in Table 11-8 and Table 11-9 respectively. Largest number of floc samples was collected in WY2004 whereas largest number of soil samples was collected in WY2007. Unlike surface water quality monitoring, floc and soil sample monitoring was not conducted on a consistent basis, which makes it difficult to conduct analysis for cross-STA comparisons.
Only one floc sample was available for STA-1E in WY2007, hence it was not used in calculation of floc nutrient storages. After WY2004 sampling event, the SFWMD carried out an assessment of monitoring efforts within STAs under its STA optimization program. The findings of this assessment suggested spatial optimization of sampling sites. This exercise was undertaken to determine most cost effective sampling design without incurring significant loss of information. It is not clear if the recommendations of this project were adopted in the subsequent sampling events because floc samples decreased and number of soil samples doubled in WY2007. Floc and soil samples were available from all of the STAs (except STA-6) from WY2007. For comparative analyses between the STAs we have used WY2007 data (WY2004 data for STA-6).
The absence of floc samples may be due to drought conditions or due to errors in identification and characterization of the floc layer. Missing floc data can potentially underestimate total (soil+

334 | P a g e
floc) phosphorus storage. Because floc is the most active layer (the interface between the water column and sediment layer), it can often contribute a significant proportion of the total soil phosphorus storage. In case of missing floc data, in our analysis we assumed that the floc was incorporated in the underlying soils and the top 10 cm soil P storages would reflect the floc fraction in them.
Several biogeochemical processes regulate the retention of nutrients by wetlands. Some of these processes include: accretion of particulate matter, uptake by vegetation, and chemical and microbiological processes. Phosphorus retention by soils and floc, which store most of the P relative to other ecosystem parts components include surface adsorption on minerals, precipitation, microbial and immobilization. In STAs these processes may be combined into two distinct P retention pathways: sorption and burial. Phosphorus sorption in sediments is defined as the removal of phosphate from the soil solution to the solid phase, and includes both adsorption and precipitation reactions. When plants and microbes die off, the P contained in cellular tissue may either recycle within the wetland, or may be buried with refractory organic compounds.
11.5.1 Floc and soil physico-chemical properties
Data on floc depth variation across the STAs are presented in Table 11-10. The range of mean floc depth across STAs was higher in WY2004 than in WY2007. STA-1W and STA-5 registered a decrease in floc depth while floc layer thickness increased in STA-2. This mean depth was utilized for calculating P, N and C storages in the floc.
The bulk density values of floc and soil from all STAs are shown in Table 11-11 and Table 11-12 respectively. Among all STAs, floc and soil bulk density was found to be highest for STA-1E suggesting larger mineral fraction in the surface soils of this STA. Floc bulk density was found in the range of 0.04 to 0.26 g /cm3 whereas soil bulk density varied from 0.2 to 1.0 g/cm3 across all STAs from all sampling years.
11.5.2 Phosphorus inventory
Data on average TP concentration (mg P/kg) in floc and soils are shown in Table 11-13 and Table 11-14 respectively. For most of the STAs floc and soil P concentration showed an increase from WY2004 to WY2007. Floc total P concentrations ranged from 870 ± 167 (STA-2) to 1192 ±261 (STA-1W; mg P/kg; mean ± SD). Range of TP concentrations in soils varied from 160 ± 135 (STA-1E) to 615 ± 396 (STA-5; mg P/kg; mean ± SD) during WY2007.
Floc P storages and SPS in each STA was calculated on a per unit area basis expressed in g P/m2. For floc samples, total floc depth was used for calculating FPS while depth of 10 cm was used for soil P storage calculation. Data of floc and soil P storage in STAs are presented in Table 11-15 and Table 11-16, respectively. Figure 11-9 represents total P storage (floc and soil (0-10 cm)) for all STAs. Highest values for SPS were found for STA-6 in WY2004 and STA-3/4 in WY2005. In WY2007, surface soils (0-10 cm) of STA-5 showed highest P storage. Caution should be exercised in comparing SPS in 0-10 cm depth surface soil across STAs. In older STAs such as STA-1W, majority of 0-10 cm soil represents consolidated floc and some native soil. In younger STAs, majority of 0-10 cm soil depth may represent native soil with small fraction of consolidated floc. With current soil sampling data it is not possible to distinguish between native

335 | P a g e
soil and consolidated floc. The observed decrease in SPS in soils fraction of some STAs could possibly be due to the upward shifting of the 10 cm boundary in the soil layer. Over time as more detrital material gets deposited and incorporated in the soil, top 10 cm layer tends to account for this newly accreted material while some fraction of previous 0-10 cm soil fraction gets discounted. This results in underestimation of SPS. In absence of a fix reference point for soil sampling, it is not possible to accurately determine change in SPS from one sampling event to other. The percentage of error in SPS calculation increases as STAs age, since the boundary of 0-10 cm surface soil is shifted with new soil accretion. Soil P storage calculations only reflect the top 10 cm soil surface underestimating the total accretion of nutrients over the POR.
STA-1W underwent a significant rehabilitation and enhancement effort during 2005-2007. Approximately 180,000 cubic yards of P enriched floc and surface soils were removed from Cell 1B and Cell 4. This resulted in a total removal of 19 mt P from the STA-1W. The WY2007 SPS presented in Table 11-16 depicts P storage before the rehabilitation activity, while WY2008 samples represent post rehabilitation SPS. The observed decrease in SPS could be attributed to the rehabilitation activities. Table 11-17 shows a comparison of total P removed from water column and total P storage (floc + soil).
Phosphorus mass balance for all STAs was carried out using total P retained from water column and P storage in floc and top 10 cm surface soil data for WY2007. Data were not available to estimate P storage in vegetation. Phosphorus storage in vegetation, especially in Typha can be significant. Sources of P to floc layer may include: water column P, uptake of P by vegetation from underlying soil and deposited back as detrital matter in the floc, and flux of P from underlying soil to floc. We assumed that total P in floc reflects the mass of P removed from water column. The P storage in the floc therefore reflects the fraction of P from detrital vegetative matter and its interaction with the water column P forms. If FPS for any STA was found to be higher than net TP retained from the water column, it meant that P fluxed into floc either from underlying surface soil layer or deposited as detrital matter into floc layer. For calculating P mass balance using floc and soil P storages, earliest available values for SPS were considered as background levels and were subtracted from WY2007 storages. A net positive change indicated that P moved to surface horizon either from the top floc layer or from the subsurface horizons (below 10 cm). A negative change from the background SPS indicated that P migrated from surface soil (0-10 cm) to either floc layer or to subsurface horizon (below 10 cm). WY1995 SPS was used as the background soil P storage for STA-1W. For STA-1E and STA-3/4 WY2005 SPS was considered as background. WY2001 SPS was used as background for STA-2, STA-5 and STA-6.
Figure 11-10 presents a schematic showing P mass in select compartments of STAs. The arrows indicate flux of P between compartments. All STAs reported net positive retention of P from the water column. The SPS registered positive change in STA-1W, STA-5 and STA-6 while other STAs (STA-2 and 3/4) registered a negative change in SPS. This change in SPS was manifested as a redistribution of P in either floc fraction or into subsurface soils fraction (below 10 cm). In STAs where the calculations suggested net flux of P into sub surface soils from surface soils, we considered them as functioning favorably for long term storage of P in the sediments. For the others, presence of P in transient floc layer and top 10 cm soil layer could not be assured as long term storage.

336 | P a g e
11.5.3 Nitrogen inventory
The change in N over the POR of STAs was analyzed by calculating the floc nitrogen storage (FNS) and soil nitrogen storage (SNS). The data on concentration of N (g N/kg) in floc and soil is depicted in Table 11-18 and Table 11-19, respectively. The FNS and SNS are depicted in Table 11-20 and Table 11-21, respectively. Total N concentration for floc was not available for WY2004 therefore comparison in FNS values across different sampling years was not possible except for STA-5 where WY2003 data was used for comparison. In most cases SNS increased over time, except for a slight decrease for STA-1W for WY2008. This small decrease could be attributed to rehabilitation activities. Figure 11-11 shows the FNS and SNS in STAs for WY2007. Table 11-22 represents total N storage (floc + soil; mt) in STAs.
The relationship between N and P storage in floc and soils is shown in Figure 11-12. Results showed positive relationship between N storage and P storage (r2=0.76). Approximately, 31 g N per g P/m2 was stored in STAs. Linear relationship between N and P storage suggest that P was stored primarily in organic form. High N : P ratios suggest that STAs are P limited.
11.5.4 Carbon inventory
The change in organic matter was estimated over the POR of STAs by calculating the C storage in floc and soil. Concentration of C (g C/kg) in floc and soil is presented in Table 11-23 and Table 11-24 respectively. Floc C storage (g C/m2) and soil C storage is shown in Table 11-25 and Table 11-26 respectively. All STAs registered some decrease in total C concentrations in soils across the sampling years, except STA-1W and STA-6. In STA-1W total C concentrations increased from WY1995 to WY2006, while in WY2007 total C concentration decreased. This was partly caused due to the hurricanes in previous year. High turbidity in water resulted in death of SAV community and a layer of highly inorganic sediments was deposited on surface soils. In WY2008, after rehabilitation activities, scraping of inorganic sediments exposed native organic soils, as shown by higher total C concentrations in WY2008. Soil C storages followed similar trends as total C concentration. Figure 11-13 shows FCS and SCS in all STAs in WY2007. Table 11-28 represents total C storage (floc + soil; mt) in STAs.
Data on relationship between total PS (floc + soil) and total CS (floc + soil) is presented in Figure 11-14. This result is based on total floc and soil C and P storages for WY2007. Carbon storage and P storage were found to be related (r2=0.87). The range of C storage per unit of P varied from 444 to 594 g C/m2 per 1 g P/m2. Strong relationship was found between C and N storage as depicted in Figure 11-15. This suggested that N fractions are either bound in organic forms or are closely associated with the organic matter present in the soil.
11.6 Water Chemistry and Soil Analysis
Comparison of P retained from water column and total (floc + soil) P storage is presented in Table 11-29. The percentage of total P (floc + soil) derived from water column is plotted in Figure 11-16. As the P retained by system increased with time, percentage of total P storage derived from water column increased.
There was noteworthy relationship (r2=0.64) between mean floc concentration and mass of P retained from water column till WY2007 (Figure 11-17) suggesting enrichment of floc layer with

337 | P a g e
P addition to the system. No clear relationship (r2=0.20) was observed between total mass of P removed from the water column and total P storage for data obtained from WY2007 (Figure 11-18). A one to one line was plotted to indicate the percentage of total P storage that is derived from water column P retained. The blue sections of upward pointing arrows indicate P proportion that is most likely derived from native soils. The orange section indicates P proportion that is derived from the water column.
When all available data for each WY were used to explore relationship between P removed from water column and total P storage, no relationship was found (Figure 11-19). Figure 11-20 shows similar relationship broken down to cell averages instead of whole STAs. Even in this case no clear relationship was obtained. Similar results were obtained when total P concentrations were plotted against flow weighted mean inflow concentrations (μg/L) and flow weighted mean outflow concentrations (μg/L) as shown in Figure 11-21 and Figure 11-22. The absence of any clear relationship could be due to following reasons – first, limited number of soils data. Second, water column data represented TP retained only in that particular WY while in case of floc and soils fraction, the measurement were cumulative for the period of operation. Third, proportion of P lying in the vegetation and biota was not accounted in these relationships and fourth, the error in measurement of soils as well as water column could possibly mask any small relationship that may exist.
11.7 Conclusions
Period-of-record outflow TP FWMC was positively correlated with inflow TP FWMC and average annual areal TP loading rate. Period-of-record mass removal effectiveness in STAs decreased with increasing age of STA, but this correlation requires further investigation, particularly to isolate the effects of variables, such as internal construction and climate, that have not been uniformly applied to each STA.
Phosphorus removal effectiveness was not correlated with EWA in any STA. Possibly, increased realized areal P loading due to partial flooding caused outflow concentrations to be somewhat higher than would have been observed under 100% flooding. Distribution of depths had no observable influence on STA performance.
The specific composition of inflow TP had no bearing on STA performance. Treatment of SRP, PP and TP were correlated with inflow Ca concentration and load. In particular, outflow TP FWMC was well correlated with inflow Ca FWMC. The Ca-P interaction deserves more attention on different temporal and spatial scales.
Soils from STA-1E had highest bulk densities, suggesting higher mineral portions, in comparison to other STAs. Total soil C and N storages were also found comparatively smaller in STA-1E soils, however the soil P storage was found to be in the same range as other STA soils, suggesting that P was mostly present in inorganic forms, in STA-1E. This is confirmed by the relationship between soil N and P storage (Figure 5-28). All other STAs shows light relationship between soil N and P storages, suggesting that significant proportion of P in soils is present in organic (associated to organic) forms. The N and P storage ratios also suggest that the soils of STAs are not N limited.

338 | P a g e
With time, the percentage of P in floc and soil fraction that was derived from water column P retention appeared to increase. There was clear relationship (r2=0.64) between mean floc concentration and mass of P retained from water column till WY2007 suggesting enrichment of floc layer with P addition to the system.
Positive relationship was found between P and C storage and C and N storages in floc and soil. Also N and P fractions appeared to be bound in organic forms or are closely associated with the organic matter present in the soil.
Absence of a clear relationship between total mass of P retained (removed) from the water column and total P storage (floc plus soil) can be attributed to limited soil samples, error in methods and non inclusion of vegetation P storages in the analysis.

339 | P a g e
Table 11-8. Number of floc samples. Floc
STA-1E STA-1W STA-2 STA-3/4 STA-5 STA-6 All STAs
2003 -- -- -- -- 58 -- 58 2004 -- 88 70 -- 104 22 284 2007 1 47 62 28 15 -- 153
Total 1 135 132 28 177 22 495
Table 11-9. Number of soil samples. Soil
STA-1E STA-1W STA-2 STA-3/4 STA-5 STA-6 All STAs 1995 -- 36 -- -- -- -- 36 1996 -- 23 -- -- -- -- 23 2000 -- 31 -- -- -- -- 31 2001 -- -- 10 -- 10 10 30 2003 -- -- -- -- 59 -- 59 2004 -- 89 74 -- 108 31 302 2005 94 -- -- 323 -- -- 417 2006 -- 28 -- -- -- -- 28 2007 103 133 115 289 82 -- 722 2008 -- 52 -- -- -- -- 52 Total 197 392 199 612 259 41 1700

340 | P a g e
Table 11-10: Floc depth (cm; mean ± SD). Floc
STA-1E STA-1W STA-2 STA-3/4 STA-5 STA-6
2003 -- -- -- -- 6.8 ± 2.7 -- 2004 -- 18.3 ± 7.2 5.2 ± 2.4 -- 9.0 ± 4.0 7.8 ± 2.9 2007 9.0 ± 0# 4.4 ± 2.3* 7.1 ± 3.5 7.3 ± 3.7 5.3 ± 2.6 --
# Only one sample was recorded hence SD=zero * Floc depth not provided so mean floc depth 6.6 cm from SAV cells was assigned for Cell 1 samples. Only one floc sample was recorded from Cell 5A in year 2007. Cell 1 and Cell 5A floc depth values were not taken in account to calculate mean floc depth Table 11-11. Floc bulk density (g/cm3; mean ± SD).
STA-1E STA-1W STA-2 STA-3/4 STA-5 STA-6
2003 -- -- -- -- 0.06 ± 0.05 -- 2004 -- 0.08 ± 0.03 0.1 ± 0.08 -- 0.08 ± 0.05 0.04 ± 0.03 2007 0.26 ± 0* 0.1 ± 0.03 0.15 ± 0.04 0.11 ± 0.04 0.11 ± 0.03 --
*Only one floc sample was recorded from STA-1E WY2007.
Table 11-12. Soil bulk density (g/cm3; mean ± SD). Soil
STA-1E STA-1W STA-2 STA-3/4 STA-5 STA-6 1995 -- 0.18 ± 0.06 -- -- -- -- 1996 -- 0.2 ± 0.06 -- -- -- -- 2000 -- 0.26 ± 0.06 -- -- -- -- 2001 -- -- 0.21 ± 0.08 -- 0.34 ± 0.09 0.52 ± 0.17 2003 -- -- -- -- 0.48 ± 0.15 -- 2004 -- 0.22 ± 0.06 0.23 ± 0.06 -- 0.47 ± 0.17 0.58 ± 0.24 2005 1.07 ± 0.43 -- -- 0.34 ± 0.1 -- -- 2006 -- 0.24 ± 0.05 -- -- -- -- 2007 1.01 ± 0.37 0.26 ± 0.09 0.25 ± 0.08 0.27 ± 0.09 0.42 ± 0.13 -- 2008 -- 0.23 ± 0.05 -- -- -- --

341 | P a g e
Table 11-13. Phosphorus concentration in floc (mg P/kg; mean ± SD). Floc
STA-1E STA-1W STA-2 STA-3/4 STA-5 STA-6
2003 -- -- -- -- 1180 ± 444 -- 2004 -- 726 ± 272 856 ± 339 -- 824 ± 325 1028 ± 520 2007 644 ± 0* 1192 ± 261 870 ± 167 1072 ± 130 1187 ± 485 --
*Only one floc sample was recorded from STA-1E WY2007
Table 11-14. Phosphorus concentration in soils (mg P/kg; mean ± SD). Soil
STA-1E STA-1W STA-2 STA-3/4 STA-5 STA-6
1995 -- 479 ± 130 -- -- -- -- 1996 -- 353 ± 96 -- -- -- -- 2000 -- 507 ± 194 -- -- -- -- 2001 -- -- 521 ± 157 -- 465 ± 74 236 ± 103 2003 -- -- -- -- 465 ± 197 -- 2004 -- 272 ± 77 506 ± 133 -- 445 ± 139 455 ± 236 2005 177 ± 136 -- -- 688 ± 187 -- -- 2006 -- 452 ± 188 -- -- -- -- 2007 160 ± 135 598 ± 316 511 ± 186 599 ± 175 615 ± 396 -- 2008 -- 500 ± 226 -- -- -- --

342 | P a g e
Table 11-15. Floc phosphorus storage (FPS, g P/m2; mean ± SD). Floc
STA-1E STA-1W STA-2 STA-3/4 STA-5 STA-6
2003 -- -- -- -- 3.3 ± 1.73 -- 2004 -- 9.6 ± 4.8 2.81 ± 2.1 -- 4.36 ± 2.32 3.16 ± 2.65 2007 15.1 ± 0* 4.4 ± 1.6 8.7 ± 4.9 8.5 ± 4.6 6.7 ± 3.1 --
*Only one floc sample was recorded from STA-1E WY2007
Table 11-16. Soil phosphorus strorage (SPS; g P/m2 ; mean ± SD). Soil
STA-1E STA-1W STA-2 STA-3/4 STA-5 STA-6
1995 -- 7.7 ± 1.5 -- -- -- -- 1996 -- 3.5 ± 1.1 -- -- -- -- 2000 -- 6.9 ± 3 -- -- -- -- 2001 -- -- 12.7 ± 5.6 -- 15.2 ± 2.9 10.8 ± 2.4 2003 -- -- -- -- 19.1 ± 9.6 -- 2004 -- 5.8 ± 2.6 12.2 ± 8.2 -- 18.9 ± 8.0 23.3 ± 11.8 2005 13.2 ± 7.8 -- -- 23.3 ± 8.5 -- -- 2006 -- 11.3 ± 6.1 -- -- -- -- 2007 10.1 ± 6.2 14.6 ± 5.9 12.5 ± 6 16.13 ± 6.7 20.7 ± 13.7 -- 2008 -- 10.7 ± 4.7 -- -- -- --
Table 11-17 Comparison of P removed from water column and FPS and SPS. Area of STA used for calculations are also shown.
Water Year Age Area
(ha) Floc
(g P/m2) Soil
(g P/m2) Total P (g P/m2)
Total P (mt)
Phosphorus removed from water* (mt)
STA-1E 2007 3 1629 -- 10.1 10.1 165 24 STA-3/4 2007 4 6698 7.8 16.1 23.9 1603 222 STA-2 2007 8 3336 8.6 12.5 21.1 704 181
STA-6~ 2004 8 352 3.5 22.9 26.4 93 25 STA-5 2007 9 1664 6.7 20.7 27.4 455 158
STA-1W 2007 13 2700 4.8 14.7 19.5 527 339 * SFER 2008, Table 5-2 (pp 5-6). For STA-6 SFER 2005 was referred.

343 | P a g e
Table 11-18. Floc nitrogen concentration (g N/kg; mean ± SD). Floc
STA-1E STA-1W STA-2 STA-3/4 STA-5 STA-6 2003 -- -- -- -- 30 ± 5 -- 2007 15.1 ± 0* 23 ± 2 14 ± 3 18 ± 2 28 ± 2 --
#Total nitrogen concentration for floc was not available for STAs 1W, 2, 5 and 6 during WY2004.
Table 11-19. Soil nitrogen concentration (g N/kg; mean ± SD). Soil
STA-1E STA-1W STA-2 STA-3/4 STA-5 STA-6
1995 -- 28 ± 2 -- -- -- -- 1996 -- 32 ± 4 -- -- -- -- 2000 -- 30 ± 3 -- -- -- -- 2001 -- -- 3 ± 0 -- 26 ± 6 13 ± 3 2003 -- -- -- -- 22 ± 7 -- 2004 -- 28 ± 3 28 ± 3 -- 23 ± 7 21 ± 6 2005 5.9 ± 5.1 -- -- 26 ± 5 -- -- 2006 -- 27 ± 3 -- -- -- -- 2007 5.6 ± 4.8 26 ± 7 28 ± 2 25 ± 5 21 ± 6 -- 2008 -- 28 ± 4 -- -- -- --

344 | P a g e
Table 11-20. Floc nitrogen storage (FNS, g N/m2; mean ± SD). Floc
STA-1E STA-1W STA-2 STA-3/4 STA-5 STA-6 2003 -- -- -- -- 96 ± 61 -- 2007 -- 92 ± 43 125 ± 66 139 ± 72 170 ± 79 --
#Total nitrogen concentration for floc was not available for STAs 1W, 2, 5 and 6 during WY2004.
Table 11-21. Soil nitrogen storage (SNS, g N/m2 ; mean ± SD). Soil
STA-1E STA-1W STA-2 STA-3/4 STA-5 STA-6
1995 -- 478 ± 122 -- -- -- -- 1996 -- 637 ± 133 -- -- -- -- 2000 -- 770 ± 163 -- -- -- -- 2001 -- -- 605 ± 89 -- 809 ± 100 623 ± 172 2003 -- -- -- -- 865 ± 193 -- 2004 -- 622 ± 145 609 ± 117 -- 877 ± 203 1029 ± 353 2005 345 ± 246 -- -- 832 ± 179 -- -- 2006 -- 646 ± 123 -- -- -- -- 2007 312 ± 141 792 ± 159 642 ± 123 646 ± 178 689 ± 223 -- 2008 -- 622 ± 115 -- -- -- --
Table 11-22 : Total nitrogen (N) storage (mt) in floc and soil in STAs.
Water Year Age Area (ha) Floc N
(g N/m2) Soil N
(g N/m2) Total N (g N/m2)
Total N (mt)
STA-1E* 2007 3 1629 -- 312 312 5082 STA-3/4 2007 4 6698 139 646 785 52579 STA-2 2007 8 3336 125 642 767 25587
STA-6 * 2004 8 352 -- 1029 1029 3622 STA-5 2007 9 1664 170 689 859 24293
STA-1W 2007 13 2700 92 792 884 23868 *Floc values were not available.

345 | P a g e
Table 11-23. Floc carbon concentration (g C/kg; mean ± SD). Floc
STA-1E STA-1W STA-2 STA-3/4 STA-5 STA-6 2003 -- -- -- -- 389 ± 56 -- 2007 -- 274 ± 13 242 ± 32 275 ± 22 375 ± 28 --
Table 11-24. Soil carbon concentration (g C/kg; mean ± SD). Soil
STA-1E STA-1W STA-2 STA-3/4 STA-5 STA-6
1995 -- 360 ± 12 -- -- -- --
1996 -- 510 ± 46 -- -- -- --
2000 -- 483 ± 40 -- -- -- --
2001 -- -- 466 ± 9 -- 381 ± 80 169 ± 46
2003 -- -- -- -- 312 ± 91 --
2004 -- 467 ± 47 419 ± 55 -- 322 ± 102 266 ± 79
2005 87 ± 76 -- -- 391 ± 85 -- --
2006 -- 450 ± 38 -- -- -- --
2007 82 ± 71 398 ± 69 452 ± 38 381 ± 79 297 ± 94 --
2008 -- 450 ± 60 -- -- -- --

346 | P a g e
Table 11-25. Floc carbon storage (FCS; g C/m2; mean ± SD). Floc
STA-1E STA-1W STA-2 STA-3/4 STA-5 STA-6
2003 -- -- -- -- 1298 ± 848 -- 2007 -- 1516 ± 643 2277 ± 1228 2164 ± 1148 2409 ± 1282 --
Table 11-26. Soil carbon storage (g C/m2; mean ± SD).
STA-1E STA-1W STA-2 STA-3/4 STA-5 STA-6
1995 -- 10650 ± 1601 -- -- -- -- 1996 -- 8085 ± 2872 -- -- -- -- 2000 -- 6238 ± 739 -- -- -- -- 2001 -- -- 10215 ± 1524 -- 11824 ± 1554 8264 ± 2088 2003 -- -- -- -- 12334 ± 2502 -- 2004 -- 10305 ± 2177 9039 ± 2415 -- 12400 ± 2644 13787 ± 3747 2005 5172 ± 3551 -- -- 12689 ± 2792 -- -- 2006 -- 10788 ± 2031 -- -- -- -- 2007 4553 ± 2128 8584 ± 1361 10294 ± 2081 9709 ± 2655 9752 ± 3204 -- 2008 -- 10104 ± 1582 -- -- -- --
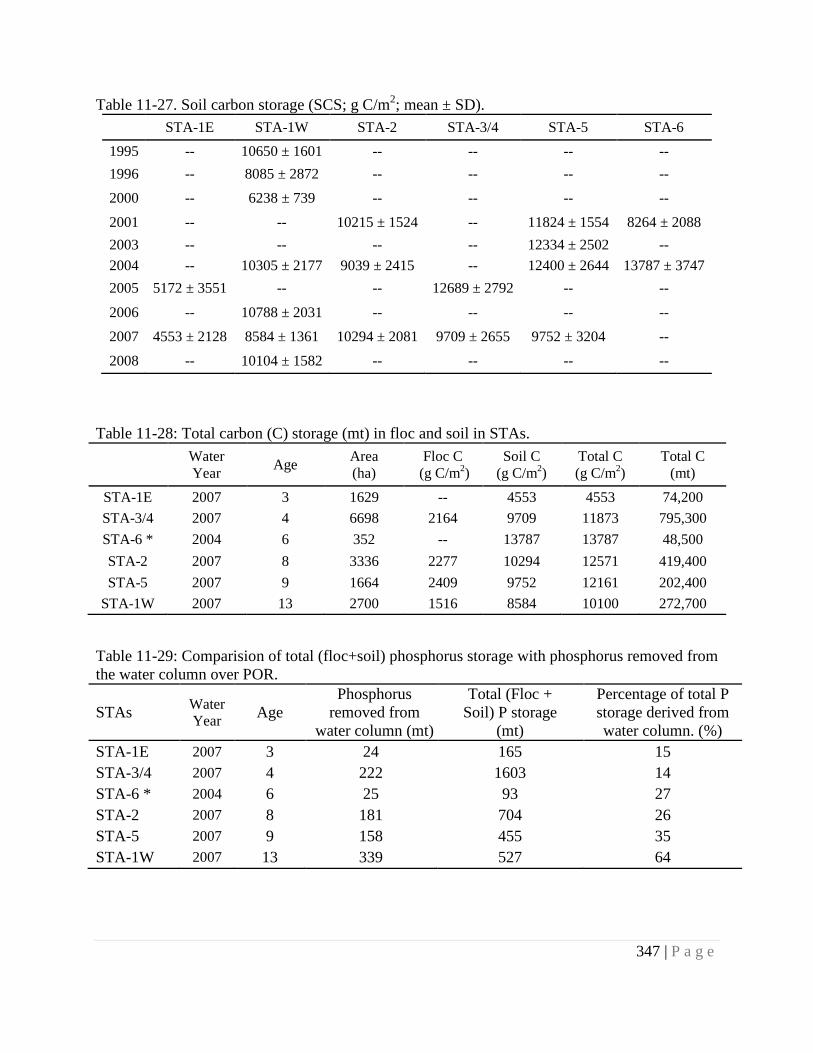
347 | P a g e
Table 11-27. Soil carbon storage (SCS; g C/m2; mean ± SD).
STA-1E STA-1W STA-2 STA-3/4 STA-5 STA-6 1995 -- 10650 ± 1601 -- -- -- -- 1996 -- 8085 ± 2872 -- -- -- -- 2000 -- 6238 ± 739 -- -- -- --
2001 -- -- 10215 ± 1524 -- 11824 ± 1554 8264 ± 2088 2003 -- -- -- -- 12334 ± 2502 -- 2004 -- 10305 ± 2177 9039 ± 2415 -- 12400 ± 2644 13787 ± 3747 2005 5172 ± 3551 -- -- 12689 ± 2792 -- --
2006 -- 10788 ± 2031 -- -- -- -- 2007 4553 ± 2128 8584 ± 1361 10294 ± 2081 9709 ± 2655 9752 ± 3204 --
2008 -- 10104 ± 1582 -- -- -- --
Table 11-28: Total carbon (C) storage (mt) in floc and soil in STAs.
Water Year Age Area
(ha) Floc C
(g C/m2) Soil C
(g C/m2) Total C (g C/m2)
Total C (mt)
STA-1E 2007 3 1629 -- 4553 4553 74,200 STA-3/4 2007 4 6698 2164 9709 11873 795,300 STA-6 * 2004 6 352 -- 13787 13787 48,500 STA-2 2007 8 3336 2277 10294 12571 419,400 STA-5 2007 9 1664 2409 9752 12161 202,400
STA-1W 2007 13 2700 1516 8584 10100 272,700
Table 11-29: Comparision of total (floc+soil) phosphorus storage with phosphorus removed from the water column over POR.
STAs Water Year Age
Phosphorus removed from
water column (mt)
Total (Floc + Soil) P storage
(mt)
Percentage of total P storage derived from water column. (%)
STA-1E 2007 3 24 165 15 STA-3/4 2007 4 222 1603 14 STA-6 * 2004 6 25 93 27 STA-2 2007 8 181 704 26 STA-5 2007 9 158 455 35 STA-1W 2007 13 339 527 64

348 | P a g e
Figure 11-9. Floc and soil phosphorus storage in WY2007. STA-6 values from WY2004.
3 years 4 years 6 years 8 years 9 years 13 years
0
4
8
12
16
20
24
28
32
STA-1E STA-3/4 STA-6 * STA-2 STA-5 STA-1W
Phos
phor
us S
tora
ge (g
P/
m2 )
Floc Soil

349 | P a g e
Figure 11-10. Phosphorus mass balance: soil P storage vis-à-vis net P retained from water quality data. All values are in g P/m2. Arrows indicate flux of P between compartements. Top row arrows indicate direction of P movement between water and floc. Middle row arrows show P movement between floc and surface soil (0-10 cm). Lower row arrows indicate P movement between surface (0-10 cm) and sub-surface soil (10-30 cm).
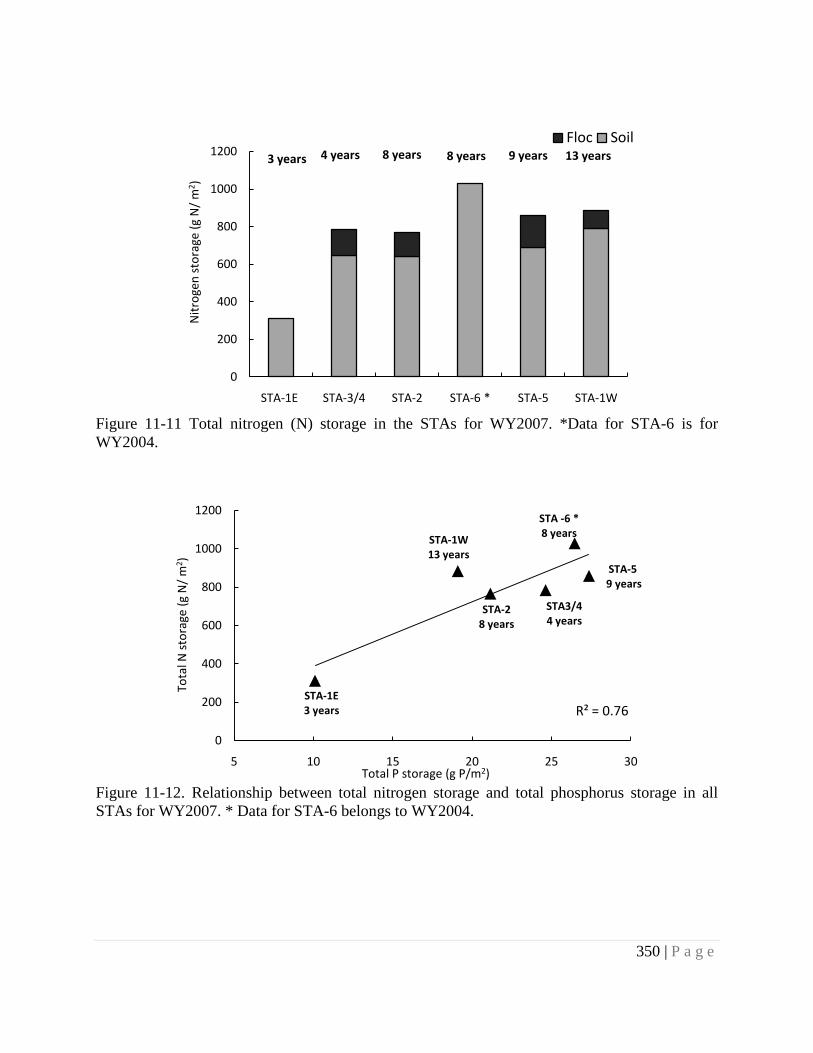
350 | P a g e
Figure 11-11 Total nitrogen (N) storage in the STAs for WY2007. *Data for STA-6 is for WY2004.
Figure 11-12. Relationship between total nitrogen storage and total phosphorus storage in all STAs for WY2007. * Data for STA-6 belongs to WY2004.
3 years 4 years 8 years 8 years 9 years 13 years
0
200
400
600
800
1000
1200
STA-1E STA-3/4 STA-2 STA-6 * STA-5 STA-1W
Nitr
ogen
sto
rage
(g N
/ m
2 )
Floc Soil
STA-1E3 years
STA-1W13 years
STA-28 years
STA -6 * 8 years
STA3/44 years
STA-59 years
R² = 0.76
0
200
400
600
800
1000
1200
5 10 15 20 25 30
Tota
l N s
tora
ge (g
N/
m2 )
Total P storage (g P/m2)

351 | P a g e
Figure 11-13. Total carbon storage in the STAs in WY2007.* Data for STA-6 belongs to WY2004.
Figure 11-14. Relationship between total carbon storage (g C/m2) and total phosphorus storage (g P/m2) in WY2007. *Data for STA-6 belongs to WY2004.
3 Years 4 years 6 years 8 years 9 years 13 Years
0
2000
4000
6000
8000
10000
12000
14000
16000
STA-1E STA-3/4 STA-6 * STA-2 STA-5 STA-1W
Carb
on s
tora
ge (g
C/
m2 )
Floc Soil
STA-1E3 years
STA-1W13 years
STA-28 years
STA-6 * 8 years
STA-3/44 years
STA-59 years
R² = 0.87
0
2000
4000
6000
8000
10000
12000
14000
16000
5 10 15 20 25 30
Tota
l C s
tora
ge (g
C/
m2 )
Total P storage (g P/m2)

352 | P a g e
Figure 11-15. Relationship between total carbon storage (g C/m2) and total nitrogen storage (g N/m2) in WY2007. *Data for STA-6 belongs to WY2004.
Figure 11-16: Percentage of total (floc + soil) phosphorus storage derived from water column phosphorus removed. All STA’s depicts WY2007 data except STA-6 which indicates WY2004.
STA-1E3 years
STA-1W13 years
STA-28 years
STA -6 * 8 years
STA-3/44 years
STA-59 years
R² = 0.82
0
2000
4000
6000
8000
10000
12000
14000
16000
0 200 400 600 800 1000 1200
Soil
C st
orag
e (g
C/
m2 )
Soil N storage (g N/m2)
STA-6 *
STA-2
STA-1E STA-3/4
STA-1W
STA-5
R² = 0.890
10
20
30
40
50
60
70
0 2 4 6 8 10 12 14
Perc
enta
ge (%
)
Age (years)

353 | P a g e
Figure 11-17 Relationship between total phosphorus retained (g P/m2) from water column till WY2007 and floc P concentration (mg P/kg) in WY2007.
Figure 11-18: Relationship between total phosphorus removed from water column till WY2007 and total P storage (floc + soil) (g P/m2). 1:1 line differentiates between native P and P retained from water column.
STA 6
STA 2
STA 5STA 3/4
STA 1W
STA 1E
R² = 0.64
0
200
400
600
800
1000
1200
1400
0 2 4 6 8 10 12 14
Floc
con
c (m
g P/
kg)
Water column P retained (g P/m2)
STA-6
STA-2
STA-5
STA-3/4
STA-1W
STA-1E
0
5
10
15
20
25
30
0 2 4 6 8 10 12 14
Tota
l PS
(g P
/ m
2 )
Water column P retained (g P/m2)
Most likely to be native P fraction Fraction derived from water column P removal.

354 | P a g e
Figure 11-19. Relationship between total phosphorus (TP) retained (g P/m2) from water column and total P storage (floc + soil) (g P/m2). STA averages used.
Figure 11-20. Relationship between total phosphorus (TP) retained (g P/m2) from water column and total P storage (floc + soil) (g P/m2). Cell averages used.
0
5
10
15
20
25
30
0 0.5 1 1.5 2 2.5
Tota
l PS
(g P
/m2 )
TP retained (g P/m2)
STA-1E-2007
STA-1W-2004
STA-1W-2007
STA-1W-2008
STA-2 -2004
STA-2-2007
STA-3/4-2007
STA-5-2001
STA-5-2003
STA-5-2004
STA-5-2007
STA-6-2004
0
5
10
15
20
25
30
35
40
-4 -2 0 2 4 6 8
Tota
l PS
(g P
/m2 )
TP retained (g P/m2)
STA-1E-2007
STA-1W-2004
STA-1W-2007
STA-2 -2004
STA-2-2007
STA-3/4-2007
STA-5-2003
STA-5-2004
STA-5-2007
STA-6-2004

355 | P a g e
Figure 11-21. Relationship between floc total phosphorus (TP) concentration (mg P/kg) and inflow TP flow-weighted mean concentration (FWMC; µg/L).
Figure 11-22. Relationship between and floc P storage (g P/m2) and total phosphorus (TP) flow-weighted mean concentration (FWMC; µg/L).
0
200
400
600
800
1000
1200
1400
1600
1800
0 100 200 300 400 500
Floc
TP
(mg/
kg)
TP FWMCI (µg/L)
STA-1E-2007STA-1W-2004STA-1W-2007STA-2 -2004STA-2-2007STA-3/4-2007STA-5-2003STA-5-2004STA-5-2007STA-6-2004
0
5
10
15
20
25
0 100 200 300 400 500
Floc
PS
(g P
/m2)
TP FWMCI (µg/L)
STA-1E-2007STA-1W-2004STA-1W-2007STA-2 -2004STA-2-2007STA-3/4-2007STA-5-2003STA-5-2004STA-5-2007STA-6-2004

356 | P a g e
12 RECOMMENDATIONS AND FUTURE OUTLOOK
We have reviewed the available data from the SFWMD on hydraulic loading, water quality, and soil nutrients for all STAs. In addition, we also reviewed UF project reports on STAs. Specific conclusions for each STA are presented in respective chapters. Chapter 12 provides a synthesis of comparison of all STAs. Recommendations presented in this report were based on our analysis of the datasets provided by the SFWMD, limitations of the existing data, and our experience in wetland ecosystem research.
12.1 Recommendations
12.1.1 Hydrology and water quality
• STAs are monitored extensively with respect to hydraulic loading and water column chemical constituents. Surface water quality data are recommended as the best data available at this time to evaluate the STA performance with respect to P removal effectiveness.
• Improved estimates of groundwater flux may reduce the residuals in calculated STA water budgets, potentially improving the accuracy of other analyses that incorporate water and P mass balance data.
• In our analysis, STA performance was not correlated to HRT, wetted area or water depth therefore SFWMD operations may be revised. However, our ability to assess the long-term chemical and biological impacts of these variables is limited.
• Assessment of residence time distributions (RTDs) within cells and STAs could reveal problematic short-circuiting. Further, incorporation of RTDs could improve the accuracy of P settling-rate calculations.
12.1.2 Floc and soil nutrients
• Improved monitoring is suggested for internal STA components, including floc, and soils. A systematic monitoring program must be implemented to capture spatial and temporal variability. The UF team has developed a soils monitoring program to meet the current needs of the SFWMD (Reddy et al., 2008).
• There is a need to establish a uniform and robust soils reference background information dataset. This reference set would be reliable to compare the outcomes of various subsequent interventions in STA management and would act as a benchmark to have scientifically robust comparisons.
• Soils play a critical role in dictating long-term performance of STAs. Once a STA starts accreting organic matter and other particulate matter, the newly accreted material dictates the exchange of P between soil and the water column. Additional studies are needed to determine the stability of P stored in these soils and determine how P retention capacities change with period of operation of the STA. It is recommended that newly accreted material should be monitored regularly for key parameters as presented by Reddy et al. (2008).

357 | P a g e
• It is recommended to accurately characterize the rate of accretion of soil. Over time, as STAs go through periods of drought, the transient floc layer dries out and gets consolidated into the soil fraction. Accurate estimation of soil accretion would allow greater precision in quantifying how much P was sequestered by the STA over time. This would provide another metric to evaluate long-term effectiveness of STAs to remove P. It is recommended to develop methods suitable for STAs to determine soil accretion rates. For example, deep cores (at least 30 cm) collected from select locations and sectioned into finer depth increments would enable differentiation of the boundary between native soil and newly accreted material.
• Assessment of equilibrium P concentration (EPC) for STA soils would be beneficial to estimate the potential P load that these soils can tolerate before releasing P back into the water column. It is recommended that EPC be determined for newly accreted material under varying hydrologic conditions.
• Nitrogen, carbon, and sulfur transformations can have significant effects on long-term storage and stability of P storage in STAs. It is recommended to determine the inter-relationships between P and other elemental cycles and its effect on P removal efficiency of STAs.
12.1.3 Vegetation
• It is recommended to determine the proportion of P stored in different above ground and below ground biomass, as these could be significant storages and need to be accounted when attempting STA P mass balance.
• Floating aquatic plant mats composed of organic matter may result in lower nutrient assimilative capacity and increased flux of nutrients from sediments to the water column. Therefore, in systems designed to optimize nutrient removal, ecosystem factors and management practices that reduce the likelihood of mat formation must be identified and implemented. In addition, strategies to manage floating substrates in systems prone to their formation must be developed. To address these points, it is recommended to determine the processes regulating formation of floating substrates in STAs and to quantify the effects floating substrate formation has on treatment efficacy.
12.1.4 Data integration and modeling
• Current knowledge of P retention and release processes in STAs should be integrated into management tools such as DMSTA or RSM. These tools can assist in forecasting STA performance and planning management activities. Processes regulating long-term P retention should be described for variable loading and environmental conditions, and data integration tools should be able to account for coupled interactions between these conditions (e.g., effects of very high flows on floc resuspension and associated effects on vegetative community viability).
• Simple correlations evaluated to date have not fully explained observed variability in STA performance. Several factors are suggested for further analysis to increase explanatory ability. 1) Nominal residence time has been investigated, but further inquiry is warranted using residence time distributions rather than merely the mean nominal residence time. 2) Multi-variate regression of several controlling factors is expected to

358 | P a g e
improve explanatory capabilities. Also, vegetative community data that were insufficiently quantitative for inclusion in the present analysis may be incorporated into the multi-variate regression if the qualitative data available can be used by transformed using indicator statistical approaches. 3) Coupled effects of hydrologic and biogeochemical driving forces can be interpreted using data integration tools such as DMSTA. The ability to rapidly and flexibly adapt such tools using recently acquired process knowledge would further improve explanatory and predictive ability.
• Comprehensive understanding of internal processes functioning in STAs is needed to determine long-term sustainability and performance of STAs to meet desired outflow water quality. Analysis of the surface water quality data alone will not provide insights in determining overall effectiveness of STAs. We recommend that future research be directed develop data on internal processes involving biogeochemistry, vegetation dynamics, and hydrology. These data coupled with predictive models will provide SFWMD tools and metrics needed to determine long-term sustainability of STAs.
12.2 Future Research
Stormwater treatment areas are critical hydrologic units of the Everglades. Long-term sustainability of these STAs is critical to reduce contaminant loads to WCAs and ENP. A vast amount of research and monitoring has been conducted to determine the effectiveness of STAs to retain P and other contaminants. However, much of this research is based on monitoring inflow and outflow concentrations and loads. Essentially, STAs have been treated as “black box” with minimal effort focused on internal processes and their effects on P retention and outflow concentrations.
Based on our analysis of the data on water quality and floc and soil nutrients, we have identified the following key issues that should be addressed to determine the long-term sustainability of STAs:
• What is the P storage capacity of STA soils? • How long will STAs store incoming phosphorus? • What are the mechanisms that control long-term P storage, and can these processes be
managed more effectively to increase long-term storage? • What indicators or measures can managers use as tools that may indicate when an STA is
approaching failure? • How can current monitoring of STAs be improved?
We propose some general ideas on future research and monitoring of STAs. This research should focus on both internal processes and the effects of external forcing events (drought, hurricanes, and contaminant loading rates) on effluent water quality. We believe that the proposed research will be very useful for forecasting long-term sustainability of STAs and addressing the key issues presented. Some examples of critical research and monitoring needs are already presented as recommendations in Section 13.1
Some overarching examples of research and monitoring programs are presented below:

359 | P a g e
• Conduct a detailed literature review and data synthesis of research and monitoring conducted on STAs. This should include: hydrology and water quality, floc and soil nutrients, vegetation dynamics, and data synthesis and forecasting tools.
• Conduct a 3-day workshop involving key researchers and managers to discuss the research and monitoring data collected. The outcome of this workshop should be to develop a long-term sustainable research and monitoring plan to collect systematic data.
• The research and monitoring plans should include a series of field, laboratory and modeling studies, to develop effective management strategies to maximize (1) the performance (to achieve 20 ug L-1) ; (2) the longevity of STAs to store and retain P; and (3) develop management strategies of optimize STAs.
• Refine or develop data integration tools for predicting performance of STAs under different environmental conditions and identify key metrics to determine long-term sustainability of STAs. One example of data integration and analysis is shown below. Level I data may include routine monitoring hydrology, water quality, soil and floc nutrients, and vegetation, while Level II data (see Reddy et al., 2008b) may include internal biogeochemical processes.
Some specific examples of research and monitoring may include:
• Soil accretion rates within STAs are poorly defined at this time. It is important to understand how these rates can be influenced by various STA operations and hydrologic management regimes. Better information about soil accretion rates will enable us to predict phosphorus storage as a function of time.
• Predict not merely rate of phosphorus (P) accretion, but spatial distribution of P accretion. This is important for operational management and maintenance of internal management units (compartments) or irregular geometry.
• Evaluate not just management alternatives, but timing of management activities such as drawdown or muck removal for long-term planning.
Level I
Level II
AnalyzeData Identify
Indicators
MonitorIndicators
STAPerformanceEvaluation
Primary Data
ModelParameters
Hydro-Biogeochemical/Statistical Models

360 | P a g e
• Understand stability of accreted P subject to "disturbances" (short circuiting; extreme flow or wind events; changes in management; changes in vegetation type; introduction of new flora and fauna).
• Identify most important P cycling process parameters (e.g., sensitivity analysis) to help direct both management and future experimental research.
• Evaluate the relative importance of residence time distribution mean an d variance in controlling STA performance. Should management effort be focused on reducing the prevalence of preferential flow zones and associated bypassing?
• Understand stability characteristics and accretion rates of newly formed soil and effects of hydroperiod.
• Mechanisms to lower EPC within wetland soils should be investigated. Lower EPC values correspond to lower potential concentration of phosphorus discharged to downstream waters. Although the storage potential of phosphorus is high in wetlands, the water column concentration in isolated wetlands can often be high, resulting in greater than desired phosphorus discharge concentrations. Application of soil amendments directly to wetland soils during dry periods, or in association with a downstream discharge point, may provide a means to lower phosphorus concentrations from the water column, thereby lowering surface water phosphorus concentrations.
• Develop stable isotopic indicators (δ13c, δ15n, δ34s) for tracing internal accumulation and redistribution of STA soils.
• Evaluate the coupling of biogeochemical processes (C, N, S, and P cycling) regulating stability of stored nutrients.
• Investigate coupled C, N, S, and P cycles in STA periphyton communities to enhance organic phosphorus removal.
• Evaluate processes regulating formation of floating substrates and quantify the effect of floating substrate formation on STA treatment efficacy.
361 | P a g e
13 REFERENCES
Abtew, W. 1996. Evapotranspiration measurements and modeling for three wetland systems in South Florida. Water Resour Bull 32:465-473.
Bostic, E.M. and J.R. White. 2007. Soil phosphorus and vegetation influence on wetland phosphorus release after simulated drought. Soil Sci. Soc. Am. J. 71:238-244.
Brown and Caldwell. 1996 STA-2 Period of Record Dry-Out Modeling, Technical Memorandum Report to South Florida Water Management District.
DB Environmental, 2002. Vegetation Biomass and Nutrient Analysis for STA-1W. Report to South Florida Water Management District.
Guardo, M. 1999. Hydrologic balance for a subtropical treatment wetland constructed for nutrient removal. Ecol. Eng. 12:315-337.
Juston, J. and T.A. DeBusk. 2006. Phosphorus mass load and outflow concentration relationships in stormwater treatment areas for everglades restoration. Ecol. Eng. 26:206-223. Kadlec, R. H. and R. L. Knight. 1996, Treatment Wetlands, CRC Press, Boca Raton.
Kadlec, R. H. and S Wallace. 2008, Treatment Wetlands, Second edition, CRC Press, Boca Raton.
Osborne, T. Z. 2005. Characterization, mobility, and fate of dissolved organic carbon in a wetland ecosystem. Ph. D., dissertation, University of Florida.
Pietro, K., R. Bearzotti, G. Germain, and N. Iricanin, 2008. Chapter 5: STA Performance, Compliance and Optimization South Florida Water Management District, West Palm Beach, FL. South Florida Environmental Report, South Florida Water Management District, West Palm Beach, FL.
Pietro, K., R. Bearzotti, G. Germain, and N. Iricanin, 2009. Chapter 5: STA Performance, Compliance and Optimization South Florida Water Management District, West Palm Beach, FL. South Florida Environmental Report, South Florida Water Management District, West Palm Beach, FL.
Qualls, R. G., and C. J. Richardson. 2003. Factors controlling concentration, export, and decomposition of dissolved organic nutrients in the Everglades of Florida. Biogeochemistry. 62:197-229.
Reddy, K.R., R.D. Delaune, W.F. Debusk and M.S. Koch, 1993. Long-term nutrient accumulation rates in the Everglades. Soil Sci. Soc. Am. J. 57:1147-1155.

362 | P a g e
Reddy, K. R., R. G. Wetzel, and R. H. Kadlec. 2005. Biogeochemistry of phosphorus in wetlands. In. Phosphorus: agriculture and the Environment, Agronomy Monograph No. 46. 263-316. Soil Science Society of America, Madison, WI.
Reddy, K. R., R. H. Kadlec, M. J. Chimney, and W. J. Mitsch. 2006. The Everglades Nutrient Removal Project. Special Issue. Ecological Engineering. 27: 265-379.
Reddy, K. R., I. Torres, and E. P. Dunne. 2008a. Organization and project-level validation of historical soil data of the stormwater treatment areas. Final report submitted to South Florida Water Management District.
Reddy, K. R., E. P. Dunne, M. W. Clark, and J. Jawitz. 2008b. Redesign of the soil sampling program for the stormwater treatment areas. Final report submitted to South Florida Water Management District.

363 | P a g e
14 APPENDIX
14.1 Appendix 1
Hydrology tables and figures.

364 | P a g e
Table 14-1. Stations used in the compilation of the STA-5 water budget. Flow Station Name DBKEY Period of Record Agency Frequency Source Remarks
Inflow G242A_C J6406 1 May 2000 to 30 April 2008 WMD Daily DBHYDRO Inflow northern flow-way
Inflow G242B_C J6398 1 May 2000 to 30 April 2008 WMD Daily DBHYDRO Inflow northern flow-way
Inflow G242C_C J6407 1 May 2000 to 30 April 2008 WMD Daily DBHYDRO Most of the values are estimated
Inflow central flow-way
Inflow G242D_C J6405 1 May 2000 to 30 April 2008 WMD Daily DBHYDRO Most of the values are estimated
Inflow central flow-way
Inflow G349A_P JJ103 1May 2000 to 30 April 2008 WMD Daily DBHYDRO Inflow northern flow-way
Inflow G507_P N2481 24 Feb 2001 to 30 April 2008 WMD Daily DBHYDRO Cell 1B inflow
Outflow G344A_C J0719 1 May 2000 to 30 April 2008 WMD Daily DBHYDRO Outflow northern flow-way
Outflow G344B_C J0720 1 May 2000 to 30 April 2008 WMD Daily DBHYDRO Outflow northern flow-way
Outflow G344C_C J0721 1 May 2000 to 30 April 2008 WMD Daily DBHYDRO Outflow central flow-way
Outflow G344D_C J0722 1 May 2000 to 30 April 2008 WMD Daily DBHYDRO Outflow central flow-way
Table 14-2. Stations used in the compliation of the STA-5 phosphorus mass balance.
Flow Structure Names Station ID(s) Parameters Collection
Method Begin Date End Date Frequency
Inflow G-342 G-507
G342A-D G507
DOP G 6/14/1999 6/5/2008 Bi-Weekly/Weekly SRP G 6/14/1999 6/5/2008 Bi-Weekly/Weekly TP G/ACF 11/30/1998 6/5/2008 Weekly
Outflow G-344 G344A-F G344DDS
DOP G 4/3/2000 6/5/2008 Bi-Weekly/Weekly SRP G 4/3/2000 6/5/2008 Bi-Weekly/Weekly TP G/ACF 6/17/1999 6/5/2008 Weekly

365 | P a g e
Table 14-3. Coefficients for elevation CDF [Equation ( 4-10 )]. STA-1E a b c d e f g Cell 3 0.001294974 -0.098039893 2.880651342 -39.88411001 231.6600962 0 -3648.828628 Cell 4N 0.3189276649 -26.5087479634 917.1549747665 -16907.0487343121 175143.5894197960 -966729.2783189160 2221246.4794759000 Cell 4S -0.0626197798 4.7868868463 -152.1224533631 2572.2761600127 -24407.8065507486 123221.6737928190 -258566.7042726770 Cell 5 -0.0182718944 1.5208591411 -52.5846014619 966.6471340068 -9963.5106682376 54594.4510439676 -124238.6358247480 Cell 6 0.0000000000 -0.0132938244 0.8822980245 -23.2666227595 304.6819719734 -1980.7878636366 5113.3538540521 Cell 7 -0.0500850209 3.6307413429 -109.3667401774 1752.1105045050 -15744.4405493849 75239.5970008303 -149384.6570432900 STA-1W Cell 1 0.0 0.0 0.1238468087 -4.8619345344 71.2514470309 -461.4956720219 1114.0491901782 Cell 2A 0.0 0.0 5.3071388648 -199.5481135317 2811.1185909028 -17583.8746400253 41204.8607752463 Cell 2B 0.0 -0.2025649777 6.6949935879 -78.5842074595 345.5564748026 0.0 -2666.2357893666 Cell 3 0.0 -0.6714915399 32.7089284579 -636.5237702247 6185.7601260178 -30018.7030645562 58195.2798396985 Cell 4 0.0 11.1045155277 -379.7018558546 4615.1659899966 -21030.7584195155 0.0 174549.2852004510 Cell 5A 0.0 0.0 0.9469072531 -33.7786408421 450.6995515219 -2665.0574600798 5891.7561117755 Cell 5B 0.0 0.4939343940 -21.2656085740 364.9309422993 -3120.2577104807 13293.9195380956 -22580.7690599182 STA-2 Cell 1 -0.1742788699 11.1382028340 -296.2146635218 4196.0557664054 -33392.7972913732 141555.0974690730 -249721.7800246700 Cell 2 0.0 0.0 -0.0617424964 2.5499645612 -39.2634594139 267.4436023189 -680.4197466730 Cell 3 0.0026614679 -0.1377040206 2.9237915105 -32.6067874283 201.5222007750 -654.7966728094 874.4411161944 STA-3/4 Cell 1A -61.6317910053 3441.8245852187 -80057.4978504374 992779.5091207380 -6922504.0367150500 25734035.0825009000 -39845146.7513240000 Cell 1B -0.1823588933 6.0290250647 -69.1781536109 282.0986659186 0.0 0.0 -10866.9580956770 Cell 2A 0.0 0.0 2.8578321906 -110.9488920028 1613.2635763199 -10411.9748753071 25164.9457210002 Cell 2B 0.0 11.4474196199 -539.3279932430 10156.7897051306 -95571.4201460801 449333.6750983170 -844445.4265641720 Cell 3A 0.2565295779 -11.9846290641 218.4377103078 -1885.0715244730 6854.2709830722 0.0 -42798.5176877662 Cell 3B 0.8826713759 -41.4883343855 761.2498944248 -6617.4321971412 24252.2592215813 0.0 -154129.7157512900 STA-5 Cell 1A 0.0 0.0 -0.0035253969 0.1563267019 -2.5305598189 17.8495802323 -46.5039443248 Cell 1B 0.1414041043 -10.4626764003 321.9474072350 -5273.4281439116 48493.7326007455 -237373.9631042960 483191.3142168890 Cell 2A 0.0 -0.3240471981 21.6155455309 -576.1311064742 7669.5062737428 -50989.9982606160 135439.0002148080 Cell 2B 0.0 0.0 0.0138101868 -0.7175030345 13.8370109593 -117.1302080501 367.0499806031 STA-6 Cell 3 0.0076829120 -0.5740633811 17.7862602421 -292.5103507101 2693.4287826435 -13167.9412611506 26707.8593873917 Cell 5 0.0026932032 -0.2159938191 7.1981019087 -127.5514747210 1267.1186570981 -6688.1387758463 14646.7395296289

366 | P a g e
Table 14-4. Non-cumulative areal*temporal depth distributions STA-1E Dry 0-0.5 ft .5-1 ft 1-1.5 ft 1.5-2 ft 2-2.5 ft 2.5-3 ft 3-3.5 ft 3.5-4 ft >4 ft
STA-1E Cell 3 WY2006 2% 7% 22% 32% 25% 10% 2% 0% 0% 0%
WY2007 3% 7% 16% 30% 27% 14% 2% 0% 0% 0%
WY2008 7% 3% 4% 20% 31% 25% 9% 1% 0% 0%
STA-1E Cell 4N WY2006 0% 5% 27% 42% 20% 5% 1% 0% 0% 0%
WY2007 1% 8% 26% 39% 20% 6% 1% 0% 0% 0%
WY2008 1% 7% 8% 15% 33% 25% 8% 2% 1% 0%
STA-1E Cell 4S WY2006 1% 3% 8% 23% 31% 20% 7% 5% 3% 0%
WY2007 1% 2% 9% 26% 34% 21% 5% 1% 0% 0%
WY2008 0% 1% 3% 8% 18% 28% 26% 13% 3% 1%
STA-1E Cell 5 WY2006 5% 14% 25% 28% 19% 8% 2% 0% 0% 0%
WY2007 4% 7% 13% 23% 28% 19% 5% 1% 0% 0%
WY2008 8% 5% 5% 18% 29% 26% 8% 1% 0% 0%
STA-1E Cell 6 WY2006 0% 3% 13% 25% 30% 17% 7% 4% 1% 0%
WY2007 0% 0% 7% 22% 35% 30% 5% 1% 0% 1%
WY2008 0% 0% 4% 11% 22% 26% 21% 12% 2% 1%
STA-1E Cell 7 WY2006 0% 0% 5% 19% 29% 24% 14% 6% 2% 1%
WY2007 0% 0% 0% 14% 35% 33% 11% 3% 2% 1%
WY2008 0% 0% 1% 7% 16% 25% 27% 17% 6% 2%
STA-1W Dry 0-0.5 ft .5-1 ft 1-1.5 ft 1.5-2 ft 2-2.5 ft 2.5-3 ft 3-3.5 ft 3.5-4 ft >4 ft
STA-1W Cell 1 WY1995 0% 0% 3% 6% 12% 20% 25% 20% 12% 2%
WY1996 0% 1% 2% 5% 14% 18% 25% 26% 10% 0%
WY1997 0% 0% 4% 8% 15% 24% 27% 17% 5% 0%
WY1998 0% 0% 2% 9% 13% 24% 31% 18% 2% 0%
WY1999 0% 1% 3% 10% 16% 25% 28% 15% 3% 0%
WY2000 0% 0% 2% 6% 12% 21% 26% 20% 10% 3%
WY2001 0% 1% 4% 7% 16% 23% 23% 16% 8% 1%
WY2002 0% 2% 3% 9% 13% 15% 23% 22% 7% 6%
WY2003 0% 0% 2% 5% 10% 17% 21% 22% 15% 9%
WY2004 0% 0% 2% 5% 11% 18% 24% 22% 10% 8%
WY2005 0% 1% 3% 7% 13% 20% 21% 16% 9% 10%
WY2006 0% 0% 2% 7% 12% 21% 27% 15% 8% 6%

367 | P a g e
WY2007 30% 7% 7% 9% 10% 11% 10% 5% 4% 7%
WY2008 10% 4% 8% 13% 17% 21% 20% 5% 1% 0%
STA-1W Cell 2A WY1995 0% 0% 1% 4% 6% 17% 37% 32% 3% 0%
WY1996 0% 0% 0% 1% 9% 16% 19% 44% 11% 1%
WY1997 0% 0% 0% 0% 4% 25% 36% 28% 6% 1%
WY1998 0% 0% 0% 0% 1% 16% 39% 35% 8% 0%
WY1999 0% 0% 0% 0% 6% 21% 46% 23% 2% 0%
WY2000 0% 0% 0% 0% 2% 16% 33% 31% 15% 3%
WY2001 0% 0% 0% 0% 5% 27% 29% 26% 11% 1%
WY2002 0% 0% 0% 4% 11% 6% 27% 35% 9% 7%
WY2003 0% 0% 0% 0% 2% 12% 25% 39% 16% 5%
WY2004 0% 0% 0% 0% 2% 11% 27% 39% 15% 5%
WY2008 2% 3% 5% 5% 8% 26% 37% 4% 0% 10%
STA-1W Cell 2B WY1995 0% 0% 0% 3% 5% 11% 34% 37% 10% 0%
WY1996 0% 0% 0% 0% 5% 17% 26% 39% 13% 1%
WY1997 0% 0% 0% 0% 2% 28% 34% 26% 8% 2%
WY1998 0% 0% 0% 0% 1% 14% 31% 37% 16% 2%
WY1999 0% 0% 0% 0% 4% 14% 39% 34% 8% 0%
WY2000 0% 0% 0% 0% 0% 9% 28% 33% 21% 9%
WY2001 0% 0% 0% 0% 1% 17% 30% 28% 19% 6%
WY2002 0% 0% 0% 1% 10% 6% 15% 38% 19% 11%
WY2003 0% 0% 0% 0% 0% 8% 19% 38% 25% 10%
WY2004 0% 0% 0% 1% 13% 10% 9% 33% 26% 9%
WY2005 6% 6% 5% 8% 26% 18% 11% 9% 7% 4%
WY2006 10% 7% 8% 32% 30% 10% 1% 0% 0% 1%
WY2008 4% 4% 6% 6% 5% 14% 36% 21% 2% 2%
STA-1W Cell 3 WY1995 0% 1% 10% 16% 28% 23% 16% 6% 0% 0%
WY1996 0% 0% 8% 21% 27% 24% 17% 2% 0% 0%
WY1997 0% 0% 6% 24% 24% 29% 13% 3% 0% 0%
WY1998 0% 3% 23% 23% 30% 16% 4% 1% 0% 0%
WY1999 0% 1% 16% 26% 26% 23% 6% 1% 0% 0%
WY2000 0% 0% 5% 22% 23% 28% 16% 5% 1% 0%
WY2001 0% 2% 8% 20% 23% 25% 15% 6% 2% 0%
WY2002 0% 3% 5% 9% 23% 20% 22% 13% 3% 1%
WY2003 0% 0% 2% 13% 23% 25% 22% 10% 3% 1%
WY2004 0% 0% 2% 8% 19% 26% 23% 17% 4% 0%
WY2005 0% 0% 4% 17% 23% 26% 19% 7% 3% 1%
WY2006 0% 0% 1% 15% 25% 25% 25% 7% 2% 0%
WY2007 44% 4% 4% 9% 11% 13% 9% 4% 1% 0%

368 | P a g e
WY2008 16% 4% 7% 17% 22% 18% 16% 2% 0% 0%
STA-1W Cell 4 WY1995 0% 0% 0% 4% 5% 17% 33% 39% 1% 0%
WY1996 0% 0% 0% 0% 3% 24% 31% 42% 1% 0%
WY1997 0% 0% 0% 0% 4% 40% 33% 23% 1% 0%
WY1998 0% 0% 0% 0% 0% 16% 37% 39% 8% 0%
WY1999 0% 0% 0% 0% 4% 15% 49% 31% 2% 0%
WY2000 0% 0% 0% 0% 0% 8% 34% 36% 17% 5%
WY2001 0% 0% 0% 0% 0% 20% 35% 27% 15% 3%
WY2002 0% 0% 0% 0% 13% 4% 16% 49% 10% 7%
WY2003 0% 0% 0% 0% 0% 11% 25% 50% 11% 4%
WY2004 0% 0% 0% 0% 17% 7% 12% 45% 18% 1%
WY2005 7% 7% 5% 6% 35% 15% 10% 10% 5% 0%
WY2006 6% 12% 8% 40% 26% 8% 0% 0% 0% 0%
WY2007 13% 4% 14% 49% 19% 0% 0% 0% 0% 0%
WY2008 13% 2% 4% 6% 9% 20% 44% 2% 0% 0%
STA-1W Cell 5A WY2001 0% 0% 0% 0% 0% 2% 20% 34% 15% 29%
WY2002 0% 0% 0% 0% 3% 17% 28% 25% 13% 15%
WY2003 0% 0% 0% 0% 3% 16% 25% 29% 20% 7%
WY2004 0% 0% 0% 3% 21% 24% 19% 21% 10% 1%
WY2005 0% 0% 0% 5% 17% 23% 24% 21% 6% 4%
WY2006 5% 0% 21% 41% 26% 6% 1% 0% 0% 0%
WY2007 24% 0% 12% 36% 23% 5% 0% 0% 0% 0%
WY2008 3% 0% 11% 14% 20% 26% 17% 6% 2% 0%
STA-1W Cell 5B WY2001 0% 0% 0% 4% 10% 24% 36% 22% 4% 0%
WY2002 0% 0% 1% 9% 13% 17% 27% 23% 8% 2%
WY2003 0% 0% 2% 3% 12% 23% 26% 20% 10% 4%
WY2004 0% 0% 0% 4% 19% 24% 25% 21% 7% 0%
WY2005 0% 1% 5% 13% 26% 26% 16% 8% 3% 1%
WY2006 12% 13% 19% 31% 18% 6% 1% 0% 0% 0%
WY2007 13% 6% 22% 36% 20% 4% 0% 0% 0% 0%
WY2008 0% 2% 11% 12% 19% 31% 20% 4% 0% 0%
STA-2 Dry 0-0.5 ft .5-1 ft 1-1.5 ft 1.5-2 ft 2-2.5 ft 2.5-3 ft 3-3.5 ft 3.5-4 ft >4 ft
STA-2 Cell 1 WY2002 48% 9% 14% 14% 8% 4% 2% 0% 0% 0%
WY2003 22% 4% 4% 14% 27% 17% 8% 3% 1% 0%
WY2004 0% 0% 1% 25% 33% 23% 12% 4% 1% 0%
WY2005 0% 0% 5% 18% 31% 23% 14% 6% 2% 1%
WY2006 0% 3% 6% 16% 26% 24% 16% 6% 3% 1%
WY2007 0% 1% 11% 29% 23% 17% 10% 6% 2% 1%

369 | P a g e
WY2008 3% 7% 15% 17% 20% 18% 12% 5% 2% 1%
STA-2 Cell 2 WY2002 12% 15% 20% 18% 13% 9% 8% 3% 2% 0%
WY2003 6% 11% 20% 22% 17% 10% 7% 5% 2% 0%
WY2004 1% 8% 23% 25% 17% 9% 7% 8% 1% 0%
WY2005 5% 20% 24% 19% 12% 8% 9% 2% 1% 0%
WY2006 7% 21% 25% 19% 11% 7% 8% 2% 0% 0%
WY2007 11% 21% 21% 16% 11% 9% 7% 2% 2% 0%
WY2008 14% 20% 23% 18% 11% 7% 7% 2% 0% 0%
STA-2 Cell 3 WY2002 0% 1% 5% 10% 18% 22% 19% 13% 6% 7%
WY2003 0% 1% 3% 4% 11% 22% 24% 18% 10% 7%
WY2004 0% 0% 3% 10% 19% 24% 20% 12% 5% 6%
WY2005 0% 3% 13% 20% 22% 18% 11% 5% 5% 3%
WY2006 2% 3% 14% 22% 23% 17% 9% 4% 4% 3%
WY2007 0% 5% 20% 26% 23% 14% 5% 2% 5% 1%
WY2008 0% 2% 9% 21% 24% 20% 12% 5% 2% 5%
STA-3/4 Dry 0-0.5 ft .5-1 ft 1-1.5 ft 1.5-2 ft 2-2.5 ft 2.5-3 ft 3-3.5 ft 3.5-4 ft >4 ft
STA-3/4 Cell 1A WY2006 0% 0% 2% 18% 24% 23% 11% 8% 6% 8%
WY2007 2% 2% 11% 41% 22% 7% 5% 3% 2% 6%
WY2008 9% 2% 2% 19% 29% 22% 9% 5% 2% 1%
STA-3/4 Cell 1B WY2006 0% 0% 4% 37% 33% 15% 6% 4% 0% 1%
WY2007 0% 0% 7% 66% 17% 3% 2% 3% 2% 0%
WY2008 0% 0% 12% 37% 30% 15% 4% 0% 0% 0%
STA-3/4 Cell 2A WY2006 0% 0% 0% 11% 37% 22% 9% 9% 5% 7%
WY2007 1% 4% 11% 40% 25% 7% 4% 3% 2% 4%
WY2008 1% 4% 4% 18% 36% 24% 10% 2% 0% 0%
STA-3/4 Cell 2B WY2006 0% 0% 1% 28% 50% 11% 4% 3% 1% 1%
WY2007 0% 0% 6% 54% 32% 4% 2% 2% 1% 0%
WY2008 0% 0% 5% 37% 36% 19% 3% 0% 0% 0%
STA-3/4 Cell 3A WY2006 2% 16% 22% 15% 16% 15% 10% 4% 0% 1%
WY2007 7% 21% 34% 26% 4% 2% 1% 1% 2% 2%
WY2008 1% 8% 16% 35% 27% 9% 4% 1% 0% 0%
STA-3/4 Cell 3B WY2006 1% 19% 26% 37% 14% 2% 0% 0% 0% 0%
WY2007 1% 19% 41% 31% 2% 1% 1% 2% 2% 0%
WY2008 2% 8% 12% 43% 30% 5% 0% 0% 0% 0%

370 | P a g e
STA-5 Dry 0-0.5 ft .5-1 ft 1-1.5 ft 1.5-2 ft 2-2.5 ft 2.5-3 ft 3-3.5 ft 3.5-4 ft >4 ft
STA-5 Cell 1A WY2000 13% 9% 13% 14% 14% 13% 10% 7% 5% 3%
WY2001 12% 12% 15% 15% 14% 12% 9% 6% 3% 2%
WY2002 5% 6% 11% 14% 15% 14% 12% 10% 7% 6%
WY2003 1% 4% 8% 13% 15% 15% 14% 11% 8% 9%
WY2004 1% 4% 8% 13% 15% 15% 14% 11% 8% 10%
WY2005 1% 6% 10% 14% 15% 15% 13% 10% 7% 7%
WY2006 15% 7% 8% 10% 11% 11% 10% 9% 7% 11%
WY2007 39% 14% 13% 11% 9% 6% 4% 2% 1% 1%
WY2008 45% 15% 13% 11% 8% 5% 2% 1% 0% 0%
STA-5 Cell 1B WY2000 15% 10% 10% 12% 17% 15% 4% 11% 5% 0%
WY2001 9% 14% 16% 18% 21% 14% 6% 3% 0% 0%
WY2002 8% 8% 17% 19% 15% 18% 13% 3% 0% 0%
WY2003 5% 11% 21% 16% 17% 25% 5% 0% 0% 0%
WY2004 2% 5% 22% 18% 10% 31% 12% 0% 0% 0%
WY2005 20% 8% 15% 12% 14% 19% 11% 1% 0% 0%
WY2006 20% 19% 14% 15% 26% 6% 1% 0% 0% 0%
WY2007 14% 24% 9% 21% 31% 1% 0% 0% 0% 0%
WY2008 22% 18% 19% 14% 20% 7% 0% 0% 0% 0%
STA-5 Cell 2A WY2000 12% 10% 10% 24% 36% 7% 1% 0% 0% 0%
WY2001 8% 9% 16% 25% 23% 15% 3% 0% 0% 0%
WY2002 4% 4% 11% 10% 24% 30% 13% 3% 0% 0%
WY2003 0% 1% 6% 10% 20% 32% 24% 6% 0% 0%
WY2004 0% 1% 8% 9% 24% 34% 17% 7% 0% 0%
WY2005 0% 1% 8% 9% 21% 39% 16% 6% 0% 0%
WY2006 27% 1% 5% 8% 12% 19% 14% 9% 4% 1%
WY2007 37% 11% 13% 19% 17% 2% 0% 0% 0% 0%
WY2008 17% 16% 14% 22% 27% 5% 0% 0% 0% 0%
STA-5 Cell 2B WY2000 22% 14% 17% 18% 15% 9% 4% 1% 0% 0%
WY2001 25% 13% 17% 18% 15% 9% 3% 0% 0% 0%
WY2002 20% 13% 17% 20% 18% 10% 2% 0% 0% 0%
WY2003 12% 12% 17% 19% 19% 15% 6% 0% 0% 0%
WY2004 10% 12% 18% 21% 20% 14% 5% 0% 0% 0%
WY2005 9% 12% 18% 22% 21% 13% 5% 1% 0% 0%
WY2006 38% 9% 13% 15% 14% 8% 2% 0% 0% 0%
WY2007 38% 15% 17% 17% 11% 2% 0% 0% 0% 0%
WY2008 32% 15% 17% 16% 13% 6% 2% 0% 0% 0%
STA-6 Dry 0-0.5 ft .5-1 ft 1-1.5 ft 1.5-2 ft 2-2.5 ft 2.5-3 ft 3-3.5 ft 3.5-4 ft >4 ft

371 | P a g e
STA-6 Cell 3
WY2003 13% 6% 19% 26% 22% 11% 3% 1% 0% 0% WY2004 6% 10% 20% 25% 21% 12% 4% 1% 0% 0% WY2005 12% 11% 22% 25% 19% 8% 2% 0% 0% 0% WY2006 12% 15% 23% 23% 16% 8% 3% 1% 0% 0% WY2007 49% 5% 11% 15% 12% 6% 1% 0% 0% 0% WY2008 49% 17% 16% 11% 5% 1% 0% 0% 0% 0%
STA-6 Cell 5
WY2003 4% 4% 5% 4% 8% 15% 22% 24% 13% 2% WY2004 1% 2% 4% 7% 10% 16% 22% 22% 12% 3% WY2005 4% 4% 6% 6% 10% 18% 23% 20% 9% 1% WY2006 5% 5% 6% 7% 11% 16% 20% 19% 9% 3% WY2007 22% 17% 13% 5% 4% 6% 11% 13% 8% 0% WY2008 17% 17% 19% 13% 10% 10% 8% 5% 2% 0%

372 | P a g e
Table 14-5. Stage stations STA-1E Station DBKey POR*
Cell 1 S-363A_T S-363C_T S-364B_H
SC965 SC970 SG551
2004 Aug – 2009 Jan 2004 Jul – 2009 Jan 2007 Nov – 2009 Jan
Cell 3 S-366B_T S-366D_T S-367C_H
SC997 SC984 TA313
2004 Dec – 2009 Jan 2004 Nov – 2009 Jan 2005 Jan – 2009 Jan
Cell 4N S-367C_T S-368C_H
TA315 SG586
2005 Jan – 2009 Jan 2005 May – 2009 Jan
Cell 4S S-368C_T S-369C_H
SG588 TA319
2005 May – 2009 Jan 2005 Jan – 2009 Jan
Cell 5 S-370A_T S-370C_T S-371B_H
SG924 TF248 TA325
2004 Dec – 2009 Jan 2006 Jan – 2009 Jan 2005 Jan – 2009 Jan
Cell 6 S-374B_T S-371B_T S-372C_H
TA339 TA327 TA331
2005 Jan – 2009 Jan 2005 Jan - 2009 Jan 2005 Feb – 2009 Jan
Cell 7 S-373A,B_T S-374B_H
SG934, SG940 TA337
2004 Dec – 2009 Jan 2004 Dec – 2009 Jan
STA-1W Cell 1A G-250S_T
G-303_T G-255_H G-255_H G-248B_H
16217 L9828 15908 VM831 VW882
1993 Sept – 2009 Jan 2000 Jun – 2009 Jan 1993 Aug – 2005 Jan 2008 Jan – 2009 Jan 2008 Jun – 2009 Jan
Cell 1B G-248B_T G-253AB_H G-253EF_H G-253IJ_H
W3836 15895 15897 15899
2008 Aug – 2009 Jan 1994 Mar – 2008 Jan 1994 Feb – 2008 Jan 1994 Jan – 2007 Nov
Cell 2A G-255_T G-255_T G-249D_H
15909 VM833 US187
1993 Aug – 2005 Jan 2008 Jan – 2009 Jan 2007 Apr – 2009 Jan
Cell 2B G-249D_T G-254C_H G-245DE_H
US198 15903 16273
2007 Feb – 2009 Jan 1993 Oct – 2006 Mar 1995 Oct – 2006 Mar
Cell 3 G-253AB_T G-253EF_T G-253IJ_T G-308_H G-259_H G-251_H
15896 15898 15900 L9845 VM665 16218
1994 Mar – 2008 Jan 1994 Feb – 2008 Jan 1994 Jan – 2008 Jan 2000 Jun – 2009 Jan 1995 Mar – 2001 Jul 1993 Oct – 2009 Jan
Cell 4 G-254AB_T G-254C_T
16528 15904
1999 Oct – 2006 Apr 1993 Oct – 2006 Mar

373 | P a g e
G-254DE_T G-258_H G-309_H G-307_H
16274 15913 L9848 VM848
1995 Oct – 2006 Apr 1994 Apr – 1999 Aug 2000 Jun – 2009 Jan 2008 Jan – 2009 Jan
Cell 5A G-304A,B,D,F,H,I,J_T G-305G,K,N_H
L9843, OB424, OH 554, OH558, OH562, OH565, V2479, VW869; OB358, P6882, OB362
2000 Jun – 2006 Auga 2002 Mar – 2009 Jana
Cell 5B G-305G,K,N_T G-306A,B,C,D,E,F,G,H,I,J_H
OB360, P6883, OB364; L9951, P6920, P6914, P6910, P6906, P6902, P6890, P6886, P6898, L9954
2002 Mar – 2009 Jana 2000 Jun – 2009 Jana
STA-2 Cell 1 G-329B_T
G-330A,D_H G-330B,C,E_H
MT238 MQ893, T1014 MQ894, T1010, T1018
2000 Dec – 2009 Jan 2001 Feb – 2009 Jan 2005 Feb – 2009 Jan
Cell2 G-331B,E_T G-331D_T G-332_H
MT241, MT244 U3468 N3458
2001 Jan – 2009 Jan 2006 Jun – 2009 Jan 2001 Mar – 2009 Jan
Cell3 G-333C_T G-334_H
N0751 N3452
2000 Dec – 2009 Jan 2001 Feb – 2009 Jan
STA-3/4 Cell 1A G-374B,E_T
G-375D_H T9922, T9924 T9999
2005 Jan – 2009 Jan 2005 Jan – 2009 Jan
Cell 1B G-375D_T G-376B,E_H
TA000 T1024, T1031
2005 Jan – 2009 Jan 2004 Dec – 2009 Jan
Cell 2A G-377B,D_T G-378C_H
T9926, T9928 T9929
2005 Jan – 2009 Jan 2005 Jan – 2009 Jan
Cell 2B G-378C_T G-379B,D_H
T9930 T1048, T1054
2005 Jan – 2009 Jan 2004 Dec – 2009 Jan
Cell 3A G-380B,E_T T9932, T9998 2005 Jan – 2009 Jan

374 | P a g e
G-384C_H VV479 2008 Apr – 2009 Jan Cell 3B G-384C_T
G-381B,E_H VV481 T1061, T1068
2008 Apr – 2009 Jan 2004 Dec – 2009 Jan
STA-5 Cell 1A G-342A,B_T
G-349A_T G-343B_H G-343C_H
JJ113, JJ115 JJ157 JJ812 OB435
1999 Jun – 2009 Jan 1999 Jun – 2009 Jan 1999 Jul – 2009 Jan 2002 Jun – 2009 Jan
Cell 1B G-343B_T G-343C_T G-344A,B_H
JJ813 OB436 JJ133, JJ138
1999 Jul – 2009 Jan 2002 Jun – 2009 Jan 1999 Jun – 2009 Jan
Cell 2A G-342C,D_T G-350A_T G-343F_H G-343G_H
JJ123, JJ128 JJ161 JJ815 OB438
1999 Jun – 2009 Jan 1999 May – 2009 Jan 1999 Jun – 2006 Jun 2002 May – 2006 May
Cell 2B G-343F_T G-343G_T G-344C,D_H
J816 OB437 JJ143, JJ148
1999 Jun – 2006 Jun 2002 May – 2006 May 1999 May – 2009 Jan
STA-6 Cell 3 G-392S_T
G-393B_H G6562 G6565
1997 Dec – 2009 Jan 1997 Dec – 2009 Jan
Cell 5 G-352S_T G-354C_H
G6560 TA188
1997 Dec – 2009 Jan 1997 Dec – 2007 Jun
*POR indicates date range retrieved from DBHydro; date ranges used in analyses were typically truncated to the earliest and latest full water year. aCollective date range; not all stations have records through the whole range.

375 | P a g e
Table 14-6. Nominal hydraulic residence times for the period of record.
STAs Period Avg. Stage Flow rate (m3/s) Effective
Vol. HRT
(m NGVD) Inflow Outflow Average (Hm3 = m3 x 106) (days)
STA-1E Cell 3 WY(2007-2008) 0.91 2.38 3.23 2.81 2.06 8.5
Cell 4N WY(2007-2008) 0.88 3.23 3.71 3.47 2.26 7.6 Cell 4S WY(2007-2008) 1.07 4.17 3.09 3.63 3.23 10.3 Cell 5 WY(2007-2008) 0.94 0.84 0.64 0.74 2.03 31.9 Cell 6 WY(2007-2008) 1.03 1.37 1.51 1.44 4.37 35.2 Cell 7 WY(2007-2008) 1.09 0.71 0.73 0.72 1.84 29.6
STA-1W Cell 1 WY(2000-2008) 0.74 4.77 5.02 4.90 4.43 10.5 Cell 2 WY(2000-2005)a 0.90 2.73 2.76 2.74 3.44 14.5 Cell 3 WY(2000-2008) 0.57 4.27 3.81 4.04 2.35 6.7 Cell 4 WY(2000-2006)b 0.60 2.29 2.70 2.49 0.87 4.1 Cell 5 WY(2001-2008)c 0.67 3.86 4.95 4.40 7.73 20.3
STA-2 Cell 1 WY(2003-2008) 0.56 2.34 2.11 2.22 3.9 20.2 Cell 2 WY(2003-2008) 0.36 4.33 3.91 4.12 3.0 8.5 Cell 3 WY(2003-2008) 0.62 4.30 4.03 4.16 5.7 15.8
STA-3/4 EFW WY(2006-2008) 0.52 6.81 9.34 8.07 12.6 18.1 CFW WY(2006-2008) 0.60 5.02 5.79 5.4 13.2 28.3 WFW WY(2006-2008) 0.35 3.68 3.54 3.61 6.7 21.5
STA-5 NFW WY(2001-2008) 0.44 3.08 2.66 2.87 3.1 12.7 CFW WY(2001-2008) 0.36 2.39 1.48 1.94 2.4 14.6
STA-6 Cell 3 WY(2003-2008) 0.27 0.63 0.43 0.53 0.2 4.5 Cell 5 WY(2003-2008) 0.34 0.61 0.48 0.54 0.8 16.5
a Average values based on 8 months in WY2005 (from May, 1 to Dec, 31, 2004) b Average values based on 10.7 months in WY2006 (from May, 1 to Mar 22, 2006). c Average values based on 9 months in WY2001 (from Aug, 1 to Apr 30, 2001). Table 14-7. STA-1E: Three-month rolling average stages, flow rates and estimated nominal hydraulic residence time (HRT) for STA-1E treatment cells. Water Year Period Average
Stage Flow rate (m3/s) Volume HRT
(m NGVD) Inflow Outflow Average (Hm3 = m3 x 106) (days)
Cell 3 2007 May,06 - Jul, 06 0.81 0.89 1.30 1.10 1.91 20 2007 Aug,06 - Oct,06 0.95 2.23 3.73 2.98 2.27 9

376 | P a g e
2007 Nov, 06 - Jan, 07 0.95 0.64 1.33 0.99 2.27 27 2007 Feb, 07 - Apr, 07 0.76 0.06 0.15 0.10 1.58 178a 2008 May,07 - Jul, 07 0.70 2.02 2.43 2.22 1.20 6 2008 Aug,07 - Oct,07 1.07 8.29 10.03 9.16 2.54 3 2008 Nov, 07 - Jan, 08 1.00 0.76 1.07 0.92 2.38 30 2008 Feb, 08 - Apr, 08 1.05 4.07 5.63 4.85 2.50 6
Cell 4N 2007 May,06 - Jul, 06 0.69 1.30 1.28 1.29 1.73 16 2007 Aug,06 - Oct,06 0.87 3.73 4.25 3.99 2.26 7 2007 Nov, 06 - Jan, 07 0.83 1.33 1.76 1.54 2.16 16 2007 Feb, 07 - Apr, 07 0.77 0.15 0.11 0.13 2.01 183a 2008 May,07 - Jul, 07 0.68 2.43 2.55 2.49 1.71 8 2008 Aug,07 - Oct,07 1.09 10.03 11.64 10.83 2.83 3 2008 Nov, 07 - Jan, 08 1.02 1.07 1.12 1.10 2.66 28 2008 Feb, 08 - Apr, 08 1.06 5.63 6.77 6.20 2.76 5
Cell 4S 2007 May,06 - Jul, 06 0.88 1.62 1.01 1.32 2.62 23 2007 Aug,06 - Oct,06 1.03 4.84 3.70 4.27 3.15 9 2007 Nov, 06 - Jan, 07 1.05 2.12 1.29 1.71 3.20 22 2007 Feb, 07 - Apr, 07 0.88 0.24 0.08 0.16 2.65 195a 2008 May,07 - Jul, 07 0.97 3.00 2.18 2.59 2.93 13 2008 Aug,07 - Oct,07 1.18 12.30 8.95 10.63 3.59 4 2008 Nov, 07 - Jan, 08 1.29 1.62 1.48 1.55 3.93 29 2008 Feb, 08 - Apr, 08 1.24 7.44 5.92 6.68 3.77 7
Cell 5 2007 May,06 - Jul, 06 0.96 2.40 0.10 1.25 2.17 20 2007 Aug,06 - Oct,06 1.01 3.23 3.47 3.35 2.32 8 2007 Nov, 06 - Jan, 07 1.00 0.09 0.03 0.06 2.32 456a 2007 Feb, 07 - Apr, 07 0.70 0.00 0.00 0.00 1.39 - 2008 May,07 - Jul, 07 0.65 0.19 0.11 0.15 1.04 81 2008 Aug,07 - Oct,07 1.02 0.13 0.19 0.16 2.36 170a 2008 Nov, 07 - Jan, 08 1.06 0.11 0.26 0.18 2.44 153a 2008 Feb, 08 - Apr, 08 1.08 0.53 0.97 0.75 2.50 39
Cell 6 2007 May,06 - Jul, 06 0.93 0.64 2.40 1.52 3.96 30 2007 Aug,06 - Oct,06 0.97 7.49 5.45 6.47 4.10 7 2007 Nov, 06 - Jan, 07 0.97 0.28 0.33 0.30 4.13 157a 2007 Feb, 07 - Apr, 07 0.97 0.00 0.00 0.00 4.11 - 2008 May,07 - Jul, 07 0.90 0.24 0.27 0.26 3.82 173a 2008 Aug,07 - Oct,07 1.05 1.47 1.08 1.28 4.44 40 2008 Nov, 07 - Jan, 08 1.20 0.48 0.24 0.36 5.11 165a 2008 Feb, 08 - Apr, 08 1.25 0.31 2.28 1.29 5.30 47
Cell 7 2007 May,06 - Jul, 06 1.01 0.39 0.54 0.46 1.71 43 2007 Aug,06 - Oct,06 1.06 3.39 4.02 3.70 1.80 6 2007 Nov, 06 - Jan, 07 1.02 0.15 0.25 0.20 1.73 99 2007 Feb, 07 - Apr, 07 0.96 0.05 0.04 0.05 1.62 415a 2008 May,07 - Jul, 07 0.95 0.05 0.14 0.09 1.61 198a 2008 Aug,07 - Oct,07 1.14 0.81 1.28 1.05 1.92 21

377 | P a g e
2008 Nov, 07 - Jan, 08 1.27 0.09 0.22 0.16 2.15 161 2008 Feb, 08 - Apr, 08 1.28 0.66 -0.66 0.00 2.17 -
Table 14-8. STA-1W: Three-month rolling average stages, flow rates and estimated nominal hydraulic residence time (HRT) for Cell 1. Water Year Period Average
Stage Flow rate (m3/s) Volume HRT
(m NGVD) Inflow Outflow Average (Hm3 = m3 x 106) (days)
2000 May,99 - Jul, 99 0.67 1.66 2.46 2.06 4.07 23 2000 Aug,99 - Oct,99 0.87 1.63 6.32 3.97 5.27 15 2000 Nov, 99 - Jan, 00 0.83 2.18 5.13 3.66 5.03 16 2000 Feb, 00 - Apr, 00 0.76 3.18 4.09 3.63 4.59 15 2001 May,00 - Jul, 00 0.69 4.06 4.15 4.11 4.14 12 2001 Aug,00 - Oct,00 0.92 8.63 6.14 7.38 5.55 9 2001 Nov, 00 - Jan, 01 0.74 1.76 0.52 1.14 4.46 45 2001 Feb, 01 - Apr, 01 0.63 1.36 0.77 1.07 3.79 41 2002 May,01 - Jul, 01 0.59 3.46 2.98 3.22 3.56 13 2002 Aug,01 - Oct,01 0.95 8.44 8.86 8.65 5.72 8 2002 Nov, 01 - Jan, 02 0.83 5.11 4.14 4.63 5.02 13 2002 Feb, 02 - Apr, 02 0.81 2.96 3.28 3.12 4.87 18 2003 May,02 - Jul, 02 0.79 7.61 8.41 8.01 4.77 7 2003 Aug,02 - Oct,02 0.94 14.52 15.26 14.89 5.67 4 2003 Nov, 02 - Jan, 03 0.90 11.06 10.33 10.70 5.44 6 2003 Feb, 03 - Apr, 03 0.83 4.52 5.88 5.20 5.00 11 2004 May,03 - Jul, 03 0.92 10.09 8.88 9.48 5.54 7 2004 Aug,03 - Oct,03 0.97 10.96 10.97 10.96 5.85 6 2004 Nov, 03 - Jan, 04 0.79 1.97 2.07 2.02 4.78 27 2004 Feb, 04 - Apr, 04 0.69 1.45 2.31 1.88 4.15 26 2005 May,04 - Jul, 04 0.80 2.93 3.49 3.21 4.80 17 2005 Aug,04 - Oct,04 0.96 13.83 22.01 17.92 5.78 4 2005 Nov, 04 - Jan, 05 0.71 3.34 3.61 3.47 4.27 14 2005 Feb, 05 - Apr, 05 0.80 5.94 5.11 5.53 4.81 10 2006 May,05 - Jul, 05 0.88 7.33 7.36 7.35 5.28 8 2006 Aug,05 - Oct,05 0.83 6.67 5.64 6.15 5.01 9 2006 Nov, 05 - Jan, 06 0.67 1.57 1.42 1.49 4.04 31 2006 Feb, 06 - Apr, 06 0.64 2.22 2.55 2.39 3.85 19 2007 May,06 - Jul, 06 0.70 8.38 5.97 7.17 4.24 7 2007 Aug,06 - Oct,06 0.77 6.88 6.10 6.49 4.65 8 2007 Nov, 06 - Jan, 07 0.22 0.00 0.00 0.00 1.34 - 2007 Feb, 07 - Apr, 07 0.00 0.00 0.00 0.00 0.00 - 2008 May,07 - Jul, 07 0.19 0.46 0.11 0.29 1.14 46 2008 Aug,07 - Oct,07 0.57 3.32 0.30 1.81 3.44 22 2008 Nov, 07 - Jan, 08 0.67 0.41 0.15 0.28 4.03 165a 2008 Feb, 08 - Apr, 08 0.75 1.56 3.76 2.66 4.51 20
Table 14-9. STA-1W: Three-month rolling average stages, flow rates and estimated nominal hydraulic residence time (HRT) for Cell 2. Water Period Average Flow rate (m3/s) Volume HRT

378 | P a g e
Year Stage
(m NGVD) Inflow Outflow Average (Hm3 = m3 x 106) (days)
2000 May,99 - Jul, 99 0.79 1.23 1.35 1.29 3.00 27 2000 Aug,99 - Oct,99 0.98 2.72 0.46 1.59 3.72 27 2000 Nov, 99 - Jan, 00 0.96 2.42 2.31 2.37 3.66 18 2000 Feb, 00 - Apr, 00 0.91 2.03 2.42 2.22 3.46 18 2001 May,00 - Jul, 00 0.83 2.01 2.45 2.23 3.17 16 2001 Aug,00 - Oct,00 1.03 1.88 2.43 2.15 3.93 21 2001 Nov, 00 - Jan, 01 0.84 0.27 0.35 0.31 3.22 120a 2001 Feb, 01 - Apr, 01 0.71 0.57 0.71 0.64 2.72 49 2002 May,01 - Jul, 01 0.66 1.50 1.16 1.33 2.52 22 2002 Aug,01 - Oct,01 1.06 3.09 2.15 2.62 4.04 18 2002 Nov, 01 - Jan, 02 0.94 2.20 2.18 2.19 3.57 19 2002 Feb, 02 - Apr, 02 0.91 1.63 2.36 1.99 3.48 20 2003 May,02 - Jul, 02 0.86 4.04 4.57 4.30 3.26 9 2003 Aug,02 - Oct,02 1.00 8.52 5.06 6.79 3.82 7 2003 Nov, 02 - Jan, 03 0.98 3.61 6.61 5.11 3.74 8 2003 Feb, 03 - Apr, 03 0.96 2.37 2.93 2.65 3.67 16 2004 May,03 - Jul, 03 1.03 3.35 6.58 4.96 3.94 9 2004 Aug,03 - Oct,03 1.04 4.31 7.83 6.07 3.97 8 2004 Nov, 03 - Jan, 04 0.93 1.37 1.94 1.65 3.54 25 2004 Feb, 04 - Apr, 04 0.72 0.41 0.72 0.57 2.74 56 2005 May,04 - Jul, 04 0.80 0.07 0.33 0.20 3.06 176a 2005 Aug,04 - Oct,04 0.98 9.82 5.12 7.47 3.73 6 2005 Nov, 04 - Jan, 05 0.78 3.58 0.62 2.10 2.99 16
Table 14-10. STA-1W: Three-month rolling average stages, flow rates and estimated nominal hydraulic residence time (HRT) for Cell 3. Water Year Period Average
Stage Flow rate (m3/s) Volume HRT
(m NGVD) Inflow Outflow Average (Hm3 = m3 x 106) (days)
2000 May,99 - Jul, 99 0.39 2.62 2.67 2.64 1.63 7 2000 Aug,99 - Oct,99 0.51 6.04 6.10 6.07 2.11 4 2000 Nov, 99 - Jan, 00 0.40 5.62 5.58 5.60 1.64 3 2000 Feb, 00 - Apr, 00 0.58 4.42 3.94 4.18 2.39 7 2001 May,00 - Jul, 00 0.42 4.31 4.38 4.35 1.73 5 2001 Aug,00 - Oct,00 0.69 6.17 5.03 5.60 2.87 6 2001 Nov, 00 - Jan, 01 0.68 0.19 0.22 0.21 2.83 159a 2001 Feb, 01 - Apr, 01 0.54 0.40 0.47 0.43 2.23 60 2002 May,01 - Jul, 01 0.45 1.81 1.39 1.60 1.87 14 2002 Aug,01 - Oct,01 0.78 8.27 7.56 7.91 3.26 5 2002 Nov, 01 - Jan, 02 0.69 4.28 4.43 4.36 2.88 8 2002 Feb, 02 - Apr, 02 0.70 3.50 2.94 3.22 2.92 11 2003 May,02 - Jul, 02 0.60 6.34 4.46 5.40 2.49 5 2003 Aug,02 - Oct,02 0.64 10.76 8.81 9.79 2.66 3 2003 Nov, 02 - Jan, 03 0.58 10.16 8.53 9.35 2.40 3 2003 Feb, 03 - Apr, 03 0.72 4.98 4.18 4.58 3.00 8

379 | P a g e
2004 May,03 - Jul, 03 0.78 8.21 7.05 7.63 3.25 5 2004 Aug,03 - Oct,03 0.72 8.47 7.07 7.77 3.01 4 2004 Nov, 03 - Jan, 04 0.75 1.57 1.56 1.57 3.10 23 2004 Feb, 04 - Apr, 04 0.53 1.77 1.01 1.39 2.20 18 2005 May,04 - Jul, 04 0.57 3.26 2.44 2.85 2.36 10 2005 Aug,04 - Oct,04 0.66 13.59 10.98 12.29 2.75 3 2005 Nov, 04 - Jan, 05 0.60 2.26 2.34 2.30 2.50 13 2005 Feb, 05 - Apr, 05 0.64 5.06 4.61 4.84 2.65 6 2006 May,05 - Jul, 05 0.65 7.36 5.85 6.61 2.68 5 2006 Aug,05 - Oct,05 0.63 5.64 4.68 5.16 2.63 6 2006 Nov, 05 - Jan, 06 0.68 1.42 1.48 1.45 2.82 23 2006 Feb, 06 - Apr, 06 0.64 2.55 2.54 2.54 2.65 12 2007 May,06 - Jul, 06 0.61 5.97 6.28 6.13 2.53 5 2007 Aug,06 - Oct,06 0.63 6.10 6.03 6.07 2.60 5 2007 Nov, 06 - Jan, 07 0.00 0.07 0.39 0.23 0.00 - 2007 Feb, 07 - Apr, 07 0.00 0.00 0.10 0.05 0.00 - 2008 May,07 - Jul, 07 0.09 0.11 0.23 0.17 0.37 25 2008 Aug,07 - Oct,07 0.49 0.30 1.10 0.70 2.03 34 2008 Nov, 07 - Jan, 08 0.62 -0.02 0.17 0.08 2.58 380a 2008 Feb, 08 - Apr, 08 0.70 0.00 0.38 0.19 2.90 178a
Table 14-11. STA-1W: Three-month rolling average stages, flow rates and estimated nominal hydraulic residence time (HRT) for Cell 4. Water Year Period Average
Stage Flow rate (m3/s) Volume HRT
(m NGVD) Inflow Outflow Average (Hm3 = m3 x 106) (days)
2000 May,99 - Jul, 99 0.61 1.35 1.38 1.37 0.88 7 2000 Aug,99 - Oct,99 0.79 0.46 2.44 1.45 1.14 9 2000 Nov, 99 - Jan, 00 0.76 2.31 2.90 2.61 1.10 5 2000 Feb, 00 - Apr, 00 0.73 2.42 2.36 2.39 1.05 5 2001 May,00 - Jul, 00 0.56 2.45 2.17 2.31 0.81 4 2001 Aug,00 - Oct,00 0.82 2.43 2.22 2.33 1.18 6 2001 Nov, 00 - Jan, 01 0.70 0.35 -0.04 0.16 1.01 - 2001 Feb, 01 - Apr, 01 0.56 0.71 0.35 0.53 0.81 18 2002 May,01 - Jul, 01 0.47 1.16 1.71 1.44 0.68 5 2002 Aug,01 - Oct,01 0.84 2.15 4.13 3.14 1.22 4 2002 Nov, 01 - Jan, 02 0.73 2.18 2.45 2.31 1.06 5 2002 Feb, 02 - Apr, 02 0.75 2.36 1.87 2.11 1.08 6 2003 May,02 - Jul, 02 0.65 4.57 4.41 4.49 0.95 2 2003 Aug,02 - Oct,02 0.72 5.06 9.22 7.14 1.05 2 2003 Nov, 02 - Jan, 03 0.75 6.61 7.51 7.06 1.09 2 2003 Feb, 03 - Apr, 03 0.79 2.93 3.30 3.12 1.14 4 2004 May,03 - Jul, 03 0.85 6.58 5.97 6.27 1.23 2 2004 Aug,03 - Oct,03 0.80 7.83 7.38 7.60 1.15 2 2004 Nov, 03 - Jan, 04 0.77 1.94 1.57 1.75 1.12 7 2004 Feb, 04 - Apr, 04 0.38 0.72 0.70 0.71 0.55 9 2005 May,04 - Jul, 04 0.34 0.33 0.09 0.21 0.50 28

380 | P a g e
2005 Aug,04 - Oct,04 0.61 5.12 8.48 6.80 0.88 1 2005 Nov, 04 - Jan, 05 0.56 0.44 1.51 0.97 0.81 10 2005 Feb, 05 - Apr, 05 0.07 -0.05 0.00 -0.03 0.11 - 2006 May,05 - Jul, 05 0.02 0.15 0.00 0.08 0.03 5 2006 Aug,05 - Oct,05 0.31 0.48 0.07 0.28 0.45 19 2006 Nov, 05 - Jan, 06 0.43 0.06 0.00 0.03 0.62 223a
Table 14-12. STA-1W: Three-month rolling average stages, flow rates and estimated nominal hydraulic residence time (HRT) for Cell 5. Water Year Period Average
Stage Flow rate (m3/s) Volume HRT
(m NGVD) Inflow Outflow Average (Hm3 = m3 x 106) (days)
2001 Aug,00 - Oct,00 1.01 -0.49 1.44 0.47 11.63 285a 2001 Nov, 00 - Jan, 01 0.86 -0.04 0.18 0.07 9.89 - 2001 Feb, 01 - Apr, 01 0.66 -0.72 0.35 -0.18 7.61 - 2002 May,01 - Jul, 01 0.71 0.74 3.85 2.30 8.18 41 2002 Aug,01 - Oct,01 1.00 0.73 16.10 8.41 11.61 16 2002 Nov, 01 - Jan, 02 0.87 0.88 1.80 1.34 10.04 87 2002 Feb, 02 - Apr, 02 0.89 3.52 3.49 3.51 10.24 34 2003 May,02 - Jul, 02 0.76 14.50 16.02 15.26 8.79 7 2003 Aug,02 - Oct,02 0.97 21.96 20.80 21.38 11.25 6 2003 Nov, 02 - Jan, 03 1.04 16.99 14.61 15.80 11.98 9 2003 Feb, 03 - Apr, 03 0.71 1.57 2.63 2.10 8.22 45 2004 May,03 - Jul, 03 0.59 0.00 0.00 0.00 6.78 - 2004 Aug,03 - Oct,03 0.92 10.43 8.33 9.38 10.67 13 2004 Nov, 03 - Jan, 04 0.95 2.18 1.86 2.02 10.95 63 2004 Feb, 04 - Apr, 04 0.79 5.18 6.27 5.72 9.16 19 2005 May,04 - Jul, 04 0.76 4.36 4.59 4.48 8.73 23 2005 Aug,04 - Oct,04 0.89 20.99 22.62 21.81 10.34 5 2005 Nov, 04 - Jan, 05 0.67 2.74 1.61 2.18 7.76 41 2005 Feb, 05 - Apr, 05 0.38 1.50 0.48 0.99 4.42 52 2006 May,05 - Jul, 05 0.50 1.15 1.91 1.53 5.79 44 2006 Aug,05 - Oct,05 0.42 3.24 2.42 2.83 4.91 20 2006 Nov, 05 - Jan, 06 0.34 1.18 0.64 0.91 3.97 51 2006 Feb, 06 - Apr, 06 0.01 0.00 1.69 0.84 0.13 2 2007 May,06 - Jul, 06 0.25 0.14 -0.14 0.00 2.84 - 2007 Aug,06 - Oct,06 0.36 0.00 3.55 1.78 4.15 27 2007 Nov, 06 - Jan, 07 0.45 0.00 1.07 0.54 5.25 113a 2007 Feb, 07 - Apr, 07 0.45 0.00 0.00 0.00 5.20 - 2008 May,07 - Jul, 07 0.35 0.63 0.00 0.31 4.01 148a 2008 Aug,07 - Oct,07 0.70 4.64 11.39 8.01 8.10 12 2008 Nov, 07 - Jan, 08 0.73 0.30 0.36 0.33 8.42 298a 2008 Feb, 08 - Apr, 08 0.74 0.88 3.29 2.09 8.56 48

381 | P a g e
Table 14-13. STA-2: Three-month rolling average stages, flow rates and estimated nominal hydraulic residence time (HRT) for Cell 1. Water Year Period Average
Stage Flow rate (m3/s) Effective Vol.b HRT
(m NGVD) Inflow Outflow Average (Hm3 = m3 x 106) (days)
2003 May,02 - Jul, 02 0.01 0.00 0.00 0.00 0.02 - 2003 Aug,02 - Oct,02 0.49 2.34 0.90 1.62 3.44 25 2003 Nov, 02 - Jan, 03 0.61 2.34 1.29 1.81 4.44 28 2003 Feb, 03 - Apr, 03 0.65 2.58 2.54 2.56 4.73 21 2004 May,03 - Jul, 03 0.63 2.75 2.54 2.64 4.59 20 2004 Aug,03 - Oct,03 0.68 4.49 4.00 4.25 4.97 14 2004 Nov, 03 - Jan, 04 0.54 1.38 0.52 0.95 3.92 48 2004 Feb, 04 - Apr, 04 0.54 1.27 0.71 0.99 3.93 46 2005 May,04 - Jul, 04 0.52 1.11 1.24 1.18 3.81 37 2005 Aug,04 - Oct,04 0.76 4.71 5.69 5.20 5.54 12 2005 Nov, 04 - Jan, 05 0.53 0.85 0.34 0.60 3.89 76 2005 Feb, 05 - Apr, 05 0.64 1.91 1.73 1.82 4.67 30 2006 May,05 - Jul, 05 0.70 3.48 3.35 3.42 5.09 17 2006 Aug,05 - Oct,05 0.76 3.95 4.50 4.22 5.56 15 2006 Nov, 05 - Jan, 06 0.40 0.02 0.09 0.05 2.88 608a 2006 Feb, 06 - Apr, 06 0.59 1.90 1.03 1.47 4.30 34 2007 May,06 - Jul, 06 0.65 3.35 2.44 2.90 4.74 19 2007 Aug,06 - Oct,06 0.69 4.46 6.10 5.28 4.99 11 2007 Nov, 06 - Jan, 07 0.48 0.81 1.66 1.23 3.52 33 2007 Feb, 07 - Apr, 07 0.41 0.50 0.11 0.30 2.95 112a 2008 May,07 - Jul, 07 0.50 3.36 2.57 2.96 3.42 13 2008 Aug,07 - Oct,07 0.76 7.57 5.83 6.70 5.52 10 2008 Nov, 07 - Jan, 08 0.40 0.06 0.39 0.22 2.90 150a 2008 Feb, 08 - Apr, 08 0.41 0.89 0.90 0.90 2.87 37
Table 14-14. STA-2: Three-month rolling average stages, flow rates and estimated nominal hydraulic residence time (HRT) for Cell 2. Water Year Period Average
Stage Flow rate (m3/s) Effective Vol.b HRT
(m NGVD) Inflow Outflow Average (Hm3 = m3 x 106) (days)
2003 May,02 - Jul, 02 0.27 9.57 8.28 8.92 1.98 3 2003 Aug,02 - Oct,02 0.40 2.40 1.70 2.05 3.57 20 2003 Nov, 02 - Jan, 03 0.47 2.04 1.43 1.74 4.25 28 2003 Feb, 03 - Apr, 03 0.52 4.95 4.34 4.65 4.76 12 2004 May,03 - Jul, 03 0.42 4.90 5.21 5.06 3.82 9 2004 Aug,03 - Oct,03 0.43 7.00 7.32 7.16 3.84 6 2004 Nov, 03 - Jan, 04 0.47 0.94 0.56 0.75 4.35 67 2004 Feb, 04 - Apr, 04 0.45 1.27 0.92 1.09 4.10 43 2005 May,04 - Jul, 04 0.31 1.38 0.72 1.05 2.67 30 2005 Aug,04 - Oct,04 0.46 15.93 15.41 15.67 4.09 3 2005 Nov, 04 - Jan, 05 0.31 0.01 0.17 0.09 2.75 353a 2005 Feb, 05 - Apr, 05 0.31 5.11 4.21 4.66 2.60 6

382 | P a g e
2006 May,05 - Jul, 05 0.39 11.12 9.16 10.14 3.44 4 2006 Aug,05 - Oct,05 0.32 6.12 4.82 5.47 2.75 6 2006 Nov, 05 - Jan, 06 0.23 1.03 0.14 0.59 1.81 36 2006 Feb, 06 - Apr, 06 0.34 1.95 1.30 1.63 3.04 22 2007 May,06 - Jul, 06 0.35 7.43 7.22 7.33 2.95 5 2007 Aug,06 - Oct,06 0.43 10.44 10.69 10.57 3.65 4 2007 Nov, 06 - Jan, 07 0.31 0.56 0.38 0.47 2.66 65 2007 Feb, 07 - Apr, 07 0.20 0.01 0.06 0.03 1.41 488a 2008 May,07 - Jul, 07 0.18 1.08 0.81 0.94 1.15 14 2008 Aug,07 - Oct,07 0.38 5.32 5.69 5.51 3.38 7 2008 Nov, 07 - Jan, 08 0.25 0.00 0.00 0.00 1.99 - 2008 Feb, 08 - Apr, 08 0.36 3.02 3.09 3.06 3.11 12
Table 14-15. STA-2: Three-month rolling average stages, flow rates and estimated nominal hydraulic residence time (HRT) for Cell 3. Water Year Period Average
Stage Flow rate (m3/s) Effective Vol.b HRT
(m NGVD) Inflow Outflow Average (Hm3 = m3 x 106) (days)
2003 May,02 - Jul, 02 0.60 8.81 9.56 9.19 5.53 7 2003 Aug,02 - Oct,02 0.84 3.84 2.27 3.05 7.76 29 2003 Nov, 02 - Jan, 03 0.88 4.23 2.42 3.33 8.12 28 2003 Feb, 03 - Apr, 03 0.92 5.81 4.09 4.95 8.45 20 2004 May,03 - Jul, 03 0.82 6.06 5.78 5.92 7.57 15 2004 Aug,03 - Oct,03 0.61 6.92 7.82 7.37 5.64 9 2004 Nov, 03 - Jan, 04 0.83 2.45 1.12 1.79 7.65 50 2004 Feb, 04 - Apr, 04 0.66 2.05 1.67 1.86 6.07 38 2005 May,04 - Jul, 04 0.54 1.91 0.96 1.43 4.93 40 2005 Aug,04 - Oct,04 0.69 14.31 14.62 14.47 6.36 5 2005 Nov, 04 - Jan, 05 0.58 1.73 1.94 1.83 5.29 33 2005 Feb, 05 - Apr, 05 0.48 4.01 2.22 3.11 4.39 16 2006 May,05 - Jul, 05 0.55 7.34 5.48 6.41 5.06 9 2006 Aug,05 - Oct,05 0.60 8.92 7.82 8.37 5.50 8 2006 Nov, 05 - Jan, 06 0.55 -0.60 1.71 0.55 5.01 105a 2006 Feb, 06 - Apr, 06 0.48 2.85 2.01 2.43 4.37 21 2007 May,06 - Jul, 06 0.41 2.23 3.35 2.79 3.73 15 2007 Aug,06 - Oct,06 0.53 6.25 6.85 6.55 4.84 9 2007 Nov, 06 - Jan, 07 0.50 0.87 0.64 0.75 4.58 71 2007 Feb, 07 - Apr, 07 0.45 0.15 0.02 0.09 4.17 557a 2008 May,07 - Jul, 07 0.52 2.26 1.81 2.03 4.78 27 2008 Aug,07 - Oct,07 0.68 7.37 8.08 7.72 6.21 9 2008 Nov, 07 - Jan, 08 0.54 0.00 0.00 0.00 4.97 - 2008 Feb, 08 - Apr, 08 0.62 4.13 4.74 4.43 5.66 15
Table 14-16. STA-3/4: Three-month rolling average stages, flow rates and estimated nominal hydraulic residence time (HRT) for Eastern Flow-way. Water Year Period Average
Stage Flow rate (m3/s) Effective Vol.b HRT

383 | P a g e
(m NGVD) Inflow Outflow Average (Hm3 = m3 x 106) (days)
2006 May,05 - Jul, 05 0.77 21.27 31.81 26.54 19.97 9 2006 Aug,05 - Oct,05 0.62 12.54 18.62 15.58 16.04 12 2006 Nov, 05 - Jan, 06 0.52 1.33 9.27 5.30 13.45 29 2006 Feb, 06 - Apr, 06 0.45 0.99 6.59 3.79 11.61 35 2007 May,06 - Jul, 06 0.47 8.91 7.81 8.36 12.14 17 2007 Aug,06 - Oct,06 0.63 15.63 17.17 16.40 16.51 12 2007 Nov, 06 - Jan, 07 0.42 0.92 0.42 0.67 10.97 190a 2007 Feb, 07 - Apr, 07 0.34 0.32 0.00 0.16 8.81 632a 2008 May,07 - Jul, 07 0.39 6.04 4.65 5.34 10.19 22 2008 Aug,07 - Oct,07 0.56 6.67 8.18 7.42 14.58 23 2008 Nov, 07 - Jan, 08 0.44 0.00 0.00 0.00 11.33 - 2008 Feb, 08 - Apr, 08 0.64 7.02 7.48 7.25 16.65 27
Table 14-17. STA-3/4: Three-month rolling average stages, flow rates and estimated nominal hydraulic residence time (HRT) for Central Flow-way. Water Year Period Average
Stage Flow rate (m3/s) Effective Vol.b HRT
(m NGVD) Inflow Outflow Average (Hm3 = m3 x 106) (days)
2006 May,05 - Jul, 05 0.84 20.38 21.99 21.19 18.57 10 2006 Aug,05 - Oct,05 0.67 10.24 9.22 9.73 14.71 18 2006 Nov, 05 - Jan, 06 0.62 2.15 4.13 3.14 13.62 50 2006 Feb, 06 - Apr, 06 0.60 -0.38 4.30 1.96 13.12 78 2007 May,06 - Jul, 06 0.54 4.34 6.17 5.25 11.89 26 2007 Aug,06 - Oct,06 0.69 10.36 12.45 11.41 15.27 15 2007 Nov, 06 - Jan, 07 0.47 0.27 0.00 0.14 10.29 878a 2007 Feb, 07 - Apr, 07 0.41 0.38 0.00 0.19 9.04 549a 2008 May,07 - Jul, 07 0.55 3.70 3.21 3.46 12.02 40 2008 Aug,07 - Oct,07 0.61 2.27 2.06 2.17 13.41 72 2008 Nov, 07 - Jan, 08 0.51 0.00 0.00 0.00 11.11 - 2008 Feb, 08 - Apr, 08 0.70 6.41 6.04 6.22 15.46 29
Table 14-18. STA-3/4: Three-month rolling average stages, flow rates and estimated nominal hydraulic residence time (HRT) for Western Flow-way. Water Year Period Average
Stage Flow rate (m3/s) Effective Vol.b HRT
(m NGVD) Inflow Outflow Average (Hm3 = m3 x 106) (days)
2006 May,05 - Jul, 05 0.52 5.02 6.38 5.70 9.82 20 2006 Aug,05 - Oct,05 0.50 6.46 4.32 5.39 9.47 20 2006 Nov, 05 - Jan, 06 0.32 0.40 5.04 2.72 6.17 26 2006 Feb, 06 - Apr, 06 0.12 0.03 -0.02 0.00 2.19 - 2007 May,06 - Jul, 06 0.15 1.28 0.88 1.08 2.91 31 2007 Aug,06 - Oct,06 0.51 10.75 11.56 11.16 9.68 10 2007 Nov, 06 - Jan, 07 0.31 0.63 0.67 0.65 5.93 105a 2007 Feb, 07 - Apr, 07 0.18 0.32 0.00 0.16 3.48 255a
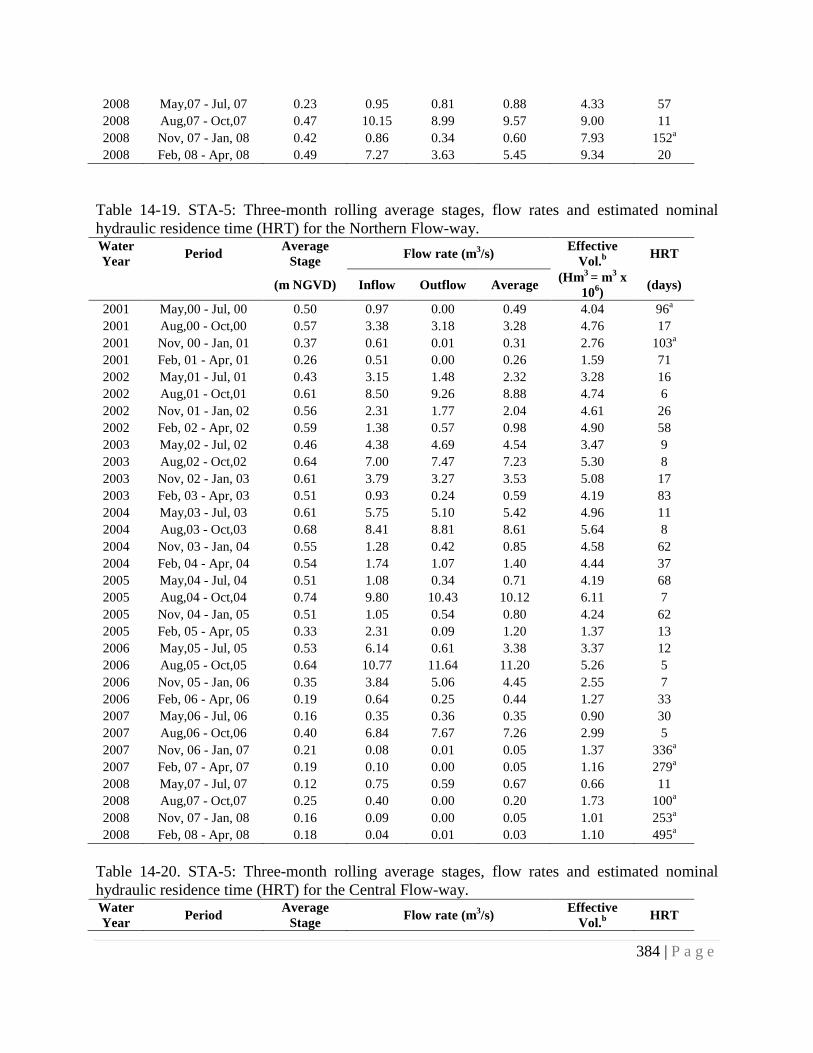
384 | P a g e
2008 May,07 - Jul, 07 0.23 0.95 0.81 0.88 4.33 57 2008 Aug,07 - Oct,07 0.47 10.15 8.99 9.57 9.00 11 2008 Nov, 07 - Jan, 08 0.42 0.86 0.34 0.60 7.93 152a 2008 Feb, 08 - Apr, 08 0.49 7.27 3.63 5.45 9.34 20
Table 14-19. STA-5: Three-month rolling average stages, flow rates and estimated nominal hydraulic residence time (HRT) for the Northern Flow-way. Water Year Period Average
Stage Flow rate (m3/s) Effective Vol.b HRT
(m NGVD) Inflow Outflow Average (Hm3 = m3 x 106) (days)
2001 May,00 - Jul, 00 0.50 0.97 0.00 0.49 4.04 96a 2001 Aug,00 - Oct,00 0.57 3.38 3.18 3.28 4.76 17 2001 Nov, 00 - Jan, 01 0.37 0.61 0.01 0.31 2.76 103a 2001 Feb, 01 - Apr, 01 0.26 0.51 0.00 0.26 1.59 71 2002 May,01 - Jul, 01 0.43 3.15 1.48 2.32 3.28 16 2002 Aug,01 - Oct,01 0.61 8.50 9.26 8.88 4.74 6 2002 Nov, 01 - Jan, 02 0.56 2.31 1.77 2.04 4.61 26 2002 Feb, 02 - Apr, 02 0.59 1.38 0.57 0.98 4.90 58 2003 May,02 - Jul, 02 0.46 4.38 4.69 4.54 3.47 9 2003 Aug,02 - Oct,02 0.64 7.00 7.47 7.23 5.30 8 2003 Nov, 02 - Jan, 03 0.61 3.79 3.27 3.53 5.08 17 2003 Feb, 03 - Apr, 03 0.51 0.93 0.24 0.59 4.19 83 2004 May,03 - Jul, 03 0.61 5.75 5.10 5.42 4.96 11 2004 Aug,03 - Oct,03 0.68 8.41 8.81 8.61 5.64 8 2004 Nov, 03 - Jan, 04 0.55 1.28 0.42 0.85 4.58 62 2004 Feb, 04 - Apr, 04 0.54 1.74 1.07 1.40 4.44 37 2005 May,04 - Jul, 04 0.51 1.08 0.34 0.71 4.19 68 2005 Aug,04 - Oct,04 0.74 9.80 10.43 10.12 6.11 7 2005 Nov, 04 - Jan, 05 0.51 1.05 0.54 0.80 4.24 62 2005 Feb, 05 - Apr, 05 0.33 2.31 0.09 1.20 1.37 13 2006 May,05 - Jul, 05 0.53 6.14 0.61 3.38 3.37 12 2006 Aug,05 - Oct,05 0.64 10.77 11.64 11.20 5.26 5 2006 Nov, 05 - Jan, 06 0.35 3.84 5.06 4.45 2.55 7 2006 Feb, 06 - Apr, 06 0.19 0.64 0.25 0.44 1.27 33 2007 May,06 - Jul, 06 0.16 0.35 0.36 0.35 0.90 30 2007 Aug,06 - Oct,06 0.40 6.84 7.67 7.26 2.99 5 2007 Nov, 06 - Jan, 07 0.21 0.08 0.01 0.05 1.37 336a 2007 Feb, 07 - Apr, 07 0.19 0.10 0.00 0.05 1.16 279a 2008 May,07 - Jul, 07 0.12 0.75 0.59 0.67 0.66 11 2008 Aug,07 - Oct,07 0.25 0.40 0.00 0.20 1.73 100a 2008 Nov, 07 - Jan, 08 0.16 0.09 0.00 0.05 1.01 253a 2008 Feb, 08 - Apr, 08 0.18 0.04 0.01 0.03 1.10 495a
Table 14-20. STA-5: Three-month rolling average stages, flow rates and estimated nominal hydraulic residence time (HRT) for the Central Flow-way. Water Year Period Average
Stage Flow rate (m3/s) Effective Vol.b HRT

385 | P a g e
(m NGVD) Inflow Outflow Average (Hm3 = m3 x 106) (days)
2001 May,00 - Jul, 00 0.37 1.73 0.57 1.15 2.94 30 2001 Aug,00 - Oct,00 0.49 4.30 2.42 3.36 3.98 14 2001 Nov, 00 - Jan, 01 0.25 0.56 0.02 0.29 1.72 69 2001 Feb, 01 - Apr, 01 0.10 0.64 0.00 0.32 0.44 16 2002 May,01 - Jul, 01 0.25 3.18 0.52 1.85 1.90 12 2002 Aug,01 - Oct,01 0.52 7.49 5.06 6.27 4.13 8 2002 Nov, 01 - Jan, 02 0.46 2.50 1.04 1.77 3.61 24 2002 Feb, 02 - Apr, 02 0.38 1.32 0.00 0.66 2.83 49 2003 May,02 - Jul, 02 0.37 3.92 2.91 3.41 2.78 9 2003 Aug,02 - Oct,02 0.58 6.70 4.61 5.65 4.70 10 2003 Nov, 02 - Jan, 03 0.55 3.49 1.73 2.61 4.45 20 2003 Feb, 03 - Apr, 03 0.42 0.98 0.00 0.49 3.11 73 2004 May,03 - Jul, 03 0.48 4.18 1.67 2.93 3.86 15 2004 Aug,03 - Oct,03 0.59 5.71 4.15 4.93 4.79 11 2004 Nov, 03 - Jan, 04 0.42 0.79 0.02 0.40 3.29 94 2004 Feb, 04 - Apr, 04 0.39 0.60 0.06 0.33 3.05 108a 2005 May,04 - Jul, 04 0.43 1.16 0.10 0.63 3.37 62 2005 Aug,04 - Oct,04 0.62 4.90 4.92 4.91 5.01 12 2005 Nov, 04 - Jan, 05 0.46 1.11 0.04 0.57 3.60 73 2005 Feb, 05 - Apr, 05 0.41 1.45 2.48 1.97 3.04 18 2006 May,05 - Jul, 05 0.59 5.79 10.38 8.09 4.73 7 2006 Aug,05 - Oct,05 0.50 5.39 3.02 4.21 3.87 11 2006 Nov, 05 - Jan, 06 0.31 4.32 0.36 2.34 2.06 10 2006 Feb, 06 - Apr, 06 0.00 0.00 0.00 0.00 0.00 - 2007 May,06 - Jul, 06 0.06 0.89 0.03 0.46 0.29 7 2007 Aug,06 - Oct,06 0.27 1.53 0.46 0.99 1.98 23 2007 Nov, 06 - Jan, 07 0.22 0.00 0.00 0.00 1.55 - 2007 Feb, 07 - Apr, 07 0.20 0.00 0.00 0.00 1.02 - 2008 May,07 - Jul, 07 0.08 0.76 0.11 0.43 0.59 16 2008 Aug,07 - Oct,07 0.33 0.48 0.29 0.39 2.60 77 2008 Nov, 07 - Jan, 08 0.28 0.00 0.00 0.00 2.00 - 2008 Feb, 08 - Apr, 08 0.16 0.26 0.11 0.18 1.17 75
Table 14-21. STA-6: Three-month rolling average stages, flow rates and estimated nominal hydraulic residence time (HRT) for Cell 3. Water Year Period Average
Stage Flow rate (m3/s) Effective Vol.b HRT
(m NGVD) Inflow Outflow Average (Hm3 = m3 x 106) (days)
2003 May,02 - Jul, 02 0.25 1.09 0.87 0.98 0.13 2 2003 Aug,02 - Oct,02 0.41 1.16 0.67 0.91 0.41 5 2003 Nov, 02 - Jan, 03 0.39 0.92 0.49 0.70 0.38 6 2003 Feb, 03 - Apr, 03 0.35 0.75 0.36 0.56 0.34 7 2004 May,03 - Jul, 03 0.38 0.80 0.62 0.71 0.37 6 2004 Aug,03 - Oct,03 0.53 1.39 1.82 1.60 0.52 4 2004 Nov, 03 - Jan, 04 0.32 0.40 0.17 0.28 0.31 13 2004 Feb, 04 - Apr, 04 0.26 0.48 0.23 0.35 0.21 7

386 | P a g e
2005 May,04 - Jul, 04 0.15 0.33 0.11 0.22 0.09 5 2005 Aug,04 - Oct,04 0.46 1.58 1.14 1.36 0.46 4 2005 Nov, 04 - Jan, 05 0.32 0.35 0.08 0.22 0.32 17 2005 Feb, 05 - Apr, 05 0.34 0.63 0.32 0.48 0.32 8 2006 May,05 - Jul, 05 0.21 0.04 0.10 0.07 0.14 22 2006 Aug,05 - Oct,05 0.46 1.39 1.50 1.44 0.45 4 2006 Nov, 05 - Jan, 06 0.27 0.74 0.35 0.55 0.25 5 2006 Feb, 06 - Apr, 06 0.23 0.45 0.06 0.26 0.21 9 2007 May,06 - Jul, 06 0.09 0.39 0.18 0.29 0.03 1 2007 Aug,06 - Oct,06 0.44 1.50 0.91 1.21 0.44 4 2007 Nov, 06 - Jan, 07 0.25 0.41 0.20 0.30 0.19 7 2007 Feb, 07 - Apr, 07 0.00 0.00 0.00 0.00 0.00 - 2008 May,07 - Jul, 07 0.00 0.01 0.00 0.00 0.00 - 2008 Aug,07 - Oct,07 0.31 0.41 0.15 0.28 0.30 12 2008 Nov, 07 - Jan, 08 0.08 0.00 0.00 0.00 0.03 - 2008 Feb, 08 - Apr, 08 0.05 0.00 0.00 0.00 0.03 -
Table 14-22. STA-6: Three-month rolling average stages, flow rates and estimated nominal hydraulic residence time (HRT) for Cell 5. Water Year Period Average
Stage Flow rate (m3/s) Effective Vol.b HRT
(m NGVD) Inflow Outflow Average (Hm3 = m3 x 106) (days)
2003 May,02 - Jul, 02 0.29 1.22 1.36 1.29 0.61 5 2003 Aug,02 - Oct,02 0.51 1.28 0.82 1.05 1.29 14 2003 Nov, 02 - Jan, 03 0.49 1.09 0.58 0.84 1.23 17 2003 Feb, 03 - Apr, 03 0.43 0.79 0.36 0.57 1.09 22 2004 May,03 - Jul, 03 0.44 0.91 0.71 0.81 1.09 16 2004 Aug,03 - Oct,03 0.58 1.32 2.09 1.70 1.46 10 2004 Nov, 03 - Jan, 04 0.41 0.37 0.16 0.27 1.03 45 2004 Feb, 04 - Apr, 04 0.34 0.44 0.26 0.35 0.84 28 2005 May,04 - Jul, 04 0.20 0.27 0.11 0.19 0.44 26 2005 Aug,04 - Oct,04 0.55 1.44 1.40 1.42 1.38 11 2005 Nov, 04 - Jan, 05 0.40 0.31 0.02 0.16 1.02 72 2005 Feb, 05 - Apr, 05 0.41 0.48 0.27 0.38 1.03 31 2006 May,05 - Jul, 05 0.27 -0.06 -0.11 -0.09 0.60 - 2006 Aug,05 - Oct,05 0.58 0.97 1.54 1.25 1.45 13 2006 Nov, 05 - Jan, 06 0.45 0.52 0.38 0.45 1.14 29 2006 Feb, 06 - Apr, 06 0.24 0.41 0.05 0.23 0.56 28 2007 May,06 - Jul, 06 0.11 0.42 0.23 0.32 0.20 7 2007 Aug,06 - Oct,06 0.52 1.41 1.01 1.21 1.32 13 2007 Nov, 06 - Jan, 07 0.27 0.32 0.08 0.20 0.60 35 2007 Feb, 07 - Apr, 07 0.00 0.00 0.00 0.00 0.00 - 2008 May,07 - Jul, 07 0.02 0.01 0.00 0.01 0.04 71 2008 Aug,07 - Oct,07 0.40 0.55 0.23 0.39 1.00 30 2008 Nov, 07 - Jan, 08 0.07 0.00 0.00 0.00 0.14 - 2008 Feb, 08 - Apr, 08 0.09 0.04 0.00 0.02 0.19 101a
aThese nominal HRTs are longer than the number of days in the three months because of the low average flow operations.

387 | P a g e
bEffective volume of the wetland was calculated taking account of the average fraction of the flooded portions of the wetland.
Figure 14-1. STA-5: Period of record (WY2000 – WY2008) rainfall recorded at station STA-5WX.
Figure 14-2. STA-5: Period of record (WY2000 – WY2008) evapotranspiration (ET) data used in this study. These are the predicted ET values obtained from DBHydro that is based on the prediction equation (Abtew 1996).
02468
1012141618
Rain
fall
(cm
)
0
0.1
0.2
0.3
0.4
0.5
0.6
0.7
Com
pute
d ET
(cm
)