Embed Size (px)
DESCRIPTION
UW LISA Torsion Balance Experiment Scott E Pollack with Stephan Schlamminger, Charlie Hagedorn, & Jens Gundlach Center for Experimental Nuclear Physics and Astrophysics University of Washington Workshop on Charging Issues in Experimental Gravity July 27, 2007 LIGO #G070478-00-R. V. - PowerPoint PPT Presentation
Citation preview
UW LISA Torsion Balance Experiment
Scott E Pollack
withStephan Schlamminger, Charlie Hagedorn,
&Jens Gundlach
Center for Experimental Nuclear Physics and AstrophysicsUniversity of Washington
Workshop on Charging Issues in Experimental Gravity
July 27, 2007LIGO #G070478-00-R

July 27, 2007Pollack 2
UW Apparatus 0.5m 13 m W fiber
Au-coated Si-pendulum
– 0.6 mm thick
– Low mass
Split Au-coated Cu-plate
– Split-plate allows investigation of potential differences laterally across pendulum
– Heater elements (light bulbs) imbedded in plates allow thermal control
– Movable up to 10 mm from pendulum
Control Electrodes
– Used to feedback pendulum to fixed position, i.e., cold damping
– Residual pendulum motion at level of ~ 2 nrad/√Hz ≈ 1.5 aNm/√Hz
≈ 0.02 fm/s2/√Hz
Electrode
Tungsten fiber
Split Copper Plate
GravitationalCompensator
PIDV
50.8
mm
63.5
mm
Silicon Pendulum
(now quartz fiber)

July 27, 2007Pollack 3
Top down view with pendulum removed
Control Electrodes
New Tiny Electrodes have 1/10th N / V2
response
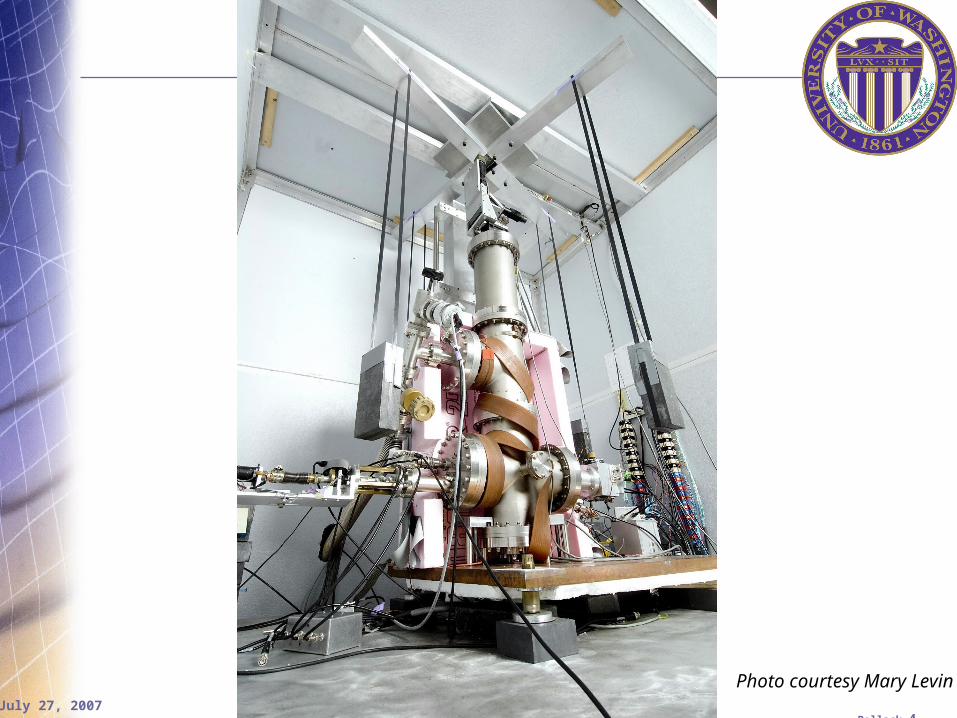
July 27, 2007Pollack 4
Photo courtesy Mary Levin

July 27, 2007Pollack 5
Torque Noise Performance
Calibration Tones
July 27, 2007Pollack 6
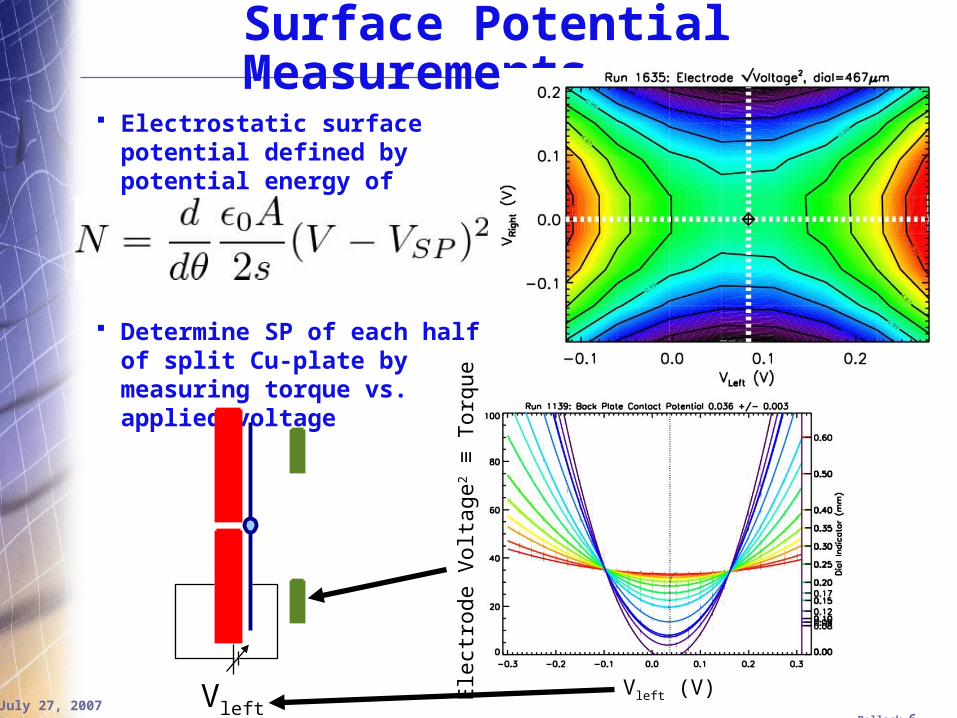
Surface Potential Measurements
Electrostatic surface potential defined by potential energy of plate-pendulum capacitor:
Determine SP of each half of split Cu-plate by measuring torque vs. applied voltage
VleftVleft (V)
Ele
ctro
de V
olt
age
2 ≡
Torq
ue
July 27, 2007Pollack 7
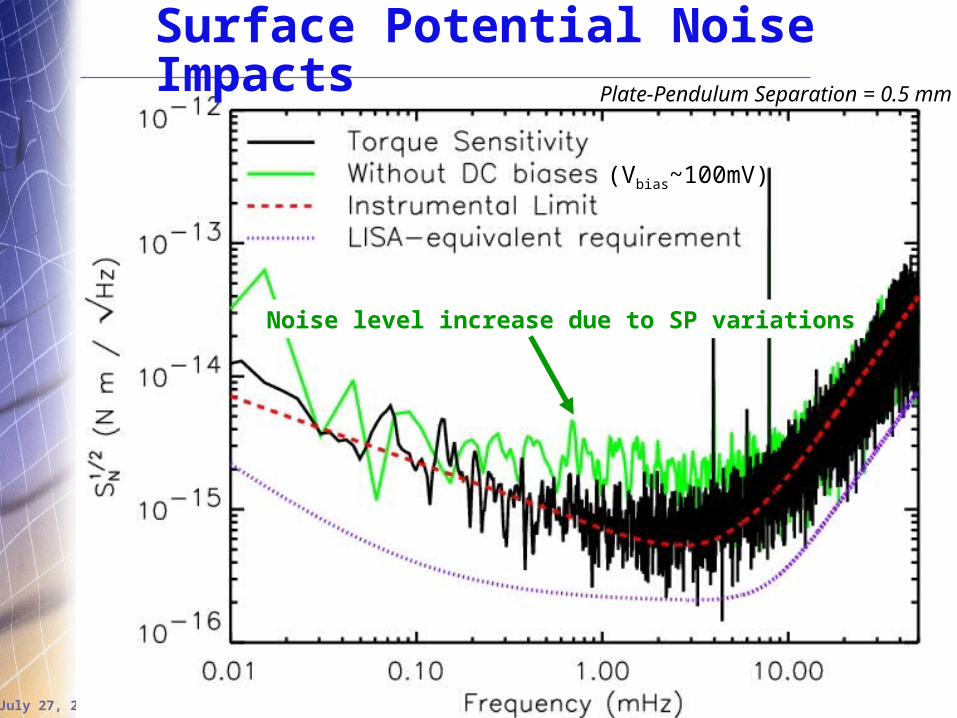
Surface Potential Noise Impacts
(Vbias~100mV)
Noise level increase due to SP variations
Plate-Pendulum Separation = 0.5 mm

July 27, 2007Pollack 8
Surface Potential Noise Impacts
July 27, 2007Pollack 9
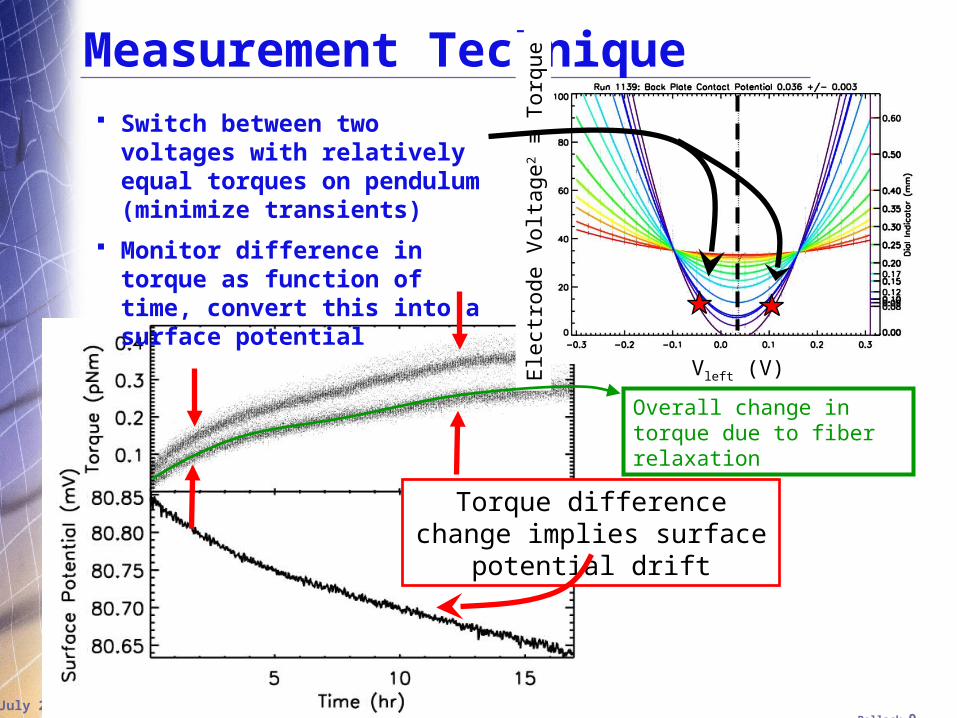
Measurement Technique Switch between two voltages
with relatively equal torques on pendulum (minimize transients)
Monitor difference in torque as function of time, convert this into a surface potential
Vleft (V)
Ele
ctro
de V
olt
age
2 ≡
Torq
ue
Torque difference change implies surface potential
drift
Overall change in torque due to fiber relaxation
July 27, 2007Pollack 10
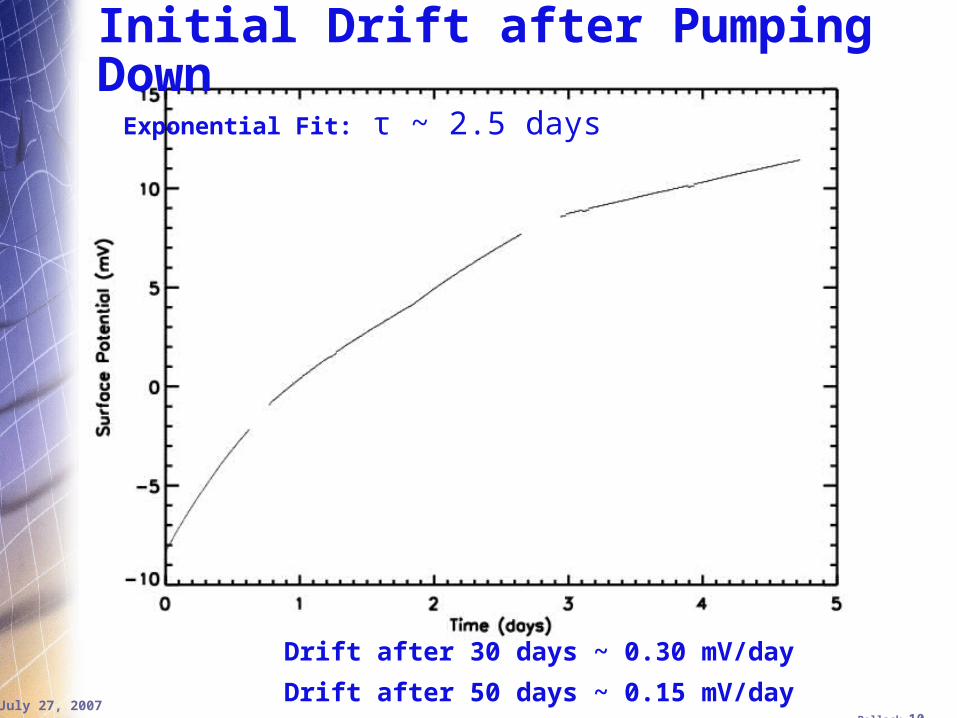
Initial Drift after Pumping Down
Drift after 30 days ~ 0.30 mV/day
Drift after 50 days ~ 0.15 mV/day
Exponential Fit: τ ~ 2.5 days
July 27, 2007Pollack 11
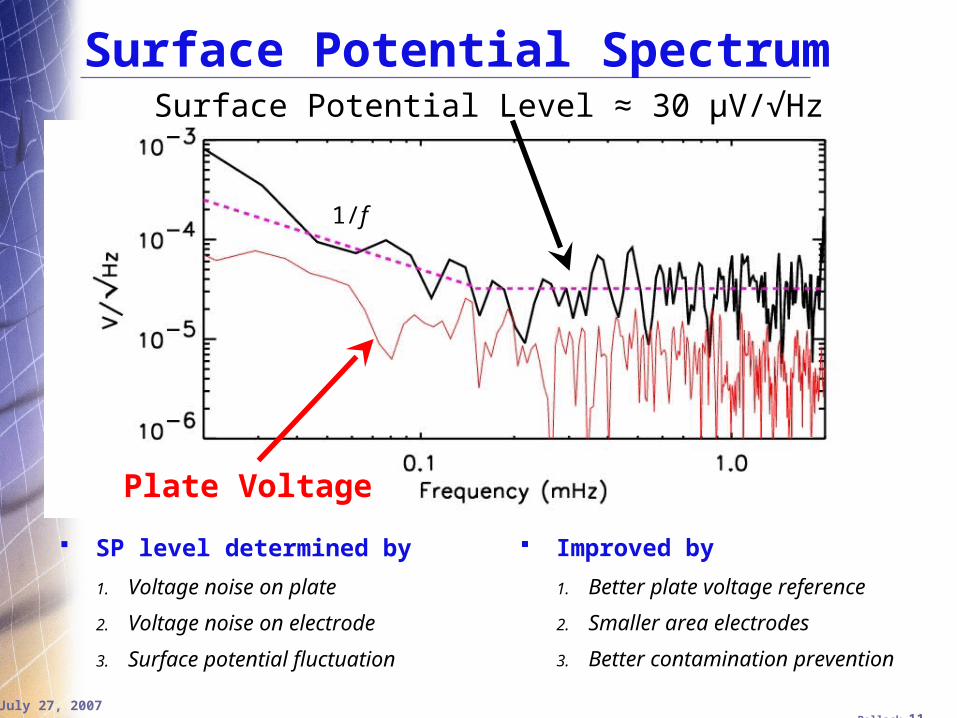
Surface Potential Spectrum
Plate Voltage
Surface Potential Level ≈ 30 μV/√Hz
1/f
Improved by
1. Better plate voltage reference
2. Smaller area electrodes
3. Better contamination prevention
SP level determined by
1. Voltage noise on plate
2. Voltage noise on electrode
3. Surface potential fluctuation

July 27, 2007Pollack 12
Surface Potential SpectrumThermal Torque Noise Contribution
Improved by
1. Better plate voltage reference
2. Smaller area electrodes
3. Better contamination prevention
SP level determined by
1. Voltage noise on plate
2. Voltage noise on electrode
3. Surface potential fluctuation
≈ 6 μV/√Hz

July 27, 2007Pollack 13
Improved by
– Better plate voltage reference
– Smaller area electrodes
– Better contamination prevention
SP level determined by
1. Voltage noise on plate
2. Voltage noise on electrode
3. Surface potential fluctuation
Surface Potential SpectrumSurface Potential Level ≈ 30 μV/√Hz
Expected drop of factor 3

July 27, 2007Pollack 14
Top down view with pendulum removed
Control Electrodes
UV LED placed under can, shinning through window
July 27, 2007Pollack 15
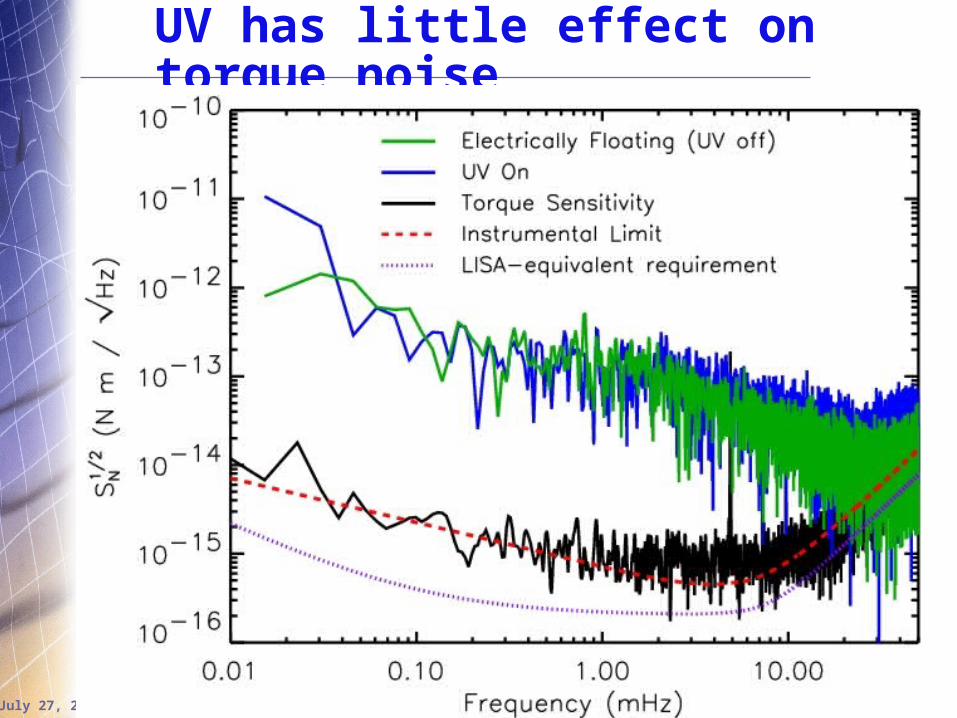
UV has little effect on torque noise

July 27, 2007Pollack 16
SP fluctuations of floating pendulum
July 27, 2007Pollack 17
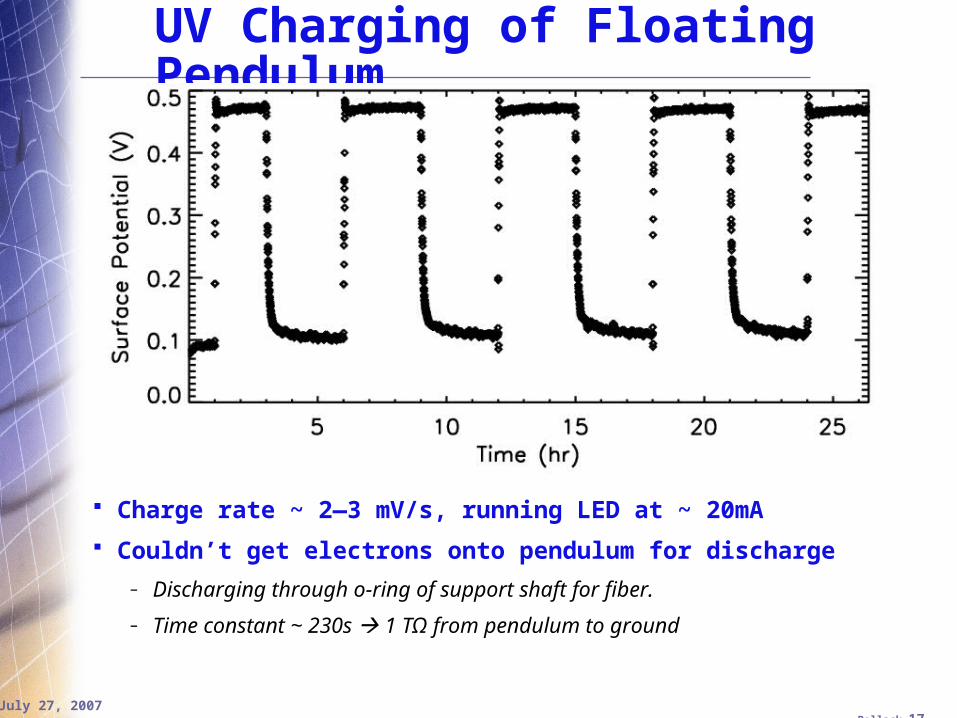
UV Charging of Floating Pendulum
Charge rate ~ 2—3 mV/s, running LED at ~ 20mA
Couldn’t get electrons onto pendulum for discharge
– Discharging through o-ring of support shaft for fiber.
– Time constant ~ 230s 1 TΩ from pendulum to ground
July 27, 2007Pollack 18
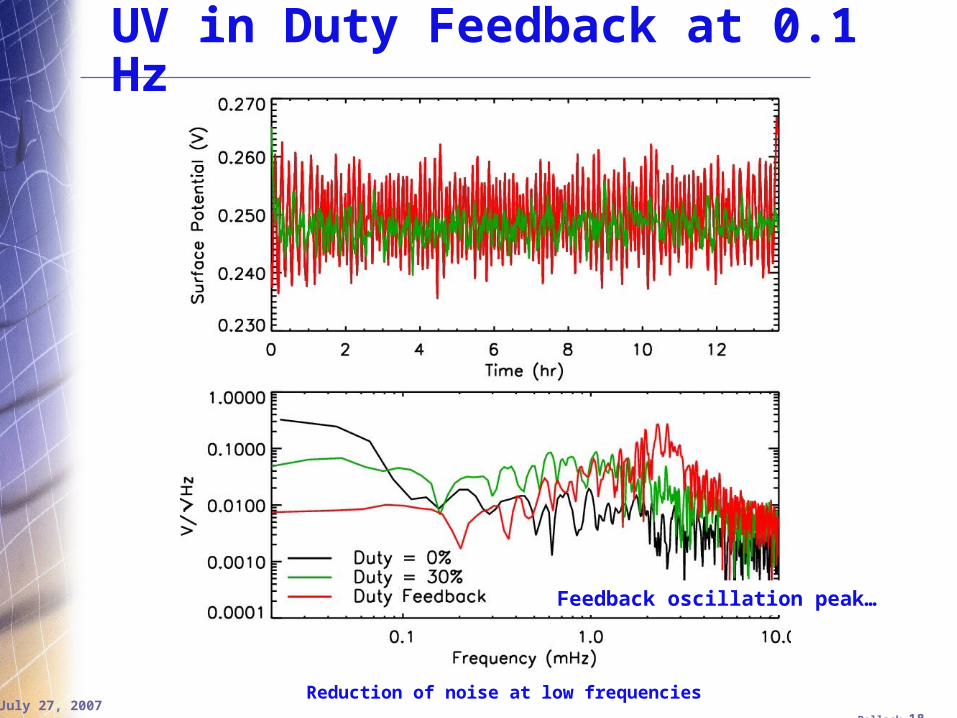
UV in Duty Feedback at 0.1 Hz
Reduction of noise at low frequencies
Feedback oscillation peak…
July 27, 2007Pollack 19
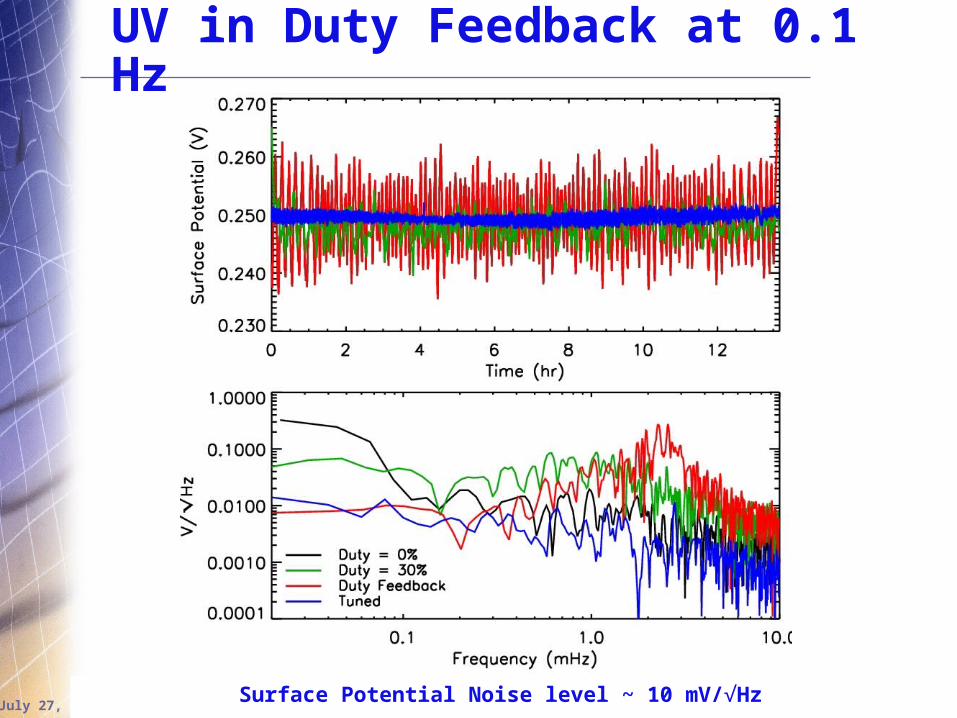
UV in Duty Feedback at 0.1 Hz
Surface Potential Noise level ~ 10 mV/√Hz

July 27, 2007Pollack 20
UV LED in vacuum (with quartz fiber)
Approximate location of Si pendulum
Pictures taken July 13
Pumping began the following day

July 27, 2007Pollack 21
Quartz Fiber Surface Potential Noise
Surface Potential Noise level ~ 10 mV/√Hz ≡ ~ 2 x 10⁶ photoelectrons/√Hz
Ambient discharging
If discharging through fiber R ~ 340 TΩ
July 27, 2007Pollack 22
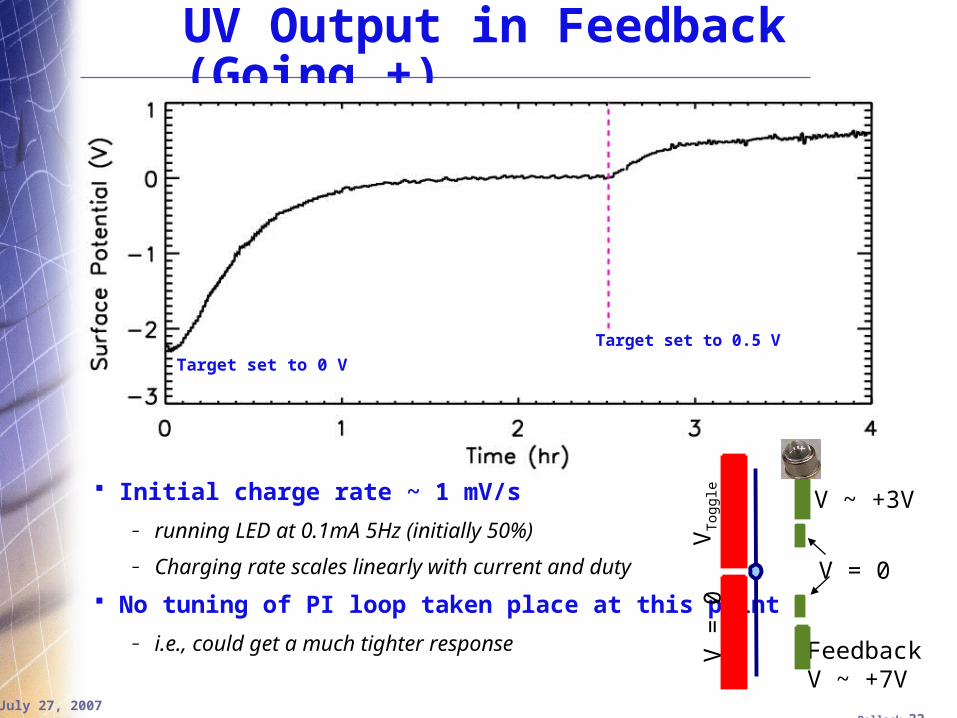
UV Output in Feedback (Going +)
Initial charge rate ~ 1 mV/s
– running LED at 0.1mA 5Hz (initially 50%)
– Charging rate scales linearly with current and duty
No tuning of PI loop taken place at this point
– i.e., could get a much tighter response
Target set to 0.5 VTarget set to 0 V
FeedbackV ~ +7V
V =
0V
Tog
gle
V = 0
V ~ +3V
July 27, 2007Pollack 23
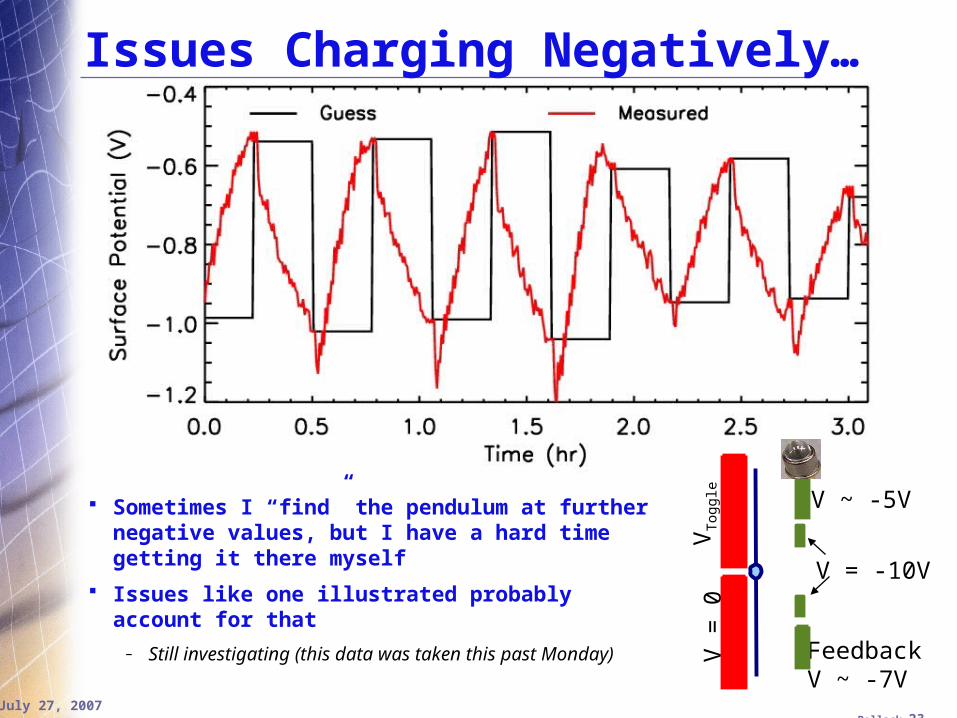
Issues Charging Negatively…
Sometimes I “find” the pendulum at further negative values, but I have a hard time getting it there myself
Issues like one illustrated probably account for that
– Still investigating (this data was taken this past Monday)
FeedbackV ~ -7V
V =
0V
Tog
gle
V = -10V
V ~ -5V

July 27, 2007Pollack 24
Summary of Charge work at UW
Surface Potential Measurements with Grounded Pendulum
– Both large and small electrodes show level ~30 μV/√Hz @ 1mHz– Reference voltage is at ~10 μV/√Hz
– It’s possible that contamination is to blame
– i.e., large drifts after pumping system
UV LED used for charge measurements outside vacuum can– No appreciable change in torque noise level with UV light on ~20mA
– Spectral amplitude in feedback: ~2x10⁶ electrons/Hz1/2 @ 1mHz– Charge pendulum positively, but not negatively…
In situ UV LED– With close proximity, run LED at low power ~ 1 mA
– Can charge negatively now as well.
– Will be getting feedback noise level soon!
Quartz Fiber “removes” discharge through o-ring (R>300 TΩ)– No change from tungsten in spectral amplitude: ~10 mV/√Hz @ 1mHz