Embed Size (px)
Citation preview
UV/Vis and CD Spectral Studies of the
Interaction between Pinacyanol Chloride and
Alginates, γ-Cyclodextrin, and Aerosol-OT
Der Fakultät für Naturwissenschaften
der Universität Duisburg-Essen
(Standort Duisburg)
zur Erlangung des akademischen Grades eines
Doktors der Naturwissenschaften
genehmigte Dissertation von
Sa’ib Al-khouri
aus
Irbid, Jordanien
Tag der mündlichen Prüfung: 10.04.2003

Die vorliegende Arbeit entstand in der Zeit vom 1. September 1999 bis 20.
Januar 2003 in der Fakultät für Naturwissenschaften an der Gerhard-Mercator-
Universität – Gesamthochschule Duisburg (Deutschland) unter Betreuung von
Herrn Prof. Volker Buß.
Referent: Prof. Dr. V. Buß
Korreferent: Prof. em. Dr. D. Döpp
II
ACKNOWLEDGEMENT
It is my great pleasure to thank my supervisor Prof. Dr. V. Buss for giving me the chance
to work in this topic, the full supervision, the fruitful guidance, and for the continual support
through this work.
I wish to express my gratitude to Prof. em. Dr. D. Döpp for writing the 2nd referee’s report.
I would also like to express my sincere gratitude to all my colleagues in the department of
theoretical chemistry, who have contributed their time, helpful discussion and friendly
atmosphere to the successful completion of the work and preparation of my thesis: Julia
Hufen, Robert Knierim, Dr. Klaus Kolster, Dr. Guido Nuding, Daniel Richter, Nicole Richter,
Marko Schreiber, Oliver Weingart, and Dr. Edgar Zimmermann.
I thank Natascha Schürks in the research group of Prof. Dr. C. Mayer for her kind help and
the purified alginate samples. I thank also Wassef Sekhaneh in the research group of Prof. Dr.
W. Veeman for his encouragement and kind help when it was needed.
My thanks also go to all members of the group of researchers (physical chemistry of bio-
film) for the useful discussions, which took place in the context of the meetings of group of
researchers supervised by Prof. Dr. H.-C. Flemming.
I thank the catholic academic foreign-service (KAAD) and German research council
(DFG) in Bonn for their support of this work.
To father, sisters, and brothers my sincere gratitude and appreciation for their support and
encouragement over the years of my study.
My special thanks and appreciation to my wife and my children for their encouragement
and patience to complete this work during our stay in Germany.
III
To the loving memory of my mother
IV
Contents 1 Preface 1
2 Introduction
2.1 Cyanine dyes……………………………………………………………………………4
2.1.1 Structure and classification………………………………………………………4
2.1.2 Molecular aggregation of cyanine dyes……………………………………….…6
2.1.3 Pinacyanol chloride……………………………………………………………..10
2.2 Polysaccharides………………………………………………………………………..12
2.2.1 Classifications…………………………………………………………………..12
2.2.2 Structure……………………………………………………………………...…13
2.2.3 Alginates………………………………………………………………………...15
2.2.3.1 History, nomenclature, properties and applications ……………….…16
2.2.3.2 Molecular structure and conformations……………………………….18
2.2.3.3 Calcium alginate and the “egg-box model” …………………………..19
2.2.3.4 Alginates and circular dichroism……………………………………...22
2.2.3.5 Induced Circular Dichroism in Alginate-Dye Systems……………….23
2.2.4 Cyclodextrins…………………………………………………………………...25
2.2.4.1 Discovery and Nomenclature…………………………………………25
2.2.4.2 Structural Features……………………………………………………26
2.2.4.3 Solubility in Polar solvents…………………………………………...27
2.2.4.4 Cyclodextrin inclusion complexes……………………………………27
2.2.4.4.1 Stoichiometric ratios and driving force……………………..28
2.2.4.4.2 Methods of detecting the inclusion process…………………28
2.2.4.5 Practical use of cyclodextrins…………………………………………29
2.2.4.6 Cyclodextrin derivatives………………………………………………30
2.2.4.7 Cyclodextrins and induced circular dichroism………………………..30
2.2.4.8 Cyanine dye complexes……………………………………………….31
2.3 Surfactants……………………………………………………………………………..32
2.3.1 Properties and classification…………………………………………………….32
2.3.2 Aggregation of surfactants……………………………………………………...34
2.3.2.1 Formation of micelles…………………………………………………35
2.3.2.2 The critical micellar concentration (cmc)……...……………...………37
2.3.3 Surfactant – dye interactions……………………………………………………39
V
3 Theoretical background
3.1 UV/Vis spectrophotometry...…………………………………………………………..41
3.2 Circular dichroism spectroscopy………………………………………………………44
3.2.1 Principle of the measurement……………………………………….…………..44
3.2.2 The rotational strength………..………………………………………………...47
3.2.3 Induced circular dichroism………………………………………………….…..48
3.2.4 Exciton coupling and exciton chirality…………………………………………49
3.2.5 Coupled oscillator model for the calculation of spectral properties of exciton-
split chromophores……………………………………………………………52
4 Results and discussion
4.1 Pinacyanol chloride solutions……………………………………………………...…..55
4.1.1 Pinacyanol chloride in aqueous solution with 7.5% v/v ethanol……………..…55
4.1.2 Pinacyanol chloride spectra in ethanol……………………………………….…57
4.1.3 Pinacyanol chloride spectra with different concentrations of ethanol ………....58
4.1.4 Derivative spectra…………….…………………………………………………59
4.1.5 Peak height measurements…………………………………………………...…62
4.1.6 Analysis of the spectra using PeakFit…………………………………………..62
4.1.7 Thermodynamic considerations…………………………………………...……67
4.1.8 Discussion………………………………………………………………………70
4.2 The inclusion of pinacyanol chloride by cyclodextrins……………………………….73
4.2.1 Interaction with γ-cyclodextrin - UV/Vis spectra……………………………...73
4.2.1.1 The fourth derivative of the visible spectra…………………………….74
4.2.2 Interaction with γ-cyclodextrin - Circular dichroism spectra………….……….75
4.2.3 The dipole strength of pinacyanol chloride……………………………………..77
4.2.4 Modelling the pinacyanol aggregation with OSCI ……………………………..78
4.2.5 Calculating the twist angle of pinacyanol chloride in γ-cyclodextrin…………..80
4.2.6 Discussion………………………………………………………………………81
4.3 Interaction of pinacyanol chloride with alginates………………………….………….83
4.3.1 Manucol-LHF; characterization by CD …………………………………….…..83
4.3.2 Aggregation of pinacyanol chloride with Manucol-LHF…………………….…83
4.3.2.1 UV/Vis and CD spectra……………………………………………….83
4.3.2.2 Job’s Method for determination of stoichiometry…………………….85
4.3.2.3 Conductometric titration………………………………………………87
VI

4.3.2.4 Effect of ethanol on the spectra……………………………………….88
4.3.2.5 Temperature effect on the spectra…………………………………….90
4.3.2.6 Effect of pH on the spectra……………………………………………91
4.3.2.7 Effect of divalent cations on the spectra………………………………92
4.3.3 Mannuronate rich alginate; characterization by CD………………..…………..94
4.3.4 Aggregation of pinacyanol chloride with mannuronate rich alginate..…………94
4.3.5 Guluronate rich alginate; characterization by CD………………………………95
4.3.6 Aggregation of pinacyanol chloride with guluronate rich alginate.…………….96
4.3.7 SG81- alginate; characterization by CD…………………………..………….…96
4.3.8 Aggregation of pinacyanol chloride with SG81- Alginate……………………...97
4.3.9 Discussion………………………………………………………………………98
4.4 Complex formation of Pinacyanol chloride with Aerosol-OT……………………...101
4.4.1 UV/Vis and CD spectra in aqueous solutions…………………………………101
4.4.2 Effect of ethanol on the surfactant spectra………………...…………………..103
4.4.3 Temperature effect…………………………………...………………………..104
4.4.4 Discussion……………………………………………………………………..105
5 Summary / Zusammenfassung
5.1 Summary……………………………………………………………………...……...107
5.2 Zusammenfassung. ………………………………………………………………….109
6 Experimental
6.1 Materials and solvents used……………………………………………………….….111
6.2 Instruments used……………………………………………………………………...111
6.3 Glassware, tool and methods………………………………………………………....112
7 References……………….……...……………………………………………..………113
VII

1 Preface
CD spectroscopy is a modified form of absorbance spectrophotometry, in which the
difference in absorbance between left and right circular polarized beams of light that pass
through a sample is measured as a function of wavelength. For the method to be applicable,
the sample has to be optically active, i.e. it has to contain elements of chirality, and this
distinguishes CD from absorbance. However, even an optically active medium can be CD
“silent”, if there is no absorbance in the spectrally accessible wavelength range.
Almost all biological macromolecules are chiral, and many are CD active, which widens
the range of application in the study of natural products. Proteins, polynucleotides, and
carbohydrates are intrinsically CD active; however, the chromophores absorb in the UV and
some (carbohydrates in particular) absorb only in the far UV. In spite of the extreme
difficulties that are inherent in measuring CD in that spectral range, a number of studies have
been published in which CD data have been used to interpret the secondary and tertiary
structures of these macromolecules in aqueous solution. The chirality inherent in these large
molecules has been exploited in experiments where activity was induced into CD inactive
molecules by either substitution or by molecular complexation. For carbohydrates, for
example, CD spectra that originate from exciton coupling between absorbing aromatic
substituents have been used to interpret the anomeric forms of linkages and the local
stereochemistry between neighboring diols in monomeric repeat units. Molecular association
reactions are most familiar, and especially those involving small molecules (“guests”) which
fit into the chiral interior of cyclodextrin oligomers (“hosts”).
The interaction of biopolymers with dyes has been investigated by many researchers from
the viewpoints of physiology, biochemistry, and physical chemistry. These investigations
have been made mainly using spectroscopic techniques, since the interaction can be studied in
detail even when the dye concentration is very low. The electronic spectra of biopolymer-dye
systems often differ from those of free dyes in a number of ways. In the biopolymer-dye
systems, the dyes may lose absorption intensity (hypochromism), change the absorption
maxima (metachromasy), display new bands, and under certain conditions become optically
active. The last property is the most significant, and derives from the fact that biopolymers are
in general chiral. A symmetric chromophore having a plane or center of symmetry becomes
optically active when placed in the asymmetric field of another chiral molecule. This effect is
known as induced optical activity or induced circular dichroism (ICD). The advantage of
studying the binding of achiral dye molecules to a chiral substrate is that the extrinsic CD
1

activity is observed in the experimentally convenient and readily accessible visible spectral
range. The conformational rearrangement of the dye, as it adapts to the chiral field imposed
upon it by association with the biopolymer molecule, will generate an extrinsic CD spectrum
that will reveal information about the structure of the host/guest complex in solution. Putting
it in another way, structural information about the host can be obtained without needing to
solve the experimental problems that are associated with making CD measurements in the far-
UV.
Polysaccharides can have various types of conformation in solution. Conformational and
anomeric changes are often connected with physiological activities. So far, only the optical
rotatory dispersion (ORD) of polysaccharides could be measured in general, and CD studies
were possible in those cases where other chromophores were present in their molecules.
Alternatively, the ICD of dyes bound to the saccharides through ionic coupling or
hydrophobic interaction has been measured for analyzing conformational changes in solution
but with many problems remaining.
The literature concerning the CD of saccharides has been less documented than those of
proteins and nucleic acids, because of the difficulty of measuring CD in the vacuum UV. The
ICD of dyes bound to saccharides through ionic coupling or hydrophobic interaction may
remain a conflicting problem due to the non-covalent bonding between the dye and the
saccharide. Also, there may be a general lack of detailed information about the dye itself with
respect to self aggregation as a function of concentration, solvent and temperature. In the
present work, the interaction of pinacyanol chloride with algae and bacterial alginates (natural
anionic copolymers polysaccharide), with cyclodextrins and with surfactants is reported.
Special emphasis is placed on the process of self aggregation of pinacyanol chloride by
studying its behaviour in aqueous solution using special methods (like derivative
spectroscopy) and programs to analyze the results. The knowledge about the dye probe itself
(its transition dipole length and the type of aggregation) helps to explain the spectral results of
the ICD measurements after complexation with alginate, cyclodextrin or surfactant.
The main objective of this work is to show how induced circular dichroism (ICD)
measurements can lead to stereochemical information about complexes involving biological
macromolecules. The study of modified alginates complexes with dyes using visible
absorption and CD spectroscopy has stimulated our interest to examine the types of
conformational structures of alginates in solutions under different experimental conditions in
view of important recent applications.
2
The organization of this work is as follows. The introduction into the chemistry of the
main components making up the complexes will be followed by a theoretical section
providing the background of the spectroscopic methods used in this study. The central part is
the presentation and discussion of the experimental results and the theoretical models derived
for the different complexes. There will be an english and a german summary, an experimental
part and a list of references.
3
2. Introduction
2.1 Cyanine dyes
Cyanine dyes were added as a new class of dyes to the supply of commercial dyestuffs
with the synthesis of the first polymethine dye (“cyanine”) by C. Williams in 1856. 1 Cyanine
dyes are characterized by their intense and sharp absorption bands in the UV-visible region,
usually between 225 and 735 nm, with narrow half-band widths of typically ~ 25 nm. Cyanine
dyes did not become commercial dyes for coloration purposes immediately after their
discovery, since they are prone to decolorization by light and acid. One of the most important
applications of cyanine dyes is their use as spectral sensitizers for silver halide micro-crystals
in photographic films, since their absorption spectra are easily shifted by chemical
substitution and by aggregation. 2, 3 Cyanine dyes have been used extensively to probe
biological systems, such as the helical structure of DNA, through the measurement of induced
circular dichroism (ICD) spectra. 4 The chiral environment of anionic polysaccharides and
cyclodextrins has been investigated through measurement of induced CD spectra with
different types of cyanine dyes. 5, 6
2.1.1 Structure and classification
Cyanine dyes are cationic dyes typically consisting of two nitrogen containing
heterocyclic ring systems, which terminate a chain of conjugated double bonds. One of the
nitrogen atoms is positively charged and is linked by the chain consisting of an odd number of
carbon atoms to the other nitrogen. The absorption of visible light in a cyanine dye is mainly
determined by the sequence of methine groups (- CH =), which are normally in the E or trans
configuration. The carbon atoms of the methine chain can be substituted by hetero atoms
(“azacyanines”), and they can carry other groups than hydrogen; they can also be parts of
carbocyclic or heterocyclic ring systems. 1
Extensive conjugation of the methine chain leads to the long wavelength absorption
maxima and large molar absorptivities typical for cyanine dyes. Bond lengths, which can be
determined by x-ray analysis, indicate that the positive charge on the nitrogen atom is
significantly delocalised along the chain extending to the opposite heterocycle, which can
result in the case of symmetrically substituted cyanine dyes in a structure in which the two
end groups carry the same amount of (half a) positive charge. 7 Though the preferred
4
geometry of these dyes is planar, solid–state structures 8, 9 and analysis of solution spectra of
cyanine dyes 10 reveal that steric interactions can induce twist deformations along the
polymethine chain. Examination of variable temperature 1H NMR spectra, 11 absorption
spectra 12 and room temperature 13C NMR spectra indicate that this twist can persist in
solution.
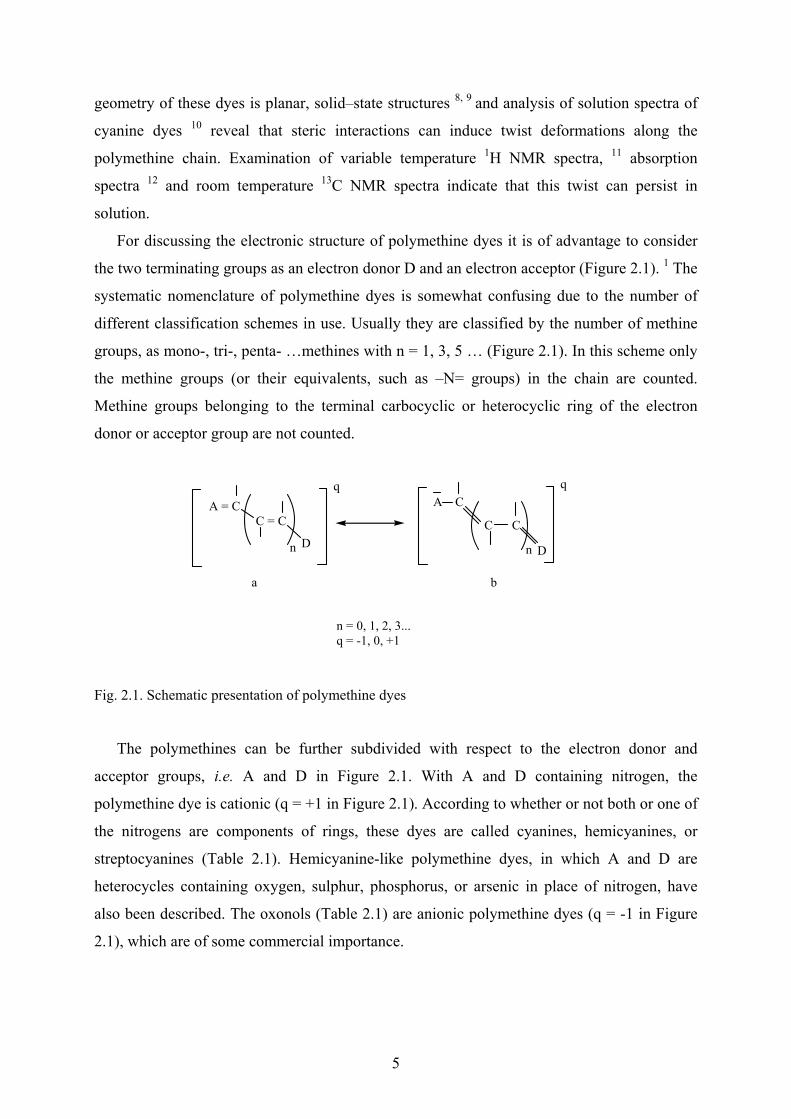
For discussing the electronic structure of polymethine dyes it is of advantage to consider
the two terminating groups as an electron donor D and an electron acceptor (Figure 2.1). 1 The
systematic nomenclature of polymethine dyes is somewhat confusing due to the number of
different classification schemes in use. Usually they are classified by the number of methine
groups, as mono-, tri-, penta- …methines with n = 1, 3, 5 … (Figure 2.1). In this scheme only
the methine groups (or their equivalents, such as –N= groups) in the chain are counted.
Methine groups belonging to the terminal carbocyclic or heterocyclic ring of the electron
donor or acceptor group are not counted.
A = CC = C
D
q
n
qA C
C C
Dn
n = 0, 1, 2, 3...q = -1, 0, +1
a b
Fig. 2.1. Schematic presentation of polymethine dyes
The polymethines can be further subdivided with respect to the electron donor and
acceptor groups, i.e. A and D in Figure 2.1. With A and D containing nitrogen, the
polymethine dye is cationic (q = +1 in Figure 2.1). According to whether or not both or one of
the nitrogens are components of rings, these dyes are called cyanines, hemicyanines, or
streptocyanines (Table 2.1). Hemicyanine-like polymethine dyes, in which A and D are
heterocycles containing oxygen, sulphur, phosphorus, or arsenic in place of nitrogen, have
also been described. The oxonols (Table 2.1) are anionic polymethine dyes (q = -1 in Figure
2.1), which are of some commercial importance.
5
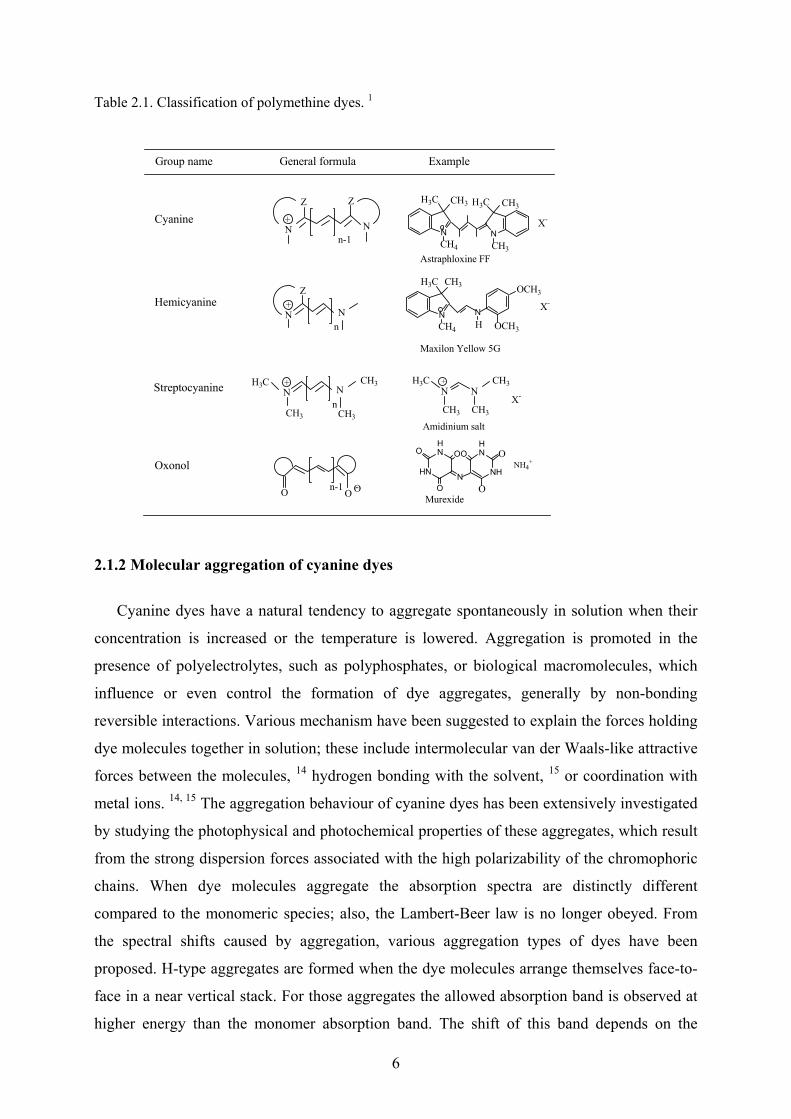
Table 2.1. Classification of polymethine dyes. 1
Z
N N
Z
+
n-1
N N
Z+
n
N N+
nCH3
H3C CH3
CH3
O On-1
Cyanine
Hemicyanine
Streptocyanine
Oxonol
N
CH3H3C
CH4
+
NCH3
CH3H3C
X-
N
CH3H3C
CH4
+ NOCH3
OCH3
H
X-
N N
CH3CH3
CH3H3C +
X-
HN
HN
N NH
HNOOO
O
O
O
NH4+
Group name General formula Example
Astraphloxine FF
Maxilon Yellow 5G
Amidinium salt
MurexideO-
2.1.2 Molecular aggregation of cyanine dyes
Cyanine dyes have a natural tendency to aggregate spontaneously in solution when their
concentration is increased or the temperature is lowered. Aggregation is promoted in the
presence of polyelectrolytes, such as polyphosphates, or biological macromolecules, which
influence or even control the formation of dye aggregates, generally by non-bonding
reversible interactions. Various mechanism have been suggested to explain the forces holding
dye molecules together in solution; these include intermolecular van der Waals-like attractive
forces between the molecules, 14 hydrogen bonding with the solvent, 15 or coordination with
metal ions. 14, 15 The aggregation behaviour of cyanine dyes has been extensively investigated
by studying the photophysical and photochemical properties of these aggregates, which result
from the strong dispersion forces associated with the high polarizability of the chromophoric
chains. When dye molecules aggregate the absorption spectra are distinctly different
compared to the monomeric species; also, the Lambert-Beer law is no longer obeyed. From
the spectral shifts caused by aggregation, various aggregation types of dyes have been
proposed. H-type aggregates are formed when the dye molecules arrange themselves face-to-
face in a near vertical stack. For those aggregates the allowed absorption band is observed at
higher energy than the monomer absorption band. The shift of this band depends on the
6
number of monomers in the aggregate, increasing and approaching a limiting value for the
infinite aggregate (“H-band”). 16 J-aggregates are formed when the dye molecules arrange into
a slanted stack, and the observed absorption maximum shifts to longer wavelength (lower
energy), with broad bands in general, but narrow, intense excitonic absorption bands are also
possible. 17
The commercially most important cyanine dyes, which are used for spectral sensitization
in photographic emulsions aggregate on silver halide micro-crystals with red–shifted
absorption spectra indicating J-aggregation. 18, 19 The relationship between the relative
orientation of chromophores and the spectral shifts of a dye aggregate has been explained in
terms of molecular exciton theory. 20-22 According to this theory, the dye molecules are treated
as point dipoles. Interaction of the transition dipoles splits the excited state of the dye
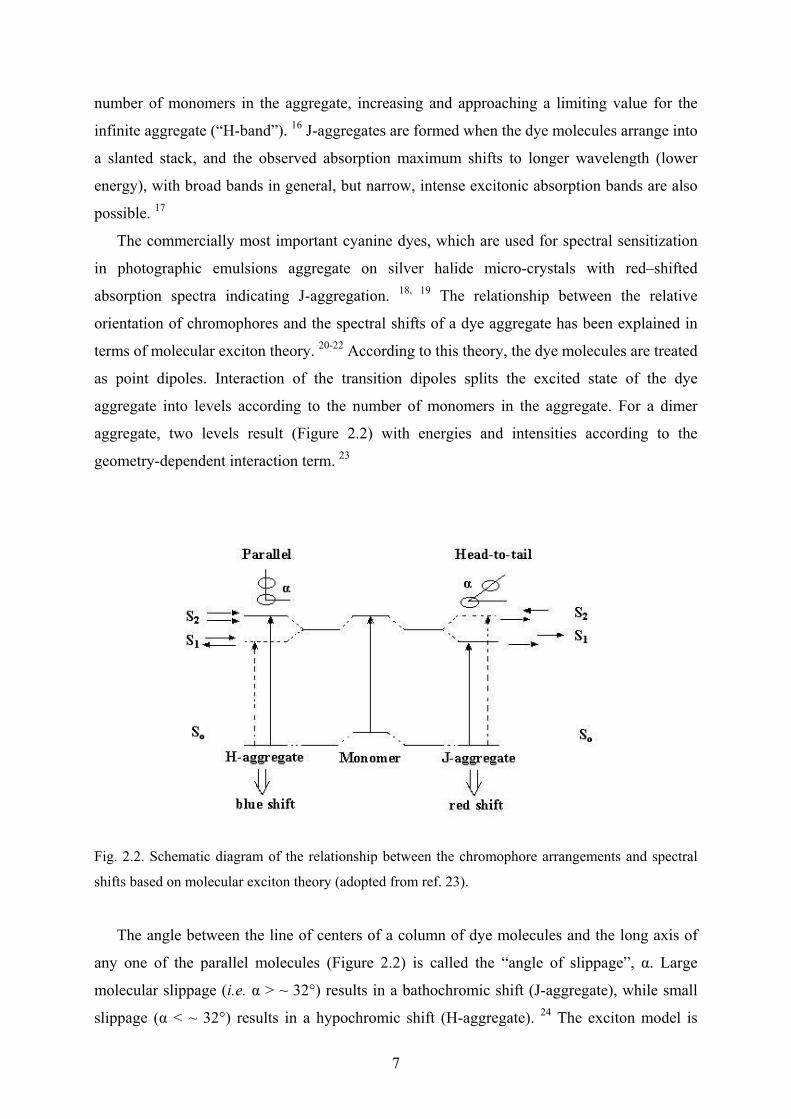
aggregate into levels according to the number of monomers in the aggregate. For a dimer
aggregate, two levels result (Figure 2.2) with energies and intensities according to the
geometry-dependent interaction term. 23
Fig. 2.2. Schematic diagram of the relationship between the chromophore arrangements and spectral
shifts based on molecular exciton theory (adopted from ref. 23).
The angle between the line of centers of a column of dye molecules and the long axis of
any one of the parallel molecules (Figure 2.2) is called the “angle of slippage”, α. Large
molecular slippage (i.e. α > ~ 32°) results in a bathochromic shift (J-aggregate), while small
slippage (α < ~ 32°) results in a hypochromic shift (H-aggregate). 24 The exciton model is
7
probably unsuitable for prediction of orbital energy levels of a dye aggregate, since it is valid
only when the interaction between orbitals of constituent molecules is negligible. 25 Extensive
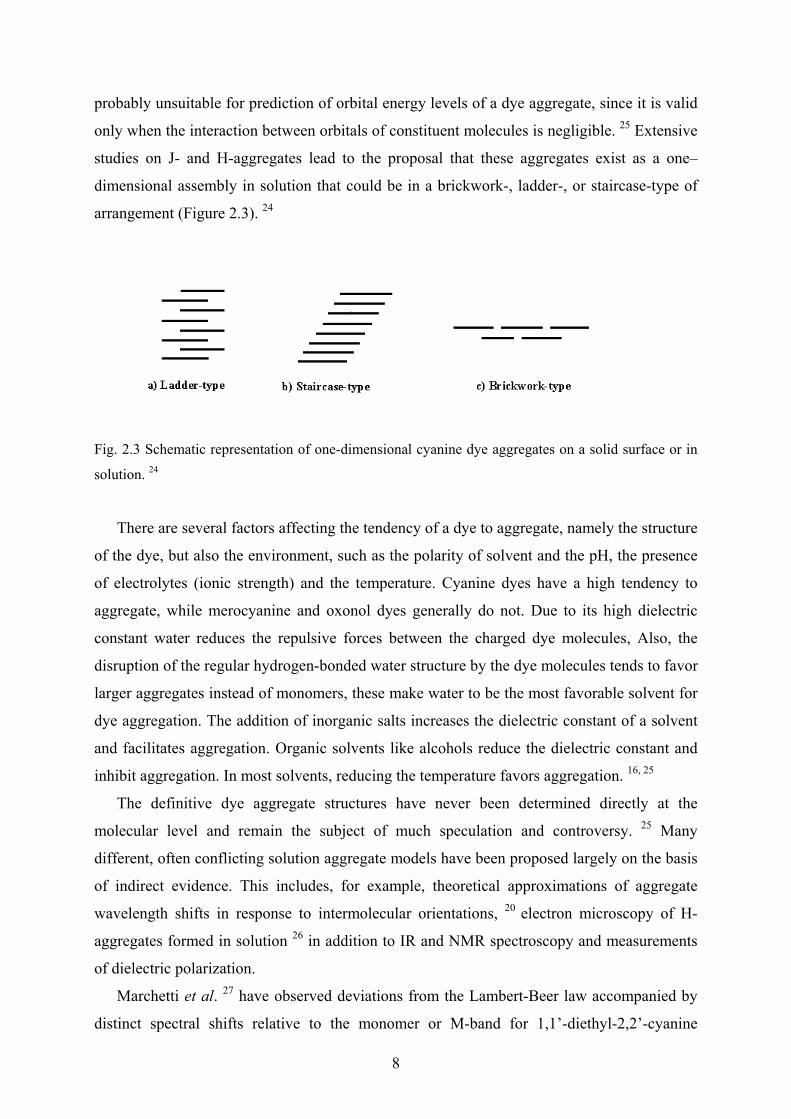
studies on J- and H-aggregates lead to the proposal that these aggregates exist as a one–
dimensional assembly in solution that could be in a brickwork-, ladder-, or staircase-type of
arrangement (Figure 2.3). 24
Fig. 2.3 Schematic representation of one-dimensional cyanine dye aggregates on a solid surface or in
solution. 24
There are several factors affecting the tendency of a dye to aggregate, namely the structure
of the dye, but also the environment, such as the polarity of solvent and the pH, the presence
of electrolytes (ionic strength) and the temperature. Cyanine dyes have a high tendency to
aggregate, while merocyanine and oxonol dyes generally do not. Due to its high dielectric
constant water reduces the repulsive forces between the charged dye molecules, Also, the
disruption of the regular hydrogen-bonded water structure by the dye molecules tends to favor
larger aggregates instead of monomers, these make water to be the most favorable solvent for
dye aggregation. The addition of inorganic salts increases the dielectric constant of a solvent
and facilitates aggregation. Organic solvents like alcohols reduce the dielectric constant and
inhibit aggregation. In most solvents, reducing the temperature favors aggregation. 16, 25
The definitive dye aggregate structures have never been determined directly at the
molecular level and remain the subject of much speculation and controversy. 25 Many
different, often conflicting solution aggregate models have been proposed largely on the basis
of indirect evidence. This includes, for example, theoretical approximations of aggregate
wavelength shifts in response to intermolecular orientations, 20 electron microscopy of H-
aggregates formed in solution 26 in addition to IR and NMR spectroscopy and measurements
of dielectric polarization.
Marchetti et al. 27 have observed deviations from the Lambert-Beer law accompanied by
distinct spectral shifts relative to the monomer or M-band for 1,1’-diethyl-2,2’-cyanine
8

chloride. They attributed this to the formation of dye dimers, oligomers, and n-mers (Figure
2.4). A blue shifted band with loss of intensity was termed a D-band and ascribed to dimeric
species. The third band or shoulder on the high-energy side of the D-band with a loss of
intensity corresponds to the H-band. 16 M-, D-, and H-bands are quite common in all classes
of dyes, while red-shifted J-bands are observed only for photographic cyanine dyes.
Fig. 2.4. The different shapes of visible absorption spectra of 1,1’-diethyl-2,2’-cyanine chloride
solutions at room temperature. M, D, H, and J correspond respectively to monomer, dimer, H-
aggregate and J-aggregate forms of the dye. (adopted from ref. 19, there is no mention in the reference
about concentration values).
With the sensitivity of aggregation to external factors, and the ease with which
quantitative UV/Vis-spectroscopy is performed, cyanine and merocyanine dyes present
perfect probes for studying various microenvironments. 30 Cyanine dyes have been used
extensively as sensors for the examination of polypeptide β-sheet structures in solution and in
thin films. 28 Several near-infrared absorbing carbocyanine dyes containing different
functional groups have been employed as fluorescent probes for the study of DNA, lipids,
peptides, and proteins. 29 To study the interaction between membranes and surfactants, probes
such as cyanine dyes are used for exploiting the application of detergents in biotechnology,
such as to activate, extract, and purify intrinsic enzymes.
9
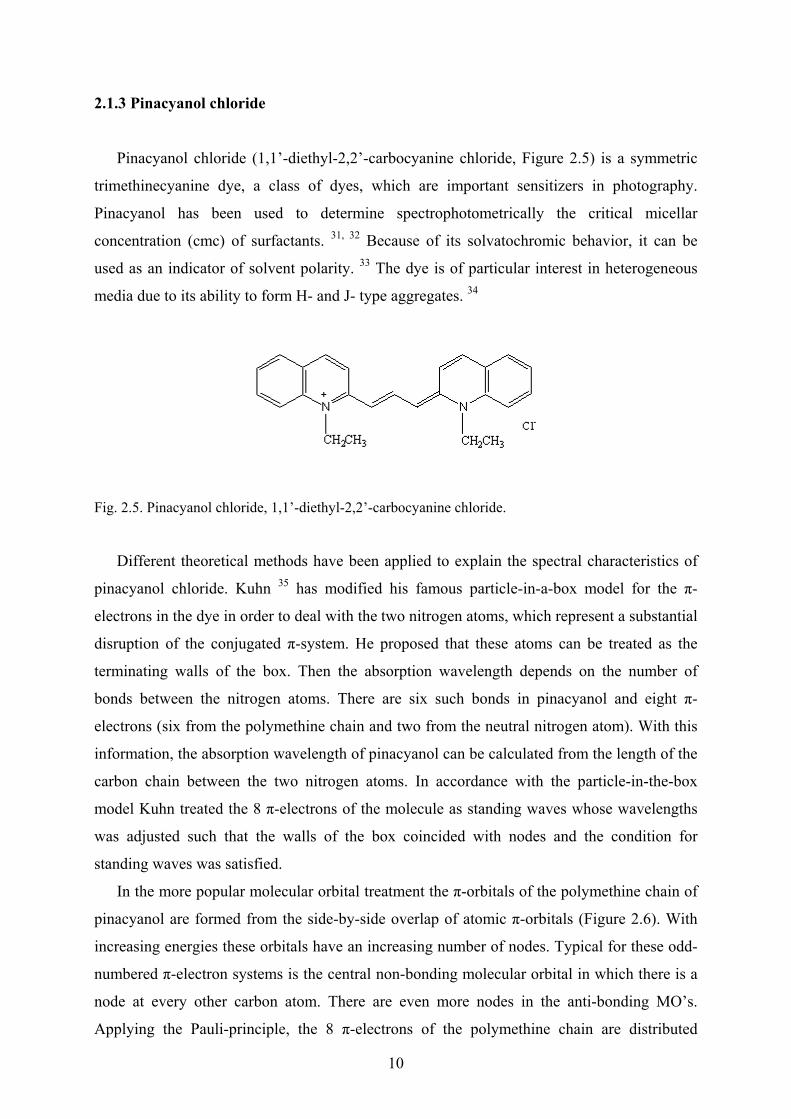
2.1.3 Pinacyanol chloride
Pinacyanol chloride (1,1’-diethyl-2,2’-carbocyanine chloride, Figure 2.5) is a symmetric
trimethinecyanine dye, a class of dyes, which are important sensitizers in photography.
Pinacyanol has been used to determine spectrophotometrically the critical micellar
concentration (cmc) of surfactants. 31, 32 Because of its solvatochromic behavior, it can be
used as an indicator of solvent polarity. 33 The dye is of particular interest in heterogeneous
media due to its ability to form H- and J- type aggregates. 34
Fig. 2.5. Pinacyanol chloride, 1,1’-diethyl-2,2’-carbocyanine chloride.
Different theoretical methods have been applied to explain the spectral characteristics of
pinacyanol chloride. Kuhn 35 has modified his famous particle-in-a-box model for the π-
electrons in the dye in order to deal with the two nitrogen atoms, which represent a substantial
disruption of the conjugated π-system. He proposed that these atoms can be treated as the
terminating walls of the box. Then the absorption wavelength depends on the number of
bonds between the nitrogen atoms. There are six such bonds in pinacyanol and eight π-
electrons (six from the polymethine chain and two from the neutral nitrogen atom). With this
information, the absorption wavelength of pinacyanol can be calculated from the length of the
carbon chain between the two nitrogen atoms. In accordance with the particle-in-the-box
model Kuhn treated the 8 π-electrons of the molecule as standing waves whose wavelengths
was adjusted such that the walls of the box coincided with nodes and the condition for
standing waves was satisfied.
In the more popular molecular orbital treatment the π-orbitals of the polymethine chain of
pinacyanol are formed from the side-by-side overlap of atomic π-orbitals (Figure 2.6). With
increasing energies these orbitals have an increasing number of nodes. Typical for these odd-
numbered π-electron systems is the central non-bonding molecular orbital in which there is a
node at every other carbon atom. There are even more nodes in the anti-bonding MO’s.
Applying the Pauli-principle, the 8 π-electrons of the polymethine chain are distributed
10
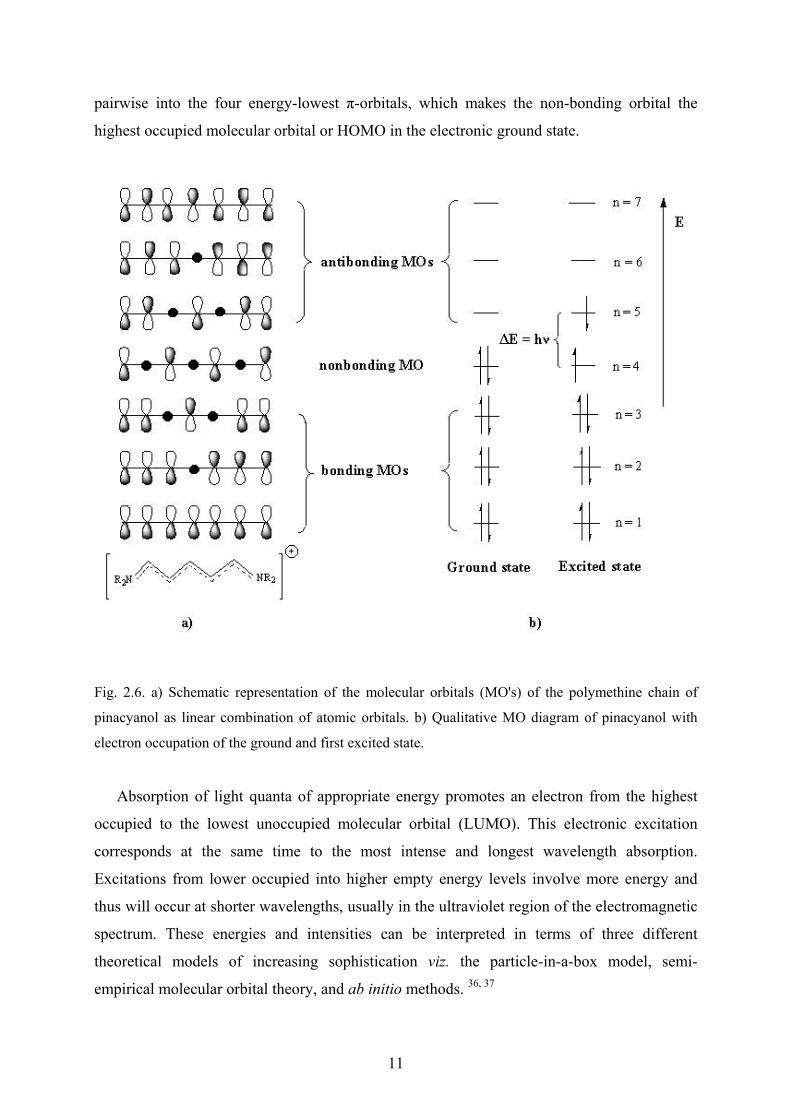
pairwise into the four energy-lowest π-orbitals, which makes the non-bonding orbital the
highest occupied molecular orbital or HOMO in the electronic ground state.
Fig. 2.6. a) Schematic representation of the molecular orbitals (MO's) of the polymethine chain of
pinacyanol as linear combination of atomic orbitals. b) Qualitative MO diagram of pinacyanol with
electron occupation of the ground and first excited state.
Absorption of light quanta of appropriate energy promotes an electron from the highest
occupied to the lowest unoccupied molecular orbital (LUMO). This electronic excitation
corresponds at the same time to the most intense and longest wavelength absorption.
Excitations from lower occupied into higher empty energy levels involve more energy and
thus will occur at shorter wavelengths, usually in the ultraviolet region of the electromagnetic
spectrum. These energies and intensities can be interpreted in terms of three different
theoretical models of increasing sophistication viz. the particle-in-a-box model, semi-
empirical molecular orbital theory, and ab initio methods. 36, 37
11
2.2 Polysaccharides
Polysaccharides are natural macromolecules occurring in all living organisms. They
constitute the largest and structurally the most diversified groups of natural compounds with
use either as an energy source (starches and glycogens in plants and animals, respectively), or
as structural units in the morphology of living material (cellulose and chitin in plants and in
the shells of insects, crabs etc., respectively). 38, 39
2.2.1 Classifications
Polysaccharides are classified on the basis of their main monosaccharide components and
the sequences and linkages between them, as well as the anomeric configuration of linkages,
the ring size (pyranose or furanose), the absolute configuration of asymmetric centers (D or L)
and any other substituents present. The most stable geometry of a polysaccharide will be the
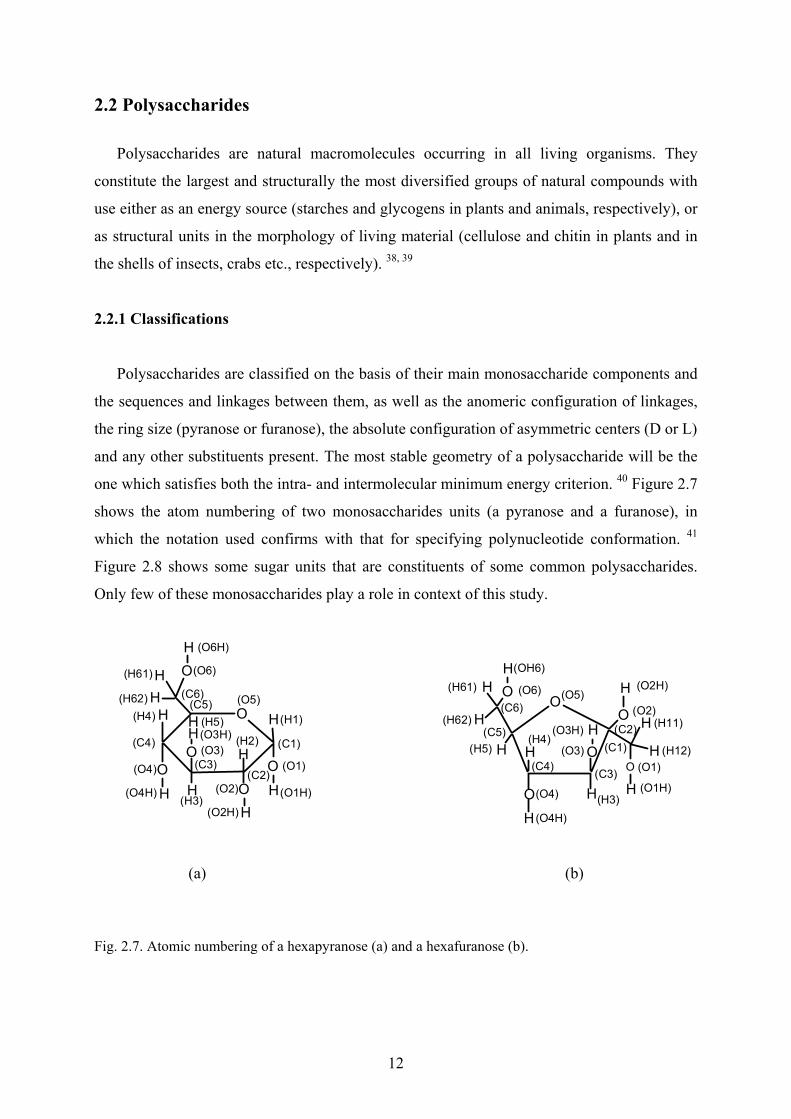
one which satisfies both the intra- and intermolecular minimum energy criterion. 40 Figure 2.7
shows the atom numbering of two monosaccharides units (a pyranose and a furanose), in
which the notation used confirms with that for specifying polynucleotide conformation. 41
Figure 2.8 shows some sugar units that are constituents of some common polysaccharides.
Only few of these monosaccharides play a role in context of this study.
OO
OO
O
O
HH
H
H
H
H
H
H
H
H OH
O
H
OOH
O H
H
H
H
H
H
H
H
H
(O6) (O5)(O2)
(O2H)
(H11)
(H12)(O1)
(O1H)(H3)
(C3)
(O4)
(O4H)
(H61)
(H62)(C6)
(C5)(H5)
(H4)(O3)
(C2)
(C4)(C1)
(H1)
OH
H
(C1)
(O1)
(O1H)
(O5)
(H2)
(OH6)
(O2)
(O2H)
(H5)(O3H)(O3)
(O6H)
(O6)
(C6)
(H61)
(H62)(H4)
(C4)
(O4)
(H3)
(C3)(C2)
(C5)
(O3H)
(O4H)
(a) (b)
Fig. 2.7. Atomic numbering of a hexapyranose (a) and a hexafuranose (b).
12
O O O
O O
O O
CH2OH
OHOH
OH
D-Glucose
CH2OH
OH OH
HO
HO
OH
D-Galactose
OHHO
HO OH
D-Ribose
OH OH
CO2H
HO
OH
OH OH HO
CO2H
D-Glucuronic acid
O
OHOH HOCO2H
D-Mannuronic acid L-Guluronic acid
OCH2OH
OHOH
HO
NH2
D-Glucosamine
HOCH3 OH
OH
HO
L-Fucose D-Fructose
HOHO
OH
CH2OHOH
HOHO
(6-deoxy-L-galactose)(2-amino-2-deoxy-D-glucose)
Fig. 2.8. Some monosaccharides, which are the building units of polysaccharides.
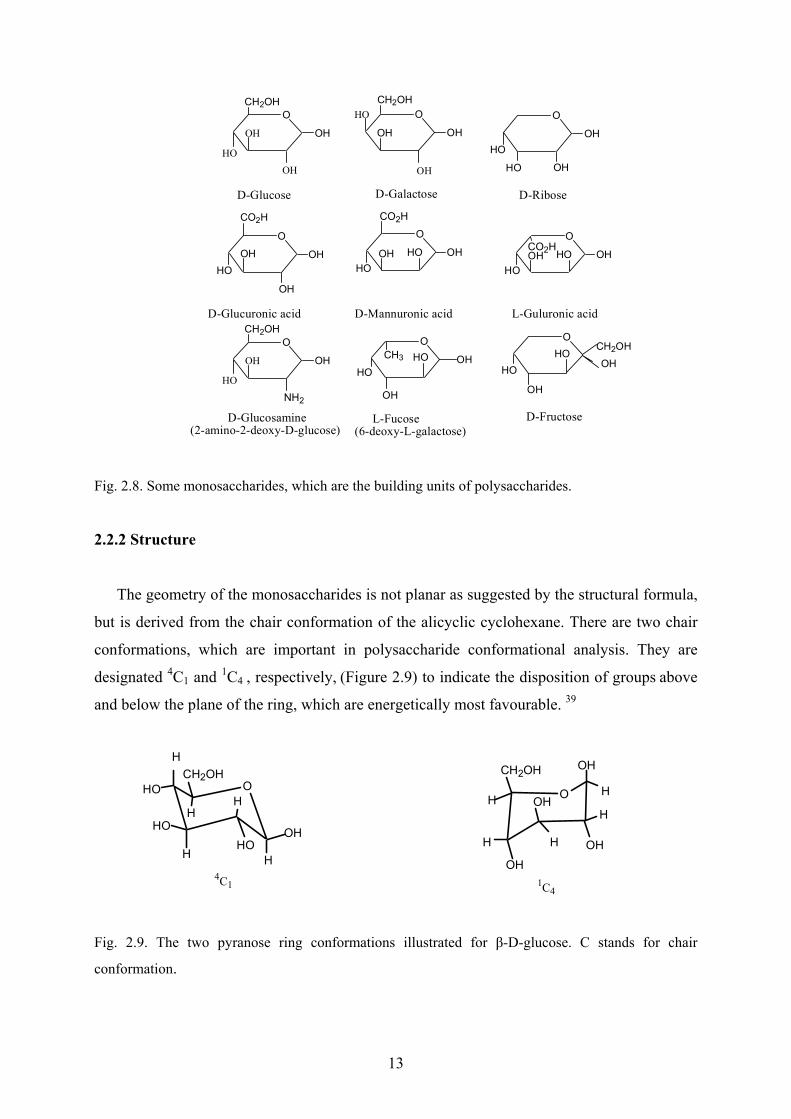
2.2.2 Structure
The geometry of the monosaccharides is not planar as suggested by the structural formula,
but is derived from the chair conformation of the alicyclic cyclohexane. There are two chair
conformations, which are important in polysaccharide conformational analysis. They are
designated 4C1 and 1C4 , respectively, (Figure 2.9) to indicate the disposition of groups above
and below the plane of the ring, which are energetically most favourable. 39
O
H
OH
HCH2OH
H
HO
HO
HHO
OH
H
H
CH2OH OH
H
OHH
OH
OH
H
4C1 1C4
Fig. 2.9. The two pyranose ring conformations illustrated for β-D-glucose. C stands for chair
conformation.
13
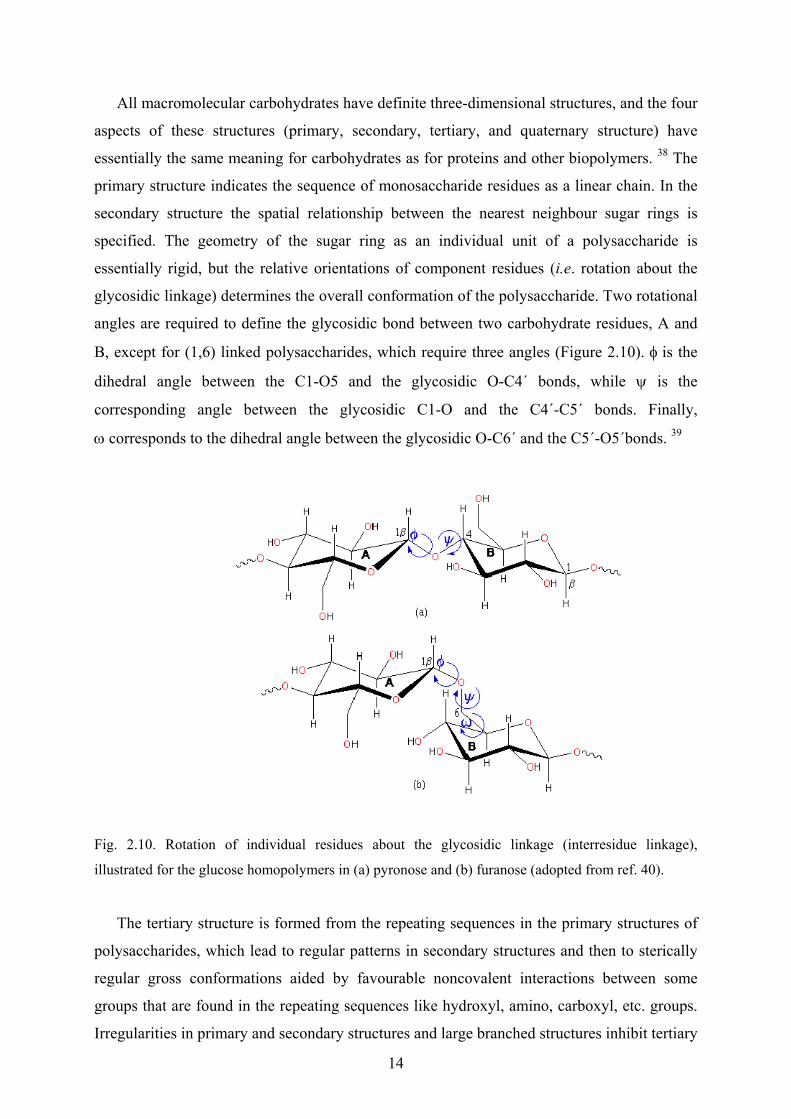
All macromolecular carbohydrates have definite three-dimensional structures, and the four
aspects of these structures (primary, secondary, tertiary, and quaternary structure) have
essentially the same meaning for carbohydrates as for proteins and other biopolymers. 38 The
primary structure indicates the sequence of monosaccharide residues as a linear chain. In the
secondary structure the spatial relationship between the nearest neighbour sugar rings is
specified. The geometry of the sugar ring as an individual unit of a polysaccharide is
essentially rigid, but the relative orientations of component residues (i.e. rotation about the
glycosidic linkage) determines the overall conformation of the polysaccharide. Two rotational
angles are required to define the glycosidic bond between two carbohydrate residues, A and
B, except for (1,6) linked polysaccharides, which require three angles (Figure 2.10). φ is the
dihedral angle between the C1-O5 and the glycosidic O-C4´ bonds, while ψ is the
corresponding angle between the glycosidic C1-O and the C4´-C5´ bonds. Finally,
ω corresponds to the dihedral angle between the glycosidic O-C6´ and the C5´-O5´bonds. 39
Fig. 2.10. Rotation of individual residues about the glycosidic linkage (interresidue linkage),
illustrated for the glucose homopolymers in (a) pyronose and (b) furanose (adopted from ref. 40).
The tertiary structure is formed from the repeating sequences in the primary structures of
polysaccharides, which lead to regular patterns in secondary structures and then to sterically
regular gross conformations aided by favourable noncovalent interactions between some
groups that are found in the repeating sequences like hydroxyl, amino, carboxyl, etc. groups.
Irregularities in primary and secondary structures and large branched structures inhibit tertiary
14
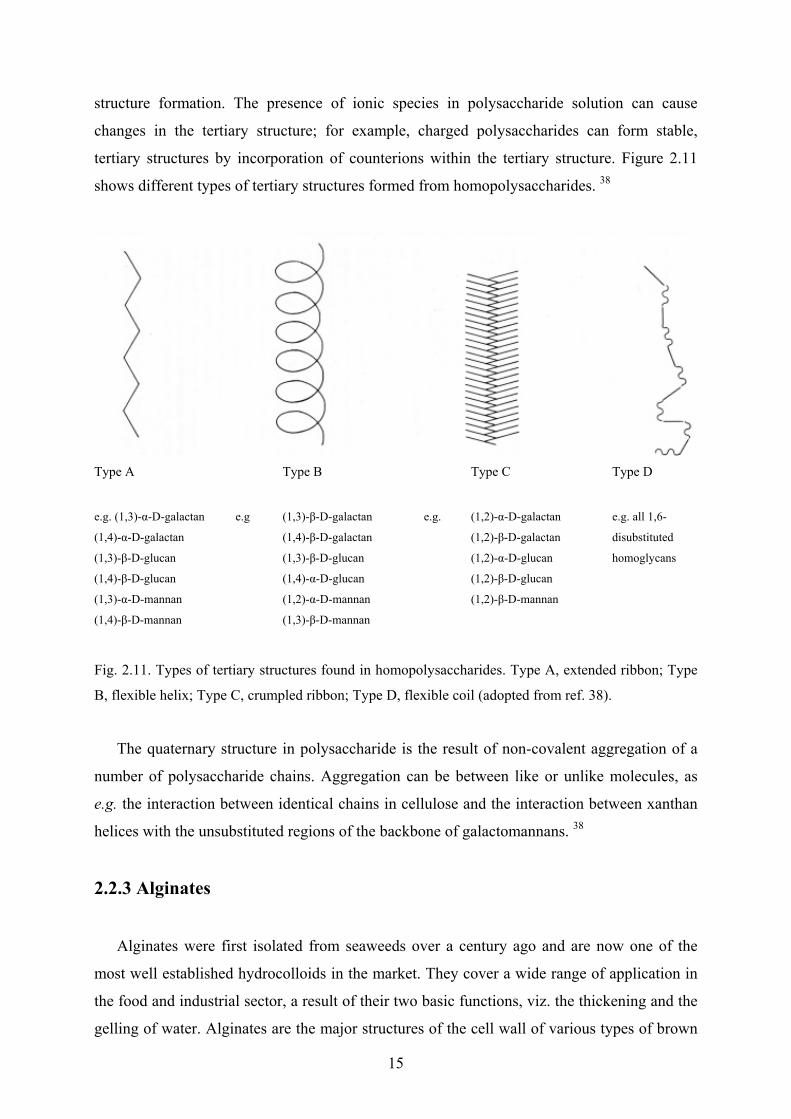
structure formation. The presence of ionic species in polysaccharide solution can cause
changes in the tertiary structure; for example, charged polysaccharides can form stable,
tertiary structures by incorporation of counterions within the tertiary structure. Figure 2.11
shows different types of tertiary structures formed from homopolysaccharides. 38
Type A Type B Type C Type D
e.g. (1,3)-α-D-galactan e.g (1,3)-β-D-galactan e.g. (1,2)-α-D-galactan e.g. all 1,6-
(1,4)-α-D-galactan (1,4)-β-D-galactan (1,2)-β-D-galactan disubstituted
(1,3)-β-D-glucan (1,3)-β-D-glucan (1,2)-α-D-glucan homoglycans
(1,4)-β-D-glucan (1,4)-α-D-glucan (1,2)-β-D-glucan
(1,3)-α-D-mannan (1,2)-α-D-mannan (1,2)-β-D-mannan
(1,4)-β-D-mannan (1,3)-β-D-mannan
Fig. 2.11. Types of tertiary structures found in homopolysaccharides. Type A, extended ribbon; Type
B, flexible helix; Type C, crumpled ribbon; Type D, flexible coil (adopted from ref. 38).
The quaternary structure in polysaccharide is the result of non-covalent aggregation of a
number of polysaccharide chains. Aggregation can be between like or unlike molecules, as
e.g. the interaction between identical chains in cellulose and the interaction between xanthan
helices with the unsubstituted regions of the backbone of galactomannans. 38
2.2.3 Alginates
Alginates were first isolated from seaweeds over a century ago and are now one of the
most well established hydrocolloids in the market. They cover a wide range of application in
the food and industrial sector, a result of their two basic functions, viz. the thickening and the
gelling of water. Alginates are the major structures of the cell wall of various types of brown
15
seaweeds (phaephceae), of which they comprise up to 40% of the total dry matter. 42 Called
algal alginate, they give both strength and flexibility to the algal tissue and prevent
desiccation of the seaweed when exposed to air, for example at low tide. 38 Another source of
alginate with the same basic structure as algal alginate is that produced by certain bacteria,
such as Azetobacter vinelandii. 43
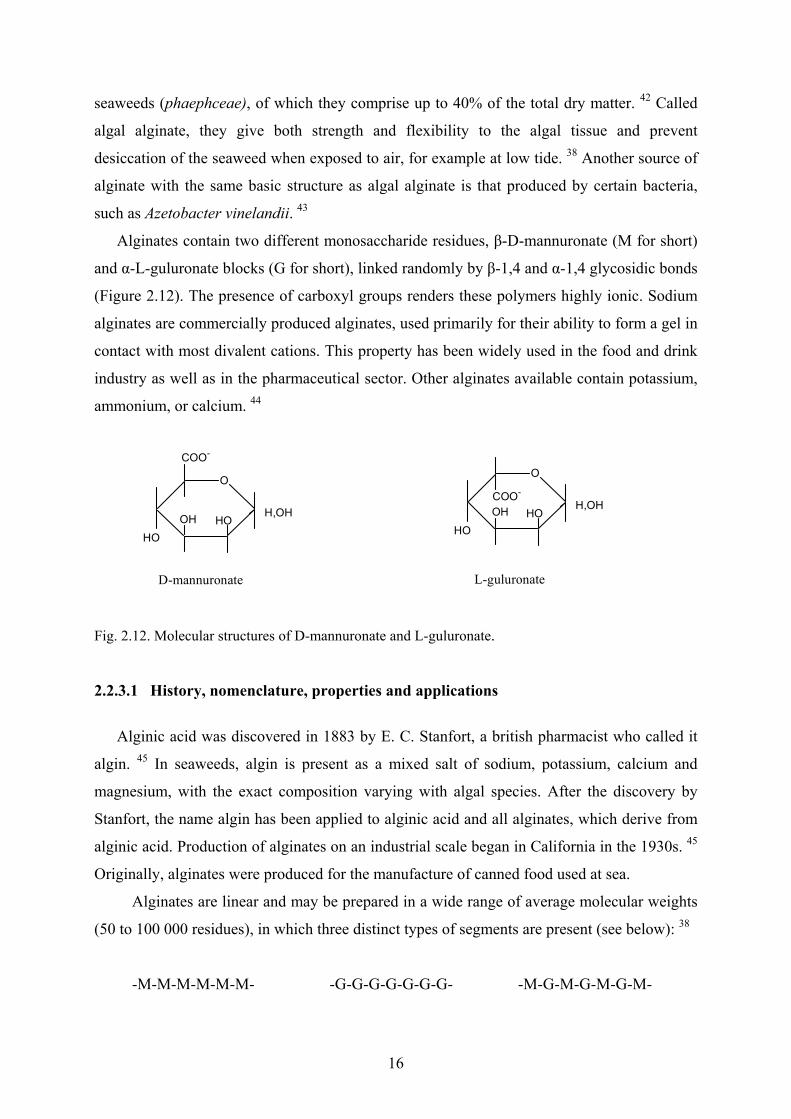
Alginates contain two different monosaccharide residues, β-D-mannuronate (M for short)
and α-L-guluronate blocks (G for short), linked randomly by β-1,4 and α-1,4 glycosidic bonds
(Figure 2.12). The presence of carboxyl groups renders these polymers highly ionic. Sodium
alginates are commercially produced alginates, used primarily for their ability to form a gel in
contact with most divalent cations. This property has been widely used in the food and drink
industry as well as in the pharmaceutical sector. Other alginates available contain potassium,
ammonium, or calcium. 44
O
OHHO
HO
COO-
H,OH
O
OHHO
HOCOO-
H,OH
D-mannuronate L-guluronate
Fig. 2.12. Molecular structures of D-mannuronate and L-guluronate.
2.2.3.1 History, nomenclature, properties and applications
Alginic acid was discovered in 1883 by E. C. Stanfort, a british pharmacist who called it
algin. 45 In seaweeds, algin is present as a mixed salt of sodium, potassium, calcium and
magnesium, with the exact composition varying with algal species. After the discovery by
Stanfort, the name algin has been applied to alginic acid and all alginates, which derive from
alginic acid. Production of alginates on an industrial scale began in California in the 1930s. 45
Originally, alginates were produced for the manufacture of canned food used at sea.
Alginates are linear and may be prepared in a wide range of average molecular weights
(50 to 100 000 residues), in which three distinct types of segments are present (see below): 38
-M-M-M-M-M-M- -G-G-G-G-G-G-G- -M-G-M-G-M-G-M-
16
Each type may contain either one of the two monosaccharide residues, or approximately equal
quantities of both, which may be distributed randomly or show some alternating sequence. 46
The proportion of these blocks depends on the species of seaweed, the condition of growth
and the part of plant from which the alginate was derived (stalk or leaf of the seaweeds). In
addition to that it has been reported that the content of L-guluronate increases as the tissue
gets older and tougher. 47 The number and length of the blocks is very important as these
factors determine the physical properties of alginates. These properties can be changed
according to the extraction conditions from the algal species used. Examples of common algal
species used to produced alginates are Ascophyllum nodosum, Ecklonia maxima, or various
species of Laminaria and Lessonia. 38
Alginic acid is insoluble in water but swells on contact with aqueous solutions. The water-
soluble forms of the product are made by neutralizing alginic acid to give the appropriate
soluble salt forms, mostly the sodium and potassium salts. These monovalent salts are the
varieties of algin that are most commonly used as thickeners. Multivalent ions such as
calcium, lead, and chromium react more strongly with alginates in solution causing them to
precipitate from solution. This phenomenon, referred to as ion exchange, is responsible for the
ability of alginates to selectively remove metal ions from solutions and to form fibres, films
and gels. Calcium is the most commonly used gelling agent, and it is also used to form
insoluble alginate filaments and films. The gelling is thermally not reversible, and its rigidity
increases with increasing ratio of L-guluronic to D-mannuronic acid. 45 The acidic solutions,
which are the source of hydronium ions, if present in high concentration, behave like
multivalent ions and cause alginate to precipitate.
Alginates dissolve in hot and cold water to give solutions with a wide range of unusually
high apparent viscosities, even at 1% solute concentrations, due to their high molecular
weight and rigid structure. 38 The viscosity increases logarithmically in accordance with an
increase in concentration. Addition of water-miscible solvents such as alcohols, glycols, or
acetone, increases viscosity and reaching a certain concentration the alginate will
precipitate.38
Alginates are very friendly to use and consume, because they are natural, sustainable,
renewable, of vegetable and not animal origin. They are non-calorific and wholly safe by all
known test. The various alkali solutions of alginate are tasteless and almost colourless. 48
Alginates are used extensively in food products, pharmaceuticals and cosmetics and for a
wide range of other industrial applications, for example in controlling viscosity in sauces and
syrups, to improve pouring and handling properties in liquid detergent and shampoos, to
17
retard phase separation and ice crystal growth in ice-cream, or to produce a semi-solid product
with good spreading properties in ointments. 38
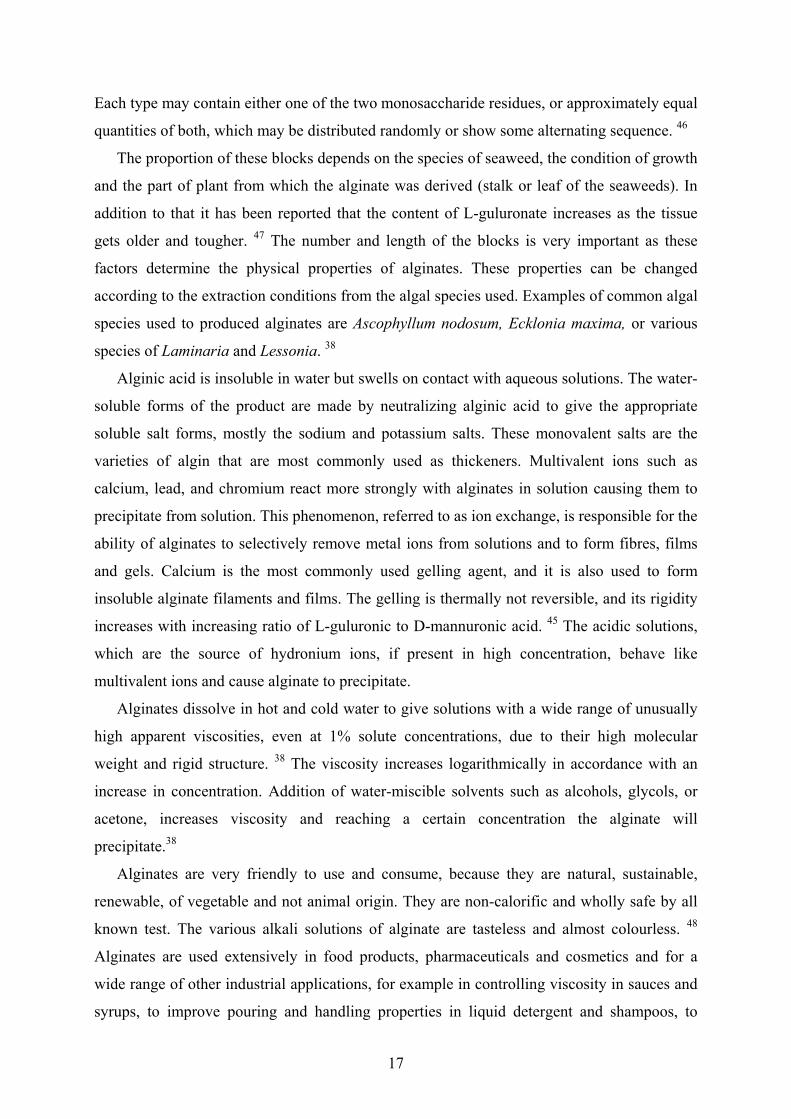
2.2.3.2 Molecular structure and conformations
Alginates are linear unbranched polyelectrolyte copolymers containing β-(1,4)-linked D-
mannuronate (M) and α- (1,4)-linked L-guluronate (G) residues. 49 D-mannuronate is 4C1 with
diequatorial links and L-guluronate is 1C4 with diaxial links between the residues (Figure
2.13). Bacterial alginates are, in contrast to algal alginates, O-acetylated in some of the 2
and/or 3 positions of the D-mannuronate residues. Acetyl groups in bacterial alginate confer
the resistance to enzymes and greatly reduce the ion binding capacity. 50 In sodium alginate,
the sodium cations are understood to be bound to the carboxylate groups in the alginate
residues.
Fig. 2.13. Glycosidic bonds between β-(1,4)-linked D-mannuronate (M) and α-(1,4)-linked L-
guluronate (G) residues in the polymer chain of alginate (adopted from ref. 51).
Poly β-(1,4)-linked D-mannuronate tends to form a 3-fold left-handed helix (Figure 2.14)
with weak intramolecular hydrogen bonding between the hydrogen of the hydroxyl group in
the 3-position (i.e. O3H) and the ring oxygen of the subsequent residues (i.e. O5). Poly α-
(1,4)-linked L-guluronate forms more rigid 2-fold screw helical chains by intramolecular
hydrogen bonding between the carboxyl group and the hydroxyl group in the 2-position (i.e
O2H) of the prior residues and weaker hydrogen bonding with the hydroxyl group in the 3-
position (i.e O3H) of the subsequent residues. Alternating poly α-(1,4)-linked L-guluronate-β-
(1,4)-linked D-mannuronate contains both equatorial-axial and axial-equatorial links and the
conformation is disordered. In this dissimilar conformation there are hydrogen bonds between
the carboxyl group on the mannuronate and the hydroxyl groups in the 2- and the 3-positions
18

(i.e. O2H and O3H, respectively) of the subsequent guluronate. Because there are differences
in the degrees of freedom of the two residues, the overall flexibility here is greater than in
poly β-(1,4)-linked D-mannuronate chains (Figure 2.14). 51
3-fold left-handed helix 2-fold-screw helical disordered conformation
Fig. 2.14. The different types of alginate conformations, (a) poly-β-(1,4)-linked D-mannuronate chain
(MMMM); (b) poly-α-(1,4)-linked L-guluronate chain (GGGG); and (c) alternating poly-α-(1,4)-
linked L-guluronate- β-(1,4)-linked D-mannuronate chain (GMGMG) (adopted from ref. 51).
The x-ray analyses of alginates show a relation between the conformation and the pH;
poly-mannuronic acid chain has a repeating value of a 10.4 Å, 2-fold helix, while poly-
mannuronate has a repeat value of 15.1 Å, 3-fold helix. For poly-guluronic acid and poly-
guluronate repeat values of, respectively, 8.7 Å and 13 Å have been observed, and both form
2-fold helices. 5, 52
2.2.3.3 Calcium alginate and the “egg-box model”
The extensive use of alginate polymers is derived from their ability to form gels in the
presence of divalent cations, mainly calcium ions. It has been shown that calcium ions induce
chain-chain association, and these associations through dimerization constitute the junction
zones responsible for gel formation. Other divalent cations (e.g. of Cu, Co, or Mn) may also
19
form similar junctions, but with marked differences in the strength of binding. 53 Mg2+ does
not promote gelation. 54
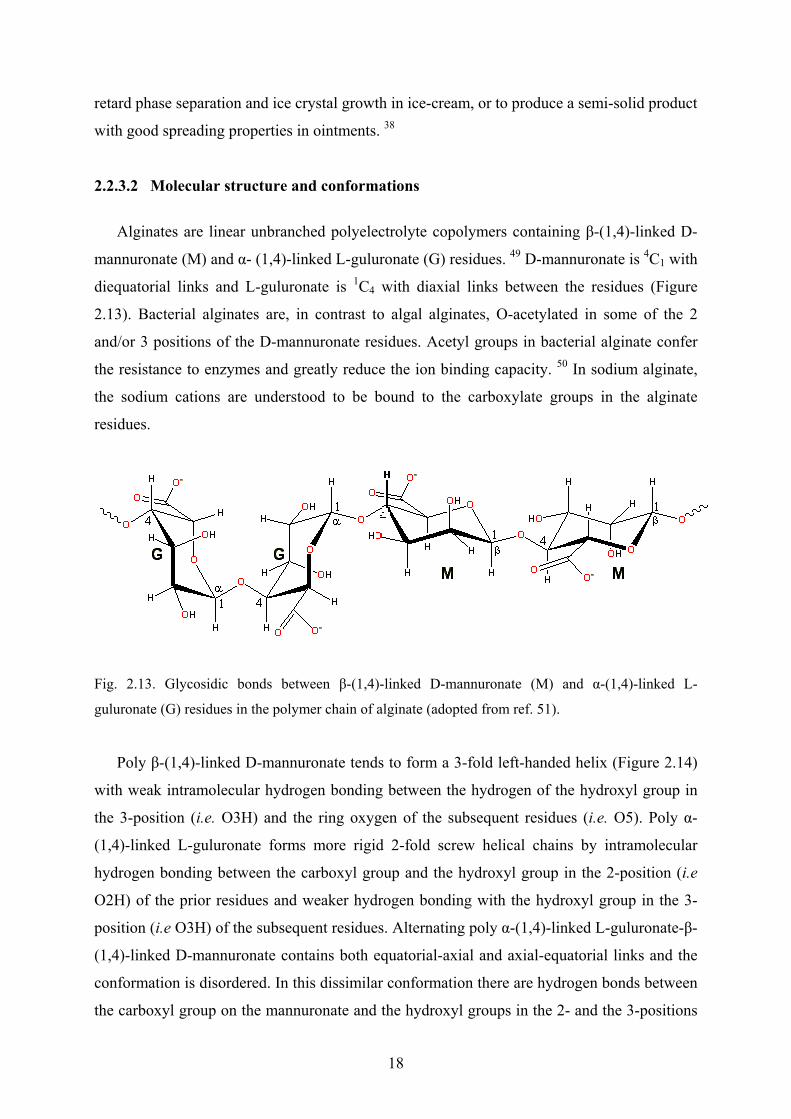
The gelation process in alginates (or in pectins, which are another similar type of ionic
polysaccharides composed of galacturonate residues) results from specific and strong
interactions between divalent ions and blocks of guluronate, but not mannuronate residues
(Figure 2.15). The guluronate blocks are better disposed to chelate the divalent ions, because a
spatial arrangement between adjacent blocks forms a cavity lined with carboxylate and other
oxygen atoms, which is suitable to complex the divalent cations. 39 Therefore, the gel strength
in alginate is related to the level of L-guluronate present, 56 in which the divalent ions lie in
cavities on alignment of two guluronate chain sections. 38, 56
Fig. 2.15. Schematic drawings of (a) polymannuronate (b) polyguluronate in alginate, and (c)
polygalacturonate in pectin (adopted from ref. 39).
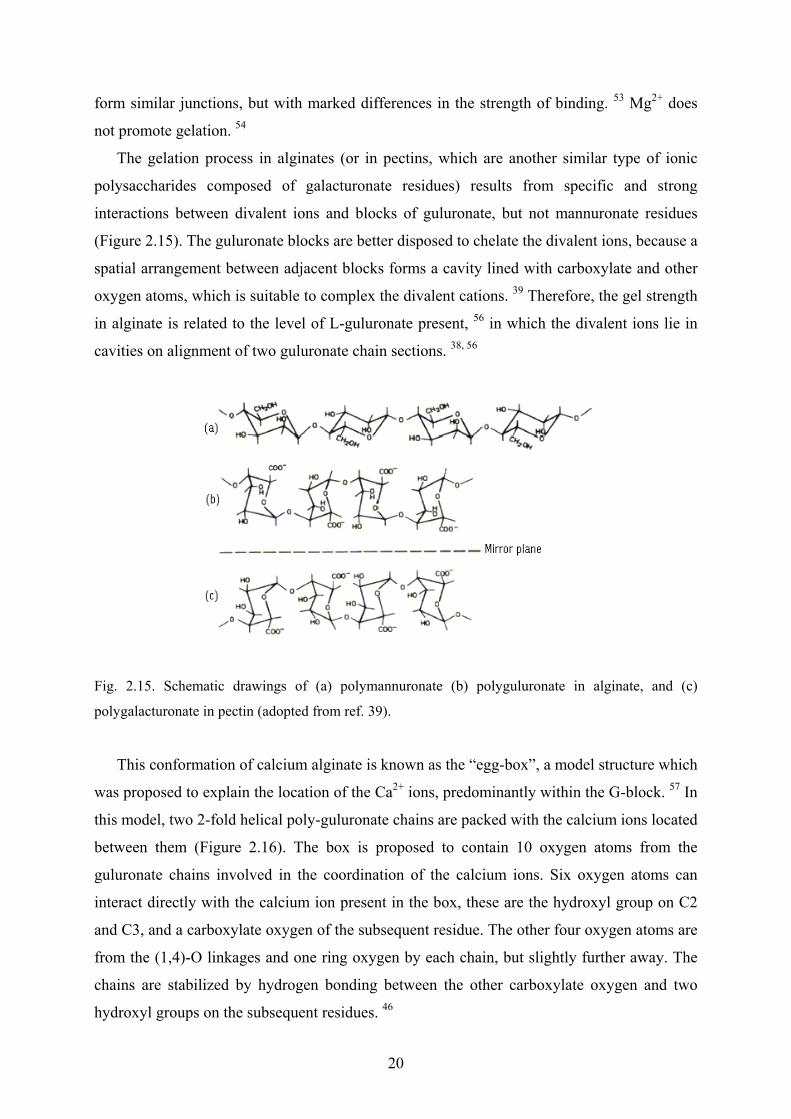
This conformation of calcium alginate is known as the “egg-box”, a model structure which
was proposed to explain the location of the Ca2+ ions, predominantly within the G-block. 57 In
this model, two 2-fold helical poly-guluronate chains are packed with the calcium ions located
between them (Figure 2.16). The box is proposed to contain 10 oxygen atoms from the
guluronate chains involved in the coordination of the calcium ions. Six oxygen atoms can
interact directly with the calcium ion present in the box, these are the hydroxyl group on C2
and C3, and a carboxylate oxygen of the subsequent residue. The other four oxygen atoms are
from the (1,4)-O linkages and one ring oxygen by each chain, but slightly further away. The
chains are stabilized by hydrogen bonding between the other carboxylate oxygen and two
hydroxyl groups on the subsequent residues. 46
20
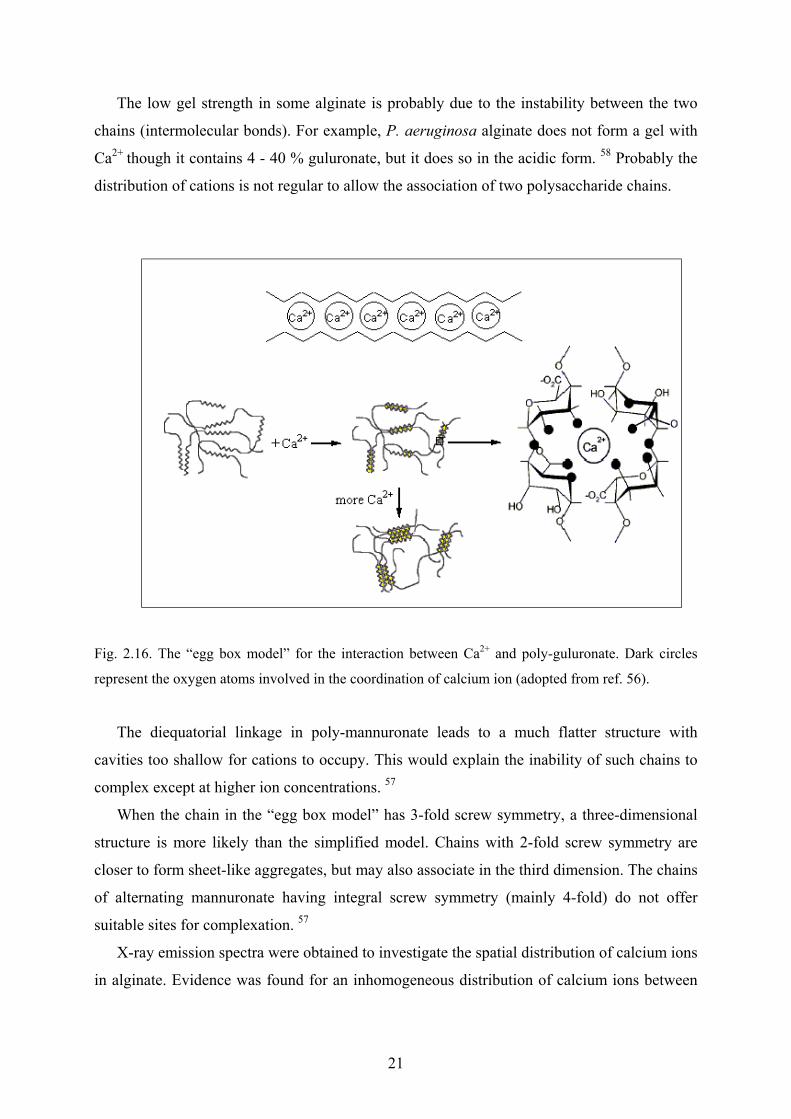
The low gel strength in some alginate is probably due to the instability between the two
chains (intermolecular bonds). For example, P. aeruginosa alginate does not form a gel with
Ca2+ though it contains 4 - 40 % guluronate, but it does so in the acidic form. 58 Probably the
distribution of cations is not regular to allow the association of two polysaccharide chains.
Fig. 2.16. The “egg box model” for the interaction between Ca2+ and poly-guluronate. Dark circles
represent the oxygen atoms involved in the coordination of calcium ion (adopted from ref. 56).
The diequatorial linkage in poly-mannuronate leads to a much flatter structure with
cavities too shallow for cations to occupy. This would explain the inability of such chains to
complex except at higher ion concentrations. 57
When the chain in the “egg box model” has 3-fold screw symmetry, a three-dimensional
structure is more likely than the simplified model. Chains with 2-fold screw symmetry are
closer to form sheet-like aggregates, but may also associate in the third dimension. The chains
of alternating mannuronate having integral screw symmetry (mainly 4-fold) do not offer
suitable sites for complexation. 57
X-ray emission spectra were obtained to investigate the spatial distribution of calcium ions
in alginate. Evidence was found for an inhomogeneous distribution of calcium ions between
21

the surface and the core of the gel spheres being highest at the surface and lower in the gel
interior. 59
2.2.3.4 Alginates and circular dichroism
In solution, carbohydrate polymers often exist as disordered coils, either extended or
collapsed, but helical structures also occur, with a wide range of residual value along the helix
axis. Short-chain carbohydrates can be flexible or relatively rigid. From conformational
analysis supported by circular dichroism (CD) evidence, the absolute conformation can be
extracted, and polymer coils can be distinguished from helices, or flexible oligomers from
rigid oligomers. Because carbohydrates are saturated oxocarbon compounds in their simplest
form, there are special experimental problems in their circular CD analysis. The simple
pyranose rings contain only ether chromophores, and electronic transitions occur at
wavelengths shorter than 200 nm. CD spectra in this range are not easily accessible, and until
recently required special prototype instruments. 60 Stevens et al 61 found that the CD bands in
the 180 – 190 nm, 164 – 177 nm, and 145 – 160 nm regions depend on the absolute
conformation of glycosidic linkages of the α- and β-(1,3), -(1,4), and -(1,6) types,
respectively.
When the carbohydrates carry unsaturated substituents, it is in general possible to find CD
absorption bands at wavelengths longer than 200 nm. Among the most common substituents
of this kind are acetamido and uronic acid moieties. Both groups have characteristic nπ* and
ππ* transitions, which makes it possible to observe the CD at wavelengths of 180 nm or
longer. Alginates have carboxylate as the intrinsic chromophore and hence exhibit circular
dichroism around 210 nm corresponding to the nπ* transition of the COO- group. 5 The three
types of block sequences present in alginates show very different CD behaviour, the spectrum
of poly-L-guluronate being entirely negative, whereas that of poly-D-mannuronate has a
strong positive band and mixed sequences show intermediate behaviour. Spectra of intact
alginates show a peak at ~200 nm, and a trough at ~215 nm (Figure 2.17), with relative
magnitudes varying with composition. 62 The ratio of peak height to trough depth varies
almost linearly with the ratio of mannuronate to guluronate residues. From the following two
simple linear equations (2.1 and 2.2) the % mannuronate in alginate can be calculated: 62
mannuronate/guluronate ≈ 2.0 (peak/trough) if peak/trough <1 (2.1)
% mannuronate ≈ 27 (peak/trough) + 40 if peak/trough >1 (2.2)
22
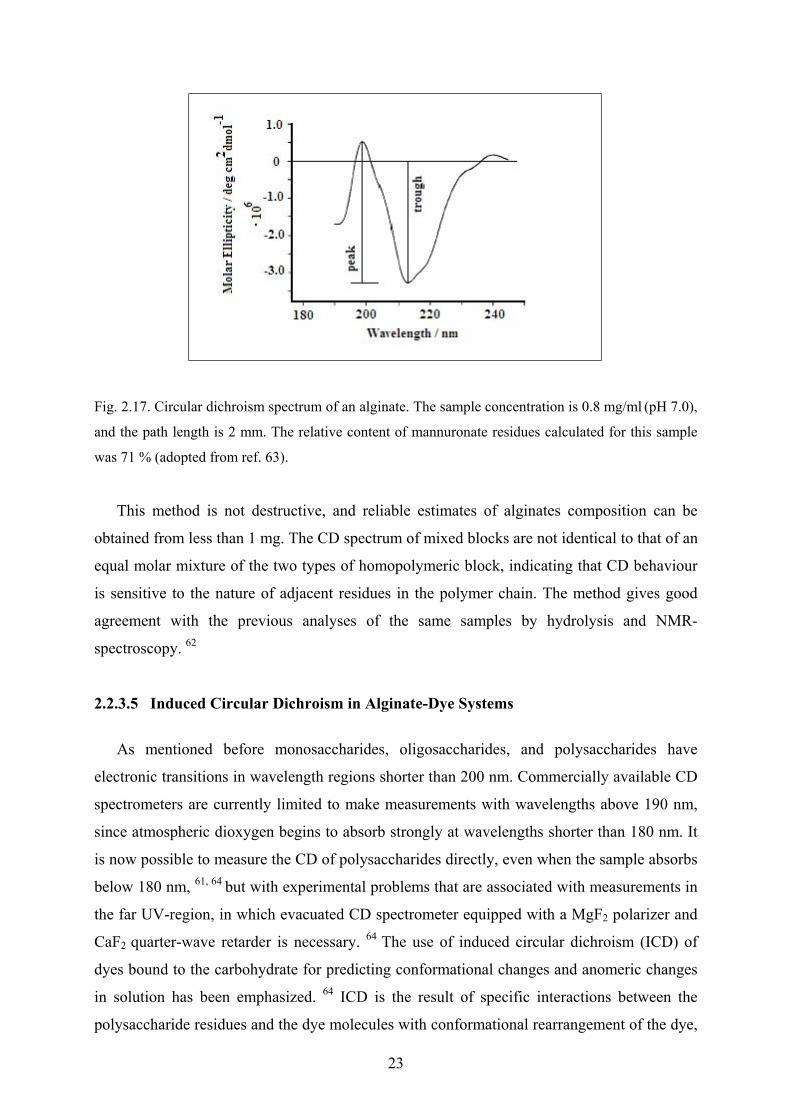
Fig. 2.17. Circular dichroism spectrum of an alginate. The sample concentration is 0.8 mg/ml (pH 7.0),
and the path length is 2 mm. The relative content of mannuronate residues calculated for this sample
was 71 % (adopted from ref. 63).
This method is not destructive, and reliable estimates of alginates composition can be
obtained from less than 1 mg. The CD spectrum of mixed blocks are not identical to that of an
equal molar mixture of the two types of homopolymeric block, indicating that CD behaviour
is sensitive to the nature of adjacent residues in the polymer chain. The method gives good
agreement with the previous analyses of the same samples by hydrolysis and NMR-
spectroscopy. 62
2.2.3.5 Induced Circular Dichroism in Alginate-Dye Systems
As mentioned before monosaccharides, oligosaccharides, and polysaccharides have
electronic transitions in wavelength regions shorter than 200 nm. Commercially available CD
spectrometers are currently limited to make measurements with wavelengths above 190 nm,
since atmospheric dioxygen begins to absorb strongly at wavelengths shorter than 180 nm. It
is now possible to measure the CD of polysaccharides directly, even when the sample absorbs
below 180 nm, 61, 64 but with experimental problems that are associated with measurements in
the far UV-region, in which evacuated CD spectrometer equipped with a MgF2 polarizer and
CaF2 quarter-wave retarder is necessary. 64 The use of induced circular dichroism (ICD) of
dyes bound to the carbohydrate for predicting conformational changes and anomeric changes
in solution has been emphasized. 64 ICD is the result of specific interactions between the
polysaccharide residues and the dye molecules with conformational rearrangement of the dye,
23

as it adapts to the chiral field in the carbohydrate molecule. This interaction will generate an
extrinsic CD spectrum that will reveal information about the structure of the polysaccharide in
solution in a way that is quite analogous to the application of the exciton coupling models. 65
This method has the advantage that there is no need to solve the experimental problems
associated with far-UV measurements.
Natural anionic polysaccharides are well known chromotropes containing more than one
kind of substituted sugar residue, such as heparin, hyaluronic acid, and chondroitin sulfate. 66
However, the formation of dye-alginate complexes has not received very detailed treatment in
the past. Seely and Hart 66 have studied the interaction between methylene blue and some
types of sodium alginate by absorption and circular dichroism spectroscopy at high polymer
to dye ratios. They obtained different types of spectra when they added methylene blue to
certain samples of sodium alginate, due to aggregation of the dye molecules as a result of their
interaction with alginate, but at any sensible polymer to dye ratio there was no induced
dichroism. Seely and Hart in their study tried to distinguish the varieties of UV and CD
absorption of the dye, and relate the different modes of dye aggregation to the different kinds
of alginate segments, poly(Man), poly(Gul), and poly(Gul-Man).
Pal and Mandel 5 have studied the ICD of the same dye, methylene blue (MB), in addition
to other dyes, acridine orange (AO), 1,9-dimethylmethyleneblue (DMMB), and pinacyanol
(PCYN) in potassium alginate, which was prepared from alginic acid (from Macrocystis-
pyrifera). However, these researchers used in their study a reasonable polymer – dye ratio,
because they felt that it was safer to work at this lower ratio, and also in order to avoid the risk
of observing CD absorption caused by a trace impurity in the polymer samples. Under this
condition, alginate does not induce CD in MB, in agreement with the observation by Seely
and Hart. Pal and Mandel also noted that MB and AO exhibit weak metachromasia and no
induced dichroism at any sensible polymer to dye ratio. As for the other dyes strong
dichroism was observed with potassium alginate and strong induced blue shifts (up to 125nm)
of the maximum in the visible spectra. From the CD spectra (1.2 · 10-4 and 8.4 · 10-4 M) in the
absence of dye it was concluded that potassium alginate shows no conformational change
associated with a change in concentration. The CD spectrum with DMMB (polysaccharide to
dye ratio of 70) was also identical except for the shallow trough around 300 nm, which was
assigned to the UV band of the dye.
These results indicate that potassium alginate has a rather stable conformation, which is
not appreciably perturbed either by dilution or by the dye. With respect to PCYN, Pal and
Mandel observed that this dye shows broad and multiply banded metachromasia induced by
24
potassium alginate, with peaks around 483, 590, and 635 nm; the shape of the metachromasic
spectrum does not significantly change upon increasing the polysaccharide to dye ratio from 1
to 10.
2.2.4 Cyclodextrins
There are many reasons that make the cyclodextrins one of the most important among all
the host type macromolecules, which have the ability to complex guest molecules without
forming a covalent bond. They are produced in tons from natural precursors by relatively
simple enzymes conversion and can be modified chemically for different tasks. Cyclodextrins
appear to pose no risk when used together with nutrients. Molecular encapsulation using
cyclodextrins is already widely utilized in many industrial products, technologies, and
analytical methods, and as ingredients for drugs, food, or cosmetics.
2.2.4.1 Discovery and Nomenclature
In 1891, Villiers 67 isolated about 3 g of a crystalline substance from 1000 g starch by
digesting starch with a particular enzyme (Bacillus macrons), and determined its composition
as (C6H10O5)2.3H2O. This new compound was named “cellulosine” because it was resistant
against acidic hydrolysis and did not show reducing properties. Villiers observed two distinct
types of “cellulosines”, which were later referred to a α- and β- cyclodextrins. In 1903,
Schardinger 68 described the properties of crystalline dextrins that seemed to be identical with
the “cellulosines” of Villiers. In all his experiments, the major crystalline product was the so-
called α-dextrin. He found the iodine reaction suitable to distinguish between the α- and β-
dextrins. 69 In 1936, Freudenberg and co-workers postulated the cyclic structure of the
crystalline Schardinger dextrins70 and in 1948, they discovered γ-dextrin and elucidated its
structure. 71 Three years later Cramer, in his concept of the “cavity in solution”, developed a
model for the complexing ability of the cyclodextrins, which was widely accepted in 1957. 72
For a long time, the most common and commercially available cyclodextrins were α-
cyclodextrin (cyclohexaamylose), β–cyclodextrin (cycloheptaamylose), and γ-cyclodextrin
(cyclooctaamylose), which are referred to as α-CD, β-CD, and γ-CD respectively. The larger
cyclodextrins (δ-, ε-CD etc.), which were observed by French 72 in the early 1950s, are not
regular cylinder shaped structures. They have collapsed, and their real cavity is even smaller
than in γ-CD.
25
2.2.4.2 Structural Features
Cyclodextrins are macrocyclic oligosacchrides, formed by α-1,4-linked glucopyranose
subunits, and appear like toroidal macro rings with a cavity in the center (Figure 2.18). 73
Crystal structure analyses of cyclodextrins have proven that all glucose residues in the ring
possess the thermodynamically favoured 4C1 chair conformation with all substitutions in the
equatorial position. The external surface of a cyclodextrin contains secondary hydroxyl
groups situated on one of the two rims of the ring, whereas primary hydroxyl groups are
placed on the other rim. The inner surface of the cavity is lined by the hydrogen atoms and
ether-like oxygen. 74 The overall appearance of a cyclodextrin molecule is less that of a ring,
but rather of a truncated cone with the wide “open” side formed by secondary hydroxyl
groups, whereas the primary hydroxyl groups are located on the narrower “closed” side. The
cavity diameters (maximum values) are 5.3, 6.5, and 8,3 Å for α-CD, β-CD, and γ-CD
respectively. Table 2.2 summarizes the most important structural features of α-, β-, and γ-
cyclodextrin.
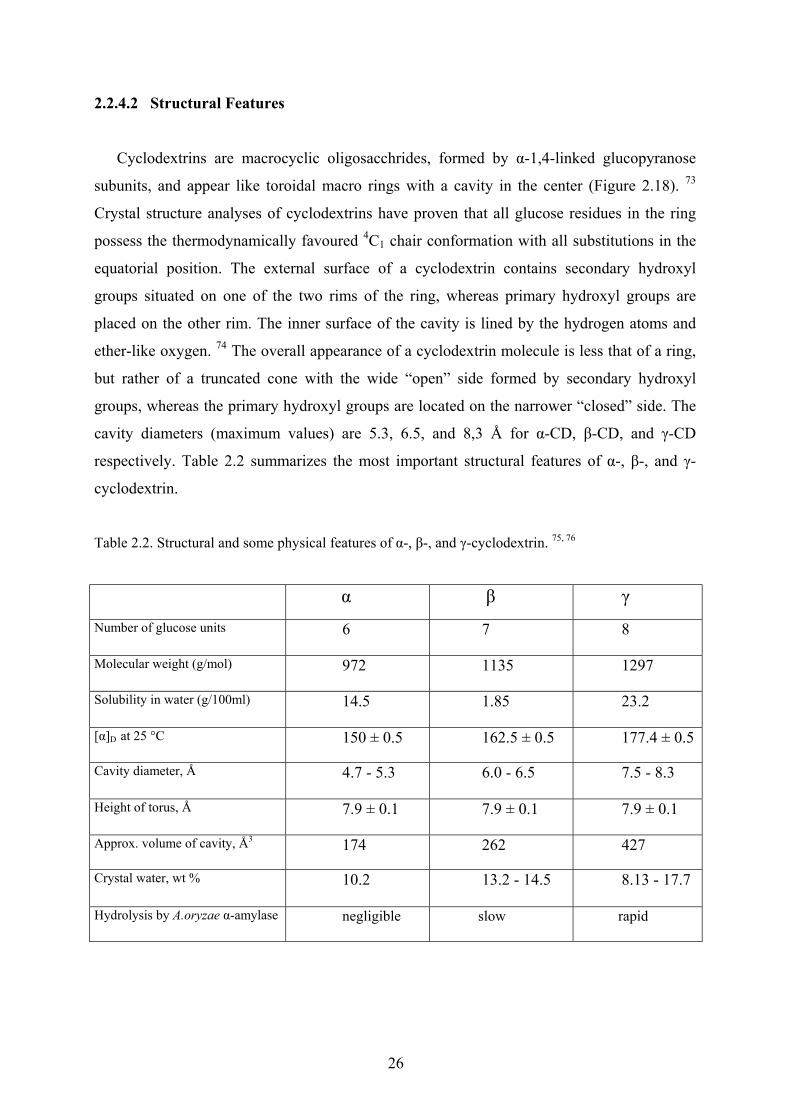
Table 2.2. Structural and some physical features of α-, β-, and γ-cyclodextrin. 75, 76
α β γ Number of glucose units 6 7 8
Molecular weight (g/mol) 972 1135 1297
Solubility in water (g/100ml) 14.5 1.85 23.2
[α]D at 25 °C 150 ± 0.5 162.5 ± 0.5 177.4 ± 0.5
Cavity diameter, Å 4.7 - 5.3 6.0 - 6.5 7.5 - 8.3
Height of torus, Å 7.9 ± 0.1 7.9 ± 0.1 7.9 ± 0.1
Approx. volume of cavity, Å3 174 262 427
Crystal water, wt % 10.2 13.2 - 14.5 8.13 - 17.7
Hydrolysis by A.oryzae α-amylase negligible slow rapid
26
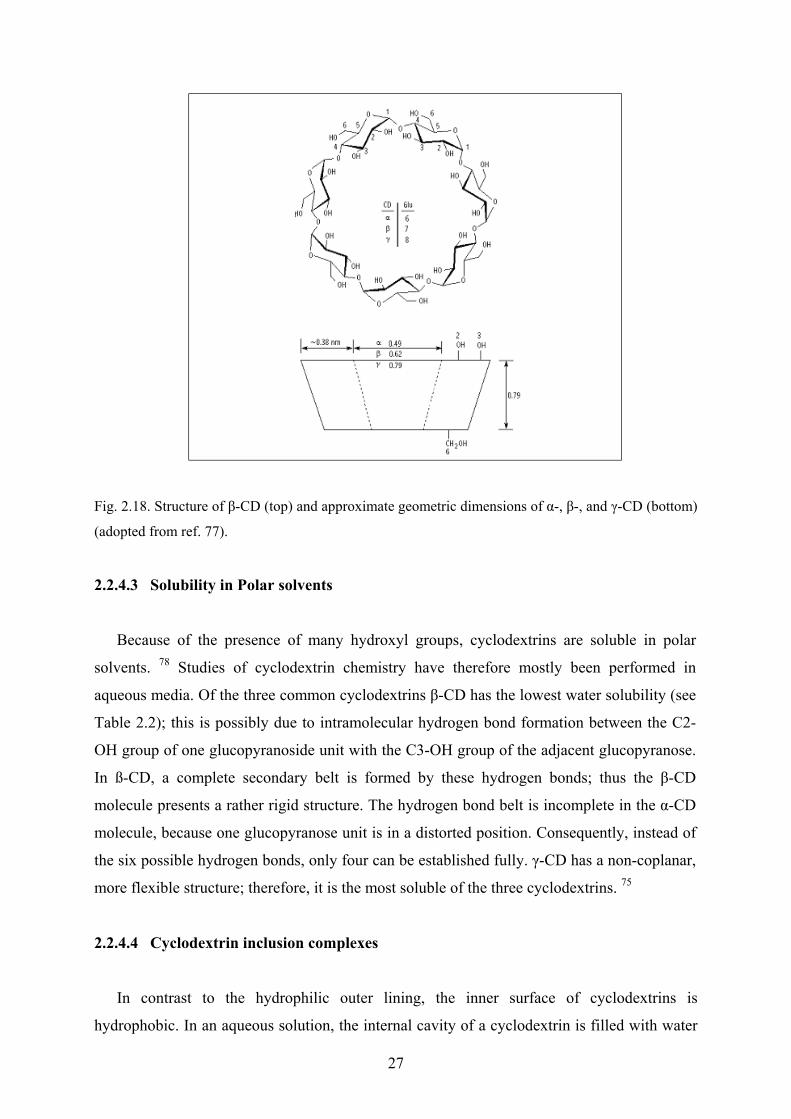
Fig. 2.18. Structure of β-CD (top) and approximate geometric dimensions of α-, β-, and γ-CD (bottom)
(adopted from ref. 77).
2.2.4.3 Solubility in Polar solvents
Because of the presence of many hydroxyl groups, cyclodextrins are soluble in polar
solvents. 78 Studies of cyclodextrin chemistry have therefore mostly been performed in
aqueous media. Of the three common cyclodextrins β-CD has the lowest water solubility (see
Table 2.2); this is possibly due to intramolecular hydrogen bond formation between the C2-
OH group of one glucopyranoside unit with the C3-OH group of the adjacent glucopyranose.
In ß-CD, a complete secondary belt is formed by these hydrogen bonds; thus the β-CD
molecule presents a rather rigid structure. The hydrogen bond belt is incomplete in the α-CD
molecule, because one glucopyranose unit is in a distorted position. Consequently, instead of
the six possible hydrogen bonds, only four can be established fully. γ-CD has a non-coplanar,
more flexible structure; therefore, it is the most soluble of the three cyclodextrins. 75
2.2.4.4 Cyclodextrin inclusion complexes
In contrast to the hydrophilic outer lining, the inner surface of cyclodextrins is
hydrophobic. In an aqueous solution, the internal cavity of a cyclodextrin is filled with water
27

molecules which are energetically unstable (polar - nonpolar interaction), and are readily
displaced by appropriate “guest molecules” which are less polar than water. 73 In this way,
aqueous solutions of cyclodextrins can form complexes with a wide range of solid, liquid, and
even gaseous guest molecules. 79 Cyclodextrins can also form inclusion compounds in the
solid state. 80 These cyclodextrin complexes have found academic as well as commercial
interest.
2.2.4.4.1 Stoichiometric ratios and driving force
There is a wide variety of guest molecules forming inclusion complexes with
cyclodextrins, ranging from dyes, 81-84 drugs, 85 small anions, 86 carboxylic acids, 87 to
alcohols. 88 Such substrates usually form inclusion complexes with 1:1 host: guest
stoichiometries; however, other stoichiometries have been reported 83, 84, 89 the most common
being 1:2. The ratio 2:1 and 2:2 have also been found 90-92 and even more complicated ones. 93
Much of the work on cyclodextrin inclusion complexes has been focused on the
determination of the formation constants of such complexes. The two main components for
the driving force of inclusion are the repulsive forces between the included water molecules
and the nonpolar cyclodextrin cavity on one hand, and between the bulk water and the
nonpolar guest molecule, on the other hand. The various published studies on cyclodextrin
chemistry indicate that the interaction forces responsible for the formation of the cyclodextrin
inclusion complexes are mainly of the type described by van der Waals-forces, 94 hydrophobic
interaction, 95, 96 strain energy of the macro cyclic ring, 97 dipolar interaction, 98 and in some
cases by hydrogen bonding. 99 Covalent bonding is inoperative in the inclusion complexes of
cyclodextrins.
2.2.4.4.2 Methods of detecting the inclusion process
By forming an inclusion complex with a guest molecule, a cyclodextrin may change some
of the physical and chemical properties of the guest molecule; by these changes the complex
formation is recognized and studied. For example, spectrophotometric determinations, 81, 84
which rely on the difference in absorptivity of the free and complexed substrate; conductance
measurements, 100, 101 which depend on the difference in mobility of the free and complexed
ionic substrate.
28
When achiral guests are inserted into the chiral cyclodextrin cavity, they may become
optically active and show strong induced Cotton effects. 102 Sometimes the maximum of the
UV absorption is shifted by several nm and fluorescence is strongly enhanced, because the
fluorescing molecule is transferred from the aqueous media into a non-polar surrounding. 103
In NMR spectra, the chemical shifts of the anistropically shielded atoms may be significantly
modified. 104
In most cases the reactivity of the included molecule in cyclodextrin cavity decreases, i.e.
the guest is stabilized, but in many cases the cyclodextrin behaves as an artificial enzyme,
accelerating various reactions and modifying reaction pathways. 105
In the solid state the guest compound is molecularly dispersed in the carbohydrate matrix
forming a microcrystalline or amorphous powder. These complexes are effectively protected
against any type of reaction, except for the cyclodextrin hydroxyl groups or reaction catalysed
by them. The sublimation and volatility of the guest molecules in the solid state are reduced to
a very low level. The analysis of x-ray data give the most reliable information about the
structure of cyclodextrin complexes. 106
2.2.4.5 Practical use of cyclodextrins
By appropriately orienting the guest molecule inside the cavity cyclodextrins can act as
catalysts in chemical reactions such as hydrolysis and oxidation. 105, 107
The major part of research papers on cyclodextrins, almost 25 %, deals with their
pharmaceutical applications. 108 Many drug molecules are ideal as guest molecules for
cyclodextrins, because their polarity, molecular mass, and structure enable them to get
included into the cyclodextrin cavity. The inclusion of drugs in cyclodextrins can enhance
drug solubility, an important aspect since the majority of drug molecules is poorly soluble in
water. Also, complexation retards evaporation and may cover bad taste. 74 Cyclodextrin can
also be used to mask or eliminate unpleasant odours and provide protection against oxidation
and proteolysis. 109 Biologically active molecules can be fundamentally modified in their
action if administered in an encapsulated molecular form. 110
Cyclodextrins are widely used in food, cosmetic, and toiletry production. 70 % of all
cyclodextrins produced are used in this field; 111 at the same time only 7 % of cyclodextrin
related research papers are dedicated this field. There are some applications of cyclodextrins
in pesticide formulation. The effects that can be obtained in this area are essentially the same
as in the drug formulation, viz. enhancement of stability, absorption and persistency. 75
29
In analytical chemistry cyclodextrins are mainly used in gas chromatography, 111 high-
performance liquid chromatography, 112 and capillary zone electrophoresis in order to separate
drug molecules, especially chiral isomers. The mechanism of the separation is based on the
different binding constants of the isomers with cyclodextrins. 113, 114
2.2.4.6 Cyclodextrin derivatives
The natural cyclodextrins form the basis for a practically unlimited number of derivatives,
because of the many hydroxyl groups (both of the primary and secondary types) in the
macromolecule. These groups are the most common reaction sites and have been extensively
derivatized. Cyclodextrins are derivatized mainly in order to modify the complex solubility,
complex properties (stability constants, guest selectivities), or to introduce groups with
specific functions (e.g. catalytic). For example, methylated cyclodextrins in general exhibit
greater stability than their parent cyclodextrins. Methylation also increases solubility,
presumability by affecting the distribution of the hydrogen bond system (as mentioned
before). Increased solubility by appropriate substitution is also well exemplified by the
hydroxypropyl, acetyl, and sulfopropyloxy derivatives. 76 Among the three main
cyclodextrins, β-cyclodextrin is the least soluble in water, which reduces its use both as
solubilizing agent and carrier of drugs or other organic compounds; therefore most of the
cyclodextrin derivatives known presently are derived from β-cyclodextrin.
Cyclodextrin derivatives might be classified as to type, polarity, and the size of the
substituents. The use of cyclodextrin derivatives is limited, because they are usually obtained
by complicated syntheses that increase the price of the new products. 108 As for
pharmaceutical application, the optimum cyclodextrin derivative used as parental drug carrier
should be cheep, highly soluble in water, available in high purity, non-toxic, stable during
heat sterilization and storing in aqueous solution, and non reacting with cholesterol and
phospholipids (and other cell-membrane compounds). This ideal cyclodextrin derivative does
not yet exist. 108
2.2.4.7 Cyclodextrins and induced circular dichroism
Most of the molecules that are used as guest molecules in the inclusion process like
cyclodextrins are achiral. In the chiral environment of a cyclodextrin these molecules can
exhibit induced circular dichroism (ICD), which is widely applied to obtain important
30
information about the complex structure. Based on the Kirkwood-Tinoco theory of
polarizabilities the following rule was developed for the cyclodextrin environment: 102 if the
transition dipole moment of the guest chromophore is aligned parallel to the axis of symmetry
of the cyclodextrin (that is, the rotational axis of the cyclodextrin cavity), then the sign of the
ICD Cotton effect for that transition will be positive, whereas if the moment axis is aligned
perpendicular to the cavity axis, the ICD sign will be negative. This rule applies to a
chromophore that resides inside the cavity; if the chromophore is located outside the cavity,
the signs of the ICD are opposite to this. 115 The strength of the ICD may be affected by the
cyclodextrin conformational flexibility (deviations from radial symmetry). 116
2.2.4.8 Cyanine dye complexes
The formation of inclusion complexes between organic dyes and cyclodextrins has been
the focus of many studies, mostly with emphasis on the thermodynamics and kinetics of the
inclusion process. The thermodynamic parameters give a macroscopic picture of the inclusion
process while its details are revealed by the kinetic data. The literature on cyclodextrin–dye
inclusion complexes has many categories. For example, studies include the binding of
cyclodextrins with an organic dye whose structure contains the azo linkage (–N=N–). 91,117-119
Other type of organic dyes that have been used as suitable guest molecules in the
complexation reaction with cyclodextrins are cyanine dyes. Circular dichroism spectroscopy
has been used to study the effect of β- and γ-cyclodextrin on the aggregation process of
different oxacarbocyanines (DOC, DODC, and DOTC, corresponding to the carbo-, dicarbo-,
and tricarbocyanine, respectively) at different dye concentrations and temperatures. 6 The
conclusion of this study, among others, was that DOTC in the presence of β-cyclodextrin
forms a dimeric aggregate regardless of temperature and concentration, while with γ-
cyclodextrin the n-mer (n>2) is formed instead. For DOC the observed aggregate depends on
the concentration of the dye; in both β- and γ-cyclodextrin the monomer, dimer and n-mer are
observed, though the latter appears only at very low temperature. DODC gives a more
complex picture. While for β-cyclodextrin all three species are observed, for γ-cyclodextrin, a
temperature and concentration dependent equilibrium between the dimer and the n-mer is
found, that is not manifest in the UV at all.
31
2.3 Surfactants
Surfactants, a contraction of surface-active agents, are organic substances which have the
tendency to concentrate at the surface or any interface of a system at low concentration,
thereby significantly reducing the amount of work required to expand the interface.
(Detergents, a term which is often used interchangeably with surfactant, refers to a
combination of surfactants and other substances, organic or inorganic, formulated to enhance
functional performance, specifically cleaning). Surfactants are considered amphipathic
solutes, with their typical head-to-head / tail-to-tail ordering observed at the surface and also
in bulk of the solvent as a result of physical interactions among the molecules. These
structures may mimic biological structures, such as enzymes and membranes, which have
vital importance in biochemical reactions and play a role in a variety of functions in the life of
the cell, respectively. A whole new field of mimetic chemistry has grown around this concept,
and colloidal structures formed by surfactants are at the centre of the entire subject. 120, 121
2.3.1 Properties and classification
Surfactants have a characteristic molecular structure consisting of a lyophobic group that
has very little attraction for the solvent, and a lyophilic group that is strongly attracted by the
solvent; this combination is known as an “amphipathic” structure. With reference to the
solvent water, the lyophobic (or hydrophobic) group of a surfactant is usually a long-chain
hydrocarbon residue, and the lyophilic (or hydrophilic) head group an ionic or highly polar
group. In the bulk of the solvent, a surfactant molecule increases the free energy of the system
due to the distortion of the solvent liquid structure. In this case less work is needed to bring
molecules to the surface, and the surfactant concentrates at the surface. The surfactant is said
to be surface-active because it lowers the surface tension γ.
The classification of surfactants depends on the nature of their hydrophilic group, which
can be anionic, cationic, neutral, or zwitterionic (amphoteric). Anionic surfactants include
carboxylates, sulfonates, sulfates, or phosphates as solubilizing group, cationic surfactants are
solubilized by amine and ammonium groups. Ethylene oxide chains and hydroxyl groups are
the solubilizing groups in non-ionic surfactants, and zwitterionic surfactants are solubilized by
combinations of anionic and cationic solubilizing groups. The hydrophobic part of a
surfactant may consist of one or several hydrocarbon chains containing from 8 to 20 carbon
atoms; the chains may be saturated or unsaturated, linear or branched and they may contain
hetero (oxygen) atoms, aromatic rings, amides, esters, or other functional groups. 122 Table 2.3
32
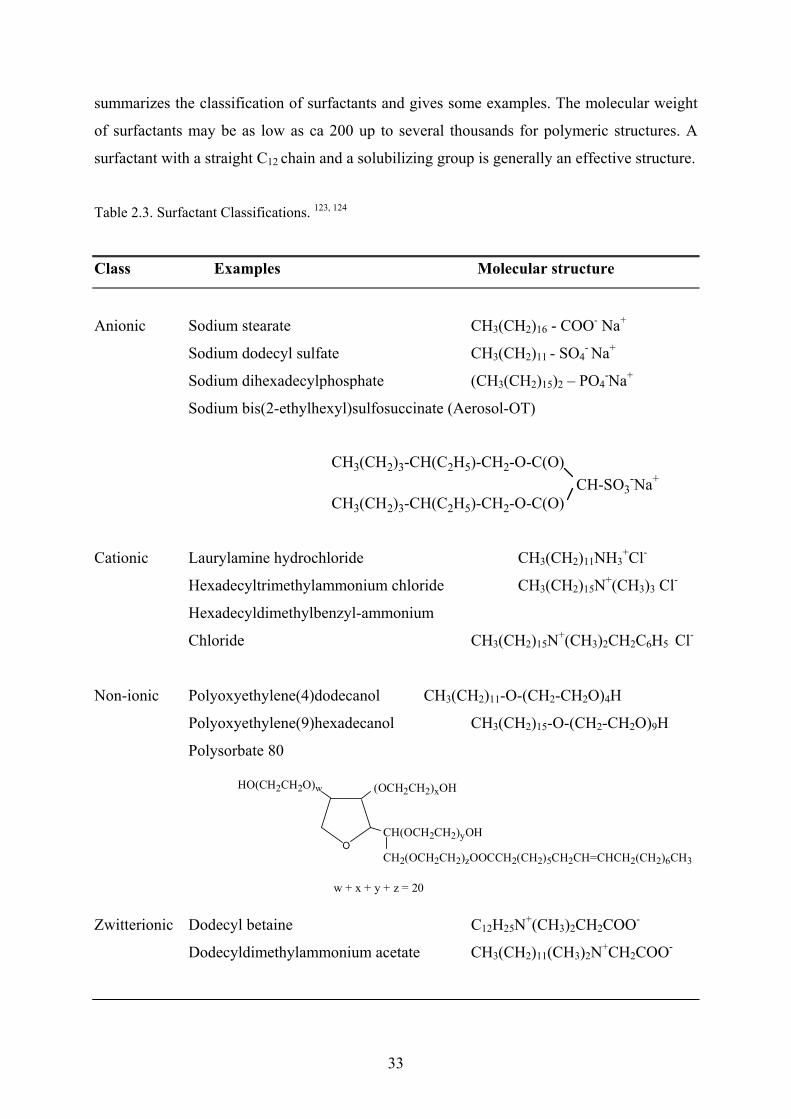
summarizes the classification of surfactants and gives some examples. The molecular weight
of surfactants may be as low as ca 200 up to several thousands for polymeric structures. A
surfactant with a straight C12 chain and a solubilizing group is generally an effective structure.
Table 2.3. Surfactant Classifications. 123, 124
Class Examples Molecular structure
Anionic Sodium stearate CH3(CH2)16 - COO- Na+
Sodium dodecyl sulfate CH3(CH2)11 - SO4- Na+
Sodium dihexadecylphosphate (CH3(CH2)15)2 – PO4-Na+
Sodium bis(2-ethylhexyl)sulfosuccinate (Aerosol-OT)
CH3(CH2)3-CH(C2H5)-CH2-O-C(O)
CH3(CH2)3-CH(C2H5)-CH2-O-C(O)CH-SO3
-Na+
Cationic Laurylamine hydrochloride CH3(CH2)11NH3+Cl-
Hexadecyltrimethylammonium chloride CH3(CH2)15N+(CH3)3 Cl-
Hexadecyldimethylbenzyl-ammonium
Chloride CH3(CH2)15N+(CH3)2CH2C6H5 Cl-
Non-ionic Polyoxyethylene(4)dodecanol CH3(CH2)11-O-(CH2-CH2O)4H
Polyoxyethylene(9)hexadecanol CH3(CH2)15-O-(CH2-CH2O)9H
Polysorbate 80
O
HO(CH2CH2O)w (OCH2CH2)xOH
CH(OCH2CH2)yOH
CH2(OCH2CH2)zOOCCH2(CH2)5CH2CH=CHCH2(CH2)6CH3
w + x + y + z = 20 Zwitterionic Dodecyl betaine C12H25N+(CH3)2CH2COO-
Dodecyldimethylammonium acetate CH3(CH2)11(CH3)2N+CH2COO-
33
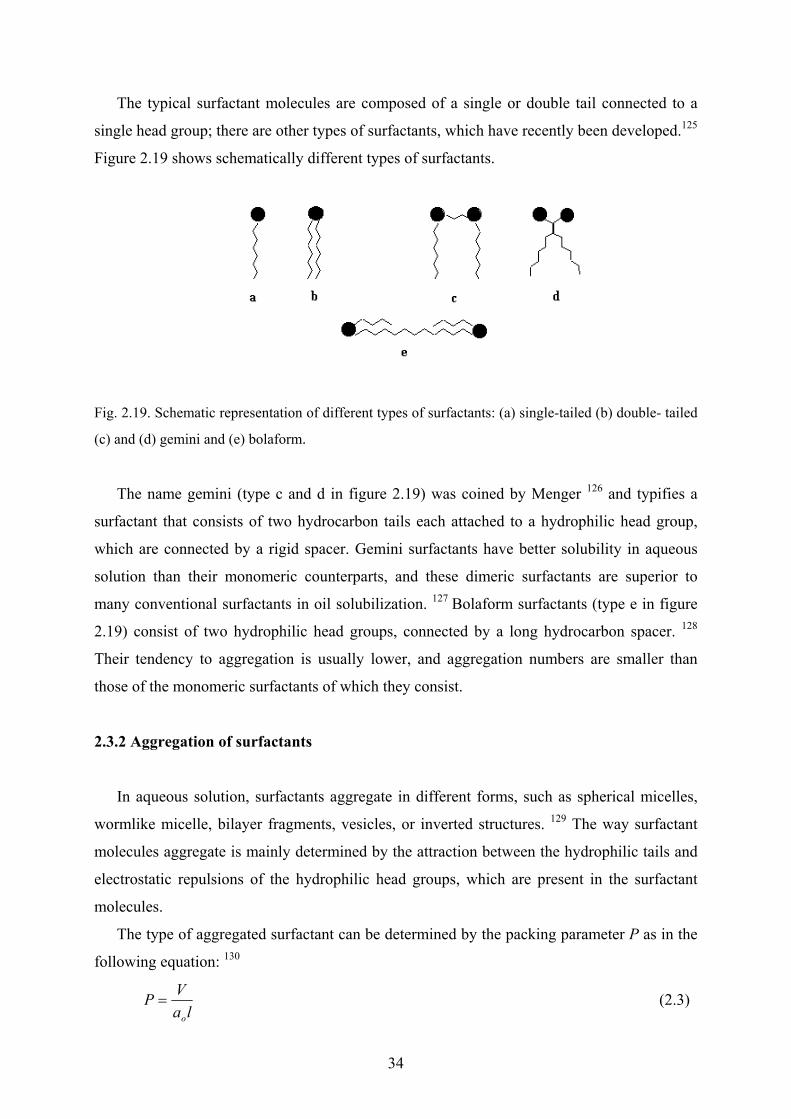
The typical surfactant molecules are composed of a single or double tail connected to a
single head group; there are other types of surfactants, which have recently been developed.125
Figure 2.19 shows schematically different types of surfactants.
Fig. 2.19. Schematic representation of different types of surfactants: (a) single-tailed (b) double- tailed
(c) and (d) gemini and (e) bolaform.
The name gemini (type c and d in figure 2.19) was coined by Menger 126 and typifies a
surfactant that consists of two hydrocarbon tails each attached to a hydrophilic head group,
which are connected by a rigid spacer. Gemini surfactants have better solubility in aqueous
solution than their monomeric counterparts, and these dimeric surfactants are superior to
many conventional surfactants in oil solubilization. 127 Bolaform surfactants (type e in figure
2.19) consist of two hydrophilic head groups, connected by a long hydrocarbon spacer. 128
Their tendency to aggregation is usually lower, and aggregation numbers are smaller than
those of the monomeric surfactants of which they consist.
2.3.2 Aggregation of surfactants
In aqueous solution, surfactants aggregate in different forms, such as spherical micelles,
wormlike micelle, bilayer fragments, vesicles, or inverted structures. 129 The way surfactant
molecules aggregate is mainly determined by the attraction between the hydrophilic tails and
electrostatic repulsions of the hydrophilic head groups, which are present in the surfactant
molecules.
The type of aggregated surfactant can be determined by the packing parameter P as in the
following equation: 130
laVP
o
= (2.3)
34
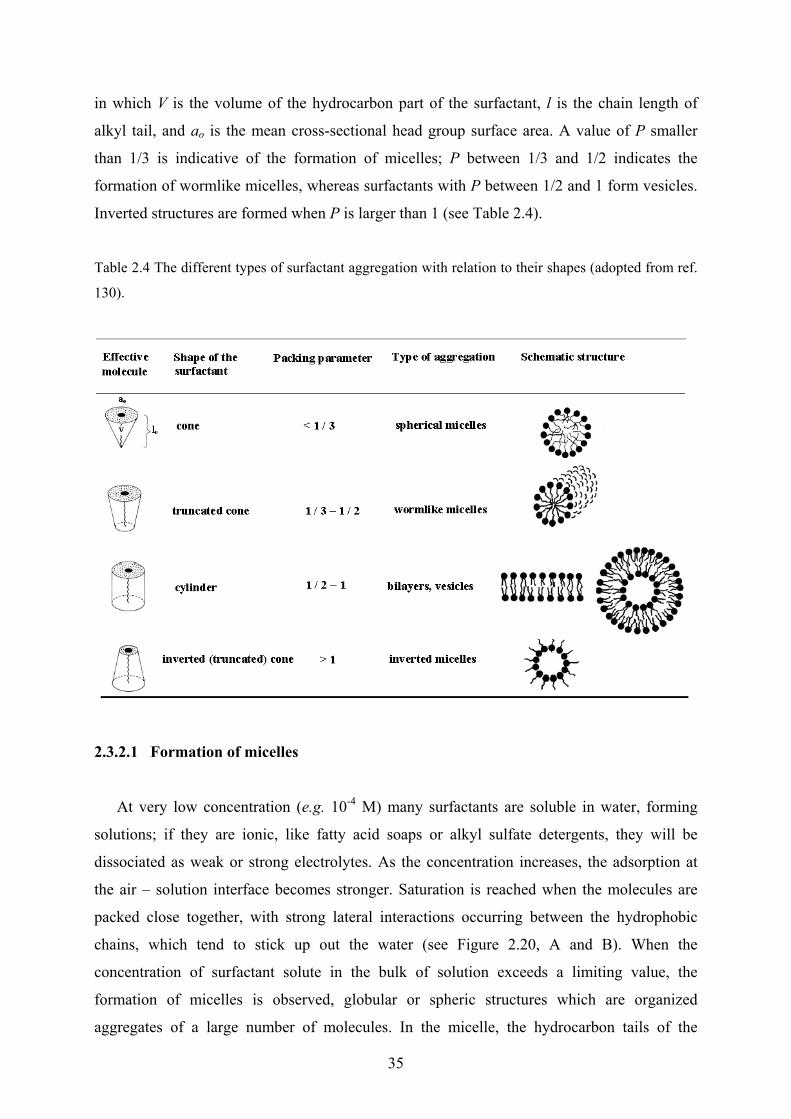
in which V is the volume of the hydrocarbon part of the surfactant, l is the chain length of
alkyl tail, and ao is the mean cross-sectional head group surface area. A value of P smaller
than 1/3 is indicative of the formation of micelles; P between 1/3 and 1/2 indicates the
formation of wormlike micelles, whereas surfactants with P between 1/2 and 1 form vesicles.
Inverted structures are formed when P is larger than 1 (see Table 2.4).
Table 2.4 The different types of surfactant aggregation with relation to their shapes (adopted from ref.
130).
2.3.2.1 Formation of micelles
At very low concentration (e.g. 10-4 M) many surfactants are soluble in water, forming
solutions; if they are ionic, like fatty acid soaps or alkyl sulfate detergents, they will be
dissociated as weak or strong electrolytes. As the concentration increases, the adsorption at
the air – solution interface becomes stronger. Saturation is reached when the molecules are
packed close together, with strong lateral interactions occurring between the hydrophobic
chains, which tend to stick up out the water (see Figure 2.20, A and B). When the
concentration of surfactant solute in the bulk of solution exceeds a limiting value, the
formation of micelles is observed, globular or spheric structures which are organized
aggregates of a large number of molecules. In the micelle, the hydrocarbon tails of the
35
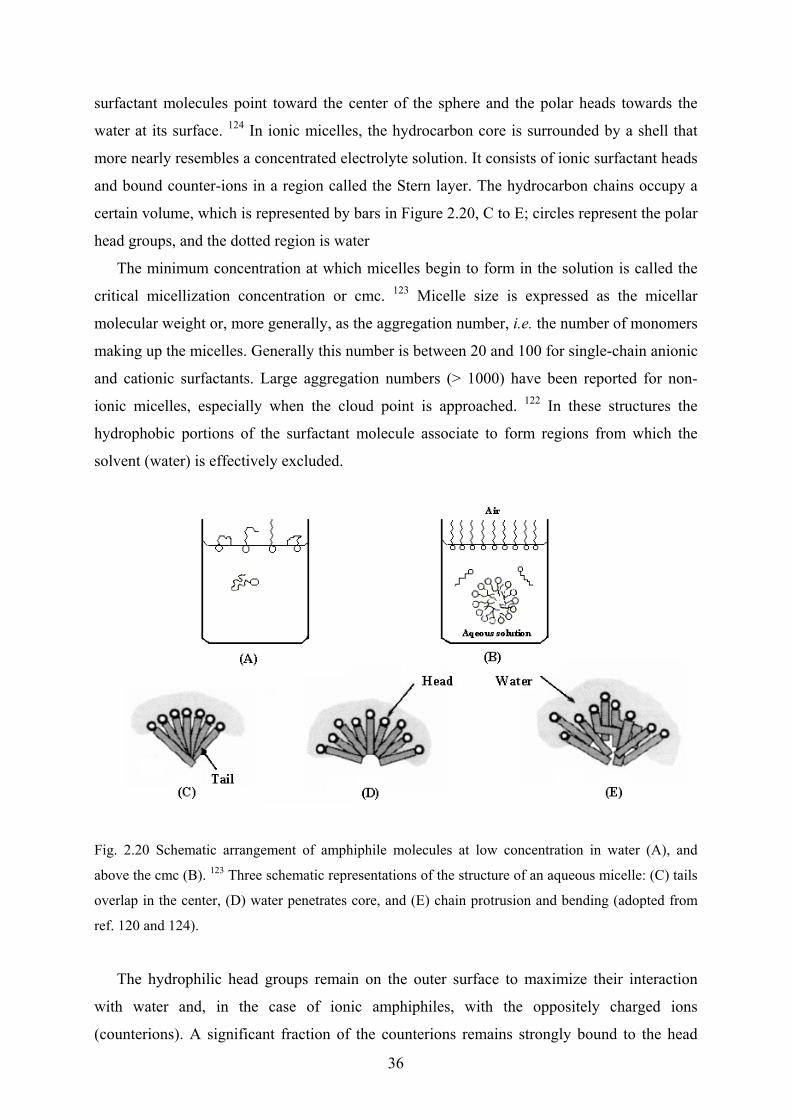
surfactant molecules point toward the center of the sphere and the polar heads towards the
water at its surface. 124 In ionic micelles, the hydrocarbon core is surrounded by a shell that
more nearly resembles a concentrated electrolyte solution. It consists of ionic surfactant heads
and bound counter-ions in a region called the Stern layer. The hydrocarbon chains occupy a
certain volume, which is represented by bars in Figure 2.20, C to E; circles represent the polar
head groups, and the dotted region is water
The minimum concentration at which micelles begin to form in the solution is called the
critical micellization concentration or cmc. 123 Micelle size is expressed as the micellar
molecular weight or, more generally, as the aggregation number, i.e. the number of monomers
making up the micelles. Generally this number is between 20 and 100 for single-chain anionic
and cationic surfactants. Large aggregation numbers (> 1000) have been reported for non-
ionic micelles, especially when the cloud point is approached. 122 In these structures the
hydrophobic portions of the surfactant molecule associate to form regions from which the
solvent (water) is effectively excluded.
Fig. 2.20 Schematic arrangement of amphiphile molecules at low concentration in water (A), and
above the cmc (B). 123 Three schematic representations of the structure of an aqueous micelle: (C) tails
overlap in the center, (D) water penetrates core, and (E) chain protrusion and bending (adopted from
ref. 120 and 124).
The hydrophilic head groups remain on the outer surface to maximize their interaction
with water and, in the case of ionic amphiphiles, with the oppositely charged ions
(counterions). A significant fraction of the counterions remains strongly bound to the head
36
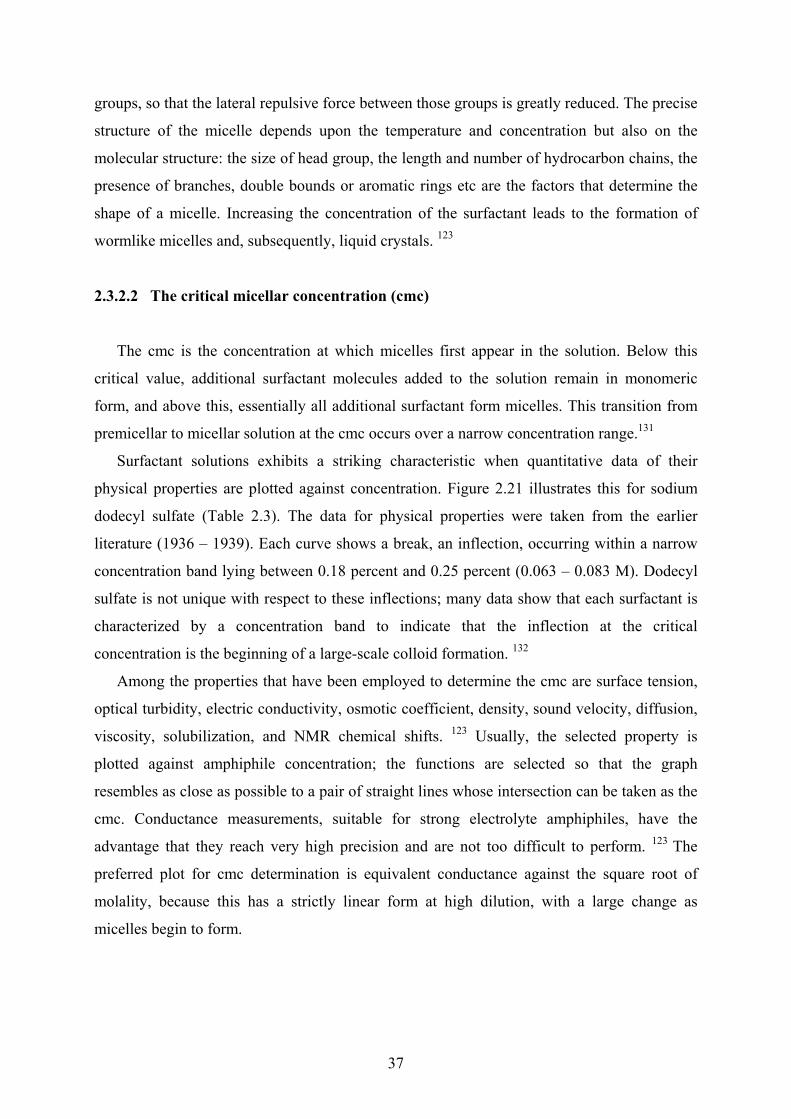
groups, so that the lateral repulsive force between those groups is greatly reduced. The precise
structure of the micelle depends upon the temperature and concentration but also on the
molecular structure: the size of head group, the length and number of hydrocarbon chains, the
presence of branches, double bounds or aromatic rings etc are the factors that determine the
shape of a micelle. Increasing the concentration of the surfactant leads to the formation of
wormlike micelles and, subsequently, liquid crystals. 123
2.3.2.2 The critical micellar concentration (cmc)
The cmc is the concentration at which micelles first appear in the solution. Below this
critical value, additional surfactant molecules added to the solution remain in monomeric
form, and above this, essentially all additional surfactant form micelles. This transition from
premicellar to micellar solution at the cmc occurs over a narrow concentration range.131
Surfactant solutions exhibits a striking characteristic when quantitative data of their
physical properties are plotted against concentration. Figure 2.21 illustrates this for sodium
dodecyl sulfate (Table 2.3). The data for physical properties were taken from the earlier
literature (1936 – 1939). Each curve shows a break, an inflection, occurring within a narrow
concentration band lying between 0.18 percent and 0.25 percent (0.063 – 0.083 M). Dodecyl
sulfate is not unique with respect to these inflections; many data show that each surfactant is
characterized by a concentration band to indicate that the inflection at the critical
concentration is the beginning of a large-scale colloid formation. 132
Among the properties that have been employed to determine the cmc are surface tension,
optical turbidity, electric conductivity, osmotic coefficient, density, sound velocity, diffusion,
viscosity, solubilization, and NMR chemical shifts. 123 Usually, the selected property is
plotted against amphiphile concentration; the functions are selected so that the graph
resembles as close as possible to a pair of straight lines whose intersection can be taken as the
cmc. Conductance measurements, suitable for strong electrolyte amphiphiles, have the
advantage that they reach very high precision and are not too difficult to perform. 123 The
preferred plot for cmc determination is equivalent conductance against the square root of
molality, because this has a strictly linear form at high dilution, with a large change as
micelles begin to form.
37
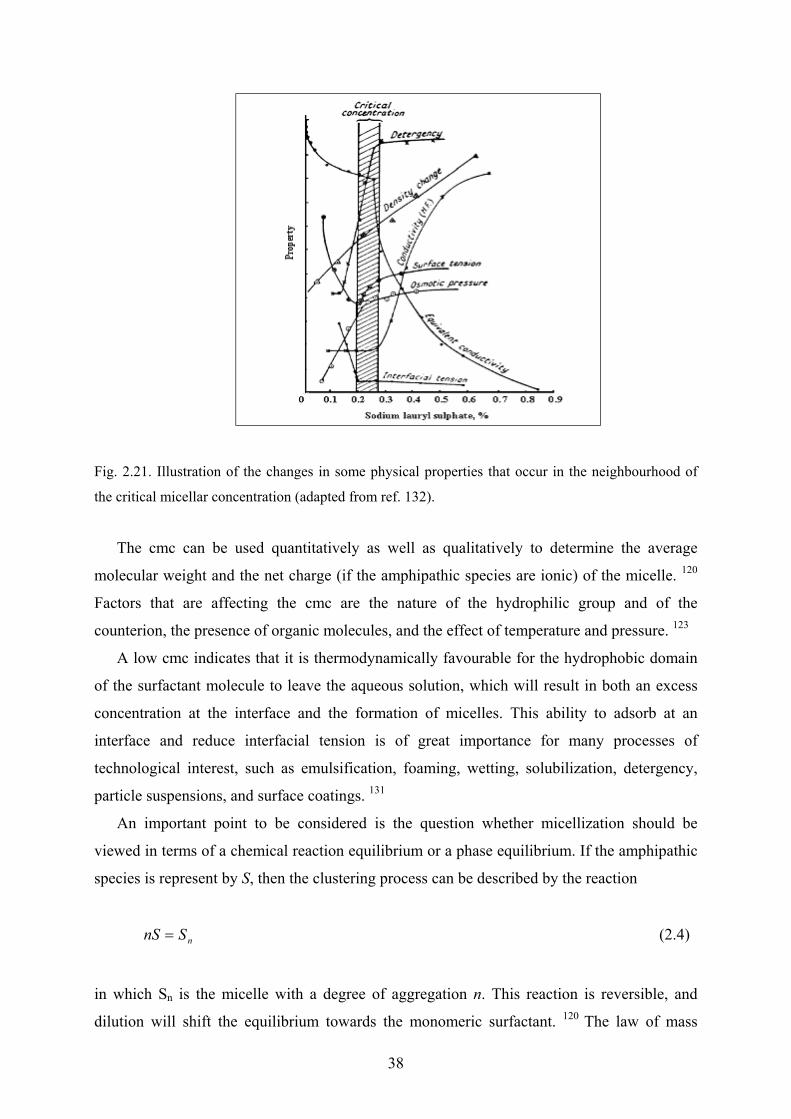
Fig. 2.21. Illustration of the changes in some physical properties that occur in the neighbourhood of
the critical micellar concentration (adapted from ref. 132).
The cmc can be used quantitatively as well as qualitatively to determine the average
molecular weight and the net charge (if the amphipathic species are ionic) of the micelle. 120
Factors that are affecting the cmc are the nature of the hydrophilic group and of the
counterion, the presence of organic molecules, and the effect of temperature and pressure. 123
A low cmc indicates that it is thermodynamically favourable for the hydrophobic domain
of the surfactant molecule to leave the aqueous solution, which will result in both an excess
concentration at the interface and the formation of micelles. This ability to adsorb at an
interface and reduce interfacial tension is of great importance for many processes of
technological interest, such as emulsification, foaming, wetting, solubilization, detergency,
particle suspensions, and surface coatings. 131
An important point to be considered is the question whether micellization should be
viewed in terms of a chemical reaction equilibrium or a phase equilibrium. If the amphipathic
species is represent by S, then the clustering process can be described by the reaction
nSnS = (2.4)
in which Sn is the micelle with a degree of aggregation n. This reaction is reversible, and
dilution will shift the equilibrium towards the monomeric surfactant. 120 The law of mass
38
action implies that a continuous distribution of species – monomers, dimers, trimers, etc.
should be present. Increasing the surface concentration should shift the equilibrium in a
reaction as follows to the right,
n
SSSSSSSS ⋅⋅⋅⋅⋅==== 4322 (2.5)
but the observed transition from monomers to n-mers with n > 50 is not expected.
Experimentally, large micelles do form sharply at the cmc in aqueous solutions, and to a good
approximation the concentration of monomeric surfactant in solution varies little above the
cmc. This type of behaviour is typical of a phase equilibrium (equation 2.4). Energetically,
some minimum value of n is apparently necessary before the exclusion of hydrophobic tails
from the aqueous medium is effective. Once the solution is concentrated enough for
aggregates with this critical n value to be formed, any additional surfactant added to the
solution goes into the micelle.
In aqueous systems the phase equilibrium model is generally used. Since a degree of
approximation is introduced by using the phase equilibrium model to describe micellization,
micelles are sometimes called pseudophases. 120
2.3.3 Surfactant – dye interactions
The solubility of a dye is related to the polarity of solvent in which it is to be dissolved.
The addition of surfactant to the aqueous solution of a dye is usually accompanied by
structural changes of the dye, which can be noted from spectral measurements. Upon
increasing the surfactant concentration, the absorption spectrum of a dye behaves as if the dye
molecules were dissolved in a non-polar solvent. Thus, dyes are often used to determine the
cmc of surfactants, e.g. pinacyanol chloride, 133-135 bromophenol blue, 136 and pyrene. 137 It
was suggested that, when using charged dyes, its ionic charge should be similar to the charge
of surfactant. 138 The cmc’s determined by the dye solubilization method are usually lower
than those measured in the absence of dyes indicating that the dye can partly substitute the
surfactant molecules. The absorption spectrum of a dye often changes at concentration far
below the cmc of the surfactants when the charges of the ionic groups of surfactant and dye
are opposite. 133, 138 For example, methyl orange has been widely studied in this respect. 138-141
This azo dye shows aggregation with the appearance of a new band in its absorption spectrum
which is blue shifted by about 80 nm with respected to the absorption band in aqueous
39
solution. This band is similar to that of the dye in the presence of small amounts of cationic
polymers. 140, 142
Sodium bis(2-ethylhexyl) sulfosuccinate (sold under the name Aerosol-OT or AOT for
short) is a surfactant with two hydrophobic tails (Figure 2.22). This molecule has three
asymmetric carbon atoms, one of them adjacent to the sulfonate group, which makes this
group optically active and may induce chirality in achiral cationic molecules (e.g. dyes) bound
to it. These cations play a major role in the aggregation of anionic surfactants (e.g. Aerosol-
OT); even below the cmc cationic dyes may act as mutual counterion to reduce the
electrostatic repulsion between the sulfonate
Fig. 2.22. Molecular structure of Sodium bis(2-ethylhexyl) sulfosuccinate (Aerosol-OT).
Assymetric carbon atomes are denoted by a star.
Pal and Pal 143 have shown that Aerosol-OT induces strong dichroism in the cationic dye
pinacyanol; this was the first report of the induction of circular dichroism in a cationic dye by
Aerosol-OT in dilute aqueous solution, or by any detergent in general. By conductometric
titration a 1:1 electrostatic binding between the cationic dye and Aerosol-OT was observed.
At this ratio the intensities of the circular dichroism spectral bands are the maximum.
Surfactants can deaggregate cyanine dyes, 145 and in contrast, they can also effect the
aggregation of dye, with ion-pairing being a prerequisite for this process. 146, 147
40
3 Theoretical background
3.1 UV / VIS Spectrophotometry
At room temperature most molecules will be in their electronic and vibrational ground
states. In ultraviolet and visible (UV/Vis) spectroscopy, a molecule will absorb light and
undergoes a transition from the ground to an excited state. This occurs if, in the interaction
between the electromagnetic radiation and the molecule, the energy of a quantum of light is
equal to the energy difference between the excited and ground states of the molecule. Thus,
the following relation has to hold:
∆E = Ef – Ei = hν (3.1)
Ef and Ei are the final and initial molecular energy levels in the molecule, h is the Planck
constant and ν is the frequency of the light absorbed.
Regardless of the type of transition, not all light of the correct energy is absorbed by a sample
of molecules. Empirically, the fraction of light absorbed by a sample follows Beer’s law. If Io
is the intensity of the light entering the sample and I is the intensity of the light emerging from
the sample, then
( ) clII ⋅⋅= ε0log (3.2)
c and l are the concentration and the path length of the sample respectively, ε is the constant
of proportionality, also known as the extinction coefficient. The quantity log (Io/I) is known as
the optical density (OD) or the absorbance (A). Both the absorbance and extinction coefficient
depend on the wavelength of the light, i.e.
( ) ( ) clA ⋅⋅= λελ (3.3)
The extinction coefficient, which characterizes the absorption process, is an empirical
measure of the fraction of light absorbed by the molecule as a function of wavelength. By
convention, the concentration c is measured in mole/liter and the path length l in centimetres.
Since logarithms are unitless, the extinction coefficient has the dimension liter/(mole.cm). For
polymers the concentration is calculated per mole of monomeric unit.
41

During the short time of excitation, the movement of the excited electron creates an
instantaneous dipole or polarization of charge called the electric dipole transition moment .
The intensity of the absorption depends on the size of this electric transition moment, which
can be defined quantum-mechanically and computed as a vector quantity (equation 4 and 5)
with both a direction (orientation) and a magnitude (intensity) that vary according to the
nature of particular transition and the chromophore involved:
µ
fΨ µ̂ iΨ=rµ (3.4)
µ = e (3.5) ˆ rr
where Ψi and Ψf are the wave functions of the initial and the final electronic state. The product
of these wavefunctions is the transition density, which is a measure of the shift of the electron
density, which follows the excitation. Multiplied by the electric dipole moment operator µ
this gives the electric transition moment µ .
ˆr
The magnitude of an absorption band is usually characterized by the maximum value of
the extinction coefficient, εmax at the corresponding wavelength λmax. However, a more
quantitative measure is the area Ai under the whole absorption band:
Ai = ∫2
1
)(ν
ν
ννε d (3.6)
This integrated absorption Ai, is an experimental measure of an absorption band (see Figure
3.1). It can be approximated using the following relation:
Ai = εmax . N½ (3.7)
where N½ is the half width (in cm-1) of the absorbance band.
42
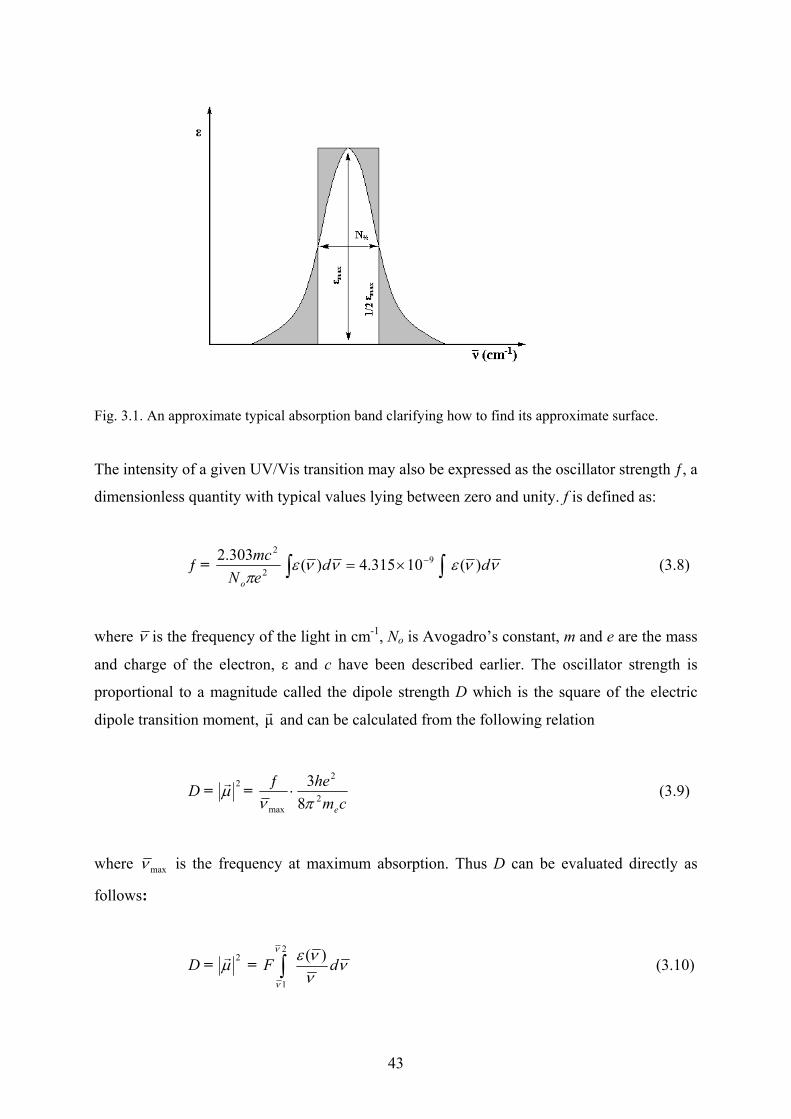
Fig. 3.1. An approximate typical absorption band clarifying how to find its approximate surface.
The intensity of a given UV/Vis transition may also be expressed as the oscillator strength ƒ, a
dimensionless quantity with typical values lying between zero and unity. f is defined as:
ƒ = ννεννεπ
ddeNmc
o
)(10315.4)(303.2 92
2
∫∫ −×= (3.8)
where ν is the frequency of the light in cm-1, No is Avogadro’s constant, m and e are the mass
and charge of the electron, ε and c have been described earlier. The oscillator strength is
proportional to a magnitude called the dipole strength D which is the square of the electric
dipole transition moment, and can be calculated from the following relation µr
D = 2µr =
cmhe
e2
2
max 83ƒπν
⋅ (3.9)
where maxν is the frequency at maximum absorption. Thus D can be evaluated directly as
follows:
D = 2µr = νννεν
ν
dF )(2
1∫ (3.10)
43

With
393
3
10184.98
10ln103 −×==oN
hcFπ
(3.11)
The transition dipole length r can be calculated from the square root of the dipole strength as
follows:
r = eµr
= eD (3.12)
3.2 Circular dichroism spectroscopy
Circular dichroism (CD) is observed when circularly polarized light passes through an
optically active medium, usually a solution of an optically active compound. In such a
solution the absorption coefficients of left and right circularly polarized light are slightly
different, because they travel through the medium with different velocities. A plot of the
difference of the absorption coefficient, , against the frequency ν is called a CD
spectrum. There is another effect, which is called optical rotation and results from the fact that
left and right circularly polarized light travel at different speeds in an optically active medium,
i.e. they have different indices of refraction. The difference of the refraction indices,
, plotted against the wavelength ν is called an optical rotatory dispersion or
ORD spectrum.
RL εεε −=∆
RL nnn −=∆
Most molecules of biological origin are asymmetric, i.e. they contain no element of mirror
symmetry. As a result they are not superimposable on their mirror image. Solutions of these
molecules are optically active, i.e. they show CD and ORD effects. Both effects are highly
sensitive to the configuration of the molecule, the mirror image molecule giving a mirror
image CD or ORD spectrum. Both methods are thus invaluable in assigning the absolute
configuration to a molecule of unknown geometry. The techniques are non-destructive,
require only small amounts of material, and are easily applied to molecules in solution.
3.2.1 Principle of the measurement
A CD spectrum is the difference of two absorbance spectra, one measured with left
circularly polarized light and the other one with right circularly polarized light:
44
∆ ε(ν) = εL(ν) - εR(ν) (3.13)
CD spectra can be measured as electronic circular dichroism in the spectral regions where
electronic transitions occur, i.e. in the UV/Vis regions, or as vibrational circular dichroism in
the infrared IR spectral regions. All measurements reported in this study refer to electronic
CD. The measured differences ∆ε(ν) are typically ~ 10-5 of sample absorbance.
With the usual definition for the extinction coefficient, the following relations hold:
∆ ε(ν) = Acl
∆1 (3.14)
L
R
R
o
L
oRL I
III
IIAAA 101010 logloglog =−=−=∆ (3.15)
As seen from relation (3.15), Io does not appear in this final relation, so there is no need for a
reference beam. The instruments are, therefore, of the single-beam type.
Circular dichroism causes another effect, called “ellipticity”. As light enters the cell, the
intensities of the two light rays, IoL and IoR, are identical; however, because of the effect of
optical rotation, IL ≠ IR when the rays exit the cell (see Figure 3.2). As a consequence
circularly polarized light, after passing an optically active medium like a solution containing
optically active matter, is elliptically polarized. The shape of the ellipse is mathematically
determined by the angle ψ = arc tan (b/a), in which b and a refer to the lengths of the short and
the long axis respectively and ψ is called the ellipticity of the sample. For example, an axial
ratio of 1:100 will result in an ellipticity of 0.57 degrees. Although the CD instruments
measure differential absorbance, they usually plot a CD spectrum in units of ellipticity, θ, in
millidegrees, versus λ, rather than ∆A versus λ. The conversion between these two is:
lcA ⋅⋅∆=∆ ε (3.16)
10ln180(deg)4πψ
= (3.17)
45

982.32deg)(mψ
= (3.18)
Fig. 3.2. (a) Two circularly polarized light, R and L, with their vector sum, E, always oscillating in the
same plane. (b) The right circularly polarized component is less intense (absorbed more) than the left
circularly polarized component. The electric light vector now follows an elliptical path, as shown,
corresponding to elliptically polarized light. (c) The semi major and semi minor axes of the ellipse
form a triangle and the angle opposite the semi minor axis is the angle, Ψ, the ellipticity. The major
axis of the ellipse has been rotated through the angle α, which is the effect of optical rotation.
The specific ellipticity [ψ] is defined analogous to the specific rotation:
[ψ] = lcl p ⋅
=⋅
ψρψ 100 (3.19)
where ρ is the density in g/cm3 (if the medium is a chiral liquid), cp is the concentration in
g/100cm3 (if the medium is a chiral solution), and l is the cell length in dm.
The molar ellipticity [θ] is
[θ] = 100
][ Mψ (3.20)
46
where M is the molecular weight of the optical active compound. Substituting equations
(3.17) and (3.19) into (3.20), one obtains the following expression for the molar ellipticity:
[θ] = 3298 ∆ε (3.21)
or [θ] = lc ⋅⋅10
ψ (3.22)
where [θ] is in mdeg, c is the molar concentration (mol/l), and l is the cell length in cm. CD
spectra are often reported in terms of molar ellipticity, instead of ∆ε. For interconversion
between the two scales one obtains from equations (3.21) and (3.22):
∆ε = lc ⋅
×⋅ −5100319.3ψ (3.23)
3.2.2 The rotational strength R
The dipole strength D is a measure of the strength of an absorption band in UV/Vis
spectroscopy. In a similar manner a property called the rotational strength R is defined, which
is a measure of the strength of an absorption band in a CD spectrum. Theoretically the
rotational strength is calculated as the scalar product of the electric and the magnetic
transition moment that results from the excitation of an electron from the state o to the state a:
Roa = µoa moa cos (µ,m) (3.24)
In this equation µoa and moa are the magnitudes of the electric and magnetic dipole transition
moments, while cos (µ,m) is the cosine of the angle between the two vectors. Experimentally
the rotational strength is obtained as the integrated area of a CD band multiplied by a
conversion factor:
λλε dR ∫ ⋅
∆××= − 330010696.0 42 (3.25)
47

with R in cgs-units. As an approximation a Gaussian-shaped CD curve is assumed with
maximum amplitude by ∆εmax at the wavelength λmax, which yields the following equation:
)/)((330010696.0 maxmax42 λεπ λ∆∆××= −R (3.26)
where ∆λ is the half-width (in nm) at 1/e times the height (0.368∆εmax), e is the base of the
natural logarithm, equal 2.71 (Figure 3.3).
Fig. 3.3. An approximate typical positive CD band clarifying how to apply eq. 3.26.
3.2.3 Induced Circular Dichroism
Induced circular dichroism (ICD) is the CD observed in an optically inactive (achiral)
chromophore due to its interaction with an optically active (chiral) moiety, e.g. as a result of
the complexation by a chiral host. An ordered and site-specific spatial relationship between
the achiral molecule and the chiral host is a necessary condition for the observation of this
effect, since otherwise the variable signs of the induced CD would lead to the effective
cancellation of the dichroic intensity. In principle ICD can arise through either of the two
following mechanisms: (1) An electric dipole-allowed transitions can gain CD intensity due to
coupling with other electronic dipole-allowed transitions in its surrounding, such as one or
many chirally disposed chromophores. (2) A magnetic dipole-allowed transition can gain CD
intensity due to mixing with electronic dipole-allowed transitions in the same chromophore
due to the perturbation of the electronic states by the chiral surrounding. 148
48
Originally the ICD was studied to prove that such interactions existed. Later the ICD was
used to obtain structural information about interacting species that was difficult to obtain
otherwise. The dependence of the ICD on the geometry dependent interaction between the
chromophore and the chiral host was theoretically analysed using generalized symmetry and
parity arguments. 149, 150
3.2.4 Exciton coupling and exciton chirality
Exciton coupling is one of the most sensitive spectroscopic methods for determining
molecular chirality in solution. It is easily identified in a CD spectrum and forms the basis for
a highly reliable non-empiric method for assigning the absolute configuration to a given
molecular species. 151 The theoretical analysis of exciton coupling, and the resulting
phenomenon of exciton chirality, is based on the coupled oscillator theory.
The origin of exciton coupling is the interaction of individual chromophore excitations
into delocalized excitations. Two or more chromophores may interact under certain conditions
with each other, even if there is no orbital overlap or electron exchange, when one
chromophore is electronically excited. For effective interaction the chromophores should be
similar, or have similar excitation energies, and there should be a fixed geometric disposition
between the chromophores. The chromophores can be part of the same molecule or they can
be placed on different molecules, which are in close contact. As a result of the interaction, the
individual electronic transitions become delocalized over the different chromophores attaining
new properties – energies and intensities – as a result.
Exciton coupling is manifest both in ordinary UV/Vis absorption spectroscopy and in CD
spectroscopy. Consider two identical molecular chromophores, such as two dye molecules,
arranged in-line or side-by-side, as shown in Figure 3.4, left. Interaction of the two local
transition dipoles leads to two coupled states, the excitons, of higher and lower energies,
respectively. In the higher state, the excitations are out-of-phase, with the result that their
intensity cancels. This is the forbidden excitation and cannot be seen in the spectrum.
Excitation to the lower-energy state, on the other hand, in which the excitations couple in-
phase leads to a very intense state which is seen in the spectrum as a band which is red-shifted
from the monomer absorption. If the two chromophors are arranged face-to-face (Figure 3.4,
right), the in-phase interaction leads to an allowed, blue-shifted exciton state while the out-of-
phase coupling results in a low-energy but forbidden exciton state.
49

Fig. 3.4 Orientation dependence in exciton coupling between two chromophores (rectangular boxes)
and their induced electric dipoles (represented by double- headed arrows).The solid arrows connecting
ground (G) and excited (E) states represent allowed transitions; the dashed arrows represent forbidden
transitions (adopted from ref. 152).
If the arrangement of the two chromophors is neither in-line nor parallel (Figure 3.4,
center), both states are allowed and can be seen in the spectrum as two separate bands or as a
broadened band depending on the interaction energy. This is the case which is realized when
the chromophores are chiraly disposed, whereas the cases shown in Figure 3.4 left and right
correspond to J- and H-type dye aggregates, respectively.
If the two chromophores are part of a chiral molecules such as the p-
dimethylaminobenzoate moieties of the diester shown in Figure 3.5, each of the two UV/Vis
exciton bands will have a corresponding CD band. These bands resulting from two identical
chromophores are called a CD or exciton “couplet”. The rotational strength associated with
these bands is identical but of opposite sign. As a consequence, an exciton couplet is much
easier to detect in a CD spectrum than in ordinary absorption. Also, from the relative signs of
the low and the high energy component of an exciton couplet one can deduce the relative
configuration of the two chromophores based on the so-called exciton chirality rule.
50
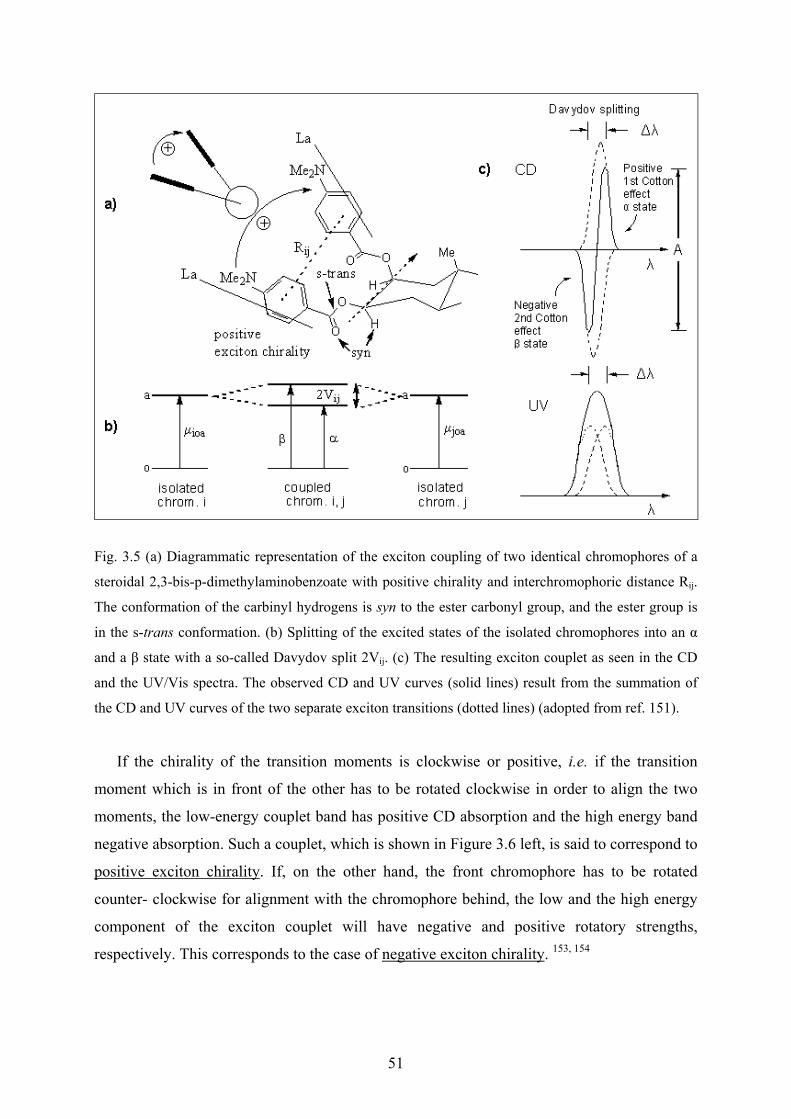
Fig. 3.5 (a) Diagrammatic representation of the exciton coupling of two identical chromophores of a
steroidal 2,3-bis-p-dimethylaminobenzoate with positive chirality and interchromophoric distance Rij.
The conformation of the carbinyl hydrogens is syn to the ester carbonyl group, and the ester group is
in the s-trans conformation. (b) Splitting of the excited states of the isolated chromophores into an α
and a β state with a so-called Davydov split 2Vij. (c) The resulting exciton couplet as seen in the CD
and the UV/Vis spectra. The observed CD and UV curves (solid lines) result from the summation of
the CD and UV curves of the two separate exciton transitions (dotted lines) (adopted from ref. 151).
If the chirality of the transition moments is clockwise or positive, i.e. if the transition
moment which is in front of the other has to be rotated clockwise in order to align the two
moments, the low-energy couplet band has positive CD absorption and the high energy band
negative absorption. Such a couplet, which is shown in Figure 3.6 left, is said to correspond to
positive exciton chirality. If, on the other hand, the front chromophore has to be rotated
counter- clockwise for alignment with the chromophore behind, the low and the high energy
component of the exciton couplet will have negative and positive rotatory strengths,
respectively. This corresponds to the case of negative exciton chirality. 153, 154
51
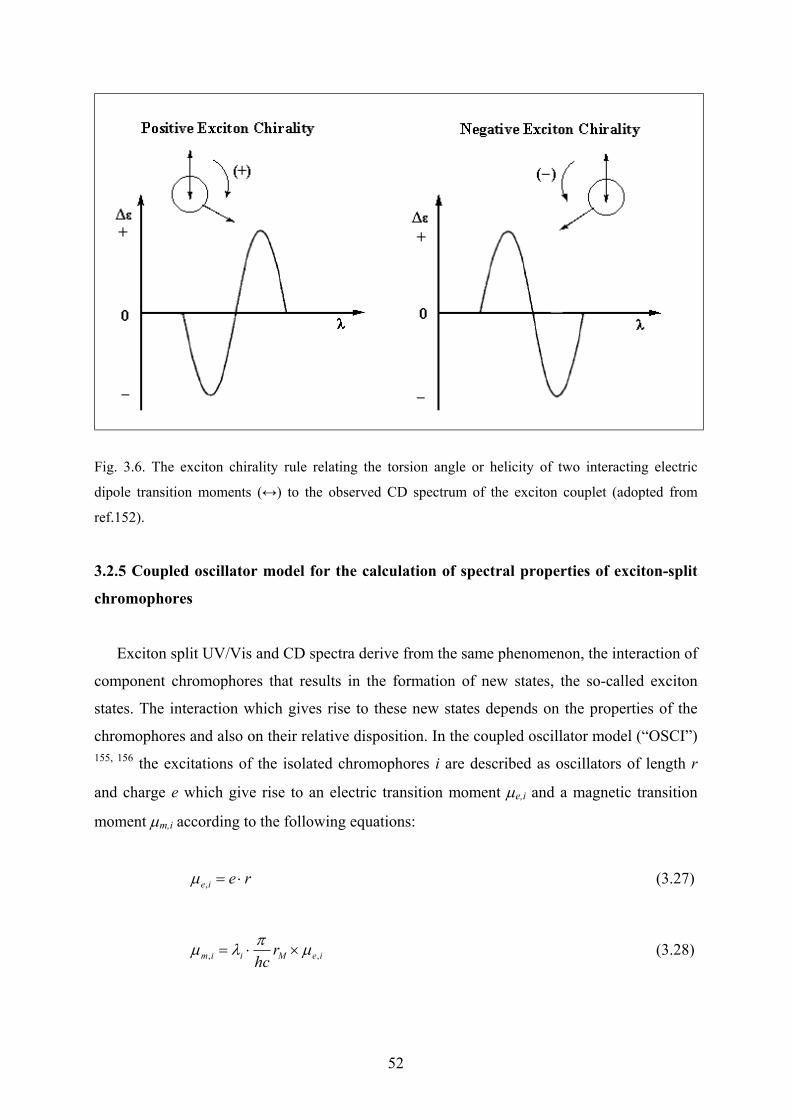
Fig. 3.6. The exciton chirality rule relating the torsion angle or helicity of two interacting electric
dipole transition moments (↔) to the observed CD spectrum of the exciton couplet (adopted from
ref.152).
3.2.5 Coupled oscillator model for the calculation of spectral properties of exciton-split
chromophores
Exciton split UV/Vis and CD spectra derive from the same phenomenon, the interaction of
component chromophores that results in the formation of new states, the so-called exciton
states. The interaction which gives rise to these new states depends on the properties of the
chromophores and also on their relative disposition. In the coupled oscillator model (“OSCI”)
155, 156 the excitations of the isolated chromophores i are described as oscillators of length r
and charge e which give rise to an electric transition moment µe,i and a magnetic transition
moment µm,i according to the following equations:
reie ⋅=,µ (3.27)
ieMiim rhc ,, µπλµ ×⋅= (3.28)
52
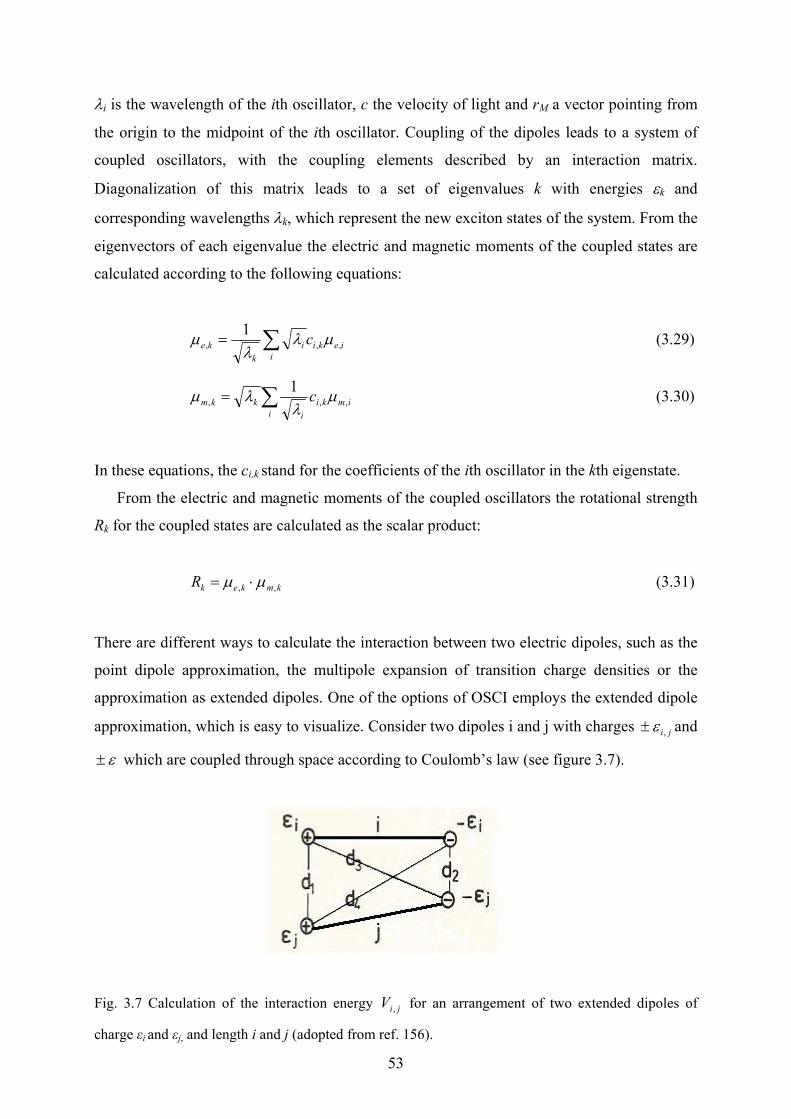
λi is the wavelength of the ith oscillator, c the velocity of light and rM a vector pointing from
the origin to the midpoint of the ith oscillator. Coupling of the dipoles leads to a system of
coupled oscillators, with the coupling elements described by an interaction matrix.
Diagonalization of this matrix leads to a set of eigenvalues k with energies εk and
corresponding wavelengths λk, which represent the new exciton states of the system. From the
eigenvectors of each eigenvalue the electric and magnetic moments of the coupled states are
calculated according to the following equations:
∑=i
iekiik
ke c ,,,1 µλλ
µ (3.29)
∑=i
imkii
kkm c ,,,1 µλ
λµ (3.30)
In these equations, the ci,k stand for the coefficients of the ith oscillator in the kth eigenstate.
From the electric and magnetic moments of the coupled oscillators the rotational strength
Rk for the coupled states are calculated as the scalar product:
kmkekR ,, µµ ⋅= (3.31)
There are different ways to calculate the interaction between two electric dipoles, such as the
point dipole approximation, the multipole expansion of transition charge densities or the
approximation as extended dipoles. One of the options of OSCI employs the extended dipole
approximation, which is easy to visualize. Consider two dipoles i and j with charges ± and
which are coupled through space according to Coulomb’s law (see figure 3.7).
ji,ε
ε±
Fig. 3.7 Calculation of the interaction energy V for an arrangement of two extended dipoles of
charge ε
ji,
i and εj, and length i and j (adopted from ref. 156).
53
The interaction energy of these two dipoles is
−−+=
4321,
11114 dddd
Vo
jiji πε
εε (3.32)
here εo is the permeability constant. One parameter which can be adjusted when using the
coupled oscillator model is the length of the dipoles representing an absorption band. Since
the integrated absorption intensity relates via the dipole strength D only to the product of
length and charge of the transition moment vector, one can use different lengths of this vector
and adjust the charge such that the correct value of is obtained. Since these adjustable
parameters affect the interaction elements V this methods, which will be applied later is of
great value to obtain a more realistic model of the system to be described.
eµ
ji ,
54
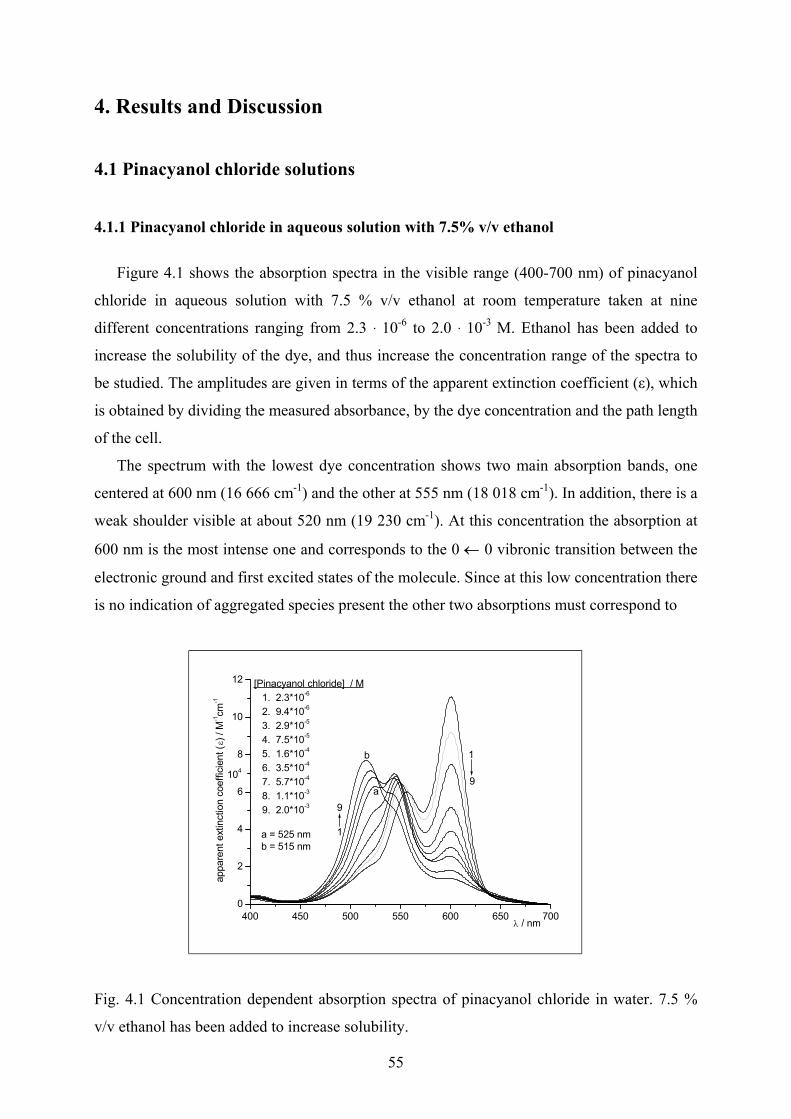
4. Results and Discussion
4.1 Pinacyanol chloride solutions
4.1.1 Pinacyanol chloride in aqueous solution with 7.5% v/v ethanol
Figure 4.1 shows the absorption spectra in the visible range (400-700 nm) of pinacyanol
chloride in aqueous solution with 7.5 % v/v ethanol at room temperature taken at nine
different concentrations ranging from 2.3 · 10-6 to 2.0 · 10-3 M. Ethanol has been added to
increase the solubility of the dye, and thus increase the concentration range of the spectra to
be studied. The amplitudes are given in terms of the apparent extinction coefficient (ε), which
is obtained by dividing the measured absorbance, by the dye concentration and the path length
of the cell.
The spectrum with the lowest dye concentration shows two main absorption bands, one
centered at 600 nm (16 666 cm-1) and the other at 555 nm (18 018 cm-1). In addition, there is a
weak shoulder visible at about 520 nm (19 230 cm-1). At this concentration the absorption at
600 nm is the most intense one and corresponds to the 0 ← 0 vibronic transition between the
electronic ground and first excited states of the molecule. Since at this low concentration there
is no indication of aggregated species present the other two absorptions must correspond to
400 450 500 550 600 650 7000
2
4
6
8
10
12
appa
rent
ext
inct
ion
coef
ficie
nt (
ε) /
M-1cm
-1
b
a
a = 525 nmb = 515 nm
9
1
9
1
[Pinacyanol chloride] / M 1. 2.3*10-6 2. 9.4*10-6 3. 2.9*10-5 4. 7.5*10-5 5. 1.6*10-4 6. 3.5*10-4 7. 5.7*10-4 8. 1.1*10-3 9. 2.0*10-3
104
λ / nm
Fig. 4.1 Concentration dependent absorption spectra of pinacyanol chloride in water. 7.5 %
v/v ethanol has been added to increase solubility.
55
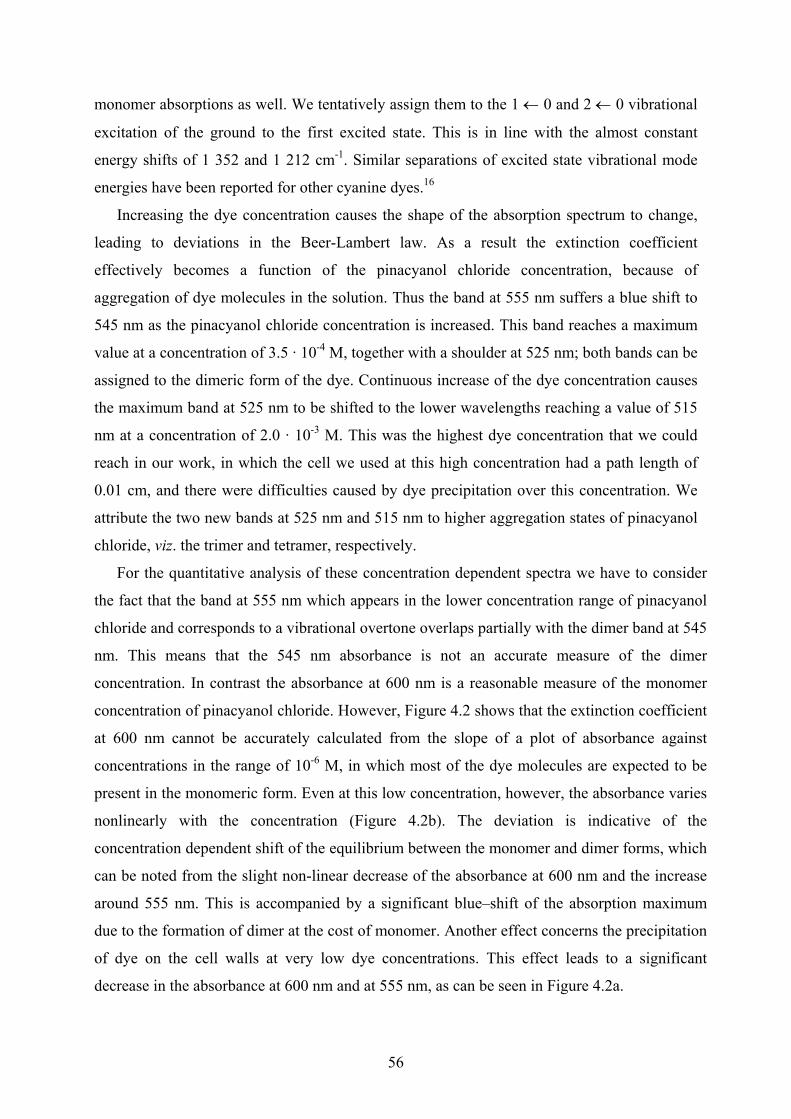
monomer absorptions as well. We tentatively assign them to the 1 ← 0 and 2 ← 0 vibrational
excitation of the ground to the first excited state. This is in line with the almost constant
energy shifts of 1 352 and 1 212 cm-1. Similar separations of excited state vibrational mode
energies have been reported for other cyanine dyes.16
Increasing the dye concentration causes the shape of the absorption spectrum to change,
leading to deviations in the Beer-Lambert law. As a result the extinction coefficient
effectively becomes a function of the pinacyanol chloride concentration, because of
aggregation of dye molecules in the solution. Thus the band at 555 nm suffers a blue shift to
545 nm as the pinacyanol chloride concentration is increased. This band reaches a maximum
value at a concentration of 3.5 · 10-4 M, together with a shoulder at 525 nm; both bands can be
assigned to the dimeric form of the dye. Continuous increase of the dye concentration causes
the maximum band at 525 nm to be shifted to the lower wavelengths reaching a value of 515
nm at a concentration of 2.0 · 10-3 M. This was the highest dye concentration that we could
reach in our work, in which the cell we used at this high concentration had a path length of
0.01 cm, and there were difficulties caused by dye precipitation over this concentration. We
attribute the two new bands at 525 nm and 515 nm to higher aggregation states of pinacyanol
chloride, viz. the trimer and tetramer, respectively.
For the quantitative analysis of these concentration dependent spectra we have to consider
the fact that the band at 555 nm which appears in the lower concentration range of pinacyanol
chloride and corresponds to a vibrational overtone overlaps partially with the dimer band at 545
nm. This means that the 545 nm absorbance is not an accurate measure of the dimer
concentration. In contrast the absorbance at 600 nm is a reasonable measure of the monomer
concentration of pinacyanol chloride. However, Figure 4.2 shows that the extinction coefficient
at 600 nm cannot be accurately calculated from the slope of a plot of absorbance against
concentrations in the range of 10-6 M, in which most of the dye molecules are expected to be
present in the monomeric form. Even at this low concentration, however, the absorbance varies
nonlinearly with the concentration (Figure 4.2b). The deviation is indicative of the
concentration dependent shift of the equilibrium between the monomer and dimer forms, which
can be noted from the slight non-linear decrease of the absorbance at 600 nm and the increase
around 555 nm. This is accompanied by a significant blue–shift of the absorption maximum
due to the formation of dimer at the cost of monomer. Another effect concerns the precipitation
of dye on the cell walls at very low dye concentrations. This effect leads to a significant
decrease in the absorbance at 600 nm and at 555 nm, as can be seen in Figure 4.2a.
56
400 450 500 550 600 650 7000,0
2,0
4,0
6,0
8,0
10,0
12,0
(a)
/104
32451
600 nm
551 nm
558 nm
5
1
[Pinacyanol chloride] / M1. 9.4*10-6
2. 4.7*10-6
3. 2.3*10-6
4. 1.8*10-6
5. 0.7*10-6
ε
λ / nm
0,0 0,2 0,4 0,6 0,8 1,0 1,2 1,4 1,6 1,8 2,00,0
0,2
0,4
0,6
0,8
1,0
1,2
1,4
1,6
1,8
(b)
Conc./ M Abs.600 Abs.555--------- ----------- -----------1,8*10-6 1,724 1,1869,4*10-6 0,939 0,5674,7*10-6 0,510 0,2752,3*10-6 0,231 0,1200.7*10-6 0,132 0,064
λmax= 600 nm λmax= 555 nm
Abso
rban
ce
l.C / cm.mol.l-1 / 10-5
Fig. 4.2. (a) The visible absorption spectra of pinacyanol chloride in aqueous solution with 7.5 % v/v
ethanol added at room temperature at low dye concentrations (~10-6 M) showing mainly the monomer
vibronic bands. (b) Beer’s law plot of the absorbance at 600 nm and 555 nm in Figure 4.2a.
In conclusion, it is difficult to make accurate measurements of the extinction coefficient of
the monomeric form of pinacyanol chloride in aqueous dye solutions even at concentrations
of 10-6 M or less.
4.1.2 Pinacyanol chloride spectra in ethanol
The UV/Vis spectrum of pinacyanol chloride in ethanol (100%) displays two main
absorption maxima at 606 (16 500 cm-1) and 562.5 nm (17 777 cm-1) in addition to a shoulder
at 520 nm. These features are independent of the concentration in the range from 10-6 to 10-4
M (Figure 4.3a). This is in contrast to the significant spectral changes that are observed in the
aqueous solutions of the dye. This indicates that pinacyanol chloride in pure ethanol is present
only in the form of monomeric molecules, and that no dimers or any higher aggregates are
formed under these conditions. This is supported by a Beer’s law plot of the two absorbance
maxima at 606 and 562.5 nm, Figure 4.3a. The absence of any deviation in the plot proves
that there is only one component of pinacyanol chloride in ethanol in the range of
concentrations studied at room temperature.
From the linear plots displayed in Figure 4.3b, values of the extinction coefficients of
monomeric pinacyanol chloride in ethanol of 175 200, 77 600, and 18 000 cm-1M-1 at 606.5,
562.5, and 521.5 nm, respectively, can be derived. The energy difference between the main
peak at 606.5 nm and the second vibronic peak at 562.5 nm is 1290 cm-1, and between the
second vibronic peak and the vibronic shoulder at 521.5 nm is 1390 cm-1. The ratio of the
57
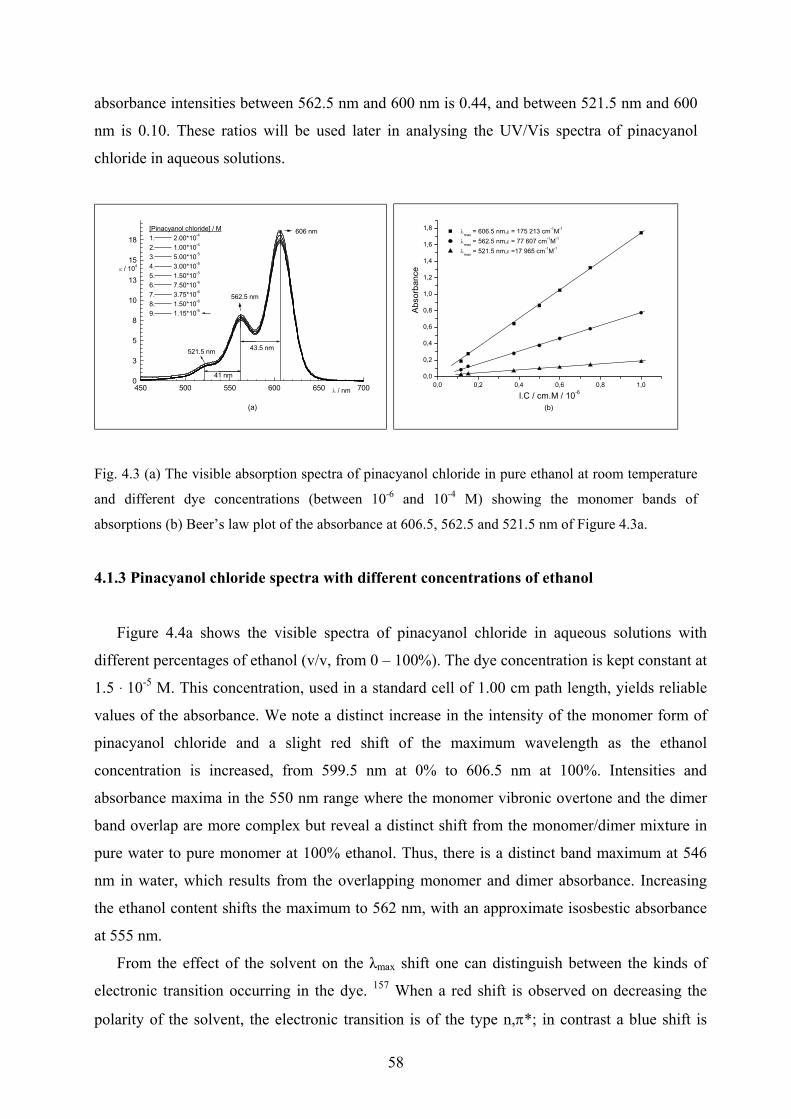
absorbance intensities between 562.5 nm and 600 nm is 0.44, and between 521.5 nm and 600
nm is 0.10. These ratios will be used later in analysing the UV/Vis spectra of pinacyanol
chloride in aqueous solutions.
450 500 550 600 650 7000
3
5
8
10
13
15
18
(a)
41 nm
521.5 nm 43.5 nm
606 nm
562.5 nm
[Pinacyanol chloride] / M1. 2.00*10-4 2. 1.00*10-4 3. 5.00*10-5 4. 3.00*10-5 5. 1.50*10-5 6. 7.50*10-6 7. 3.75*10-6 8. 1.50*10-6 9. 1.15*10-6
ε / 104
λ / nm
0,0 0,2 0,4 0,6 0,8 1,00,0
0,2
0,4
0,6
0,8
1,0
1,2
1,4
1,6
1,8
(b)
λmax
= 606.5 nm,ε = 175 213 cm-1M-1
λmax = 562.5 nm,ε = 77 607 cm-1M-1
λmax = 521.5 nm,ε =17 965 cm-1M-1
Abso
rban
ce
l.C / cm.M / 10-6
Fig. 4.3 (a) The visible absorption spectra of pinacyanol chloride in pure ethanol at room temperature
and different dye concentrations (between 10-6 and 10-4 M) showing the monomer bands of
absorptions (b) Beer’s law plot of the absorbance at 606.5, 562.5 and 521.5 nm of Figure 4.3a.
4.1.3 Pinacyanol chloride spectra with different concentrations of ethanol
Figure 4.4a shows the visible spectra of pinacyanol chloride in aqueous solutions with
different percentages of ethanol (v/v, from 0 – 100%). The dye concentration is kept constant at
1.5 · 10-5 M. This concentration, used in a standard cell of 1.00 cm path length, yields reliable
values of the absorbance. We note a distinct increase in the intensity of the monomer form of
pinacyanol chloride and a slight red shift of the maximum wavelength as the ethanol
concentration is increased, from 599.5 nm at 0% to 606.5 nm at 100%. Intensities and
absorbance maxima in the 550 nm range where the monomer vibronic overtone and the dimer
band overlap are more complex but reveal a distinct shift from the monomer/dimer mixture in
pure water to pure monomer at 100% ethanol. Thus, there is a distinct band maximum at 546
nm in water, which results from the overlapping monomer and dimer absorbance. Increasing
the ethanol content shifts the maximum to 562 nm, with an approximate isosbestic absorbance
at 555 nm.
From the effect of the solvent on the λmax shift one can distinguish between the kinds of
electronic transition occurring in the dye. 157 When a red shift is observed on decreasing the
polarity of the solvent, the electronic transition is of the type n,π*; in contrast a blue shift is
58
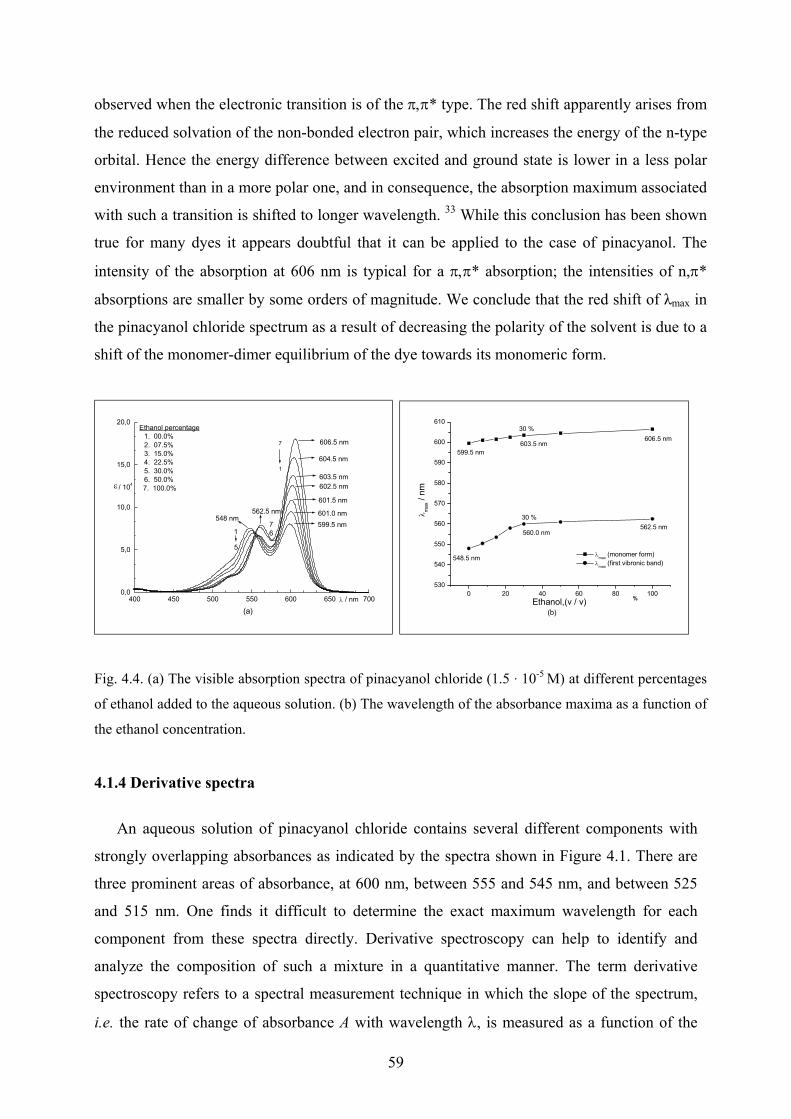
observed when the electronic transition is of the π,π* type. The red shift apparently arises from
the reduced solvation of the non-bonded electron pair, which increases the energy of the n-type
orbital. Hence the energy difference between excited and ground state is lower in a less polar
environment than in a more polar one, and in consequence, the absorption maximum associated
with such a transition is shifted to longer wavelength. 33 While this conclusion has been shown
true for many dyes it appears doubtful that it can be applied to the case of pinacyanol. The
intensity of the absorption at 606 nm is typical for a π,π* absorption; the intensities of n,π*
absorptions are smaller by some orders of magnitude. We conclude that the red shift of λmax in
the pinacyanol chloride spectrum as a result of decreasing the polarity of the solvent is due to a
shift of the monomer-dimer equilibrium of the dye towards its monomeric form.
400 450 500 550 600 650 7000,0
5,0
10,0
15,0
20,0
(a)
/ 104
76
5
1
1
7
603.5 nm602.5 nm
604.5 nm
601.5 nm562.5 nm
548 nm601.0 nm599.5 nm
606.5 nm
Ethanol percentage1. 00.0% 2. 07.5% 3. 15.0% 4. 22.5% 5. 30.0% 6. 50.0%
7. 100.0% ε
λ / nm
0 20 40 60 80 100530
540
550
560
570
580
590
600
610
(b)
560.0 nm
30 %
30 %
603.5 nm
548.5 nm
562.5 nm
599.5 nm
606.5 nm
%
λmax (monomer form)
λmax (first vibronic band)
λ max
/ nm
Ethanol,(v / v)
Fig. 4.4. (a) The visible absorption spectra of pinacyanol chloride (1.5 · 10-5 M) at different percentages
of ethanol added to the aqueous solution. (b) The wavelength of the absorbance maxima as a function of
the ethanol concentration.
4.1.4 Derivative spectra
An aqueous solution of pinacyanol chloride contains several different components with
strongly overlapping absorbances as indicated by the spectra shown in Figure 4.1. There are
three prominent areas of absorbance, at 600 nm, between 555 and 545 nm, and between 525
and 515 nm. One finds it difficult to determine the exact maximum wavelength for each
component from these spectra directly. Derivative spectroscopy can help to identify and
analyze the composition of such a mixture in a quantitative manner. The term derivative
spectroscopy refers to a spectral measurement technique in which the slope of the spectrum,
i.e. the rate of change of absorbance A with wavelength λ, is measured as a function of the
59

wavelength. Thus, the first-derivative spectrum is a plot of the spectral slope ( λ∆∆A ) against
the wavelength, in which ( λ∆∆A ) is zero at the wavelength corresponding to the peak
maximum of the original spectrum. The second-derivative spectrum is the first derivative of
the first-derivative spectrum, i.e. ( )22 λ∆∆ A , in which in contrast the second- or even higher
order derivatives appear as sharpened representations of the original spectrum. The magnitude
of the resolution enhancement depends on the derivative order and band shape, as well as the
relative bandwidths and heights of the overlapping peaks. 158
Figure 4.5A represents as an example the visible spectrum of pinacyanol chloride at a
concentration of 7.5 · 10-5 M (spectrum #4 in Figure 4.1), while Figures 4.5B, C, and D are,
respectively, the first-, second-, and fourth-derivative spectra of the same solution in the
wavelength range from 400 to 700 nm. In the absorption spectrum a, b, c d, and e indicate
absorptions of the monomer, dimer, and three other higher aggregates, respectively, which
can be correlated with the derivative spectra. Repeating the same procedure for the other eight
concentrations of pinacyanol chloride solutions shown in Figure 4.1, we obtain the maximum
wavelengths for each component of pinacyanol chloride at each concentration. Figure 4.6
shows the maximum wavelengths for monomer, dimer, and the higher aggregates, which are
taken from the fourth-derivative spectrum by identifying the position of the peak maxima.
In Figure 4.6 we show how the positions of the different band maxima change with the
pinacaynol chloride concentration. At low concentration most of the dye is present as
monomer, and the maximum wavelength is about 601 nm (averaged). At moderate
concentration (10-4 M), there is a significant ratio of the dimer with maximum wavelength of
546 nm. At higher concentration (3.5 ⋅ 10-4 M), there is a the third peak with a maximum of
about 522.5 nm, which occurs for the first time in the spectra shown in Figure 4.1. It has a
maximum wavelength of above 525 nm and rises with increasing dye concentration. The
other two absorption maxima in Figure 4.6 (507 and 486 nm) are attributed to higher
aggregates of the dye.
It is most satisfying to see that the wavelengths of the absorption maxima of these
different aggregated species is in effect independent from the dye concentration, as they
should be. In our work with the peakFit program, which will be described in the next section,
we took these values in account as the suggested maximum wavelengths of the pinacyanol
chloride components in the quantitative analysis of the strongly overlapping band
components.
60
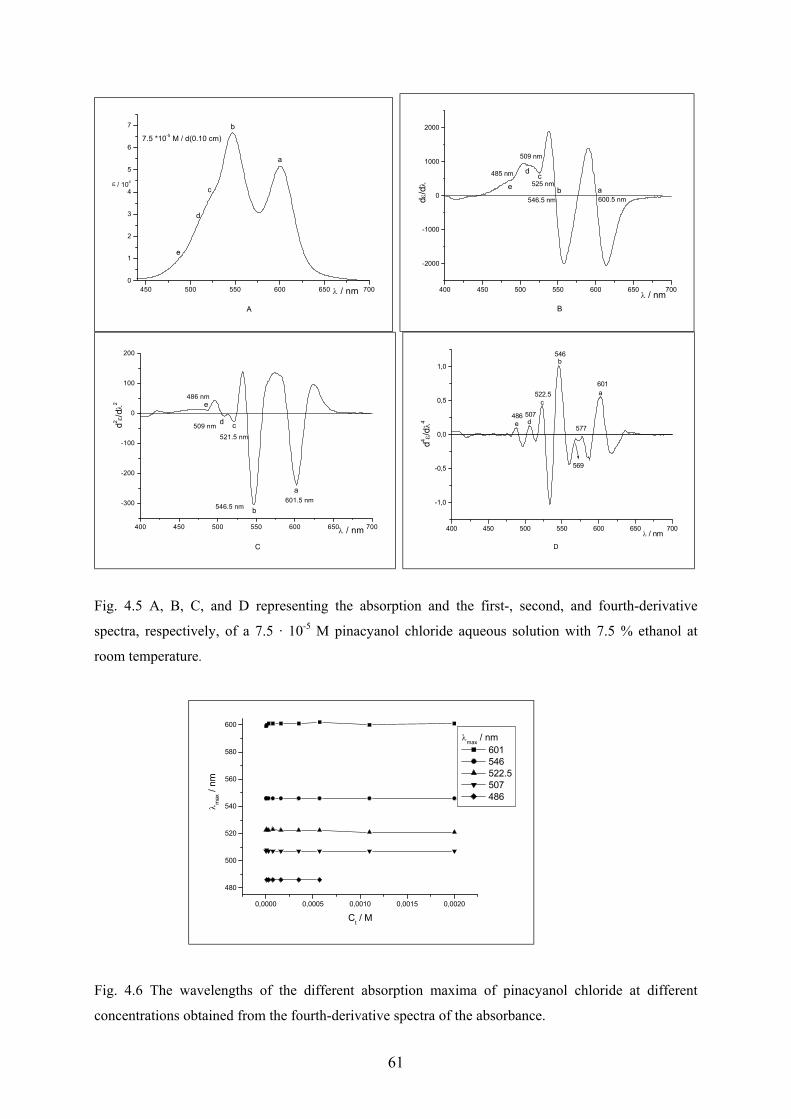
450 500 550 600 650 7000
1
2
3
4
5
6
7
A
7.5 *10-5 M / d(0.10 cm)
e
d
c
b
a
/ 104ε
λ / nm
400 450 500 550 600 650 700
-2000
-1000
0
1000
2000
B
485 nm
509 nm
525 nme
dc
b a546.5 nm 600.5 nmd ε
/dλ
λ / nm
400 450 500 550 600 650 700
-300
-200
-100
0
100
200
C
486 nme
d c
b
a
509 nm521.5 nm
546.5 nm601.5 nm
d2 ε/dλ2
λ / nm
400 450 500 550 600 650 700
-1,0
-0,5
0,0
0,5
1,0
D
e d
c
b
a
569
577
486 507
522.5
546
601
d4 ε/dλ4
λ / nm
Fig. 4.5 A, B, C, and D representing the absorption and the first-, second, and fourth-derivative
spectra, respectively, of a 7.5 · 10-5 M pinacyanol chloride aqueous solution with 7.5 % ethanol at
room temperature.
0,0000 0,0005 0,0010 0,0015 0,0020
480
500
520
540
560
580
600
λmax / nm 601 546 522.5 507 486
λ max
/ nm
Ct / M
Fig. 4.6 The wavelengths of the different absorption maxima of pinacyanol chloride at different
concentrations obtained from the fourth-derivative spectra of the absorbance.
61
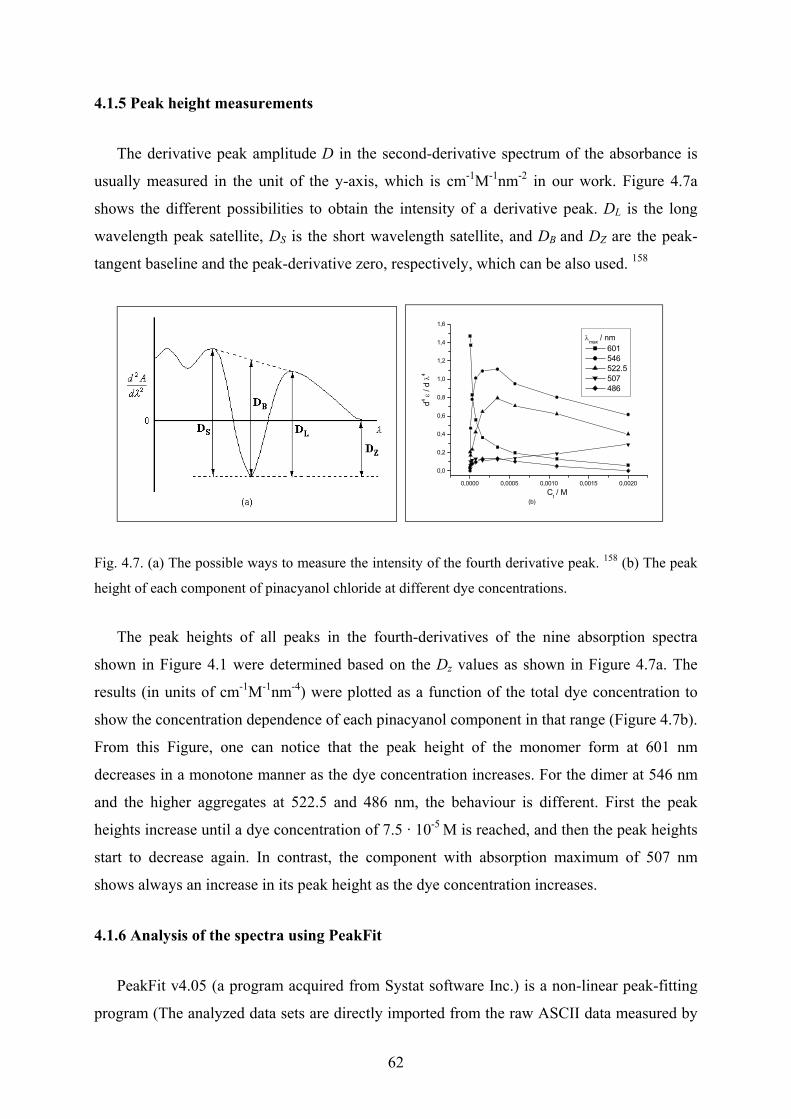
4.1.5 Peak height measurements
The derivative peak amplitude D in the second-derivative spectrum of the absorbance is
usually measured in the unit of the y-axis, which is cm-1M-1nm-2 in our work. Figure 4.7a
shows the different possibilities to obtain the intensity of a derivative peak. DL is the long
wavelength peak satellite, DS is the short wavelength satellite, and DB and DZ are the peak-
tangent baseline and the peak-derivative zero, respectively, which can be also used. 158
0,0000 0,0005 0,0010 0,0015 0,0020
0,0
0,2
0,4
0,6
0,8
1,0
1,2
1,4
1,6
(b)
λmax / nm 601 546 522.5 507 486
d4 ε / d
λ4
Ct / M
Fig. 4.7. (a) The possible ways to measure the intensity of the fourth derivative peak. 158 (b) The peak
height of each component of pinacyanol chloride at different dye concentrations.
The peak heights of all peaks in the fourth-derivatives of the nine absorption spectra
shown in Figure 4.1 were determined based on the Dz values as shown in Figure 4.7a. The
results (in units of cm-1M-1nm-4) were plotted as a function of the total dye concentration to
show the concentration dependence of each pinacyanol component in that range (Figure 4.7b).
From this Figure, one can notice that the peak height of the monomer form at 601 nm
decreases in a monotone manner as the dye concentration increases. For the dimer at 546 nm
and the higher aggregates at 522.5 and 486 nm, the behaviour is different. First the peak
heights increase until a dye concentration of 7.5 · 10-5 M is reached, and then the peak heights
start to decrease again. In contrast, the component with absorption maximum of 507 nm
shows always an increase in its peak height as the dye concentration increases.
4.1.6 Analysis of the spectra using PeakFit
PeakFit v4.05 (a program acquired from Systat software Inc.) is a non-linear peak-fitting
program (The analyzed data sets are directly imported from the raw ASCII data measured by
62

the spectrophotometer), which is capable to separate overlapping peaks of a spectrum
containing different components as well as to uniquely characterize the fundamental
underlying parameters for each peak component. PeakFit is unique in offering a pure
analytical computation of the Voigt function, the line shape arising as a result of the
convolution of the Lorentzian and Gaussian components within a spectroscopic peak. In many
cases, PeakFit offers both an amplitude and area model for a given function. 159 Figure 4.8a
shows the resolved absorption bands for the 7.5 · 10-5 M pinacyanol chloride spectrum of
Figure 4.1. They are, starting with long wavelengths (from the right): the monomer band at
601 nm, the first vibronic overtone at 557 nm, the dimer at 546 nm, and the higher aggregates
at 522.5, 507 and 486 nm. The obtained λmax values from PeakFit are in very good agreement
with the values obtained from the fourth-derivative spectra (Figure 4.6). The graph of the
residuals shown in Figure 4.8b is a separate PeakFit graph activated in the Review window to
display graphically the residuals of the different peaks. It depicts the difference between the
experimental absorption spectrum and the spectrum calculated with PeakFit on the basis of
the different components.
450 500 550 600 650 7000
2
4
6
8
10
(a)
507
572486
522.5
546
557
601
ε / 104
λ / nm
450 500 550 600 650 700
-1000
-500
0
(b)
-387
7.5 * 10-5 M
ε
λ / nm
Fig. 4.8 (a) The absorption spectrum of the 7.5 · 10-5 M pinacyanol chloride solution resolved into its
components with PeakFit. (b) The graph of the residuals, which is the difference between the normal
absorption spectrum data and the one obtained using the PeakFit data for the component.
The maximum absolute value of the residual graph shown in Figure 4.8b is 387 cm-1M-1,
which is 0.6 % of the highest extinction of Figure 4.8(a). This is statistically highly acceptable
according to the experimental and technical conditions. Figure 4.9 shows the peak fit results
for the other eight concentrations of pinacyanol chloride presented in Figure 4.1. The
percentage of residuals in their maximum values can be noted together with each of the
resolved spectrum in Figure 4.9
63
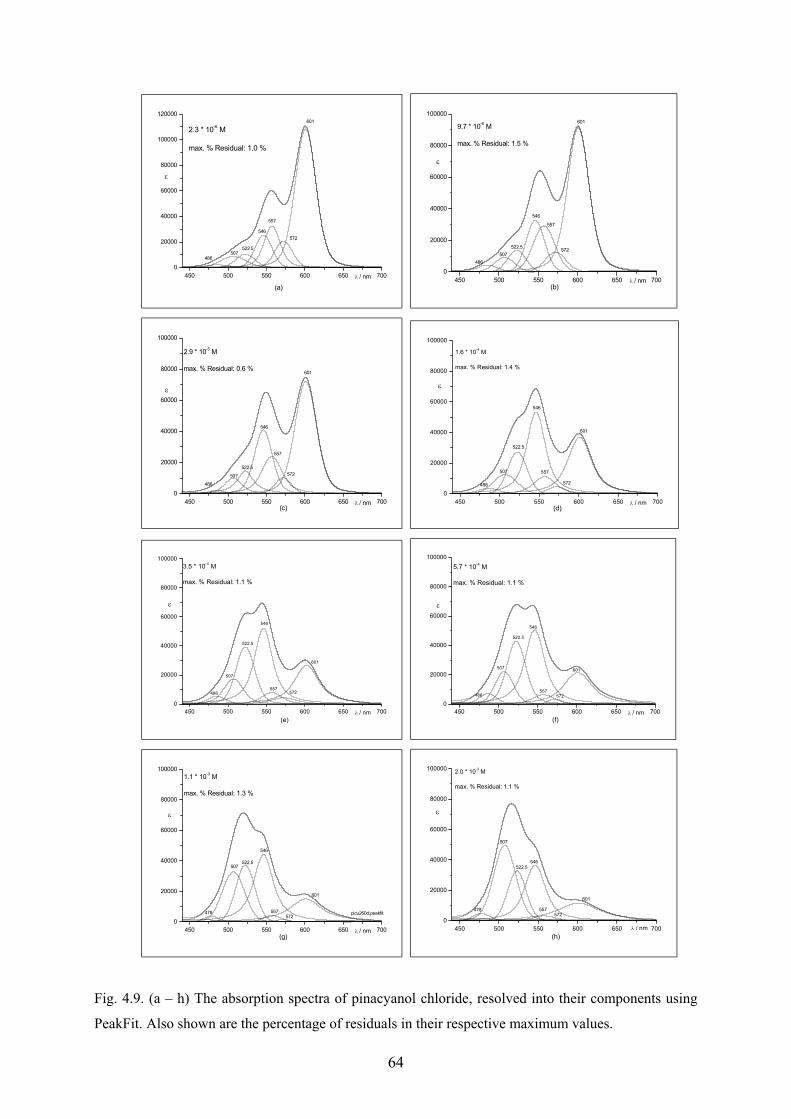
450 500 550 600 650 7000
20000
40000
60000
80000
100000
120000
(a)
2.3 * 10-6 M
max. % Residual: 1.0 %
507
572
486
522.5
546
557
601
ε
λ / nm
450 500 550 600 650 700
0
20000
40000
60000
80000
100000
(b)
9.7 * 10-6 M
max. % Residual: 1.5 %
507572
486
522.5
546
557
601
ε
λ / nm
450 500 550 600 650 7000
20000
40000
60000
80000
100000
(c)
2.9 * 10-5 M
max. % Residual: 0.6 %
507 572
486
522.5
546
557
601
ε
λ / nm
450 500 550 600 650 700
0
20000
40000
60000
80000
100000
(d)
1.6 * 10-4 M
max. % Residual: 1.4 %
507
572486
522.5
546
557
601
ε
λ / nm
450 500 550 600 650 7000
20000
40000
60000
80000
100000
(e)
3.5 * 10-4 M
max. % Residual: 1.1 %
507
572486
522.5
546
557
601
ε
λ / nm
450 500 550 600 650 700
0
20000
40000
60000
80000
100000
(f)
5.7 * 10-4 M
max. % Residual: 1.1 %
507
572486
522.5
546
557
601
ε
λ / nm
450 500 550 600 650 7000
20000
40000
60000
80000
100000
(g)
1.1 * 10-3 M
max. % Residual: 1.3 %
507
572478
522.5
546
557
601
picu260d.peakfit
ε
λ / nm
450 500 550 600 650 7000
20000
40000
60000
80000
100000
(h)
2.0 * 10-3 M
max. % Residual: 1.1 %
507
572478
522.5546
557
601
ε
λ / nm
Fig. 4.9. (a – h) The absorption spectra of pinacyanol chloride, resolved into their components using
PeakFit. Also shown are the percentage of residuals in their respective maximum values.
64

The wavelengths of the absorption maxima and their heights as obtained with PeakFit are
collected for each of the different pinacyanol chloride concentrations in Figure 4.10. The
position of the absorption maxima obtained with PeakFit are in good agreement with the
values obtained from an analysis of the fourth-derivative spectra. The distribution of each
pinacyanol component as shown in Figure 4.10b is logical with respect to the spectra in
Figure 4.1 in so far as there is a continuous decrease of the monomer band height. In contrast,
the dimer at 522.5 nm and the higher aggregate at 486 nm increase in the beginning and then
start to decrease, but the species absorbing at 507 nm always increases. The behaviour of the
vibronic overtone of the monomer is similar to the main monomer band, and their intensity
ratios are constant over the range of concentrations studied.
0,0000 0,0005 0,0010 0,0015 0,0020480
500
520
540
560
580
600
(a)
λmax / nm 601 nm 572 nm 557 nm 546 nm 522 nm 507 nm 486 nm
Peak
cen
ter /
nm
Total concentration of Pinacyanol / M
0,0000 0,0005 0,0010 0,0015 0,00200
20000
40000
60000
80000
100000
120000
(b)
λmax / nm 601 nm 572 nm 557 nm 546 nm 522 nm 507 nm 486 nmε
Ct / M
Fig. 4.10. (a) Wavelengths of absorption maxima and (b) their amplitudes for each component at
different pinacyanol chloride concentrations obtained with PeakFit.
Table 4.1 summarizes the information obtained from the analysis of the spectra shown in
Figure 4.1 using PeakFit. In the Table, the values of absorbances are converted to extinction
coefficients and were taken directly from the PeakFit program.
65
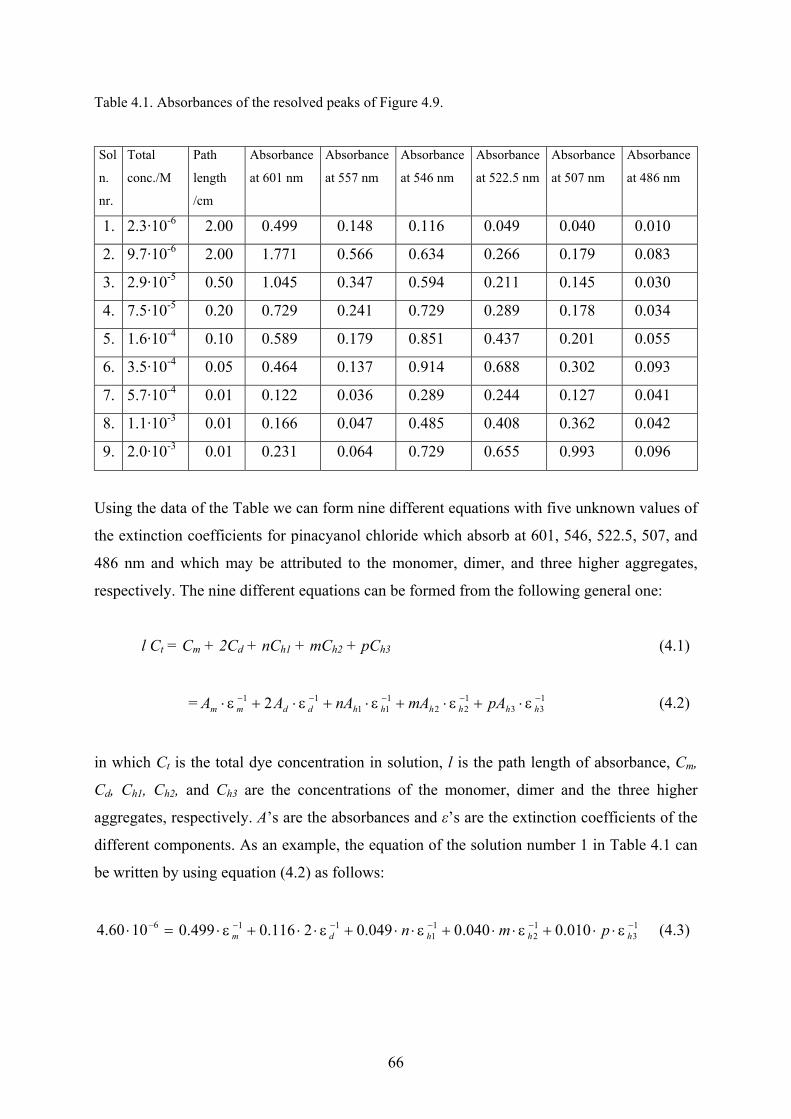
Table 4.1. Absorbances of the resolved peaks of Figure 4.9.
Sol
n.
nr.
Total
conc./M
Path
length
/cm
Absorbance
at 601 nm
Absorbance
at 557 nm
Absorbance
at 546 nm
Absorbance
at 522.5 nm
Absorbance
at 507 nm
Absorbance
at 486 nm
1. 2.3·10-6 2.00 0.499 0.148 0.116 0.049 0.040 0.010
2. 9.7·10-6 2.00 1.771 0.566 0.634 0.266 0.179 0.083
3. 2.9·10-5 0.50 1.045 0.347 0.594 0.211 0.145 0.030
4. 7.5·10-5 0.20 0.729 0.241 0.729 0.289 0.178 0.034
5. 1.6·10-4 0.10 0.589 0.179 0.851 0.437 0.201 0.055
6. 3.5·10-4 0.05 0.464 0.137 0.914 0.688 0.302 0.093
7. 5.7·10-4 0.01 0.122 0.036 0.289 0.244 0.127 0.041
8. 1.1·10-3 0.01 0.166 0.047 0.485 0.408 0.362 0.042
9. 2.0·10-3 0.01 0.231 0.064 0.729 0.655 0.993 0.096
Using the data of the Table we can form nine different equations with five unknown values of
the extinction coefficients for pinacyanol chloride which absorb at 601, 546, 522.5, 507, and
486 nm and which may be attributed to the monomer, dimer, and three higher aggregates,
respectively. The nine different equations can be formed from the following general one:
l Ct = Cm + 2Cd + nCh1 + mCh2 + pCh3 (4.1)
= (4.2) 133
122
111
11 2 −−−−− ⋅+⋅+⋅+⋅+⋅ hhhhhhddmm pAmAnAAA εεεεε
in which Ct is the total dye concentration in solution, l is the path length of absorbance, Cm,
Cd, Ch1, Ch2, and Ch3 are the concentrations of the monomer, dimer and the three higher
aggregates, respectively. A’s are the absorbances and ε’s are the extinction coefficients of the
different components. As an example, the equation of the solution number 1 in Table 4.1 can
be written by using equation (4.2) as follows:
=⋅ −61060.4 13
12
11
11 010.0040.0049.02116.0499.0 −−−−− ⋅⋅+⋅⋅+⋅⋅+⋅⋅+⋅ hhhdm pmn εεεεε (4.3)
66
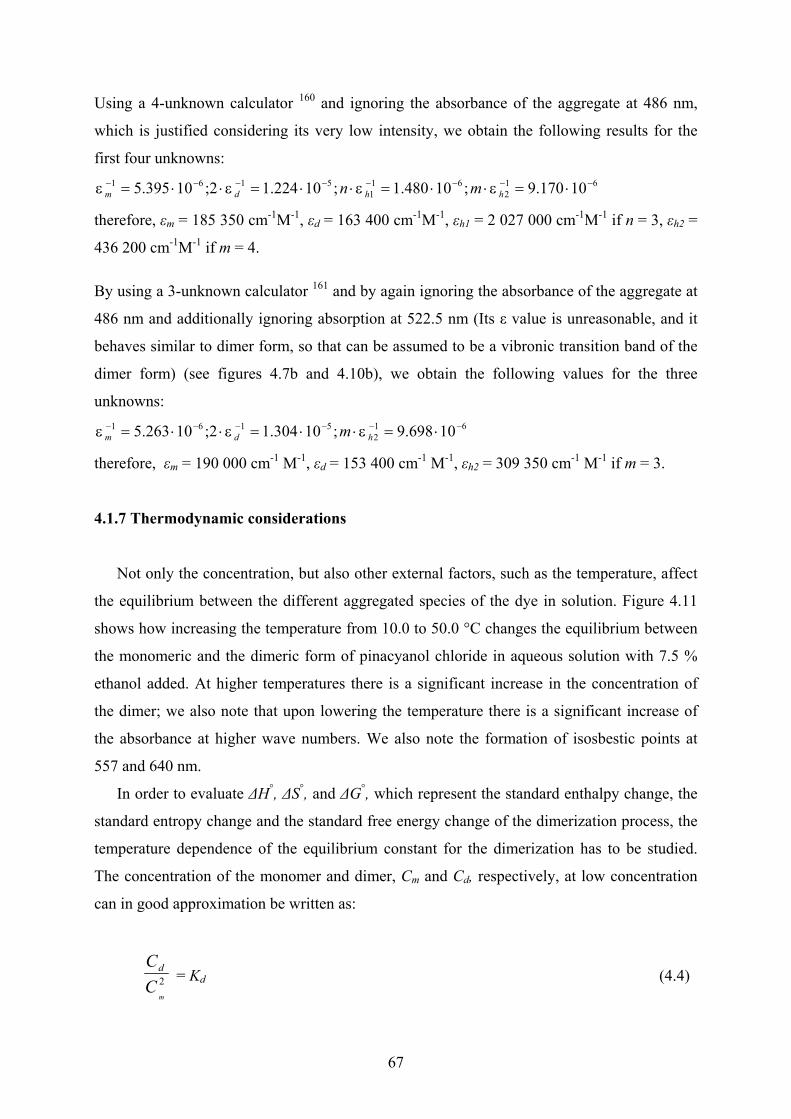
Using a 4-unknown calculator 160 and ignoring the absorbance of the aggregate at 486 nm,
which is justified considering its very low intensity, we obtain the following results for the
first four unknowns: 61
261
15161 10170.9;10480.1;10224.12;10395.5 −−−−−−−− ⋅=⋅⋅=⋅⋅=⋅⋅= hhdm mn εεεε
therefore, εm = 185 350 cm-1M-1, εd = 163 400 cm-1M-1, εh1 = 2 027 000 cm-1M-1 if n = 3, εh2 =
436 200 cm-1M-1 if m = 4.
By using a 3-unknown calculator 161 and by again ignoring the absorbance of the aggregate at
486 nm and additionally ignoring absorption at 522.5 nm (Its ε value is unreasonable, and it
behaves similar to dimer form, so that can be assumed to be a vibronic transition band of the
dimer form) (see figures 4.7b and 4.10b), we obtain the following values for the three
unknowns: 61
25161 10698.9;10304.12;10263.5 −−−−−− ⋅=⋅⋅=⋅⋅= hdm m εεε
therefore, εm = 190 000 cm-1 M-1, εd = 153 400 cm-1 M-1, εh2 = 309 350 cm-1 M-1 if m = 3.
4.1.7 Thermodynamic considerations
Not only the concentration, but also other external factors, such as the temperature, affect
the equilibrium between the different aggregated species of the dye in solution. Figure 4.11
shows how increasing the temperature from 10.0 to 50.0 °C changes the equilibrium between
the monomeric and the dimeric form of pinacyanol chloride in aqueous solution with 7.5 %
ethanol added. At higher temperatures there is a significant increase in the concentration of
the dimer; we also note that upon lowering the temperature there is a significant increase of
the absorbance at higher wave numbers. We also note the formation of isosbestic points at
557 and 640 nm.
In order to evaluate ∆H°, ∆S°, and ∆G°, which represent the standard enthalpy change, the
standard entropy change and the standard free energy change of the dimerization process, the
temperature dependence of the equilibrium constant for the dimerization has to be studied.
The concentration of the monomer and dimer, Cm and Cd, respectively, at low concentration
can in good approximation be written as:
2m
CCd = Kd (4.4)
67

where Kd is the association constant of the dimer. Because the solution was measured at five
different temperatures, five different values of Kd can be obtained and the temperature
dependence be studied. The different values of Cd and Cm at each temperature have been
obtained by using PeakFit as described before in section 4.1.6.
400 450 500 550 600 650 7000,0
0,2
0,4
0,6
0,8
1,0
1,2
1,4 Temperatures / °C 1. + 50 2. + 40 3. + 30 4. + 20 5. + 10
5
1
5
1
Abso
rban
ce
λ / nm
Fig. 4.11. The temperature dependence of the equilibrium between monomer and dimer forms of
pinacyanol chloride (1.5 · 10-5 M ) in aqueous solution with 7.5 % ethanol added.
Table 4.2 lists the absorbances and concentrations of the monomer and dimer forms,
which can be calculated from the assumed values of the extinction (190 000 and 153 400 cm-
1M-1, respectively) and the calculated dimerization constant Kd at each of the five different
temperatures studied. The change of density solvent within the used temperature range is not
significant according to our experimental conditions. The error is less than 1% of the total dye
concentration.
68
Table 4.2. Absorbance and concentration of the monomer and dimer forms in a pinacyanol chloride
solution (1.50 · 10-5 M) at different temperatures.
Temperature / °C Absorbance,
601 nm
Absorbance,
546 nm [Monomer] / M [Dimer] / M Kd / M-1
50.0 1.240 0.198 6.526 · 10-6 1.291 · 10-6 3.031 · 104
40.0 1.192 0.233 6.274 · 10-6 1.519 · 10-6 3.859 · 104
30.0 1.131 0.285 5.953 · 10-6 1.858 · 10-6 5.243 · 104
20.0 1.048 0.338 5.516 · 10-6 2.203 · 10-6 7.240 · 104
10.0 0.931 0.389 4.900 · 10-6 2.536 · 10-6 1.056 · 105
The values of ∆H° and ∆S° at 298 K were obtained by subjecting the data of Table 4.2 to a
linear regression analysis according to the following thermodynamic equation:
2.303 R · log Kd = - ∆ H° (1/T) + ∆S° (4.5)
where ∆H° and ∆S° are obtained from the slope and intercept of equation 4.5. The value of
∆G° can be calculated according to the following thermodynamic equation:
∆G° = ∆H° - 298 ∆S° (4.6)
From the straight linear plot shown in Figure 4.12, with a correlation coefficient of 0.999, the
following values are obtained: ∆H° = – 5696 calmol-1, ∆S° = 2.8 calmol-1K-1 and ∆G° = –
6540 calmol-1. The negative value of ∆H° shows that the dimerization process of pinacyanol
chloride is exothermic. The absolute value of ∆H° is less than expected for interactions in
which covalent or electrostatic bonding is operative. The negative value of ∆G° indicates that
the dimerization process is spontaneous. The slightly positive value of ∆S° shows that the
dimerization process is accompanied by an entropy increase.
69
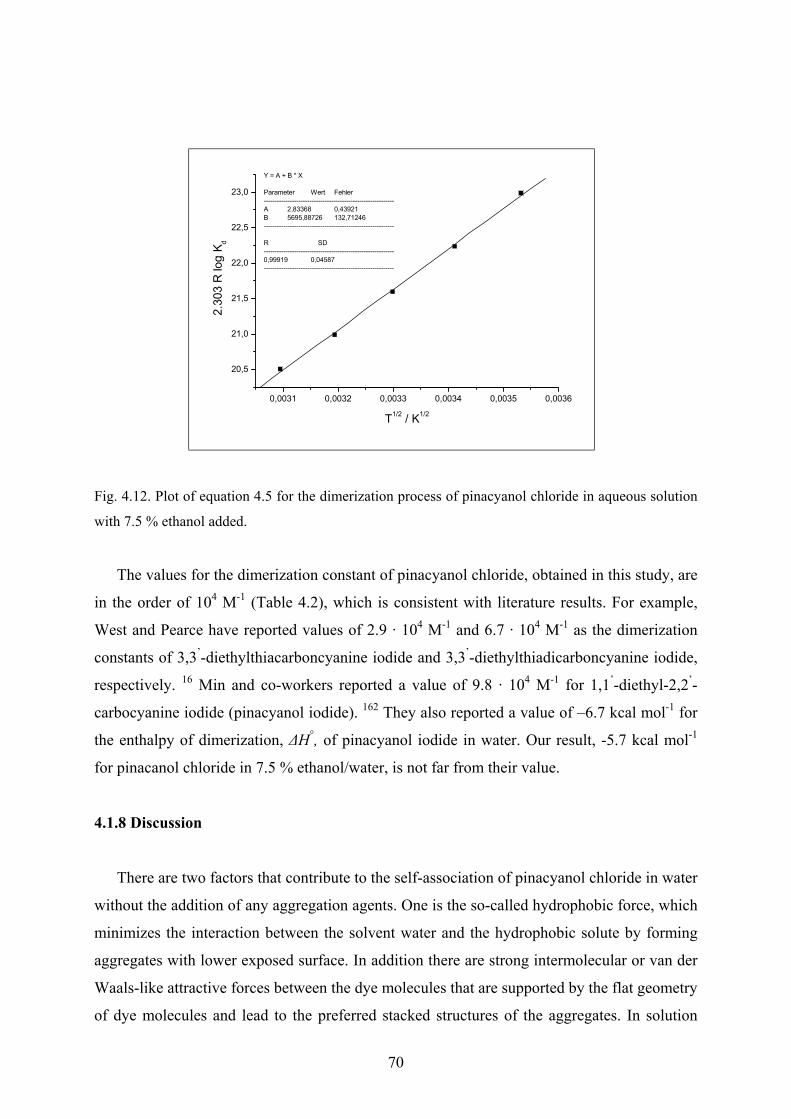
0,0031 0,0032 0,0033 0,0034 0,0035 0,0036
20,5
21,0
21,5
22,0
22,5
23,0
Y = A + B * X
Parameter Wert Fehler------------------------------------------------------------A 2,83368 0,43921B 5695,88726 132,71246------------------------------------------------------------
R SD ------------------------------------------------------------0,99919 0,04587------------------------------------------------------------
2.30
3 R
log
K d
T1/2 / K1/2
Fig. 4.12. Plot of equation 4.5 for the dimerization process of pinacyanol chloride in aqueous solution
with 7.5 % ethanol added.
The values for the dimerization constant of pinacyanol chloride, obtained in this study, are
in the order of 104 M-1 (Table 4.2), which is consistent with literature results. For example,
West and Pearce have reported values of 2.9 · 104 M-1 and 6.7 · 104 M-1 as the dimerization
constants of 3,3’-diethylthiacarboncyanine iodide and 3,3’-diethylthiadicarboncyanine iodide,
respectively. 16 Min and co-workers reported a value of 9.8 · 104 M-1 for 1,1’-diethyl-2,2’-
carbocyanine iodide (pinacyanol iodide). 162 They also reported a value of –6.7 kcal mol-1 for
the enthalpy of dimerization, ∆H°, of pinacyanol iodide in water. Our result, -5.7 kcal mol-1
for pinacanol chloride in 7.5 % ethanol/water, is not far from their value.
4.1.8 Discussion
There are two factors that contribute to the self-association of pinacyanol chloride in water
without the addition of any aggregation agents. One is the so-called hydrophobic force, which
minimizes the interaction between the solvent water and the hydrophobic solute by forming
aggregates with lower exposed surface. In addition there are strong intermolecular or van der
Waals-like attractive forces between the dye molecules that are supported by the flat geometry
of dye molecules and lead to the preferred stacked structures of the aggregates. In solution
70
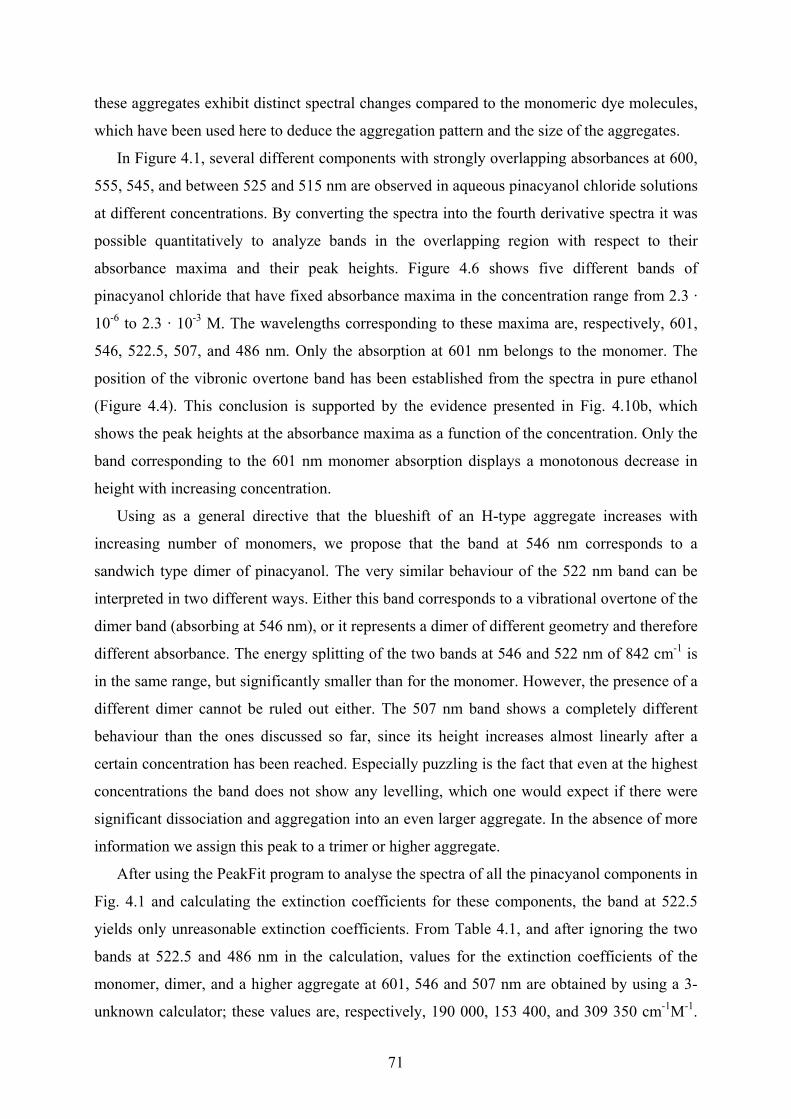
these aggregates exhibit distinct spectral changes compared to the monomeric dye molecules,
which have been used here to deduce the aggregation pattern and the size of the aggregates.
In Figure 4.1, several different components with strongly overlapping absorbances at 600,
555, 545, and between 525 and 515 nm are observed in aqueous pinacyanol chloride solutions
at different concentrations. By converting the spectra into the fourth derivative spectra it was
possible quantitatively to analyze bands in the overlapping region with respect to their
absorbance maxima and their peak heights. Figure 4.6 shows five different bands of
pinacyanol chloride that have fixed absorbance maxima in the concentration range from 2.3 ·
10-6 to 2.3 · 10-3 M. The wavelengths corresponding to these maxima are, respectively, 601,
546, 522.5, 507, and 486 nm. Only the absorption at 601 nm belongs to the monomer. The
position of the vibronic overtone band has been established from the spectra in pure ethanol
(Figure 4.4). This conclusion is supported by the evidence presented in Fig. 4.10b, which
shows the peak heights at the absorbance maxima as a function of the concentration. Only the
band corresponding to the 601 nm monomer absorption displays a monotonous decrease in
height with increasing concentration.
Using as a general directive that the blueshift of an H-type aggregate increases with
increasing number of monomers, we propose that the band at 546 nm corresponds to a
sandwich type dimer of pinacyanol. The very similar behaviour of the 522 nm band can be
interpreted in two different ways. Either this band corresponds to a vibrational overtone of the
dimer band (absorbing at 546 nm), or it represents a dimer of different geometry and therefore
different absorbance. The energy splitting of the two bands at 546 and 522 nm of 842 cm-1 is
in the same range, but significantly smaller than for the monomer. However, the presence of a
different dimer cannot be ruled out either. The 507 nm band shows a completely different
behaviour than the ones discussed so far, since its height increases almost linearly after a
certain concentration has been reached. Especially puzzling is the fact that even at the highest
concentrations the band does not show any levelling, which one would expect if there were
significant dissociation and aggregation into an even larger aggregate. In the absence of more
information we assign this peak to a trimer or higher aggregate.
After using the PeakFit program to analyse the spectra of all the pinacyanol components in
Fig. 4.1 and calculating the extinction coefficients for these components, the band at 522.5
yields only unreasonable extinction coefficients. From Table 4.1, and after ignoring the two
bands at 522.5 and 486 nm in the calculation, values for the extinction coefficients of the
monomer, dimer, and a higher aggregate at 601, 546 and 507 nm are obtained by using a 3-
unknown calculator; these values are, respectively, 190 000, 153 400, and 309 350 cm-1M-1.
71

From the absorbances and the cell constants given in Table 4.1 the total dye concentration
was calculated according to
Ct = Am / εm·l + 2 Ad / εd·l + 3At/ εt·l (4.7)
The calculated total dye concentrations for the nine different solutions are in good agreement
with the dye concentration used to prepare the samples and feature an error of less than 1%.
From the slope of the extinction coefficient of the monomer form in 100% ethanol at 606 nm
against concentration (Fig. 4.3b), an extinction coefficient of 175 200 cm-1M-1 is obtained.
The difference between this value and the value found with the PeakFit program (190 000 cm-
1M-1) may reflect a solvent effect apart from a possible error coming from the different
method that was used. The extinction coefficient of the pinacyanol dimer, which is present in
high concentration in the γ-cyclodextrin cavity, was estimated from the visible spectra (see
next section, Fig. 4.15a). The value is 142 000 cm-1M-1 which is in good agreement with the
value calculated by using the PeakFit program (153 400 cm-1M-1).
A blue shift in the maximum wavelength of the visible absorption band of a dye indicates
near vertical stack aggregation of the dye molecules and depends on the number of monomers
in the aggregate. In addition to the dimer, which absorbs at 546 nm and considering the
calculated extinction coefficients, we attribute the band at 507 nm to the trimeric state of the
dye. Formation of higher aggregates is possible on the one hand in equilibrium with and on
the other hand at the cost of dimer and trimer aggregates. Experimentally, such higher
aggregates are difficult to detect due to the very low concentrations and the overlap of their
bands with the intense dimer and trimer aggregates. The aggregate absorbing at 486 nm
behaves like another dimer form (see figure 4.7b); increasing the total dye concentration
reduces the intensity of this band, which eventually disappears completely. The new band
with relatively low intensity which appears at 478 nm (Fig. 4.9) may be attributed to a higher
aggregated form than the trimer.
72
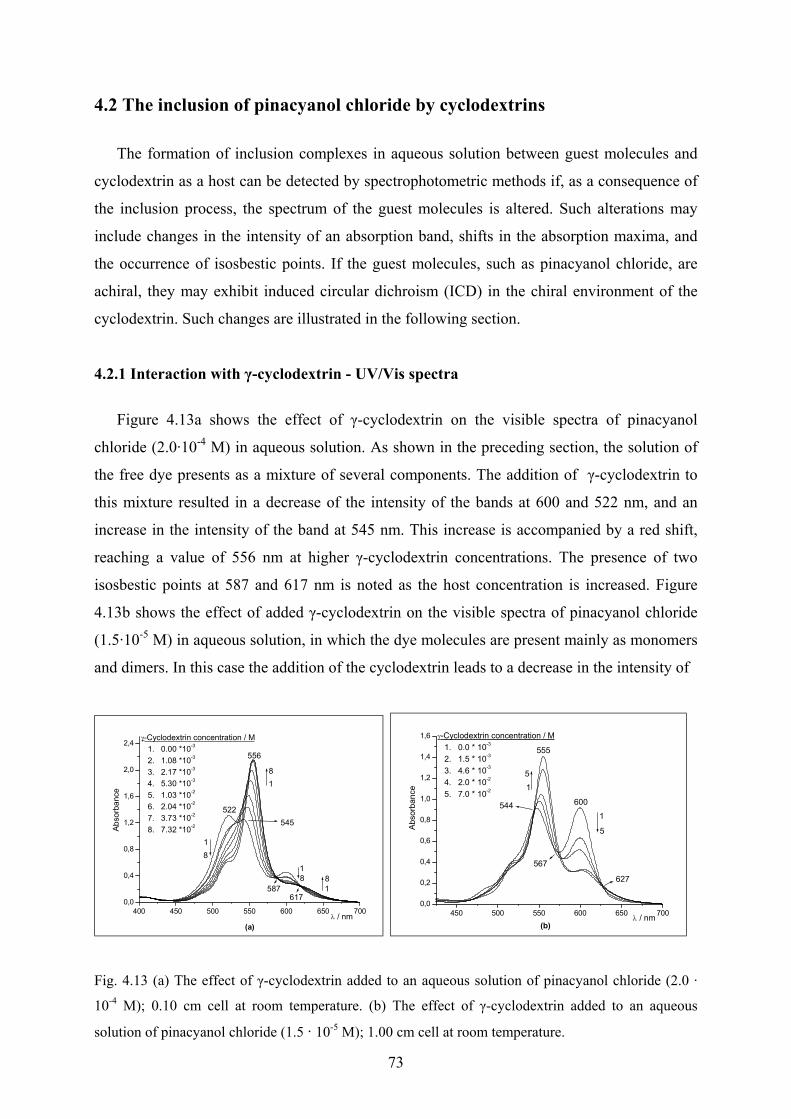
4.2 The inclusion of pinacyanol chloride by cyclodextrins
The formation of inclusion complexes in aqueous solution between guest molecules and
cyclodextrin as a host can be detected by spectrophotometric methods if, as a consequence of
the inclusion process, the spectrum of the guest molecules is altered. Such alterations may
include changes in the intensity of an absorption band, shifts in the absorption maxima, and
the occurrence of isosbestic points. If the guest molecules, such as pinacyanol chloride, are
achiral, they may exhibit induced circular dichroism (ICD) in the chiral environment of the
cyclodextrin. Such changes are illustrated in the following section.
4.2.1 Interaction with γ-cyclodextrin - UV/Vis spectra
Figure 4.13a shows the effect of γ-cyclodextrin on the visible spectra of pinacyanol
chloride (2.0·10-4 M) in aqueous solution. As shown in the preceding section, the solution of
the free dye presents as a mixture of several components. The addition of γ-cyclodextrin to
this mixture resulted in a decrease of the intensity of the bands at 600 and 522 nm, and an
increase in the intensity of the band at 545 nm. This increase is accompanied by a red shift,
reaching a value of 556 nm at higher γ-cyclodextrin concentrations. The presence of two
isosbestic points at 587 and 617 nm is noted as the host concentration is increased. Figure
4.13b shows the effect of added γ-cyclodextrin on the visible spectra of pinacyanol chloride
(1.5·10-5 M) in aqueous solution, in which the dye molecules are present mainly as monomers
and dimers. In this case the addition of the cyclodextrin leads to a decrease in the intensity of
400 450 500 550 600 650 7000,0
0,4
0,8
1,2
1,6
2,0
2,4
(a)
617587
545522
556
188
1
81
81
γ-Cyclodextrin concentration / M 1. 0.00 *10-3 2. 1.08 *10-3 3. 2.17 *10-3 4. 5.30 *10-3 5. 1.03 *10-2 6. 2.04 *10-2 7. 3.73 *10-2 8. 7.32 *10-2 Ab
sorb
ance
λ / nm
450 500 550 600 650 700
0,0
0,2
0,4
0,6
0,8
1,0
1,2
1,4
1,6
(b)
544
567
627
600
555
5
1
15
γ-Cyclodextrin concentration / M 1. 0.0 * 10-3
2. 1.5 * 10-3 3. 4.6 * 10-3 4. 2.0 * 10-2 5. 7.0 * 10-2
Abso
rban
ce
λ / nm
Fig. 4.13 (a) The effect of γ-cyclodextrin added to an aqueous solution of pinacyanol chloride (2.0 ·
10-4 M); 0.10 cm cell at room temperature. (b) The effect of γ-cyclodextrin added to an aqueous
solution of pinacyanol chloride (1.5 · 10-5 M); 1.00 cm cell at room temperature.
73

the band at 600 nm and increase in the intensity of the band at 545 nm, the latter accompanied
by a significant shift toward lower energy. Three isosbestic points are visible and appear at
567, 627, and 544 nm.
4.2.1.1 The fourth derivative of the visible spectra
Figure 4.14a shows the fourth derivative spectra of all the spectra given in Figure 4.13a.
The changes in the intensity of the absorption bands and the red shifts of the bands maxima
become more clear and quantitatively can be measured, as indicated in Figure 4.13b. The
intensity increase of the bands at 507, 545.5 and 572 nm, and the intensity decrease of the
bands at 484, 522, and 601 nm are clearly visible in Figure 4.13b. The increase of what we
have shown to be the dimer band at 545.5 nm indicates a favorable interaction between
pinacyanol chloride as dimer and the γ-cyclodextrin host, probably occurring inside the
cyclodextrin cavity. The intensity increase of the band at 507 nm, which we have attributed to
one of the higher aggregates, probably a trimer, indicates likewise that the cyclodextrin host
promotes this aggregation. However, for steric reasons this interaction must occur outside the
cavity or through partial inclusion. The decrease in the intensity of the band at 522 nm, which
we have attributed to the vibronic band of the dimer, may be a consequence of the different
kind of interaction in the dimer or of the change of the environment from aqueous to organic
nonpolar inside the cyclodextrin cavity.
450 475 500 525 550 575 600 625 650
-0,0003
-0,0002
-0,0001
0,0000
0,0001
0,0002
0,0003
0,0004
0,0005
(a)
8
1
γ-Cyclodextrin concentration / M 1. 0.00 *10-3 2. 1.08 *10-3 3. 2.17 *10-3 4. 5.30 *10-3 5. 1.03 *10-2 6. 2.04 *10-2 7. 3.73 *10-2 8. 7.32 *10-2
d4 A/dλ
4
λ / nm
-0,01 0,00 0,01 0,02 0,03 0,04 0,05 0,06 0,07 0,08
0,0000
0,0001
0,0002
0,0003
0,0004
0,0005
λmax
λmax
without γ -CD with higher γ -CD conc.
484 486.5 507 516.5 522 532 545.5 556 572 581.5 601 608
(b)
d4 A/dλ
4
[γ - CD] / M
Fig. 4.14. (a) The fourth derivative of the spectra shown in Figure 4.13a. (b) The peak heights of the
bands in Figure 4.14a as a function of the γ-cyclodextrin concentration.
74

4.2.2 Interaction with γ-cyclodextrin -Circular Dichroism spectra
Figure 4.15 depicts the visible absorption and the circular dichroism spectrum of an
aqueous solution of pinacyanol chloride (7.5 · 10-5 M) with 1.0 · 10-1 M γ- cyclodextrin added.
The CD spectrum shows two main absorption bands at 553 (negative) and 670 nm (positive)
in addition to a small positive band at 603 nm and two shoulders at 516 and 484 nm. Figure
4.16, in which the concentrations of the dye and of the cyclodextrin host are different, shows
spectra, which are very similar to the ones shown in Figure 4.15. Especially the bands of the
CD spectrum in Figure 4.16 have identical positions as in Figure 4.15. Again there are two
main bands with opposite signs at 553 (18 080 cm-1) and 670 nm (14 925 cm-1). The mean of
these two energies is 16 500 cm-1 or 603 nm, which is identical to the position of the
monomer absorption band. It can be safely assumed that the two bands correspond to the two
exciton states of the dye in its dimeric aggregation state. The weak negative band at 516 nm
(19 380 cm-1), the positive CD band at 603 (16 500 cm-1) and the positive shoulder at 726 nm
(13 770 cm-1) which can be seen more clearly in Figure 4.15b, are ascribed tentatively to the
trimer form of pinacyanol chloride. Again, they have an average energy of 16 575 cm-1, which
is identical to the energy of the monomer at 603 nm (16 500 cm-1), and the trimeric aggregates
generate three exciton states.
400 450 500 550 600 650 7000,0
0,5
1,0
1,5
2,0
2,5 1.0 * 10-1 M γ - Cyclodextrin
(a)
607
556
516
484
Abso
rban
ce
λ / nm
400 450 500 550 600 650 700 750-20
-15
-10
-5
0
5
10 1.0 * 10-1 M γ - Cyclodextrin
726
(b)
670
603
553
516
484
∆ε
λ / nm
Fig. 4.15. The visible absorption spectrum (a) and the CD spectrum (b) of pinacyanol chloride (7.5 ·
10-5 M) and γ-cyclodextrin (1.0 · 10-1 M) in aqueous solution; 0.20 cm cell at room temperature.
75
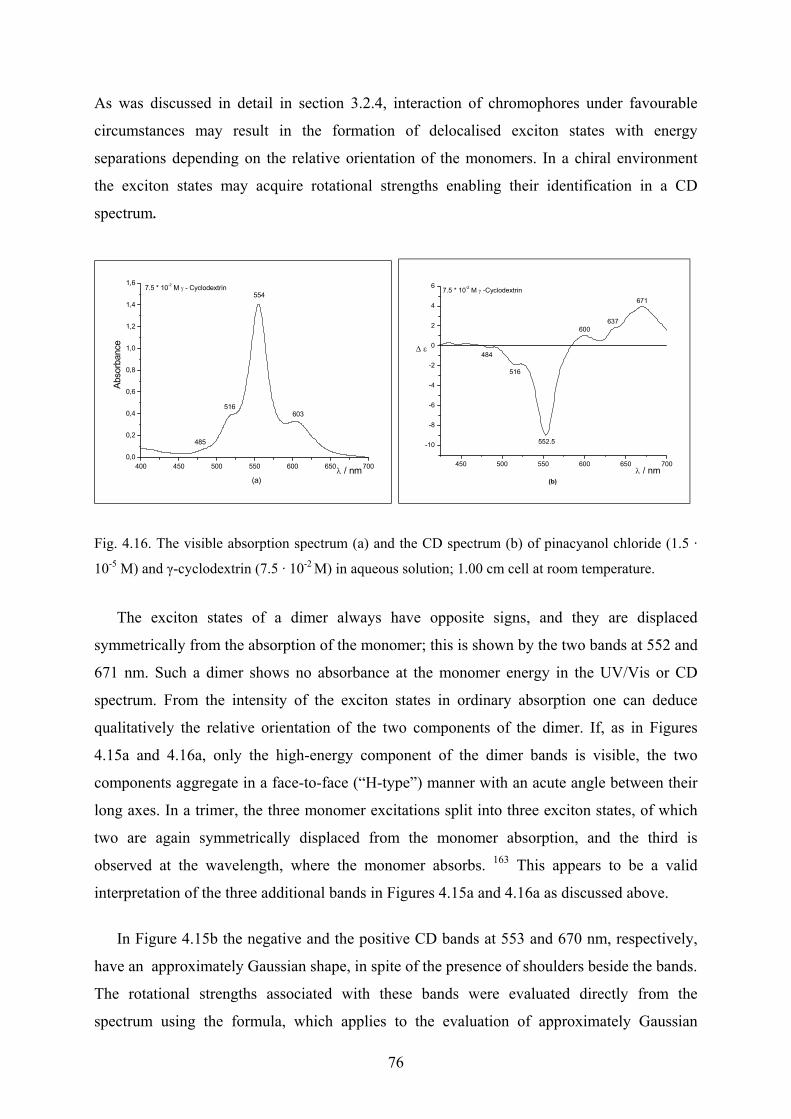
As was discussed in detail in section 3.2.4, interaction of chromophores under favourable
circumstances may result in the formation of delocalised exciton states with energy
separations depending on the relative orientation of the monomers. In a chiral environment
the exciton states may acquire rotational strengths enabling their identification in a CD
spectrum.
400 450 500 550 600 650 7000,0
0,2
0,4
0,6
0,8
1,0
1,2
1,4
1,6
(a)
603
485
516
554 7.5 * 10-2 M γ - Cyclodextrin
Abso
rban
ce
λ / nm
450 500 550 600 650 700
-10
-8
-6
-4
-2
0
2
4
6
484
(b)
637
671
600
552.5
516
7.5 * 10-2 M γ -Cyclodextrin
∆ ε
λ / nm
Fig. 4.16. The visible absorption spectrum (a) and the CD spectrum (b) of pinacyanol chloride (1.5 ·
10-5 M) and γ-cyclodextrin (7.5 · 10-2 M) in aqueous solution; 1.00 cm cell at room temperature.
The exciton states of a dimer always have opposite signs, and they are displaced
symmetrically from the absorption of the monomer; this is shown by the two bands at 552 and
671 nm. Such a dimer shows no absorbance at the monomer energy in the UV/Vis or CD
spectrum. From the intensity of the exciton states in ordinary absorption one can deduce
qualitatively the relative orientation of the two components of the dimer. If, as in Figures
4.15a and 4.16a, only the high-energy component of the dimer bands is visible, the two
components aggregate in a face-to-face (“H-type”) manner with an acute angle between their
long axes. In a trimer, the three monomer excitations split into three exciton states, of which
two are again symmetrically displaced from the monomer absorption, and the third is
observed at the wavelength, where the monomer absorbs. 163 This appears to be a valid
interpretation of the three additional bands in Figures 4.15a and 4.16a as discussed above.
In Figure 4.15b the negative and the positive CD bands at 553 and 670 nm, respectively,
have an approximately Gaussian shape, in spite of the presence of shoulders beside the bands.
The rotational strengths associated with these bands were evaluated directly from the
spectrum using the formula, which applies to the evaluation of approximately Gaussian
76
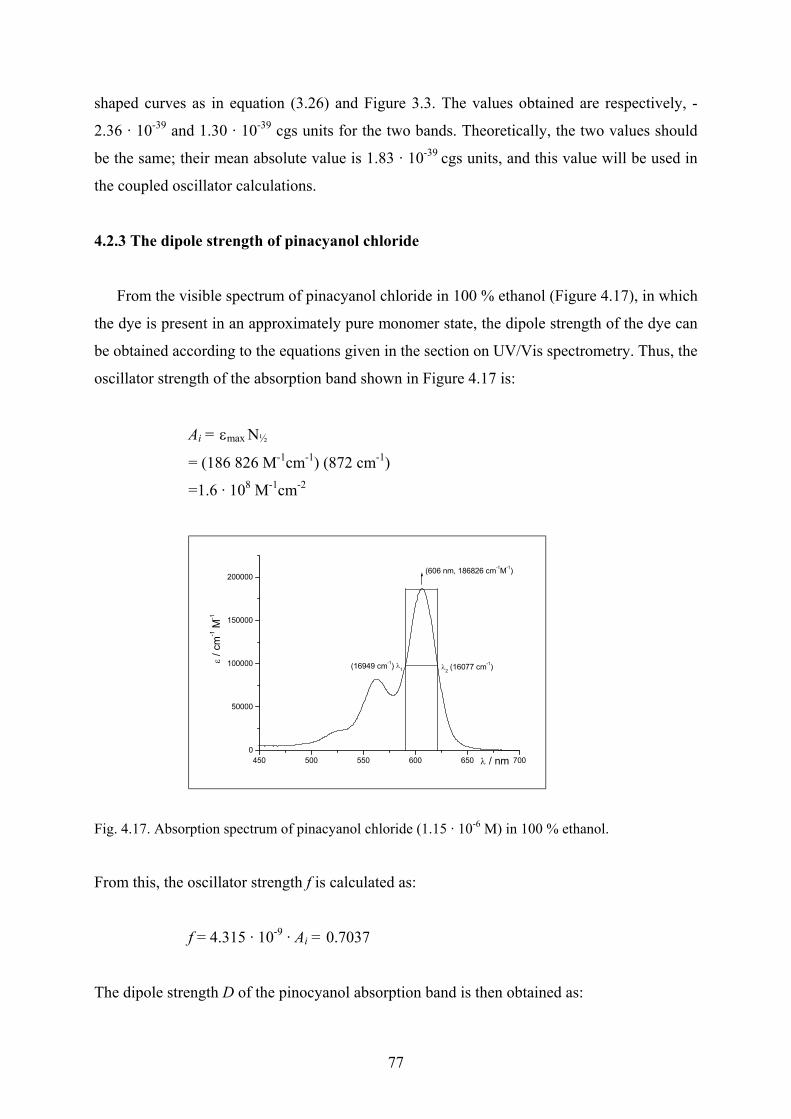
shaped curves as in equation (3.26) and Figure 3.3. The values obtained are respectively, -
2.36 · 10-39 and 1.30 · 10-39 cgs units for the two bands. Theoretically, the two values should
be the same; their mean absolute value is 1.83 · 10-39 cgs units, and this value will be used in
the coupled oscillator calculations.
4.2.3 The dipole strength of pinacyanol chloride
From the visible spectrum of pinacyanol chloride in 100 % ethanol (Figure 4.17), in which
the dye is present in an approximately pure monomer state, the dipole strength of the dye can
be obtained according to the equations given in the section on UV/Vis spectrometry. Thus, the
oscillator strength of the absorption band shown in Figure 4.17 is:
Ai = εmax N½
= (186 826 M-1cm-1) (872 cm-1)
=1.6 · 108 M-1cm-2
450 500 550 600 650 7000
50000
100000
150000
200000
(16949 cm-1) λ2 (16077 cm-1)λ1
(606 nm, 186826 cm-1M-1)
ε / c
m-1 M
-1
λ / nm
Fig. 4.17. Absorption spectrum of pinacyanol chloride (1.15 · 10-6 M) in 100 % ethanol.
From this, the oscillator strength f is calculated as:
f = 4.315 · 10-9 · Ai = 0.7037
The dipole strength D of the pinocyanol absorption band is then obtained as:
77
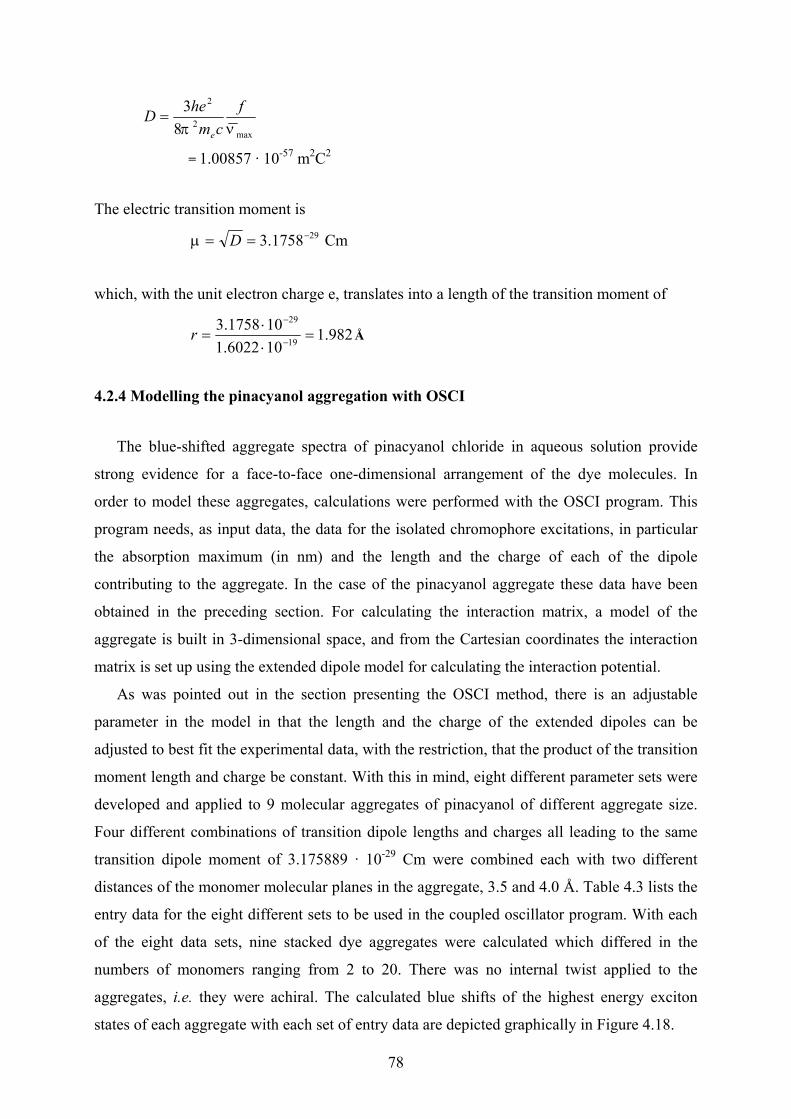
max2
2
83
νπf
cmheD
e
=
= 1.00857 · 10-57 m2C2
The electric transition moment is
291758.3 −== Dµ Cm
which, with the unit electron charge e, translates into a length of the transition moment of
982.1106022.1101758.3
19
29
=⋅⋅
= −
−
r Å
4.2.4 Modelling the pinacyanol aggregation with OSCI
The blue-shifted aggregate spectra of pinacyanol chloride in aqueous solution provide
strong evidence for a face-to-face one-dimensional arrangement of the dye molecules. In
order to model these aggregates, calculations were performed with the OSCI program. This
program needs, as input data, the data for the isolated chromophore excitations, in particular
the absorption maximum (in nm) and the length and the charge of each of the dipole
contributing to the aggregate. In the case of the pinacyanol aggregate these data have been
obtained in the preceding section. For calculating the interaction matrix, a model of the
aggregate is built in 3-dimensional space, and from the Cartesian coordinates the interaction
matrix is set up using the extended dipole model for calculating the interaction potential.
As was pointed out in the section presenting the OSCI method, there is an adjustable
parameter in the model in that the length and the charge of the extended dipoles can be
adjusted to best fit the experimental data, with the restriction, that the product of the transition
moment length and charge be constant. With this in mind, eight different parameter sets were
developed and applied to 9 molecular aggregates of pinacyanol of different aggregate size.
Four different combinations of transition dipole lengths and charges all leading to the same
transition dipole moment of 3.175889 · 10-29 Cm were combined each with two different
distances of the monomer molecular planes in the aggregate, 3.5 and 4.0 Å. Table 4.3 lists the
entry data for the eight different sets to be used in the coupled oscillator program. With each
of the eight data sets, nine stacked dye aggregates were calculated which differed in the
numbers of monomers ranging from 2 to 20. There was no internal twist applied to the
aggregates, i.e. they were achiral. The calculated blue shifts of the highest energy exciton
states of each aggregate with each set of entry data are depicted graphically in Figure 4.18.
78

Table 4.3. The eight different entry sets for the OSCI program.
model
#
dipole charge
/10-20 C dipole length
/ Å
monomer
distance / Å
1. 16.0219 1.9821 3.5
2. 8.01095 3.9642 3.5
3. 4.00547 7.9284 3.5
4. 2.00274 15.857 3.5
5. 16.0219 1.9821 4.0
6. 8.01095 3.9642 4.0
7. 4.00547 7.9284 4.0
8. 2.00274 15.857 4.0
Figure 4.18 shows graphically the calculated wavelength shifts of the nine aggregates
calculated with the 8 different data sets. The experimentally observed wavelength shift of the
dimer relative to the monomer is 55 nm. The data set that comes closest to this value is #7,
which gives a blue shift of 540.6 nm. By fine-tuning the dipole length and charge to 8.50 Å
and 3.7361 · 10-20 C, respectively, the experimental result is reproduced quantitatively. We
call this dipole, together with the distance of 4 Å and 0° angle twist the data set #7*. The
maximum wavelength values belong to the points from a to i in figure 4.18 are respectively
546, 517.5, 491, 484, 479, 475, 470, and 460 nm.
With increasing aggregate size the blue-shift increases, but not in a linear manner, but
approaching a limiting value instead. With an aggregate size of 20 stacked dye molecules the
limit is not quite reached, but a good estimate is obtained where the infinite aggregate might
absorb. The different data sets differ significantly in the predicted blue-shift of the infinite
aggregate, from about 60 nm for set # 8 to more than 340 nm for set # 1. With the set which
reproduces the dimer shift rather well (# 7*) the calculated wavelength shift of the very large
aggregate is 125 nm which corresponds to an absorption maximum at 476 nm in surprisingly
good agreement with the value found for the limiting aggregate (Figure 4.18).
79

0 2 4 6 8 10 12 14 16 18 20
50
100
150
200
250
300
350
ihgfed
c
b
a 8
4
7#
7
5
6
3
2
1
∆λ/ n
m
Number of dye molecules in the aggregate
Fig. 4.18. The blue shift of pinacyanol chloride as a function of its aggregation state calculated with
different values of dipole length and charge.
4.2.5 Calculating the twist angle of pinacyanol chloride in γ-cyclodextrin
The experimental value for the rotational strength of the two exciton states of the
pinacyanol dimer in γ-cyclodextrin is 1.83 · 10-39 cgs units. If this rotational strength is due to
a twist of the two dye molecules against each other, OSCI allows to calculate the twist angle.
For this, different twist angles are used as input data, together with the data derived in the
preceding section, and oscillator and rotational strengths calculated on the basis of the
assumed structure. Entering the data of set # 7* into OSCI and increasing the twist angle in
steps of 0.3° one thus obtains the rotational strength as a function of the twist angle of the dye
molecules against each other.
Figure 4.19a shows that this function is linear: the greater the twist, the greater the
rotational strength. The angle, which is appropriate to the observed rotational strength from
the CD spectrum, is 1.1°. Figure 4.19b is a three-dimensional representation of the two
identical dipoles of pinacyanol chloride with a twisting angle of 1.1°.
80
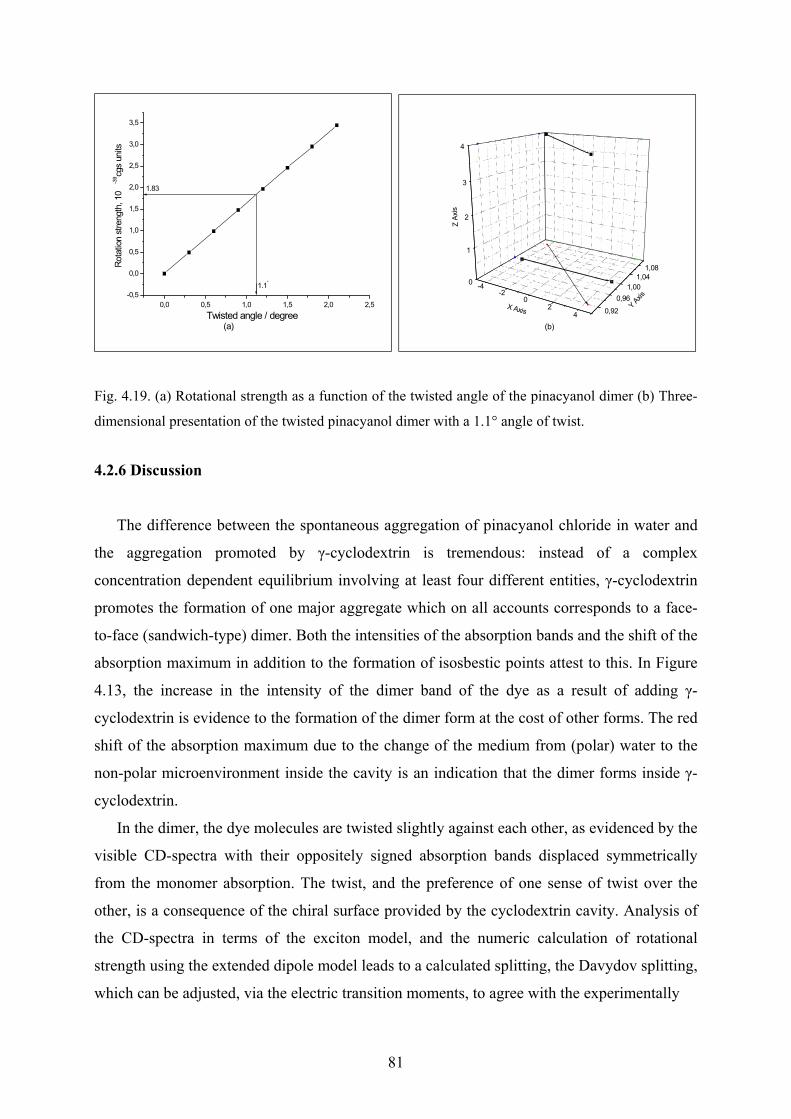
0,0 0,5 1,0 1,5 2,0 2,5-0,5
0,0
0,5
1,0
1,5
2,0
2,5
3,0
3,5
(a)
1.1°
1.83
Rota
tion
stre
ngth
, 10
-39 cg
s un
its
Twisted angle / degree
-4-2
02
4
0
1
2
3
4
0,92
0,961,00
1,041,08
(b)
Z Ax
is
Y Axis
X Axis
Fig. 4.19. (a) Rotational strength as a function of the twisted angle of the pinacyanol dimer (b) Three-
dimensional presentation of the twisted pinacyanol dimer with a 1.1° angle of twist.
4.2.6 Discussion
The difference between the spontaneous aggregation of pinacyanol chloride in water and
the aggregation promoted by γ-cyclodextrin is tremendous: instead of a complex
concentration dependent equilibrium involving at least four different entities, γ-cyclodextrin
promotes the formation of one major aggregate which on all accounts corresponds to a face-
to-face (sandwich-type) dimer. Both the intensities of the absorption bands and the shift of the
absorption maximum in addition to the formation of isosbestic points attest to this. In Figure
4.13, the increase in the intensity of the dimer band of the dye as a result of adding γ-
cyclodextrin is evidence to the formation of the dimer form at the cost of other forms. The red
shift of the absorption maximum due to the change of the medium from (polar) water to the
non-polar microenvironment inside the cavity is an indication that the dimer forms inside γ-
cyclodextrin.
In the dimer, the dye molecules are twisted slightly against each other, as evidenced by the
visible CD-spectra with their oppositely signed absorption bands displaced symmetrically
from the monomer absorption. The twist, and the preference of one sense of twist over the
other, is a consequence of the chiral surface provided by the cyclodextrin cavity. Analysis of
the CD-spectra in terms of the exciton model, and the numeric calculation of rotational
strength using the extended dipole model leads to a calculated splitting, the Davydov splitting,
which can be adjusted, via the electric transition moments, to agree with the experimentally
81

observed splitting. Modelling the pinacyanol chloride with OSCI gives a value of ~ 1° as the
twisting angle of the dimer in the γ-cyclodextrin cavity. The positive sign of the twisting
angle is deduced from the positive sign of the long wavelength CD band (positive exciton
chirality).
In Fig. 4.14, the intensity of the band at 507 nm, which we have attributed to one of the
higher aggregates, probably a trimer, increases with addition of cyclodextrin in the solution.
This increase indicates that the cyclodextrin host promotes not only the dimerization of
pinacyanol chloride, but also higher aggregation, albeit to a lesser degree. For steric reasons,
this type of aggregation must occur outside the cavity or through partial inclusion. In the CD
spectrum of figure 4.15b, the weak negative band at 516 nm, the positive CD band at 603 and
the positive shoulder at 726 nm are ascribed tentatively to this trimer. In this type of aggregate
the three monomer excitations split into three exciton states, of which two are again
symmetrically displaced from the monomer absorption, and the third is observed where the
monomer absorbs. The decrease in the intensity of the band at 522 nm, which we have
attributed to the vibronic band of the dimer, may be a consequence of the different kind of
interaction in the dimer or the change of the environment from aqueous to organic non-polar
inside the cyclodextrin cavity.
82

4.3 Interaction of pinacyanol chloride with alginates 4.3.1 Manucol-LHF; characterization by CD
Figure 4.20 shows the CD spectrum of Manucol-LHF between 195 and 250 nm. The
spectrum has been taken in aqueous solution, and the concentration is 0.80 mg/ml,
corresponding to 4.0 · 10-4 M, if monomeric sodium mannuronate or guluronate, C6H7O6Na,
are taken as the molecular mass unit. The spectrum shows a positive peak at 200 nm, and a
negative trough at 215. From the ratio of the peak to the trough amplitude (Figure 4.20) the
composition of Manucol-LHF, in terms of mannuronate and guluronate can be calculated by
using the equation (2.1). 62 The calculated values are 62.9 and 37.1 %, respectively.
Therefore, Manucol-LHF that was used in the following aggregation experiments contains an
excess of mannuronate over guluronate in the ratio of 1.7 : 1.
190 200 210 220 230 240 250
-40
-30
-20
-10
0
10
peak/trough < 1
Man./Gul.= 2 (peak / trough) = 2 (31.76 / 37.40) = 1.698% Man. = 62.9%% Gul. = 37.1%
peak
troug
h
∆ ε
λ / nm
Fig. 4.20. CD-spectrum of Manucol-LHF (0.80 mg/ml); pH = 6.80, and cell width is 1.00 cm.
4.3.2 Aggregation of pinacyanol chloride with Manucol-LHF
4.3.2.1 UV/Vis and CD spectra
Ionic polymers increase the inherent tendency of many cyanine dyes to form aggregate in
aqueous solution, a phenomenon that is generally called metachromasia. 5 The effect of
metachromasia can be shown in different ways; one of the most obvious is the change in
absorbance, which accompanies the addition of the polymer to a dye solution. Figure 4.21
presents the UV/Vis spectra of a 1.5 · 10-5 M aqueous solution of pinacyanol chloride in the
83
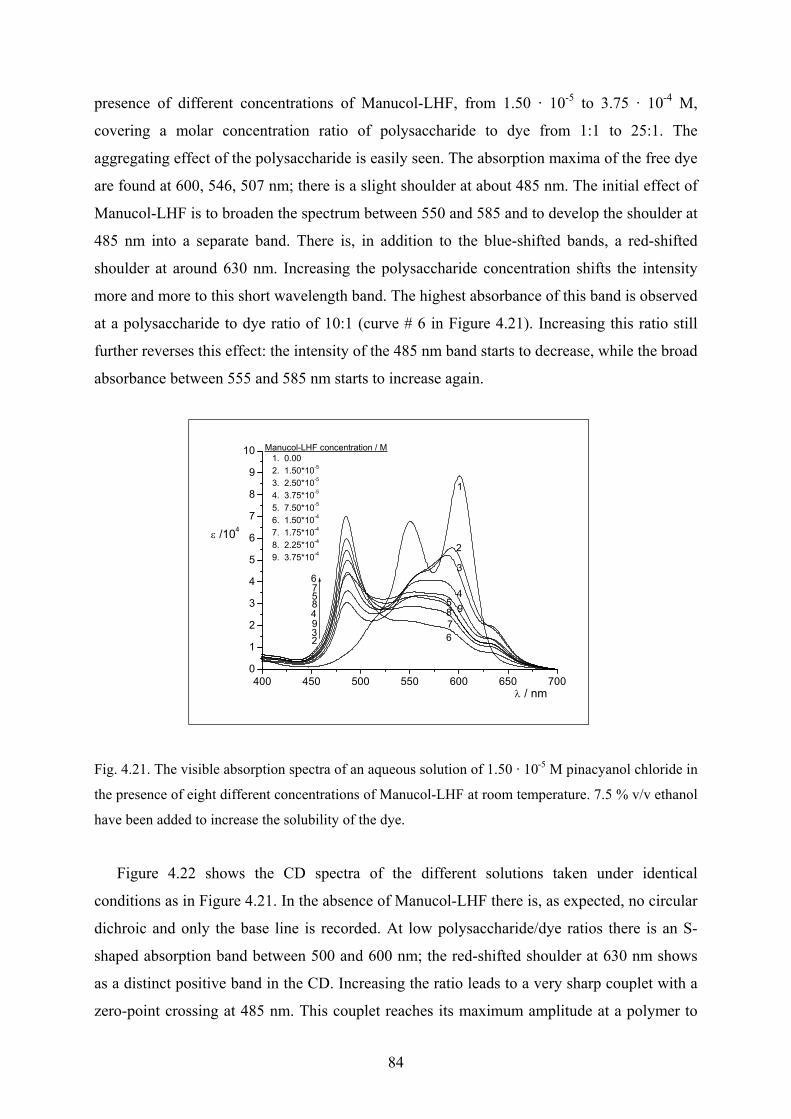
presence of different concentrations of Manucol-LHF, from 1.50 · 10-5 to 3.75 · 10-4 M,
covering a molar concentration ratio of polysaccharide to dye from 1:1 to 25:1. The
aggregating effect of the polysaccharide is easily seen. The absorption maxima of the free dye
are found at 600, 546, 507 nm; there is a slight shoulder at about 485 nm. The initial effect of
Manucol-LHF is to broaden the spectrum between 550 and 585 and to develop the shoulder at
485 nm into a separate band. There is, in addition to the blue-shifted bands, a red-shifted
shoulder at around 630 nm. Increasing the polysaccharide concentration shifts the intensity
more and more to this short wavelength band. The highest absorbance of this band is observed
at a polysaccharide to dye ratio of 10:1 (curve # 6 in Figure 4.21). Increasing this ratio still
further reverses this effect: the intensity of the 485 nm band starts to decrease, while the broad
absorbance between 555 and 585 nm starts to increase again.
400 450 500 550 600 650 7000
1
2
3
4
5
6
7
8
9
10
23948576
9876
54
3
2
1
Manucol-LHF concentration / M 1. 0.00 2. 1.50*10-5 3. 2.50*10-5 4. 3.75*10-5 5. 7.50*10-5 6. 1.50*10-4 7. 1.75*10-4 8. 2.25*10-4 9. 3.75*10-4
ε /104
λ / nm
Fig. 4.21. The visible absorption spectra of an aqueous solution of 1.50 · 10-5 M pinacyanol chloride in
the presence of eight different concentrations of Manucol-LHF at room temperature. 7.5 % v/v ethanol
have been added to increase the solubility of the dye.
Figure 4.22 shows the CD spectra of the different solutions taken under identical
conditions as in Figure 4.21. In the absence of Manucol-LHF there is, as expected, no circular
dichroic and only the base line is recorded. At low polysaccharide/dye ratios there is an S-
shaped absorption band between 500 and 600 nm; the red-shifted shoulder at 630 nm shows
as a distinct positive band in the CD. Increasing the ratio leads to a very sharp couplet with a
zero-point crossing at 485 nm. This couplet reaches its maximum amplitude at a polymer to
84
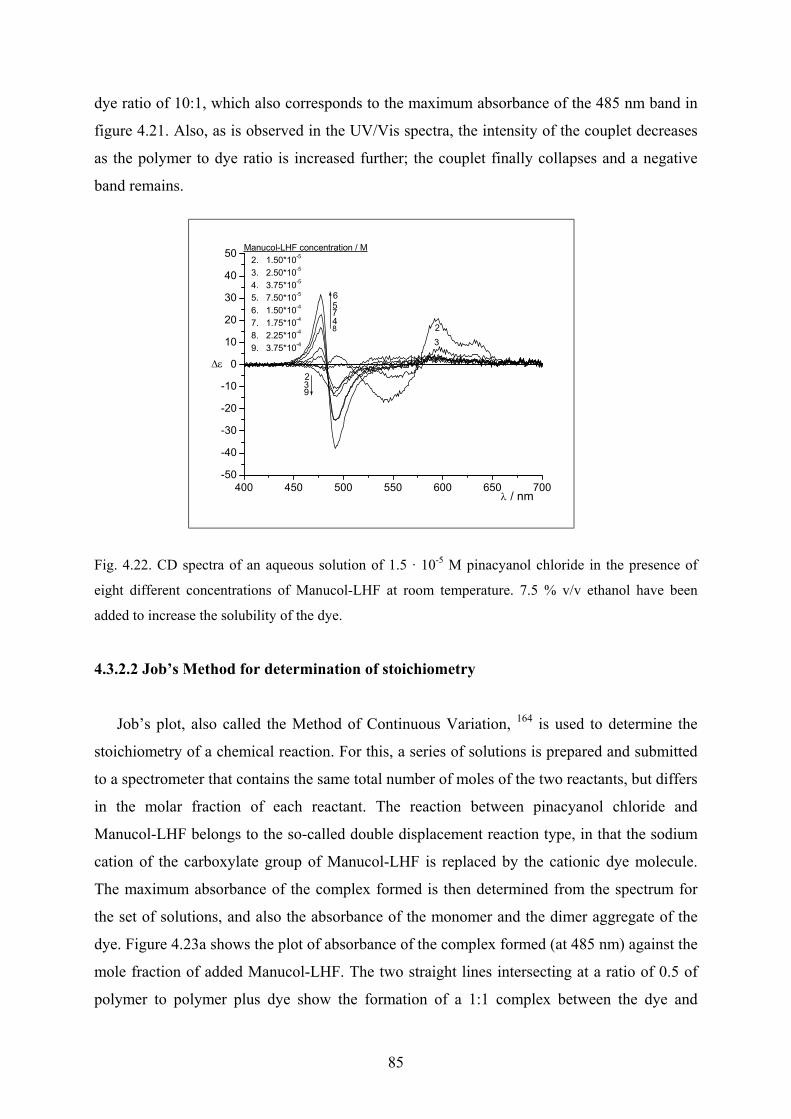
dye ratio of 10:1, which also corresponds to the maximum absorbance of the 485 nm band in
figure 4.21. Also, as is observed in the UV/Vis spectra, the intensity of the couplet decreases
as the polymer to dye ratio is increased further; the couplet finally collapses and a negative
band remains.
400 450 500 550 600 650 700-50
-40
-30
-20
-10
0
10
20
30
40
50
32
932
65748
Manucol-LHF concentration / M 2. 1.50*10-5 3. 2.50*10-5 4. 3.75*10-5 5. 7.50*10-5 6. 1.50*10-4 7. 1.75*10-4 8. 2.25*10-4 9. 3.75*10-4 ∆ε
λ / nm
Fig. 4.22. CD spectra of an aqueous solution of 1.5 · 10-5 M pinacyanol chloride in the presence of
eight different concentrations of Manucol-LHF at room temperature. 7.5 % v/v ethanol have been
added to increase the solubility of the dye.
4.3.2.2 Job’s Method for determination of stoichiometry
Job’s plot, also called the Method of Continuous Variation, 164 is used to determine the
stoichiometry of a chemical reaction. For this, a series of solutions is prepared and submitted
to a spectrometer that contains the same total number of moles of the two reactants, but differs
in the molar fraction of each reactant. The reaction between pinacyanol chloride and
Manucol-LHF belongs to the so-called double displacement reaction type, in that the sodium
cation of the carboxylate group of Manucol-LHF is replaced by the cationic dye molecule.
The maximum absorbance of the complex formed is then determined from the spectrum for
the set of solutions, and also the absorbance of the monomer and the dimer aggregate of the
dye. Figure 4.23a shows the plot of absorbance of the complex formed (at 485 nm) against the
mole fraction of added Manucol-LHF. The two straight lines intersecting at a ratio of 0.5 of
polymer to polymer plus dye show the formation of a 1:1 complex between the dye and
85
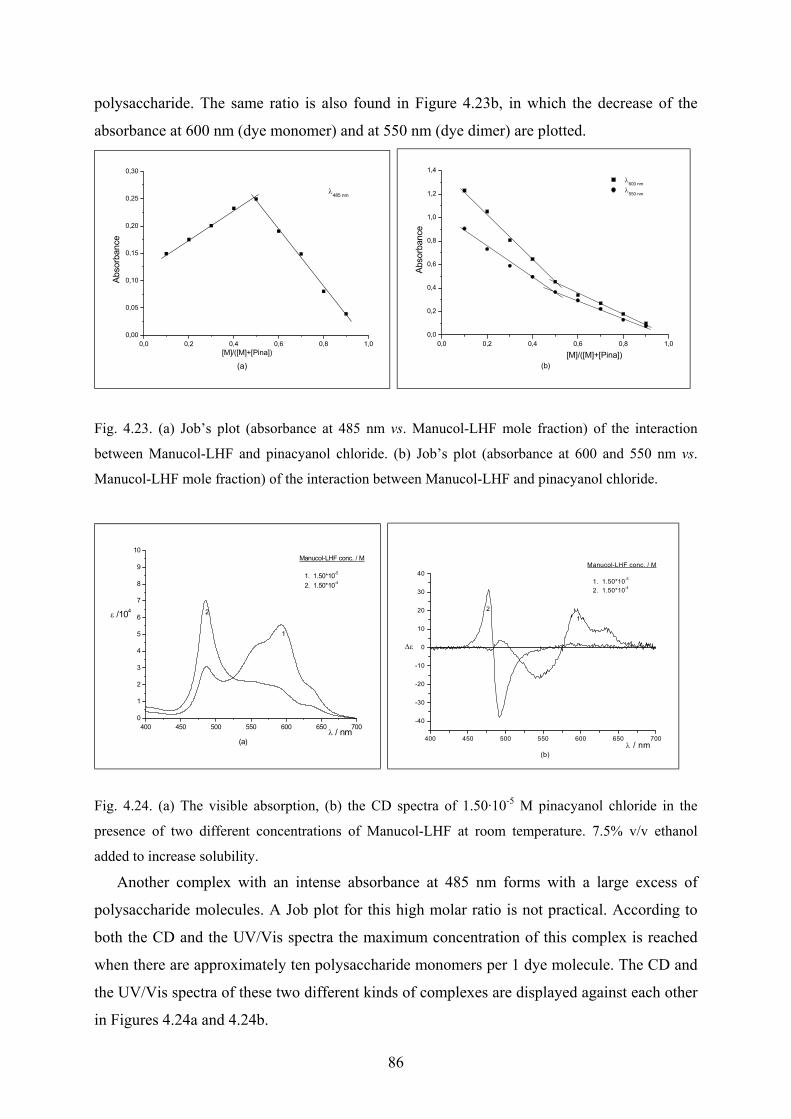
polysaccharide. The same ratio is also found in Figure 4.23b, in which the decrease of the
absorbance at 600 nm (dye monomer) and at 550 nm (dye dimer) are plotted.
0,0 0,2 0,4 0,6 0,8 1,00,00
0,05
0,10
0,15
0,20
0,25
0,30
(a)[M]/([M]+[Pina])
λ485 nm
Abso
rban
ce
0,0 0,2 0,4 0,6 0,8 1,00,0
0,2
0,4
0,6
0,8
1,0
1,2
1,4
(b)
λ600 nm λ550 nm
Abso
rban
ce
[M]/([M]+[Pina])
Fig. 4.23. (a) Job’s plot (absorbance at 485 nm vs. Manucol-LHF mole fraction) of the interaction
between Manucol-LHF and pinacyanol chloride. (b) Job’s plot (absorbance at 600 and 550 nm vs.
Manucol-LHF mole fraction) of the interaction between Manucol-LHF and pinacyanol chloride.
400 450 500 550 600 650 7000
1
2
3
4
5
6
7
8
9
10
(a)
2
1
Manucol-LHF conc. / M 1. 1.50*10-5 2. 1.50*10-4
ε /104
λ / nm
400 450 500 550 600 650 700
-40
-30
-20
-10
0
10
20
30
40
(b)
21
Manucol-LHF conc. / M 1. 1.50*10-5 2. 1.50*10-4
∆ε
λ / nm
Fig. 4.24. (a) The visible absorption, (b) the CD spectra of 1.50·10-5 M pinacyanol chloride in the
presence of two different concentrations of Manucol-LHF at room temperature. 7.5% v/v ethanol
added to increase solubility.
Another complex with an intense absorbance at 485 nm forms with a large excess of
polysaccharide molecules. A Job plot for this high molar ratio is not practical. According to
both the CD and the UV/Vis spectra the maximum concentration of this complex is reached
when there are approximately ten polysaccharide monomers per 1 dye molecule. The CD and
the UV/Vis spectra of these two different kinds of complexes are displayed against each other
in Figures 4.24a and 4.24b.
86
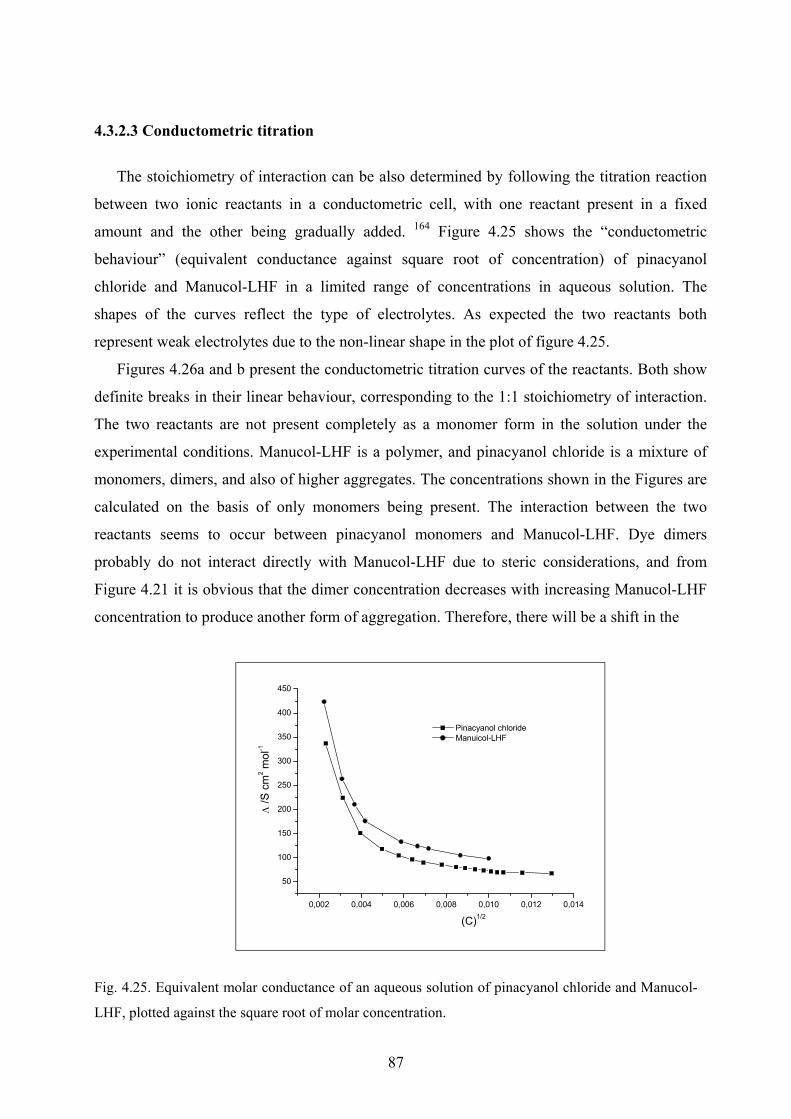
4.3.2.3 Conductometric titration
The stoichiometry of interaction can be also determined by following the titration reaction
between two ionic reactants in a conductometric cell, with one reactant present in a fixed
amount and the other being gradually added. 164 Figure 4.25 shows the “conductometric
behaviour” (equivalent conductance against square root of concentration) of pinacyanol
chloride and Manucol-LHF in a limited range of concentrations in aqueous solution. The
shapes of the curves reflect the type of electrolytes. As expected the two reactants both
represent weak electrolytes due to the non-linear shape in the plot of figure 4.25.
Figures 4.26a and b present the conductometric titration curves of the reactants. Both show
definite breaks in their linear behaviour, corresponding to the 1:1 stoichiometry of interaction.
The two reactants are not present completely as a monomer form in the solution under the
experimental conditions. Manucol-LHF is a polymer, and pinacyanol chloride is a mixture of
monomers, dimers, and also of higher aggregates. The concentrations shown in the Figures are
calculated on the basis of only monomers being present. The interaction between the two
reactants seems to occur between pinacyanol monomers and Manucol-LHF. Dye dimers
probably do not interact directly with Manucol-LHF due to steric considerations, and from
Figure 4.21 it is obvious that the dimer concentration decreases with increasing Manucol-LHF
concentration to produce another form of aggregation. Therefore, there will be a shift in the
0,002 0,004 0,006 0,008 0,010 0,012 0,014
50
100
150
200
250
300
350
400
450
Pinacyanol chloride Manuicol-LHF
Λ /S
cm
2 mol
-1
(C)1/2
Fig. 4.25. Equivalent molar conductance of an aqueous solution of pinacyanol chloride and Manucol-
LHF, plotted against the square root of molar concentration.
87
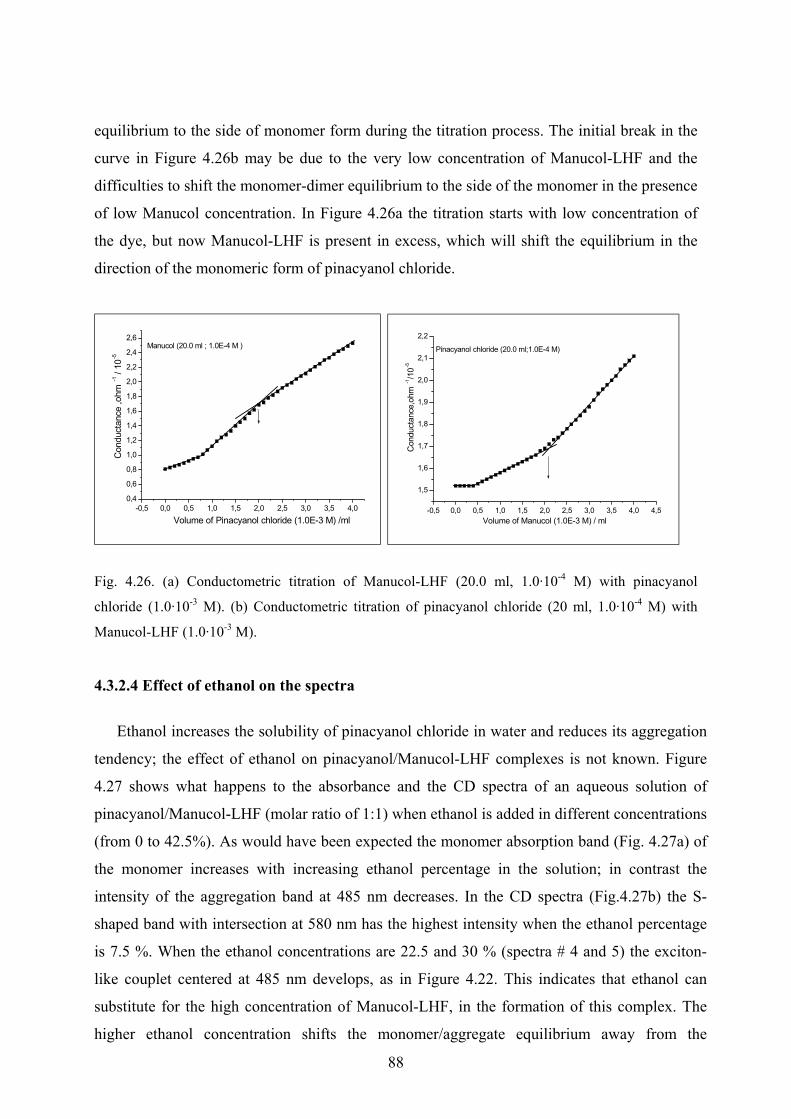
equilibrium to the side of monomer form during the titration process. The initial break in the
curve in Figure 4.26b may be due to the very low concentration of Manucol-LHF and the
difficulties to shift the monomer-dimer equilibrium to the side of the monomer in the presence
of low Manucol concentration. In Figure 4.26a the titration starts with low concentration of
the dye, but now Manucol-LHF is present in excess, which will shift the equilibrium in the
direction of the monomeric form of pinacyanol chloride.
-0,5 0,0 0,5 1,0 1,5 2,0 2,5 3,0 3,5 4,00,4
0,6
0,8
1,0
1,2
1,4
1,6
1,8
2,0
2,2
2,4
2,6Manucol (20.0 ml ; 1.0E-4 M )
Con
duct
ance
,ohm
-1 /
10-5
Volume of Pinacyanol chloride (1.0E-3 M) /ml
-0,5 0,0 0,5 1,0 1,5 2,0 2,5 3,0 3,5 4,0 4,5
1,5
1,6
1,7
1,8
1,9
2,0
2,1
2,2
Pinacyanol chloride (20.0 ml;1.0E-4 M)
Con
duct
ance
,ohm
-1/1
0-5
Volume of Manucol (1.0E-3 M) / ml
Fig. 4.26. (a) Conductometric titration of Manucol-LHF (20.0 ml, 1.0·10-4 M) with pinacyanol
chloride (1.0·10-3 M). (b) Conductometric titration of pinacyanol chloride (20 ml, 1.0·10-4 M) with
Manucol-LHF (1.0·10-3 M).
4.3.2.4 Effect of ethanol on the spectra
Ethanol increases the solubility of pinacyanol chloride in water and reduces its aggregation
tendency; the effect of ethanol on pinacyanol/Manucol-LHF complexes is not known. Figure
4.27 shows what happens to the absorbance and the CD spectra of an aqueous solution of
pinacyanol/Manucol-LHF (molar ratio of 1:1) when ethanol is added in different concentrations
(from 0 to 42.5%). As would have been expected the monomer absorption band (Fig. 4.27a) of
the monomer increases with increasing ethanol percentage in the solution; in contrast the
intensity of the aggregation band at 485 nm decreases. In the CD spectra (Fig.4.27b) the S-
shaped band with intersection at 580 nm has the highest intensity when the ethanol percentage
is 7.5 %. When the ethanol concentrations are 22.5 and 30 % (spectra # 4 and 5) the exciton-
like couplet centered at 485 nm develops, as in Figure 4.22. This indicates that ethanol can
substitute for the high concentration of Manucol-LHF, in the formation of this complex. The
higher ethanol concentration shifts the monomer/aggregate equilibrium away from the
88
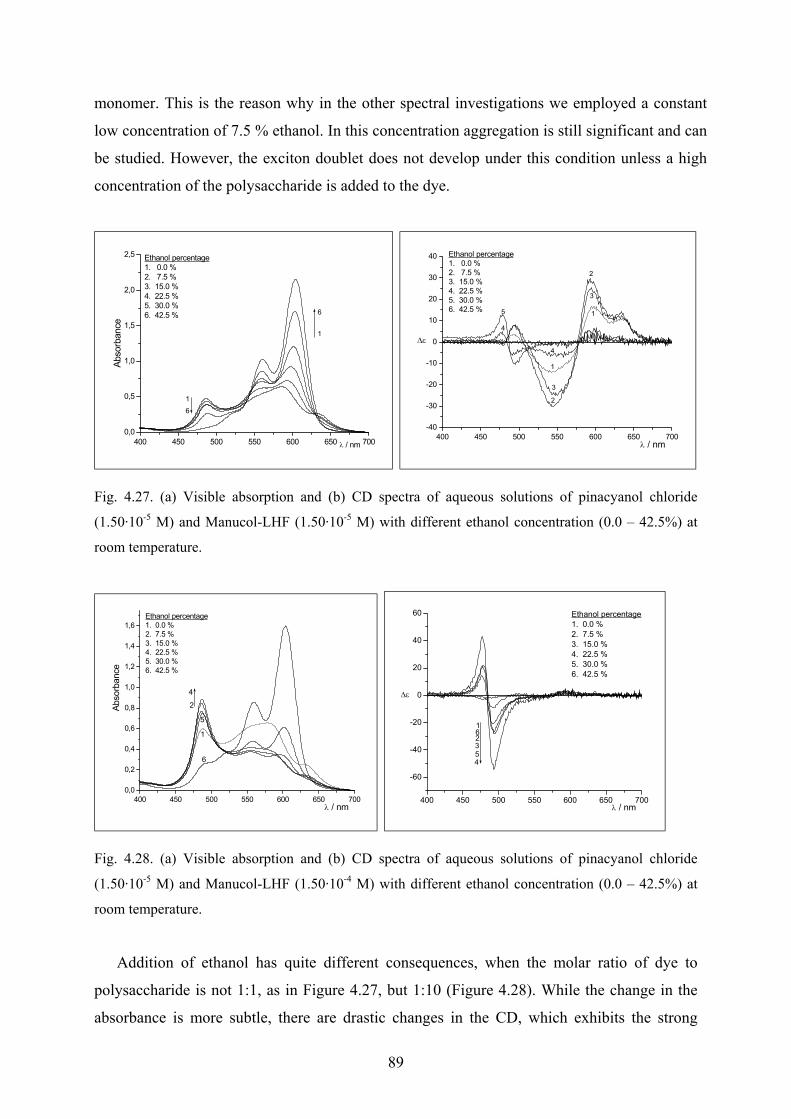
monomer. This is the reason why in the other spectral investigations we employed a constant
low concentration of 7.5 % ethanol. In this concentration aggregation is still significant and can
be studied. However, the exciton doublet does not develop under this condition unless a high
concentration of the polysaccharide is added to the dye.
400 450 500 550 600 650 7000,0
0,5
1,0
1,5
2,0
2,5
61
6
1
Ethanol percentage1. 0.0 % 2. 7.5 % 3. 15.0 % 4. 22.5 %5. 30.0 % 6. 42.5 %
Abso
rban
ce
λ / nm
400 450 500 550 600 650 700-40
-30
-20
-10
0
10
20
30
40
2
3
1
4
5
4
1
3
2
Ethanol percentage1. 0.0 % 2. 7.5 % 3. 15.0 % 4. 22.5 %5. 30.0 % 6. 42.5 %
∆ε
λ / nm
Fig. 4.27. (a) Visible absorption and (b) CD spectra of aqueous solutions of pinacyanol chloride
(1.50·10-5 M) and Manucol-LHF (1.50·10-5 M) with different ethanol concentration (0.0 – 42.5%) at
room temperature.
400 450 500 550 600 650 7000,0
0,2
0,4
0,6
0,8
1,0
1,2
1,4
1,6
4
2
5
1
6
Ethanol percentage1. 0.0 % 2. 7.5 % 3. 15.0 % 4. 22.5 %5. 30.0 % 6. 42.5 %
Abso
rban
ce
λ / nm
400 450 500 550 600 650 700
-60
-40
-20
0
20
40
60
2354
61
Ethanol percentage1. 0.0 % 2. 7.5 % 3. 15.0 % 4. 22.5 %5. 30.0 % 6. 42.5 %
∆ε
λ / nm
Fig. 4.28. (a) Visible absorption and (b) CD spectra of aqueous solutions of pinacyanol chloride
(1.50·10-5 M) and Manucol-LHF (1.50·10-4 M) with different ethanol concentration (0.0 – 42.5%) at
room temperature.
Addition of ethanol has quite different consequences, when the molar ratio of dye to
polysaccharide is not 1:1, as in Figure 4.27, but 1:10 (Figure 4.28). While the change in the
absorbance is more subtle, there are drastic changes in the CD, which exhibits the strong
89
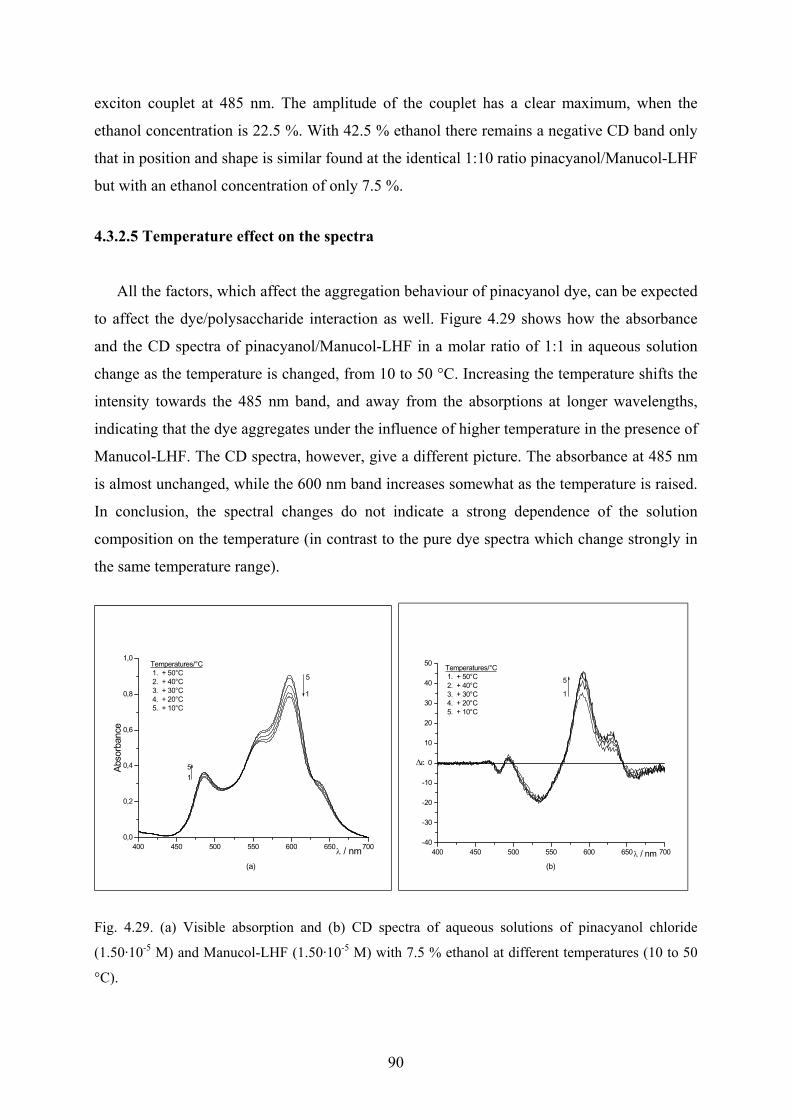
exciton couplet at 485 nm. The amplitude of the couplet has a clear maximum, when the
ethanol concentration is 22.5 %. With 42.5 % ethanol there remains a negative CD band only
that in position and shape is similar found at the identical 1:10 ratio pinacyanol/Manucol-LHF
but with an ethanol concentration of only 7.5 %.
4.3.2.5 Temperature effect on the spectra
All the factors, which affect the aggregation behaviour of pinacyanol dye, can be expected
to affect the dye/polysaccharide interaction as well. Figure 4.29 shows how the absorbance
and the CD spectra of pinacyanol/Manucol-LHF in a molar ratio of 1:1 in aqueous solution
change as the temperature is changed, from 10 to 50 °C. Increasing the temperature shifts the
intensity towards the 485 nm band, and away from the absorptions at longer wavelengths,
indicating that the dye aggregates under the influence of higher temperature in the presence of
Manucol-LHF. The CD spectra, however, give a different picture. The absorbance at 485 nm
is almost unchanged, while the 600 nm band increases somewhat as the temperature is raised.
In conclusion, the spectral changes do not indicate a strong dependence of the solution
composition on the temperature (in contrast to the pure dye spectra which change strongly in
the same temperature range).
400 450 500 550 600 650 7000,0
0,2
0,4
0,6
0,8
1,0
(a)
51
1
5
Temperatures/°C 1. + 50°C 2. + 40°C 3. + 30°C 4. + 20°C 5. + 10°C
Abso
rban
ce
λ / nm
400 450 500 550 600 650 700-40
-30
-20
-10
0
10
20
30
40
50
5
1
(b)
Temperatures/°C 1. + 50°C 2. + 40°C 3. + 30°C 4. + 20°C 5. + 10°C
∆ε
λ / nm
Fig. 4.29. (a) Visible absorption and (b) CD spectra of aqueous solutions of pinacyanol chloride
(1.50·10-5 M) and Manucol-LHF (1.50·10-5 M) with 7.5 % ethanol at different temperatures (10 to 50
°C).
90
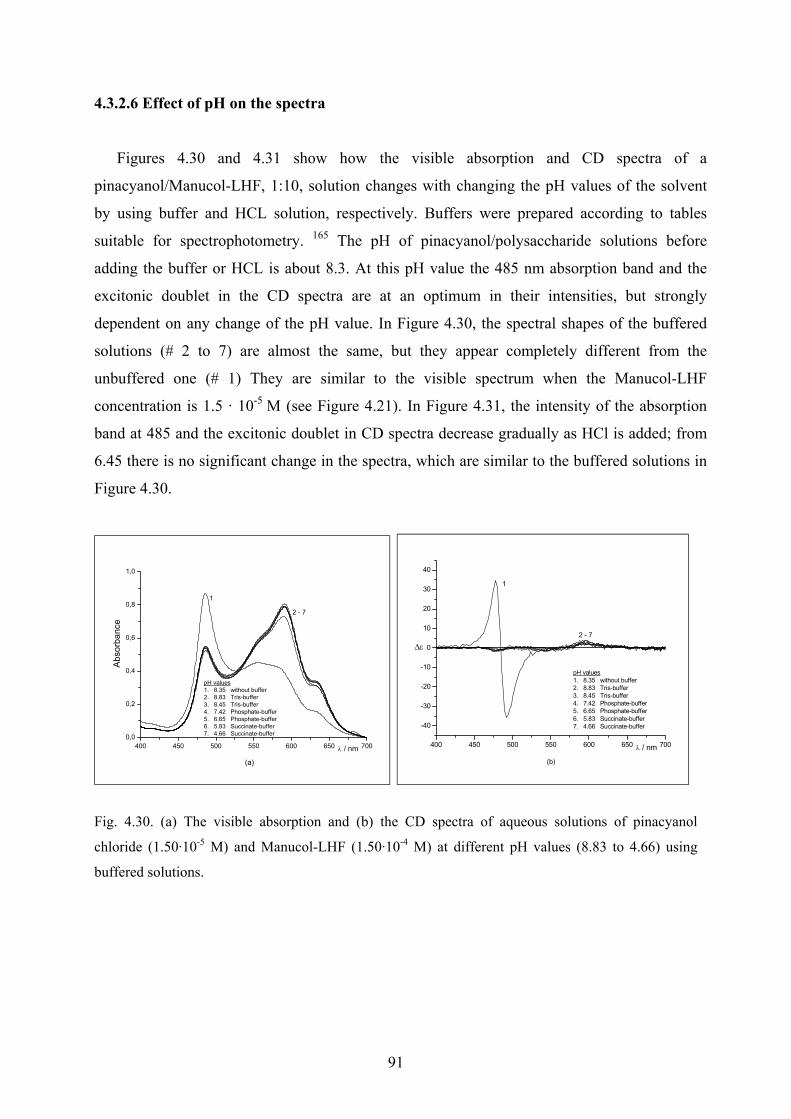
4.3.2.6 Effect of pH on the spectra
Figures 4.30 and 4.31 show how the visible absorption and CD spectra of a
pinacyanol/Manucol-LHF, 1:10, solution changes with changing the pH values of the solvent
by using buffer and HCL solution, respectively. Buffers were prepared according to tables
suitable for spectrophotometry. 165 The pH of pinacyanol/polysaccharide solutions before
adding the buffer or HCL is about 8.3. At this pH value the 485 nm absorption band and the
excitonic doublet in the CD spectra are at an optimum in their intensities, but strongly
dependent on any change of the pH value. In Figure 4.30, the spectral shapes of the buffered
solutions (# 2 to 7) are almost the same, but they appear completely different from the
unbuffered one (# 1) They are similar to the visible spectrum when the Manucol-LHF
concentration is 1.5 · 10-5 M (see Figure 4.21). In Figure 4.31, the intensity of the absorption
band at 485 and the excitonic doublet in CD spectra decrease gradually as HCl is added; from
6.45 there is no significant change in the spectra, which are similar to the buffered solutions in
Figure 4.30.
400 450 500 550 600 650 7000,0
0,2
0,4
0,6
0,8
1,0
2 - 7
1
(a)
pH values1. 8.35 without buffer2. 8.83 Tris-buffer3. 8.45 Tris-buffer4. 7.42 Phosphate-buffer5. 6.65 Phosphate-buffer6. 5.83 Succinate-buffer7. 4.66 Succinate-buffer
Abso
rban
ce
λ / nm
400 450 500 550 600 650 700
-40
-30
-20
-10
0
10
20
30
40
2 - 7
1
(b)
pH values1. 8.35 without buffer2. 8.83 Tris-buffer3. 8.45 Tris-buffer4. 7.42 Phosphate-buffer5. 6.65 Phosphate-buffer6. 5.83 Succinate-buffer7. 4.66 Succinate-buffer
∆ε
λ / nm
Fig. 4.30. (a) The visible absorption and (b) the CD spectra of aqueous solutions of pinacyanol
chloride (1.50·10-5 M) and Manucol-LHF (1.50·10-4 M) at different pH values (8.83 to 4.66) using
buffered solutions.
91
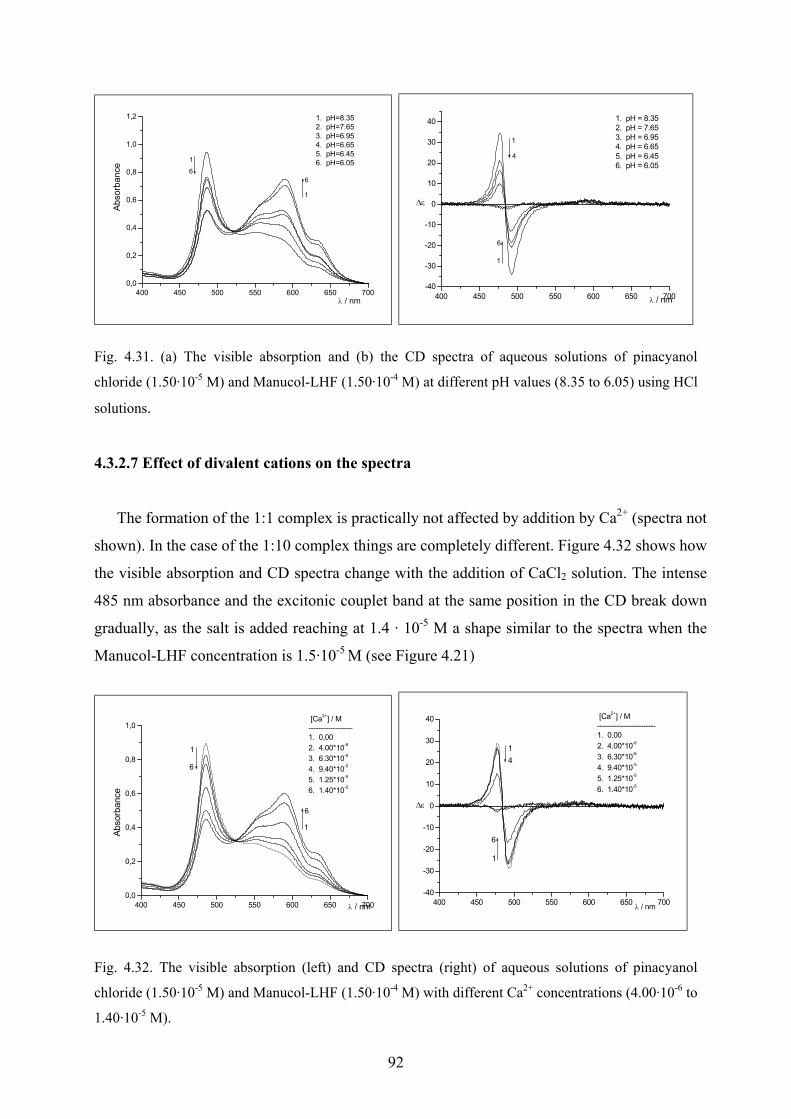
400 450 500 550 600 650 7000,0
0,2
0,4
0,6
0,8
1,0
1,2
6
1
6
1
1. pH=8.352. pH=7.653. pH=6.954. pH=6.655. pH=6.456. pH=6.05
Abso
rban
ce
λ / nm
400 450 500 550 600 650 700-40
-30
-20
-10
0
10
20
30
40
4
1
6
1
1. pH = 8.352. pH = 7.653. pH = 6.954. pH = 6.655. pH = 6.456. pH = 6.05
∆ε
λ / nm
Fig. 4.31. (a) The visible absorption and (b) the CD spectra of aqueous solutions of pinacyanol
chloride (1.50·10-5 M) and Manucol-LHF (1.50·10-4 M) at different pH values (8.35 to 6.05) using HCl
solutions.
4.3.2.7 Effect of divalent cations on the spectra
The formation of the 1:1 complex is practically not affected by addition by Ca2+ (spectra not
shown). In the case of the 1:10 complex things are completely different. Figure 4.32 shows how
the visible absorption and CD spectra change with the addition of CaCl2 solution. The intense
485 nm absorbance and the excitonic couplet band at the same position in the CD break down
gradually, as the salt is added reaching at 1.4 · 10-5 M a shape similar to the spectra when the
Manucol-LHF concentration is 1.5·10-5 M (see Figure 4.21)
400 450 500 550 600 650 7000,0
0,2
0,4
0,6
0,8
1,0
6
1
6
1
[Ca2+] / M------------------1. 0,002. 4.00*10-6
3. 6.30*10-6
4. 9.40*10-5
5. 1.25*10-5
6. 1.40*10-5
Abso
rban
ce
λ / nm
400 450 500 550 600 650 700-40
-30
-20
-10
0
10
20
30
40
6
1
41
[Ca2+] / M------------------------1. 0.002. 4.00*10-6
3. 6.30*10-6
4. 9.40*10-5
5. 1.25*10-5
6. 1.40*10-5
∆ε
λ / nm
Fig. 4.32. The visible absorption (left) and CD spectra (right) of aqueous solutions of pinacyanol
chloride (1.50·10-5 M) and Manucol-LHF (1.50·10-4 M) with different Ca2+ concentrations (4.00·10-6 to
1.40·10-5 M).
92
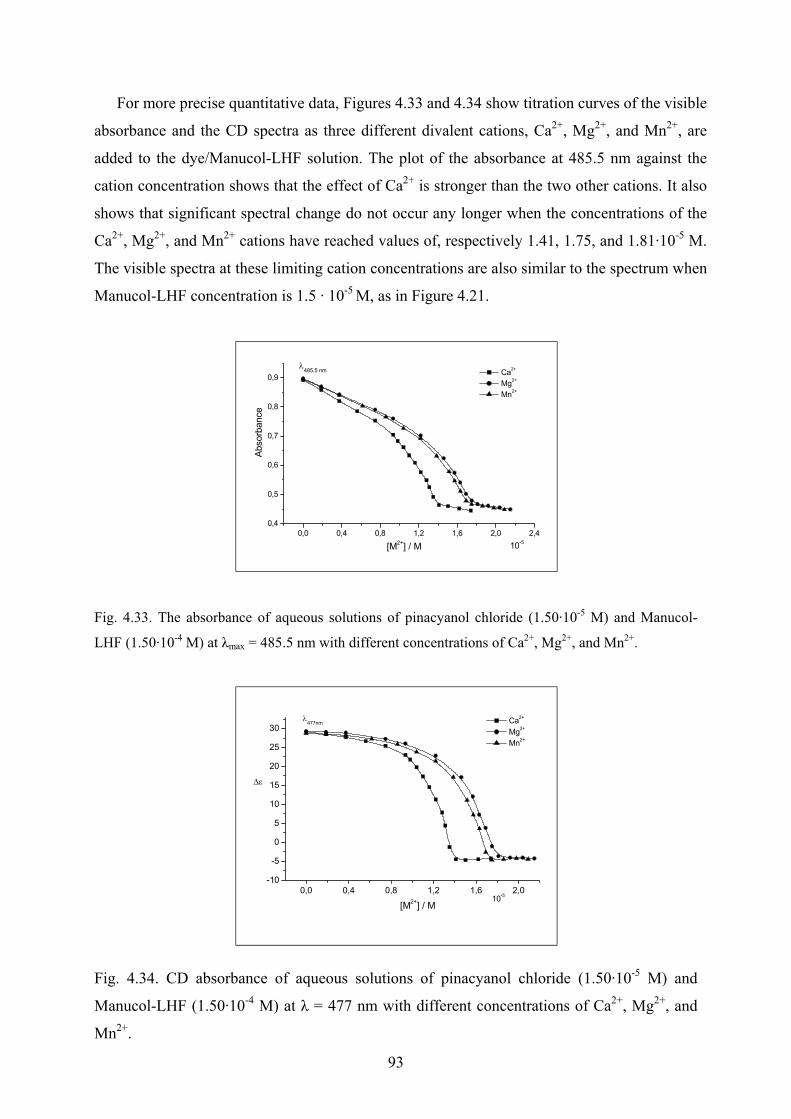
For more precise quantitative data, Figures 4.33 and 4.34 show titration curves of the visible
absorbance and the CD spectra as three different divalent cations, Ca2+, Mg2+, and Mn2+, are
added to the dye/Manucol-LHF solution. The plot of the absorbance at 485.5 nm against the
cation concentration shows that the effect of Ca2+ is stronger than the two other cations. It also
shows that significant spectral change do not occur any longer when the concentrations of the
Ca2+, Mg2+, and Mn2+ cations have reached values of, respectively 1.41, 1.75, and 1.81·10-5 M.
The visible spectra at these limiting cation concentrations are also similar to the spectrum when
Manucol-LHF concentration is 1.5 · 10-5 M, as in Figure 4.21.
0,0 0,4 0,8 1,2 1,6 2,0 2,40,4
0,5
0,6
0,7
0,8
0,9
10-5
Ca2+
Mg2+
Mn2+
λ485.5 nm
Abso
rban
ce
[M2+] / M
Fig. 4.33. The absorbance of aqueous solutions of pinacyanol chloride (1.50·10-5 M) and Manucol-
LHF (1.50·10-4 M) at λmax = 485.5 nm with different concentrations of Ca2+, Mg2+, and Mn2+.
0,0 0,4 0,8 1,2 1,6 2,0-10
-5
0
5
10
15
20
25
30 Ca2+
Mg2+
Mn2+
10-5
λ477nm
∆ε
[M2+] / M
Fig. 4.34. CD absorbance of aqueous solutions of pinacyanol chloride (1.50·10-5 M) and
Manucol-LHF (1.50·10-4 M) at λ = 477 nm with different concentrations of Ca2+, Mg2+, and
Mn2+.
93
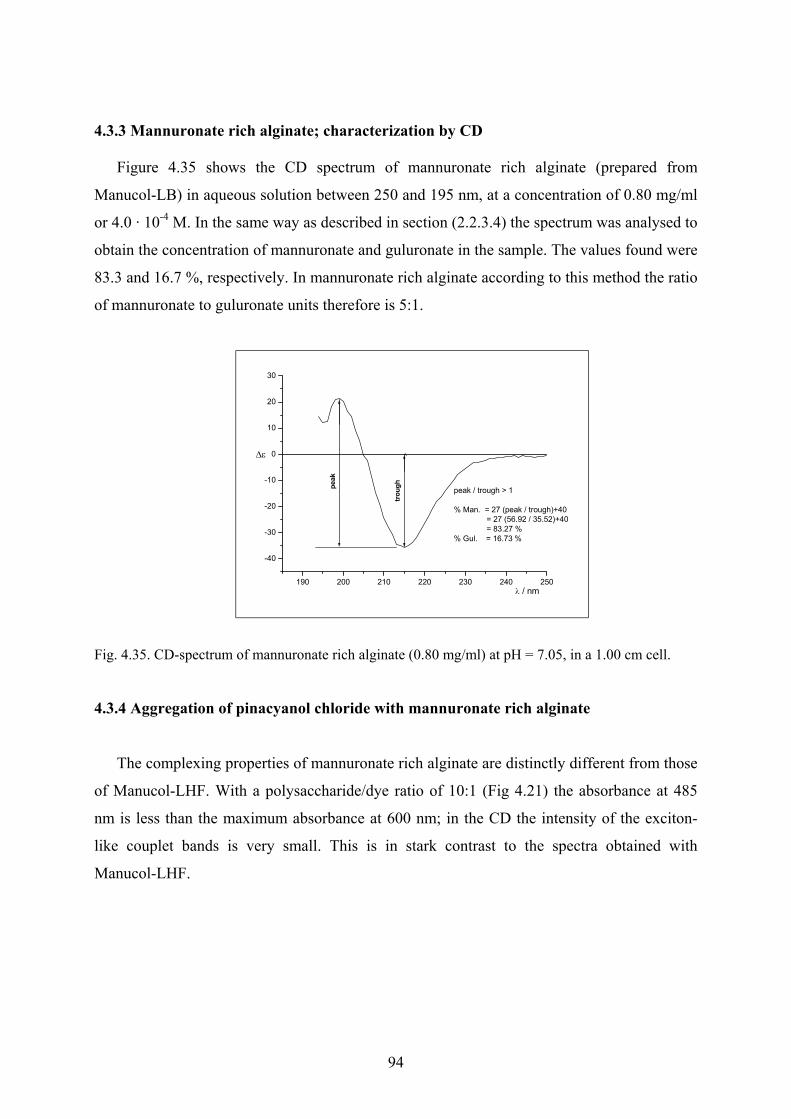
4.3.3 Mannuronate rich alginate; characterization by CD
Figure 4.35 shows the CD spectrum of mannuronate rich alginate (prepared from
Manucol-LB) in aqueous solution between 250 and 195 nm, at a concentration of 0.80 mg/ml
or 4.0 · 10-4 M. In the same way as described in section (2.2.3.4) the spectrum was analysed to
obtain the concentration of mannuronate and guluronate in the sample. The values found were
83.3 and 16.7 %, respectively. In mannuronate rich alginate according to this method the ratio
of mannuronate to guluronate units therefore is 5:1.
190 200 210 220 230 240 250
-40
-30
-20
-10
0
10
20
30
peak / trough > 1
% Man. = 27 (peak / trough)+40 = 27 (56.92 / 35.52)+40 = 83.27 %% Gul. = 16.73 %
peak
troug
h
∆ε
λ / nm
Fig. 4.35. CD-spectrum of mannuronate rich alginate (0.80 mg/ml) at pH = 7.05, in a 1.00 cm cell.
4.3.4 Aggregation of pinacyanol chloride with mannuronate rich alginate
The complexing properties of mannuronate rich alginate are distinctly different from those
of Manucol-LHF. With a polysaccharide/dye ratio of 10:1 (Fig 4.21) the absorbance at 485
nm is less than the maximum absorbance at 600 nm; in the CD the intensity of the exciton-
like couplet bands is very small. This is in stark contrast to the spectra obtained with
Manucol-LHF.
94
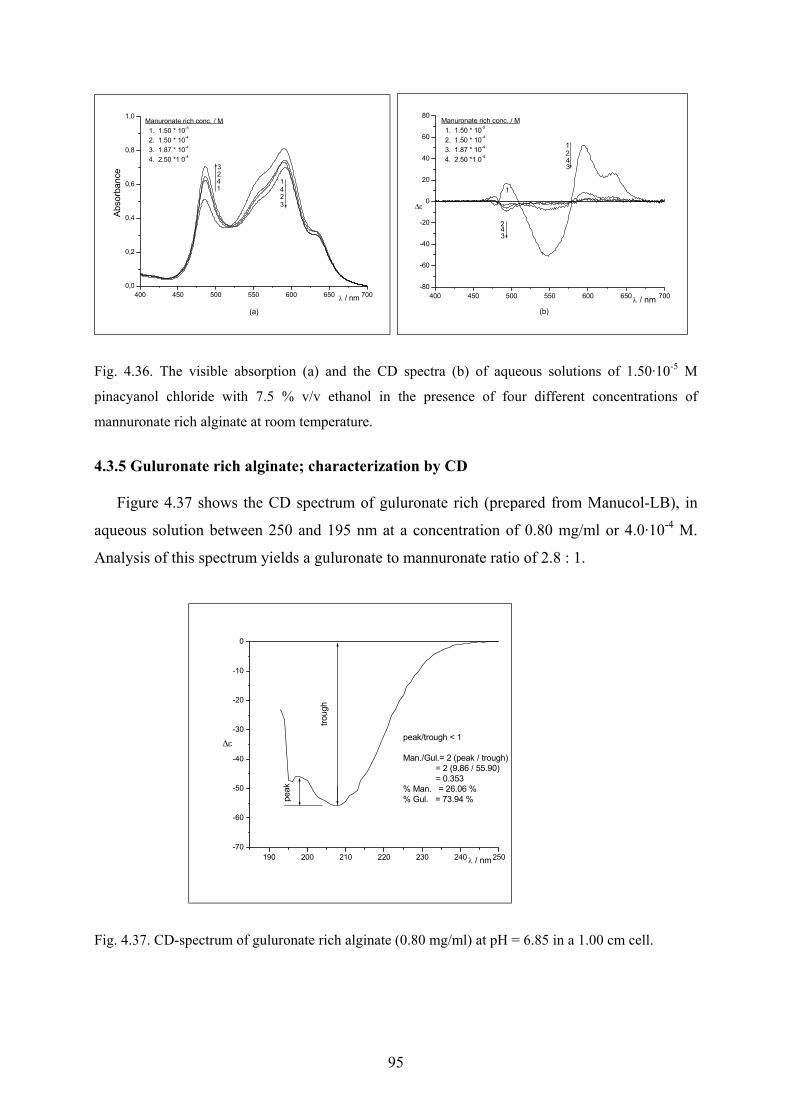
400 450 500 550 600 650 7000,0
0,2
0,4
0,6
0,8
1,0
(a)
3241
1423
Manuronate rich conc. / M 1. 1.50 * 10-5
2. 1.50 * 10-4
3. 1.87 * 10-4
4. 2.50 *1 0-4
Abso
rban
ce
λ / nm
400 450 500 550 600 650 700-80
-60
-40
-20
0
20
40
60
80
(b)
342
1
3421
Manuronate rich conc. / M 1. 1.50 * 10-5
2. 1.50 * 10-4
3. 1.87 * 10-4
4. 2.50 *1 0-4
∆ε
λ / nm
Fig. 4.36. The visible absorption (a) and the CD spectra (b) of aqueous solutions of 1.50·10-5 M
pinacyanol chloride with 7.5 % v/v ethanol in the presence of four different concentrations of
mannuronate rich alginate at room temperature.
4.3.5 Guluronate rich alginate; characterization by CD
Figure 4.37 shows the CD spectrum of guluronate rich (prepared from Manucol-LB), in
aqueous solution between 250 and 195 nm at a concentration of 0.80 mg/ml or 4.0·10-4 M.
Analysis of this spectrum yields a guluronate to mannuronate ratio of 2.8 : 1.
190 200 210 220 230 240 250-70
-60
-50
-40
-30
-20
-10
0
peak
troug
h
peak/trough < 1
Man./Gul.= 2 (peak / trough) = 2 (9.86 / 55.90) = 0.353% Man. = 26.06 %% Gul. = 73.94 %
∆ε
λ / nm
Fig. 4.37. CD-spectrum of guluronate rich alginate (0.80 mg/ml) at pH = 6.85 in a 1.00 cm cell.
95
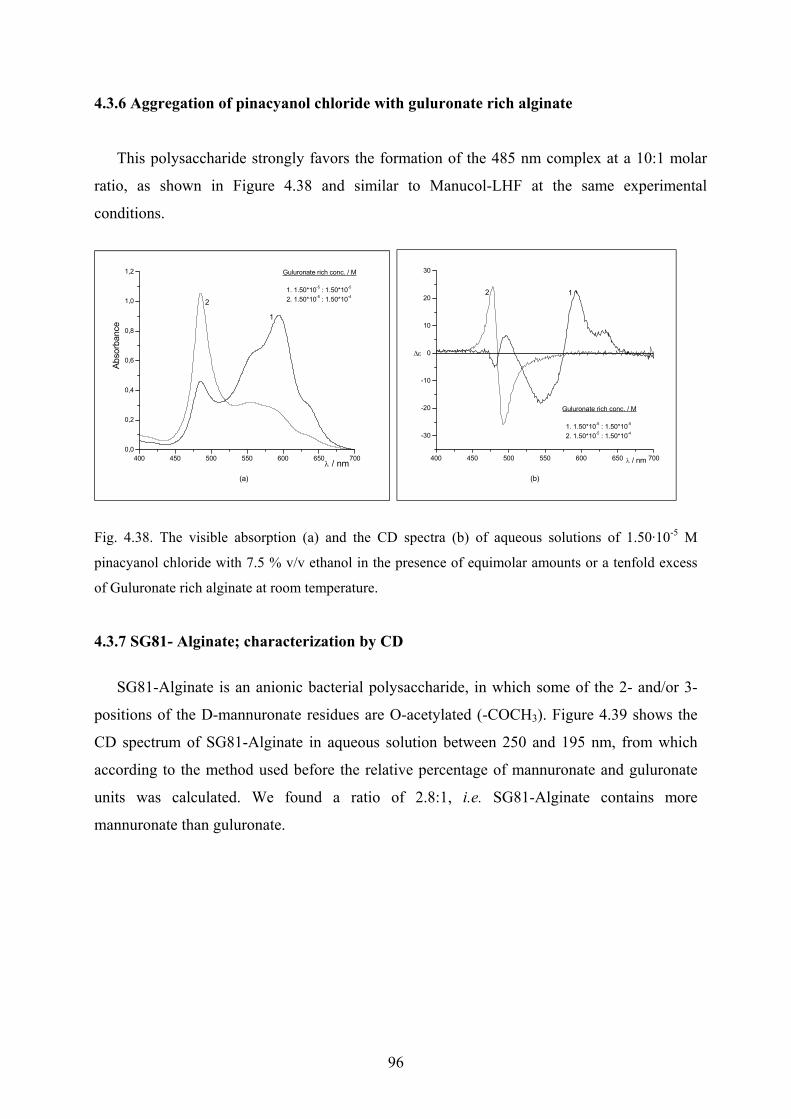
4.3.6 Aggregation of pinacyanol chloride with guluronate rich alginate
This polysaccharide strongly favors the formation of the 485 nm complex at a 10:1 molar
ratio, as shown in Figure 4.38 and similar to Manucol-LHF at the same experimental
conditions.
400 450 500 550 600 650 7000,0
0,2
0,4
0,6
0,8
1,0
1,2
(a)
2
1
Guluronate rich conc. / M
1. 1.50*10-5 : 1.50*10-5 2. 1.50*10-5 : 1.50*10-4
Abso
rban
ce
λ / nm
400 450 500 550 600 650 700
-30
-20
-10
0
10
20
30
(b)
2 1
Guluronate rich conc. / M
1. 1.50*10-5 : 1.50*10-5 2. 1.50*10-5 : 1.50*10-4
∆ε
λ / nm
Fig. 4.38. The visible absorption (a) and the CD spectra (b) of aqueous solutions of 1.50·10-5 M
pinacyanol chloride with 7.5 % v/v ethanol in the presence of equimolar amounts or a tenfold excess
of Guluronate rich alginate at room temperature.
4.3.7 SG81- Alginate; characterization by CD
SG81-Alginate is an anionic bacterial polysaccharide, in which some of the 2- and/or 3-
positions of the D-mannuronate residues are O-acetylated (-COCH3). Figure 4.39 shows the
CD spectrum of SG81-Alginate in aqueous solution between 250 and 195 nm, from which
according to the method used before the relative percentage of mannuronate and guluronate
units was calculated. We found a ratio of 2.8:1, i.e. SG81-Alginate contains more
mannuronate than guluronate.
96
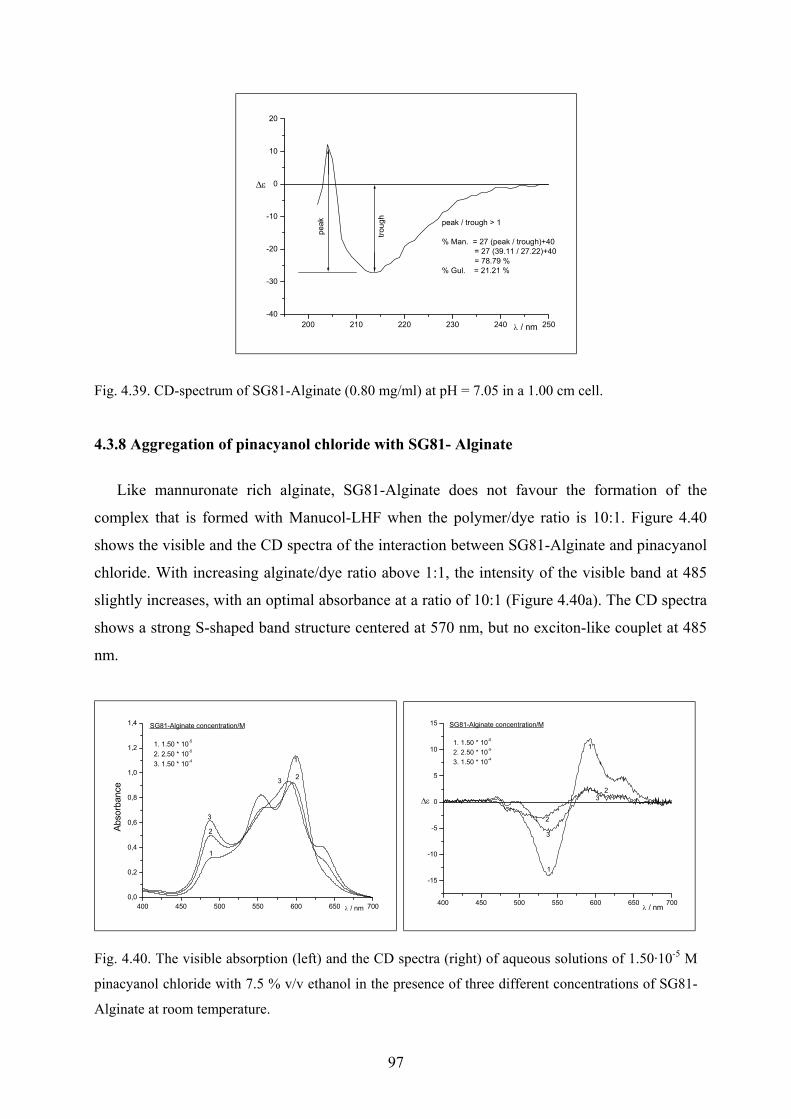
200 210 220 230 240 250-40
-30
-20
-10
0
10
20
peak / trough > 1
% Man. = 27 (peak / trough)+40 = 27 (39.11 / 27.22)+40 = 78.79 %% Gul. = 21.21 %
peak
troug
h
∆ε
λ / nm
Fig. 4.39. CD-spectrum of SG81-Alginate (0.80 mg/ml) at pH = 7.05 in a 1.00 cm cell.
4.3.8 Aggregation of pinacyanol chloride with SG81- Alginate
Like mannuronate rich alginate, SG81-Alginate does not favour the formation of the
complex that is formed with Manucol-LHF when the polymer/dye ratio is 10:1. Figure 4.40
shows the visible and the CD spectra of the interaction between SG81-Alginate and pinacyanol
chloride. With increasing alginate/dye ratio above 1:1, the intensity of the visible band at 485
slightly increases, with an optimal absorbance at a ratio of 10:1 (Figure 4.40a). The CD spectra
shows a strong S-shaped band structure centered at 570 nm, but no exciton-like couplet at 485
nm.
400 450 500 550 600 650 7000,0
0,2
0,4
0,6
0,8
1,0
1,2
1,4
3 2
1
3
2
1
SG81-Alginate concentration/M
1. 1.50 * 10-5 2. 2.50 * 10-5 3. 1.50 * 10-4
λ / nm
Abso
rban
ce
400 450 500 550 600 650 700
-15
-10
-5
0
5
10
15
3
2
1
32
1
SG81-Alginate concentration/M
1. 1.50 * 10-5 2. 2.50 * 10-5 3. 1.50 * 10-4
∆ε
λ / nm
Fig. 4.40. The visible absorption (left) and the CD spectra (right) of aqueous solutions of 1.50·10-5 M
pinacyanol chloride with 7.5 % v/v ethanol in the presence of three different concentrations of SG81-
Alginate at room temperature.
97
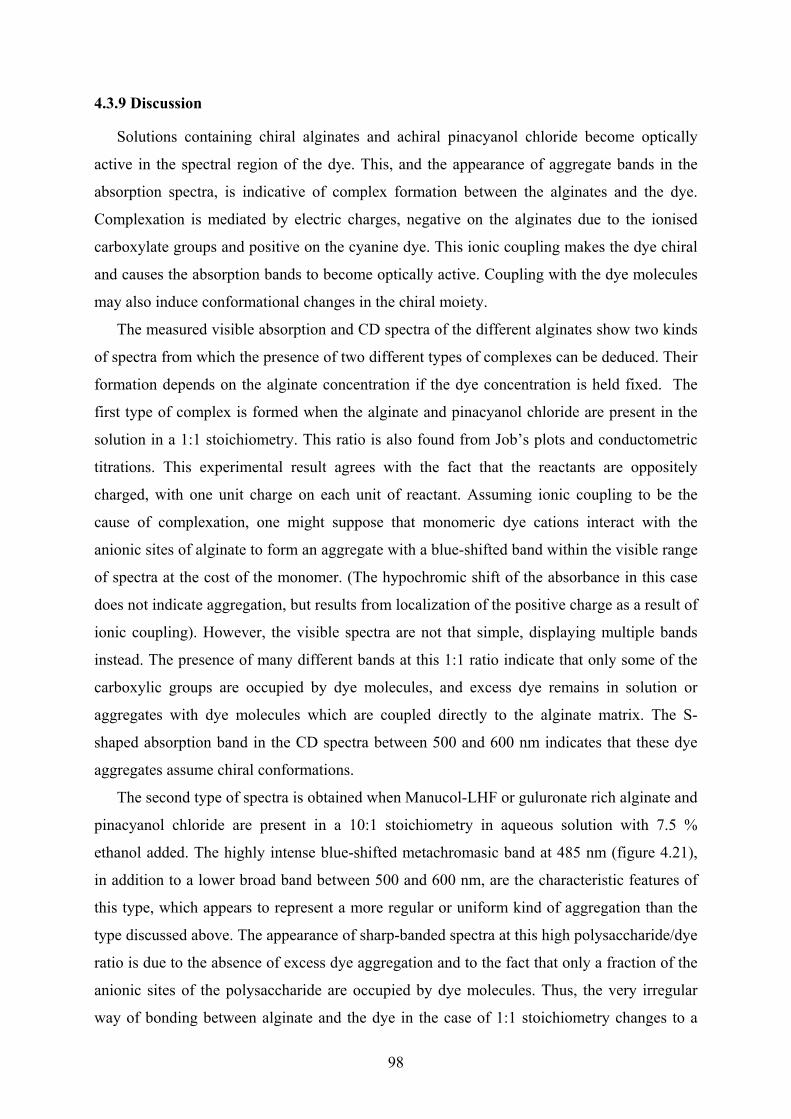
4.3.9 Discussion
Solutions containing chiral alginates and achiral pinacyanol chloride become optically
active in the spectral region of the dye. This, and the appearance of aggregate bands in the
absorption spectra, is indicative of complex formation between the alginates and the dye.
Complexation is mediated by electric charges, negative on the alginates due to the ionised
carboxylate groups and positive on the cyanine dye. This ionic coupling makes the dye chiral
and causes the absorption bands to become optically active. Coupling with the dye molecules
may also induce conformational changes in the chiral moiety.
The measured visible absorption and CD spectra of the different alginates show two kinds
of spectra from which the presence of two different types of complexes can be deduced. Their
formation depends on the alginate concentration if the dye concentration is held fixed. The
first type of complex is formed when the alginate and pinacyanol chloride are present in the
solution in a 1:1 stoichiometry. This ratio is also found from Job’s plots and conductometric
titrations. This experimental result agrees with the fact that the reactants are oppositely
charged, with one unit charge on each unit of reactant. Assuming ionic coupling to be the
cause of complexation, one might suppose that monomeric dye cations interact with the
anionic sites of alginate to form an aggregate with a blue-shifted band within the visible range
of spectra at the cost of the monomer. (The hypochromic shift of the absorbance in this case
does not indicate aggregation, but results from localization of the positive charge as a result of
ionic coupling). However, the visible spectra are not that simple, displaying multiple bands
instead. The presence of many different bands at this 1:1 ratio indicate that only some of the
carboxylic groups are occupied by dye molecules, and excess dye remains in solution or
aggregates with dye molecules which are coupled directly to the alginate matrix. The S-
shaped absorption band in the CD spectra between 500 and 600 nm indicates that these dye
aggregates assume chiral conformations.
The second type of spectra is obtained when Manucol-LHF or guluronate rich alginate and
pinacyanol chloride are present in a 10:1 stoichiometry in aqueous solution with 7.5 %
ethanol added. The highly intense blue-shifted metachromasic band at 485 nm (figure 4.21),
in addition to a lower broad band between 500 and 600 nm, are the characteristic features of
this type, which appears to represent a more regular or uniform kind of aggregation than the
type discussed above. The appearance of sharp-banded spectra at this high polysaccharide/dye
ratio is due to the absence of excess dye aggregation and to the fact that only a fraction of the
anionic sites of the polysaccharide are occupied by dye molecules. Thus, the very irregular
way of bonding between alginate and the dye in the case of 1:1 stoichiometry changes to a
98

more regular one at a ratio of 10:1. This phenomenon occurs only with Manucol-LHF or
guluronate rich alginate. From this we conclude that at high polysaccharide/dye ratio the dye
prefers to interact with the more rigid 2-fold screw helical alternating sequence of guluronate
residues (-G-G-G-G-) rather than the 3-fold left-handed helix mannuronate residues (-M-M-
M-M-) or the disordered conformation (-M-G-M-G-) (see figure 2.14 in section 2.2.3.2).
Figure 4.41 represents a qualitative interpretation of the spectra, in which the dye
molecules are bound by ionic coupling to guluronate residues. The presence of two different
conformations in equilibrium with each other is deduced from the isosbestic point at about
520 nm for the two main different spectra and the other intermediate spectra.
Upon addition of divalent cations (section 4.3.2.7) the conformation of the second
complex formed at the 10:1 ratio is destroyed and is changed to the 1:1 type, possibly because
of competition between the cations and the dye molecules for the anionic binding sites of the
polysaccharide: there is evidence that guluronate blocks are better disposed to chelate the
divalent ions due to their spatial arrangement between adjacent blocks which is suitable to
complex these cations at the cost of the dye molecules.
The very intense exciton couplet seen in Figures 4.21 and 4.22 centered at the sharp 485
nm absorption band of the UV/Vis spectra can be explained by applying exciton theory to the
case of two interacting chromophores. Chromophores may interact under certain conditions
with each other, even if there is no orbital overlap or electron exchange, when one
chromophore is electronically excited. For effective interaction the chromophores should be
similar, or have similar excitation energies, and there should be a fixed geometric disposition
between the chromophores. Interaction leads to two absorption bands of energies and
intensities depending on the geometric disposition, and to two oppositely signed CD-bands,
one positive at 477 nm, one negative at 491 nm (see Fig. 4.42). The sharp visible band at 485
nm corresponds to the absorbance of the exciton state, which is allowed and thus has high
intensity.
99

Fig. 4.41. Dye aggregates and ionic coupling of pinacyanol to guluronate residues in alginate.
Numbers indicate the wavelengths of the absorption maxima in the UV/Vis spectra.
Fig. 4.42. Schematic representation of the exciton coupling for the interaction between pinacyanol
chloride and alginate. At this acute angle between the dye monomers α-type coupling leads to low-
intensity red-shifted absorbance, and ß-type coupling to high-intensity blue-shifted absorbance.
100
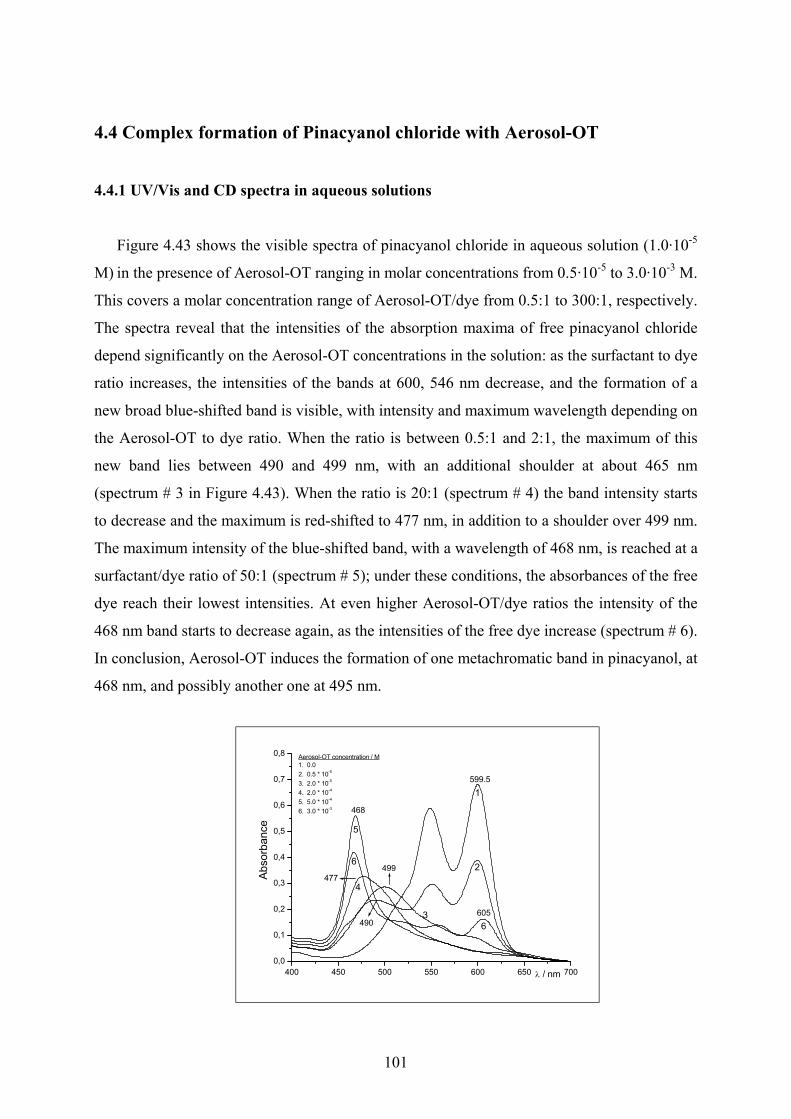
4.4 Complex formation of Pinacyanol chloride with Aerosol-OT
4.4.1 UV/Vis and CD spectra in aqueous solutions
Figure 4.43 shows the visible spectra of pinacyanol chloride in aqueous solution (1.0·10-5
M) in the presence of Aerosol-OT ranging in molar concentrations from 0.5·10-5 to 3.0·10-3 M.
This covers a molar concentration range of Aerosol-OT/dye from 0.5:1 to 300:1, respectively.
The spectra reveal that the intensities of the absorption maxima of free pinacyanol chloride
depend significantly on the Aerosol-OT concentrations in the solution: as the surfactant to dye
ratio increases, the intensities of the bands at 600, 546 nm decrease, and the formation of a
new broad blue-shifted band is visible, with intensity and maximum wavelength depending on
the Aerosol-OT to dye ratio. When the ratio is between 0.5:1 and 2:1, the maximum of this
new band lies between 490 and 499 nm, with an additional shoulder at about 465 nm
(spectrum # 3 in Figure 4.43). When the ratio is 20:1 (spectrum # 4) the band intensity starts
to decrease and the maximum is red-shifted to 477 nm, in addition to a shoulder over 499 nm.
The maximum intensity of the blue-shifted band, with a wavelength of 468 nm, is reached at a
surfactant/dye ratio of 50:1 (spectrum # 5); under these conditions, the absorbances of the free
dye reach their lowest intensities. At even higher Aerosol-OT/dye ratios the intensity of the
468 nm band starts to decrease again, as the intensities of the free dye increase (spectrum # 6).
In conclusion, Aerosol-OT induces the formation of one metachromatic band in pinacyanol, at
468 nm, and possibly another one at 495 nm.
400 450 500 550 600 650 7000,0
0,1
0,2
0,3
0,4
0,5
0,6
0,7
0,8
490
468
477499
6605
599.5
5
4
6
3
2
1
Aerosol-OT concentration / M1. 0.02. 0.5 * 10-5 3. 2.0 * 10-5 4. 2.0 * 10-4 5. 5.0 * 10-4 6. 3.0 * 10-3
Abso
rban
ce
λ / nm
101
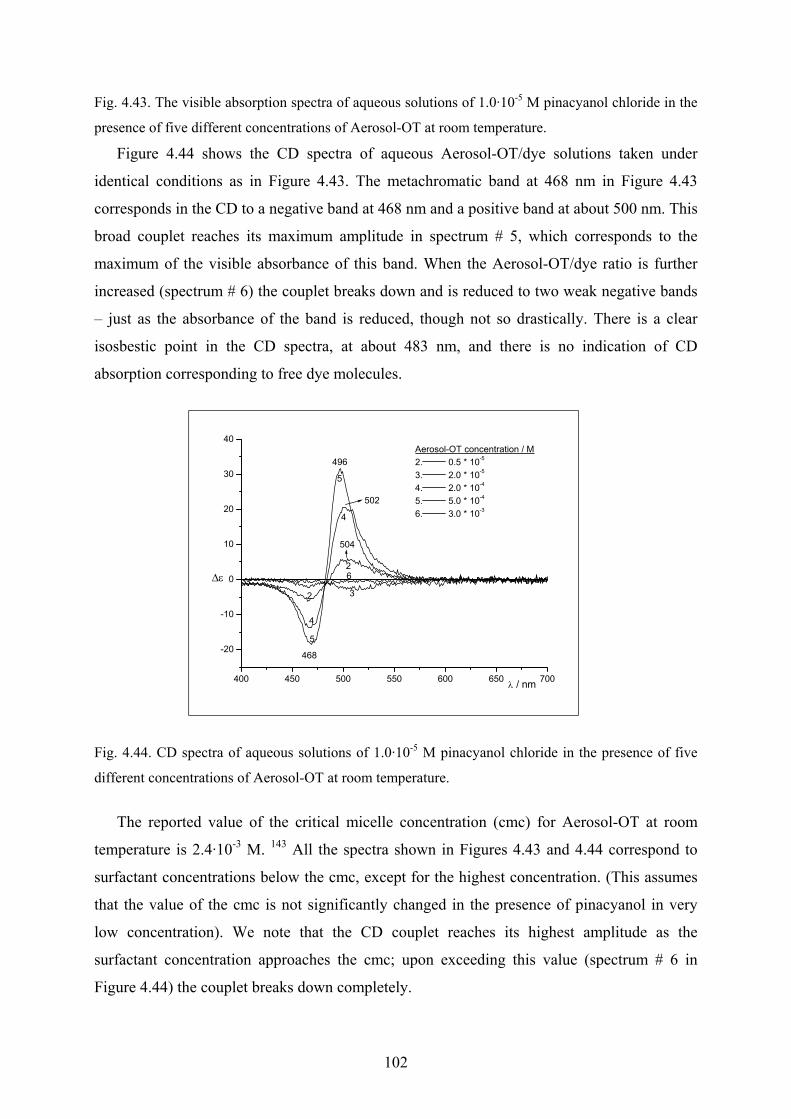
Fig. 4.43. The visible absorption spectra of aqueous solutions of 1.0·10-5 M pinacyanol chloride in the
presence of five different concentrations of Aerosol-OT at room temperature.
Figure 4.44 shows the CD spectra of aqueous Aerosol-OT/dye solutions taken under
identical conditions as in Figure 4.43. The metachromatic band at 468 nm in Figure 4.43
corresponds in the CD to a negative band at 468 nm and a positive band at about 500 nm. This
broad couplet reaches its maximum amplitude in spectrum # 5, which corresponds to the
maximum of the visible absorbance of this band. When the Aerosol-OT/dye ratio is further
increased (spectrum # 6) the couplet breaks down and is reduced to two weak negative bands
– just as the absorbance of the band is reduced, though not so drastically. There is a clear
isosbestic point in the CD spectra, at about 483 nm, and there is no indication of CD
absorption corresponding to free dye molecules.
400 450 500 550 600 650 700
-20
-10
0
10
20
30
40
2
4
5
502
504
468
496
6
3
2
4
5
Aerosol-OT concentration / M2. 0.5 * 10-5 3. 2.0 * 10-5 4. 2.0 * 10-4 5. 5.0 * 10-4 6. 3.0 * 10-3
∆ε
λ / nm
Fig. 4.44. CD spectra of aqueous solutions of 1.0·10-5 M pinacyanol chloride in the presence of five
different concentrations of Aerosol-OT at room temperature.
The reported value of the critical micelle concentration (cmc) for Aerosol-OT at room
temperature is 2.4·10-3 M. 143 All the spectra shown in Figures 4.43 and 4.44 correspond to
surfactant concentrations below the cmc, except for the highest concentration. (This assumes
that the value of the cmc is not significantly changed in the presence of pinacyanol in very
low concentration). We note that the CD couplet reaches its highest amplitude as the
surfactant concentration approaches the cmc; upon exceeding this value (spectrum # 6 in
Figure 4.44) the couplet breaks down completely.
102
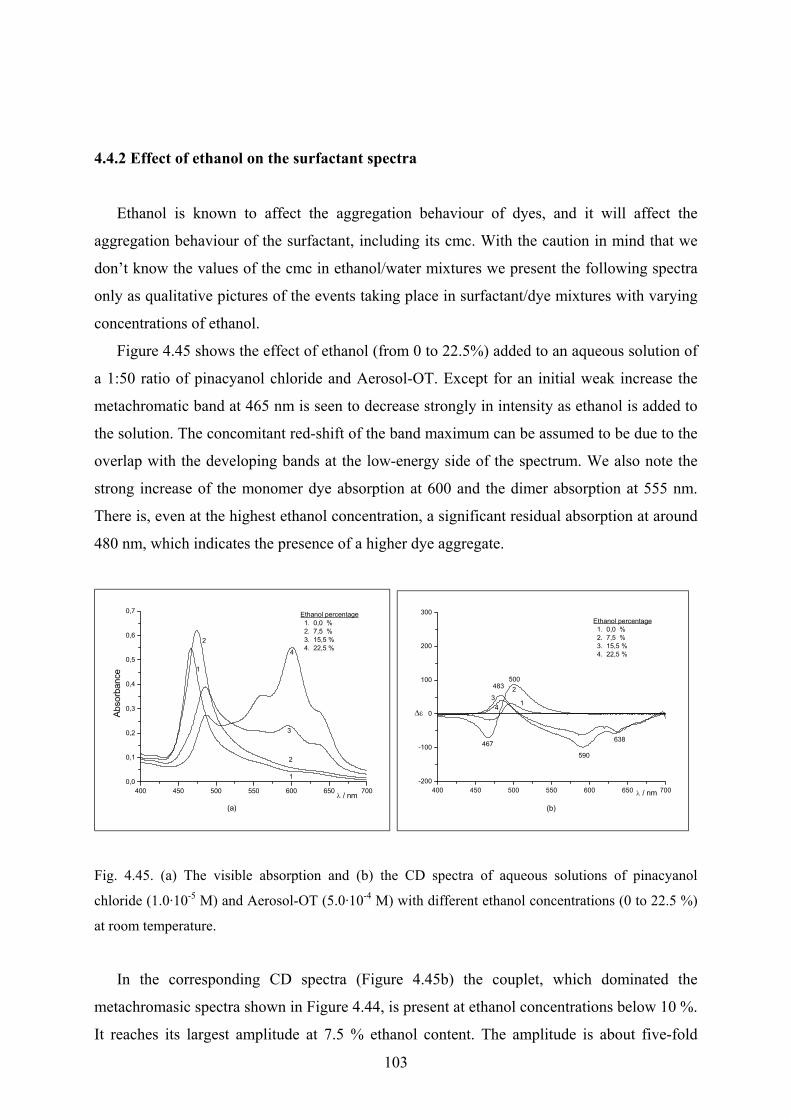
4.4.2 Effect of ethanol on the surfactant spectra
Ethanol is known to affect the aggregation behaviour of dyes, and it will affect the
aggregation behaviour of the surfactant, including its cmc. With the caution in mind that we
don’t know the values of the cmc in ethanol/water mixtures we present the following spectra
only as qualitative pictures of the events taking place in surfactant/dye mixtures with varying
concentrations of ethanol.
Figure 4.45 shows the effect of ethanol (from 0 to 22.5%) added to an aqueous solution of
a 1:50 ratio of pinacyanol chloride and Aerosol-OT. Except for an initial weak increase the
metachromatic band at 465 nm is seen to decrease strongly in intensity as ethanol is added to
the solution. The concomitant red-shift of the band maximum can be assumed to be due to the
overlap with the developing bands at the low-energy side of the spectrum. We also note the
strong increase of the monomer dye absorption at 600 and the dimer absorption at 555 nm.
There is, even at the highest ethanol concentration, a significant residual absorption at around
480 nm, which indicates the presence of a higher dye aggregate.
400 450 500 550 600 650 7000,0
0,1
0,2
0,3
0,4
0,5
0,6
0,7
1
2
(a)
4
3
2
1
Ethanol percentage 1. 0,0 % 2. 7,5 % 3. 15,5 % 4. 22,5 %
Abso
rban
ce
λ / nm
400 450 500 550 600 650 700-200
-100
0
100
200
300
483
467
500
638
590
(b)
43
2
1
Ethanol percentage 1. 0,0 % 2. 7,5 % 3. 15,5 % 4. 22,5 %
∆ε
λ / nm
Fig. 4.45. (a) The visible absorption and (b) the CD spectra of aqueous solutions of pinacyanol
chloride (1.0·10-5 M) and Aerosol-OT (5.0·10-4 M) with different ethanol concentrations (0 to 22.5 %)
at room temperature.
In the corresponding CD spectra (Figure 4.45b) the couplet, which dominated the
metachromasic spectra shown in Figure 4.44, is present at ethanol concentrations below 10 %.
It reaches its largest amplitude at 7.5 % ethanol content. The amplitude is about five-fold
103
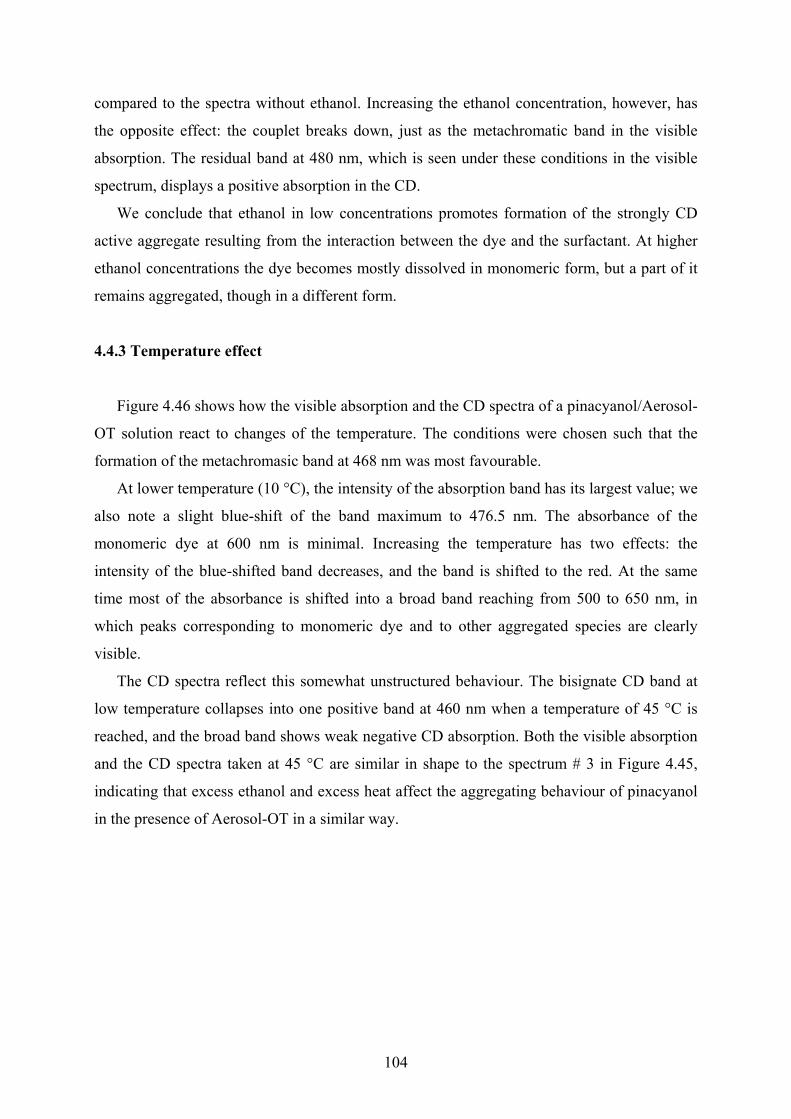
compared to the spectra without ethanol. Increasing the ethanol concentration, however, has
the opposite effect: the couplet breaks down, just as the metachromatic band in the visible
absorption. The residual band at 480 nm, which is seen under these conditions in the visible
spectrum, displays a positive absorption in the CD.
We conclude that ethanol in low concentrations promotes formation of the strongly CD
active aggregate resulting from the interaction between the dye and the surfactant. At higher
ethanol concentrations the dye becomes mostly dissolved in monomeric form, but a part of it
remains aggregated, though in a different form.
4.4.3 Temperature effect
Figure 4.46 shows how the visible absorption and the CD spectra of a pinacyanol/Aerosol-
OT solution react to changes of the temperature. The conditions were chosen such that the
formation of the metachromasic band at 468 nm was most favourable.
At lower temperature (10 °C), the intensity of the absorption band has its largest value; we
also note a slight blue-shift of the band maximum to 476.5 nm. The absorbance of the
monomeric dye at 600 nm is minimal. Increasing the temperature has two effects: the
intensity of the blue-shifted band decreases, and the band is shifted to the red. At the same
time most of the absorbance is shifted into a broad band reaching from 500 to 650 nm, in
which peaks corresponding to monomeric dye and to other aggregated species are clearly
visible.
The CD spectra reflect this somewhat unstructured behaviour. The bisignate CD band at
low temperature collapses into one positive band at 460 nm when a temperature of 45 °C is
reached, and the broad band shows weak negative CD absorption. Both the visible absorption
and the CD spectra taken at 45 °C are similar in shape to the spectrum # 3 in Figure 4.45,
indicating that excess ethanol and excess heat affect the aggregating behaviour of pinacyanol
in the presence of Aerosol-OT in a similar way.
104
400 450 500 550 600 650 7000,0
0,1
0,2
0,3
0,4
0,5
0,6
476.5 nm
(a)
6
1
61
Temperatures/°C 1. 10 2. 25 3. 35 4. 40 5. 45 6. 50
Abso
rban
ce
λ / nm
400 450 500 550 600 650 700-150
-100
-50
0
50
100
150
(b)
4
3
2
1
Temperatures/°C 1. 10 2. 25 3. 35 4. 45
∆ε
λ / nm
Fig. 4.46.(a) and (b) The visible absorption (a) and the CD spectra (b) of aqueous solutions of
pinacyanol chloride (1.0·10-5 M) and Aerosol-OT (5.0·10-4 M) with 7.5 % v/v ethanol at different
temperatures (10 to 50 C°).
4.4.4 Discussion
Aerosol-OT induces very strong blue-shifted metachromasia in pinacyanol chloride
solutions at concentrations below the cmc (Figure 4.43). The reported value for the cmc of
Aerosol-OT at room temperature is 2.4·10-3 M, 166 which would correspond to a
surfactant/dye ratio of 240 when the pinacyanol concentration is 1.5·10-5 M. In the Figure,
there is a progressive blue shift of the metachromatic band and increasing intensity as the
surfactant/dye ratio is increased to 50, at which ratio the wavelength of 468 nm is reached.
Above the cmc (ratio 300:1), the intensity of the metachromatic band decreases with a slight
shift of 2 nm to 466 nm and appearance of weak absorbances in the region of the monomer
and dimer bands. It is obvious that Aerosol-OT induces a sharp and single absorption band
with pinacyanol, indicating that the dye cations aggregate systematically with reasonable
distances between each other, and they are not overcrowded because there are no multiple
bands.
Conductometric titrations show a 1:1 stoichiometry interaction between pinacyanol
chloride and Aerosol-OT. 143 At this ratio there is a metachromatic band at 495 nm and a
shoulder at 465 nm. Metachromasy with a sharp and single band and significant blue shift sets
in when excess Aerosol-OT is present in the solution (Figure 4.43). The question arises
whether pinacyanol binds at alternating anionic groups of aggregated Aerosol-OT, and
whether these aggregates are already present in the solution before pinacyanol chloride is
added. The cmc tells us that Aerosol-OT is present in monomeric form when the
105
surfactant/dye ratio is less than 300:1. Therefore the presence of cationic dye molecules in the
solution induces the formation of Aerosol-OT aggregates, which can easily interact with the
anionic Aerosol-OT molecules. Ionic coupling yields larger molecular structures, which
become salt-like macromolecules and have the capability to aggregate in solution. The
enhancement of this aggregation depends directly on the Aerosol-OT/dye ratio.
The presence of intense and sharp positive and negative bands in the CD spectra (Figure
4.44) indicates exciton splitting, reflecting strong dye-dye interaction with an optimum when
the ratio is 50:1. Regardless of the interaction of Aerosol-OT with dyes, the cmc of the free
excess Aerosol-OT in the solution should not change significantly; however, the new structure
may behave different from the free excess Aerosol-OT itself. This conclusion is clear from the
spectral shape of the UV/Vis band at a ratio of 300:1, in which Aerosol-OT is present in a
concentration above the cmc, and the absorbance is very similar to the one observed when the
ratio is 50:1 (obviously, the band can represent only the Aerosol-OT bonded to the dye which
is equal at least to the concentration of the dye presents in the solution). From this we see that
the aggregation of the dye induced by Aerosol-OT at low concentration is similar to the
geometry induced by the surfactant at or above its cmc.
There is no easy explanation why the aggregate at the 300:1 ratio loses its optical activity.
Pal and Pal 143 argue that some of the amphiphilic dye molecules enter the micelles with the
cationic charged portion of the dye facing the sulfonate groups at the surface, and that the dye
cations within the micelles also aggregate, exhibiting metachromasia with different maximum
wavelength. These aggregates do not exhibit optical activity because the micelle of Aerosol-
OT are not chiral. This mode of aggregation may be present in the case of the 300:1 ratio
because of the absence of a circular dichroism band (see Figure 4.44).
106
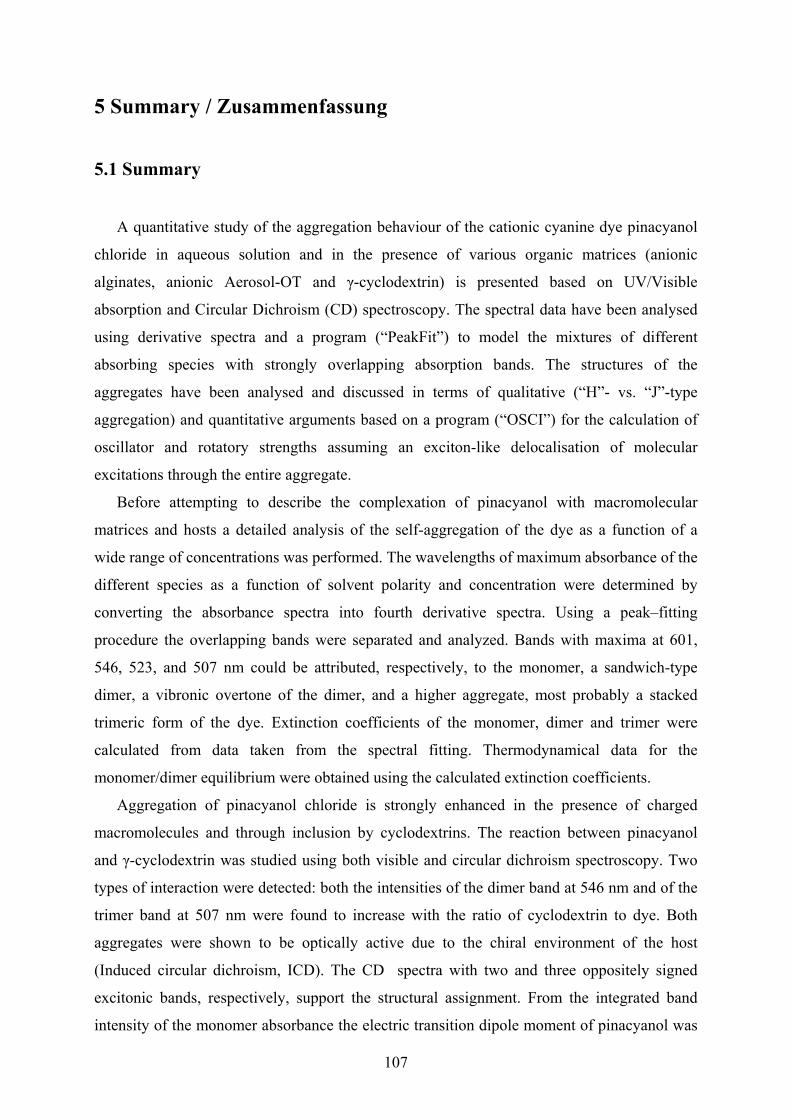
5 Summary / Zusammenfassung
5.1 Summary
A quantitative study of the aggregation behaviour of the cationic cyanine dye pinacyanol
chloride in aqueous solution and in the presence of various organic matrices (anionic
alginates, anionic Aerosol-OT and γ-cyclodextrin) is presented based on UV/Visible
absorption and Circular Dichroism (CD) spectroscopy. The spectral data have been analysed
using derivative spectra and a program (“PeakFit”) to model the mixtures of different
absorbing species with strongly overlapping absorption bands. The structures of the
aggregates have been analysed and discussed in terms of qualitative (“H”- vs. “J”-type
aggregation) and quantitative arguments based on a program (“OSCI”) for the calculation of
oscillator and rotatory strengths assuming an exciton-like delocalisation of molecular
excitations through the entire aggregate.
Before attempting to describe the complexation of pinacyanol with macromolecular
matrices and hosts a detailed analysis of the self-aggregation of the dye as a function of a
wide range of concentrations was performed. The wavelengths of maximum absorbance of the
different species as a function of solvent polarity and concentration were determined by
converting the absorbance spectra into fourth derivative spectra. Using a peak–fitting
procedure the overlapping bands were separated and analyzed. Bands with maxima at 601,
546, 523, and 507 nm could be attributed, respectively, to the monomer, a sandwich-type
dimer, a vibronic overtone of the dimer, and a higher aggregate, most probably a stacked
trimeric form of the dye. Extinction coefficients of the monomer, dimer and trimer were
calculated from data taken from the spectral fitting. Thermodynamical data for the
monomer/dimer equilibrium were obtained using the calculated extinction coefficients.
Aggregation of pinacyanol chloride is strongly enhanced in the presence of charged
macromolecules and through inclusion by cyclodextrins. The reaction between pinacyanol
and γ-cyclodextrin was studied using both visible and circular dichroism spectroscopy. Two
types of interaction were detected: both the intensities of the dimer band at 546 nm and of the
trimer band at 507 nm were found to increase with the ratio of cyclodextrin to dye. Both
aggregates were shown to be optically active due to the chiral environment of the host
(Induced circular dichroism, ICD). The CD spectra with two and three oppositely signed
excitonic bands, respectively, support the structural assignment. From the integrated band
intensity of the monomer absorbance the electric transition dipole moment of pinacyanol was
107

obtained and used to calculate the excited state properties of different pinacyanol aggregates.
Applying eight different parameter sets aggregates of pinacyanol chloride ranging in size
from two to twenty dye molecules were considered. The calculated energy splitting was
adjusted, via the transition dipole length, to the experimentally observed band shift. Rotational
strengths associated with the CD absorptions were calculated and used to obtain an estimate
of the inherent twist of the dimer aggregate inside the γ-cyclodextrin cavity.
The interaction between pinacyanol chloride and different alginates yields profound
changes in the visible absorbance and circular dichroism spectra. Two different types of
aggregates were found depending on the type of alginate used and the relative concentrations.
With Manucol-LHF and at high pinacyanol concentrations the formation of a 1:1 complex
was deduced from an analysis of Job’s method and conductometric titrations. Another
complex formed at 1:10 dye/alginate ratios and only in the presence of Manucol-LHF or
guluronate rich alginate. The two aggregates which display strongly different visible and CD
spectral characteristics are in dynamic equilibrium according to the presence of isosbestic
points in the visible region. The effect of temperature, pH, solvent, and divalent cations on the
spectra was studied. The complex formed at low dye/alginate ratio was damaged by addition
of hydrochloric acid and divalent cations; however, at low concentration of these agents the
spectra indicated conversion of the complex into the 1:1 aggregate. Models for the two
complexes are proposed taking into account the preference of guluronate binding sites for
chelating ions.
Different structures are proposed for the complexes formed from the reaction between the
cationic pinacyanol and the anionic surfactant Aerosol-OT. UV/Vis and CD spectra provide
tools to study the concentration and solvent dependence of the interaction. Aggregation
spectra are dominated by a literature-known strongly blue-shifted, sharp and single visible
metachromasic band, which appears at Aerosol-OT concentrations much below the cmc of the
surfactant. Above the cmc the spectra indicate dissociation into monomer and dimer species,
and the system becomes completely devoid of chirality. Two different CD spectra with a
distinct isosbestic point are observed for complexes with different surfactant to dye ratios.
Both the addition of ethanol and increasing the temperature retards the metachromasic
process.
108
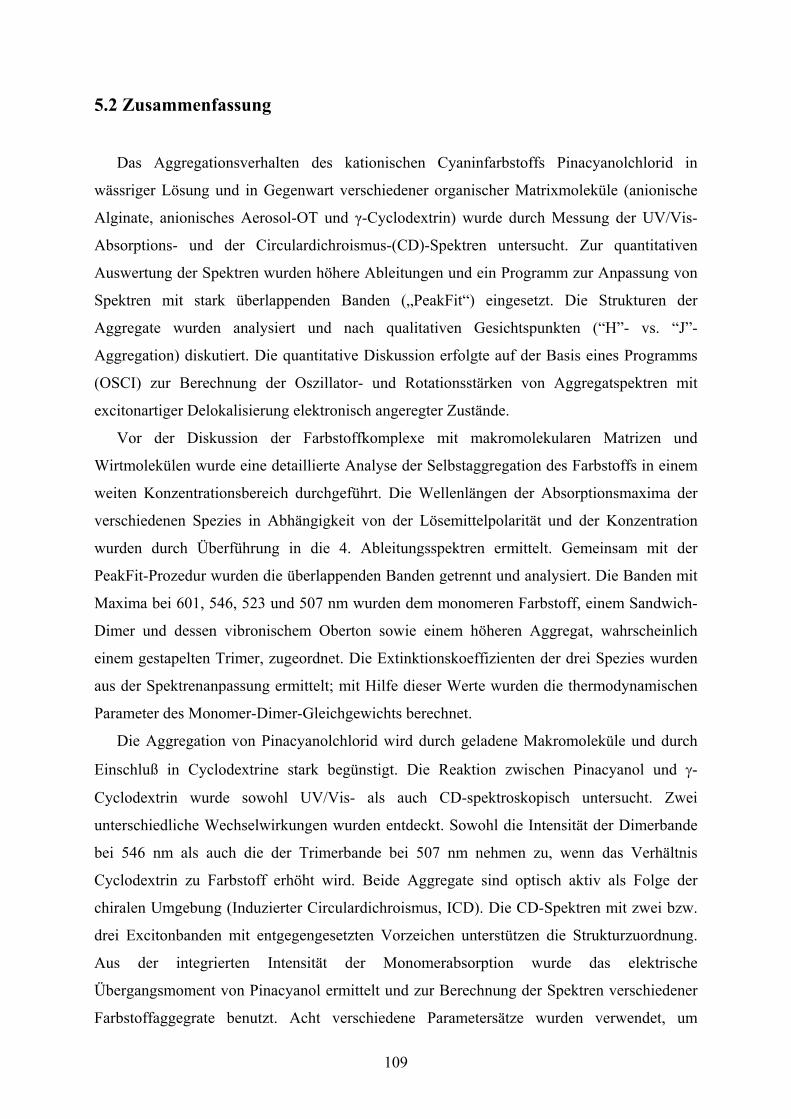
5.2 Zusammenfassung
Das Aggregationsverhalten des kationischen Cyaninfarbstoffs Pinacyanolchlorid in
wässriger Lösung und in Gegenwart verschiedener organischer Matrixmoleküle (anionische
Alginate, anionisches Aerosol-OT und γ-Cyclodextrin) wurde durch Messung der UV/Vis-
Absorptions- und der Circulardichroismus-(CD)-Spektren untersucht. Zur quantitativen
Auswertung der Spektren wurden höhere Ableitungen und ein Programm zur Anpassung von
Spektren mit stark überlappenden Banden („PeakFit“) eingesetzt. Die Strukturen der
Aggregate wurden analysiert und nach qualitativen Gesichtspunkten (“H”- vs. “J”-
Aggregation) diskutiert. Die quantitative Diskussion erfolgte auf der Basis eines Programms
(OSCI) zur Berechnung der Oszillator- und Rotationsstärken von Aggregatspektren mit
excitonartiger Delokalisierung elektronisch angeregter Zustände.
Vor der Diskussion der Farbstoffkomplexe mit makromolekularen Matrizen und
Wirtmolekülen wurde eine detaillierte Analyse der Selbstaggregation des Farbstoffs in einem
weiten Konzentrationsbereich durchgeführt. Die Wellenlängen der Absorptionsmaxima der
verschiedenen Spezies in Abhängigkeit von der Lösemittelpolarität und der Konzentration
wurden durch Überführung in die 4. Ableitungsspektren ermittelt. Gemeinsam mit der
PeakFit-Prozedur wurden die überlappenden Banden getrennt und analysiert. Die Banden mit
Maxima bei 601, 546, 523 und 507 nm wurden dem monomeren Farbstoff, einem Sandwich-
Dimer und dessen vibronischem Oberton sowie einem höheren Aggregat, wahrscheinlich
einem gestapelten Trimer, zugeordnet. Die Extinktionskoeffizienten der drei Spezies wurden
aus der Spektrenanpassung ermittelt; mit Hilfe dieser Werte wurden die thermodynamischen
Parameter des Monomer-Dimer-Gleichgewichts berechnet.
Die Aggregation von Pinacyanolchlorid wird durch geladene Makromoleküle und durch
Einschluß in Cyclodextrine stark begünstigt. Die Reaktion zwischen Pinacyanol und γ-
Cyclodextrin wurde sowohl UV/Vis- als auch CD-spektroskopisch untersucht. Zwei
unterschiedliche Wechselwirkungen wurden entdeckt. Sowohl die Intensität der Dimerbande
bei 546 nm als auch die der Trimerbande bei 507 nm nehmen zu, wenn das Verhältnis
Cyclodextrin zu Farbstoff erhöht wird. Beide Aggregate sind optisch aktiv als Folge der
chiralen Umgebung (Induzierter Circulardichroismus, ICD). Die CD-Spektren mit zwei bzw.
drei Excitonbanden mit entgegengesetzten Vorzeichen unterstützen die Strukturzuordnung.
Aus der integrierten Intensität der Monomerabsorption wurde das elektrische
Übergangsmoment von Pinacyanol ermittelt und zur Berechnung der Spektren verschiedener
Farbstoffaggegrate benutzt. Acht verschiedene Parametersätze wurden verwendet, um
109
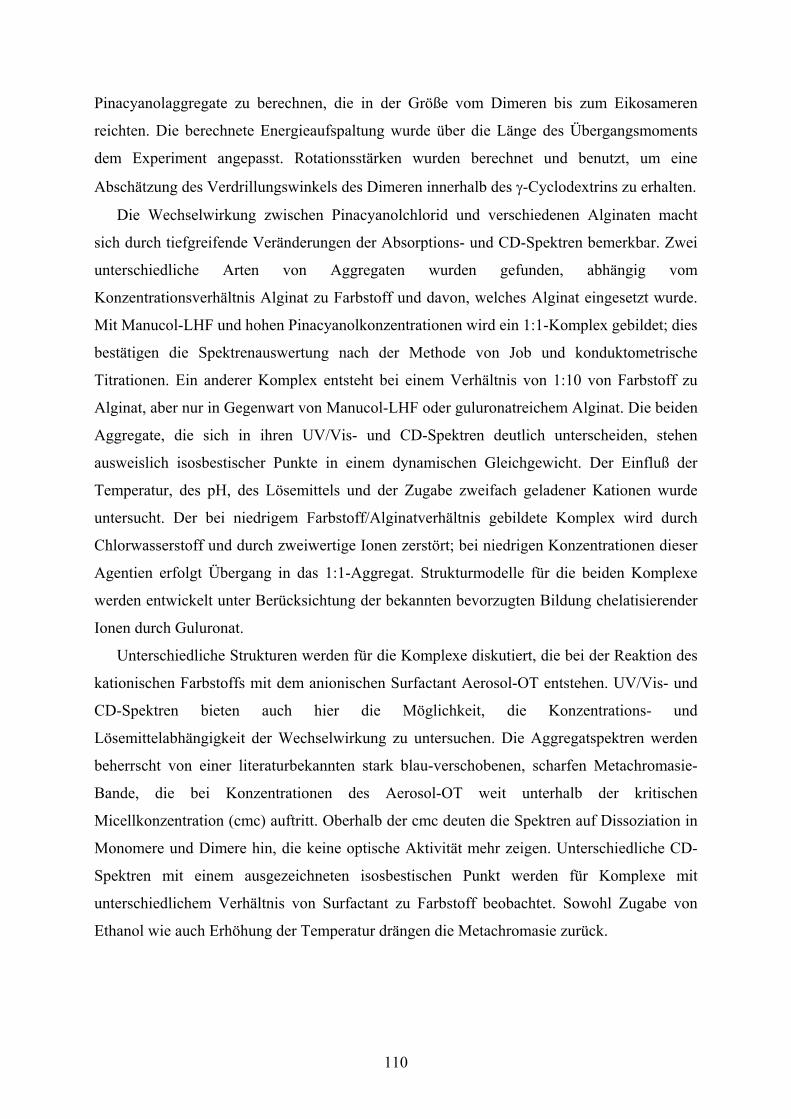
Pinacyanolaggregate zu berechnen, die in der Größe vom Dimeren bis zum Eikosameren
reichten. Die berechnete Energieaufspaltung wurde über die Länge des Übergangsmoments
dem Experiment angepasst. Rotationsstärken wurden berechnet und benutzt, um eine
Abschätzung des Verdrillungswinkels des Dimeren innerhalb des γ-Cyclodextrins zu erhalten.
Die Wechselwirkung zwischen Pinacyanolchlorid und verschiedenen Alginaten macht
sich durch tiefgreifende Veränderungen der Absorptions- und CD-Spektren bemerkbar. Zwei
unterschiedliche Arten von Aggregaten wurden gefunden, abhängig vom
Konzentrationsverhältnis Alginat zu Farbstoff und davon, welches Alginat eingesetzt wurde.
Mit Manucol-LHF und hohen Pinacyanolkonzentrationen wird ein 1:1-Komplex gebildet; dies
bestätigen die Spektrenauswertung nach der Methode von Job und konduktometrische
Titrationen. Ein anderer Komplex entsteht bei einem Verhältnis von 1:10 von Farbstoff zu
Alginat, aber nur in Gegenwart von Manucol-LHF oder guluronatreichem Alginat. Die beiden
Aggregate, die sich in ihren UV/Vis- und CD-Spektren deutlich unterscheiden, stehen
ausweislich isosbestischer Punkte in einem dynamischen Gleichgewicht. Der Einfluß der
Temperatur, des pH, des Lösemittels und der Zugabe zweifach geladener Kationen wurde
untersucht. Der bei niedrigem Farbstoff/Alginatverhältnis gebildete Komplex wird durch
Chlorwasserstoff und durch zweiwertige Ionen zerstört; bei niedrigen Konzentrationen dieser
Agentien erfolgt Übergang in das 1:1-Aggregat. Strukturmodelle für die beiden Komplexe
werden entwickelt unter Berücksichtung der bekannten bevorzugten Bildung chelatisierender
Ionen durch Guluronat.
Unterschiedliche Strukturen werden für die Komplexe diskutiert, die bei der Reaktion des
kationischen Farbstoffs mit dem anionischen Surfactant Aerosol-OT entstehen. UV/Vis- und
CD-Spektren bieten auch hier die Möglichkeit, die Konzentrations- und
Lösemittelabhängigkeit der Wechselwirkung zu untersuchen. Die Aggregatspektren werden
beherrscht von einer literaturbekannten stark blau-verschobenen, scharfen Metachromasie-
Bande, die bei Konzentrationen des Aerosol-OT weit unterhalb der kritischen
Micellkonzentration (cmc) auftritt. Oberhalb der cmc deuten die Spektren auf Dissoziation in
Monomere und Dimere hin, die keine optische Aktivität mehr zeigen. Unterschiedliche CD-
Spektren mit einem ausgezeichneten isosbestischen Punkt werden für Komplexe mit
unterschiedlichem Verhältnis von Surfactant zu Farbstoff beobachtet. Sowohl Zugabe von
Ethanol wie auch Erhöhung der Temperatur drängen die Metachromasie zurück.
110
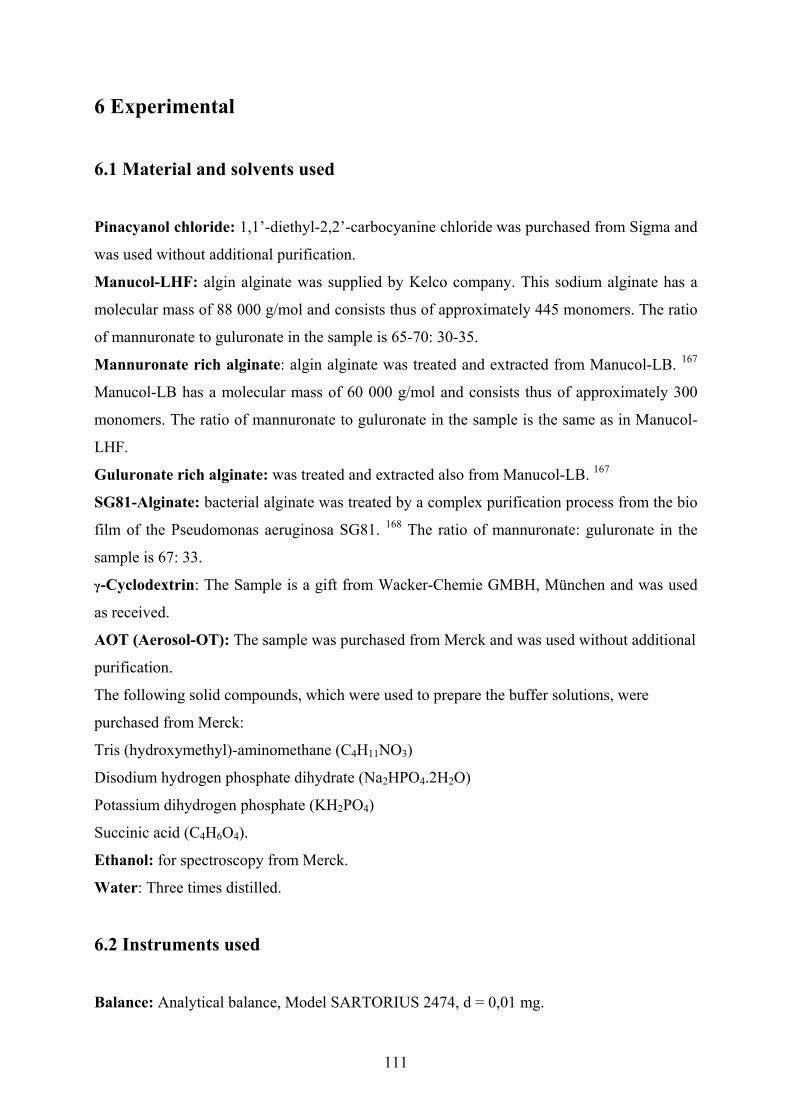
6 Experimental
6.1 Material and solvents used
Pinacyanol chloride: 1,1’-diethyl-2,2’-carbocyanine chloride was purchased from Sigma and
was used without additional purification.
Manucol-LHF: algin alginate was supplied by Kelco company. This sodium alginate has a
molecular mass of 88 000 g/mol and consists thus of approximately 445 monomers. The ratio
of mannuronate to guluronate in the sample is 65-70: 30-35.
Mannuronate rich alginate: algin alginate was treated and extracted from Manucol-LB. 167
Manucol-LB has a molecular mass of 60 000 g/mol and consists thus of approximately 300
monomers. The ratio of mannuronate to guluronate in the sample is the same as in Manucol-
LHF.
Guluronate rich alginate: was treated and extracted also from Manucol-LB. 167
SG81-Alginate: bacterial alginate was treated by a complex purification process from the bio
film of the Pseudomonas aeruginosa SG81. 168 The ratio of mannuronate: guluronate in the
sample is 67: 33.
γ-Cyclodextrin: The Sample is a gift from Wacker-Chemie GMBH, München and was used
as received.
AOT (Aerosol-OT): The sample was purchased from Merck and was used without additional
purification.
The following solid compounds, which were used to prepare the buffer solutions, were
purchased from Merck:
Tris (hydroxymethyl)-aminomethane (C4H11NO3)
Disodium hydrogen phosphate dihydrate (Na2HPO4.2H2O)
Potassium dihydrogen phosphate (KH2PO4)
Succinic acid (C4H6O4).
Ethanol: for spectroscopy from Merck.
Water: Three times distilled.
6.2 Instruments used
Balance: Analytical balance, Model SARTORIUS 2474, d = 0,01 mg.
111
UV/Vis-spectrometer: PERKIN-ELMER, Model LAMBDA 5 connected to a personal
computer for data collection as ASCII format.
CD- spectrometer: AVIV circular dichroism spectrometer model 62DS connected to a
personal computer for data collection as ASCII format.
CD-cryostat system: OXFORD INSTRUMENTS, Variable Temperature liquid Nitrogen
cryostat, DN 1714 (static).
Conductometer: WTW/LF 42. The conductivity cell had a cell constant of 0.73 cm-1.
pH-meter: Knick-mV. The electrode was calibrated each time with buffer 4 and 9 before use.
6.3 Glassware, tool and Methods
Stoppered quartz cells were used with different optical path lengths (0.01 – 2.00 cm) as
appropriate.
Micropipettes were used with different types of capacities; 100, 50, and 10 µl as appropriate.
Preparation of the test solutions. The solutions needed for studying the formation of
complexes between Pinacyanol chloride and the different types of host macromolecules were
prepared by using a fixed volume (4.00 ml) using a stoppered rolled rim glasses regarding the
size of measuring cell (to maintain the same conditions and precision for all test samples) by
using the appropriate Micropipettes. Always the host solutions were added first into a rolled
rim glass of 10 cm3 capacity, followed by adding the required amount of the dye solution. The
standard solutions of the dye and the host were prepared by using volumetric flask of 25 ml.
Each standard solution when prepared was used only in the same day, i.e all of the spectra in
one figure were prepared from the same fresh standard solution. Special care was taken to
assure thermal equilibrium for each test solution by waiting to get a canstant read of the
temerature and a reproducible absorbance at the required temperature.
The wavelength range, sensitivity scale, scan rate were selected to give the optimum
signal-noise ratios.
112
7 References
1 H. Zollinger, Color chemistry. Syntheses, Properties and Applications of Organic Dyes
and Pigments; 2nd ed., VCH, Weinheim (1991). 2 T. P. Causgrove, S. Yang, W. S. Struve, J. Phys. Chem., 92, 6121 (1988). 3 J. M. Lanzafame, A. A. Muenter, D. V. Brumbaugh, Chem. Phys. 210, 79 (1996). 4 (a) B. Nordén and M. Kubista, Polarized Spectroscopy of Ordered Systems, B. Samori
and E. W. Thulstrup, Eds, Kluwer Acad. Publ., Dordrecht, Holland, Vol. 242 (1988). (b)
J. L. Seifert, R. E. Conner, S. A. Kushon, M. Wang, and B. A. Armitage, J. Am. Chem.
Soc. 21, 2987 (1999). 5 M. Pal and N. Mandel, Biopolymers, 29, 1541 (1990). 6 V. Buss in: “Sixth International Symposium on Cyclodextrins”, A. Hedges, Ed.,Paris,
p.160 (1992). 7 D. J. Owen, D. VanDerveer, and G. B. Schuster, J. Am. Chem. Soc. 120, 1705 (1998). 8 J. Tanaka, T. Masashi, and M. Hayakawa, Bull. Chem. Soc. Jpn. 53, 3109 (1980). 9 H. Yoshioka and K. Nakatsu, Chem. Phys. Lett. 11, 255 (1971). 10 L. G. S. Brooker, F. L. White, R. H. Sprague, S. G. J. Dent and G. VanZandt, Chem.
Rev. 41, 325 (1947). 11 P. M. Henrichs and S. Gross, J. Am. Chem. Soc. 98, 7169 (1976). 12 W. West, S. Pearce, and F. Grum, J. Phys. Chem. 71, 1316 (1967). 13 W. Grahn, Tetrahedron, 32, 1931 (1976). 14 S. E. Sheppard and A. L. Geddes, J. Am. Chem. Soc. 66, 2003 (1944). 15 V. L. Levschin and E. G. Baranova, J. Chim. Phys. 55, 869 (1958). 16 W. West and S. Pearce , J. Phys. Chem. 69, 1894 (1965). 17 D. L. Akins and J. W. Macklin, J. Phys. Chem. 93, 5999 (1989). 18 T. Tani, J-Aggregates, T. Kobayashi, Ed., World Scientific, Singapore (1996). 19 A. Mishra, R. K. Behera, P. K. Behera, B. K. Mishra, and G. B. Behera, Chem.
Rev.100, 1973 (2000). 20 E. G. McRae and M. Kasha, J. Chem. Phys. 28, 721 (1958). 21 M. Kasha, H. R. Rawis, and M. A. El-Bayoumi, Pure Appl. Chem. 11, 371 (1965). 22 G. S. Levinson, W. T. Simpson, and W. Curtius, J. Am. Chem. Soc. 79, 4314 (1957). 23 T. Katoh, Y. Inagaki, and R. Okazaki, Bull. Chem. Soc. Jpn. 70, 2279 (1997). 24 W. J. Harrison, D. L. Mateer, and G. J. T. Tiddy, J. Phys. Chem. 100, 2310 (1996). 25 O. Valdes - Aguilera and D. C. Neckers, Acc. Chem. Res. 22, 171 (1989)
113
26 E. S. Emerson, M. A. Conlin, A. E. Rosenoff, K. S. Norland, H. Rodriguez, D. Chin,
and G. R. Bird, J. Phys. Chem. 71, 2396 (1967). 27 A. P. Marchetti, C. D. Salzberg, and E. I. P. Walker, J. Chem. Phys. 64, 4693 (1976). 28 H. Hermel, U. DeRossi, Int. J. Biol. Macromol. 21, 263 (1997). 29 L. Strekowski, M. Lipowska, and G. Potonay, J. Org. Chem. 57, 4578 (1992). 30 P. Kaschny and F. M. Goni, Eur. J. Biochem. 207, 1085 (1992). 31 S. E. Sheppard and A. L. Geddes, J. Chem. Phys. 13, 63 (1945). 32 P. Mukerjee and K. J. Mysels, J. Am. Chem. Soc. 59, 2937 (1955). 33 R. Sabaté, L. Freire, and J. Estelrich, J. Chem. Educ. 78, 343 (2001). 34 S. Barazzouk, H. Lee, S. Hotchandani, and P. V. Kamat, J. Phys. Chem. B, 104,3616
(2000). 35 H. Kuhn, J. Chem. Phys. 17, 1198 (1949). 36 G. M. Shalhoub, J. Chem. Educ. 74, 1317 (1997). 37 R. S. Moog, J. Chem. Educ. 68, 506 (1991). 38 J. F. Kennedy and C. A. White, in Carbohydrate Chemistry, John F. Kennedy, Ed.,
Clarendon Press, Oxford, p. 33ff (1988). 39 G. O. Aspinall, Ed., The Polysaccharides, Vol. I, Academic Press, New York
London(1982). 40 M. Chaplin, Food Research Center, South Bank University in:
http://www.sbu.ac.uk/water/hypol.html 41 G. P. Moss, Symbols for Specifying the Conformation of Polysaccharide Chains,
http://www.chem.qmul.ac.uk/ iupac/misc/psac.html 42 A. B. Steiner and W.H McNeely, Adv. Chem. Ser. 11, 68 (1954) in: ref. 39 p.264. 43 P. A. J. Gorin and J. F. T. Spencer, Can. J. Chem. 44, 993 (1966). 44 I. W. Cottrell and P. Kovacs (1980) in ref. 38 p.601 45 J. G. Lewis, N. F. Stanley and G. G. Guist (1990) in:
http://www.uct.ac.za/depts/botany/pstgrd/enrico/seaweed/alginica.html 46 A. Haug, B. Larsen, and O. Smidsrød, Acta Chem. Scand. 20, 183 (1966). 47 G. O. Aspinall, Ed., The Polysaccharides, Vol. II, Academic Press, New York London
(1983). 48 V. J. Chapman, and D .J. Chapman (1980) in:
http://www.uct.ac.za/depts/botany/pstgrd/enrico/seaweed/alginica.html 49 D. A. Rees and J. W. B. Samuel, J. Chem. Soc. C, 2295 (1967). 50 I. W. Sutherland, Pure Appl. Chem. 69, 1911 (1997).
114

51 M. Chaplin, Food Research Center, South Bank University in:
http://www.sbu.ac.uk/water/hyalg.html 52 M. Yalpani, Polysaccharides. Synthesis, Modifications and Structure/ Property
Relations, Elsevier, Amsterdam, p. 11 (1988). 53 R. Seale, E. R. Morris, and D. A. Rees, Carbohydr. Res. 110, 101 (1982). 54 O. Smidsrød and A. Hang, Acta Chem. Scand. 26, 2063 (1972). 55 O. Smidsrød and A. Hang, Acta Chem. Scand. 26, 79 (1972). 56 I. Braccini and S. Perez, Biomacromolecules, 2, 1089 (2001). 57 G. T. Grant, E. R. Morris, D. A. Rees, P.J. Smith, and D. Thom, FEBS Lett. 32,195
(1973). 58 J. Wingender, T. Neu, and H.-C. Flemming, Eds., Microbial Extracellular Polymeric
Substances, Springer-Verlag Berlin Heidelberg New York (1999). 59 B. Thu, G. Skjåk-Bræk, F. Micali, F. Vittur, and R. Rizzo, Carbohydr. Res. 297, 101
(1997). 60 G. D. Fasman, Circular Dichroism and the Conformational Analysis of Biomolecules,
Plenum Press, New York London (1996). 61 A. J. Stipanovic and E. S. Stevens : in Solution Properties of Polysaccharides”, D. A.
Brant, Ed., American Chemical Society Symposium Series, No. 150, American
Chemical Society, Washington (1981), p.303 in Ref. 52. 62 E. R. Morris, D. A. Rees, and D. Thom, Carbohydr. Res. 81, 305 (1980). 63 G. Klöck, A. Pfeffermann, C. Ryser, P. Gröhn, B. Kuttler, H.-J. Hahn, and U.
Zimmermann, Biomaterial. 18, 707 (1997). 64 M. Hatano, Induced Circular Dichroism in Biopolymer – Dye Systems, in Advances in
Polymer Science 77, S. O. Kamura, Ed., Springer-Verlag, Berlin Heidelberg NewYork
Tokyo (1986). 65 A. R. Engle, N. Purdie, and J. A. Hyatt, Carbohydr. Res. 265, 181 (1994). 66 G. R. Seely and R.L. Hart, Biopolymers 18, 2745 (1979). 67 A. Valliers, Compt. Rend. 112, 536 (1891). 68 F. Schardinger, Z. Unters. Nahr. u. Genussm. 6, 865 (1903). 69 F. Schardinger, Zentralbl. Bakteriol. Parasitenk. Abt. 2. 29,772 (1911). 70 K. Freudenberg, G. Blomquist, L. Ewald, and K. Soff, Ber. Dtsch. Chem. Ges. 69,1258
(1936). 71 K. Freudenberg, F. Cramer, Z. Naturforsch. 3b, 464 (1948). 72 D. French, Adv. Carbohydr. Chem. 12,189 (1957).
115
73 F. Cramer, Chem. Ber. 84, 851 (1951). 74 T. Nagai, in “Proceedings of the First International Symposium on Cyclodextrins”, J.
Szejtli, Ed., Reidel: Dordrecht, p. 15 (1981). 75 J. Szejtli, Cyclodextrin Technology, Kluwer Academic Publisher: Dordrecht, p. 450
(1988). 76 J. H. T. Luong and A.L.Nguyen, J. Chromatogr. A, 792, 431 (1997). 77 J . J indr ich in: http://prfdec.natur.cuni.cz/~jindrich/CD/sbcdcon2.gif 78 B. Siegel and R. Breslow, J. Am. Chem. Soc. 97, 6869 (1975). 79 J. Szejtli, J. incl. Phenom. 1, 104 (1983). 80 F. Cramer and H. Hettler, Naturw. 54, 625 (1967). 81 F. Cramer, W. Saenger, and H. C. H. Spartz, J. Am. Chem. Soc. 89, 14 (1967). 82 Y. Matsui and K. Mochida, Bull. Chem. Soc. Jpn. 51, 673 (1978). 83 V. Buss and Ch. Reichardt, J. Chem. Soc., Chem. Commun. 1636 (1992). 84 K. M. Tawarah and S. J. Khouri, Dyes and pigments, 45, 229 (2000). 85 H. Mwakibete, D. M. Bloor, E. J. Wyn-Jones, Inclusion Phenom Mol Recognit Chem.
10, 497 (1991). 86 R. P. Rohbach, L. J. Rodriguez, and E. M. Eyring, J. Phys. Chem. 81, 944 (1977). 87 R. I. Gelb, L. M. Schwartz, Inclusion Phenom Mol Recognit Chem. 7, 465, (1989). 88 A. Buvari, J. Szejtli, L. J. Barcza, J. Inclusion Phenom. 1, 151 (1983). 89 R. L. Schiller, J. H. Coates, SFJ. Lincoln, Chem. Soc. Faraday Trans, I. 80, 1257
(1984). 90 K. Connors, D. Pendergast, J. Am. Chem. Soc. 106, 7607 (1984). 91 H. Hirai, N. Toshima, and S. Uenoyama, Bull. Chem. Soc. Jpn. 58, 1156 (1985). 92 J. W. Park, H. J. Song, J. Phys. Chem. 93, 6454 (1989). 93 S. J. Hamai, J.Phys. Chem. 93, 2074 (1989). 94 R. J. Bergereon, D. M. Pillor, G. Gibeily and W. P. Roberts, Bioorg. Chem. 7, 263
(1978). 95 H. Harata, Bull. Chem. Soc. Jpn. 49, 2066 (1976). 96 T. Tabushi, Y. Kiyosuke, T. Sugimoto and K. Yamamura, J. Am. Chem. Soc. 100, 916
(1978). 97 P. C. Manor and W. Saenger, J. Am. Chem. Soc. 96, 3690 (1974). 98 R. I. Gelb, L. M. Schwartz., B. Cardelino, H. S. Fuhrman, R. F. Johnson and D. A.
Laufer , J. Am. Chem. Soc. 103, 1750 (1981). 99 Ref. 74, p. 141.
116

100 J. F. Wojcik and R.P. Rohrbach, J. Phys. Chem. 79, 2251 (1975). 101 K. M. Tawarah and A. A. Wazwaz, J. Chem Soc. Faraday Trans. 89,1729 (1993). 102 K. Harata and H. Uedaira, Bull. Chem. Soc. Jpn. 48, 375 (1975). 103 C. H. Tung, Z. Zhen and H. J. Xu, J. Photochem. 32, 311 (1986). 104 P. V. Demarco and A. L. Thakkar, J. Chem. Soc. , Chem. Commun. 2, (1970). 105 R. L. Vanetten, G. A. Glowes, J. S. Sebastian and M. L. Bender, J. Am. Chem. Soc. 98,
7855 (1967). 106 K. Harata, Bull. Chem. Soc. Jpn. 50, 1416 (1977). 107 D. W. Griffiths and M. L. Bender, Adv. Catal. 23, 209 (1973 ). 108 J. Szeijtli Chem. Rev. 98, 1743 (1998). 109 J. E. Davies, W. Kemula, H. M. Powell and N. O. Smith. J. Incl. Phenom. 1, 34 (1983). 110 J. Szeitli, J. Incl. Phenom. 1, 104 (1983). 111 D. W. Armstrong, W. Li and J. Pitha, Anal. Chem. 62, 214 (1990). 112 H. Nishi and S. Terabe, J. Chromatogr. A, 694, 245 (1995). 113 S. A. C. Wren and R. C. J. Rowe, Chromatography, 603, 235 (1992). 114 S. G. Penn, E. T. Bergström, D. M. Goodall and J. S. Loran, Anal. Chem., 66, 2866
(1994). 115 M. J. Kodaka, J. Phys. Chem. 95, 2110 (1991). 116 G. Marconi, S. Monti, B. Mayer and Köhler, J. Phys. Chem. 99, 3943 (1995). 117 R. P. Rohrbach and J. F. Wojcik, Carbohydr. Res. 92, 177 (1981). 118 N. Yoshida, Seiyama and M. Fujimoto, J. Incl. Phenom. 2, 573 (1984). 119 R. J. Clarke, J. H. Coates and S. F. Lincoln, J. Chem. Soc. Faraday Trans. I. 80, 3119
(1984). 120 P. C. Hiemenz, Principles of Colloid and Surface Chemistry, 2nd Ed., Marcel Dekker,
Inc., New York Basel (1986). 121 M. J. Rosen, Surfactants and Interfacial Phenomena, 2nd Ed., John Wiley & sons, New
York (1989). 122 J. L. Lynn and B. H. Bory in: Concise Encyclopaedia of Chemical Technology, R. Kirk,
Ed., Wiley, New York, p. 1949 (1999). 123 E. Pramauro and E. Pelizzetti, Surfactants in Analytical Chemistry: Applications of
Organized Amphiphilic Media, Elsevier, Amsterdam (1996). 124 L. L. Schramm, Surfactants: Fundamentals and Applications in Petroleum Industry,
Cambridge University Press, Cambridge (2000). 125 C. A. Bunton, L. Robinson, J. Schaak, and M. F. Stam, J. Org. Chem. 36, 2346 (1971).
117

126 F. M. Menger and C. A. Littau, J. Am. Chem. Soc. 113, 1451 (1991). 127 F. M. Menger and J. S. Keiper, Angew. Chem. 112, 1980 (2000). 128 G. H. Escamilla and G. R. Newkome. Angew. Chem. 106, 2013 (1994). 129 T. Kunitake, Angew. Chem. 104, 692 (1992). 130 (a) J. N. Israelachvili, D. J. Mitchel, and B. W. Ninham, J. Chem. Soc., Faraday Trans.
II. 72, 1525 (1976). (b) http://www.ub.rug.nl/eldoc/dis/science/r.t.buwalda/ 131 W. C. Preston, J. Phys. Colloid Chem. 52, 84 (1948). 132 P. C. T. V. S. Lobanov, A. R. Katritzky, D. O. Shah, and M. Karelson, Langmuir, 12,
1462 (1996). 133 S. E. Sheppard and A. L. Geddes, J. Chem. Phys. 13, 63 (1945). 134 P. Mukerjee and K. J. Mysels, J. Am. Chem. Soc. 59, 2937 (1955). 135 J. K. Weil and A.J.Stirton, J. Phys. Chem. 60, 899 (1956). 136 E. L. Colichman, J. Am. Chem. Soc. 73, 3385 (1951). 137 N. J. Turro, P. – L. Kuo, P. Somasundaran, and K. Wong, J. Phys. Chem. 90, 288
(1986). 138 C. F. Hiskey and T. A. Downey, J. Phys. Chem. 58, 835 ( 1954). 139 R. T. Buwalda, J. M. Jonker and J. B. F. N. Engberts, Langmuir 15, 1083 (1999). 140 G. J. Wang and J. B. F. N. Engbert, Langmuir 10, 2583 (1994). 141 R. K. Dutta and S. N. Bhat, Bull. Chem. Soc. Jpn. 66, 2457 (1993). 142 F. Quadrifoglio and V. Crezenzi, J. Colloid Interf. Sci. 35, 447 (1971). 143 M. K. Pal and P. K. Pal, J. Phys. Chem. 94, 2557 (1990). 144 P. Mukherjee and K.J. Mysels, J. Am. Chem. Soc. 77, 2937, (1955). 145 M. Fischer and J. Georges, Spectrochim. Acta. A 53, 1419 (1997). 146 P. Bilski, R. N. Hott, and C. F. Chignell, J. Photochem. Photobiol. Chem. A 110, 67
(1997). 147 P. Pal, H. Zeng, G. Durocher, D. Girard, R.Giasson, L. Blanchard, L. Gaboury, and L.
Villeneuve, J. Photochem. Photobiol. Chem. A 98, 65 (1996). 148 K. Vickery and B. Nordén, Encyclopaedia of Spectroscopy and Spectrometry, J. C.
Lindon, G. E. Tranter, and J. L. Holmes, Eds., Academic Press: London, p. 869 (2000). 149 P. Pančoška, L. Bednarova, and V. Kapsa, Chem. Phys. Lett. 191, 603 (1992). 150 M. Hatano, Induced Circular Dichroism in Biopolymer – Dye systems, in Advances in
Polymer Science 77, S. O. Kamura, Ed., Springer Verlag: Berlin Heidelberg New York
Tokyo 1986.
118
151 N. Berova, N. Harada, and K. Nakanishi, Encyclopaedia of Spectroscopy and
Spectrometry, J. C. Lindon, G. E. Tranter, and J. L. Holmes, Eds., Academic Press:
London, p. 470 (2000). 152 D. A. Lightner and J. E. Gurst, Organic Conformational Analysis and Stereochemistry
From Circular Dichroism Spectroscopy, Wiley: New York (2000). 153 N. Harada and K. Nakanishi, Circular Dichroic Spectroscopy: Exciton Coupling in
Organic Stereochemistry, University Science Books: Mill Valley, CA (1983). 154 N. Berova and K. Nakanishi in Circular Dichroism - Principles and Applications, N.
Berova, K. Nakanishi, and R. Woody, Eds., Wiley-VCH: New York, p. 337 (2000). 155 V. Czikkely, H. D. Försterling, and H. Kuhn, Chem. Phys. Lett. 6, 11 (1970). 156 H. J. Nolte and V. Buss, Chem. Phys. Lett. 19, 395 (1973). 157 D. A. Skoog, Principles of Instrumental Analysis, 3rd. ed. Philadelphia [u.a.] : Saunders
College Publ. (1985). 158 M. Thomas, Ultraviolet and visible Spectroscopy, 2nd Ed., John Wiley & Sons:
Chichester (1996). 159 Information inside the program: PeakFit Program version 4.05, Systat software Inc. 160 4-unknown calculator program: http://www.1728.com/unknwn4.htm 161 3-unknown calculator program: http://www.1728.com/unknwn3.htm 162 H. Min, J. Park, J. Ju, and D. Kim, Bull. Korean Chem. Soc., 19, 650 (1998). 163 C. Roos and V. Buss, J. Incl. Phenom. 27, 49 (1997). 164 K. A. Connors, Binding Constants: The Measurements of Molecular Complex Stability,
John Wiley, New York (1987). 165 D. D. Perrin and D. Boyd, Buffers for pH and metal ion control, Chapman and Hall,
London, P 44-47 (1979). 166 E. F. Williams, N. T. Woodbery, and J. K. Dixon, J. Colloid Interface Sci. 12, 459
(1957) in ref.143. 167 A. Haug, B. Larsen, and O. Smidsrød, Carbohydr. Res. 32, 217 (1974), modified by N.
Schürks, Duisburg University. 168 Purification (modified by S. Grobe) in: Bedeutung des extrazellulären Polysaccharids
Alginat für die Resistenz aquatischer Stämme von Pseudomonas aeruginosa gegenüber
Chlor. Dissertation, Universität Bonn (1995).
119
CURRICULUM VITAE
Name Sa’ib Al-khouri
Date of Birth 01.04.1963
Place of Birth Bishra (Irbid-Jordan)
Personal Status Married (three children)
School Education
1969-1979 Bishra elementary & secondary school (Jordan)
1979-1981 Irbid secondary school (Jordan)
University Education
1981-1985 B.Sc. study in chemistry at Yarmouk University (Irbid-Jordan)
1988-1990 M.Sc. study in physical chemistry at Yarmouk University.
During my study I worked on the inclusion process between
Azo-dyes and Cyclodextrins solutions.
Sep 1999 Commencement of my Ph.D. studies in the department of
theoretical chemistry at the Gerhard-Mercator-University
Duisburg, Germany, under the supervision of Prof. Dr. V. Buss.
Employment and Training
1985-1987 Military service (Army and ministry of education as teacher in a
secondary school)
1991- 1999 Research and teaching assistant in the department of chemistry
at Yarmouk University (Jordan). During my work I taught many
Laboratories courses, mainly physical chemistry laboratory.
Mar1999-Aug1999 Intensive course of German language / Bonn, Germany.
120