Embed Size (px)
Citation preview

UvA-DARE is a service provided by the library of the University of Amsterdam (http://dare.uva.nl)
UvA-DARE (Digital Academic Repository)
The cell cycle in neuroblastoma : from genomic aberrations to targeted interventionMolenaar, J.J.
Link to publication
Citation for published version (APA):Molenaar, J. J. (2009). The cell cycle in neuroblastoma : from genomic aberrations to targeted intervention.
General rightsIt is not permitted to download or to forward/distribute the text or part of it without the consent of the author(s) and/or copyright holder(s),other than for strictly personal, individual use, unless the work is under an open content license (like Creative Commons).
Disclaimer/Complaints regulationsIf you believe that digital publication of certain material infringes any of your rights or (privacy) interests, please let the Library know, statingyour reasons. In case of a legitimate complaint, the Library will make the material inaccessible and/or remove it from the website. Please Askthe Library: http://uba.uva.nl/en/contact, or a letter to: Library of the University of Amsterdam, Secretariat, Singel 425, 1012 WP Amsterdam,The Netherlands. You will be contacted as soon as possible.
Download date: 25 Mar 2019
5Genetic aberrations of G1-cell cycle genes in neuro-
blastoma are frequent and correlate with high ex-pression of E2F target genes and a poor prognosis.
Jan J. Molenaar1, Jan Koster1, Marli E. Ebus1, Peter van Sluis1, Ellen M. Westerhout1, Katleen De Preter2, Ingrid Ora1, Frank Speleman2,
Rogier Versteeg1, Huib N. Caron3
1Department of Human Genetics, Academic Medical Center, University of Amsterdam,
Meibergdreef 15, PO box 22700, 1105 AZ Amsterdam, The Netherlands. 2Center for Medical Genetics, Ghent University Hospital, Ghent, Belgium.
3Department of Pediatric Oncology, Emma Kinderziekenhuis, Academic Medical Center, Uni-
versity of Amsterdam, the Netherlands.
(Submitted for publication)


75
5
Genetic aberrations of G1-cell cycle genes in neuroblastoma
AbstractDeregulation of the cell cycle is crucial in oncogenesis. The tightly controlled network of cell cycle regulating genes consists of a core of Cyclin Dependent Kinases (CDK’s) that are activated by periodic expressed Cyclins. The activity of these Cyclin-CDK com-plexes is in turn influenced by Cyclin Dependent Kinase Inhibitors (CDKI’s) and multiple signal transduction routes that are frequently involved in cancer. Neuroblastoma are paediatric tumors that belong to the group of small round blue cell tumors which are characterized by a high growth rate and fast cell division. In this paper we present high throughput analyses of cell cycle regulating genes in neuroblastoma. We ana-lyzed a series of neuroblastoma by Comparative Genomic Hybridization (CGH) arrays, Single Nucleotide Polymorphism (SNP) arrays and Affymetrix expression arrays and we analyzed the data with the R2 bioinformatic tool. About 30% of neuroblastoma have genomic amplifications, gains or losses with shortest regions of overlap (SRO’s) that suggest implication of a series of G1 cell cycle regulating genes. CCND1 (Cyclin D1) and CDK4 are amplified or gained and the chromosomal regions of CDKN2 (INK4) group of CDKI’s are frequently deleted. Cluster analysis shows that tumors with genomic aberra-tions in G1 regulating genes, over-express E2F target genes that regulate G2/M phase progression. These tumors have a poor prognosis. Our findings suggest that pharma-cological inhibition of cell cycle genes might bear therapeutic promises for high risk neuroblastoma tumors.
IntroductionThe cell cycle is regulated by Cyclin Dependent Kinases (CDK’s) that are activated by intermittent expressed Cyclins. Each phase of the cell cycle is more or less controlled by specific CDK/Cyclin complexes, though there is redundancy. The Cyclin/CDK complexes are inhibited by Cyclin Dependent Kinase Inhibitors (CDKI’s). Cell cycle deregulation is one of the hallmarks of cancer and several human tumors are characterized by typi-cal aberrations in cell cycle regulating genes. Retinoblastoma have deletions of the Rb gene, mantle cell lymphoma carry translocations that result in over expression of the CCND1 (Cyclin D1) gene and familial melanomas have CDKN2A (INK4A; p16) dele-tions(1-3).
Neuroblastoma are extracranial neuroendocrine tumors that arise from the sympa-thetic nervous system. The tumor is characterized by a wide diversity of presentations. It is one of the rare human malignancies known to demonstrate spontaneous regres-sion with complete disappearance of undifferentiated disseminated stage 4S neuro-blastoma. On the other end of the spectrum are the stage 4 neuroblastoma tumors, often with bone metastasis, that are very aggressive and have a very poor prognosis. Though neuroblastoma have a low incidence, they are the second cause of cancer-related deaths in children. Histologically the neuroblastoma tumors can be subdivided in three types, i.e. undifferentiated, poorly differentiated and differentiating neuroblas-toma. Prognosis is better in more differentiated tumors(4;5). The most striking genetic characteristic of neuroblastoma is the amplification of MYCN. This oncogene is ampli-fied in 20-30% of neuroblastoma tumors and strongly correlates with a bad prognosis.

76
The Cell Cycle in Neuroblastoma
5
Myc Oncogene family members are involved in cell growth through protein synthesis, transcriptional regulation of ribosomal RNA processing, cell adhesion and tumor inva-sion(6;7). MYCN has also shown to be involved in the origin of replication complex as a co-factor in the complex, as well as through direct transcriptional up-regulation of the MCM family of genes(8;9). Besides MYCN, only very few other genes have been impli-cated in neuroblastoma pathogenesis. PHOX2B is mutated in less than 5% of neuroblas-toma (10), while ALK mutations were recently identified in about 7 % of neuroblastoma (11). Chromosomal aberrations on the contrary, are very frequent in neuroblastoma. Gain of chromosome 17q is found in the majority of neuroblastoma, while loss of distal chromosome arms 1p and 11q are among the prominent deletions. Homozygous dele-tions are exceptionally rare and it proved to be difficult to pinpoint genes in the aber-rant chromosomal regions that actually contribute to neuroblastoma.
There is not one clear genetic defect in neuroblastoma that causes cell cycle deregula-tion, though a low frequency of deletions and amplifications of cell cycle regulating genes have been described(12-15). In this paper we show by array CGH analysis of a panel of 82 primary neuroblastoma that about one-third of the tumors carry genetic aberrations of core cell cycle genes. Integrated analysis of CGH data and Affymetrix mRNA expression data revealed that the presence of these genetic aberrations cor-related with high expression E2F target genes that regulate the S and G2/M phase. Tumors with deregulation of E2F target genes tend to have a bad prognosis.
Results
High frequency of DNA and mRNA aberrations in G1 checkpoint regulating genes in neuroblastoma.
Cells have to pass the G1 entry checkpoint to irreversibly proceed in the G1 phase of the cell cycle. This checkpoint is tightly controlled by the D type Cyclins that acti-vate the kinase activity of CDK4 and CDK6. Activated CDK4/6 phosphorylates the pRb protein on several residues, resulting in a release and activation of E2F transcription factors. The target genes that are subsequently transcribed by E2F control further pro-gression of the cell cycle.
The q arm of chromosome 11 is frequently deleted in neuroblastoma, which correlates with a poor prognosis(16). The 11q13 region however, where CCND1 (Cyclin D1) is lo-cated, is never included in the deletions. On the contrary, we could identify gain of the 11q region containing CCND1 in 10 out of 82 neuroblastoma (fig 1A and S1) that were analyzed by Comparative Genomic Hybridization (CGH). Moreover the CCND1 gene sporadically shows high level amplification in neuroblastoma, which is in line with our previous findings(14). In our cohort of 82 neuroblastoma we could identify two primary tumors with high level amplification of the 11q13 region including the CCND1 gene (fig S2). This brings the frequency of gain or amplification of the 11q13 region to 15%. The expression of CCND1 on mRNA level is elevated in almost all of the neuroblastoma,

77
5
Genetic aberrations of G1-cell cycle genes in neuroblastoma
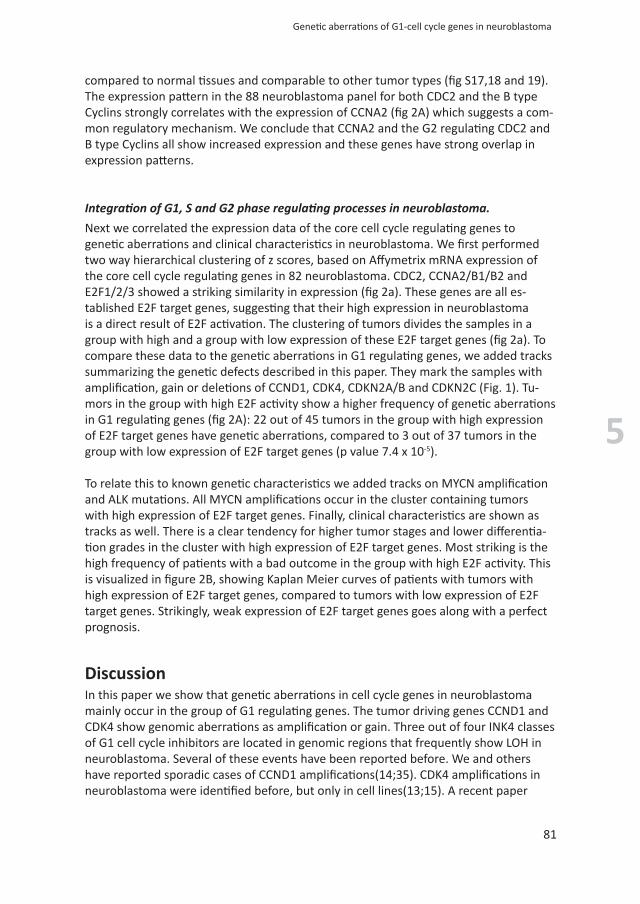
Figure 1. Smallest Region of Overlap (SRO) analysis determined by array CGH analysis. (A) The 11q13 region showing tumors with gain in black and amplification in red. The SRO is indicated with dotted lines and the ex-act genomic location on 11q is given in the figure. The CCND1 gene is located from 69.165.000 to 69.178.000 which is in the SRO. (B) The 12q14 region showing gain and amplification in 3 tumor samples. The NCBI reference sequences for genes are shown in green and red (green is sense and red anti-sense orientation). The location of CDK4 is indicated. (C) The 9p21 region showing loss of heterozygosity. The CDKN2A/B genes are located next to each other in the SRO as indicated in the figure. One tumor showed a small interstitial deletion in the CDKN2A gene (ITCC0195) and is therefore not included in this SRO analysis.
78
The Cell Cycle in Neuroblastoma
5
compared to normal tissue and even compared to many adult malignancies (fig S3).
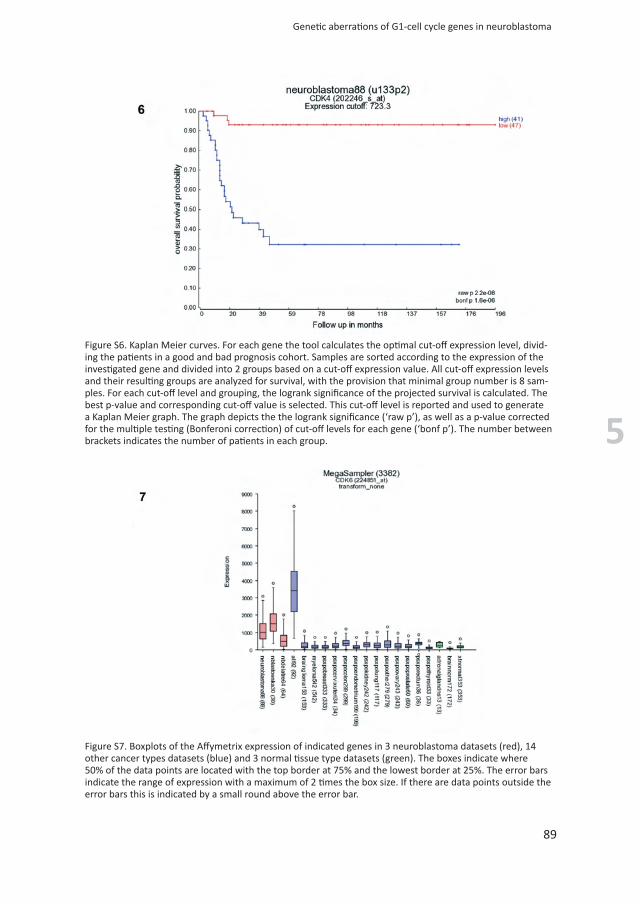
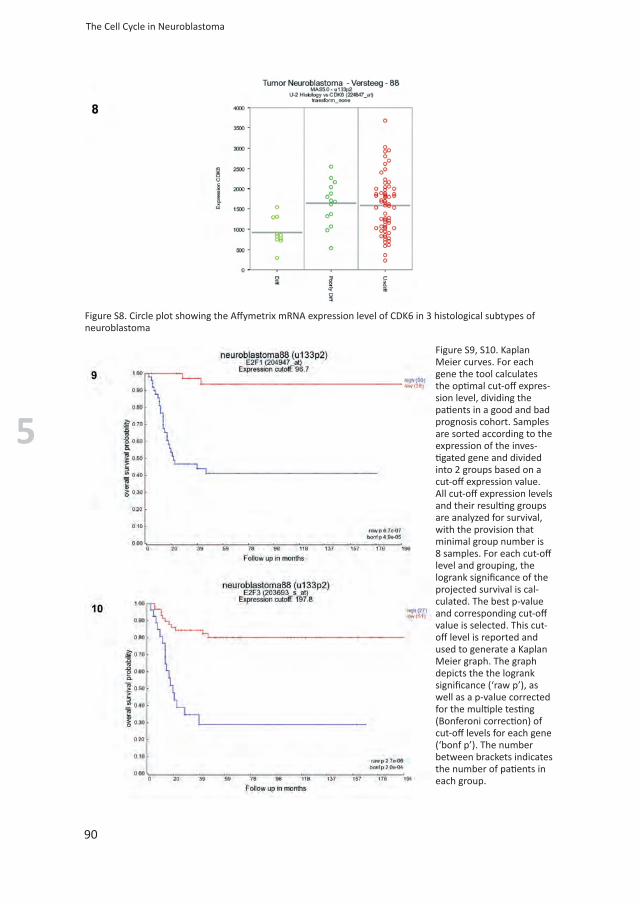
Deregulation of the G1 checkpoint can also occur by aberrations of CDK4 or CDK6, as amplifications and activating mutations of these CDK’s are found in various tumor types(17-19). In our series of 82 neuroblastoma, used for CGH analysis, we could identify one tumor with CDK4 amplification. In addition, the 12q14 region encompass-ing the CDK4 gene showed gain in 2 out of 82 neuroblastoma. In one tumor this occurs only in a small area directly surrounding the CDK4 gene (fig 1B and S4). The mRNA expression of CDK4 is high compared to normal tissue and significantly correlated with a bad prognosis (fig S5 and S6). For CDK6, the other G1 regulating Cyclin Dependent Kinase, CGH analysis did not reveal any genetic aberrations. However, CDK6 is highly expressed in neuroblastoma and expression is correlated to undifferentiated tumor histology (fig S7 and S8).
The pRb gene and the E2F transcription factors are not located in regions with genetic aberrations in neuroblastoma. Only E2F6 is located on the frequently gained 2p region but this gene is not functioning as a key player in G1 cell cycle regulation(20). The E2F transcription factors E2F1 and E2F3 have a moderate high expression, which correlates with a poor prognosis (fig S9 and S10).
The Cyclin D-CDK4/6 complex can be inhibited by the INK4 group of CDKI’s. The best known inhibitor is CDKN2A (INK4A /p16) which is located on chromosome 9p21 at the same gene locus as p14ARF. CDKN2A has not been reported to harbour single nucle-otide mutations in neuroblastoma but sporadic deletions of CDKN2A are found(12). In the 82 neuroblastoma analyzed by CGH we identified 7 tumors with small 9q21 deletions indicating heterozygote loss of CDKN2A (fig 1C and S11). To confirm heterozy-gote deletions we used SNP array analysis, which showed that the CDKN2A aberrations affected one allele only. The previously described homozygous deletions of CDKN2A were therefore not found in our cohort of 82 primary neuroblastoma tumors. Analysis of Affymetrix gene expression data showed that CDKN2A expression is equal or lower compared to normal tissue. A striking exception was formed by the high CDKN2A expression in a neuroblastoma tumor with CDK4 amplification (fig S12). The increase in CDKN2A expression in CDK4 amplified tumors is also seen in malignancies with a high frequency of CDK4 genetic aberrations like glioblastoma, suggesting that CDK4 can up-regulate CDKN2A expression. The CDKN2B (INK4B/p15) gene is located on 9p21 next to CDKN2A and is included in the deletions of CDKN2A. The CDKN2C (INK4C/p18) gene is located at chromosome 1p32, which is outside the SRO for 1p deletions in neuroblas-toma. Still this region is frequently deleted in neuroblastoma and the 1p32 region has been suggested to play a role in neuroblastoma development as well(21). In our cohort of neuroblastoma the 1p32 loss correlates with decreased CDKN2C expression (p value 0.03, t-test), suggesting that the genetic aberration adds to the decreased expression of CDKN2C. Finally the CDKN2D (INK4D/p19) gene is located on the 19p13 region which is not showing genetic aberrations in neuroblastoma. Interestingly the mRNA expression analysis shows a strong inverse correlation with MYCN expression (p value 1.2x10⁻⁶)(fig S13) suggesting an inhibitory effect of MYCN on this CDKI.
79
5
Genetic aberrations of G1-cell cycle genes in neuroblastoma
We conclude that in neuroblastoma the G1 checkpoint regulating genes CCND1 and CDK4 show occasional high level amplification. Moreover the CCND1, CDK4 and CDKN2A,B and C are located in regions that frequently show mild genomic aberrations as gain or LOH. The over-all frequency of genomic aberrations of G1 regulating genes in neuroblastoma is 30% (fig 2A). In addition to the genetic aberrations we identified very high expression of the G1 regulating genes on mRNA level, which is most abundant for CCND1, CDK4 and CDK6.
Over expression of E2F target genes in S phase and G2M checkpoint
S phase progression is controlled by CDK2 which is activated by Cyclin A/E. Activated CDK2 causes a further phosphorylation of pRb to maintain E2F transcriptional activity. Active CDK2 also phosphorylates Nucleophosmin and components of the pre-replica-tion complex to regulate initiation of DNA replication(22-24). The activated CDK2 ki-nase complex is inhibited by the CDKN1 family of CDKI’s: CDKN1A (Cip1/p21), CDKN1B (Kip1/p27) and CDKN1C (Cip2/p57)(25).
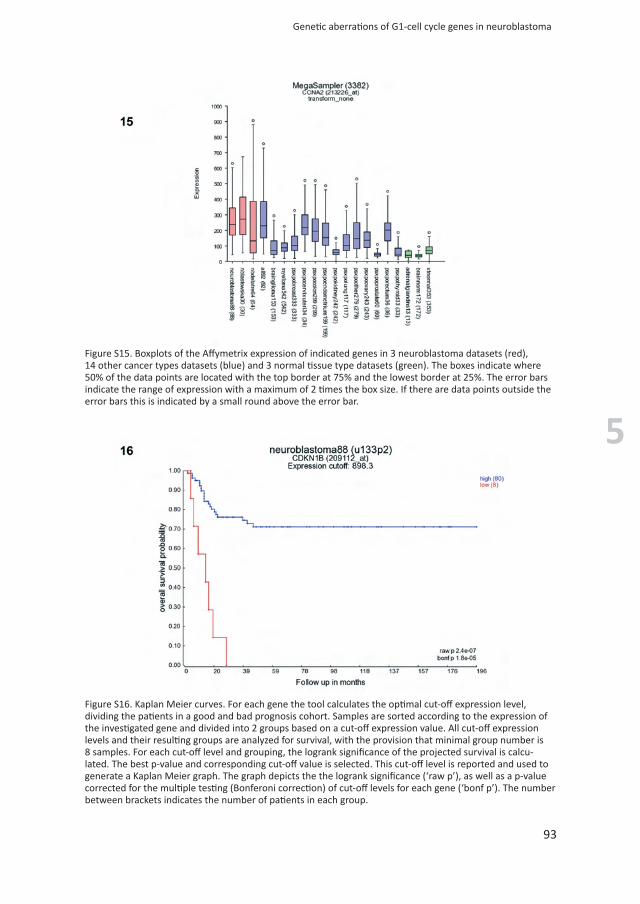
CDK2, Cyclin A/E and CDKN1A/B/C do not show gain, amplification or deletions in our 82 neuroblastoma cohort that was analyzed using CGH. The CDK2 mRNA expression levels show a strong correlation with poor prognosis and this might be in line with the synthetic lethal relation with MYCN, that we have reported previously (fig S14). From the S phase regulating Cyclins the CCNA2 gene does show increased mRNA expression compared to normal tissue (fig S15). CCNA2 is a direct transcriptional target of E2F and we previously showed that CCNA2 expression strongly decreases after silencing of CCND1 or CDK4 in neuroblastoma(26). Therefore the high CCNA2 expression in neuro-blastoma is most likely an indicator of high E2F activity.
The CDK inhibitors CDKN1A (Cip1/p21) and CDKN1B (Kip1/p27) are extensively studied in neuroblastoma (27-31). In our tumor panel the mRNA expression levels of CDKN1A are not up or down-regulated compared to other tumors and there is no correlation with clinical or genetic characteristics. Low CDKN1B mRNA expression levels are cor-related with bad prognosis which is in line with previous findings (fig S16)(28). CDKN1B was previously found to be strongly up-regulated during induction of neuronal differen-tiation and down-regulated by MYCN in a cell line model(29). These findings could not be confirmed by our current mRNA analysis in primary tumors. CDKN1B mRNA expres-sion does not correlate with differentiation or with MYCN expression. Also the CDKN1C (Kip2/p57) gene has been reported to be repressed by MYCN over-expression(32). However, these regulatory relations were not reflected by a significant correlation between MYCN amplification and CDKN1C expression in our series.
Progression from G2 to M phase is driven by CDC2 (CDK1) in complex with Cyclin B, which activation must be sustained until the metaphase. Active CDC2 causes phos-phorylation of a group of key proteins involved in chromatin condensation, nuclear membrane breakdown and microtubule and actin reorganization(33;34). CDC2 and the regulating B type Cyclins do not show aberrations on CGH analysis of the neuroblas-toma panel. The mRNA expression levels of these G2M regulating genes are increased
80
The Cell Cycle in Neuroblastoma
5
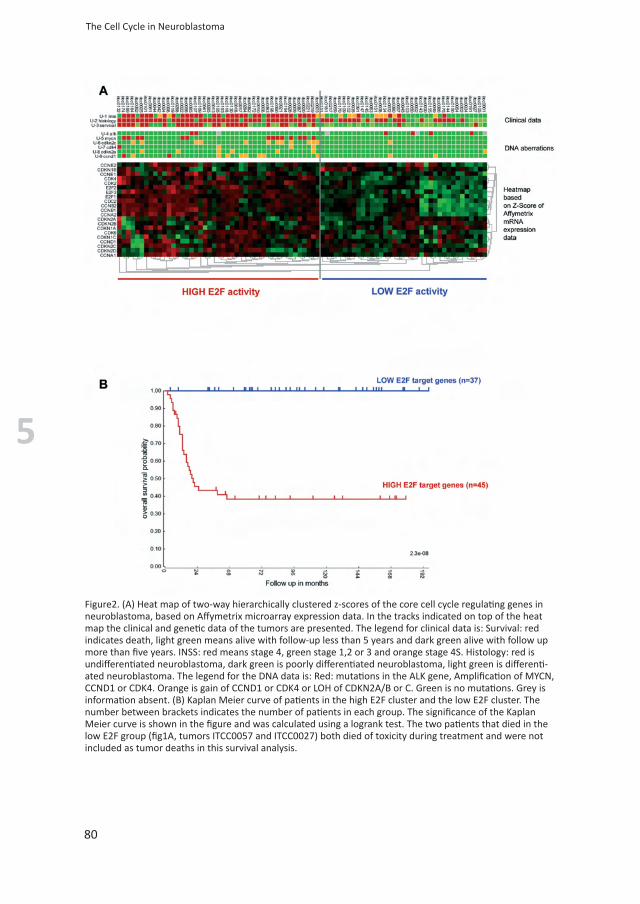
Figure2. (A) Heat map of two-way hierarchically clustered z-scores of the core cell cycle regulating genes in neuroblastoma, based on Affymetrix microarray expression data. In the tracks indicated on top of the heat map the clinical and genetic data of the tumors are presented. The legend for clinical data is: Survival: red indicates death, light green means alive with follow-up less than 5 years and dark green alive with follow up more than five years. INSS: red means stage 4, green stage 1,2 or 3 and orange stage 4S. Histology: red is undifferentiated neuroblastoma, dark green is poorly differentiated neuroblastoma, light green is differenti-ated neuroblastoma. The legend for the DNA data is: Red: mutations in the ALK gene, Amplification of MYCN, CCND1 or CDK4. Orange is gain of CCND1 or CDK4 or LOH of CDKN2A/B or C. Green is no mutations. Grey is information absent. (B) Kaplan Meier curve of patients in the high E2F cluster and the low E2F cluster. The number between brackets indicates the number of patients in each group. The significance of the Kaplan Meier curve is shown in the figure and was calculated using a logrank test. The two patients that died in the low E2F group (fig1A, tumors ITCC0057 and ITCC0027) both died of toxicity during treatment and were not included as tumor deaths in this survival analysis.
81
5
Genetic aberrations of G1-cell cycle genes in neuroblastoma
compared to normal tissues and comparable to other tumor types (fig S17,18 and 19). The expression pattern in the 88 neuroblastoma panel for both CDC2 and the B type Cyclins strongly correlates with the expression of CCNA2 (fig 2A) which suggests a com-mon regulatory mechanism. We conclude that CCNA2 and the G2 regulating CDC2 and B type Cyclins all show increased expression and these genes have strong overlap in expression patterns.
Integration of G1, S and G2 phase regulating processes in neuroblastoma.
Next we correlated the expression data of the core cell cycle regulating genes to genetic aberrations and clinical characteristics in neuroblastoma. We first performed two way hierarchical clustering of z scores, based on Affymetrix mRNA expression of the core cell cycle regulating genes in 82 neuroblastoma. CDC2, CCNA2/B1/B2 and E2F1/2/3 showed a striking similarity in expression (fig 2a). These genes are all es-tablished E2F target genes, suggesting that their high expression in neuroblastoma is a direct result of E2F activation. The clustering of tumors divides the samples in a group with high and a group with low expression of these E2F target genes (fig 2a). To compare these data to the genetic aberrations in G1 regulating genes, we added tracks summarizing the genetic defects described in this paper. They mark the samples with amplification, gain or deletions of CCND1, CDK4, CDKN2A/B and CDKN2C (Fig. 1). Tu-mors in the group with high E2F activity show a higher frequency of genetic aberrations in G1 regulating genes (fig 2A): 22 out of 45 tumors in the group with high expression of E2F target genes have genetic aberrations, compared to 3 out of 37 tumors in the group with low expression of E2F target genes (p value 7.4 x 10⁻⁵). To relate this to known genetic characteristics we added tracks on MYCN amplification and ALK mutations. All MYCN amplifications occur in the cluster containing tumors with high expression of E2F target genes. Finally, clinical characteristics are shown as tracks as well. There is a clear tendency for higher tumor stages and lower differentia-tion grades in the cluster with high expression of E2F target genes. Most striking is the high frequency of patients with a bad outcome in the group with high E2F activity. This is visualized in figure 2B, showing Kaplan Meier curves of patients with tumors with high expression of E2F target genes, compared to tumors with low expression of E2F target genes. Strikingly, weak expression of E2F target genes goes along with a perfect prognosis.
DiscussionIn this paper we show that genetic aberrations in cell cycle genes in neuroblastoma mainly occur in the group of G1 regulating genes. The tumor driving genes CCND1 and CDK4 show genomic aberrations as amplification or gain. Three out of four INK4 classes of G1 cell cycle inhibitors are located in genomic regions that frequently show LOH in neuroblastoma. Several of these events have been reported before. We and others have reported sporadic cases of CCND1 amplifications(14;35). CDK4 amplifications in neuroblastoma were identified before, but only in cell lines(13;15). A recent paper

82
The Cell Cycle in Neuroblastoma
5
described heterozygous and sporadically homozygous deletions of CDKN2A(12). We did not identify any homozygous deletions in CDKN2A in our series. The hemizygous dele-tions of the other CDKN2 genes and the gain of small regions surrounding CCND1 and CDK4 are newly reported findings. Most surprising is the high overall frequency of 30% genetic aberrations in G1 regulating genes. As others have shown, integrated analysis of high throughput methods can reveal a high frequency of oncogenetic pathways in certain tumor types(36;37). In neuroblastoma, the G1 cell cycle signal transduction route seems to be involved in a significant subset of the tumors. The frequency of genomic defects could even be an underestimation, since we did not include genetic aberrations as single nucleotide mutations or translocations. Moreover, mRNA expres-sion analysis reveals an even higher frequency of over-expression of the cell cycle regu-lating genes CCND1, CDK4 and CDK6. This suggests that oncogenetic events in Micro RNA’s (MIR’s) or epigenetic events as methylation, could also be involved in deregula-tion of the expression of these genes. The 1p36 located MIR-34A for instance, is known to have binding sites in the 3’ UTR of CCND1 and CDK6 mRNA and this is a candidate tumor suppressor miRNA in neuroblastoma(38).
Clustering analysis showed that the genomic aberrations affecting G1 genes correlate to over-expression of E2F target genes involved in S and G2/M phase progression. This suggests that the genetic aberrations in G1 regulating genes result in an increase in pRb phosphorylation and a release of pRb from the E2F transcription factor. As a result, E2F target genes become over-expressed (fig 3). We have recently confirmed that this chain of events actually occurs in neuroblastoma cell lines. Silencing of CCND1 and/or CDK4 resulted in decreased expression of the E2F target gene CCNA2(26). The other E2F target genes are probably regulated in a similar way, since their expression patterns strongly correlate.
The cluster of tumors with high E2F activity includes all tumors with MYCN amplifica-tion, which could indicate a direct involvement of MYCN in cell cycle regulation in neuroblastoma. Most studies on cell cycle regulation by MYC family members have focussed on MYC (c-Myc). MYC directly regulates CDK4 and CCND2 (Cyclin D2) on a transcriptional level and inhibits CDKN1A (p21) and CDKN2B (p15) by direct transcrip-tional repression(39-41). For MYCN these direct transcriptional interactions have not been proven. We found no correlation between MYCN amplification and expression of CDK4, CCND2, CDKN2B or CDKN1A in our cohort. Other studies have indirectly shown a relation of MYCN with cell cycle regulation. Over-expression of MYCN in quiescent cells accelerates S-phase progression after mitogenic stimulation and silencing of MYCN us-ing RNAi causes a decrease of cells in S-phase(42;43). Direct MYCN transcriptional tar-get genes in cell cycle regulation however have not been shown. As already described above we could show inverse correlations between MYCN expression and CDKN1C and CDKN2D. Whether these correlations are caused by direct MYCN transcriptional inhibition or instead MYCN over-expression is related to cell growth and up-regulation of metabolic pathways that sensitize a cell for further growth and replication, remains to be studied.
A most striking result of our analyses is the extreme poor prognosis for tumors in the

83
5
Genetic aberrations of G1-cell cycle genes in neuroblastoma
cluster with high E2F activity and frequent G1 deregulating events (Fig. 2B). Strong deregulation of G1 cell cycle genes in high risk tumors opens opportunities for targeted drug development. Preclinical and clinical studies with small molecule inhibitors target-ing G1 regulating genes though, have been disappointing. Also targeted inhibition of G1 regulating genes in neuroblastoma did not cause tumor death but rather resulted in a cell cycle arrest and neuronal differentiation. Since the G1 aberrations lead to high activity of S and G2M phase regulating genes, these might be better drug targets. Our data suggest that CDK2 and CDC2 inhibitors should be evaluated for efficacy in neuro-blastoma models.
Materials and methods
Patients and cell samples
The neuroblastic tumor panel used for Affymetrix Microarray analysis contains 88 neu-roblastoma samples. For CGH analysis 82 neuroblastoma tumor samples were used. All tumors analyzed by CGH were also included in the mRNA analysis. All samples were de-rived from primary tumors of untreated patients. Material was obtained during surgery and immediately frozen in liquid nitrogen. The Affymetrix data from adult tumors and normal tissues was derived from the Expression Project for Oncology (expO) database from the International Genomics Consortium (IGC) (http://www.intgen.org/expo.cfm).
Figure3. An overview of aberrations in cell cycle regulating genes in neuroblastoma. The genes indicated in red are activators of proliferation and those indicated in green are inhibiting cell cycle progression. The red lightnings indicate that the genes can be mutated or have copy number abnormalities in neuroblastoma. ↑ Indicates over expression of that gene compared to normal tissue. † Indicates a significant correlation of the mRNA expression of this gene (measured by Affymetrix micro arrays) with bad prognosis in the panel of 88 neuroblastoma.
84
The Cell Cycle in Neuroblastoma
5
CGH analysis
High molecular weight DNA was extracted from tumor tissue using standard proce-dures (see Caron et al 1993). Labeling and hybridisation were performed as described previously by Michels et al 2007(35). We used a custom 44K Agilent aCGH chip, en-riched for critical regions of loss/gain for neuroblastoma (10 kb resolution), miRNAs/T-UCRs (5 oligos/gene) and cancer gene census genes (5 oligos/gene). Data were ana-lyzed using the R2 web application (http://R2.humangenetics-amc.nl/). Circular binary segmentation was used for scoring the regions of gain, amplification and deletion. The coordinates of the first probe sets outside of the gained, amplified or deleted regions are given to indicate the borders of the genetic aberrations.
Affymetrix analysis
Total RNA of neuroblastoma tumors was extracted using Trizol reagent (Invitrogen, Carlsbad, ca) according to the manufacturer’s protocol. RNA concentration and quality were determined using the RNA 6000 nano assay on the Agilent 2100 Bioanalyzer (Agi-lent Technologies). Fragmentation of cRNA, hybridization to hg-u133 plus 2.0 microar-rays and scanning were carried out according to the manufacturers protocol (Affyme-trix inc. Santa Barbara, USA). The expression data were normalized with the MAS5.0 algorithm within the gcos program of Affymetrix. Target intensity was set to 100. All data were analyzed using the R2 web application, which is freely available at (http://R2.humangenetics-amc.nl/).
Acknowledgements
The work was supported by: Stichting Koningin Wilhelmina Fonds (KWF), Stichting Kin-dergeneeskundig Kankeronderzoek (SKK), and Kinderen Kankervrij (KiKa).

85
5
Genetic aberrations of G1-cell cycle genes in neuroblastoma
Reference List
(1) Sherr CJ. Cancer cell cycles. Science 1996; 274(5293):1672-1677.(2) Sherr CJ, Roberts JM. Living with or without cyclins and cyclin-dependent kinases. Genes Dev 2004;
18(22):2699-2711.(3) Santamaria D, Barriere C, Cerqueira A, Hunt S, Tardy C, Newton K et al. Cdk1 is sufficient to drive the
mammalian cell cycle. Nature 2007; 448(7155):811-815.(4) Maris JM, Hogarty MD, Bagatell R, Cohn SL. Neuroblastoma. Lancet 2007; 369(9579):2106-2120.(5) van Noesel MM, Versteeg R. Pediatric neuroblastomas: genetic and epigenetic ‘danse macabre’. Gene
2004; 325:1-15.(6) Boon K, Caron HN, van Asperen R, Valentijn L, Hermus MC, Van Sluis P et al. N-myc enhances the expres-
sion of a large set of genes functioning in ribosome biogenesis and protein synthesis. EMBO J 2001; 20(6):1383-1393.
(7) Adhikary S, Eilers M. Transcriptional regulation and transformation by Myc proteins. Nat Rev Mol Cell Biol 2005; 6(8):635-645.
(8) Koppen A, it-Aissa R, Koster J, van Sluis PG, Ora I, Caron HN et al. Direct regulation of the minichromo-some maintenance complex by MYCN in neuroblastoma. Eur J Cancer 2007; 43(16):2413-2422.
(9) Cole MD, Cowling VH. Transcription-independent functions of MYC: regulation of translation and DNA replication. Nat Rev Mol Cell Biol 2008; 9(10):810-815.
(10) van Limpt, V, Schramm A, van Lakeman A, Sluis P, Chan A, van Noesel M et al. The Phox2B homeobox gene is mutated in sporadic neuroblastomas. Oncogene 2004; 23(57):9280-9288.
(11) Mosse YP, Laudenslager M, Longo L, Cole KA, Wood A, Attiyeh EF et al. Identification of ALK as a major familial neuroblastoma predisposition gene. Nature 2008; 455(7215):930-935.
(12) Caren H, Erichsen J, Olsson L, Enerback C, Sjoberg RM, Abrahamsson J et al. High-resolution array copy number analyses for detection of deletion, gain, amplification and copy-neutral LOH in primary neu-roblastoma tumors: four cases of homozygous deletions of the CDKN2A gene. BMC Genomics 2008; 9:353.
(13) Fan X, Gomez L, Nistal M, Sierrasesumaga L, Castresana JS. Lack of gene amplification as a mechanism of CDK4 activation in human neuroblastoma. Oncol Rep 1999; 6(3):647-650.
(14) Molenaar JJ, van Sluis P, Boon K, Versteeg R, Caron HN. Rearrangements and increased expression of cyclin D1 (CCND1) in neuroblastoma. Genes Chromosomes Cancer 2003; 36(3):242-249.
(15) Van Roy N, Forus A, Myklebost O, Cheng NC, Versteeg R, Speleman F. Identification of two distinct chro-mosome 12-derived amplification units in neuroblastoma cell line NGP. Cancer Genet Cytogenet 1995; 82(2):151-154.
(16) Attiyeh EF, London WB, Mosse YP, Wang Q, Winter C, Khazi D et al. Chromosome 1p and 11q deletions and outcome in neuroblastoma. N Engl J Med 2005; 353(21):2243-2253.
(17) Kanoe H, Nakayama T, Murakami H, Hosaka T, Yamamoto H, Nakashima Y et al. Amplification of the CDK4 gene in sarcomas: tumor specificity and relationship with the RB gene mutation. Anticancer Res 1998; 18(4A):2317-2321.
(18) An HX, Beckmann MW, Reifenberger G, Bender HG, Niederacher D. Gene amplification and overexpres-sion of CDK4 in sporadic breast carcinomas is associated with high tumor cell proliferation. Am J Pathol 1999; 154(1):113-118.
(19) Schmidt EE, Ichimura K, Reifenberger G, Collins VP. CDKN2 (p16/MTS1) gene deletion or CDK4 amplifica-tion occurs in the majority of glioblastomas. Cancer Res 1994; 54(24):6321-6324.
(20) Trimarchi JM, Fairchild B, Verona R, Moberg K, Andon N, Lees JA. E2F-6, a member of the E2F family that can behave as a transcriptional repressor. Proc Natl Acad Sci U S A 1998; 95(6):2850-2855.
(21) Hiyama E, Hiyama K, Ohtsu K, Yamaoka H, Fukuba I, Matsuura Y et al. Biological characteristics of neuro-blastoma with partial deletion in the short arm of chromosome 1. Med Pediatr Oncol 2001; 36(1):67-74.
(22) Okuda M, Horn HF, Tarapore P, Tokuyama Y, Smulian AG, Chan PK et al. Nucleophosmin/B23 is a target of CDK2/cyclin E in centrosome duplication. Cell 2000; 103(1):127-140.
(23) Coverley D, Laman H, Laskey RA. Distinct roles for cyclins E and A during DNA replication complex assem-bly and activation. Nat Cell Biol 2002; 4(7):523-528.
(24) Woo RA, Poon RY. Cyclin-dependent kinases and S phase control in mammalian cells. Cell Cycle 2003;
86
The Cell Cycle in Neuroblastoma
5
2(4):316-324.(25) Sherr CJ, Roberts JM. CDK inhibitors: positive and negative regulators of G1-phase progression. Genes
Dev 1999; 13(12):1501-1512.(26) Molenaar JJ, Ebus ME, Koster J, van Sluis P, van Noesel CJ, Versteeg R et al. Cyclin D1 and CDK4 activity
contribute to the undifferentiated phenotype in neuroblastoma. Cancer Res 2008; 68(8):2599-2609.(27) Kawamata N, Seriu T, Koeffler HP, Bartram CR. Molecular analysis of the cyclin-dependent kinase inhi-
bitor family: p16(CDKN2/MTS1/INK4A), p18(INK4C) and p27(Kip1) genes in neuroblastomas. Cancer 1996; 77(3):570-575.
(28) Bergmann E, Wanzel M, Weber A, Shin I, Christiansen H, Eilers M. Expression of P27(KIP1) is prognostic and independent of MYCN amplification in human neuroblastoma. Int J Cancer 2001; 95(3):176-183.
(29) Nakamura Y, Ozaki T, Koseki H, Nakagawara A, Sakiyama S. Accumulation of p27 KIP1 is associated with BMP2-induced growth arrest and neuronal differentiation of human neuroblastoma-derived cell lines. Biochem Biophys Res Commun 2003; 307(1):206-213.
(30) Poluha W, Poluha DK, Chang B, Crosbie NE, Schonhoff CM, Kilpatrick DL et al. The cyclin-dependent kinase inhibitor p21 (WAF1) is required for survival of differentiating neuroblastoma cells. Mol Cell Biol 1996; 16(4):1335-1341.
(31) McKenzie PP, Danks MK, Kriwacki RW, Harris LC. P21Waf1/Cip1 dysfunction in neuroblastoma: a novel mechanism of attenuating G0-G1 cell cycle arrest. Cancer Res 2003; 63(13):3840-3844.
(32) Bell E, Lunec J, Tweddle DA. Cell cycle regulation targets of MYCN identified by gene expression microar-rays. Cell Cycle 2007; 6(10):1249-1256.
(33) Lukas J, Lukas C, Bartek J. Mammalian cell cycle checkpoints: signalling pathways and their organization in space and time. DNA Repair (Amst) 2004; 3(8-9):997-1007.
(34) Kops GJ, Weaver BA, Cleveland DW. On the road to cancer: aneuploidy and the mitotic checkpoint. Nat Rev Cancer 2005; 5(10):773-785.
(35) Michels E, Vandesompele J, De Preter K, Hoebeeck J, Vermeulen J, Schramm A et al. ArrayCGH-based classification of neuroblastoma into genomic subgroups. Genes Chromosomes Cancer 2007; 46(12):1098-1108.
(36) Jones S, Zhang X, Parsons DW, Lin JC, Leary RJ, Angenendt P et al. Core signaling pathways in human pancreatic cancers revealed by global genomic analyses. Science 2008; 321(5897):1801-1806.
(37) Parsons DW, Jones S, Zhang X, Lin JC, Leary RJ, Angenendt P et al. An integrated genomic analysis of human glioblastoma multiforme. Science 2008; 321(5897):1807-1812.
(38) Sun F, Fu H, Liu Q, Tie Y, Zhu J, Xing R et al. Downregulation of CCND1 and CDK6 by miR-34a induces cell cycle arrest. FEBS Lett 2008; 582(10):1564-1568.
(39) Hermeking H, Rago C, Schuhmacher M, Li Q, Barrett JF, Obaya AJ et al. Identification of CDK4 as a target of c-MYC. Proc Natl Acad Sci U S A 2000; 97(5):2229-2234.
(40) Bouchard C, Thieke K, Maier A, Saffrich R, Hanley-Hyde J, Ansorge W et al. Direct induction of cyclin D2 by Myc contributes to cell cycle progression and sequestration of p27. EMBO J 1999; 18(19):5321-5333.
(41) Gartel AL, Ye X, Goufman E, Shianov P, Hay N, Najmabadi F et al. Myc represses the p21(WAF1/CIP1) promoter and interacts with Sp1/Sp3. Proc Natl Acad Sci U S A 2001; 98(8):4510-4515.
(42) Woo CW, Tan F, Cassano H, Lee J, Lee KC, Thiele CJ. Use of RNA interference to elucidate the effect of MYCN on cell cycle in neuroblastoma. Pediatr Blood Cancer 2008; 50(2):208-212.
(43) Wartiovaara K, Barnabe-Heider F, Miller FD, Kaplan DR. N-myc promotes survival and induces S-phase entry of postmitotic sympathetic neurons. J Neurosci 2002; 22(3):815-824.

87
5
Genetic aberrations of G1-cell cycle genes in neuroblastoma
Supplementary figures
Figure S1 and S2. Array CGH analysis of chromosome 11 for a tumor with gain (S1) and amplification (S2) of the 11q13 region. The log fold values for the probe sets are shown. Red lines indicate the circular binary segmentation.
Figure S3. Boxplots of the Affymetrix expression of indicated genes in 3 neuroblastoma datasets (red), 14 other cancer types datasets (blue) and 3 normal tissue type datasets (green). The boxes indicate where 50% of the data points are located with the top border at 75% and the lowest border at 25%. The error bars indicate the range of expression with a maximum of 2 times the box size. If there are data points outside the error bars this is indicated by a small round above the error bar.

88
The Cell Cycle in Neuroblastoma
5
Figure S4. Array CGH analysis of the region surrounding CDK4 at chromosome 12. The log fold values for the probe sets are shown. The NCBI reference sequences for genes are shown in green and red (green is sense and red anti sense orientation).
Figure S5. Boxplots of the Affymetrix expression of indicated genes in 3 neuroblastoma datasets (red), 14 other cancer types datasets (blue) and 3 normal tissue type datasets (green). The boxes indicate where 50% of the data points are located with the top border at 75% and the lowest border at 25%. The error bars indicate the range of expression with a maximum of 2 times the box size. If there are data points outside the error bars this is indicated by a small round above the error bar.
89
5
Genetic aberrations of G1-cell cycle genes in neuroblastoma
Figure S6. Kaplan Meier curves. For each gene the tool calculates the optimal cut-off expression level, divid-ing the patients in a good and bad prognosis cohort. Samples are sorted according to the expression of the investigated gene and divided into 2 groups based on a cut-off expression value. All cut-off expression levels and their resulting groups are analyzed for survival, with the provision that minimal group number is 8 sam-ples. For each cut-off level and grouping, the logrank significance of the projected survival is calculated. The best p-value and corresponding cut-off value is selected. This cut-off level is reported and used to generate a Kaplan Meier graph. The graph depicts the the logrank significance (‘raw p’), as well as a p-value corrected for the multiple testing (Bonferoni correction) of cut-off levels for each gene (‘bonf p’). The number between brackets indicates the number of patients in each group.
Figure S7. Boxplots of the Affymetrix expression of indicated genes in 3 neuroblastoma datasets (red), 14 other cancer types datasets (blue) and 3 normal tissue type datasets (green). The boxes indicate where 50% of the data points are located with the top border at 75% and the lowest border at 25%. The error bars indicate the range of expression with a maximum of 2 times the box size. If there are data points outside the error bars this is indicated by a small round above the error bar.
90
The Cell Cycle in Neuroblastoma
5
Figure S8. Circle plot showing the Affymetrix mRNA expression level of CDK6 in 3 histological subtypes of neuroblastoma
Figure S9, S10. Kaplan Meier curves. For each gene the tool calculates the optimal cut-off expres-sion level, dividing the patients in a good and bad prognosis cohort. Samples are sorted according to the expression of the inves-tigated gene and divided into 2 groups based on a cut-off expression value. All cut-off expression levels and their resulting groups are analyzed for survival, with the provision that minimal group number is 8 samples. For each cut-off level and grouping, the logrank significance of the projected survival is cal-culated. The best p-value and corresponding cut-off value is selected. This cut-off level is reported and used to generate a Kaplan Meier graph. The graph depicts the the logrank significance (‘raw p’), as well as a p-value corrected for the multiple testing (Bonferoni correction) of cut-off levels for each gene (‘bonf p’). The number between brackets indicates the number of patients in each group.

91
5
Genetic aberrations of G1-cell cycle genes in neuroblastoma
Figure S11. Log fold values of array CGH data and B allele frequency of SNP array data from the area sur-rounding the CDKN2A gene at chromosome 9. The NCBI reference sequences for genes are shown in green and red (green is sense and red anti sense orientation).
Figure S12. Circle plot showing the Affymetrix mRNA expression level of CDKN2A in neuroblastoma and vari-ous types of normal tissues.

92
The Cell Cycle in Neuroblastoma
5
Figure S13. Circle plot showing the Affymetrix mRNA expression level of CDKN2D in MYCN amplified and MYCN single copy neuroblastoma
Figure S14. Kaplan Meier curves. For each gene the tool calculates the optimal cut-off expression level, dividing the patients in a good and bad prognosis cohort. Samples are sorted according to the expression of the investigated gene and divided into 2 groups based on a cut-off expression value. All cut-off expression levels and their resulting groups are analyzed for survival, with the provision that minimal group number is 8 samples. For each cut-off level and grouping, the logrank significance of the projected survival is calcu-lated. The best p-value and corresponding cut-off value is selected. This cut-off level is reported and used to generate a Kaplan Meier graph. The graph depicts the the logrank significance (‘raw p’), as well as a p-value corrected for the multiple testing (Bonferoni correction) of cut-off levels for each gene (‘bonf p’). The number between brackets indicates the number of patients in each group.
93
5
Genetic aberrations of G1-cell cycle genes in neuroblastoma
Figure S16. Kaplan Meier curves. For each gene the tool calculates the optimal cut-off expression level, dividing the patients in a good and bad prognosis cohort. Samples are sorted according to the expression of the investigated gene and divided into 2 groups based on a cut-off expression value. All cut-off expression levels and their resulting groups are analyzed for survival, with the provision that minimal group number is 8 samples. For each cut-off level and grouping, the logrank significance of the projected survival is calcu-lated. The best p-value and corresponding cut-off value is selected. This cut-off level is reported and used to generate a Kaplan Meier graph. The graph depicts the the logrank significance (‘raw p’), as well as a p-value corrected for the multiple testing (Bonferoni correction) of cut-off levels for each gene (‘bonf p’). The number between brackets indicates the number of patients in each group.
Figure S15. Boxplots of the Affymetrix expression of indicated genes in 3 neuroblastoma datasets (red), 14 other cancer types datasets (blue) and 3 normal tissue type datasets (green). The boxes indicate where 50% of the data points are located with the top border at 75% and the lowest border at 25%. The error bars indicate the range of expression with a maximum of 2 times the box size. If there are data points outside the error bars this is indicated by a small round above the error bar.

94
The Cell Cycle in Neuroblastoma
5
Figure S17, S18, S19. Boxplots of the Affymetrix expression of indicated genes in 3 neuroblastoma datasets (red), 14 other cancer types datasets (blue) and 3 normal tissue type datasets (green). The boxes indicate where 50% of the data points are located with the top border at 75% and the lowest border at 25%. The error bars indicate the range of expression with a maximum of 2 times the box size. If there are data points outside the error bars this is indicated by a small round above the error bar.