Embed Size (px)
Citation preview
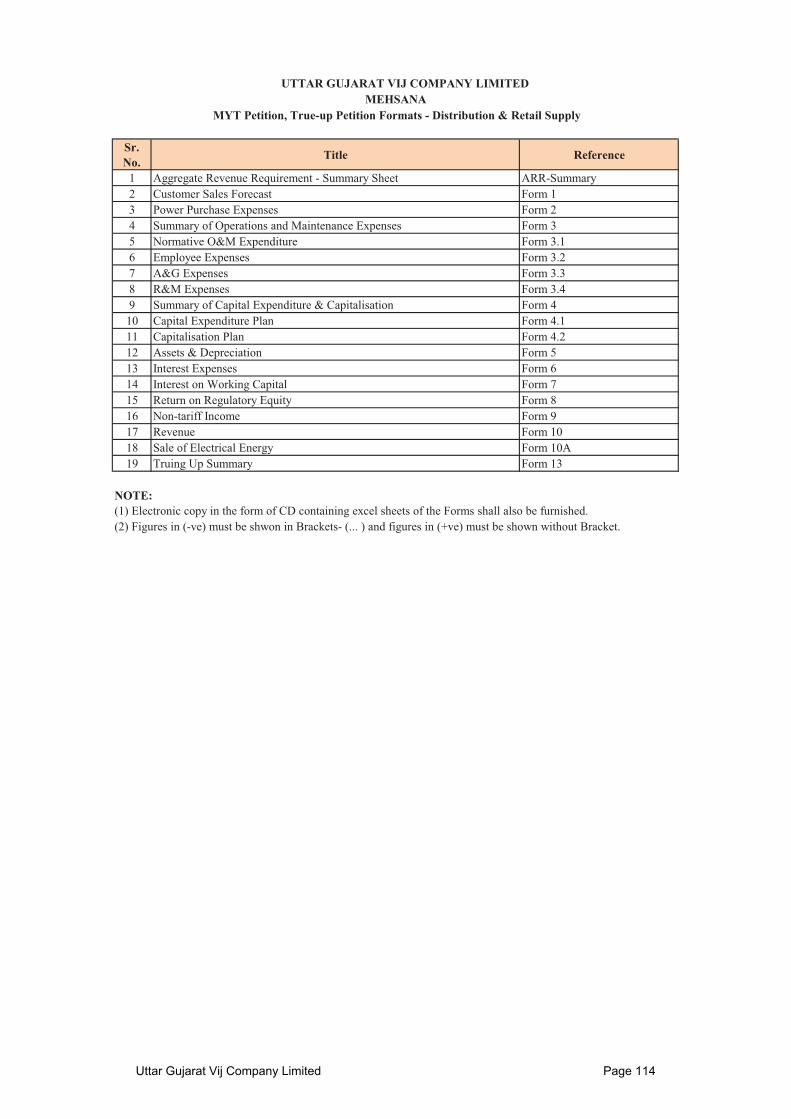
Sr. No. Title Reference
1 Aggregate Revenue Requirement - Summary Sheet ARR-Summary2 Customer Sales Forecast Form 13 Power Purchase Expenses Form 24 Summary of Operations and Maintenance Expenses Form 35 Normative O&M Expenditure Form 3.16 Employee Expenses Form 3.27 A&G Expenses Form 3.38 R&M Expenses Form 3.49 Summary of Capital Expenditure & Capitalisation Form 410 Capital Expenditure Plan Form 4.111 Capitalisation Plan Form 4.212 Assets & Depreciation Form 513 Interest Expenses Form 614 Interest on Working Capital Form 715 Return on Regulatory Equity Form 816 Non-tariff Income Form 917 Revenue Form 1018 Sale of Electrical Energy Form 10A19 Truing Up Summary Form 13
NOTE:
UTTAR GUJARAT VIJ COMPANY LIMITED
MYT Petition, True-up Petition Formats - Distribution & Retail SupplyMEHSANA
(1) Electronic copy in the form of CD containing excel sheets of the Forms shall also be furnished.(2) Figures in (-ve) must be shwon in Brackets- (... ) and figures in (+ve) must be shown without Bracket.
Uttar Gujarat Vij Company Limited Page 114

Distribution Business(Rs. Crore)
FY 2016-17 FY 2017-18 FY 2018-19 FY 2019-20 FY 2020-21
Projected Projected Projected Projected Projected
1 Power Purcahse Expenses Form 2 7,228.97 7,888.88 8,249.78 8,843.67 9,297.82 9,724.98 10,481.962 Operation & Maintenance Expenses Form 3 343.12 468.93 555.16 586.71 620.06 655.32 692.593 Depreciation Form 5 271.28 231.08 289.67 331.74 368.61 399.19 427.814 Interest & Finance Charges Form 6 158.81 135.58 145.76 151.30 153.47 150.91 145.835 Interest on Working Capital Form 7 - - - - - - -6 Bad Debts written off 0.72 6.15 6.15 6.15 6.15 6.15 6.157 Contribution to contingency reserves - - - - - - -8 Total Revenue Expenditure 8,002.90 8,730.62 9,246.52 9,919.57 10,446.10 10,936.55 11,754.339 Return on Equity Capital Form 8 147.76 147.90 164.32 181.11 197.59 212.51 226.97
10 Income Tax 15.00 17.14 17.14 17.14 17.14 17.14 17.1411 Aggregate Revenue Requirement 8,165.66 8,895.66 9,427.99 10,117.82 10,660.83 11,166.21 11,998.4412 Less: Non Tariff Income Form 9 156.83 167.85 148.09 148.09 148.09 148.09 148.0913 Less: Income from Other Business14 Aggregate Revenue Requirement of Wires Business 8,008.83 8,727.80 9,279.90 9,969.73 10,512.74 11,018.12 11,850.35
Distribution Wires Business(Rs. Crore)
FY 2016-17 FY 2017-18 FY 2018-19 FY 2019-20 FY 2020-21
Projected Projected Projected Projected Projected
1 Operation & Maintenance Expenses Form 3 222.50 292.32 347.86 367.63 388.54 410.64 434.002 Depreciation Form 5 244.15 207.97 260.71 298.57 331.74 359.27 385.023 Interest & Finance Charges Form 6 142.93 122.02 131.18 136.17 138.13 135.82 131.254 Interest on Working Capital Form 7 - - - - - - -5 Contribution to contingency reserves - -6 Total Revenue Expenditure 609.58 622.31 739.75 802.37 858.41 905.73 950.277 Return on Equity Capital Form 8 132.98 133.11 147.89 163.00 177.83 191.26 204.278 Income Tax 13.50 15.43 15.43 15.43 15.43 15.43 15.439 Aggregate Revenue Requirement 756.07 770.85 903.07 980.80 1,051.67 1,112.42 1,169.97
10 Less: Non Tariff Income Form 9 15.68 16.79 14.81 14.81 14.81 14.81 14.8111 Less: Income from Other Business12 Aggregate Revenue Requirement of Wires Business 740.39 754.06 888.26 965.99 1,036.86 1,097.61 1,155.16
Distribution Retail Supply Business(Rs. Crore)
FY 2016-17 FY 2017-18 FY 2018-19 FY 2019-20 FY 2020-21
Projected Projected Projected Projected Projected
1 Power Purchase Expenses Form 2 7,228.97 7,888.88 8249.78266 8843.67417 9297.81854 9724.98439 10481.95642 Operation & Maintenance Expenses Form3 120.62 176.61 207.30 219.07 231.52 244.68 258.593 Depreciation Form 5 27.13 23.11 28.97 33.17 36.86 39.92 42.784 Interest & Finance Charges Form 6 15.88 13.56 14.58 15.13 15.35 15.09 14.585 Interest on Working Capital Form 7 - - - - - - -6 Bad debts written off 0.72 6.15 6.15 6.15 6.15 6.15 6.157 Contribution to contingency reserves - -8 Total Revenue Expenditure 7,393.32 8,108.30 8,506.77 9,117.20 9,587.70 10,030.82 10,804.069 Return on Equity Capital Form 8 14.78 14.79 16.43 18.11 19.76 21.25 22.70
10 Income Tax 1.50 1.71 1.71 1.71 1.71 1.71 1.7111 Aggregate Revenue Requirement 7,409.59 8,124.81 8,524.92 9,137.02 9,609.17 10,053.79 10,828.471213 Less: Non Tariff Income Form 9 141.15 151.0669 133.28 133.28 133.28 133.28 133.2814 Less: Income from Other Business15 Aggregate Revenue Requirement of Retail Supply 7,268.45 7,973.74 8,391.64 9,003.74 9,475.89 9,920.51 10,695.19
Note For FY 2015-16 : GERC Tariff Regulations, 2011 will be ApplicableFor FY 2016-17 to FY 2020-21 : GERC MYT Regulations, 2016 will be Applicable.
UTTAR GUJARAT VIJ COMPANY LIMITEDMEHSANA
MYT Petition, True-up Petition Formats - Distribution & Retail Supply
Sr. No. Particulars Reference
True-Up Year (FY 2015-16) MYT Control Period
Tariff Order
MYT Control Period
Tariff Order April - March (Audited)
Claimed in the petition
Particulars Reference
Form Summary: Aggregate Revenue Requirement - Summary Sheet
True-Up Year (FY 2015-16)Sr. No.
MYT Control Period
Tariff Order April - March (Audited)
Claimed in the petition
April - March (Audited)
Claimed in the petition
Sr. No. Particulars Reference
True-Up Year (FY 2015-16)
Uttar Gujarat Vij Company Limited Page 115

True-Up Year (FY 2015-16)(MU)
Consumer Category & Consumption Slab Apr May Jun Jul Aug Sep Oct Nov Dec Jan Feb Mar Total
HT & EHT CategoryIndustrial HT 4,550Railway Traction 14
Low Voltage CategoryRGP 1,881GLP 41Non-RGP & LTMD 1,557Public Water Works 610Agriculture 8,549Street Light 52Total 17,254Year: FY 2016-17
(MU)Consumer Category & Consumption
Slab Apr May Jun Jul Aug Sep Oct Nov Dec Jan Feb Mar Total
HT & EHT CategoryIndustrial HT 4,632Railway Traction -
Low Voltage CategoryRGP 2,035GLP 44Non-RGP & LTMD 1,643Public Water Works 662Agriculture 9,010Street Light 55Total 18081
Ensuing Years (FY 2017-18 to FY 2020-21)
Consumer Category & Consumption Slab
FY 2017-18 FY 2018-19 FY 2019-
20FY 2020-
21
HT & EHT CategoryIndustrial HT 4,716 4,802 4,889 4,977Railway Traction - - - -
Low Voltage CategoryRGP 2,200.19 2,379.34 2,573.07 2,782.58GLP 48.17 52.18 56.53 61.25Non-RGP & LTMD 1,733.22 1,828.50 1,929.02 2,035.06Public Water Works 718.34 779.53 845.93 918.00Agriculture 9,471 9,932 10,394 10,855Street Light 58.51 62.00 65.70 69.62Total 18,946 19,836 20,752 21,698
Past Sales Data
Consumer Category & Consumption Slab
FY 2010-11 FY 2011-12 FY 2012-
13FY 2013-
14FY 2014-
15FY 2015-
165 Year CAGR
HT & EHT CategoryIndustrial HT 3,250 3,566 3,771 3,465 4,469 4,550 6.96%Railway Traction 14 17 17 15 16 14 -0.06%
Low Voltage CategoryRGP 1,272.0 1,371.0 1,480.5 1,573.3 1,763.5 1,881.3 8.14%GLP 32.3 33.6 37.2 41.0Non-RGP & LTMD 1,326.3 1,337.0 1,431.9 1,557.3Public Water Works 462.0 482.0 514.9 518.0 571.6 610.0 5.71%Agriculture 7,082.0 7,261.0 7,629.9 7,496.6 8,070.1 8,548.5Street Light 39.0 41.0 43.2 46.2 48.3 52.1 5.97%Total 13,319 14,012 14,816 14,486 16,408 17,254 5.31%
UTTAR GUJARAT VIJ COMPANY LIMITEDMEHSANA
MYT Petition, True-up Petition Formats - Distribution & Retail SupplyForm 1: Customer Sales & Forecast
1,200.0 1,274.0
Uttar Gujarat Vij Company Limited Page 116
True-Up Year (FY 2015-16)
Installed Capacity
(MW)
Utility share (%)
GUVNL share (MW)
Energy Received
(MU)
Total Annual Fixed
charges (Rs Crore)
Capacity Charges paid/
payable by Utility (Rs
Crore)
Variable Cost per
unit (Rs/kWh)
Total Variable
Charges (Rs Crore)
Any Other Charges (Please specify the type
of charges)
Total Cost of Energy
purchased (Rs Crore)
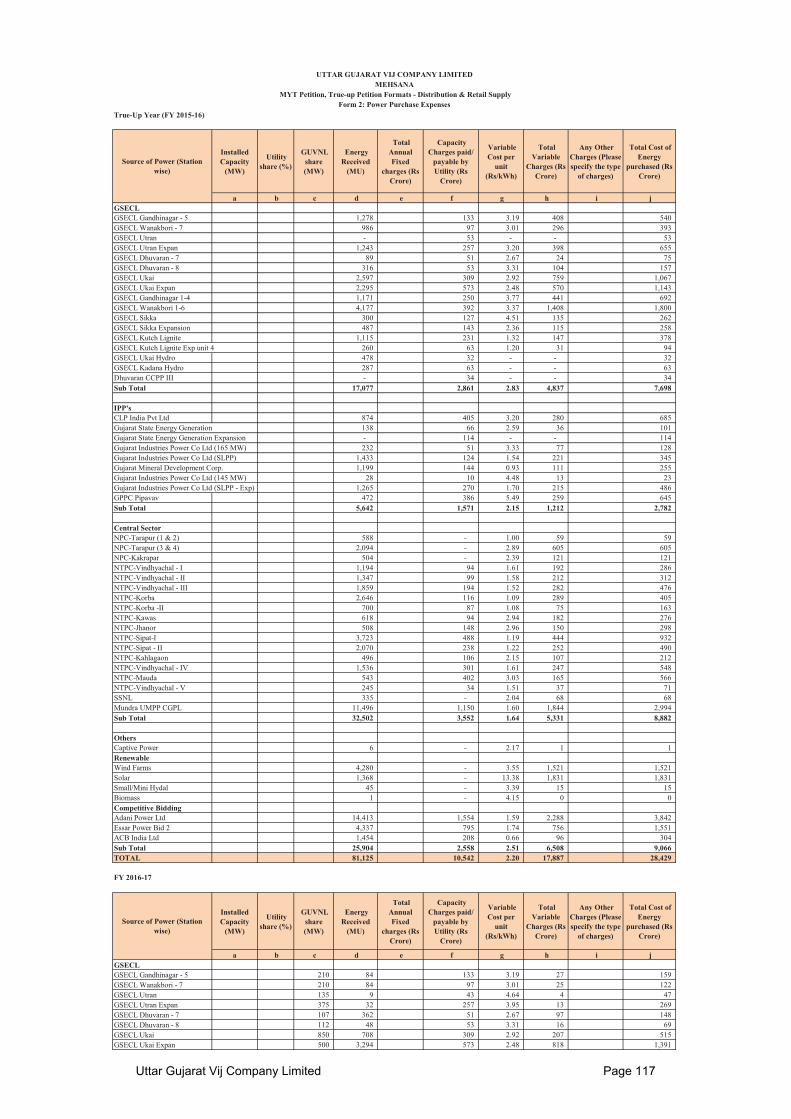
a b c d e f g h i j GSECLGSECL Gandhinagar - 5 1,278 133 3.19 408 540GSECL Wanakbori - 7 986 97 3.01 296 393GSECL Utran - 53 - - 53GSECL Utran Expan 1,243 257 3.20 398 655GSECL Dhuvaran - 7 89 51 2.67 24 75GSECL Dhuvaran - 8 316 53 3.31 104 157GSECL Ukai 2,597 309 2.92 759 1,067GSECL Ukai Expan 2,295 573 2.48 570 1,143GSECL Gandhinagar 1-4 1,171 250 3.77 441 692GSECL Wanakbori 1-6 4,177 392 3.37 1,408 1,800GSECL Sikka 300 127 4.51 135 262GSECL Sikka Expansion 487 143 2.36 115 258GSECL Kutch Lignite 1,115 231 1.32 147 378GSECL Kutch Lignite Exp unit 4 260 63 1.20 31 94GSECL Ukai Hydro 478 32 - - 32GSECL Kadana Hydro 287 63 - - 63Dhuvaran CCPP III - 34 - - 34Sub Total 17,077 2,861 2.83 4,837 7,698
IPP'sCLP India Pvt Ltd 874 405 3.20 280 685Gujarat State Energy Generation 138 66 2.59 36 101Gujarat State Energy Generation Expansion - 114 - - 114Gujarat Industries Power Co Ltd (165 MW) 232 51 3.33 77 128Gujarat Industries Power Co Ltd (SLPP) 1,433 124 1.54 221 345Gujarat Mineral Development Corp. 1,199 144 0.93 111 255Gujarat Industries Power Co Ltd (145 MW) 28 10 4.48 13 23Gujarat Industries Power Co Ltd (SLPP - Exp) 1,265 270 1.70 215 486GPPC Pipavav 472 386 5.49 259 645Sub Total 5,642 1,571 2.15 1,212 2,782
Central SectorNPC-Tarapur (1 & 2) 588 - 1.00 59 59NPC-Tarapur (3 & 4) 2,094 - 2.89 605 605NPC-Kakrapar 504 - 2.39 121 121NTPC-Vindhyachal - I 1,194 94 1.61 192 286NTPC-Vindhyachal - II 1,347 99 1.58 212 312NTPC-Vindhyachal - III 1,859 194 1.52 282 476NTPC-Korba 2,646 116 1.09 289 405NTPC-Korba -II 700 87 1.08 75 163NTPC-Kawas 618 94 2.94 182 276NTPC-Jhanor 508 148 2.96 150 298NTPC-Sipat-I 3,723 488 1.19 444 932NTPC-Sipat - II 2,070 238 1.22 252 490NTPC-Kahlagaon 496 106 2.15 107 212NTPC-Vindhyachal - IV 1,536 301 1.61 247 548NTPC-Mauda 543 402 3.03 165 566NTPC-Vindhyachal - V 245 34 1.51 37 71SSNL 335 - 2.04 68 68Mundra UMPP CGPL 11,496 1,150 1.60 1,844 2,994Sub Total 32,502 3,552 1.64 5,331 8,882
OthersCaptive Power 6 - 2.17 1 1RenewableWind Farms 4,280 - 3.55 1,521 1,521Solar 1,368 - 13.38 1,831 1,831Small/Mini Hydal 45 - 3.39 15 15Biomass 1 - 4.15 0 0Competitive BiddingAdani Power Ltd 14,413 1,554 1.59 2,288 3,842Essar Power Bid 2 4,337 795 1.74 756 1,551ACB India Ltd 1,454 208 0.66 96 304Sub Total 25,904 2,558 2.51 6,508 9,066TOTAL 81,125 10,542 2.20 17,887 28,429
Installed Capacity
(MW)
Utility share (%)
GUVNL share (MW)
Energy Received
(MU)
Total Annual Fixed
charges (Rs Crore)
Capacity Charges paid/
payable by Utility (Rs
Crore)
Variable Cost per
unit (Rs/kWh)
Total Variable
Charges (Rs Crore)
Any Other Charges (Please specify the type
of charges)
Total Cost of Energy
purchased (Rs Crore)
a b c d e f g h i j GSECLGSECL Gandhinagar - 5 210 84 133 3.19 27 159GSECL Wanakbori - 7 210 84 97 3.01 25 122GSECL Utran 135 9 43 4.64 4 47GSECL Utran Expan 375 32 257 3.95 13 269GSECL Dhuvaran - 7 107 362 51 2.67 97 148GSECL Dhuvaran - 8 112 48 53 3.31 16 69GSECL Ukai 850 708 309 2.92 207 515GSECL Ukai Expan 500 3,294 573 2.48 818 1,391
Source of Power (Station wise)
FY 2016-17
UTTAR GUJARAT VIJ COMPANY LIMITEDMEHSANA
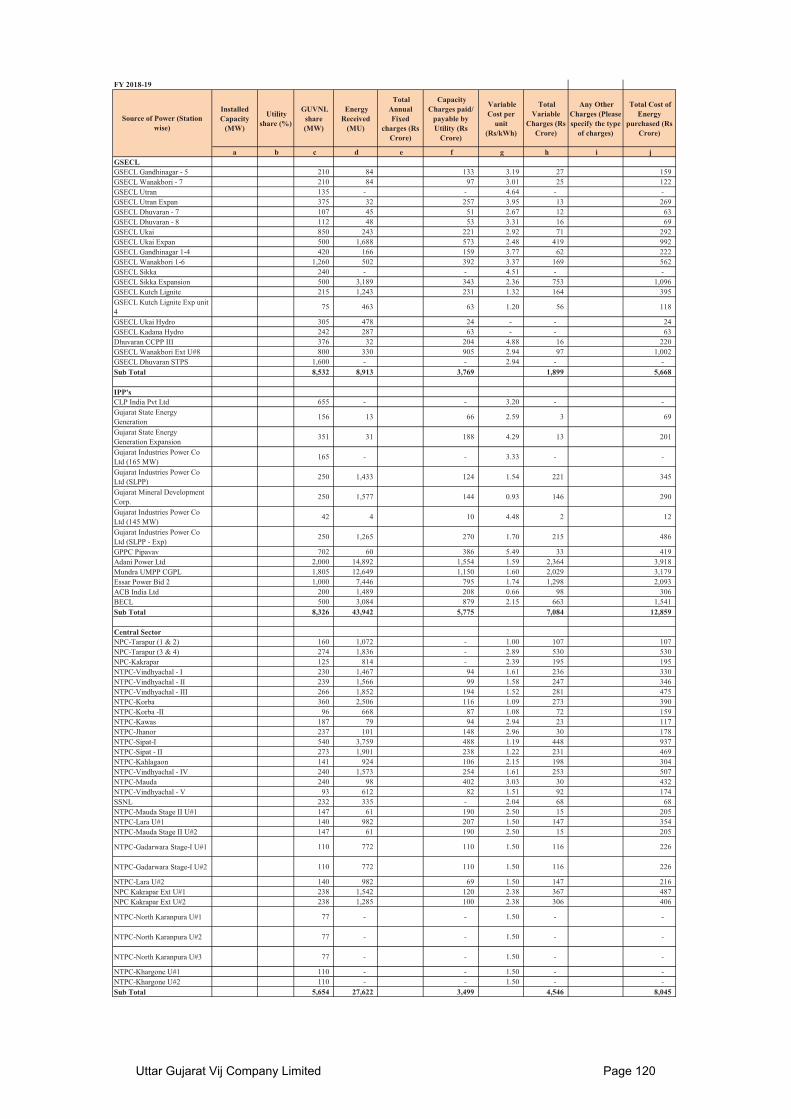
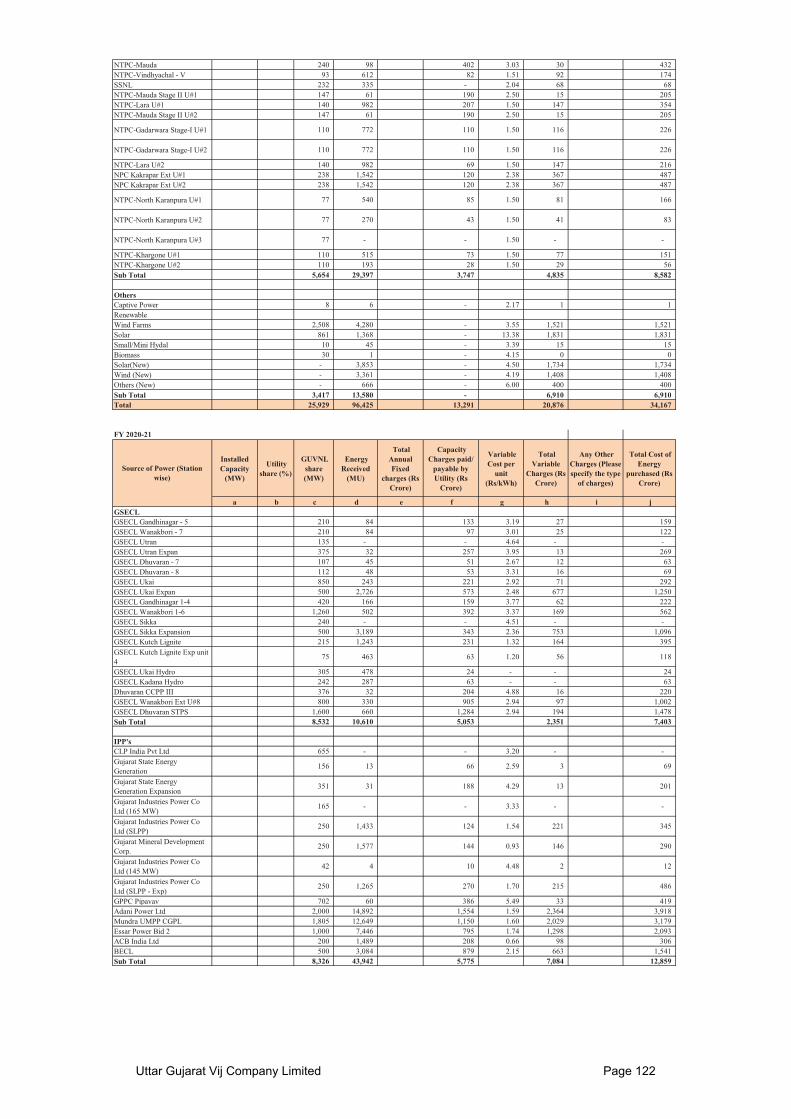
MYT Petition, True-up Petition Formats - Distribution & Retail SupplyForm 2: Power Purchase Expenses
Source of Power (Station wise)
Uttar Gujarat Vij Company Limited Page 117

GSECL Gandhinagar 1-4 420 205 197 3.77 77 274GSECL Wanakbori 1-6 1,260 502 392 3.37 169 562GSECL Sikka 240 93 127 4.51 42 169GSECL Sikka Expansion 500 3,189 343 2.36 753 1,096GSECL Kutch Lignite 215 1,243 231 1.32 164 395GSECL Kutch Lignite Exp unit 4
75 463 63 1.20 56 118
GSECL Ukai Hydro 305 478 24 - - 24GSECL Kadana Hydro 242 287 63 - - 63Dhuvaran CCPP III 376 32 204 4.88 16 220GSECL Wanakbori Ext U#8 800 - - 2.94 -GSECL Dhuvaran STPS 1,600 - - 2.94 - -Sub Total 8,532 11,111 3,159 2,482 5,641
IPP'sCLP India Pvt Ltd 655 56 405 3.20 18 423Gujarat State Energy Generation
156 13 66 2.59 3 69
Gujarat State Energy Generation Expansion
351 31 188 4.29 13 201
Gujarat Industries Power Co Ltd (165 MW)
165 5 17 3.33 2 18
Gujarat Industries Power Co Ltd (SLPP)
250 1,433 124 1.54 221 345
Gujarat Mineral Development Corp.
250 1,577 144 0.93 146 290
Gujarat Industries Power Co Ltd (145 MW)
42 4 10 4.48 2 12
Gujarat Industries Power Co Ltd (SLPP - Exp)
250 1,265 270 1.70 215 486
GPPC Pipavav 702 60 386 5.49 33 419Adani Power Ltd 2,000 14,892 1,554 1.59 2,364 3,918Mundra UMPP CGPL 1,805 12,649 1,150 1.60 2,029 3,179Essar Power Bid 2 1,000 7,446 795 1.74 1,298 2,093ACB India Ltd 200 1,489 208 0.66 98 306BECL 500 1,799 512 2.15 387 899Sub Total 8,326 42,717 5,831 6,827 12,658
Central SectorNPC-Tarapur (1 & 2) 160 1,072 - 1.00 107 107NPC-Tarapur (3 & 4) 274 1,836 - 2.89 530 530NPC-Kakrapar 125 814 - 2.39 195 195NTPC-Vindhyachal - I 230 1,467 94 1.61 236 330NTPC-Vindhyachal - II 239 1,566 99 1.58 247 346NTPC-Vindhyachal - III 266 1,852 194 1.52 281 475NTPC-Korba 360 2,506 116 1.09 273 390NTPC-Korba -II 96 668 87 1.08 72 159NTPC-Kawas 187 79 94 2.94 23 117NTPC-Jhanor 237 101 148 2.96 30 178NTPC-Sipat-I 540 3,759 488 1.19 448 937NTPC-Sipat - II 273 1,901 238 1.22 231 469NTPC-Kahlagaon 141 924 106 2.15 198 304NTPC-Vindhyachal - IV 240 1,573 254 1.61 253 507NTPC-Mauda 240 98 402 3.03 30 432NTPC-Vindhyachal - V 93 612 82 1.51 92 174SSNL 232 335 - 2.04 68 68NTPC-Mauda Stage II U#1 147 344 63 2.50 86 149NTPC-Lara U#1 140 - - 1.50 - -NTPC-Mauda Stage II U#2 147 - - 2.50 - -
NTPC-Gadarwara Stage-I U#1 110 - - 1.50 - -
NTPC-Gadarwara Stage-I U#2 110 - - 1.50 - -
NTPC-Lara U#2 140 - - 1.50 - -NPC Kakrapar Ext U#1 238 - - 2.38 - -NPC Kakrapar Ext U#2 238 - - 2.38 - -
NTPC-North Karanpura U#1 77 - - 1.50 - -
NTPC-North Karanpura U#2 77 - - 1.50 - -
NTPC-North Karanpura U#3 77 - - 1.50 - -
NTPC-Khargone U#1 110 - - 1.50 - -NTPC-Khargone U#2 110 - - 1.50 - -Sub Total 5,654 21,509 2,466 3,403 5,869
OthersCaptive Power 8 6 - 2.17 1 1RenewableWind Farms 2,508 4,280 - 3.55 1,521 1,521Solar 861 1,368 - 13.38 1,831 1,831Small/Mini Hydal 10 45 - 3.39 15 15Biomass 30 1 - 4.15 0 0Solar(New) - 67 - 4.50 30 30Wind (New) - 2,079 - 4.19 871 871Others (New) - 365 - 6.00 219 219Sub Total 3,417 8,210 - 4,489 4,489Total 25,929 83,548 11,456 17,201 28,657
Installed Capacity
(MW)
Utility share (%)
GUVNL share (MW)
Energy Received
(MU)
Total Annual Fixed
charges (Rs Crore)
Capacity Charges paid/
payable by Utility (Rs
Crore)
Variable Cost per
unit (Rs/kWh)
Total Variable
Charges (Rs Crore)
Any Other Charges (Please specify the type
of charges)
Total Cost of Energy
purchased (Rs Crore)
a b c d e f g h i j GSECLGSECL Gandhinagar - 5 210 84 133 3.19 27 159
FY 2017-18
Source of Power (Station wise)
Uttar Gujarat Vij Company Limited Page 118
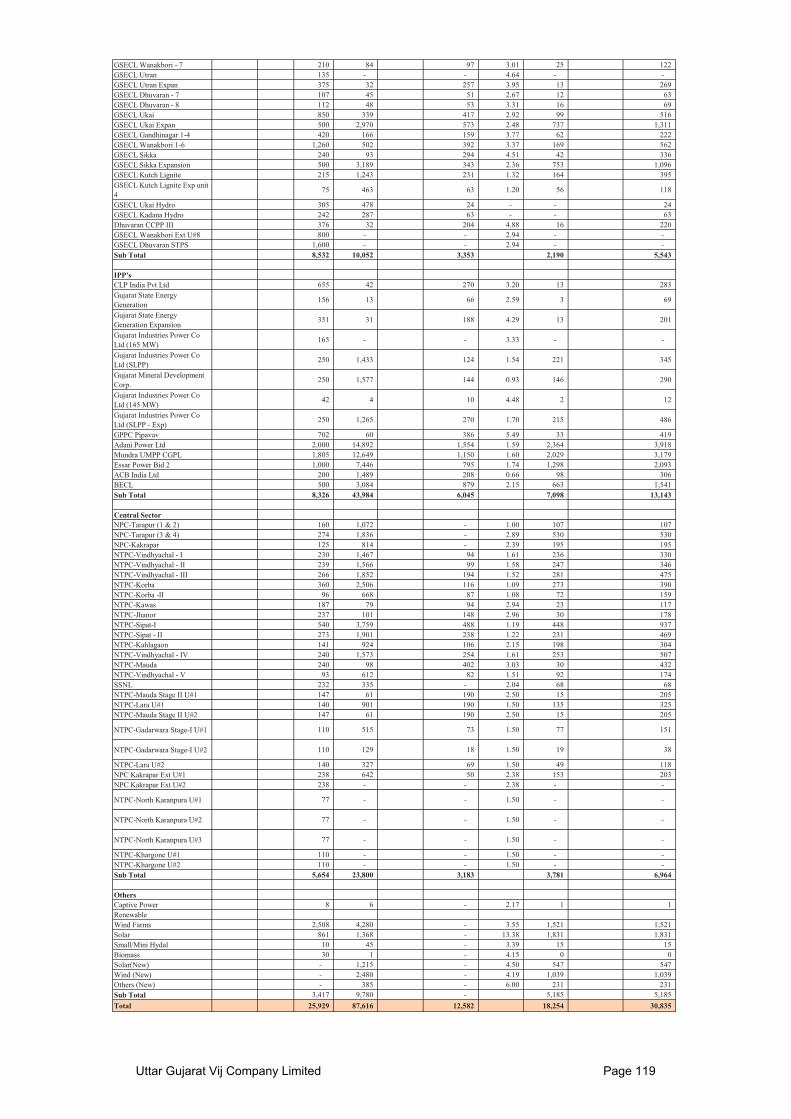
GSECL Wanakbori - 7 210 84 97 3.01 25 122GSECL Utran 135 - - 4.64 - -GSECL Utran Expan 375 32 257 3.95 13 269GSECL Dhuvaran - 7 107 45 51 2.67 12 63GSECL Dhuvaran - 8 112 48 53 3.31 16 69GSECL Ukai 850 339 417 2.92 99 516GSECL Ukai Expan 500 2,970 573 2.48 737 1,311GSECL Gandhinagar 1-4 420 166 159 3.77 62 222GSECL Wanakbori 1-6 1,260 502 392 3.37 169 562GSECL Sikka 240 93 294 4.51 42 336GSECL Sikka Expansion 500 3,189 343 2.36 753 1,096GSECL Kutch Lignite 215 1,243 231 1.32 164 395GSECL Kutch Lignite Exp unit 4
75 463 63 1.20 56 118
GSECL Ukai Hydro 305 478 24 - - 24GSECL Kadana Hydro 242 287 63 - - 63Dhuvaran CCPP III 376 32 204 4.88 16 220GSECL Wanakbori Ext U#8 800 - - 2.94 - -GSECL Dhuvaran STPS 1,600 - - 2.94 - -Sub Total 8,532 10,052 3,353 2,190 5,543
IPP'sCLP India Pvt Ltd 655 42 270 3.20 13 283Gujarat State Energy Generation
156 13 66 2.59 3 69
Gujarat State Energy Generation Expansion
351 31 188 4.29 13 201
Gujarat Industries Power Co Ltd (165 MW)
165 - - 3.33 - -
Gujarat Industries Power Co Ltd (SLPP)
250 1,433 124 1.54 221 345
Gujarat Mineral Development Corp.
250 1,577 144 0.93 146 290
Gujarat Industries Power Co Ltd (145 MW)
42 4 10 4.48 2 12
Gujarat Industries Power Co Ltd (SLPP - Exp)
250 1,265 270 1.70 215 486
GPPC Pipavav 702 60 386 5.49 33 419Adani Power Ltd 2,000 14,892 1,554 1.59 2,364 3,918Mundra UMPP CGPL 1,805 12,649 1,150 1.60 2,029 3,179Essar Power Bid 2 1,000 7,446 795 1.74 1,298 2,093ACB India Ltd 200 1,489 208 0.66 98 306BECL 500 3,084 879 2.15 663 1,541Sub Total 8,326 43,984 6,045 7,098 13,143
Central SectorNPC-Tarapur (1 & 2) 160 1,072 - 1.00 107 107NPC-Tarapur (3 & 4) 274 1,836 - 2.89 530 530NPC-Kakrapar 125 814 - 2.39 195 195NTPC-Vindhyachal - I 230 1,467 94 1.61 236 330NTPC-Vindhyachal - II 239 1,566 99 1.58 247 346NTPC-Vindhyachal - III 266 1,852 194 1.52 281 475NTPC-Korba 360 2,506 116 1.09 273 390NTPC-Korba -II 96 668 87 1.08 72 159NTPC-Kawas 187 79 94 2.94 23 117NTPC-Jhanor 237 101 148 2.96 30 178NTPC-Sipat-I 540 3,759 488 1.19 448 937NTPC-Sipat - II 273 1,901 238 1.22 231 469NTPC-Kahlagaon 141 924 106 2.15 198 304NTPC-Vindhyachal - IV 240 1,573 254 1.61 253 507NTPC-Mauda 240 98 402 3.03 30 432NTPC-Vindhyachal - V 93 612 82 1.51 92 174SSNL 232 335 - 2.04 68 68NTPC-Mauda Stage II U#1 147 61 190 2.50 15 205NTPC-Lara U#1 140 901 190 1.50 135 325NTPC-Mauda Stage II U#2 147 61 190 2.50 15 205
NTPC-Gadarwara Stage-I U#1 110 515 73 1.50 77 151
NTPC-Gadarwara Stage-I U#2 110 129 18 1.50 19 38
NTPC-Lara U#2 140 327 69 1.50 49 118NPC Kakrapar Ext U#1 238 642 50 2.38 153 203NPC Kakrapar Ext U#2 238 - - 2.38 - -
NTPC-North Karanpura U#1 77 - - 1.50 - -
NTPC-North Karanpura U#2 77 - - 1.50 - -
NTPC-North Karanpura U#3 77 - - 1.50 - -
NTPC-Khargone U#1 110 - - 1.50 - -NTPC-Khargone U#2 110 - - 1.50 - -Sub Total 5,654 23,800 3,183 3,781 6,964
OthersCaptive Power 8 6 - 2.17 1 1RenewableWind Farms 2,508 4,280 - 3.55 1,521 1,521Solar 861 1,368 - 13.38 1,831 1,831Small/Mini Hydal 10 45 - 3.39 15 15Biomass 30 1 - 4.15 0 0Solar(New) - 1,215 - 4.50 547 547Wind (New) - 2,480 - 4.19 1,039 1,039Others (New) - 385 - 6.00 231 231Sub Total 3,417 9,780 - 5,185 5,185Total 25,929 87,616 12,582 18,254 30,835
Uttar Gujarat Vij Company Limited Page 119
Installed Capacity
(MW)
Utility share (%)
GUVNL share (MW)
Energy Received
(MU)
Total Annual Fixed
charges (Rs Crore)
Capacity Charges paid/
payable by Utility (Rs
Crore)
Variable Cost per
unit (Rs/kWh)
Total Variable
Charges (Rs Crore)
Any Other Charges (Please specify the type
of charges)
Total Cost of Energy
purchased (Rs Crore)
a b c d e f g h i j GSECLGSECL Gandhinagar - 5 210 84 133 3.19 27 159GSECL Wanakbori - 7 210 84 97 3.01 25 122GSECL Utran 135 - - 4.64 - -GSECL Utran Expan 375 32 257 3.95 13 269GSECL Dhuvaran - 7 107 45 51 2.67 12 63GSECL Dhuvaran - 8 112 48 53 3.31 16 69GSECL Ukai 850 243 221 2.92 71 292GSECL Ukai Expan 500 1,688 573 2.48 419 992GSECL Gandhinagar 1-4 420 166 159 3.77 62 222GSECL Wanakbori 1-6 1,260 502 392 3.37 169 562GSECL Sikka 240 - - 4.51 - -GSECL Sikka Expansion 500 3,189 343 2.36 753 1,096GSECL Kutch Lignite 215 1,243 231 1.32 164 395GSECL Kutch Lignite Exp unit 4
75 463 63 1.20 56 118
GSECL Ukai Hydro 305 478 24 - - 24GSECL Kadana Hydro 242 287 63 - - 63Dhuvaran CCPP III 376 32 204 4.88 16 220GSECL Wanakbori Ext U#8 800 330 905 2.94 97 1,002GSECL Dhuvaran STPS 1,600 - - 2.94 - -Sub Total 8,532 8,913 3,769 1,899 5,668
IPP'sCLP India Pvt Ltd 655 - - 3.20 - -Gujarat State Energy Generation
156 13 66 2.59 3 69
Gujarat State Energy Generation Expansion
351 31 188 4.29 13 201
Gujarat Industries Power Co Ltd (165 MW)
165 - - 3.33 - -
Gujarat Industries Power Co Ltd (SLPP)
250 1,433 124 1.54 221 345
Gujarat Mineral Development Corp.
250 1,577 144 0.93 146 290
Gujarat Industries Power Co Ltd (145 MW)
42 4 10 4.48 2 12
Gujarat Industries Power Co Ltd (SLPP - Exp)
250 1,265 270 1.70 215 486
GPPC Pipavav 702 60 386 5.49 33 419Adani Power Ltd 2,000 14,892 1,554 1.59 2,364 3,918Mundra UMPP CGPL 1,805 12,649 1,150 1.60 2,029 3,179Essar Power Bid 2 1,000 7,446 795 1.74 1,298 2,093ACB India Ltd 200 1,489 208 0.66 98 306BECL 500 3,084 879 2.15 663 1,541Sub Total 8,326 43,942 5,775 7,084 12,859
Central SectorNPC-Tarapur (1 & 2) 160 1,072 - 1.00 107 107NPC-Tarapur (3 & 4) 274 1,836 - 2.89 530 530NPC-Kakrapar 125 814 - 2.39 195 195NTPC-Vindhyachal - I 230 1,467 94 1.61 236 330NTPC-Vindhyachal - II 239 1,566 99 1.58 247 346NTPC-Vindhyachal - III 266 1,852 194 1.52 281 475NTPC-Korba 360 2,506 116 1.09 273 390NTPC-Korba -II 96 668 87 1.08 72 159NTPC-Kawas 187 79 94 2.94 23 117NTPC-Jhanor 237 101 148 2.96 30 178NTPC-Sipat-I 540 3,759 488 1.19 448 937NTPC-Sipat - II 273 1,901 238 1.22 231 469NTPC-Kahlagaon 141 924 106 2.15 198 304NTPC-Vindhyachal - IV 240 1,573 254 1.61 253 507NTPC-Mauda 240 98 402 3.03 30 432NTPC-Vindhyachal - V 93 612 82 1.51 92 174SSNL 232 335 - 2.04 68 68NTPC-Mauda Stage II U#1 147 61 190 2.50 15 205NTPC-Lara U#1 140 982 207 1.50 147 354NTPC-Mauda Stage II U#2 147 61 190 2.50 15 205
NTPC-Gadarwara Stage-I U#1 110 772 110 1.50 116 226
NTPC-Gadarwara Stage-I U#2 110 772 110 1.50 116 226
NTPC-Lara U#2 140 982 69 1.50 147 216NPC Kakrapar Ext U#1 238 1,542 120 2.38 367 487NPC Kakrapar Ext U#2 238 1,285 100 2.38 306 406
NTPC-North Karanpura U#1 77 - - 1.50 - -
NTPC-North Karanpura U#2 77 - - 1.50 - -
NTPC-North Karanpura U#3 77 - - 1.50 - -
NTPC-Khargone U#1 110 - - 1.50 - -NTPC-Khargone U#2 110 - - 1.50 - -Sub Total 5,654 27,622 3,499 4,546 8,045
FY 2018-19
Source of Power (Station wise)
Uttar Gujarat Vij Company Limited Page 120

OthersCaptive Power 8 6 - 2.17 1 1RenewableWind Farms 2,508 4,280 - 3.55 1,521 1,521Solar 861 1,368 - 13.38 1,831 1,831Small/Mini Hydal 10 45 - 3.39 15 15Biomass 30 1 - 4.15 0 0Solar(New) - 2,477 - 4.50 1,115 1,115Wind (New) - 2,913 - 4.19 1,220 1,220Others (New) - 407 - 6.00 244 244Sub Total 3,417 11,496 - 5,947 5,947Total 25,929 91,972 13,043 19,477 32,520
FY 2019-20
Installed Capacity
(MW)
Utility share (%)
GUVNL share (MW)
Energy Received
(MU)
Total Annual Fixed
charges (Rs Crore)
Capacity Charges paid/
payable by Utility (Rs
Crore)
Variable Cost per
unit (Rs/kWh)
Total Variable
Charges (Rs Crore)
Any Other Charges (Please specify the type
of charges)
Total Cost of Energy
purchased (Rs Crore)
a b c d e f g h i j GSECLGSECL Gandhinagar - 5 210 84 133 3.19 27 159GSECL Wanakbori - 7 210 84 97 3.01 25 122GSECL Utran 135 - - 4.64 - -GSECL Utran Expan 375 32 257 3.95 13 269GSECL Dhuvaran - 7 107 45 51 2.67 12 63GSECL Dhuvaran - 8 112 48 53 3.31 16 69GSECL Ukai 850 243 221 2.92 71 292GSECL Ukai Expan 500 2,282 573 2.48 566 1,140GSECL Gandhinagar 1-4 420 166 159 3.77 62 222GSECL Wanakbori 1-6 1,260 502 392 3.37 169 562GSECL Sikka 240 - - 4.51 - -GSECL Sikka Expansion 500 3,189 343 2.36 753 1,096GSECL Kutch Lignite 215 1,243 231 1.32 164 395GSECL Kutch Lignite Exp unit 4
75 463 63 1.20 56 118
GSECL Ukai Hydro 305 478 24 - - 24GSECL Kadana Hydro 242 287 63 - - 63Dhuvaran CCPP III 376 32 204 4.88 16 220GSECL Wanakbori Ext U#8 800 330 905 2.94 97 1,002GSECL Dhuvaran STPS 1,600 - - 2.94 - -Sub Total 8,532 9,506 3,769 2,046 5,815
IPP'sCLP India Pvt Ltd 655 - - 3.20 - -Gujarat State Energy Generation
156 13 66 2.59 3 69
Gujarat State Energy Generation Expansion
351 31 188 4.29 13 201
Gujarat Industries Power Co Ltd (165 MW)
165 - - 3.33 - -
Gujarat Industries Power Co Ltd (SLPP)
250 1,433 124 1.54 221 345
Gujarat Mineral Development Corp.
250 1,577 144 0.93 146 290
Gujarat Industries Power Co Ltd (145 MW)
42 4 10 4.48 2 12
Gujarat Industries Power Co Ltd (SLPP - Exp)
250 1,265 270 1.70 215 486
GPPC Pipavav 702 60 386 5.49 33 419Adani Power Ltd 2,000 14,892 1,554 1.59 2,364 3,918Mundra UMPP CGPL 1,805 12,649 1,150 1.60 2,029 3,179Essar Power Bid 2 1,000 7,446 795 1.74 1,298 2,093ACB India Ltd 200 1,489 208 0.66 98 306BECL 500 3,084 879 2.15 663 1,541Sub Total 8,326 43,942 5,775 7,084 12,859
Central SectorNPC-Tarapur (1 & 2) 160 1,072 - 1.00 107 107NPC-Tarapur (3 & 4) 274 1,836 - 2.89 530 530NPC-Kakrapar 125 814 - 2.39 195 195NTPC-Vindhyachal - I 230 1,467 94 1.61 236 330NTPC-Vindhyachal - II 239 1,566 99 1.58 247 346NTPC-Vindhyachal - III 266 1,852 194 1.52 281 475NTPC-Korba 360 2,506 116 1.09 273 390NTPC-Korba -II 96 668 87 1.08 72 159NTPC-Kawas 187 79 94 2.94 23 117NTPC-Jhanor 237 101 148 2.96 30 178NTPC-Sipat-I 540 3,759 488 1.19 448 937NTPC-Sipat - II 273 1,901 238 1.22 231 469NTPC-Kahlagaon 141 924 106 2.15 198 304NTPC-Vindhyachal - IV 240 1,573 254 1.61 253 507
Source of Power (Station wise)
Uttar Gujarat Vij Company Limited Page 121
NTPC-Mauda 240 98 402 3.03 30 432NTPC-Vindhyachal - V 93 612 82 1.51 92 174SSNL 232 335 - 2.04 68 68NTPC-Mauda Stage II U#1 147 61 190 2.50 15 205NTPC-Lara U#1 140 982 207 1.50 147 354NTPC-Mauda Stage II U#2 147 61 190 2.50 15 205
NTPC-Gadarwara Stage-I U#1 110 772 110 1.50 116 226
NTPC-Gadarwara Stage-I U#2 110 772 110 1.50 116 226
NTPC-Lara U#2 140 982 69 1.50 147 216NPC Kakrapar Ext U#1 238 1,542 120 2.38 367 487NPC Kakrapar Ext U#2 238 1,542 120 2.38 367 487
NTPC-North Karanpura U#1 77 540 85 1.50 81 166
NTPC-North Karanpura U#2 77 270 43 1.50 41 83
NTPC-North Karanpura U#3 77 - - 1.50 - -
NTPC-Khargone U#1 110 515 73 1.50 77 151NTPC-Khargone U#2 110 193 28 1.50 29 56Sub Total 5,654 29,397 3,747 4,835 8,582
OthersCaptive Power 8 6 - 2.17 1 1RenewableWind Farms 2,508 4,280 - 3.55 1,521 1,521Solar 861 1,368 - 13.38 1,831 1,831Small/Mini Hydal 10 45 - 3.39 15 15Biomass 30 1 - 4.15 0 0Solar(New) - 3,853 - 4.50 1,734 1,734Wind (New) - 3,361 - 4.19 1,408 1,408Others (New) - 666 - 6.00 400 400Sub Total 3,417 13,580 - 6,910 6,910Total 25,929 96,425 13,291 20,876 34,167
Installed Capacity
(MW)
Utility share (%)
GUVNL share (MW)
Energy Received
(MU)
Total Annual Fixed
charges (Rs Crore)
Capacity Charges paid/
payable by Utility (Rs
Crore)
Variable Cost per
unit (Rs/kWh)
Total Variable
Charges (Rs Crore)
Any Other Charges (Please specify the type
of charges)
Total Cost of Energy
purchased (Rs Crore)
a b c d e f g h i j GSECLGSECL Gandhinagar - 5 210 84 133 3.19 27 159GSECL Wanakbori - 7 210 84 97 3.01 25 122GSECL Utran 135 - - 4.64 - -GSECL Utran Expan 375 32 257 3.95 13 269GSECL Dhuvaran - 7 107 45 51 2.67 12 63GSECL Dhuvaran - 8 112 48 53 3.31 16 69GSECL Ukai 850 243 221 2.92 71 292GSECL Ukai Expan 500 2,726 573 2.48 677 1,250GSECL Gandhinagar 1-4 420 166 159 3.77 62 222GSECL Wanakbori 1-6 1,260 502 392 3.37 169 562GSECL Sikka 240 - - 4.51 - -GSECL Sikka Expansion 500 3,189 343 2.36 753 1,096GSECL Kutch Lignite 215 1,243 231 1.32 164 395GSECL Kutch Lignite Exp unit 4
75 463 63 1.20 56 118
GSECL Ukai Hydro 305 478 24 - - 24GSECL Kadana Hydro 242 287 63 - - 63Dhuvaran CCPP III 376 32 204 4.88 16 220GSECL Wanakbori Ext U#8 800 330 905 2.94 97 1,002GSECL Dhuvaran STPS 1,600 660 1,284 2.94 194 1,478Sub Total 8,532 10,610 5,053 2,351 7,403
IPP'sCLP India Pvt Ltd 655 - - 3.20 - -Gujarat State Energy Generation
156 13 66 2.59 3 69
Gujarat State Energy Generation Expansion
351 31 188 4.29 13 201
Gujarat Industries Power Co Ltd (165 MW)
165 - - 3.33 - -
Gujarat Industries Power Co Ltd (SLPP)
250 1,433 124 1.54 221 345
Gujarat Mineral Development Corp.
250 1,577 144 0.93 146 290
Gujarat Industries Power Co Ltd (145 MW)
42 4 10 4.48 2 12
Gujarat Industries Power Co Ltd (SLPP - Exp)
250 1,265 270 1.70 215 486
GPPC Pipavav 702 60 386 5.49 33 419Adani Power Ltd 2,000 14,892 1,554 1.59 2,364 3,918Mundra UMPP CGPL 1,805 12,649 1,150 1.60 2,029 3,179Essar Power Bid 2 1,000 7,446 795 1.74 1,298 2,093ACB India Ltd 200 1,489 208 0.66 98 306BECL 500 3,084 879 2.15 663 1,541Sub Total 8,326 43,942 5,775 7,084 12,859
FY 2020-21
Source of Power (Station wise)
Uttar Gujarat Vij Company Limited Page 122
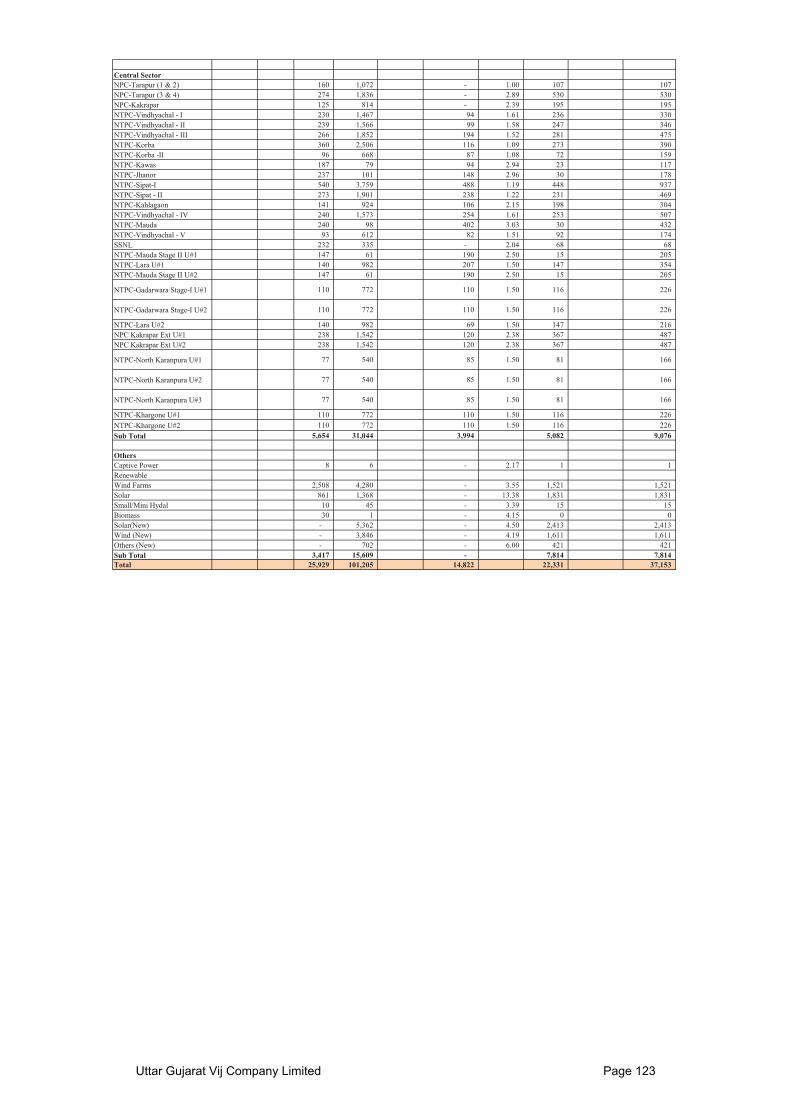
Central SectorNPC-Tarapur (1 & 2) 160 1,072 - 1.00 107 107NPC-Tarapur (3 & 4) 274 1,836 - 2.89 530 530NPC-Kakrapar 125 814 - 2.39 195 195NTPC-Vindhyachal - I 230 1,467 94 1.61 236 330NTPC-Vindhyachal - II 239 1,566 99 1.58 247 346NTPC-Vindhyachal - III 266 1,852 194 1.52 281 475NTPC-Korba 360 2,506 116 1.09 273 390NTPC-Korba -II 96 668 87 1.08 72 159NTPC-Kawas 187 79 94 2.94 23 117NTPC-Jhanor 237 101 148 2.96 30 178NTPC-Sipat-I 540 3,759 488 1.19 448 937NTPC-Sipat - II 273 1,901 238 1.22 231 469NTPC-Kahlagaon 141 924 106 2.15 198 304NTPC-Vindhyachal - IV 240 1,573 254 1.61 253 507NTPC-Mauda 240 98 402 3.03 30 432NTPC-Vindhyachal - V 93 612 82 1.51 92 174SSNL 232 335 - 2.04 68 68NTPC-Mauda Stage II U#1 147 61 190 2.50 15 205NTPC-Lara U#1 140 982 207 1.50 147 354NTPC-Mauda Stage II U#2 147 61 190 2.50 15 205
NTPC-Gadarwara Stage-I U#1 110 772 110 1.50 116 226
NTPC-Gadarwara Stage-I U#2 110 772 110 1.50 116 226
NTPC-Lara U#2 140 982 69 1.50 147 216NPC Kakrapar Ext U#1 238 1,542 120 2.38 367 487NPC Kakrapar Ext U#2 238 1,542 120 2.38 367 487
NTPC-North Karanpura U#1 77 540 85 1.50 81 166
NTPC-North Karanpura U#2 77 540 85 1.50 81 166
NTPC-North Karanpura U#3 77 540 85 1.50 81 166
NTPC-Khargone U#1 110 772 110 1.50 116 226NTPC-Khargone U#2 110 772 110 1.50 116 226Sub Total 5,654 31,044 3,994 5,082 9,076
OthersCaptive Power 8 6 - 2.17 1 1RenewableWind Farms 2,508 4,280 - 3.55 1,521 1,521Solar 861 1,368 - 13.38 1,831 1,831Small/Mini Hydal 10 45 - 3.39 15 15Biomass 30 1 - 4.15 0 0Solar(New) - 5,362 - 4.50 2,413 2,413Wind (New) - 3,846 - 4.19 1,611 1,611Others (New) - 702 - 6.00 421 421Sub Total 3,417 15,609 - 7,814 7,814Total 25,929 101,205 14,822 22,331 37,153
Uttar Gujarat Vij Company Limited Page 123

(Rs. Crore)
Tariff Order April-March (Audited ) Deviation FY 2016-17 FY 2017-18 FY 2018-19 FY 2019-20 FY 2020-21
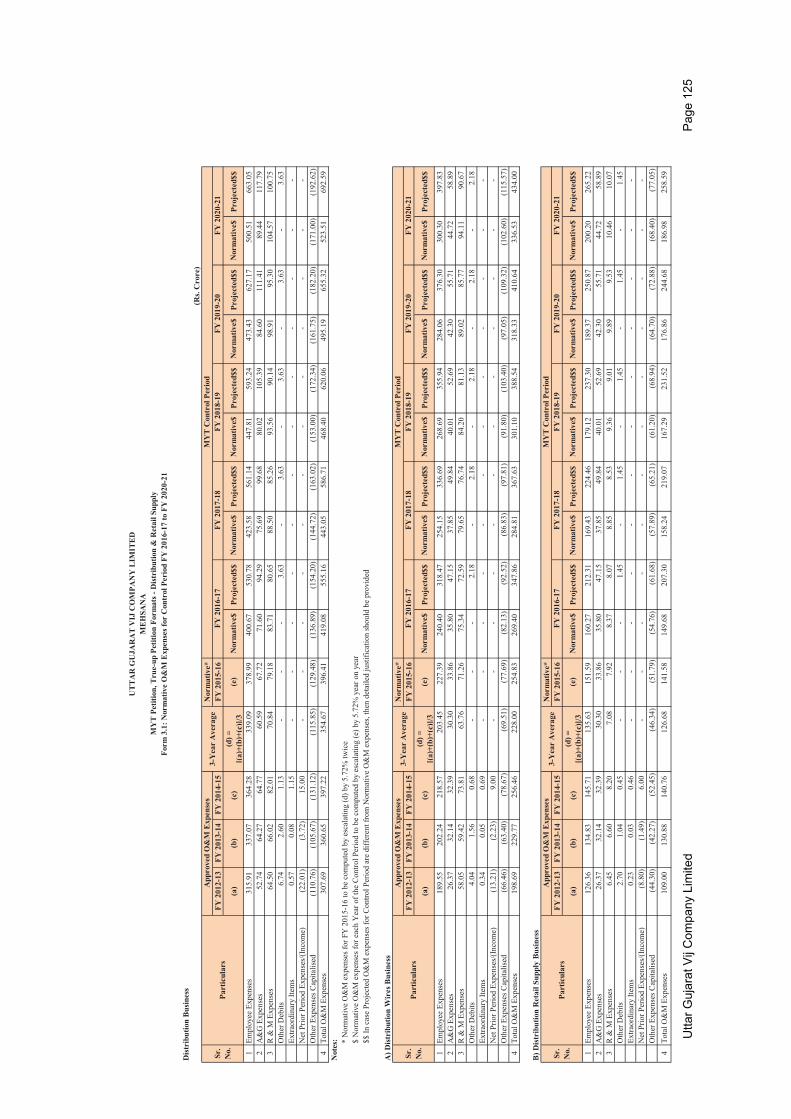
(a) (b) (c ) = (b) - (a) Projected Projected Projected Projected Projected1 O&M Expenses Form 3.1 519.12 581.11 61.99 709.35 749.72 792.40 837.52 885.21
1.1 Employee Expenses Form 3.2 373.28 433.82 60.54 530.78 561.14 593.24 627.17 663.051.2 R&M Expenses Form 3.4 76.21 59.72 (16.49) 94.29 99.68 105.39 111.41 117.791.3 A&G Expenses Form 3.5 62.32 69.53 7.21 80.65 85.26 90.14 95.30 100.75
Other Debits 6.74 3.63 (3.11) 3.63 3.63 3.63 3.63 3.63Extraordinary Items 0.57 14.75 14.18 - - - - -Net Prior Period Expenses/(Income) - (0.35) (0.35) - - - - -
2 O&M Expense capitalised (176.00) (112.18) 63.82 (154.20) (163.02) (172.34) (182.20) (192.62)
3 Total Operation & Maintenance Expenses (net of capitalisation) 343.12 468.93 126 555.16 586.71 620.06 655.32 692.59
UTTAR GUJARAT VIJ COMPANY LIMITEDMEHSANA
MYT Petition, True-up Petition Formats - Distribution & Retail SupplyForm 3: Operations and Maintenance Expenses Summary
Reference
True-Up Year (FY 2015-16) MYT Control Period
Sr. No.
Particulars
Uttar Gujarat Vij Company Limited Page 124
Dis
trib
utio
n B
usin
ess
(Rs.
Cro
re)
Nor
mat
ive*
FY 2
012-
13FY
201
3-14
FY 2
014-
15FY
201
5-16
(a)
(b)
(c)
(d) =
[(a)
+(b)
+(c)
]/3(e
)N
orm
ativ
e$Pr
ojec
ted$
$ N
orm
ativ
e$Pr
ojec
ted$
$ N
orm
ativ
e$Pr
ojec
ted$
$ N
orm
ativ
e$Pr
ojec
ted$
$ N
orm
ativ
e$Pr
ojec
ted$
$
1Em
ploy
ee E
xpen
ses
315.
9133
7.07
364.
2833
9.09
378.
9940
0.67
530.
7842
3.58
561.
1444
7.81
593.
2447
3.43
627.
1750
0.51
663.
052
A&
G E
xpen
ses
52.7
464
.27
64.7
760
.59
67.7
271
.60
94.2
975
.69
99.6
880
.02
105.
3984
.60
111.
4189
.44
117.
793
R &
M E
xpen
ses
64.5
066
.02
82.0
170
.84
79.1
883
.71
80.6
588
.50
85.2
693
.56
90.1
498
.91
95.3
010
4.57
100.
75O
ther
Deb
its6.
742.
601.
13-
--
3.63
-3.
63-
3.63
-3.
63-
3.63
Extra
ordi
nary
Item
s0.
570.
081.
15-
--
--
--
--
--
-N
et P
rior P
erio
d Ex
pens
es/(I
ncom
e)(2
2.01
)(3
.72)
15.0
0-
--
--
--
--
--
-O
ther
Exp
ense
s Cap
italis
ed(1
10.7
6)(1
05.6
7)(1
31.1
2)(1
15.8
5)(1
29.4
8)(1
36.8
9)(1
54.2
0)(1
44.7
2)(1
63.0
2)(1
53.0
0)(1
72.3
4)(1
61.7
5)(1
82.2
0)(1
71.0
0)(1
92.6
2)4
Tota
l O&
M E
xpen
ses
307.
6936
0.65
397.
2235
4.67
396.
4141
9.08
555.
1644
3.05
586.
7146
8.40
620.
0649
5.19
655.
3252
3.51
692.
59N
otes
: * N
orm
ativ
e O
&M
exp
ense
s for
FY
201
5-16
to b
e co
mpu
ted
by e
scal
atin
g (d
) by
5.72
% tw
ice
$ N
orm
ativ
e O
&M
exp
ense
s for
eac
h Y
ear o
f the
Con
trol P
erio
d to
be
com
pute
d by
esc
alat
ing
(e) b
y 5.
72%
yea
r on
year
$$ In
cas
e Pr
ojec
ted
O&
M e
xpen
ses f
or C
ontro
l Per
iod
are
diff
eren
t fro
m N
orm
ativ
e O
&M
exp
ense
s, th
en d
etai
led
just
ifica
tion
shou
ld b
e pr
ovid
ed
A) D
istr
ibut
ion
Wir
es B
usin
ess
Nor
mat
ive*
FY 2
012-
13FY
201
3-14
FY 2
014-
15FY
201
5-16
(a)
(b)
(c)
(d) =
[(a)
+(b)
+(c)
]/3(e
)N
orm
ativ
e$Pr
ojec
ted$
$ N
orm
ativ
e$Pr
ojec
ted$
$ N
orm
ativ
e$Pr
ojec
ted$
$ N
orm
ativ
e$Pr
ojec
ted$
$ N
orm
ativ
e$Pr
ojec
ted$
$
1Em
ploy
ee E
xpen
ses
189.
5520
2.24
218.
5720
3.45
227.
3924
0.40
318.
4725
4.15
336.
6926
8.69
355.
9428
4.06
376.
3030
0.30
397.
832
A&
G E
xpen
ses
26.3
732
.14
32.3
930
.30
33.8
635
.80
47.1
537
.85
49.8
440
.01
52.6
942
.30
55.7
144
.72
58.8
93
R &
M E
xpen
ses
58.0
559
.42
73.8
163
.76
71.2
675
.34
72.5
979
.65
76.7
484
.20
81.1
389
.02
85.7
794
.11
90.6
7O
ther
Deb
its4.
041.
560.
68-
--
2.18
-2.
18-
2.18
-2.
18-
2.18
Extra
ordi
nary
Item
s0.
340.
050.
69-
--
--
--
--
--
-N
et P
rior P
erio
d Ex
pens
es/(I
ncom
e)(1
3.21
)(2
.23)
9.00
--
--
--
--
--
--
Oth
er E
xpen
ses C
apita
lised
(66.
46)
(63.
40)
(78.
67)
(69.
51)
(77.
69)
(82.
13)
(92.
52)
(86.
83)
(97.
81)
(91.
80)
(103
.40)
(97.
05)
(109
.32)
(102
.60)
(115
.57)
4To
tal O
&M
Exp
ense
s19
8.69
229.
7725
6.46
228.
0025
4.83
269.
4034
7.86
284.
8136
7.63
301.
1038
8.54
318.
3341
0.64
336.
5343
4.00
B) D
istr
ibut
ion
Ret
ail S
uppl
y B
usin
ess
Nor
mat
ive*
FY 2
012-
13FY
201
3-14
FY 2
014-
15FY
201
5-16
(a)
(b)
(c)
(d) =
[(a)
+(b)
+(c)
]/3(e
)N
orm
ativ
e$Pr
ojec
ted$
$ N
orm
ativ
e$Pr
ojec
ted$
$ N
orm
ativ
e$Pr
ojec
ted$
$ N
orm
ativ
e$Pr
ojec
ted$
$ N
orm
ativ
e$Pr
ojec
ted$
$
1Em
ploy
ee E
xpen
ses
126.
3613
4.83
145.
7113
5.63
151.
5916
0.27
212.
3116
9.43
224.
4617
9.12
237.
3018
9.37
250.
8720
0.20
265.
222
A&
G E
xpen
ses
26.3
732
.14
32.3
930
.30
33.8
635
.80
47.1
537
.85
49.8
440
.01
52.6
942
.30
55.7
144
.72
58.8
93
R &
M E
xpen
ses
6.45
6.60
8.20
7.08
7.92
8.37
8.07
8.85
8.53
9.36
9.01
9.89
9.53
10.4
610
.07
Oth
er D
ebits
2.70
1.04
0.45
--
-1.
45-
1.45
-1.
45-
1.45
-1.
45Ex
traor
dina
ry It
ems
0.23
0.03
0.46
--
--
--
--
--
--
Net
Prio
r Per
iod
Expe
nses
/(Inc
ome)
(8.8
0)(1
.49)
6.00
--
--
--
--
--
--
Oth
er E
xpen
ses C
apita
lised
(44.
30)
(42.
27)
(52.
45)
(46.
34)
(51.
79)
(54.
76)
(61.
68)
(57.
89)
(65.
21)
(61.
20)
(68.
94)
(64.
70)
(72.
88)
(68.
40)
(77.
05)
4To
tal O
&M
Exp
ense
s10
9.00
130.
8814
0.76
126.
6814
1.58
149.
6820
7.30
158.
2421
9.07
167.
2923
1.52
176.
8624
4.68
186.
9825
8.59
FY 2
019-
203-
Yea
r A
vera
geFY
201
6-17
FY 2
020-
21M
YT
Con
trol
Per
iod
MY
T C
ontr
ol P
erio
dFY
202
0-21
FY 2
017-
18FY
201
8-19
FY 2
019-
20Sr
. N
o.Pa
rtic
ular
s
App
rove
d O
&M
Exp
ense
s3-
Yea
r A
vera
geFY
201
6-17
Sr.
No.
Part
icul
ars
App
rove
d O
&M
Exp
ense
sFY
201
7-18
FY 2
018-
19
UT
TA
R G
UJA
RA
T V
IJ C
OM
PAN
Y L
IMIT
ED
ME
HSA
NA
MY
T P
etiti
on, T
rue-
up P
etiti
on F
orm
ats -
Dist
ribu
tion
& R
etai
l Sup
ply
Form
3.1
: Nor
mat
ive
O&
M E
xpen
ses f
or C
ontr
ol P
erio
d FY
201
6-17
to F
Y 2
020-
21
3-Y
ear
Ave
rage
MY
T C
ontr
ol P
erio
dFY
201
6-17
FY 2
017-
18FY
201
8-19
FY 2
019-
20FY
202
0-21
Sr.
No.
Part
icul
ars
App
rove
d O
&M
Exp
ense
s
Utta
r Guj
arat
Vij
Com
pany
Lim
ited
Pag
e 12
5

(Rs. Crore)
Regulated Business Non-regulated Business Total (Audited)1 Basic Salary 148.162 Dearness Allowance (DA) 135.983 House Rent Allowance 12.404 Conveyance Allowance 0.185 Leave Travel Allowance 0.856 Earned Leave Encashment 2.437 Other Allowances 24.848 Medical Reimbursement 8.19 Overtime Payment 0.31
10 Bonus/Ex-Gratia Payments 1.4311 Interim Relief / Wage Revision 012 Staff welfare expenses 9.213 VRS Expenses/Retrenchment Compensation -14 Commission to Directors 015 Training Expenses 016 Payment under Workmen's Compensation Act 0.2717 Net Employee Costs 018 Terminal Benefits 89.67
18.1 Provident Fund Contribution 21.8318.2 Provision for PF Fund 018.3 Pension Payments 9.518.4 Gratuity Payment 30.6219 Others 27.7220 Gross Employee Expenses 433.8221 Less: Expenses Capitalised 97.3521 Net Employee Expenses 336.47
UTTAR GUJARAT VIJ COMPANY LIMITEDMEHSANA
MYT Petition, True-up Petition Formats - Distribution & Retail SupplyForm 3.2: Employee Expenses
Sr.No. Particulars
True-Up Year (FY 2015-16)April-March (Audited)
Uttar Gujarat Vij Company Limited Page 126

(Rs. Crore)
Regulated Business Non-regulated Business Total (Audited)
1 Rent Rates & Taxes 1.682 Insurance 0.343 Telephone & Postage, etc. 2.114 Legal charges & Audit fee (Break-up as per separate Table in Form 3.3.1) 0.615 Professional, Consultancy, Technical fee 1.186 Conveyance & Travel 26.767 Electricity charges 2.068 Water charges 0.639 Security arrangements 4.1510 Fees & subscription 1.0611 Books & periodicals 0.0312 Computer Stationery -13 Printing & Stationery 2.5814 Advertisements 0.3815 Purchase Related Advertisement Expenses -16 Contribution/Donations 017 License Fee and other related fee 3.6818 Vehicle Running Expenses Truck / Delivery Van 0.01419 Vehicle Hiring Expenses Truck / Delivery Van 13.6820 Cost of services procured -21 Outsourcing of metering and billing system 0.7422 Freight On Capital Equipments 0.03423 V-sat, Internet and related charges -24 Training 0.9925 Bank Charges 026 Miscellaneous Expenses 027 Office Expenses 028 Others 6.8229 Gross A&G Expenses 69.5330 Less: Expenses Capitalised 14.8331 Net A&G Expenses 54.70
UTTAR GUJARAT VIJ COMPANY LIMITEDMEHSANA
MYT Petition, True-up Petition Formats - Distribution & Retail SupplyForm 3.3: Administration & General Expenses
Sr. No. Particulars
True-Up Year (FY 2015-16)April-March (Audited)
Uttar Gujarat Vij Company Limited Page 127
(Rs. Crore)
True-Up Year (FY 2015-16)
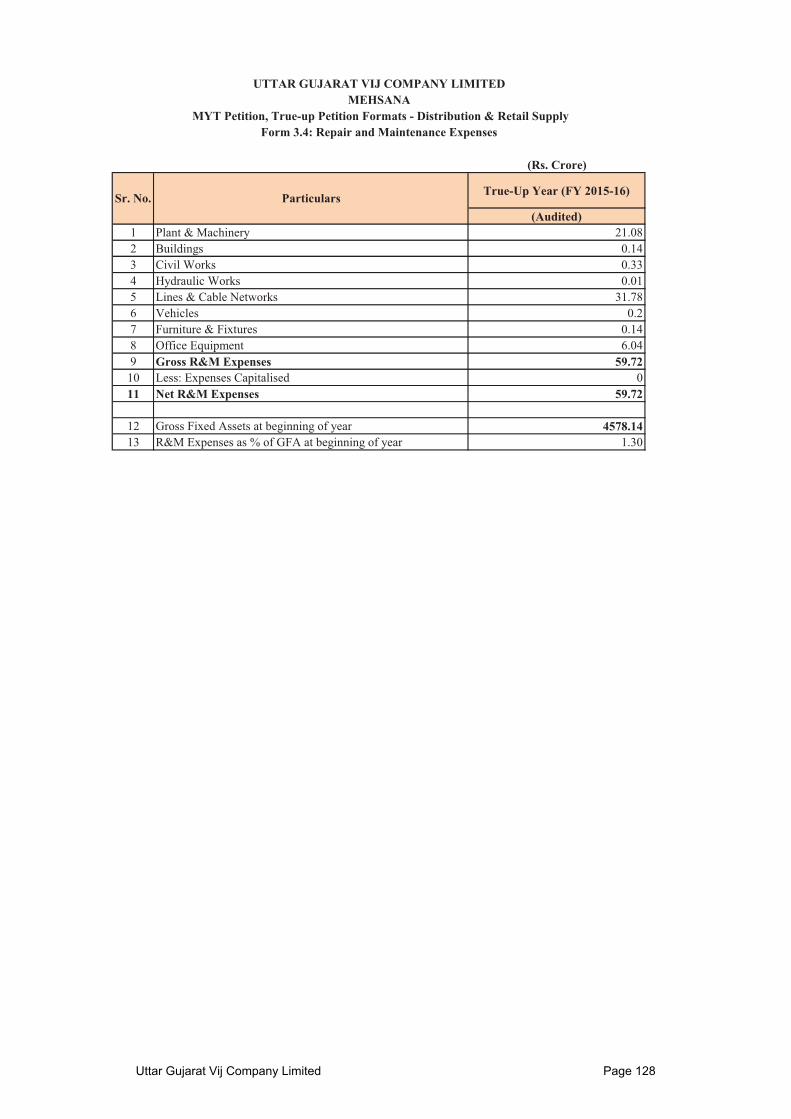
(Audited)1 Plant & Machinery 21.082 Buildings 0.143 Civil Works 0.334 Hydraulic Works 0.015 Lines & Cable Networks 31.786 Vehicles 0.27 Furniture & Fixtures 0.148 Office Equipment 6.049 Gross R&M Expenses 59.72
10 Less: Expenses Capitalised 011 Net R&M Expenses 59.72
12 Gross Fixed Assets at beginning of year 4578.1413 R&M Expenses as % of GFA at beginning of year 1.30
UTTAR GUJARAT VIJ COMPANY LIMITEDMEHSANA
MYT Petition, True-up Petition Formats - Distribution & Retail SupplyForm 3.4: Repair and Maintenance Expenses
Sr. No. Particulars
Uttar Gujarat Vij Company Limited Page 128
Distribution Business(Rs. Crore)
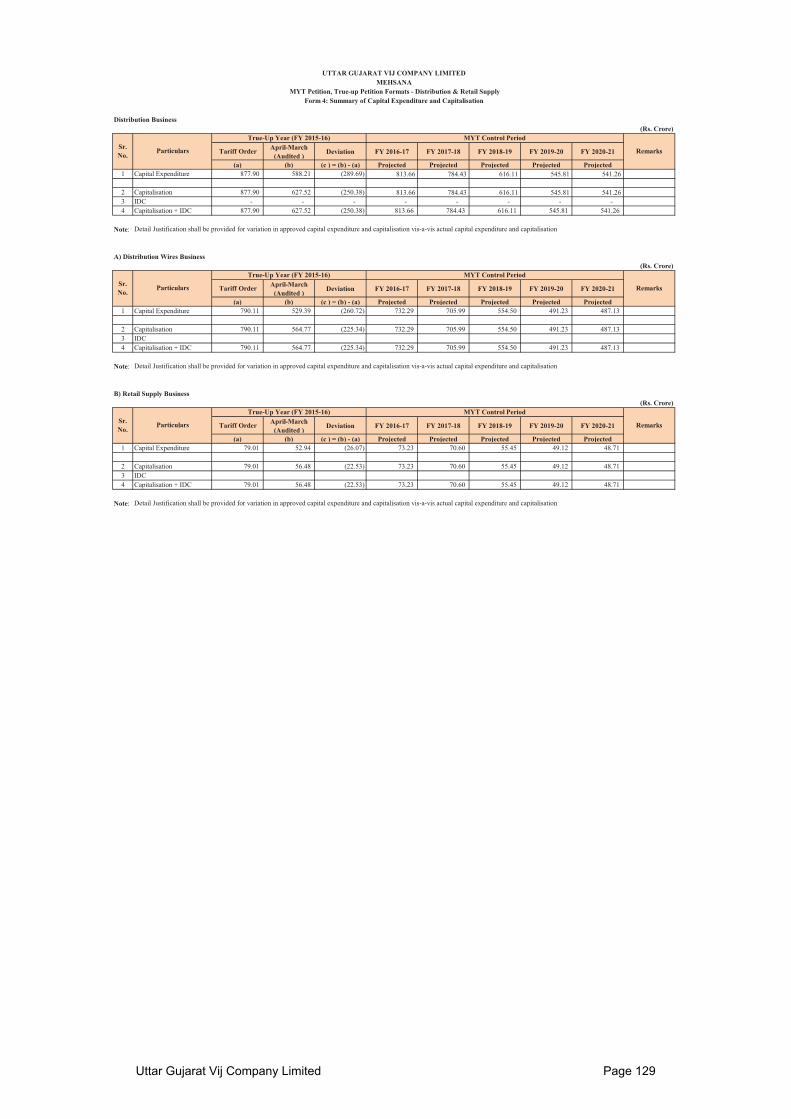
Tariff Order April-March (Audited ) Deviation FY 2016-17 FY 2017-18 FY 2018-19 FY 2019-20 FY 2020-21
(a) (b) (c ) = (b) - (a) Projected Projected Projected Projected Projected1 Capital Expenditure 877.90 588.21 (289.69) 813.66 784.43 616.11 545.81 541.26
2 Capitalisation 877.90 627.52 (250.38) 813.66 784.43 616.11 545.81 541.26 3 IDC - - - - - - - -4 Capitalisation + IDC 877.90 627.52 (250.38) 813.66 784.43 616.11 545.81 541.26
Note: *Detail Justification shall be provided for variation in approved capital expenditure and capitalisation vis-a-vis actual capital expenditure and capitalisation
A) Distribution Wires Business(Rs. Crore)
Tariff Order April-March (Audited ) Deviation FY 2016-17 FY 2017-18 FY 2018-19 FY 2019-20 FY 2020-21
(a) (b) (c ) = (b) - (a) Projected Projected Projected Projected Projected1 Capital Expenditure 790.11 529.39 (260.72) 732.29 705.99 554.50 491.23 487.13
2 Capitalisation 790.11 564.77 (225.34) 732.29 705.99 554.50 491.23 487.133 IDC4 Capitalisation + IDC 790.11 564.77 (225.34) 732.29 705.99 554.50 491.23 487.13
Note: *Detail Justification shall be provided for variation in approved capital expenditure and capitalisation vis-a-vis actual capital expenditure and capitalisation
B) Retail Supply Business(Rs. Crore)
Tariff Order April-March (Audited ) Deviation FY 2016-17 FY 2017-18 FY 2018-19 FY 2019-20 FY 2020-21
(a) (b) (c ) = (b) - (a) Projected Projected Projected Projected Projected1 Capital Expenditure 79.01 52.94 (26.07) 73.23 70.60 55.45 49.12 48.71
2 Capitalisation 79.01 56.48 (22.53) 73.23 70.60 55.45 49.12 48.713 IDC4 Capitalisation + IDC 79.01 56.48 (22.53) 73.23 70.60 55.45 49.12 48.71
Note: *Detail Justification shall be provided for variation in approved capital expenditure and capitalisation vis-a-vis actual capital expenditure and capitalisation
Remarks
Sr. No.
Particulars
True-Up Year (FY 2015-16)
Remarks
MYT Control Period
MYT Control Period
Sr. No.
Particulars
True-Up Year (FY 2015-16)
UTTAR GUJARAT VIJ COMPANY LIMITED
MYT Petition, True-up Petition Formats - Distribution & Retail SupplyForm 4: Summary of Capital Expenditure and Capitalisation
MEHSANA
Sr. No.
Particulars
True-Up Year (FY 2015-16) MYT Control Period
Remarks
Uttar Gujarat Vij Company Limited Page 129
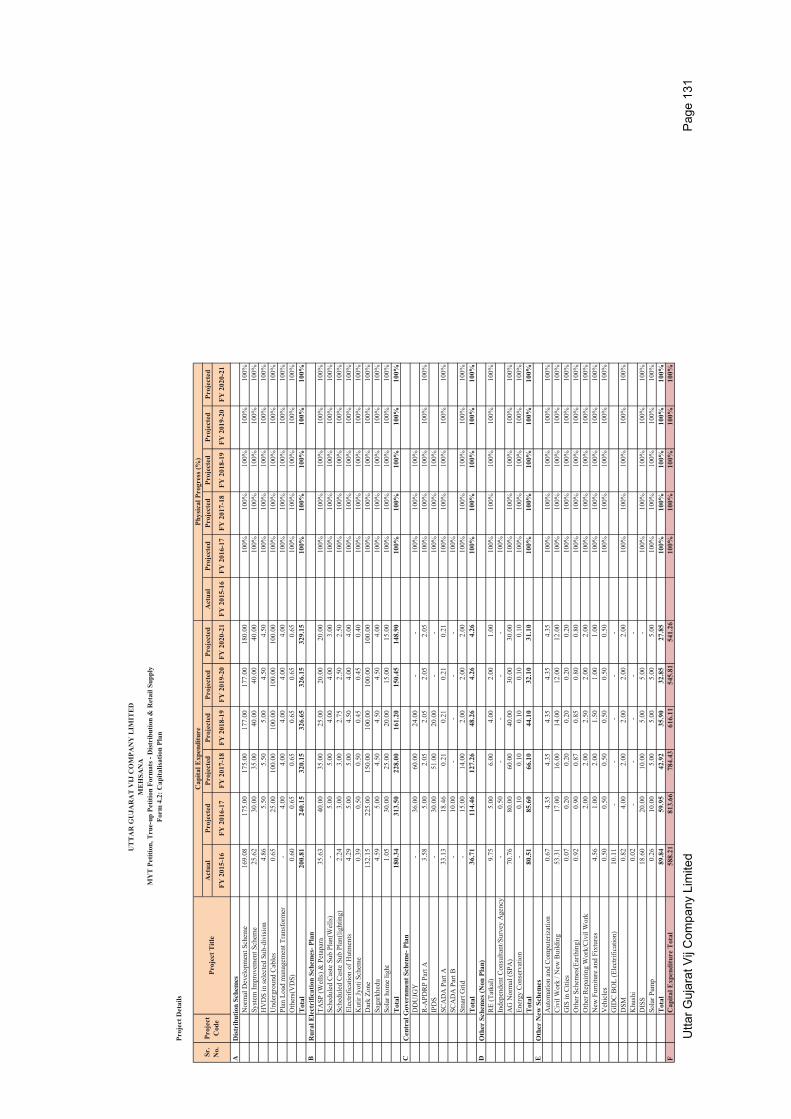
Project Details(Rs. Crore)
FY 2016-17 FY 2017-18 FY 2018-19 FY 2019-20 FY 2020-21Projected Projected Projected Projected Projected
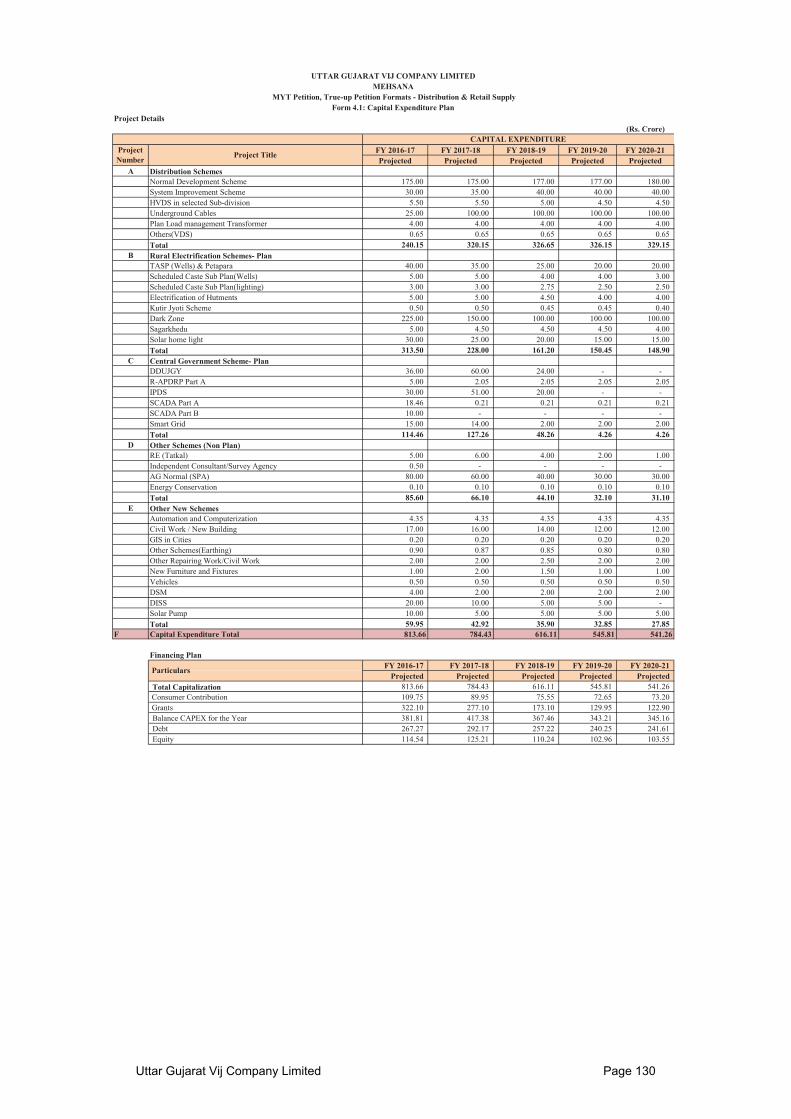
A Distribution SchemesNormal Development Scheme 175.00 175.00 177.00 177.00 180.00System Improvement Scheme 30.00 35.00 40.00 40.00 40.00HVDS in selected Sub-division 5.50 5.50 5.00 4.50 4.50Underground Cables 25.00 100.00 100.00 100.00 100.00Plan Load management Transformer 4.00 4.00 4.00 4.00 4.00Others(VDS) 0.65 0.65 0.65 0.65 0.65Total 240.15 320.15 326.65 326.15 329.15
B Rural Electrification Schemes- PlanTASP (Wells) & Petapara 40.00 35.00 25.00 20.00 20.00Scheduled Caste Sub Plan(Wells) 5.00 5.00 4.00 4.00 3.00Scheduled Caste Sub Plan(lighting) 3.00 3.00 2.75 2.50 2.50Electrification of Hutments 5.00 5.00 4.50 4.00 4.00Kutir Jyoti Scheme 0.50 0.50 0.45 0.45 0.40Dark Zone 225.00 150.00 100.00 100.00 100.00Sagarkhedu 5.00 4.50 4.50 4.50 4.00Solar home light 30.00 25.00 20.00 15.00 15.00Total 313.50 228.00 161.20 150.45 148.90
C Central Government Scheme- PlanDDUJGY 36.00 60.00 24.00 - -R-APDRP Part A 5.00 2.05 2.05 2.05 2.05IPDS 30.00 51.00 20.00 - -SCADA Part A 18.46 0.21 0.21 0.21 0.21SCADA Part B 10.00 - - - -Smart Grid 15.00 14.00 2.00 2.00 2.00Total 114.46 127.26 48.26 4.26 4.26
D Other Schemes (Non Plan)RE (Tatkal) 5.00 6.00 4.00 2.00 1.00Independent Consultant/Survey Agency 0.50 - - - -AG Normal (SPA) 80.00 60.00 40.00 30.00 30.00Energy Conservation 0.10 0.10 0.10 0.10 0.10Total 85.60 66.10 44.10 32.10 31.10
E Other New SchemesAutomation and Computerization 4.35 4.35 4.35 4.35 4.35Civil Work / New Building 17.00 16.00 14.00 12.00 12.00GIS in Cities 0.20 0.20 0.20 0.20 0.20Other Schemes(Earthing) 0.90 0.87 0.85 0.80 0.80Other Repairing Work/Civil Work 2.00 2.00 2.50 2.00 2.00New Furniture and Fixtures 1.00 2.00 1.50 1.00 1.00Vehicles 0.50 0.50 0.50 0.50 0.50DSM 4.00 2.00 2.00 2.00 2.00DISS 20.00 10.00 5.00 5.00 -Solar Pump 10.00 5.00 5.00 5.00 5.00Total 59.95 42.92 35.90 32.85 27.85
F Capital Expenditure Total 813.66 784.43 616.11 545.81 541.26
Financing PlanFY 2016-17 FY 2017-18 FY 2018-19 FY 2019-20 FY 2020-21
Projected Projected Projected Projected ProjectedTotal Capitalization 813.66 784.43 616.11 545.81 541.26
Consumer Contribution 109.75 89.95 75.55 72.65 73.20 Grants 322.10 277.10 173.10 129.95 122.90Balance CAPEX for the Year 381.81 417.38 367.46 343.21 345.16Debt 267.27 292.17 257.22 240.25 241.61Equity 114.54 125.21 110.24 102.96 103.55
Form 4.1: Capital Expenditure Plan MYT Petition, True-up Petition Formats - Distribution & Retail Supply
UTTAR GUJARAT VIJ COMPANY LIMITEDMEHSANA
CAPITAL EXPENDITUREProject Number Project Title
Particulars
Uttar Gujarat Vij Company Limited Page 130
Proj
ect D
etai
ls
Act
ual
Proj
ecte
dPr
ojec
ted
Proj
ecte
dPr
ojec
ted
Proj
ecte
dA
ctua
lPr
ojec
ted
Proj
ecte
dPr
ojec
ted
Proj
ecte
dPr
ojec
ted
FY 2
015-
16FY
201
6-17
FY 2
017-
18FY
201
8-19
FY 2
019-
20FY
202
0-21
FY 2
015-
16FY
201
6-17
FY 2
017-
18FY
201
8-19
FY 2
019-
20FY
202
0-21
AD
istr
ibut
ion
Sche
mes
Nor
mal
Dev
elop
men
t Sch
eme
169.
0817
5.00
175.
0017
7.00
177.
0018
0.00
100%
100%
100%
100%
100%
Syst
em Im
prov
emen
t Sch
eme
25.6
230
.00
35.0
040
.00
40.0
040
.00
100%
100%
100%
100%
100%
HV
DS
in se
lect
ed S
ub-d
ivis
ion
4.86
5.50
5.50
5.00
4.50
4.50
100%
100%
100%
100%
100%
Und
ergr
ound
Cab
les
0.65
25.0
010
0.00
100.
0010
0.00
100.
0010
0%10
0%10
0%10
0%10
0%Pl
an L
oad
man
agem
ent T
rans
form
er-
4.00
4.00
4.00
4.00
4.00
100%
100%
100%
100%
100%
Oth
ers(
VD
S)0.
600.
650.
650.
650.
650.
6510
0%10
0%10
0%10
0%10
0%T
otal
200.
8124
0.15
320.
1532
6.65
326.
1532
9.15
100%
100%
100%
100%
100%
BR
ural
Ele
ctri
ficat
ion
Sche
mes
- Pla
nTA
SP (W
ells
) & P
etap
ara
35
.63
40.0
035
.00
25.0
020
.00
20.0
010
0%10
0%10
0%10
0%10
0%Sc
hedu
led
Cas
te S
ub P
lan(
Wel
ls)
-5.
005.
004.
004.
003.
0010
0%10
0%10
0%10
0%10
0%Sc
hedu
led
Cas
te S
ub P
lan(
light
ing)
2.
243.
003.
002.
752.
502.
5010
0%10
0%10
0%10
0%10
0%El
ectri
ficat
ion
of H
utm
ents
4.
295.
005.
004.
504.
004.
0010
0%10
0%10
0%10
0%10
0%K
utir
Jyot
i Sch
eme
0.
390.
500.
500.
450.
450.
4010
0%10
0%10
0%10
0%10
0%D
ark
Zone
13
2.15
225.
0015
0.00
100.
0010
0.00
100.
0010
0%10
0%10
0%10
0%10
0%Sa
gark
hedu
4.
595.
004.
504.
504.
504.
0010
0%10
0%10
0%10
0%10
0%So
lar h
ome
light
1.05
30.0
025
.00
20.0
015
.00
15.0
010
0%10
0%10
0%10
0%10
0%T
otal
180.
3431
3.50
228.
0016
1.20
150.
4514
8.90
100%
100%
100%
100%
100%
CC
entr
al G
over
nmen
t Sch
eme-
Pla
nD
DU
JGY
-36
.00
60.0
024
.00
--
100%
100%
100%
R-A
PDR
P Pa
rt A
3.
585.
002.
052.
052.
052.
0510
0%10
0%10
0%10
0%10
0%IP
DS
-30
.00
51.0
020
.00
--
100%
100%
100%
SCA
DA
Par
t A33
.13
18.4
60.
210.
210.
210.
2110
0%10
0%10
0%10
0%10
0%SC
AD
A P
art B
-10
.00
--
--
100%
Smar
t Grid
-15
.00
14.0
02.
002.
002.
0010
0%10
0%10
0%10
0%10
0%T
otal
36.7
111
4.46
127.
2648
.26
4.26
4.26
100%
100%
100%
100%
100%
DO
ther
Sch
emes
(Non
Pla
n)R
E (T
atka
l)9.
755.
006.
004.
002.
001.
0010
0%10
0%10
0%10
0%10
0%In
depe
nden
t Con
sulta
nt/S
urve
y A
genc
y-
0.50
--
--
100%
AG
Nor
mal
(SPA
) 70
.76
80.0
060
.00
40.0
030
.00
30.0
010
0%10
0%10
0%10
0%10
0%En
ergy
Con
serv
atio
n
-0.
100.
100.
100.
100.
1010
0%10
0%10
0%10
0%10
0%T
otal
80.5
185
.60
66.1
044
.10
32.1
031
.10
100%
100%
100%
100%
100%
EO
ther
New
Sch
emes
Aut
omat
ion
and
Com
pute
rizat
ion
0.67
4.35
4.35
4.35
4.35
4.35
100%
100%
100%
100%
100%
Civ
il W
ork
/ New
Bui
ldin
g53
.31
17.0
016
.00
14.0
012
.00
12.0
010
0%10
0%10
0%10
0%10
0%G
IS in
Citi
es0.
070.
200.
200.
200.
200.
2010
0%10
0%10
0%10
0%10
0%O
ther
Sch
emes
(Ear
thin
g)0.
920.
900.
870.
850.
800.
8010
0%10
0%10
0%10
0%10
0%O
ther
Rep
airin
g W
ork/
Civ
il W
ork
2.00
2.00
2.50
2.00
2.00
100%
100%
100%
100%
100%
New
Fur
nitu
re a
nd F
ixtu
res
4.56
1.00
2.00
1.50
1.00
1.00
100%
100%
100%
100%
100%
Veh
icle
s0.
500.
500.
500.
500.
500.
5010
0%10
0%10
0%10
0%10
0%G
IDC
BO
L (E
lect
rific
atio
n)10
.11
--
--
-D
SM0.
824.
002.
002.
002.
002.
0010
0%10
0%10
0%10
0%10
0%K
hush
i0.
02-
--
--
DIS
S18
.60
20.0
010
.00
5.00
5.00
-10
0%10
0%10
0%10
0%10
0%So
lar P
ump
0.26
10.0
05.
005.
005.
005.
0010
0%10
0%10
0%10
0%10
0%T
otal
89.8
459
.95
42.9
235
.90
32.8
527
.85
100%
100%
100%
100%
100%
FC
apita
l Exp
endi
ture
Tot
al58
8.21
813.
6678
4.43
616.
1154
5.81
541.
2610
0%10
0%10
0%10
0%10
0%
MY
T P
etiti
on, T
rue-
up P
etiti
on F
orm
ats -
Dis
trib
utio
n &
Ret
ail S
uppl
y
UT
TA
R G
UJA
RA
T V
IJ C
OM
PAN
Y L
IMIT
ED
ME
HSA
NA
Cap
ital E
xpen
ditu
rePh
ysic
al P
rogr
ess (
%)
Sr.
No.
Proj
ect
Cod
ePr
ojec
t Titl
e
Form
4.2
: Cap
italis
atio
n Pl
an
Utta
r Guj
arat
Vij
Com
pany
Lim
ited
Pag
e 13
1

Proj
ect D
etai
ls(R
s. C
rore
)
Act
ual
Est
imat
edPr
ojec
ted
Proj
ecte
dPr
ojec
ted
Proj
ecte
d
FY 2
015-
16FY
201
6-17
FY 2
017-
18FY
201
8-19
FY 2
019-
20FY
202
0-21
AD
istr
ibut
ion
Sche
mes
Nor
mal
Dev
elop
men
t Sch
eme
175.
0017
5.00
177.
0017
7.00
180.
00Sy
stem
Impr
ovem
ent S
chem
e30
.00
35.0
040
.00
40.0
040
.00
HV
DS
in se
lect
ed S
ub-d
ivis
ion
5.50
5.50
5.00
4.50
4.50
Und
ergr
ound
Cab
les
25.0
010
0.00
100.
0010
0.00
100.
00Pl
an L
oad
man
agem
ent T
rans
form
er4.
004.
004.
004.
004.
00O
ther
s(V
DS)
0.65
0.65
0.65
0.65
0.65
Tot
al24
0.15
320.
1532
6.65
326.
1532
9.15
BR
ural
Ele
ctri
ficat
ion
Sche
mes
- Pla
nTA
SP (W
ells
) & P
etap
ara
40
.00
35.0
025
.00
20.0
020
.00
Sche
dule
d C
aste
Sub
Pla
n(W
ells
)5.
005.
004.
004.
003.
00Sc
hedu
led
Cas
te S
ub P
lan(
light
ing)
3.
003.
002.
752.
502.
50El
ectri
ficat
ion
of H
utm
ents
5.
005.
004.
504.
004.
00K
utir
Jyot
i Sch
eme
0.
500.
500.
450.
450.
40D
ark
Zone
22
5.00
150.
0010
0.00
100.
0010
0.00
Saga
rkhe
du
5.00
4.50
4.50
4.50
4.00
Sola
r hom
e lig
ht30
.00
25.0
020
.00
15.0
015
.00
Tot
al31
3.50
228.
0016
1.20
150.
4514
8.90
CC
entr
al G
over
nmen
t Sch
eme-
Pla
nD
DU
JGY
36.0
060
.00
24.0
0-
-R
-APD
RP
Part
A
5.00
2.05
2.05
2.05
2.05
IPD
S30
.00
51.0
020
.00
--
SCA
DA
Par
t A18
.46
0.21
0.21
0.21
0.21
SCA
DA
Par
t B10
.00
--
--
Smar
t Grid
15.0
014
.00
2.00
2.00
2.00
Tot
al11
4.46
127.
2648
.26
4.26
4.26
DO
ther
Sch
emes
(Non
Pla
n)R
E (T
atka
l)5.
006.
004.
002.
001.
00In
depe
nden
t Con
sulta
nt/S
urve
y A
genc
y0.
50-
--
-A
G N
orm
al (S
PA)
80.0
060
.00
40.0
030
.00
30.0
0En
ergy
Con
serv
atio
n
0.10
0.10
0.10
0.10
0.10
Tot
al85
.60
66.1
044
.10
32.1
031
.10
EO
ther
New
Sch
emes
Aut
omat
ion
and
Com
pute
rizat
ion
4.35
4.35
4.35
4.35
4.35
Civ
il W
ork
/ New
Bui
ldin
g17
.00
16.0
014
.00
12.0
012
.00
GIS
in C
ities
0.20
0.20
0.20
0.20
0.20
Oth
er S
chem
es(E
arth
ing)
0.90
0.87
0.85
0.80
0.80
Oth
er R
epai
ring
Wor
k/C
ivil
Wor
k 2.
002.
002.
502.
002.
00N
ew F
urni
ture
and
Fix
ture
s1.
002.
001.
501.
001.
00V
ehic
les
0.50
0.50
0.50
0.50
0.50
GID
C B
OL
(Ele
ctrif
icat
ion)
DSM
4.00
2.00
2.00
2.00
2.00
Khu
shi
DIS
S20
.00
10.0
05.
005.
00-
Sola
r Pum
p10
.00
5.00
5.00
5.00
5.00
Tot
al59
.95
42.9
235
.90
32.8
527
.85
FC
apita
l Exp
endi
ture
Tot
al81
3.66
784.
4361
6.11
545.
8154
1.26
Cap
italis
atio
nSr
. N
o.Pr
ojec
t C
ode
Proj
ect T
itle
Utta
r Guj
arat
Vij
Com
pany
Lim
ited
Pag
e 13
2

UTTAR GUJARAT VIJ COMPANY LIMITEDMEHSANA
MYT Petition, True-up Petition Formats - Distribution & Retail SupplyForm 5: Assets & Depreciation
Distribution Business
Fixed Assets and Depreciation For True Up year and each Year of MYT Control Period
As at the beginning of the Financial Year
Additions Deductions As at the end of the Financial Year
As at the beginning of the Financial
Year
Additions DeductionsAs at the end of
the Financial Year
As at the beginning of the Financial Year
As at the end of the Financial
Year
Land 36.24 51.11 1.91 85.44 - 0.00 - 36.24 85.44Buildings 44.46 7.32 0.14 51.64 6.01 1.61 0.09 7.54 38.45 44.10Hydraulic works 0.66 0.02 0.00 0.67 0.41 0.03 - 0.45 0.24 0.22Other Civil Works 6.66 82.53 0.12 89.07 0.98 1.39 0.00 2.37 5.68 86.69Plant & Machinery 1,286.58 167.05 26.89 1,426.74 384.98 70.10 11.40 443.68 901.60 983.06Lines & Cables 3,159.63 362.55 17.67 3,504.51 1,060.04 172.03 1.48 1,230.59 2,099.59 2,273.92Vehicles 4.23 0.93 0.82 4.34 2.34 0.29 0.48 2.15 1.89 2.20Furniture & Fixtures 8.33 3.51 0.27 11.57 3.13 0.67 0.12 3.68 5.20 7.88Office Equipments 31.35 6.06 5.72 31.68 17.52 3.59 5.09 16.02 13.83 15.66Assets taken over from licensees pending final valuation
- - - - - - - - - -
Computer Software - - - - - - - - - -Capital Expenditure on Assets not belonging to utilitySpare UnitsCapital Spares
TOTAL 4,578.14 681.07 53.55 5,205.67 1,475.41 249.73 18.65 1,706.48 3,102.74 3,499.18
Total as per Audited Account (for True up year only) 4,578.14 681.07 53.55 5,205.67 1,475.41 249.73 18.65 1,706.48 3,102.74 3,499.18
* The particular of asset and rate of depreciation should match with those provided in the applicable Tariff Regulations
Distribution Wire Business
As at the beginning of the Financial Year
Additions Deductions As at the end of the Financial Year
As at the beginning of the Financial
Year
Additions DeductionsAs at the end of
the Financial Year
As at the beginning of the Financial Year
As at the end of the Financial
Year
LandBuildingsHydraulic worksOther Civil WorksPlant & MachineryLines & CablesVehiclesFurniture & FixturesOffice EquipmentsAssets taken over from licensees pending final valuationComputer SoftwareCapital Expenditure on Assets not belonging to utilitySpare UnitsCapital Spares
TOTAL 1,327.87 224.76 16.79 1,535.84
Distribution Retail Supply Business
As at the beginning of the Financial Year
Additions Deductions As at the end of the Financial Year
As at the beginning of the Financial
Year
Additions DeductionsAs at the end of
the Financial Year
As at the beginning of the Financial Year
As at the end of the Financial
Year
LandBuildingsHydraulic worksOther Civil WorksPlant & MachineryLines & CablesVehiclesFurniture & FixturesOffice EquipmentsCapital Expenditure on Assets not belonging to utilitySpare UnitsCapital Spares
TOTAL 147.54 24.97 1.87 170.65
* The particular of asset and rate of depreciation should match with those provided in the applicable Tariff Regulations
Particulars *
Gross Block- FY 2015-16 Depreciation- FY 2015-16 Applicable rate of
Depreciation (%) *
Net Block- FY 2015-16
Particulars *
Gross Block- FY 2015-16 Depreciation- FY 2015-16 Applicable rate of
Depreciation (%) *
Net Block- FY 2015-16
Particulars *
Gross Block- FY 2015-16 Depreciation- FY 2015-16 Applicable rate of
Depreciation (%) *
Net Block- FY 2015-16
Uttar Gujarat Vij Company Limited Page 133

As at the beginning of the Financial Year
Additions Deductions As at the end of the Financial Year
As at the beginning of the Financial
Year
Additions DeductionsAs at the end of
the Financial Year
As at the beginning of the Financial Year
As at the end of the Financial
Year
Land 85.44 28.97 - 114.41 - - - - 0.00% 85.44 114.41Buildings 51.64 2.12 - 53.76 7.54 1.76 - 9.30 3.34% 44.10 44.46Hydraulic works 0.67 0.05 - 0.72 0.45 0.04 - 0.49 5.28% 0.22 0.24Other Civil Works 89.07 1.89 - 90.96 2.37 3.01 - 5.38 3.34% 86.69 85.58Plant & Machinery 1,426.74 408.61 - 1,835.35 443.68 86.12 - 529.80 5.28% 983.06 1,305.55Lines & Cables 3,504.51 268.50 - 3,773.01 1,230.59 192.13 - 1,422.72 5.28% 2,273.92 2,350.29Vehicles 4.34 12.45 - 16.79 2.15 1.00 - 3.15 9.50% 2.20 13.64Furniture & Fixtures 11.57 4.16 - 15.72 3.68 0.86 - 4.55 6.33% 7.88 11.18Office Equipments 31.68 86.92 - 118.60 16.02 4.76 - 20.78 6.33% 15.66 97.82Assets taken over from licensees pending final valuation
- - - - - - - - 0.00% - -
Computer Software - - - - - - 30.00% - -Capital Expenditure on Assets not belonging to utilitySpare UnitsCapital Spares
TOTAL 5,205.67 813.66 - 6,019.33 1,706.48 289.67 - 1,996.16 0.75 3,499.18 4,023.17
Distribution Wire Business
As at the beginning of the Financial Year
Additions Deductions As at the end of the Financial Year
As at the beginning of the Financial
Year
Additions DeductionsAs at the end of
the Financial Year
As at the beginning of the Financial Year
As at the end of the Financial
Year
LandBuildingsHydraulic worksOther Civil WorksPlant & MachineryLines & CablesVehiclesFurniture & FixturesOffice EquipmentsAssets taken over from licensees pending final valuationComputer SoftwareCapital Expenditure on Assets not belonging to utilitySpare UnitsCapital Spares
TOTAL 1,535.84 260.71 1,796.54
Distribution Retail Supply Business
As at the beginning of the Financial Year
Additions Deductions As at the end of the Financial Year
As at the beginning of the Financial
Year
Additions DeductionsAs at the end of
the Financial Year
As at the beginning of the Financial Year
As at the end of the Financial
Year
LandBuildingsHydraulic worksOther Civil WorksPlant & MachineryLines & CablesVehiclesFurniture & FixturesOffice EquipmentsCapital Expenditure on Assets not belonging to utilitySpare UnitsCapital Spares
TOTAL 170.65 28.97 199.62
* The particular of asset and rate of depreciation should match with those provided in the applicable Tariff Regulations
Particulars *
Particulars *
Depreciation- FY 2016-17 Applicable rate of
Depreciation (%) *
Net Block- FY 2016-17Gross Block- FY 2016-17
Gross Block- FY 2016-17 Depreciation- FY 2016-17 Applicable rate of
Depreciation (%) *
Net Block- FY 2016-17
Gross Block- FY 2016-17 Depreciation- FY 2016-17 Applicable rate of
Depreciation (%) *
Net Block- FY 2016-17
Particulars *
Uttar Gujarat Vij Company Limited Page 134

As at the beginning of the Financial Year
Additions Deductions As at the end of the Financial Year
As at the beginning of the Financial
Year
Additions DeductionsAs at the end of
the Financial Year
As at the beginning of the Financial Year
As at the end of the Financial
Year
Land 114.41 27.93 142.34 - - - 0.00% 114.41 142.34Buildings 53.76 2.04 55.80 9.30 1.83 11.13 3.34% 44.46 44.67Hydraulic works 0.72 0.05 0.77 0.49 0.04 0.53 5.28% 0.24 0.24Other Civil Works 90.96 1.82 92.78 5.38 3.07 8.45 3.34% 85.58 84.33Plant & Machinery 1,835.35 393.93 2,229.28 529.80 107.31 637.10 5.28% 1,305.55 1,592.17Lines & Cables 3,773.01 258.85 4,031.86 1,422.72 206.05 1,628.76 5.28% 2,350.29 2,403.09Vehicles 16.79 12.00 28.80 3.15 2.17 5.32 9.50% 13.64 23.48Furniture & Fixtures 15.72 4.01 19.73 4.55 1.12 5.67 6.33% 11.18 14.06Office Equipments 118.60 83.80 202.40 20.78 10.16 30.94 6.33% 97.82 171.46Assets taken over from licensees pending final valuation
- - - - - - 0.00% - -
Computer Software - - - - - - 30.00% - -Capital Expenditure on Assets not belonging to utilitySpare UnitsCapital Spares
TOTAL 6,019.33 784.43 - 6,803.76 1,996.16 331.74 - 2,327.90 4,023.17 4,475.86
Distribution Wire Business
As at the beginning of the Financial Year
Additions Deductions As at the end of the Financial Year
As at the beginning of the Financial
Year
Additions DeductionsAs at the end of
the Financial Year
As at the beginning of the Financial Year
As at the end of the Financial
Year
LandBuildingsHydraulic worksOther Civil WorksPlant & MachineryLines & CablesVehiclesFurniture & FixturesOffice EquipmentsAssets taken over from licensees pending final valuationComputer SoftwareCapital Expenditure on Assets not belonging to utilitySpare UnitsCapital Spares
TOTAL 1,796.54 298.57 2,095.11
Distribution Retail Supply Business
As at the beginning of the Financial Year
Additions Deductions As at the end of the Financial Year
As at the beginning of the Financial
Year
Additions DeductionsAs at the end of
the Financial Year
As at the beginning of the Financial Year
As at the end of the Financial
Year
LandBuildingsHydraulic worksOther Civil WorksPlant & MachineryLines & CablesVehiclesFurniture & FixturesOffice EquipmentsCapital Expenditure on Assets not belonging to utilitySpare UnitsCapital Spares
TOTAL 199.62 33.17 232.79
* The particular of asset and rate of depreciation should match with those provided in the applicable Tariff Regulations
Particulars *
Particulars *
Particulars *
Gross Block- FY 2017-18 Depreciation- FY 2017-18 Applicable rate of
Depreciation (%) *
Net Block- FY 2017-18
Gross Block- FY 2017-18 Depreciation- FY 2017-18 Applicable rate of
Depreciation (%) *
Net Block- FY 2017-18
Net Block- FY 2017-18Applicable rate of
Depreciation (%) *
Gross Block- FY 2017-18 Depreciation- FY 2017-18
Uttar Gujarat Vij Company Limited Page 135

As at the beginning of the Financial Year
Additions Deductions As at the end of the Financial Year
As at the beginning of the Financial
Year
Additions DeductionsAs at the end of
the Financial Year
As at the beginning of the Financial Year
As at the end of the Financial
Year
Land 142.34 21.94 164.28 - - - 0.00% 142.34 164.28Buildings 55.80 1.60 57.40 11.13 1.89 13.02 3.34% 44.67 44.38Hydraulic works 0.77 0.04 0.81 0.53 0.04 0.57 5.28% 0.24 0.24Other Civil Works 92.78 1.43 94.21 8.45 3.12 11.57 3.34% 84.33 82.64Plant & Machinery 2,229.28 309.40 2,538.68 637.10 125.87 762.98 5.28% 1,592.17 1,775.70Lines & Cables 4,031.86 203.31 4,235.17 1,628.76 218.25 1,847.01 5.28% 2,403.09 2,388.15Vehicles 28.80 9.43 38.23 5.32 3.18 8.50 9.50% 23.48 29.72Furniture & Fixtures 19.73 3.15 22.88 5.67 1.35 7.02 6.33% 14.06 15.86Office Equipments 202.40 65.82 268.22 30.94 14.89 45.83 6.33% 171.46 222.38Assets taken over from licensees pending final valuation
- - - - - - 0.00% - -
Computer Software - - - - - - 30.00% - -Capital Expenditure on Assets not belonging to utilitySpare UnitsCapital Spares
TOTAL 6,803.76 616.11 - 7,419.87 2,327.90 368.61 - 2,696.50 4,475.86 4,723.36
Distribution Wire Business
As at the beginning of the Financial Year
Additions Deductions As at the end of the Financial Year
As at the beginning of the Financial
Year
Additions DeductionsAs at the end of
the Financial Year
As at the beginning of the Financial Year
As at the end of the Financial
Year
LandBuildingsHydraulic worksOther Civil WorksPlant & MachineryLines & CablesVehiclesFurniture & FixturesOffice EquipmentsAssets taken over from licensees pending final valuationComputer SoftwareCapital Expenditure on Assets not belonging to utilitySpare UnitsCapital Spares
TOTAL 2,095.11 331.74 2,426.85
Distribution Retail Supply Business
As at the beginning of the Financial Year
Additions Deductions As at the end of the Financial Year
As at the beginning of the Financial
Year
Additions DeductionsAs at the end of
the Financial Year
As at the beginning of the Financial Year
As at the end of the Financial
Year
LandBuildingsHydraulic worksOther Civil WorksPlant & MachineryLines & CablesVehiclesFurniture & FixturesOffice EquipmentsCapital Expenditure on Assets not belonging to utilitySpare UnitsCapital Spares
TOTAL 232.79 36.86 269.65
* The particular of asset and rate of depreciation should match with those provided in the applicable Tariff Regulations
Gross Block- FY 2018-19 Depreciation- FY 2018-19 Applicable rate of
Depreciation (%) *
Net Block- FY 2018-19
Particulars *
Depreciation- FY 2018-19 Applicable rate of
Depreciation (%) *
Net Block- FY 2018-19Gross Block- FY 2018-19
Particulars *
Gross Block- FY 2018-19 Depreciation- FY 2018-19 Applicable rate of
Depreciation (%) *
Net Block- FY 2018-19
Particulars *
Uttar Gujarat Vij Company Limited Page 136
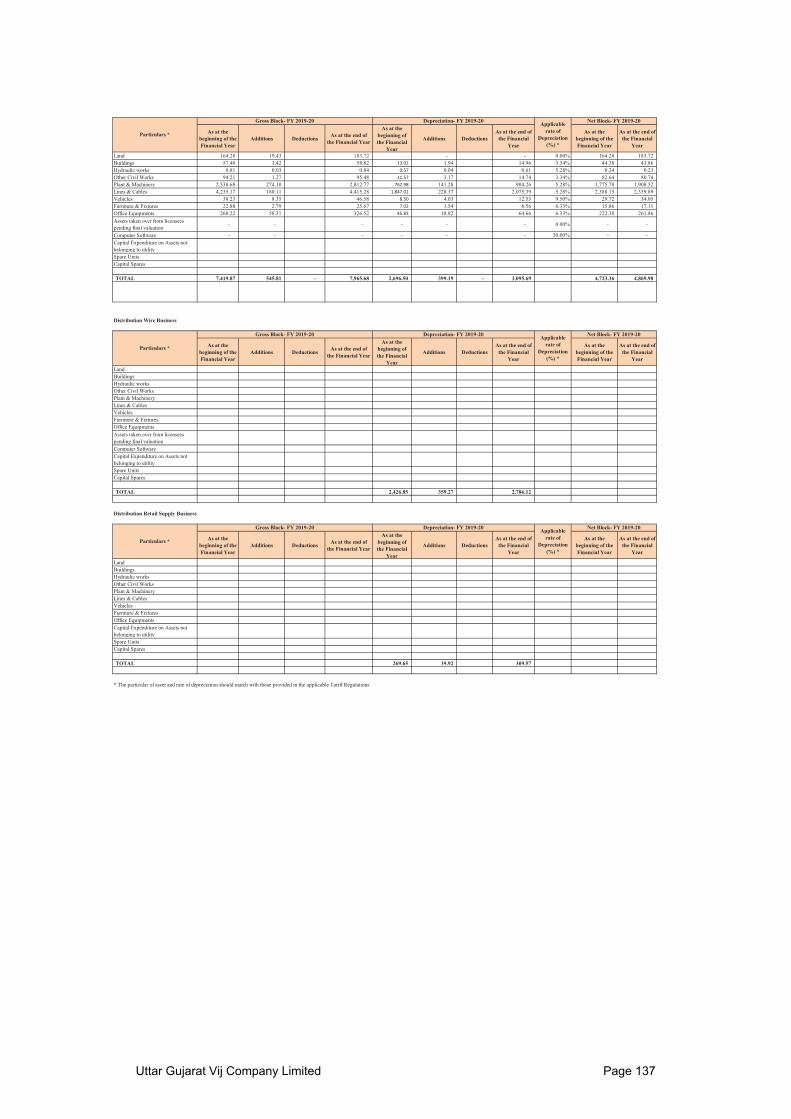
As at the beginning of the Financial Year
Additions Deductions As at the end of the Financial Year
As at the beginning of the Financial
Year
Additions DeductionsAs at the end of
the Financial Year
As at the beginning of the Financial Year
As at the end of the Financial
Year
Land 164.28 19.43 183.72 - - - 0.00% 164.28 183.72Buildings 57.40 1.42 58.82 13.02 1.94 14.96 3.34% 44.38 43.86Hydraulic works 0.81 0.03 0.84 0.57 0.04 0.61 5.28% 0.24 0.23Other Civil Works 94.21 1.27 95.48 11.57 3.17 14.74 3.34% 82.64 80.74Plant & Machinery 2,538.68 274.10 2,812.77 762.98 141.28 904.26 5.28% 1,775.70 1,908.52Lines & Cables 4,235.17 180.11 4,415.28 1,847.01 228.37 2,075.39 5.28% 2,388.15 2,339.89Vehicles 38.23 8.35 46.58 8.50 4.03 12.53 9.50% 29.72 34.05Furniture & Fixtures 22.88 2.79 25.67 7.02 1.54 8.56 6.33% 15.86 17.11Office Equipments 268.22 58.31 326.52 45.83 18.82 64.66 6.33% 222.38 261.86Assets taken over from licensees pending final valuation
- - - - - - 0.00% - -
Computer Software - - - - - - 30.00% - -Capital Expenditure on Assets not belonging to utilitySpare UnitsCapital Spares
TOTAL 7,419.87 545.81 - 7,965.68 2,696.50 399.19 - 3,095.69 4,723.36 4,869.98
Distribution Wire Business
As at the beginning of the Financial Year
Additions Deductions As at the end of the Financial Year
As at the beginning of the Financial
Year
Additions DeductionsAs at the end of
the Financial Year
As at the beginning of the Financial Year
As at the end of the Financial
Year
LandBuildingsHydraulic worksOther Civil WorksPlant & MachineryLines & CablesVehiclesFurniture & FixturesOffice EquipmentsAssets taken over from licensees pending final valuationComputer SoftwareCapital Expenditure on Assets not belonging to utilitySpare UnitsCapital Spares
TOTAL 2,426.85 359.27 2,786.12
Distribution Retail Supply Business
As at the beginning of the Financial Year
Additions Deductions As at the end of the Financial Year
As at the beginning of the Financial
Year
Additions DeductionsAs at the end of
the Financial Year
As at the beginning of the Financial Year
As at the end of the Financial
Year
LandBuildingsHydraulic worksOther Civil WorksPlant & MachineryLines & CablesVehiclesFurniture & FixturesOffice EquipmentsCapital Expenditure on Assets not belonging to utilitySpare UnitsCapital Spares
TOTAL 269.65 39.92 309.57
* The particular of asset and rate of depreciation should match with those provided in the applicable Tariff Regulations
Particulars *
Gross Block- FY 2019-20
Gross Block- FY 2019-20
Depreciation- FY 2019-20 Applicable rate of
Depreciation (%) *
Net Block- FY 2019-20
Particulars *
Particulars *
Gross Block- FY 2019-20 Depreciation- FY 2019-20 Applicable rate of
Depreciation (%) *
Net Block- FY 2019-20
Depreciation- FY 2019-20 Applicable rate of
Depreciation (%) *
Net Block- FY 2019-20
Uttar Gujarat Vij Company Limited Page 137

(Rs. Crore)
As at the beginning of the Financial Year
Additions Deductions As at the end of the Financial Year
As at the beginning of the Financial
Year
Additions DeductionsAs at the end of
the Financial Year
As at the beginning of the Financial Year
As at the end of the Financial
Year
Land 183.72 19.27 202.99 - - - 0.00% 183.72 202.99Buildings 58.82 1.41 60.22 14.96 1.99 16.95 3.34% 43.86 43.28Hydraulic works 0.84 0.03 0.88 0.61 0.05 0.66 5.28% 0.23 0.22Other Civil Works 95.48 1.26 96.74 14.74 3.21 17.95 3.34% 80.74 78.79Plant & Machinery 2,812.77 271.81 3,084.59 904.26 155.69 1,059.95 5.28% 1,908.52 2,024.64Lines & Cables 4,415.28 178.61 4,593.89 2,075.39 237.84 2,313.23 5.28% 2,339.89 2,280.66Vehicles 46.58 8.28 54.86 12.53 4.82 17.35 9.50% 34.05 37.51Furniture & Fixtures 25.67 2.77 28.43 8.56 1.71 10.27 6.33% 17.11 18.17Office Equipments 326.52 57.82 384.34 64.66 22.50 87.16 6.33% 261.86 297.18Assets taken over from licensees pending final valuation
- - - - - - 0.00% - -
Computer Software - - - - - - 30.00% - -Capital Expenditure on Assets not belonging to utilitySpare UnitsCapital Spares
TOTAL 7,965.68 541.26 - 8,506.94 3,095.69 427.81 - 3,523.50 4,869.98 4,983.44
Distribution Wire Business
As at the beginning of the Financial Year
Additions Deductions As at the end of the Financial Year
As at the beginning of the Financial
Year
Additions DeductionsAs at the end of
the Financial Year
As at the beginning of the Financial Year
As at the end of the Financial
Year
LandBuildingsHydraulic worksOther Civil WorksPlant & MachineryLines & CablesVehiclesFurniture & FixturesOffice EquipmentsAssets taken over from licensees pending final valuationComputer SoftwareCapital Expenditure on Assets not belonging to utilitySpare UnitsCapital Spares
TOTAL 2,786.12 385.02 3,171.15
Distribution Retail Supply Business
As at the beginning of the Financial Year
Additions Deductions As at the end of the Financial Year
As at the beginning of the Financial
Year
Additions DeductionsAs at the end of
the Financial Year
As at the beginning of the Financial Year
As at the end of the Financial
Year
LandBuildingsHydraulic worksOther Civil WorksPlant & MachineryLines & CablesVehiclesFurniture & FixturesOffice EquipmentsCapital Expenditure on Assets not belonging to utilitySpare UnitsCapital Spares
TOTAL 309.57 42.78 352.35
* The particular of asset and rate of depreciation should match with those provided in the applicable Tariff Regulations
Particulars *
Particulars *
Particulars *
Net Block- FY 2020-21Gross Block- FY 2020-21 Depreciation- FY 2020-21 Applicable rate of
Depreciation (%) *
Gross Block- FY 2020-21 Depreciation- FY 2020-21 Applicable rate of
Depreciation (%) *
Net Block- FY 2020-21
Net Block- FY 2020-21Gross Block- FY 2020-21 Depreciation- FY 2020-21 Applicable rate of
Depreciation (%) *
Uttar Gujarat Vij Company Limited Page 138
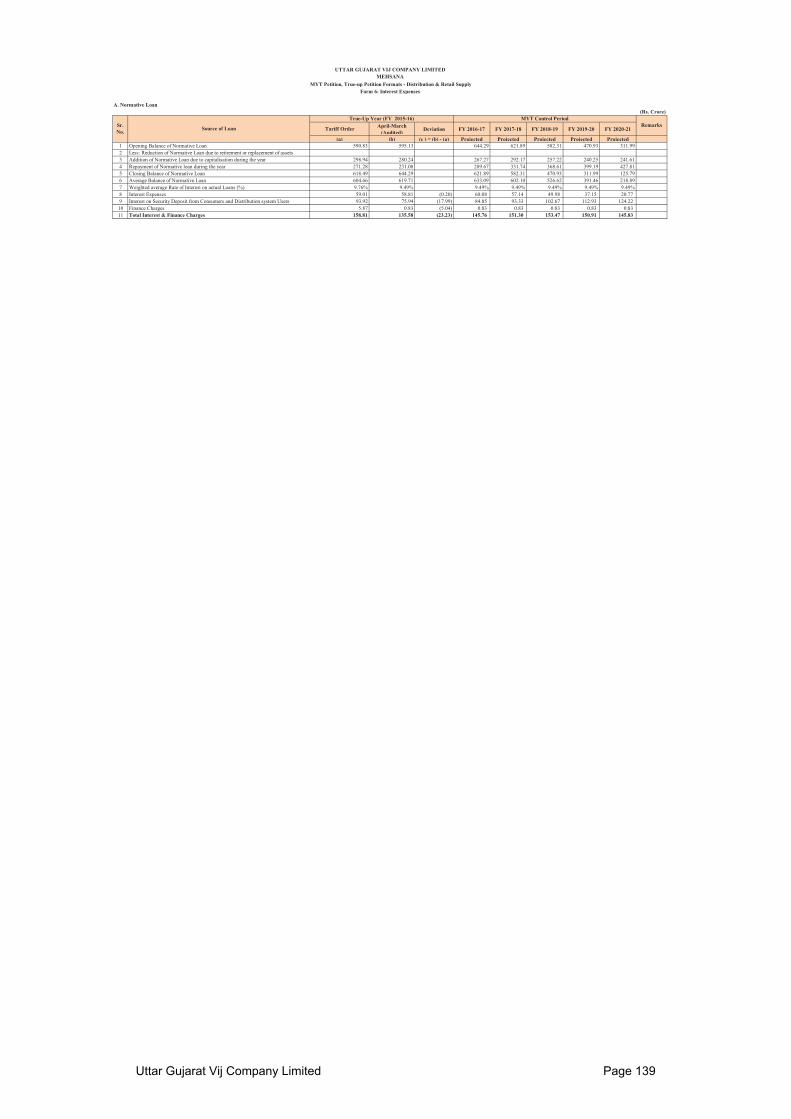
A. Normative Loan(Rs. Crore)
Tariff Order April-March (Audited) Deviation FY 2016-17 FY 2017-18 FY 2018-19 FY 2019-20 FY 2020-21
(a) (b) (c ) = (b) - (a) Projected Projected Projected Projected Projected1 Opening Balance of Normative Loan 590.83 595.13 644.29 621.89 582.31 470.93 311.992 Less: Reduction of Normative Loan due to retirement or replacement of assets3 Addition of Normative Loan due to capitalisation during the year 298.94 280.24 267.27 292.17 257.22 240.25 241.614 Repayment of Normative loan during the year 271.28 231.08 289.67 331.74 368.61 399.19 427.815 Closing Balance of Normative Loan 618.49 644.29 621.89 582.31 470.93 311.99 125.796 Average Balance of Normative Loan 604.66 619.71 633.09 602.10 526.62 391.46 218.897 Weighted average Rate of Interest on actual Loans (%) 9.76% 9.49% 9.49% 9.49% 9.49% 9.49% 9.49%8 Interest Expenses 59.01 58.81 (0.20) 60.08 57.14 49.98 37.15 20.779 Interest on Security Deposit from Consumers and Distribution system Users 93.92 75.94 (17.99) 84.85 93.33 102.67 112.93 124.2210 Finance Charges 5.87 0.83 (5.04) 0.83 0.83 0.83 0.83 0.8311 Total Interest & Finance Charges 158.81 135.58 (23.23) 145.76 151.30 153.47 150.91 145.83
UTTAR GUJARAT VIJ COMPANY LIMITEDMEHSANA
MYT Petition, True-up Petition Formats - Distribution & Retail SupplyForm 6: Interest Expenses
Sr. No. Source of Loan
True-Up Year (FY 2015-16) MYT Control PeriodRemarks
Uttar Gujarat Vij Company Limited Page 139

Interest on Working Capital - Distribution Business
A. True-up Year (FY 2015-16)
Tariff Order Audited True-Up PetitionComputation of Working Capital
1 O&M expenses 39.082 Maintenance Spares 45.783 Receivables 726.254 Working Capital requirement 811.11
Less:
5 Amount held as security deposit from Distribution System Users
988.06
6 Total Working Capital (176.95)
Computation of working capital interest7 Interest Rate (%) 14.75%8 Interest on Working Capital -
9 Actual Working Capital Interest - -
B. MYT Control Period FY 2016-17 to FY 2020-21
FY 2016-17 FY 2017-18 FY 2018-19 FY 2019-20 FY 2020-21Computation of Working Capital
1 O&M expenses 46.26 48.89 51.67 54.61 57.722 Maintenance Spares 52.06 60.19 68.04 74.20 79.663 Receivables 783.63 816.29 850.36 885.95 923.154 Working Capital requirement 881.95 925.38 970.07 1,014.76 1,060.52
Less:
5 Amount held as security deposit from Distribution System Users
1,094.80 1,204.28 1,324.71 1,457.18 1,602.90
6 Total Working Capital (212.85) (278.91) (354.64) (442.43) (542.38)
Computation of working capital interest7 Interest Rate (%) 11.70% 11.70% 11.70% 11.70% 11.70%8 Interest on Working Capital - - - - -
Interest on Working Capital - Distribution Wire Business
A. True-up Year (FY 2015-16)
Tariff Order Audited True-Up PetitionComputation of Working Capital
1 O&M expenses 3.912 Maintenance Spares 4.583 Receivables 72.624 Working Capital requirement 81.11
Less:
5 Amount held as security deposit from Distribution System Users
98.81
6 Total Working Capital (17.70)
Computation of working capital interest7 Interest Rate (%) 14.75%8 Interest on Working Capital -
9 Actual Working Capital Interest -
B. MYT Control Period FY 2016-17 to FY 2020-21
FY 2016-17 FY 2017-18 FY 2018-19 FY 2019-20 FY 2020-21Computation of Working Capital
1 O&M expenses 4.63 4.89 5.17 5.46 5.772 Maintenance Spares 5.21 6.02 6.80 7.42 7.973 Receivables 78.36 81.63 85.04 88.60 92.324 Working Capital requirement 88.19 92.54 97.01 101.48 106.05
Less:
5 Amount held as security deposit from Distribution System Users
109.48 120.43 132.47 145.72 160.29
6 Total Working Capital (21.29) (27.89) (35.46) (44.24) (54.24)
Computation of working capital interest7 Interest Rate (%) 11.70% 11.70% 11.70% 11.70% 11.70%8 Interest on Working Capital - - - - -
Interest on Working Capital - Retail Supply Business
A. True-up Year (FY 2015-16)
Tariff Order Audited True-Up Petition
Computation of Working Capital1 O&M expenses 35.172 Maintenance Spares 41.203 Receivables 653.624 Working Capital requirement 730.00
Less:5 Amount held as security deposit 889.256 Total Working Capital (159.26)
Computation of working capital interest7 Interest Rate (%) 14.75%8 Interest on Working Capital -
9 Actual Working Capital Interest -
B) MYT Control Period FY 2016-17 to FY 2020-21
FY 2016-17 FY 2017-18 FY 2018-19 FY 2019-20 FY 2020-21Computation of Working Capital
1 O&M expenses 41.64 44.00 46.50 49.15 51.942 Maintenance Spares 46.85 54.17 61.23 66.78 71.693 Receivables 705.27 734.66 765.32 797.36 830.844 Working Capital requirement 793.75 832.84 873.06 913.28 954.47
Less:5 Amount held as security deposit 985.32 1,083.86 1,192.24 1,311.47 1,442.616 Total Working Capital (191.57) (251.02) (319.18) (398.18) (488.14)
Computation of working capital interest7 Interest Rate (%) 11.70% 11.70% 11.70% 11.70% 11.70%8 Interest on Working Capital - - - - -
UTTAR GUJARAT VIJ COMPANY LIMITEDMEHSANA
MYT Petition, True-up Petition Formats - Distribution & Retail SupplyForm 7: Interest on Working Capital
Sr. No Particulars Norm True-up Year (FY 2015-16)
Sl. No Particulars Norm MYT Control Period
Sr. No Particulars Norm True-up Year (FY 2015-16)
Sl. No Particulars Norm MYT Control Period
Sl. No Particulars Norm MYT Control Period
Sl. No Particulars Norm True-up Year (FY 2015-16)
Uttar Gujarat Vij Company Limited Page 140

Distribution Business(Rs. Crore)
FY 2016-17 FY 2017-18 FY 2018-19 FY 2019-20 FY 2020-21Projected Projected Projected Projected Projected
1 Regulatory Equity at the beginning of the year A 991.37 996.37 1,116.47 1,231.02 1,356.23 1,466.47 1,569.432 Capitalisation during the year B 877.90 627.52 813.66 784.43 616.11 545.81 541.263 Equity portion of capitalisation during the year C 128.13 120.10 114.54 125.21 110.24 102.96 103.55
4 Reduction in Equity Capital on account of retirement / replacement of assets D - - - - - - -
5 Regulatory Equity at the end of the year E=A+C-D 1,119.50 1,116.47 1,231.02 1,356.23 1,466.47 1,569.43 1,672.98
Return on Equity Computation6 Return on Regulatory Equity at the beginning of the year F 138.79 139.49 156.31 172.34 189.87 205.31 219.727 Return on Regulatory Equity addition during the year G=(C-D)/2 8.97 8.41 8.02 8.76 7.72 7.21 7.258 Total Return on Equity 147.76 147.90 164.32 181.11 197.59 212.51 226.97
Distribution Wires Business(Rs. Crore)
FY 2016-17 FY 2017-18 FY 2018-19 FY 2019-20 FY 2020-21Projected Projected Projected Projected Projected
1 Regulatory Equity at the beginning of the year A 892.23 896.74 1,004.83 1,107.92 1,220.61 1,319.82 1,412.492 Capitalisation during the year B 790.11 564.77 732.29 705.99 554.50 491.23 487.133 Equity portion of capitalisation during the year C 115.32 108.09 103.09 112.69 99.21 92.67 93.19
4 Reduction in Equity Capital on account of retirement / replacement of assets D - - - - - - -
5 Regulatory Equity at the end of the year E=A+C-D 1,007.55 1,004.83 1,107.92 1,220.61 1,319.82 1,412.49 1,505.68
Return on Equity Computation6 Return on Regulatory Equity at the beginning of the year F 124.91 125.54 140.68 155.11 170.89 184.78 197.757 Return on Regulatory Equity addition during the year G=(C-D)/2 8.07 7.57 7.22 7.89 6.94 6.49 6.528 Total Return on Equity 132.98 133.11 147.89 163.00 177.83 191.26 204.27
Distribution Retail Supply Business(Rs. Crore)
FY 2016-17 FY 2017-18 FY 2018-19 FY 2019-20 FY 2020-21Projected Projected Projected Projected Projected
1 Regulatory Equity at the beginning of the year A 99.14 99.64 111.65 123.10 135.62 146.65 156.942 Capitalisation during the year B 87.79 62.75 81.37 78.44 61.61 54.58 54.133 Equity portion of capitalisation during the year C 12.81 12.01 11.45 12.52 11.02 10.30 10.35
4 Reduction in Equity Capital on account of retirement / replacement of assets D - - - - - - -
5 Regulatory Equity at the end of the year E=A+C-D 111.95 111.65 123.10 135.62 146.65 156.94 167.30
Return on Equity Computation6 Return on Regulatory Equity at the beginning of the year F 13.88 13.95 15.63 17.23 18.99 20.53 21.977 Return on Regulatory Equity addition during the year G=(C-D)/2 0.90 0.84 0.80 0.88 0.77 0.72 0.728 Total Return on Equity 14.78 14.79 16.43 18.11 19.76 21.25 22.70
UTTAR GUJARAT VIJ COMPANY LIMITEDMEHSANA
MYT Petition, True-up Petition Formats - Distribution & Retail SupplyForm 8: Return on Regulatory Equity - Distribution Wire & Retail Supply Business
Sr. No. Particulars Legend
True-Up Year (FY 2015-16) MYT Control Period
Norm Tariff Order Claimed in Petition
Sr. No. Particulars Legend
True-Up Year (FY 2015-16)
Sr. No. Particulars Legend
True-Up Year (FY 2015-16) MYT Control Period
Norm Tariff Order Claimed in Petition
MYT Control Period
Norm Tariff Order Claimed in Petition
Uttar Gujarat Vij Company Limited Page 141

Distribution Business(Rs. Crore)
Tariff Order April-March (Audited) Deviation FY 2016-17 FY 2017-18 FY 2018-19 FY 2019-20 FY 2020-21
(a) (b) (c ) = (b) - (a) Projected Projected Projected Projected Projected
Interest on staff loans and advances 1.3323Interest from others 0.1432Income from sale of scrapGain on sale of fixed assets (net) 0.323Income from Staff Welfare ActivitiesGrant for energy conservation 0.1121Capital grants ( Deferred amount 10% W.Back)Cons. contribution ( Deferred amount 10% W.Back)Provisions no longer required 0.9437Miscellaneous receipts 30.1846Delay Payment Charges 19.76Penalties received from Suppliers Recovery of Reactive chargesRents of land or buildingsIncome from investmentsInterest on advances to suppliers/contractorsRental from staff quartersRental from contractorsIncome from hire charges from contractors and othersIncome from advertisementsMiscellaneous receiptsPrior Period IncomeOther (Pls. specify)…Total 156.83 167.85 11.02 148.09 148.09 148.09 148.09 148.09
Distribution Wires Business(Rs. Crore)
Tariff Order April-March (Audited) Deviation FY 2016-17 FY 2017-18 FY 2018-19 FY 2019-20 FY 2020-21
(a) (b) (c ) = (b) - (a) Projected Projected Projected Projected Projected
Interest on staff loans and advances 0.13 Interest from others 0.01 Income from sale of scrap -Gain on sale of fixed assets (net) 0.03 Income from Staff Welfare Activities -Grant for energy conservation 0.01 Capital grants ( Deferred amount 10% W.Back) 11.51 Cons. contribution ( Deferred amount 10% W.Back) -Provisions no longer required 0.09 Miscellaneous receipts 3.02 Delay Payment Charges 1.98 Penalties received from Suppliers -Recovery of Reactive charges -Rents of land or buildingsIncome from investmentsInterest on advances to suppliers/contractorsRental from staff quartersRental from contractorsIncome from hire charges from contractors and othersIncome from advertisementsMiscellaneous receiptsPrior Period IncomeOther (Pls. specify)…Total 15.68 16.79 1.10 14.81 14.81 14.81 14.81 14.81
Distribution Retail Supply Business(Rs. Crore)
Tariff Order April-March (Audited ) Deviation FY 2016-17 FY 2017-18 FY 2018-19 FY 2019-20 FY 2020-21
(a) (b) (c ) = (b) - (a) Projected Projected Projected Projected Projected1 Interest on staff loans and advances 1.202 Interest from others 0.13
Income from sale of scrap -Gain on sale of fixed assets (net) 0.29Income from Staff Welfare Activities -Grant for energy conservation 0.10Capital grants ( Deferred amount 10% W.Back) 103.55Cons. contribution ( Deferred amount 10% W.Back) -Provisions no longer required 0.85Miscellaneous receipts 27.17Delay Payment Charges 17.78Penalties received from Suppliers -Recovery of Reactive charges -Rents of land or buildingsIncome from investmentsInterest on advances to suppliers/contractorsRental from staff quarters
3 Rental from contractors4 Income from hire charges from contractors and others5 Income from advertisements6 Miscellaneous receipts7 Prior Period Income8 Other (Pls. specify)9 …
Total 141.15 151.07 9.92 133.28 133.28 133.28 133.28 133.28
Remarks
Sr. No.
Particulars
True-Up Year (FY 2015-16)
Sr. No.
Particulars
True-Up Year (FY 2015-16) MYT Control Period
Remarks
MYT Control Period
115.0532
UTTAR GUJARAT VIJ COMPANY LIMITEDMEHSNA
MYT Petition, True-up Petition Formats - Distribution & Retail SupplyForm 9: Non-tariff Income
Sr. No.
Particulars
True-Up Year (FY 2015-16) MYT Control Period
Remarks
Uttar Gujarat Vij Company Limited Page 142
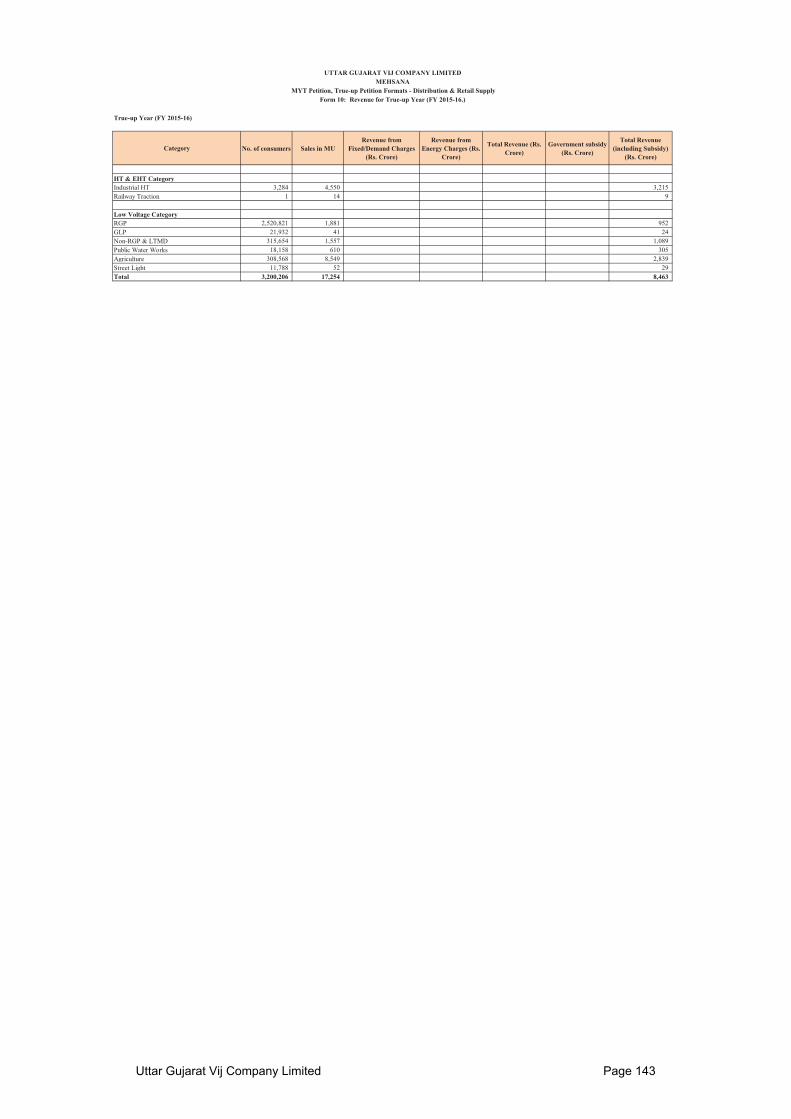
True-up Year (FY 2015-16)
Category No. of consumers Sales in MURevenue from
Fixed/Demand Charges (Rs. Crore)
Revenue from Energy Charges (Rs.
Crore)
Total Revenue (Rs. Crore)
Government subsidy (Rs. Crore)
Total Revenue (including Subsidy)
(Rs. Crore)
HT & EHT CategoryIndustrial HT 3,284 4,550 3,215Railway Traction 1 14 9
Low Voltage CategoryRGP 2,520,821 1,881 952GLP 21,932 41 24Non-RGP & LTMD 315,654 1,557 1,089Public Water Works 18,158 610 305Agriculture 308,568 8,549 2,839Street Light 11,788 52 29Total 3,200,206 17,254 8,463
UTTAR GUJARAT VIJ COMPANY LIMITEDMEHSANA
MYT Petition, True-up Petition Formats - Distribution & Retail SupplyForm 10: Revenue for True-up Year (FY 2015-16.)
Uttar Gujarat Vij Company Limited Page 143

True-up Year (FY 2015-16) at existing Tariff , Ensuing Year (FY 2017-18) at proposed Tariff
All CategoriesTrue Up Year (FY 2015-
16) Ensuing Year (FY 2017-
18) A Physical Data1 Units Sold MU's 18,9462 Units Sold during Peak hours (ToU) 1,9463 Connected Load MW 13,4064 Contract Demand kW/kVA -5 Actual Recorded Demand kW/kVA -6 Normal Billed Demand kW/kVA -7 Excess Billed Demand kW/kVA -8 Total Billed Demand kW/kVA -9 Number of Single Phase Consumers -10 Number of Three Phase Consumers -11 Total Number of Consumers 3,471,65312 Power Factor %13 Monthly Consumption per consumer kWh 45514 Connected Load per Consumer HP/kW15 Normal Billed Demand per Consumer kW/kVA16 Excess Billed Demand per Consumer kW/kVA17 Total Billed Demand per Consumer kW/kVA
B Sales Revenue1 Fixed Charge / Demand Charge Rs. In Cr. 2,2942 Excess Demand Charge Rs. In Cr. -3 Total Fixed Charge / Demand Charge Rs. In Cr. 2,2944 Energy Charge Rs. In Cr. 3,9305 Time of Use Charge Rs. In Cr. 716 Power Factor Adjustment Rs. In Cr. 47 Energy + ToU + PF Adjustment Charge ( 4+5+6) Rs. In Cr. 4,0048 Fuel Cost Adjustment Rs. In Cr. 2,7099 Total Charge Rs. In Cr. 9,00710 Prompt Payment Discount, if Any. Rs. In Cr. -11 Net Sale of Energy Rs. In Cr. 9,007
C Sales Revenue1 Fixed Charge / Demand Charge Paise per unit 1212 Excess Demand Charge Paise per unit -3 Total Fixed Charge / Demand Charge Paise per unit 1214 Energy Charge Paise per unit 2075 Time of Use Charge Paise per unit 46 Power Factor Adjustment Paise per unit 07 Energy + ToU + PF Adjustment Charge ( 4+5+6) Paise per unit 2118 Fuel Cost Adjustment Paise per unit 1439 Total Charge Paise per unit 47510 Prompt Payment Discount, if Any. Paise per unit -11 Net Sale of Energy Paise per unit 475
UTTAR GUJARAT VIJ COMPANY LIMITEDMEHSANA
MYT Petition, True-up Petition Formats - Distribution & Retail SupplyForm 10.A: Sale of Electrical Energy
TOTAL / AVERAGE
Uttar Gujarat Vij Company Limited Page 144

True-up Year (FY 2015-16) at existing Tariff , Ensuing Year (FY 2017-18) at proposed Tariff
ResidentialTrue Up Year (FY 2015-
16) Ensuing Year (FY 2017-
18) A Physical Data1 Units Sold MU's 2,200.192 Units Sold during Peak hours (ToU)3 Connected Load MW 2,728.954 Contract Demand kW/kVA5 Actual Recorded Demand kW/kVA6 Normal Billed Demand kW/kVA7 Excess Billed Demand kW/kVA8 Total Billed Demand kW/kVA9 Number of Single Phase Consumers10 Number of Three Phase Consumers11 Total Number of Consumers 2,698,192.0012 Power Factor %13 Monthly Consumption per consumer kWh 67.9514 Connected Load per Consumer HP/kW15 Normal Billed Demand per Consumer kW/kVA16 Excess Billed Demand per Consumer kW/kVA17 Total Billed Demand per Consumer kW/kVA
B Sales Revenue1 Fixed Charge / Demand Charge Rs. In Cr. 50.332 Excess Demand Charge Rs. In Cr. -3 Total Fixed Charge / Demand Charge Rs. In Cr. 50.334 Energy Charge Rs. In Cr. 802.105 Time of Use Charge Rs. In Cr. -6 Power Factor Adjustment Rs. In Cr. -7 Energy + ToU + PF Adjustment Charge ( 4+5+6) Rs. In Cr. 802.108 Fuel Cost Adjustment Rs. In Cr. 314.639 Total Charge Rs. In Cr. 1,167.0510 Prompt Payment Discount, if Any. Rs. In Cr. -11 Net Sale of Energy Rs. In Cr. 1,167.05
C Sales Revenue1 Fixed Charge / Demand Charge Paise per unit 22.882 Excess Demand Charge Paise per unit -3 Total Fixed Charge / Demand Charge Paise per unit 22.884 Energy Charge Paise per unit 364.565 Time of Use Charge Paise per unit -6 Power Factor Adjustment Paise per unit -7 Energy + ToU + PF Adjustment Charge ( 4+5+6) Paise per unit 364.568 Fuel Cost Adjustment Paise per unit 143.009 Total Charge Paise per unit 530.4310 Prompt Payment Discount, if Any. Paise per unit -11 Net Sale of Energy Paise per unit 530.43
UTTAR GUJARAT VIJ COMPANY LIMITEDMEHSANA
MYT Petition, True-up Petition Formats - Distribution & Retail SupplyForm 10.A: Sale of Electrical Energy
TOTAL / AVERAGE
Uttar Gujarat Vij Company Limited Page 145
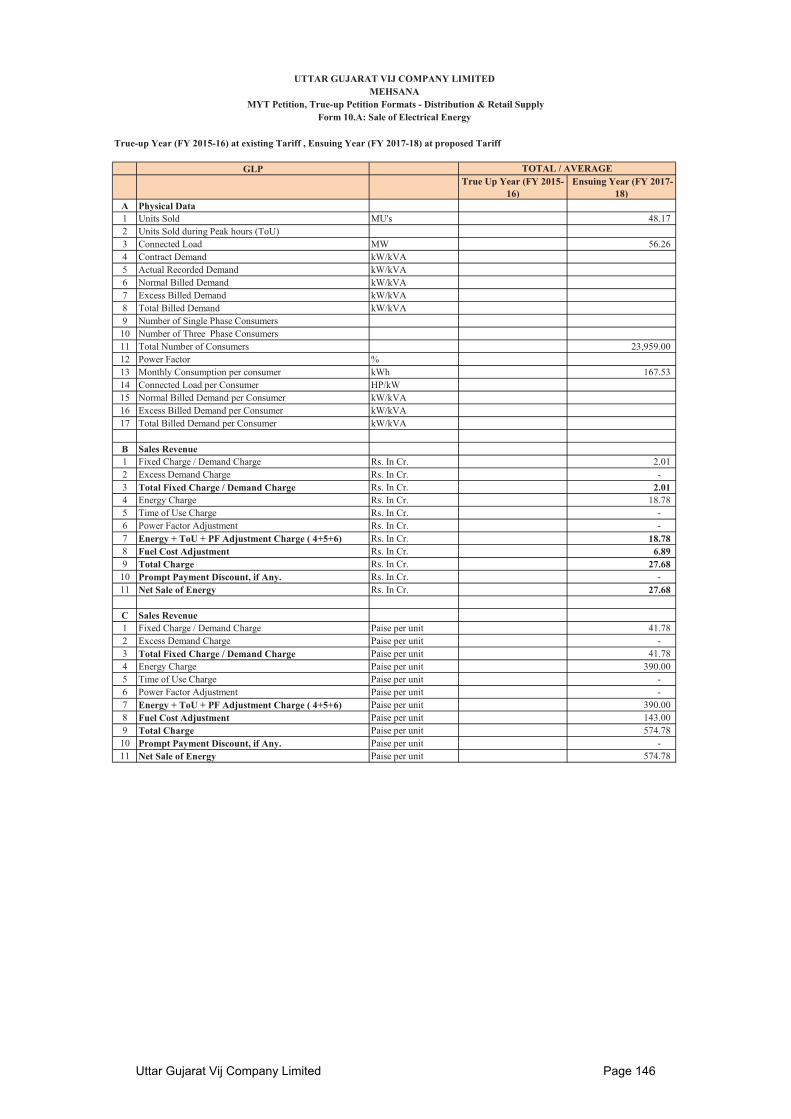
True-up Year (FY 2015-16) at existing Tariff , Ensuing Year (FY 2017-18) at proposed Tariff
GLPTrue Up Year (FY 2015-
16) Ensuing Year (FY 2017-
18) A Physical Data1 Units Sold MU's 48.172 Units Sold during Peak hours (ToU)3 Connected Load MW 56.264 Contract Demand kW/kVA5 Actual Recorded Demand kW/kVA6 Normal Billed Demand kW/kVA7 Excess Billed Demand kW/kVA8 Total Billed Demand kW/kVA9 Number of Single Phase Consumers10 Number of Three Phase Consumers11 Total Number of Consumers 23,959.0012 Power Factor %13 Monthly Consumption per consumer kWh 167.5314 Connected Load per Consumer HP/kW15 Normal Billed Demand per Consumer kW/kVA16 Excess Billed Demand per Consumer kW/kVA17 Total Billed Demand per Consumer kW/kVA
B Sales Revenue1 Fixed Charge / Demand Charge Rs. In Cr. 2.012 Excess Demand Charge Rs. In Cr. -3 Total Fixed Charge / Demand Charge Rs. In Cr. 2.014 Energy Charge Rs. In Cr. 18.785 Time of Use Charge Rs. In Cr. -6 Power Factor Adjustment Rs. In Cr. -7 Energy + ToU + PF Adjustment Charge ( 4+5+6) Rs. In Cr. 18.788 Fuel Cost Adjustment Rs. In Cr. 6.899 Total Charge Rs. In Cr. 27.6810 Prompt Payment Discount, if Any. Rs. In Cr. -11 Net Sale of Energy Rs. In Cr. 27.68
C Sales Revenue1 Fixed Charge / Demand Charge Paise per unit 41.782 Excess Demand Charge Paise per unit -3 Total Fixed Charge / Demand Charge Paise per unit 41.784 Energy Charge Paise per unit 390.005 Time of Use Charge Paise per unit -6 Power Factor Adjustment Paise per unit -7 Energy + ToU + PF Adjustment Charge ( 4+5+6) Paise per unit 390.008 Fuel Cost Adjustment Paise per unit 143.009 Total Charge Paise per unit 574.7810 Prompt Payment Discount, if Any. Paise per unit -11 Net Sale of Energy Paise per unit 574.78
UTTAR GUJARAT VIJ COMPANY LIMITEDMEHSANA
MYT Petition, True-up Petition Formats - Distribution & Retail SupplyForm 10.A: Sale of Electrical Energy
TOTAL / AVERAGE
Uttar Gujarat Vij Company Limited Page 146

True-up Year (FY 2015-16) at existing Tariff , Ensuing Year (FY 2017-18) at proposed Tariff
LTMDTrue Up Year (FY 2015-
16) Ensuing Year (FY 2017-
18) A Physical Data1 Units Sold MU's 1,733.222 Units Sold during Peak hours (ToU)3 Connected Load MW 1,745.714 Contract Demand kW/kVA5 Actual Recorded Demand kW/kVA6 Normal Billed Demand kW/kVA7 Excess Billed Demand kW/kVA8 Total Billed Demand kW/kVA9 Number of Single Phase Consumers10 Number of Three Phase Consumers11 Total Number of Consumers 352,104.0012 Power Factor %13 Monthly Consumption per consumer kWh 410.2114 Connected Load per Consumer HP/kW15 Normal Billed Demand per Consumer kW/kVA16 Excess Billed Demand per Consumer kW/kVA17 Total Billed Demand per Consumer kW/kVA
B Sales Revenue1 Fixed Charge / Demand Charge Rs. In Cr. 170.772 Excess Demand Charge Rs. In Cr. -3 Total Fixed Charge / Demand Charge Rs. In Cr. 170.774 Energy Charge Rs. In Cr. 774.535 Time of Use Charge Rs. In Cr. -6 Power Factor Adjustment Rs. In Cr. 3.537 Energy + ToU + PF Adjustment Charge ( 4+5+6) Rs. In Cr. 778.068 Fuel Cost Adjustment Rs. In Cr. 247.859 Total Charge Rs. In Cr. 1,196.6910 Prompt Payment Discount, if Any. Rs. In Cr. -11 Net Sale of Energy Rs. In Cr. 1,196.69
C Sales Revenue1 Fixed Charge / Demand Charge Paise per unit 98.532 Excess Demand Charge Paise per unit -3 Total Fixed Charge / Demand Charge Paise per unit 98.534 Energy Charge Paise per unit 446.885 Time of Use Charge Paise per unit -6 Power Factor Adjustment Paise per unit 2.047 Energy + ToU + PF Adjustment Charge ( 4+5+6) Paise per unit 448.918 Fuel Cost Adjustment Paise per unit 143.009 Total Charge Paise per unit 690.4410 Prompt Payment Discount, if Any. Paise per unit -11 Net Sale of Energy Paise per unit 690.44
UTTAR GUJARAT VIJ COMPANY LIMITEDMEHSANA
MYT Petition, True-up Petition Formats - Distribution & Retail SupplyForm 10.A: Sale of Electrical Energy
TOTAL / AVERAGE
Uttar Gujarat Vij Company Limited Page 147

True-up Year (FY 2015-16) at existing Tariff , Ensuing Year (FY 2017-18) at proposed Tariff
Public Water WorksTrue Up Year (FY 2015-
16) Ensuing Year (FY 2017-
18) A Physical Data1 Units Sold MU's 718.342 Units Sold during Peak hours (ToU)3 Connected Load MW 382.274 Contract Demand kW/kVA5 Actual Recorded Demand kW/kVA6 Normal Billed Demand kW/kVA7 Excess Billed Demand kW/kVA8 Total Billed Demand kW/kVA9 Number of Single Phase Consumers10 Number of Three Phase Consumers11 Total Number of Consumers 21,393.2612 Power Factor %13 Monthly Consumption per consumer kWh 2,798.1514 Connected Load per Consumer HP/kW15 Normal Billed Demand per Consumer kW/kVA16 Excess Billed Demand per Consumer kW/kVA17 Total Billed Demand per Consumer kW/kVA
B Sales Revenue1 Fixed Charge / Demand Charge Rs. In Cr. 6.622 Excess Demand Charge Rs. In Cr. -3 Total Fixed Charge / Demand Charge Rs. In Cr. 6.624 Energy Charge Rs. In Cr. 253.945 Time of Use Charge Rs. In Cr. -6 Power Factor Adjustment Rs. In Cr. -7 Energy + ToU + PF Adjustment Charge ( 4+5+6) Rs. In Cr. 253.948 Fuel Cost Adjustment Rs. In Cr. 102.729 Total Charge Rs. In Cr. 363.2910 Prompt Payment Discount, if Any. Rs. In Cr. -11 Net Sale of Energy Rs. In Cr. 363.29
C Sales Revenue1 Fixed Charge / Demand Charge Paise per unit 9.212 Excess Demand Charge Paise per unit -3 Total Fixed Charge / Demand Charge Paise per unit 9.214 Energy Charge Paise per unit 353.525 Time of Use Charge Paise per unit -6 Power Factor Adjustment Paise per unit -7 Energy + ToU + PF Adjustment Charge ( 4+5+6) Paise per unit 353.528 Fuel Cost Adjustment Paise per unit 143.009 Total Charge Paise per unit 505.7310 Prompt Payment Discount, if Any. Paise per unit -11 Net Sale of Energy Paise per unit 505.73
UTTAR GUJARAT VIJ COMPANY LIMITEDMEHSANA
MYT Petition, True-up Petition Formats - Distribution & Retail SupplyForm 10.A: Sale of Electrical Energy
TOTAL / AVERAGE
Uttar Gujarat Vij Company Limited Page 148

True-up Year (FY 2015-16) at existing Tariff , Ensuing Year (FY 2017-18) at proposed Tariff
AgricultureTrue Up Year (FY 2015-
16) Ensuing Year (FY 2017-
18) A Physical Data1 Units Sold MU's 9,471.102 Units Sold during Peak hours (ToU)3 Connected Load MW 5,315.074 Contract Demand kW/kVA5 Actual Recorded Demand kW/kVA6 Normal Billed Demand kW/kVA7 Excess Billed Demand kW/kVA8 Total Billed Demand kW/kVA9 Number of Single Phase Consumers10 Number of Three Phase Consumers11 Total Number of Consumers 358,568.0012 Power Factor %13 Monthly Consumption per consumer kWh 2,201.1414 Connected Load per Consumer HP/kW15 Normal Billed Demand per Consumer kW/kVA16 Excess Billed Demand per Consumer kW/kVA17 Total Billed Demand per Consumer kW/kVA
B Sales Revenue1 Fixed Charge / Demand Charge Rs. In Cr. 963.592 Excess Demand Charge Rs. In Cr. -3 Total Fixed Charge / Demand Charge Rs. In Cr. 963.594 Energy Charge Rs. In Cr. 204.115 Time of Use Charge Rs. In Cr. -6 Power Factor Adjustment Rs. In Cr. -7 Energy + ToU + PF Adjustment Charge ( 4+5+6) Rs. In Cr. 204.118 Fuel Cost Adjustment Rs. In Cr. 1,354.379 Total Charge Rs. In Cr. 2,522.0710 Prompt Payment Discount, if Any. Rs. In Cr. -11 Net Sale of Energy Rs. In Cr. 2,522.07
C Sales Revenue1 Fixed Charge / Demand Charge Paise per unit 101.742 Excess Demand Charge Paise per unit -3 Total Fixed Charge / Demand Charge Paise per unit 101.744 Energy Charge Paise per unit 21.555 Time of Use Charge Paise per unit -6 Power Factor Adjustment Paise per unit -7 Energy + ToU + PF Adjustment Charge ( 4+5+6) Paise per unit 21.558 Fuel Cost Adjustment Paise per unit 143.009 Total Charge Paise per unit 266.2910 Prompt Payment Discount, if Any. Paise per unit -11 Net Sale of Energy Paise per unit 266.29
UTTAR GUJARAT VIJ COMPANY LIMITEDMEHSANA
MYT Petition, True-up Petition Formats - Distribution & Retail SupplyForm 10.A: Sale of Electrical Energy
TOTAL / AVERAGE
Uttar Gujarat Vij Company Limited Page 149

True-up Year (FY 2015-16) at existing Tariff , Ensuing Year (FY 2017-18) at proposed Tariff
Street LightsTrue Up Year (FY 2015-
16) Ensuing Year (FY 2017-
18) A Physical Data1 Units Sold MU's 58.512 Units Sold during Peak hours (ToU)3 Connected Load MW 29.074 Contract Demand kW/kVA5 Actual Recorded Demand kW/kVA6 Normal Billed Demand kW/kVA7 Excess Billed Demand kW/kVA8 Total Billed Demand kW/kVA9 Number of Single Phase Consumers10 Number of Three Phase Consumers11 Total Number of Consumers 13,505.0012 Power Factor %13 Monthly Consumption per consumer kWh 361.0514 Connected Load per Consumer HP/kW15 Normal Billed Demand per Consumer kW/kVA16 Excess Billed Demand per Consumer kW/kVA17 Total Billed Demand per Consumer kW/kVA
B Sales Revenue1 Fixed Charge / Demand Charge Rs. In Cr. 0.222 Excess Demand Charge Rs. In Cr. -3 Total Fixed Charge / Demand Charge Rs. In Cr. 0.224 Energy Charge Rs. In Cr. 23.705 Time of Use Charge Rs. In Cr. -6 Power Factor Adjustment Rs. In Cr. -7 Energy + ToU + PF Adjustment Charge ( 4+5+6) Rs. In Cr. 23.708 Fuel Cost Adjustment Rs. In Cr. 8.379 Total Charge Rs. In Cr. 32.2810 Prompt Payment Discount, if Any. Rs. In Cr. -11 Net Sale of Energy Rs. In Cr. 32.28
C Sales Revenue1 Fixed Charge / Demand Charge Paise per unit 3.702 Excess Demand Charge Paise per unit -3 Total Fixed Charge / Demand Charge Paise per unit 3.704 Energy Charge Paise per unit 405.005 Time of Use Charge Paise per unit -6 Power Factor Adjustment Paise per unit -7 Energy + ToU + PF Adjustment Charge ( 4+5+6) Paise per unit 405.008 Fuel Cost Adjustment Paise per unit 143.009 Total Charge Paise per unit 551.7010 Prompt Payment Discount, if Any. Paise per unit -11 Net Sale of Energy Paise per unit 551.70
UTTAR GUJARAT VIJ COMPANY LIMITEDMEHSANA
MYT Petition, True-up Petition Formats - Distribution & Retail SupplyForm 10.A: Sale of Electrical Energy
TOTAL / AVERAGE
Uttar Gujarat Vij Company Limited Page 150
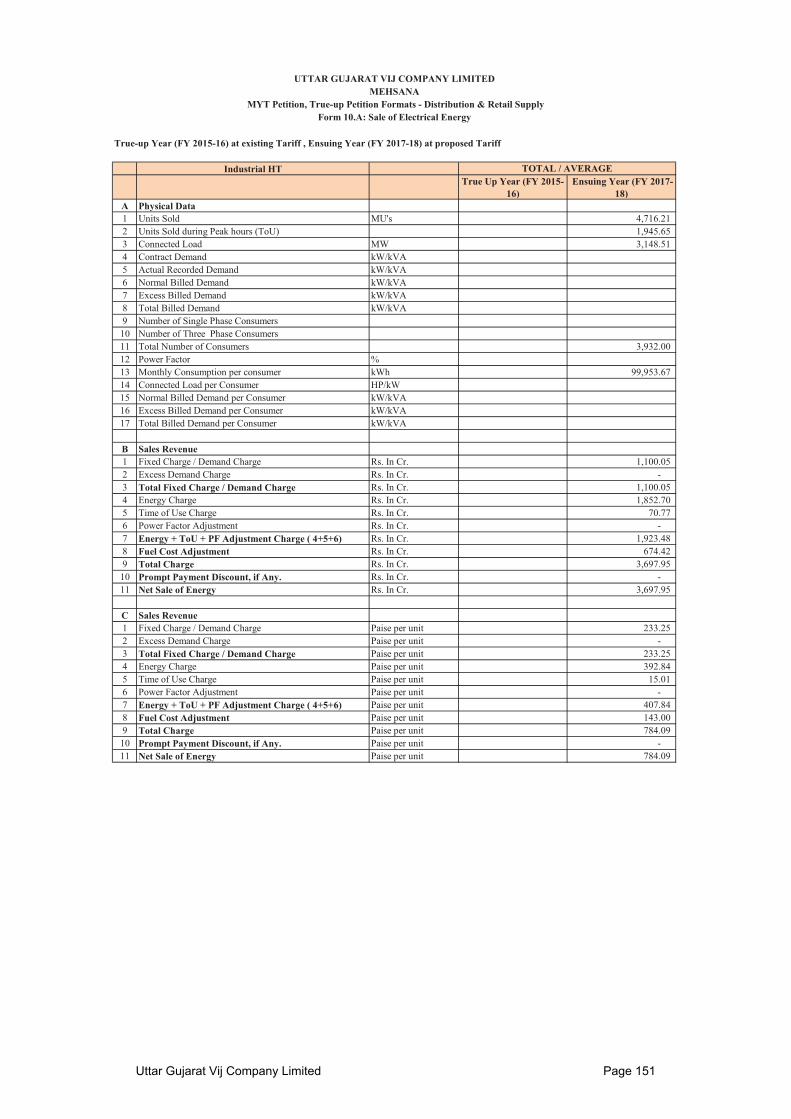
True-up Year (FY 2015-16) at existing Tariff , Ensuing Year (FY 2017-18) at proposed Tariff
Industrial HTTrue Up Year (FY 2015-
16) Ensuing Year (FY 2017-
18) A Physical Data1 Units Sold MU's 4,716.212 Units Sold during Peak hours (ToU) 1,945.653 Connected Load MW 3,148.514 Contract Demand kW/kVA5 Actual Recorded Demand kW/kVA6 Normal Billed Demand kW/kVA7 Excess Billed Demand kW/kVA8 Total Billed Demand kW/kVA9 Number of Single Phase Consumers10 Number of Three Phase Consumers11 Total Number of Consumers 3,932.0012 Power Factor %13 Monthly Consumption per consumer kWh 99,953.6714 Connected Load per Consumer HP/kW15 Normal Billed Demand per Consumer kW/kVA16 Excess Billed Demand per Consumer kW/kVA17 Total Billed Demand per Consumer kW/kVA
B Sales Revenue1 Fixed Charge / Demand Charge Rs. In Cr. 1,100.052 Excess Demand Charge Rs. In Cr. -3 Total Fixed Charge / Demand Charge Rs. In Cr. 1,100.054 Energy Charge Rs. In Cr. 1,852.705 Time of Use Charge Rs. In Cr. 70.776 Power Factor Adjustment Rs. In Cr. -7 Energy + ToU + PF Adjustment Charge ( 4+5+6) Rs. In Cr. 1,923.488 Fuel Cost Adjustment Rs. In Cr. 674.429 Total Charge Rs. In Cr. 3,697.9510 Prompt Payment Discount, if Any. Rs. In Cr. -11 Net Sale of Energy Rs. In Cr. 3,697.95
C Sales Revenue1 Fixed Charge / Demand Charge Paise per unit 233.252 Excess Demand Charge Paise per unit -3 Total Fixed Charge / Demand Charge Paise per unit 233.254 Energy Charge Paise per unit 392.845 Time of Use Charge Paise per unit 15.016 Power Factor Adjustment Paise per unit -7 Energy + ToU + PF Adjustment Charge ( 4+5+6) Paise per unit 407.848 Fuel Cost Adjustment Paise per unit 143.009 Total Charge Paise per unit 784.0910 Prompt Payment Discount, if Any. Paise per unit -11 Net Sale of Energy Paise per unit 784.09
UTTAR GUJARAT VIJ COMPANY LIMITEDMEHSANA
MYT Petition, True-up Petition Formats - Distribution & Retail SupplyForm 10.A: Sale of Electrical Energy
TOTAL / AVERAGE
Uttar Gujarat Vij Company Limited Page 151
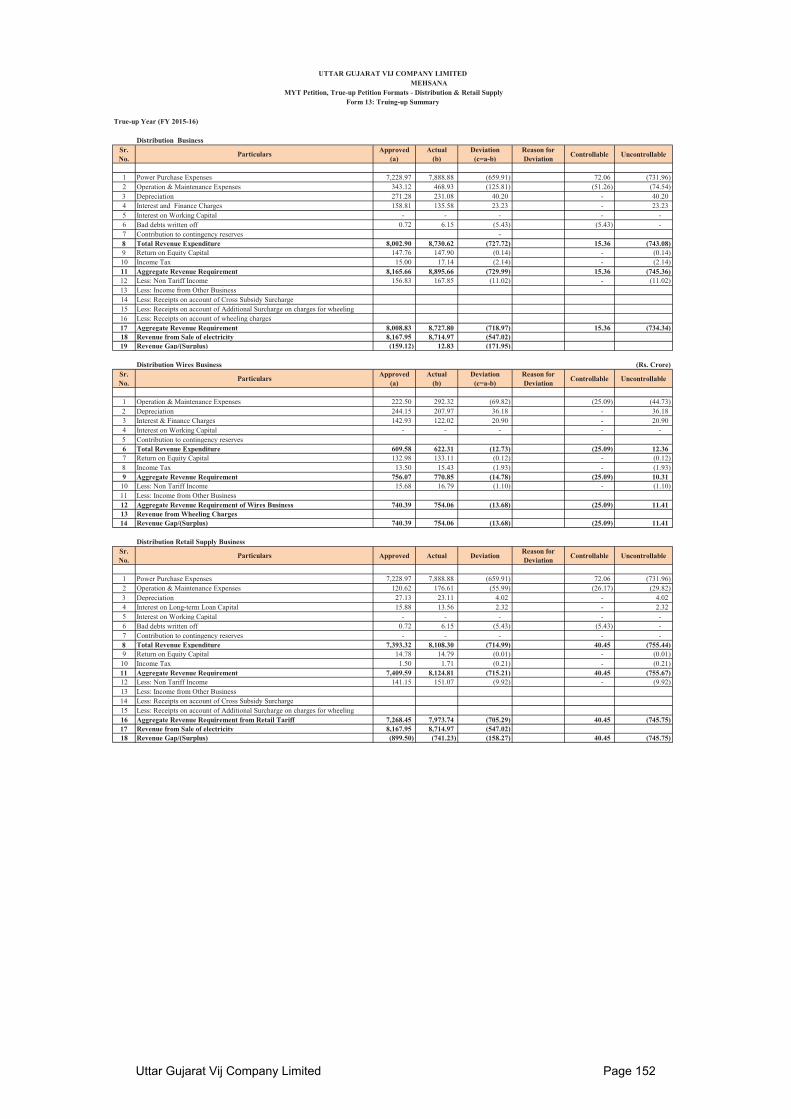
True-up Year (FY 2015-16)
Distribution BusinessSr. No. Particulars Approved
(a)Actual
(b)Deviation
(c=a-b)Reason for Deviation Controllable Uncontrollable
1 Power Purchase Expenses 7,228.97 7,888.88 (659.91) 72.06 (731.96)2 Operation & Maintenance Expenses 343.12 468.93 (125.81) (51.26) (74.54)3 Depreciation 271.28 231.08 40.20 - 40.204 Interest and Finance Charges 158.81 135.58 23.23 - 23.235 Interest on Working Capital - - - - -6 Bad debts written off 0.72 6.15 (5.43) (5.43) -7 Contribution to contingency reserves -8 Total Revenue Expenditure 8,002.90 8,730.62 (727.72) 15.36 (743.08)9 Return on Equity Capital 147.76 147.90 (0.14) - (0.14)10 Income Tax 15.00 17.14 (2.14) - (2.14)11 Aggregate Revenue Requirement 8,165.66 8,895.66 (729.99) 15.36 (745.36)12 Less: Non Tariff Income 156.83 167.85 (11.02) - (11.02)13 Less: Income from Other Business14 Less: Receipts on account of Cross Subsidy Surcharge15 Less: Receipts on account of Additional Surcharge on charges for wheeling16 Less: Receipts on account of wheeling charges17 Aggregate Revenue Requirement 8,008.83 8,727.80 (718.97) 15.36 (734.34)18 Revenue from Sale of electricity 8,167.95 8,714.97 (547.02)19 Revenue Gap/(Surplus) (159.12) 12.83 (171.95)
Distribution Wires Business (Rs. Crore)Sr. No. Particulars Approved
(a)Actual
(b)Deviation
(c=a-b)Reason for Deviation Controllable Uncontrollable
1 Operation & Maintenance Expenses 222.50 292.32 (69.82) (25.09) (44.73)2 Depreciation 244.15 207.97 36.18 - 36.183 Interest & Finance Charges 142.93 122.02 20.90 - 20.904 Interest on Working Capital - - - - -5 Contribution to contingency reserves6 Total Revenue Expenditure 609.58 622.31 (12.73) (25.09) 12.367 Return on Equity Capital 132.98 133.11 (0.12) - (0.12)8 Income Tax 13.50 15.43 (1.93) - (1.93)9 Aggregate Revenue Requirement 756.07 770.85 (14.78) (25.09) 10.31
10 Less: Non Tariff Income 15.68 16.79 (1.10) - (1.10)11 Less: Income from Other Business12 Aggregate Revenue Requirement of Wires Business 740.39 754.06 (13.68) (25.09) 11.4113 Revenue from Wheeling Charges14 Revenue Gap/(Surplus) 740.39 754.06 (13.68) (25.09) 11.41
Distribution Retail Supply BusinessSr. No. Particulars Approved Actual Deviation Reason for
Deviation Controllable Uncontrollable
1 Power Purchase Expenses 7,228.97 7,888.88 (659.91) 72.06 (731.96)2 Operation & Maintenance Expenses 120.62 176.61 (55.99) (26.17) (29.82)3 Depreciation 27.13 23.11 4.02 - 4.024 Interest on Long-term Loan Capital 15.88 13.56 2.32 - 2.325 Interest on Working Capital - - - - -6 Bad debts written off 0.72 6.15 (5.43) (5.43) -7 Contribution to contingency reserves - - - - -8 Total Revenue Expenditure 7,393.32 8,108.30 (714.99) 40.45 (755.44)9 Return on Equity Capital 14.78 14.79 (0.01) - (0.01)
10 Income Tax 1.50 1.71 (0.21) - (0.21)11 Aggregate Revenue Requirement 7,409.59 8,124.81 (715.21) 40.45 (755.67)12 Less: Non Tariff Income 141.15 151.07 (9.92) - (9.92)13 Less: Income from Other Business14 Less: Receipts on account of Cross Subsidy Surcharge15 Less: Receipts on account of Additional Surcharge on charges for wheeling16 Aggregate Revenue Requirement from Retail Tariff 7,268.45 7,973.74 (705.29) 40.45 (745.75)17 Revenue from Sale of electricity 8,167.95 8,714.97 (547.02)18 Revenue Gap/(Surplus) (899.50) (741.23) (158.27) 40.45 (745.75)
UTTAR GUJARAT VIJ COMPANY LIMITEDMEHSANA
MYT Petition, True-up Petition Formats - Distribution & Retail SupplyForm 13: Truing-up Summary
Uttar Gujarat Vij Company Limited Page 152


![NTPC Korba stacker Installation.ppt - Sheetal Wireless Communication at...Microsoft PowerPoint - NTPC Korba_stacker Installation.ppt [Compatibility Mode] Author Sukinavas Created Date](https://img.pdfslide.us/doc/110x75/5aa0b3127f8b9a84178e90f8/ntpc-korba-stacker-sheetal-wireless-communication-atmicrosoft-powerpoint-.jpg)