Embed Size (px)
Citation preview

Utilizing SWAT to Enhance Stakeholder-based Watershed
Protection Planning
North Central TexasWater Quality Project
Clint WolfeProject Coordinator
Texas AgriLife Urban Solutions Center - DallasThe Texas A&M University System

North Central TexasWater Quality Project
• Proactive approach to solving water quality issues opposed to regulatory action through a TMDL (Total Maximum Daily Load)
• Trend of increasing Chlorophyll a levels in Cedar Creek Reservoir• Listing on the 303 (d) Water Quality list for impairments
Developing a Watershed Plan

North Central TexasWater Quality Project
• People and organizations that have a stake in the outcome of the watershed protection plan
– General Public– Municipalities and Counties– Resource Managers– Agriculture– Environmental– Developers– Landowners– State and Federal Agencies
Who is a Stakeholder

North Central TexasWater Quality Project
• Balanced representation from the varying “interest” groups• Manageable size for decision-making purposes• All stakeholders provide input
Stakeholder Group Composition
North Central TexasWater Quality Project
• Participate in the analysis of problems• Contribute ideas to the creation and implementation of the WPP
– Evaluate options for managing pollutants as outlined by research team– Suggest alternative management measures for your watershed– Integrate existing programs or plans into the WPP– Provide input on various components of the WPP
Stakeholder Roles
North Central TexasWater Quality Project
• Not 100% accurate• Explain the Model Limitations• Talk About Input Data and Where it was Obtained• Explain Its Not a Weather Model – Does Not Predict the Future
Helping Stakeholders Understand SWAT

Upland Processes
SWAT Watershed System
Channel/Flood PlainProcesses
North Central TexasWater Quality Project
• Land Use/Land Cover• Fertilization Rates• Crops Grown• Livestock Numbers and Types• Areas with Septic Systems• Changing Land Use• Currently Implemented Practices
Engage Stakeholders – Data Input
North Central TexasWater Quality Project
• Keep it Simple yet Informative• Don’t Overwhelm Stakeholders with “Extra” Information• Utilize Graphs and Charts
Presenting SWAT Data Output
North Central TexasWater Quality Project
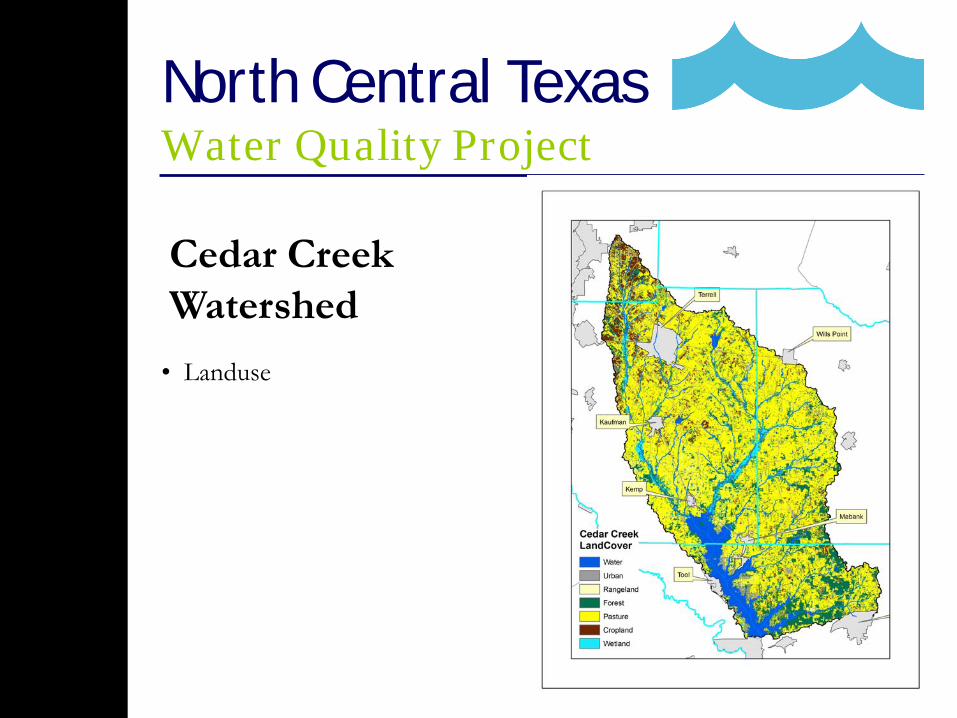
Cedar CreekWatershed• Landuse
North Central TexasWater Quality Project
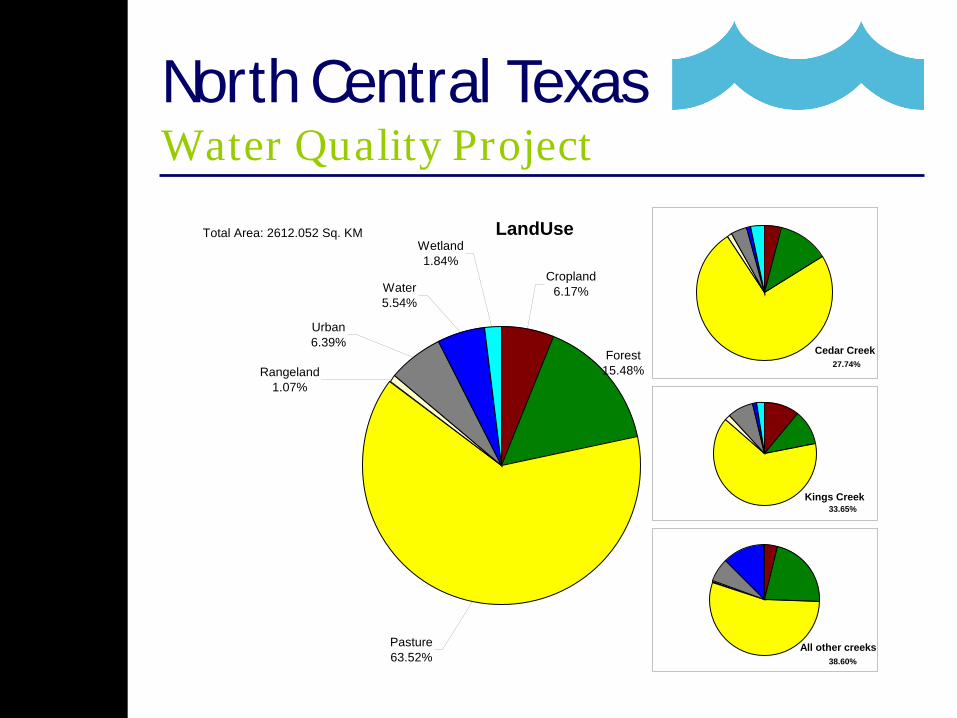
LandUse
Urban6.39%
Rangeland1.07%
Forest15.48%
Pasture63.52%
Cropland6.17%Water
5.54%
Wetland1.84%
Cedar Creek
Kings Creek
All other creeks
Total Area: 2612.052 Sq. KM
27.74%
33.65%
38.60%
North Central TexasWater Quality Project
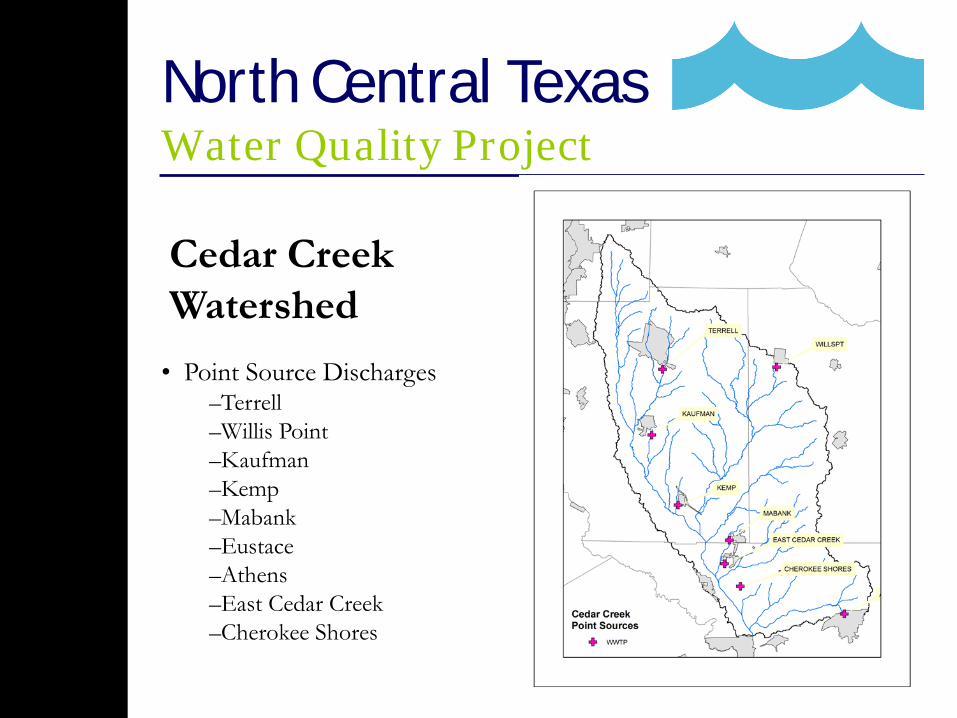
Cedar CreekWatershed• Point Source Discharges
–Terrell–Willis Point–Kaufman–Kemp–Mabank–Eustace–Athens–East Cedar Creek–Cherokee Shores
0
5
10
15
20
25
30
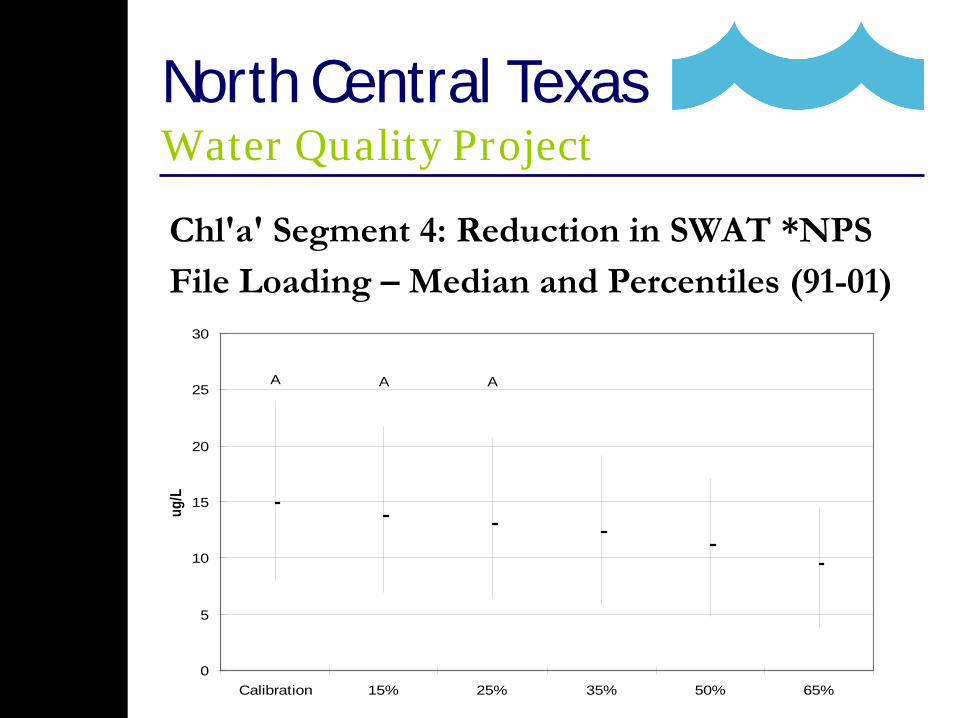
Calibration 15% 25% 35% 50% 65%
ug/L
A A A
North Central TexasWater Quality Project
Chl'a' Segment 4: Reduction in SWAT *NPS File Loading – Median and Percentiles (91-01)
North Central TexasWater Quality Project
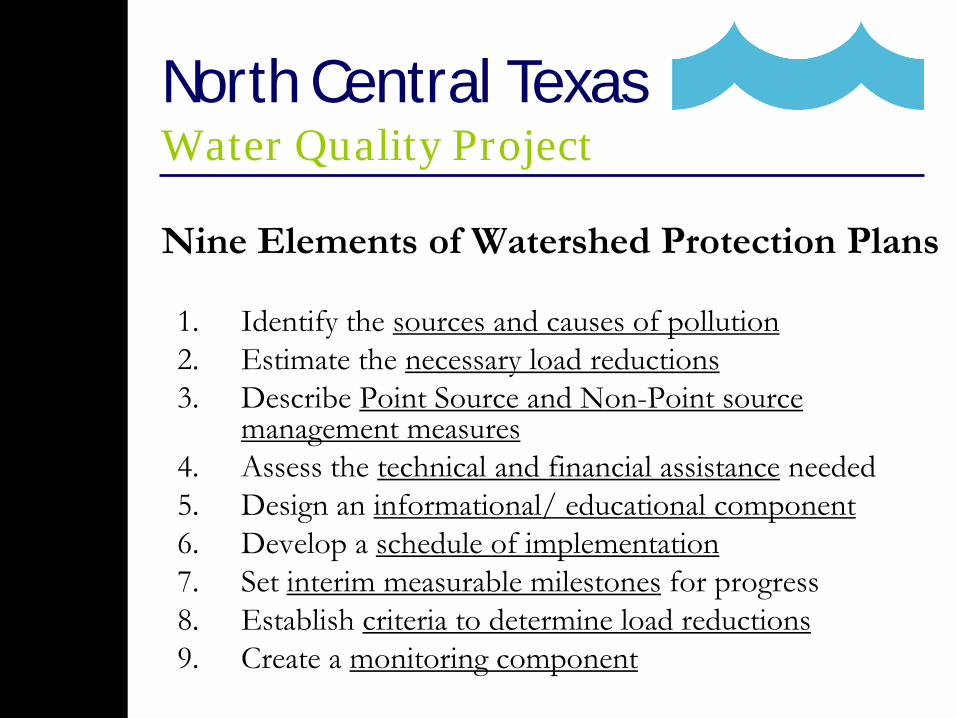
Nine Elements of Watershed Protection Plans
1. Identify the sources and causes of pollution2. Estimate the necessary load reductions3. Describe Point Source and Non-Point source
management measures4. Assess the technical and financial assistance needed 5. Design an informational/ educational component6. Develop a schedule of implementation7. Set interim measurable milestones for progress8. Establish criteria to determine load reductions9. Create a monitoring component
North Central TexasWater Quality Project
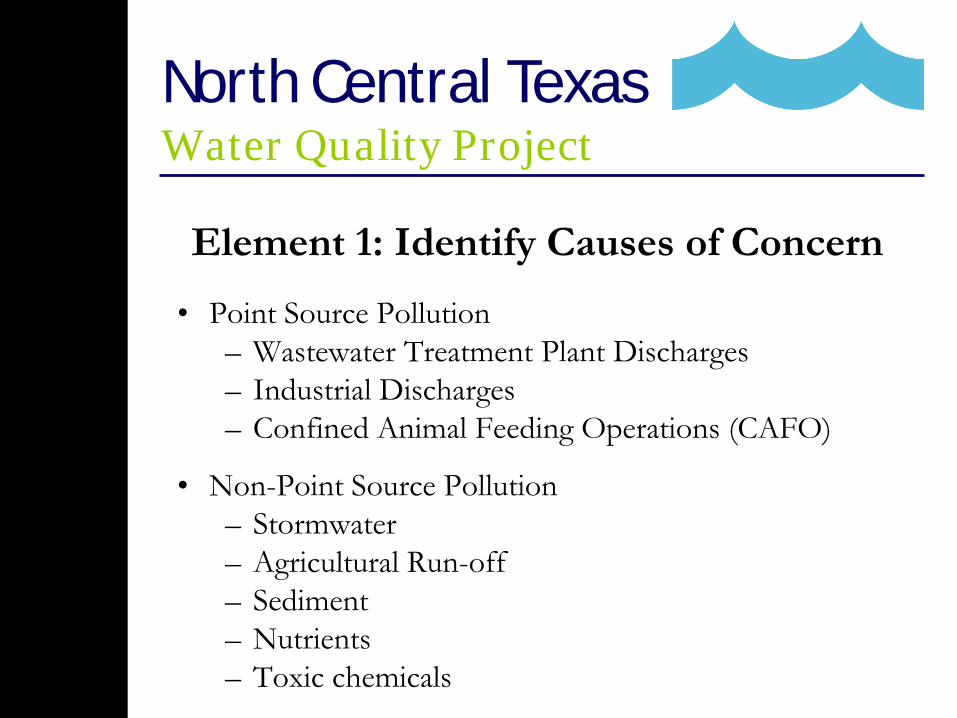
Element 1: Identify Causes of Concern• Point Source Pollution
– Wastewater Treatment Plant Discharges– Industrial Discharges– Confined Animal Feeding Operations (CAFO)
• Non-Point Source Pollution– Stormwater– Agricultural Run-off– Sediment– Nutrients– Toxic chemicals
North Central TexasWater Quality Project
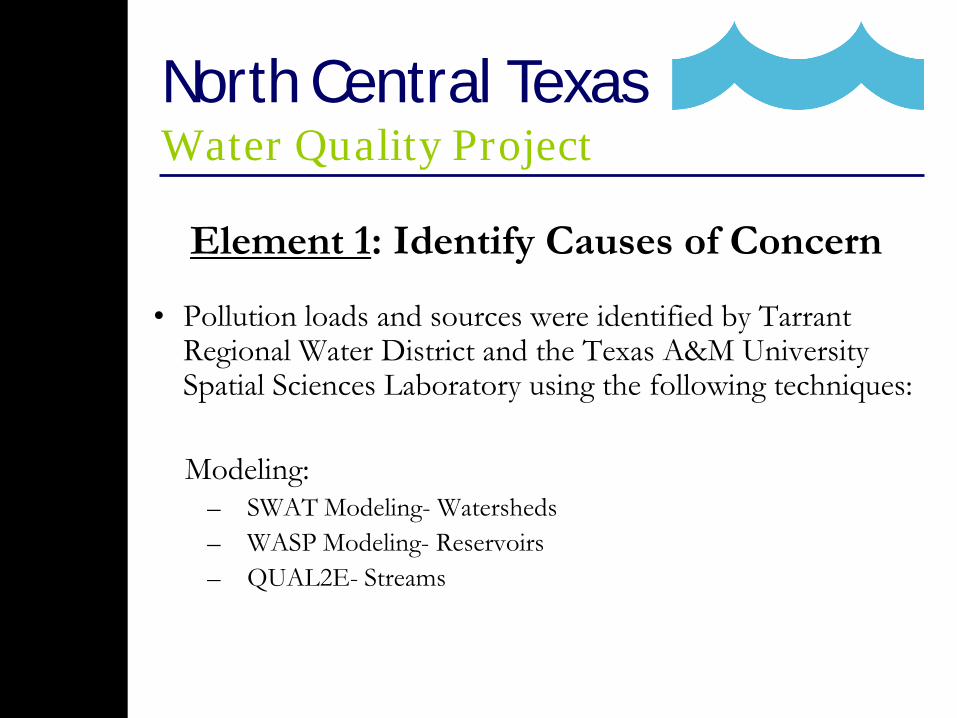
Element 1: Identify Causes of Concern
• Pollution loads and sources were identified by Tarrant Regional Water District and the Texas A&M University Spatial Sciences Laboratory using the following techniques:
Modeling:– SWAT Modeling- Watersheds– WASP Modeling- Reservoirs– QUAL2E- Streams
North Central TexasWater Quality Project
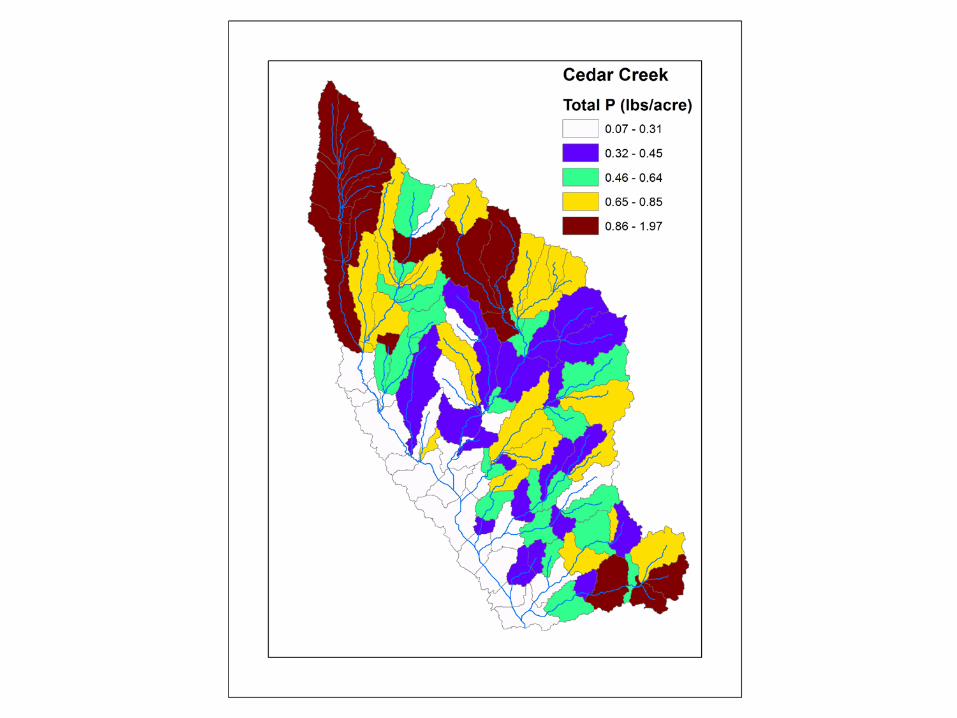
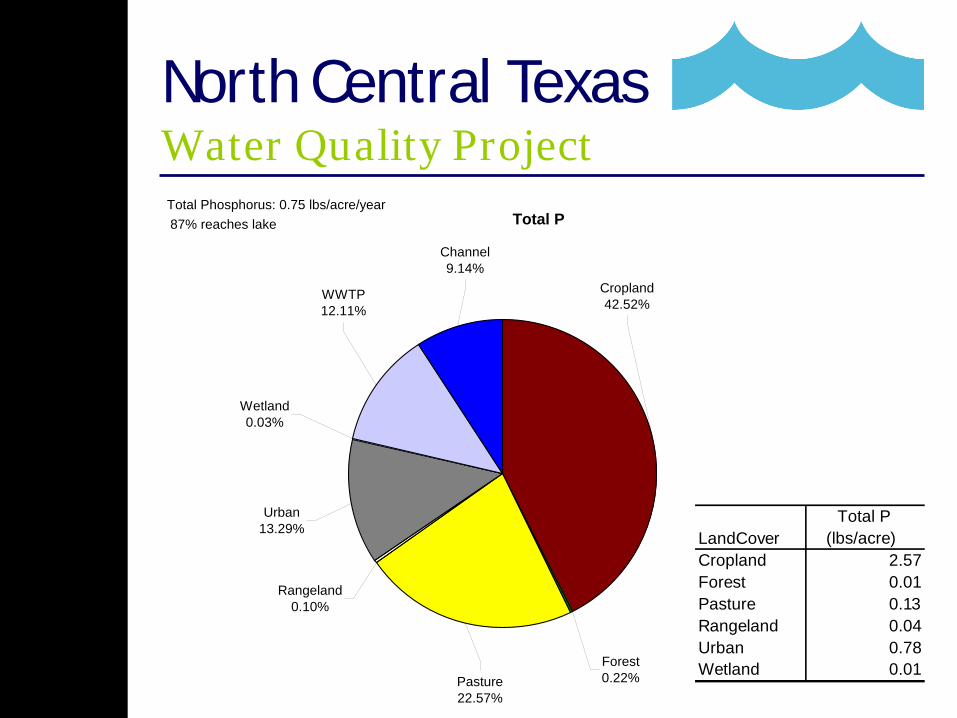
Total P
Urban13.29%
Rangeland0.10%
Channel9.14%
WWTP12.11%
Forest0.22%Pasture
22.57%
Cropland42.52%
Wetland0.03%
87% reaches lakeTotal Phosphorus: 0.75 lbs/acre/year
LandCoverTotal P
(lbs/acre)Cropland 2.57Forest 0.01Pasture 0.13Rangeland 0.04Urban 0.78Wetland 0.01
North Central TexasWater Quality Project
Element 2: Estimate Load Reductions
Load Reductions based on:• SWAT model outputs• Effectiveness of Best Management Practices (BMP)
tied to land use and changes
North Central TexasWater Quality Project
Element 3: Nonpoint Source ManagementBest Management Practices Implementation
• Structural • Behavioral
North Central TexasWater Quality Project
Element 3: Point Source Management
• Infrastructure upgrades to WWTP’s• Permitting programs• Stormwater development planning
North Central TexasWater Quality Project
Selection and Prioritization of Best Management Practices
Targeting Sub-basins
North Central TexasWater Quality Project
• 6% of the Watershed – 40% of Total Sediment Yield– 23% of Total Nitrogen Yield– 42% of Total Phosphorus Yield
• Cropland Erosion rate is 5.35 mt/ac/yr– Equivalent to .8 to 1.1 mm of topsoil per year
Cropland
North Central TexasWater Quality Project
Cropland BMP’s
• Filter Strips• Contour Farming• Terracing• Grassed Waterways• Crop Residue Management• Cropland Conversion to Pasture• Fertilizer/ Nutrient Management

North Central TexasWater Quality Project
Sub-basins With More Than 10% Cropland Area
North Central TexasWater Quality Project
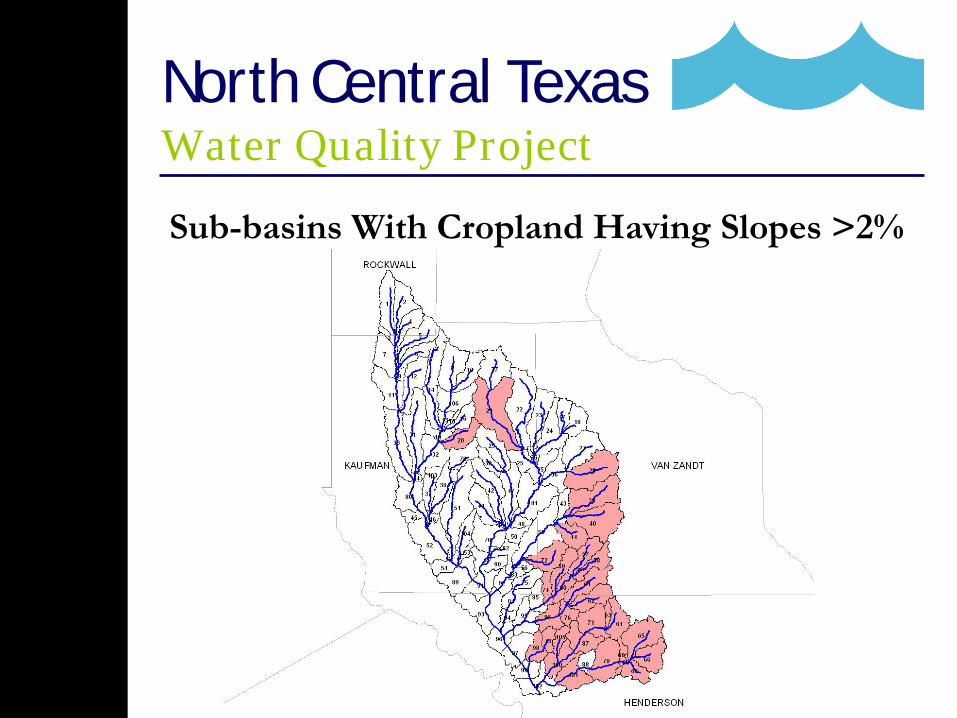
Sub-basins With Cropland Having Slopes >2%
North Central TexasWater Quality Project
• 62% of the Watershed – 16% of Total Sediment Yield– 44% of Total Nitrogen Yield– 23% of Total Phosphorus Yield
Pasture and Rangeland
North Central TexasWater Quality Project
Pasture and Rangeland BMP’s• Prescribed Grazing• Fencing• Water Facility• Fertilizer/ Nutrient Management• Pasture Planting• Range Planting• Grassed Waterway• Riparian Buffer strips

North Central TexasWater Quality Project
Sub-basins With More Than 75% Pasture Area
North Central TexasWater Quality Project
• 751 km of channels in the watershed – 35% of Total Sediment Yield– 5.5% of Total Nitrogen Yield– 9% of Total Phosphorus Yield
Channels
North Central TexasWater Quality Project
• Riparian Buffers• Channel Stabilization• Shoreline Protection• On and Off Channel Water and Sedimentation Control
Basins
Channel BMPs

North Central TexasWater Quality Project
Channel Erosion

North Central TexasWater Quality Project
• Total Area 2612.052 Sq. km– Pasture 63.52%– Rangeland 1.07%– Urban 6.39%– Water 5.54%– Wetlands 1.84%– Cropland 6.17%– Forest 15.48%
Watershed
North Central TexasWater Quality Project
Watershed BMP’s
• Wetlands• Grade Stabilization• Urban Nutrient Management

North Central TexasWater Quality Project
Distribution of Urban Land Cover
![Aplication of SWAT model to the hidrologic study of rivers ... · quality on watershed modelling using SWAT [Soil and Water Assessment Tool] applied to this area. The model is a daily](https://img.pdfslide.us/doc/110x75/5f3c252ae659ee1e5305e18a/aplication-of-swat-model-to-the-hidrologic-study-of-rivers-quality-on-watershed.jpg)