Embed Size (px)
Citation preview
Documented by
The Village of Sauget Physical/Chemical Plant
May, 2015
Utilizing ScaleBlaster to Reduce
Lime Scale Build-up in an
Industrial Wastewater Treatment Plant
Utilizing ScaleBlaster to Reduce
Lime Scale Build-up in an
Industrial Wastewater Treatment Plant
Case Study: Utilizing ScaleBlaster to
Reduce Lime Scale Build-Up in an
Industrial Wastewater Treatment Plant
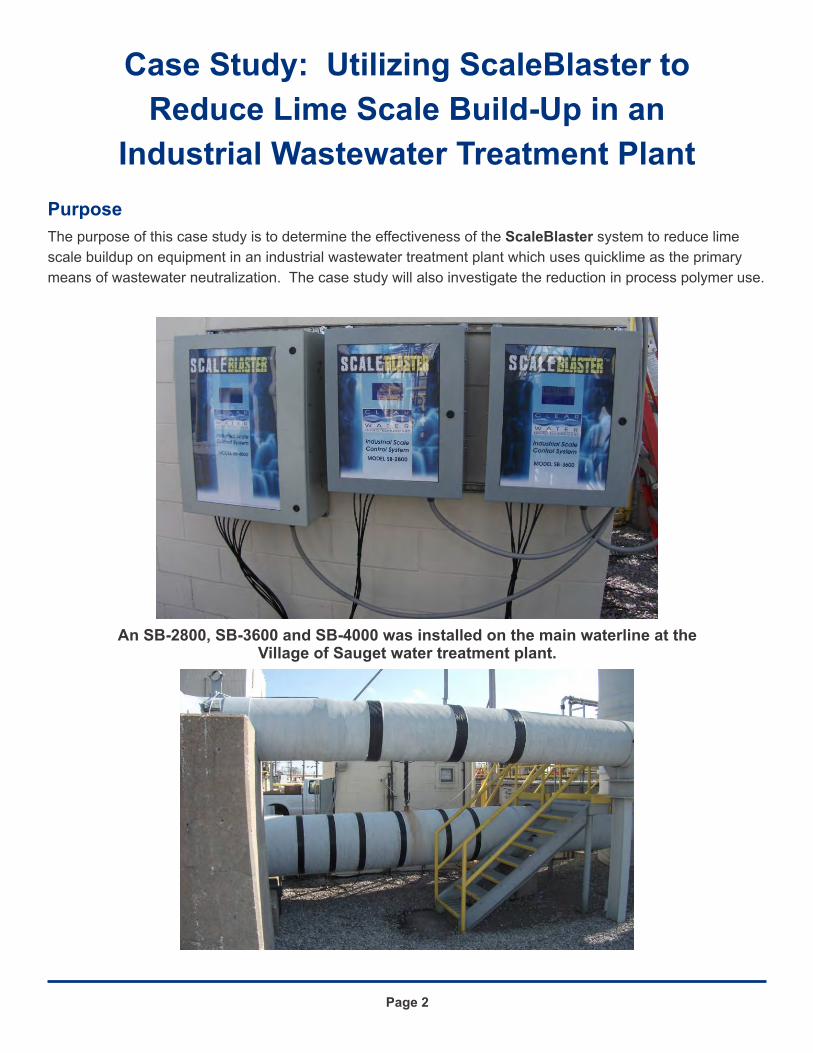
Purpose
The purpose of this case study is to determine the effectiveness of the ScaleBlaster system to reduce lime
scale buildup on equipment in an industrial wastewater treatment plant which uses quicklime as the primary
means of wastewater neutralization. The case study will also investigate the reduction in process polymer use.
Page 2
An SB-2800, SB-3600 and SB-4000 was installed on the main waterline at the Village of Sauget water treatment plant.
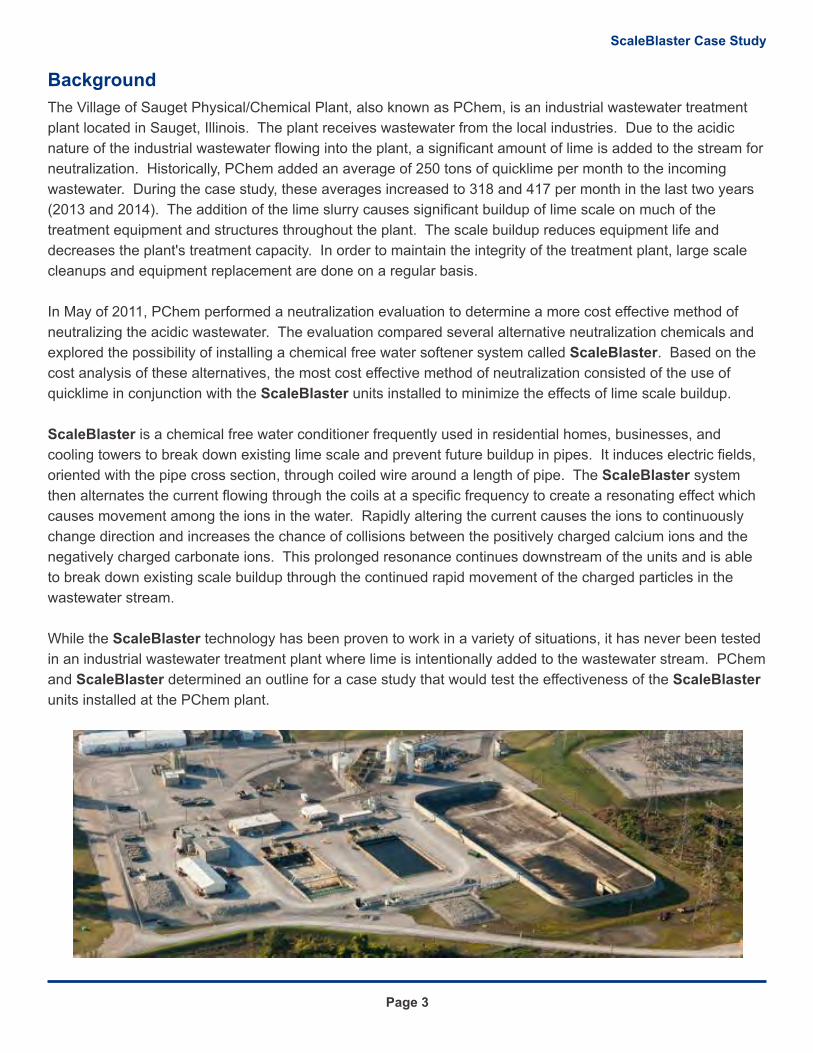
Background
The Village of Sauget Physical/Chemical Plant, also known as PChem, is an industrial wastewater treatment
plant located in Sauget, Illinois. The plant receives wastewater from the local industries. Due to the acidic
nature of the industrial wastewater flowing into the plant, a significant amount of lime is added to the stream for
neutralization. Historically, PChem added an average of 250 tons of quicklime per month to the incoming
wastewater. During the case study, these averages increased to 318 and 417 per month in the last two years
(2013 and 2014). The addition of the lime slurry causes significant buildup of lime scale on much of the
treatment equipment and structures throughout the plant. The scale buildup reduces equipment life and
decreases the plant's treatment capacity. In order to maintain the integrity of the treatment plant, large scale
cleanups and equipment replacement are done on a regular basis.
In May of 2011, PChem performed a neutralization evaluation to determine a more cost effective method of
neutralizing the acidic wastewater. The evaluation compared several alternative neutralization chemicals and
explored the possibility of installing a chemical free water softener system called ScaleBlaster. Based on the
cost analysis of these alternatives, the most cost effective method of neutralization consisted of the use of
quicklime in conjunction with the ScaleBlaster units installed to minimize the effects of lime scale buildup.
ScaleBlaster is a chemical free water conditioner frequently used in residential homes, businesses, and
cooling towers to break down existing lime scale and prevent future buildup in pipes. It induces electric fields,
oriented with the pipe cross section, through coiled wire around a length of pipe. The ScaleBlaster system
then alternates the current flowing through the coils at a specific frequency to create a resonating effect which
causes movement among the ions in the water. Rapidly altering the current causes the ions to continuously
change direction and increases the chance of collisions between the positively charged calcium ions and the
negatively charged carbonate ions. This prolonged resonance continues downstream of the units and is able
to break down existing scale buildup through the continued rapid movement of the charged particles in the
wastewater stream.
While the ScaleBlaster technology has been proven to work in a variety of situations, it has never been tested
in an industrial wastewater treatment plant where lime is intentionally added to the wastewater stream. PChem
and ScaleBlaster determined an outline for a case study that would test the effectiveness of the ScaleBlaster
units installed at the PChem plant.
Page 3
ScaleBlaster Case Study
Case Study
Monitoring Methods
The case study covers a period of three years: February 2012 to February 2015. On February 23, 2012,
ScaleBlaster installed three units on the 20” and 30” influent fiberglass force mains which convey wastewater
from the influent wet well to the neutralization system. At the beginning of the study, two of the units were
installed on the 30” influent pipe and one was installed on the 20” influent pipe used only during rain events.
After a short period of time, it was decided that the unit installed on the 20” rain event pipe needed to be
moved to the 30” main pipe. Additionally, a fourth unit was installed on a lime recirculation pipe in an attempt to
treat the lime slurry.
Prior to installing the ScaleBlaster system, PChem determined a baseline rate of lime scale buildup on plant
equipment. After the units were installed, measurements were taken and compared to the baseline to
determine if the units were operating effectively. After making adjustments to the equipment, PChem continued
to monitor the lime scale buildup throughout the PChem plant to ensure the existing scale buildup was being
reduced and no additional scale was forming. PChem also monitored for any lime scale buildup and any
adverse effects to the biological system downstream at the municipal biological nutrient removal (BNR) plant,
American Bottoms Wastewater Treatment Facility, which receives the PChem effluent flow.
Immediately after the installation of the ScaleBlaster system, an unexpected observation was made: the plant
now required little-to-no process polymer to settle clarifier solids. According to testing, only a sixth of the
average amount of process polymer was needed. Potential to reduce process polymer was then added to the
case study.
Pchem fabricated measuring devices and determined 21 primary monitoring locations and seven alternate
locations dependent upon process configuration. The path of the water flow can change depending upon
which clarifier is in service. In order to capture each situation, monitoring locations were put along both paths
and checked according to which path the flow was taking. These devices consisted of metal pipes and wires
continuously submerged in the water along with fabricated measuring sticks to measure scale thickness on the
walls of the equipment. The scale buildup on the continuously submerged devices was measured on a regular
basis. Several visual observation areas were also included with these monitoring locations where PChem
personnel would photograph and note any visible changes in scale thickness. The goal was to monitor existing
lime scale breakdown and to verify that no additional buildup was forming. It was noticed that the
ScaleBlaster system caused the top layer of lime scale to become soft, allowing the measuring devices to
push through the scale, affecting the measurement accuracy. Many of the devices were used under water
where the only way of determining where the scale buildup ended was by feel. Prior to ScaleBlaster, the
measuring devices would touch the scale buildup and stop. After the installation of the units, the devices easily
pushed through the layer of scale. Buildup depth throughout the main channels was also inconsistent; the
scale is built up in waves. Based on these two measurement challenges, PChem developed a new monitoring
method.
The new method relied heavily on documented visual observations. Historically problematic areas such as
flocculation chamber chains, clarifier weirs, and the effluent flume were monitored continuously throughout the
case study, with each location being cleaned prior to monitoring. PChem also monitored the frequency of and
hours required for cleaning these areas throughout the case study period. As the process permitted, PChem
Page 4
Documented by the Village of Sauget Wastewater Treatment Plant
cleaned out large sections of the treatment process and visually monitored any buildup that occurred after
cleaning. Additional methods of determining ScaleBlaster effectiveness consisted of compiling historical data
pertaining to cleaning projects and comparing to similar data collected during the case study. To determine the
effect ScaleBlaster had on process polymer usage, PChem monitored the effluent suspended solids along
with the amount of process polymer used during the case study period and compared this to historical data.
PChem has never historically operated without the use of process polymer; therefor, historical data only
consists of effluent suspended solids with the use of process polymer. There is no historical data that shows
what the effluent suspended solids would have been without process polymer prior to the installation of the
ScaleBlaster units.
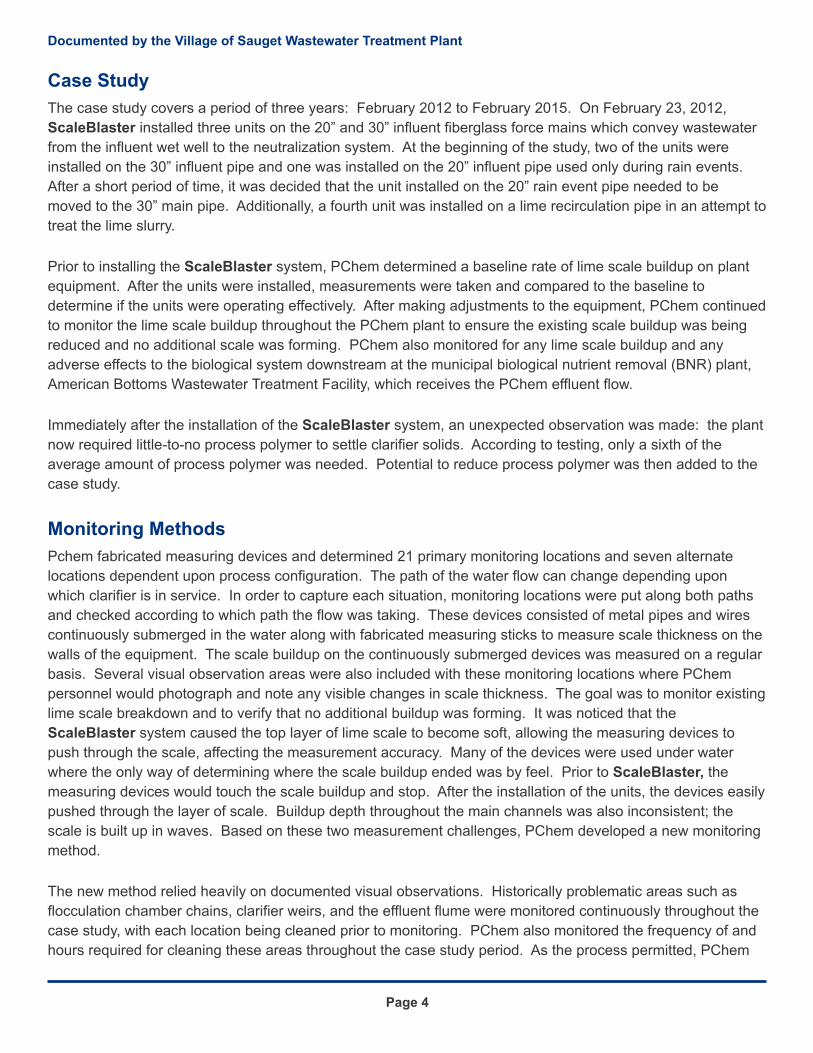
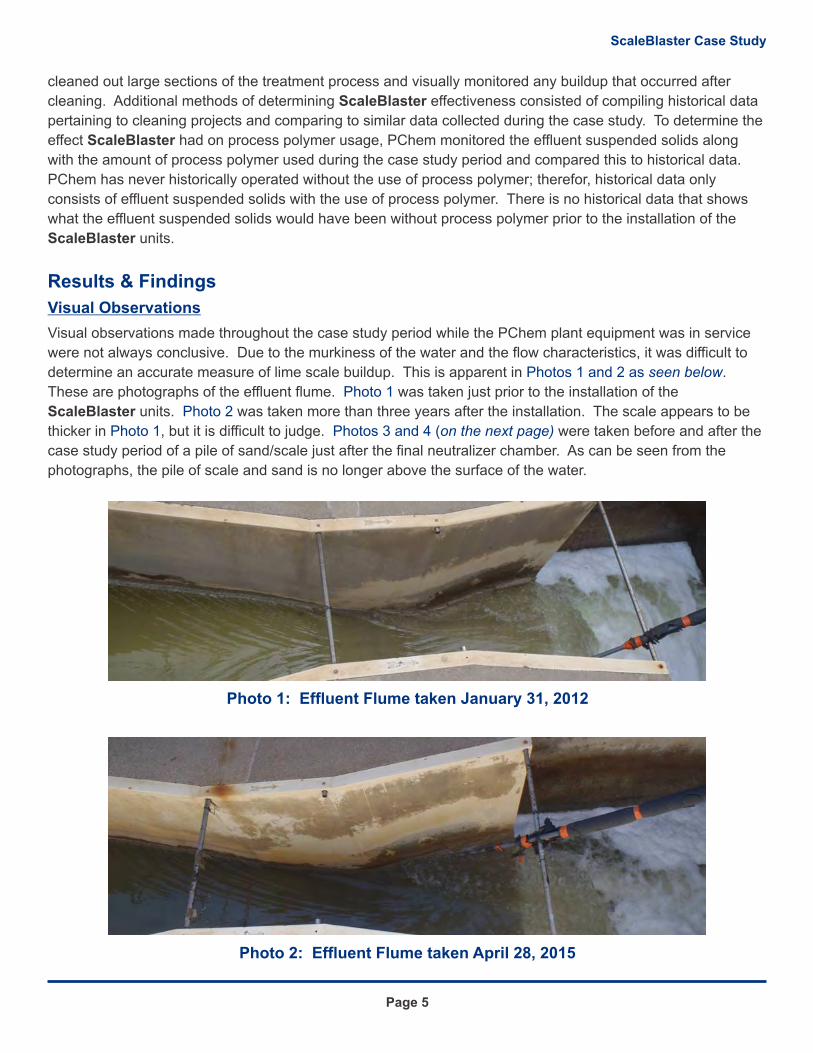
Visual observations made throughout the case study period while the PChem plant equipment was in service
were not always conclusive. Due to the murkiness of the water and the flow characteristics, it was difficult to
determine an accurate measure of lime scale buildup. This is apparent in .
These are photographs of the effluent flume. was taken just prior to the installation of the
ScaleBlaster units. was taken more than three years after the installation. The scale appears to be
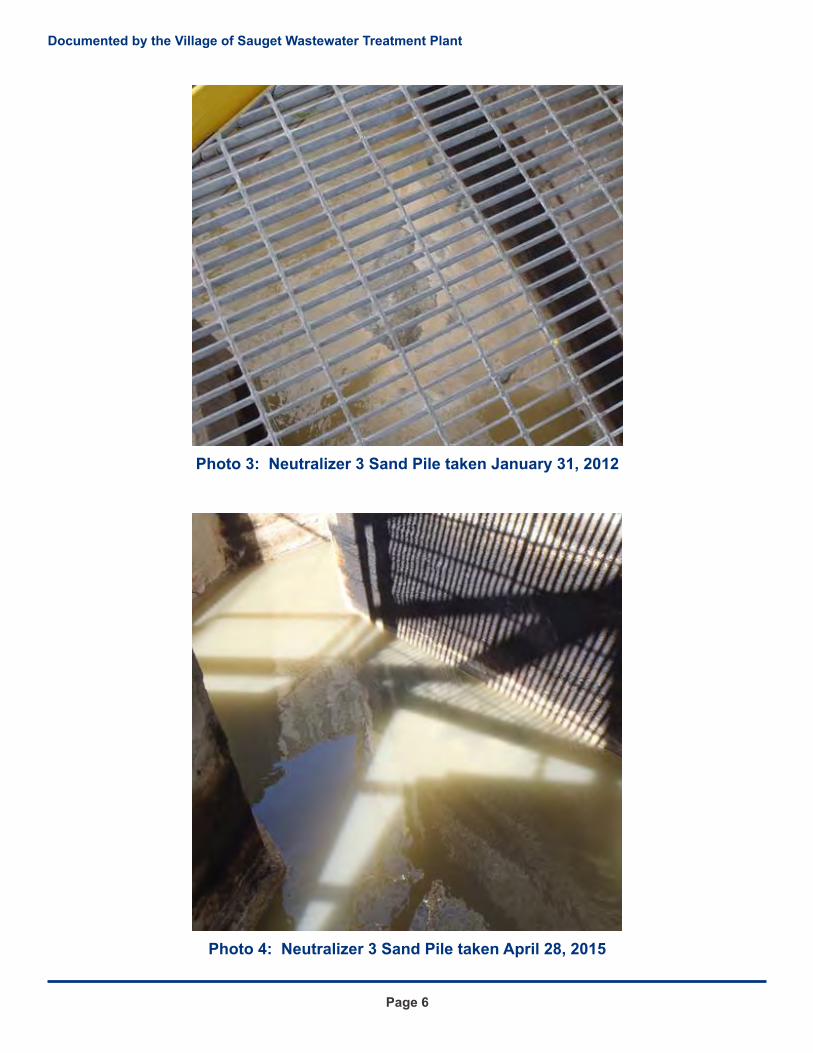
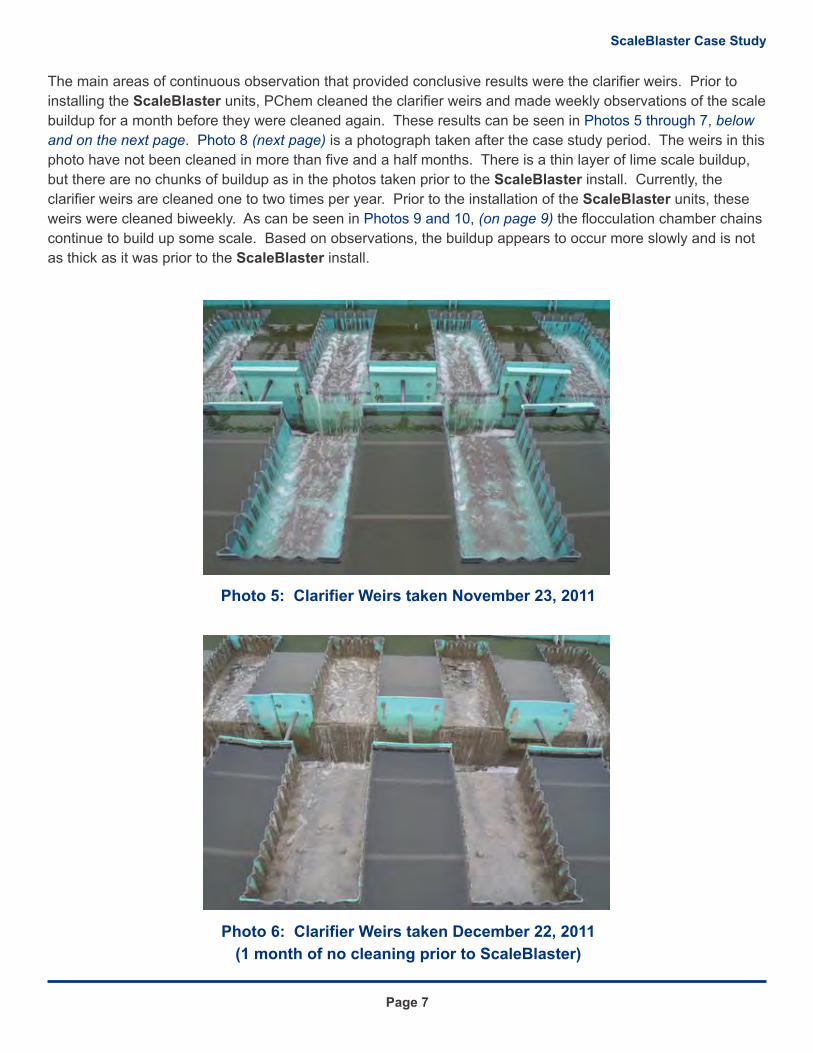
thicker in , but it is difficult to judge. were taken before and after the
case study period of a pile of sand/scale just after the final neutralizer chamber. As can be seen from the
photographs, the pile of scale and sand is no longer above the surface of the water.
Results & Findings
Visual Observations
Photos 1 and 2 as seen below
Photo 1
Photo 2
Photo 1 Photos 3 and 4 (on the next page)
Page 5
ScaleBlaster Case Study
Photo 1: Effluent Flume taken January 31, 2012
Photo 2: Effluent Flume taken April 28, 2015
Page 6
Photo 4: Neutralizer 3 Sand Pile taken April 28, 2015
Photo 3: Neutralizer 3 Sand Pile taken January 31, 2012
Documented by the Village of Sauget Wastewater Treatment Plant
The main areas of continuous observation that provided conclusive results were the clarifier weirs. Prior to
installing the ScaleBlaster units, PChem cleaned the clarifier weirs and made weekly observations of the scale
buildup for a month before they were cleaned again. These results can be seen in
. is a photograph taken after the case study period. The weirs in this
photo have not been cleaned in more than five and a half months. There is a thin layer of lime scale buildup,
but there are no chunks of buildup as in the photos taken prior to the ScaleBlaster install. Currently, the
clarifier weirs are cleaned one to two times per year. Prior to the installation of the ScaleBlaster units, these
weirs were cleaned biweekly. As can be seen in , the flocculation chamber chains
continue to build up some scale. Based on observations, the buildup appears to occur more slowly and is not
as thick as it was prior to the ScaleBlaster install.
Photos 5 through 7 below
and on the next page Photo 8 (next page)
Photos 9 and 10 (on page 9)
,
Photo 5: Clarifier Weirs taken November 23, 2011
Photo 6: Clarifier Weirs taken December 22, 2011
(1 month of no cleaning prior to ScaleBlaster)
Page 7
ScaleBlaster Case Study
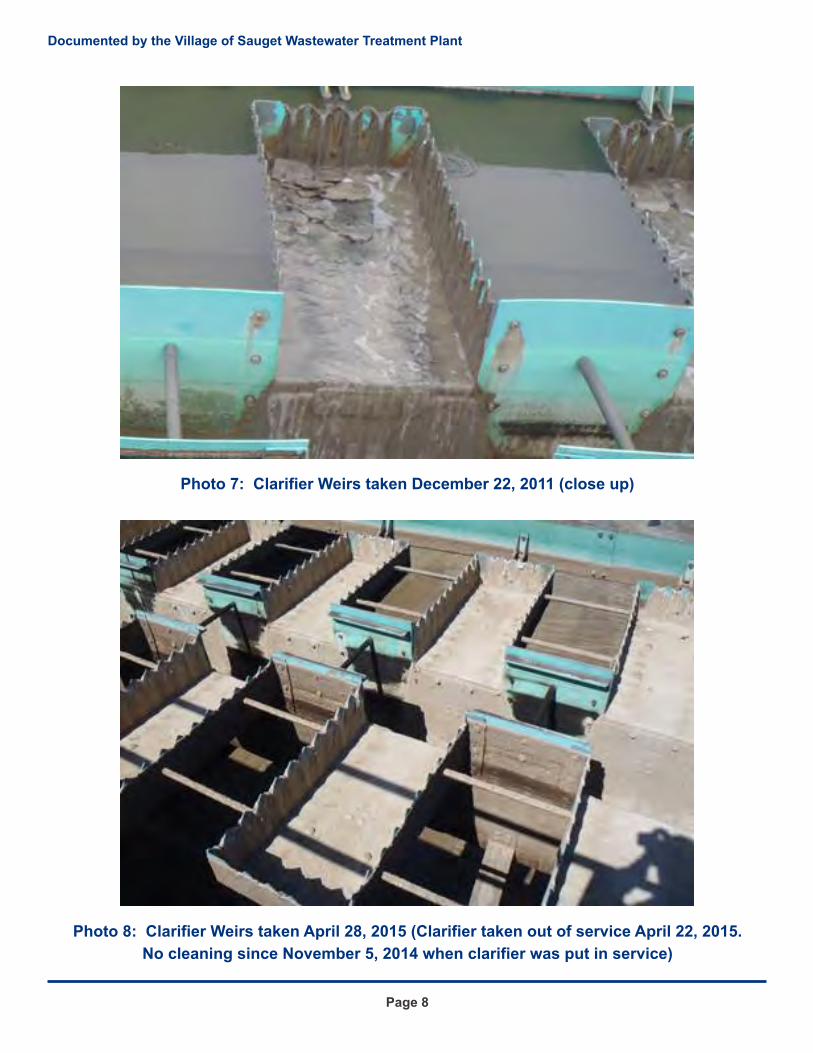
Photo 7: Clarifier Weirs taken December 22, 2011 (close up)
Photo 8: Clarifier Weirs taken April 28, 2015 (Clarifier taken out of service April 22, 2015.
No cleaning since November 5, 2014 when clarifier was put in service)
Page 8
Documented by the Village of Sauget Wastewater Treatment Plant
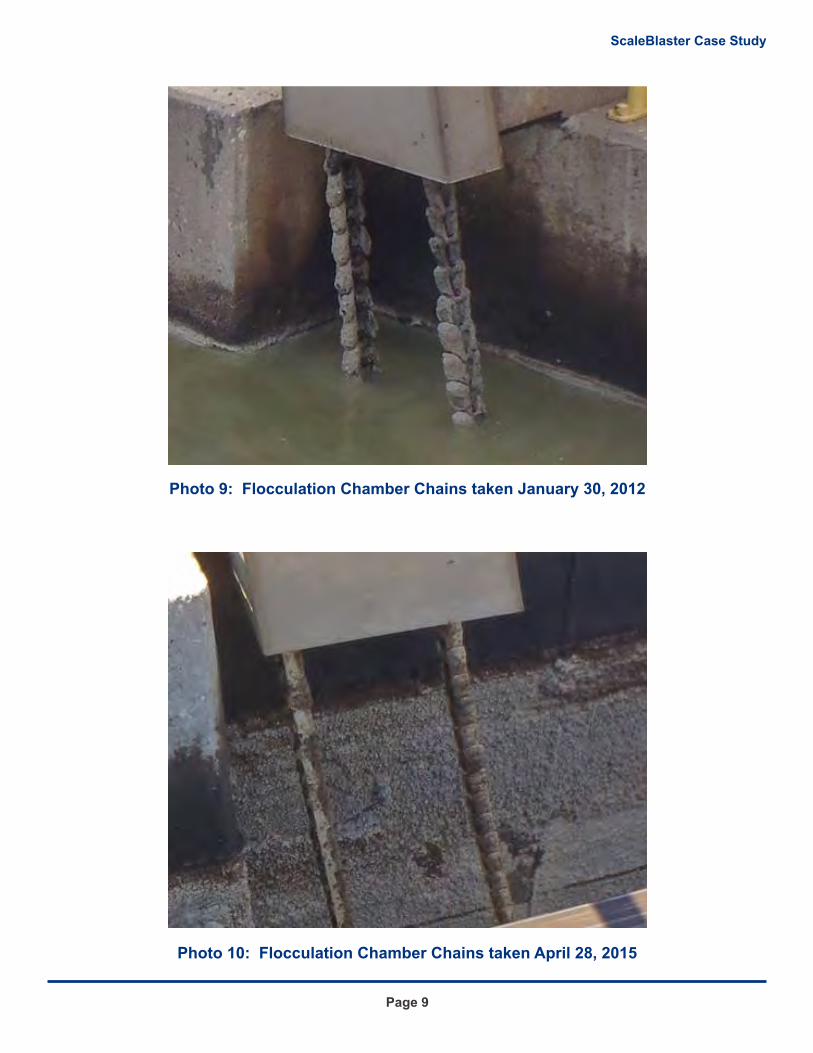
Photo 9: Flocculation Chamber Chains taken January 30, 2012
Photo 10: Flocculation Chamber Chains taken April 28, 2015
Page 9
ScaleBlaster Case Study
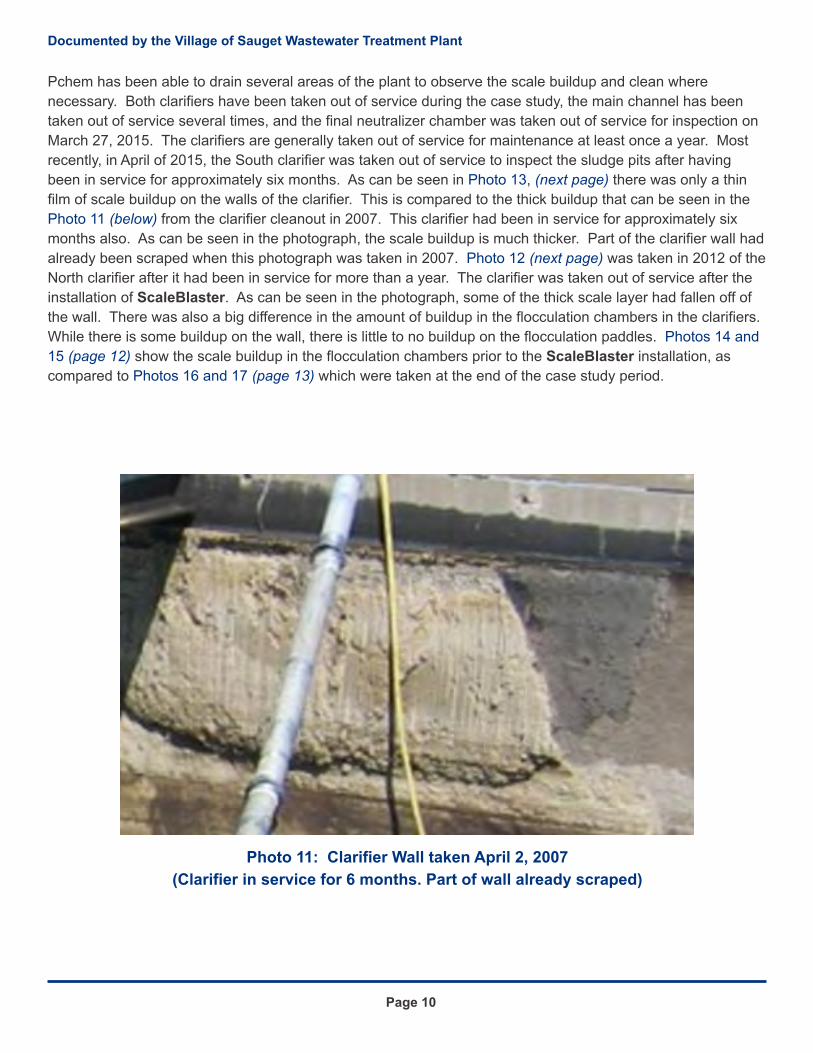
Pchem has been able to drain several areas of the plant to observe the scale buildup and clean where
necessary. Both clarifiers have been taken out of service during the case study, the main channel has been
taken out of service several times, and the final neutralizer chamber was taken out of service for inspection on
March 27, 2015. The clarifiers are generally taken out of service for maintenance at least once a year. Most
recently, in April of 2015, the South clarifier was taken out of service to inspect the sludge pits after having
been in service for approximately six months. As can be seen in , there was only a thin
film of scale buildup on the walls of the clarifier. This is compared to the thick buildup that can be seen in the
from the clarifier cleanout in 2007. This clarifier had been in service for approximately six
months also. As can be seen in the photograph, the scale buildup is much thicker. Part of the clarifier wall had
already been scraped when this photograph was taken in 2007. was taken in 2012 of the
North clarifier after it had been in service for more than a year. The clarifier was taken out of service after the
installation of ScaleBlaster. As can be seen in the photograph, some of the thick scale layer had fallen off of
the wall. There was also a big difference in the amount of buildup in the flocculation chambers in the clarifiers.
While there is some buildup on the wall, there is little to no buildup on the flocculation paddles.
show the scale buildup in the flocculation chambers prior to the ScaleBlaster installation, as
compared to which were taken at the end of the case study period.
Photo 13 (next page)
Photo 11 (below)
Photo 12 (next page)
Photos 14 and
15 (page 12)
Photos 16 and 17 (page 13)
Photo 11: Clarifier Wall taken April 2, 2007
(Clarifier in service for 6 months. Part of wall already scraped)
Page 10
Documented by the Village of Sauget Wastewater Treatment Plant
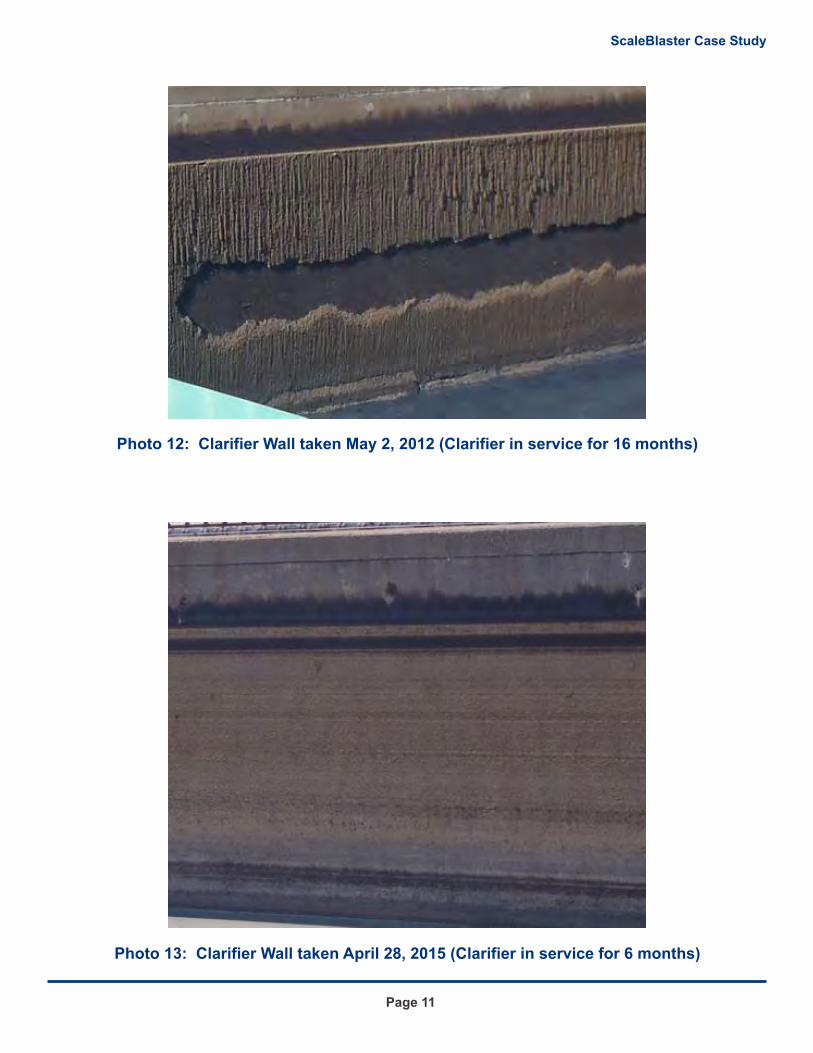
Photo 12: Clarifier Wall taken May 2, 2012 (Clarifier in service for 16 months)
Photo 13: Clarifier Wall taken April 28, 2015 (Clarifier in service for 6 months)
Page 11
ScaleBlaster Case Study
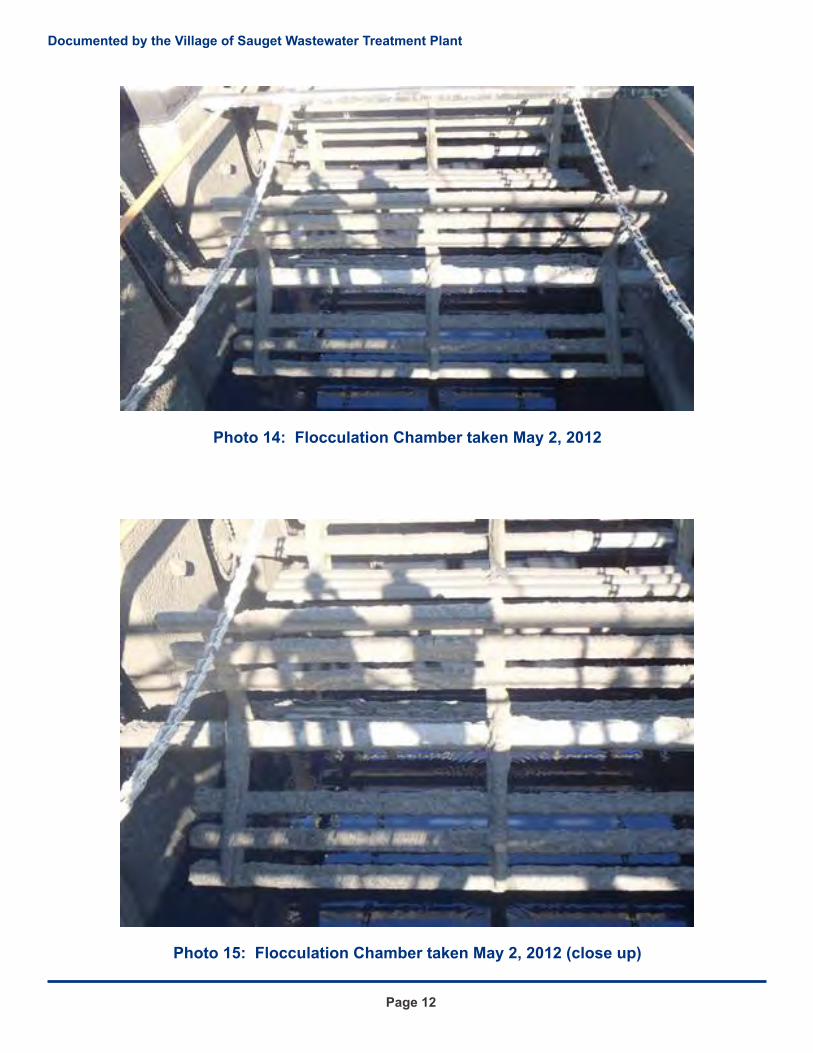
Photo 14: Flocculation Chamber taken May 2, 2012
Photo 15: Flocculation Chamber taken May 2, 2012 (close up)
Page 12
Documented by the Village of Sauget Wastewater Treatment Plant
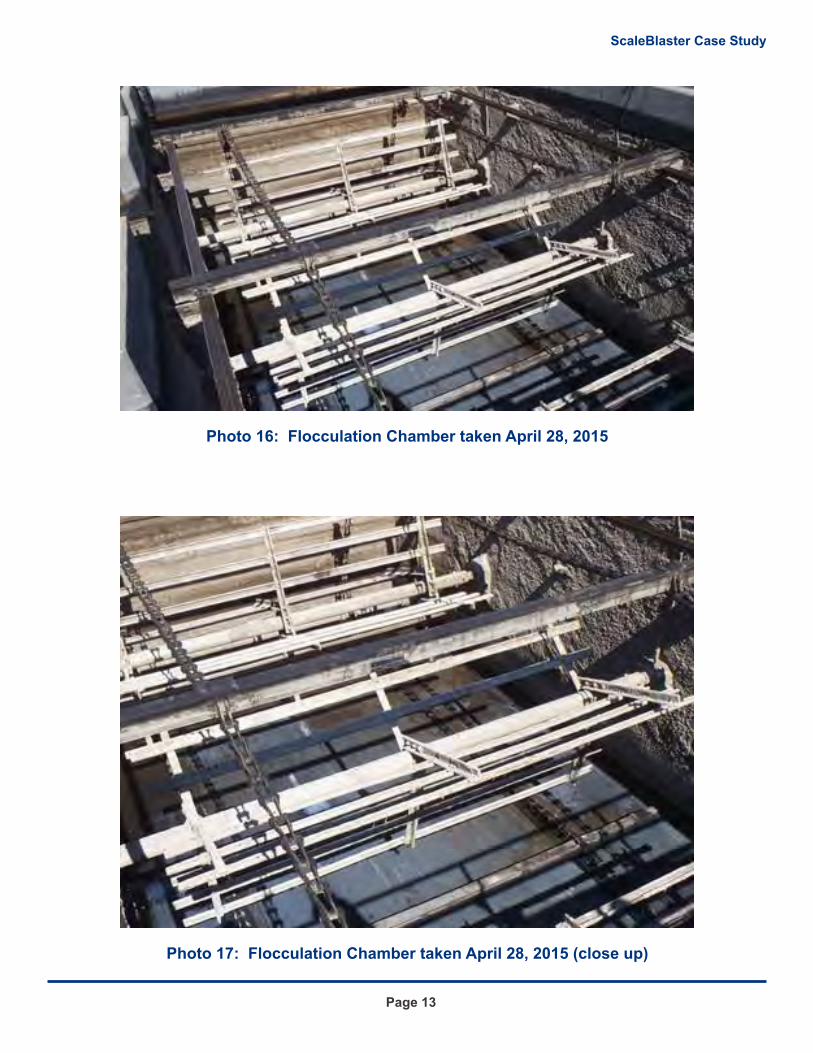
Photo 16: Flocculation Chamber taken April 28, 2015
Photo 17: Flocculation Chamber taken April 28, 2015 (close up)
Page 13
ScaleBlaster Case Study
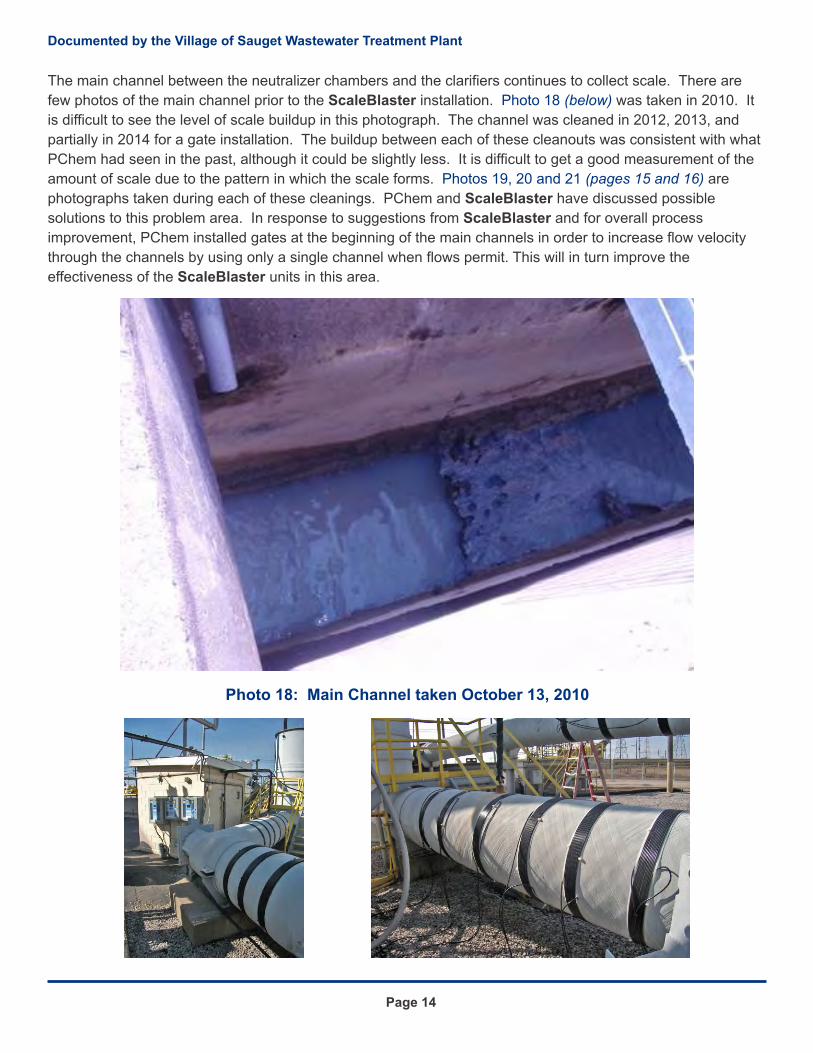
The main channel between the neutralizer chambers and the clarifiers continues to collect scale. There are
few photos of the main channel prior to the ScaleBlaster installation. was taken in 2010. It
is difficult to see the level of scale buildup in this photograph. The channel was cleaned in 2012, 2013, and
partially in 2014 for a gate installation. The buildup between each of these cleanouts was consistent with what
PChem had seen in the past, although it could be slightly less. It is difficult to get a good measurement of the
amount of scale due to the pattern in which the scale forms. are
photographs taken during each of these cleanings. PChem and ScaleBlaster have discussed possible
solutions to this problem area. In response to suggestions from ScaleBlaster and for overall process
improvement, PChem installed gates at the beginning of the main channels in order to increase flow velocity
through the channels by using only a single channel when flows permit. This will in turn improve the
effectiveness of the ScaleBlaster units in this area.
Photo 18 (below)
Photos 19, 20 and 21 (pages 15 and 16)
Photo 18: Main Channel taken October 13, 2010
Page 14
Documented by the Village of Sauget Wastewater Treatment Plant
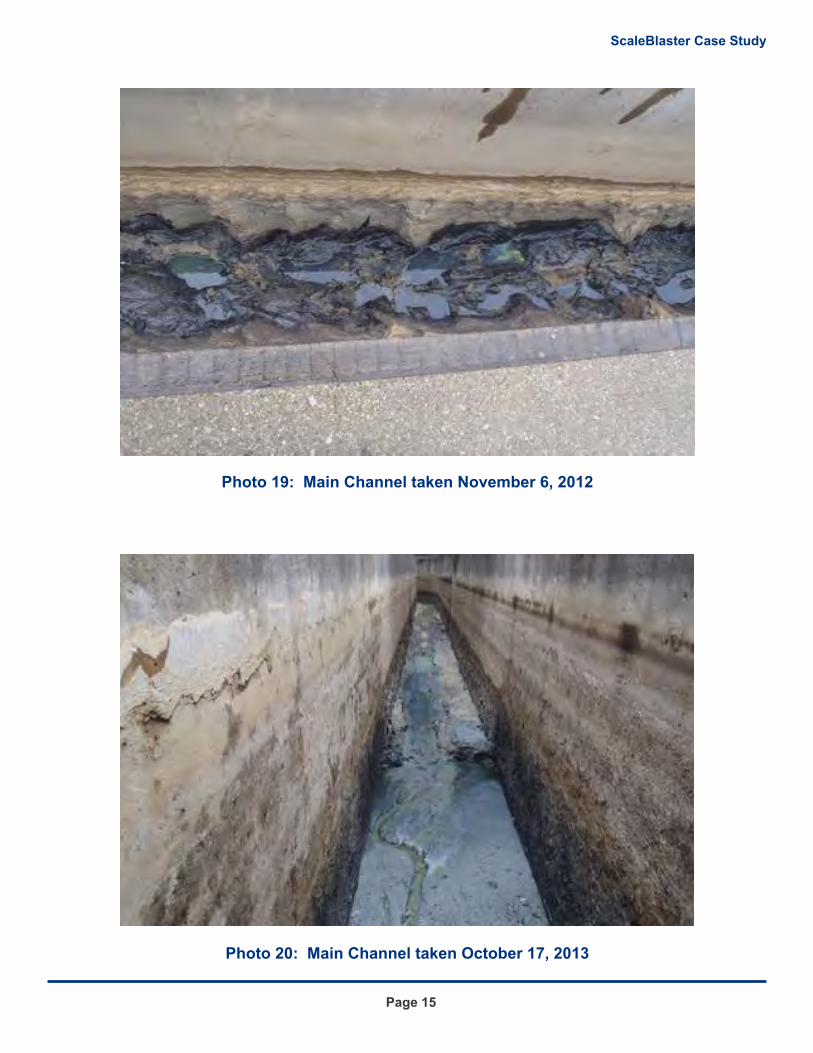
Photo 19: Main Channel taken November 6, 2012
Photo 20: Main Channel taken October 17, 2013
Page 15
ScaleBlaster Case Study
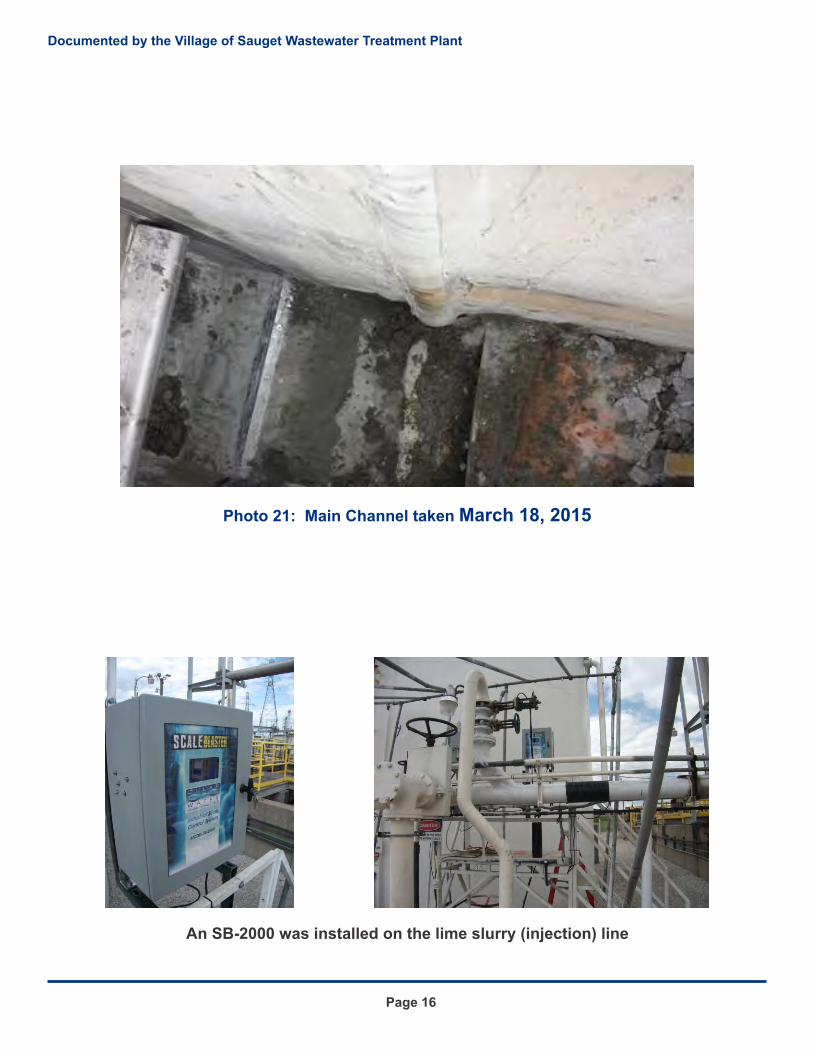
Photo 21: Main Channel taken March 18, 2015
Page 16
An SB-2000 was installed on the lime slurry (injection) line
Documented by the Village of Sauget Wastewater Treatment Plant
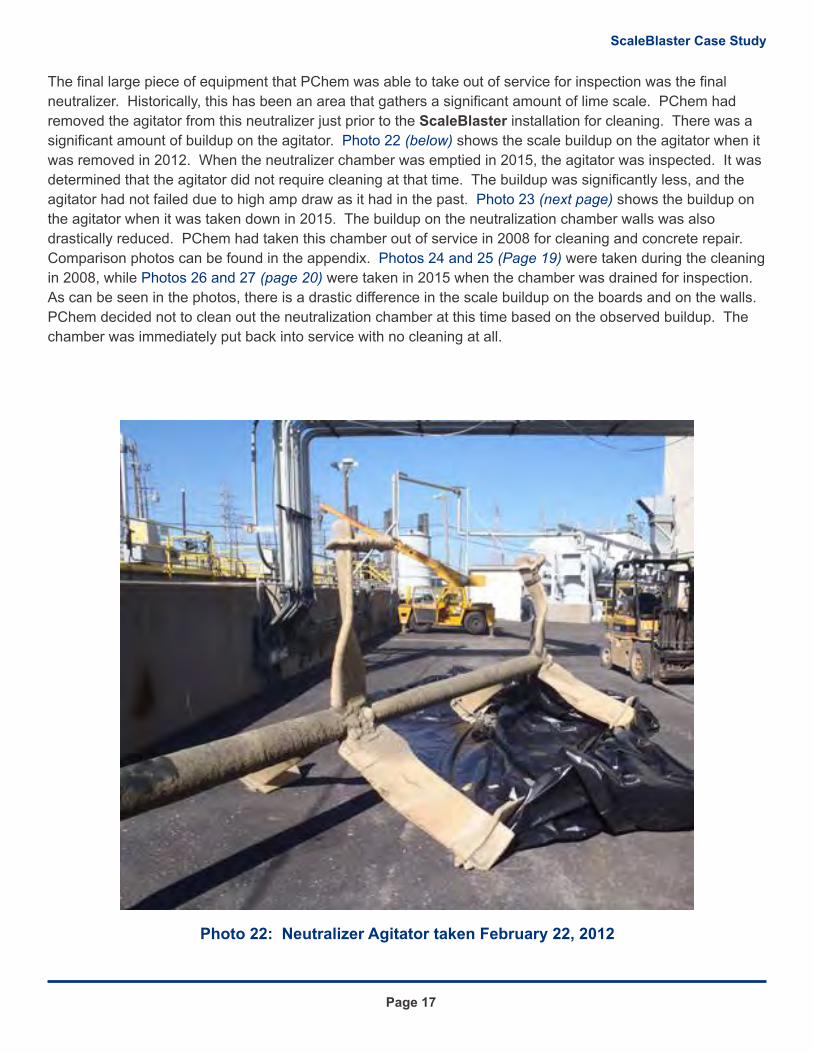
The final large piece of equipment that PChem was able to take out of service for inspection was the final
neutralizer. Historically, this has been an area that gathers a significant amount of lime scale. PChem had
removed the agitator from this neutralizer just prior to the ScaleBlaster installation for cleaning. There was a
significant amount of buildup on the agitator. shows the scale buildup on the agitator when it
was removed in 2012. When the neutralizer chamber was emptied in 2015, the agitator was inspected. It was
determined that the agitator did not require cleaning at that time. The buildup was significantly less, and the
agitator had not failed due to high amp draw as it had in the past. shows the buildup on
the agitator when it was taken down in 2015. The buildup on the neutralization chamber walls was also
drastically reduced. PChem had taken this chamber out of service in 2008 for cleaning and concrete repair.
Comparison photos can be found in the appendix. were taken during the cleaning
in 2008, while were taken in 2015 when the chamber was drained for inspection.
As can be seen in the photos, there is a drastic difference in the scale buildup on the boards and on the walls.
PChem decided not to clean out the neutralization chamber at this time based on the observed buildup. The
chamber was immediately put back into service with no cleaning at all.
Photo 22 (below)
Photo 23 (next page)
Photos 24 and 25 (Page 19)
Photos 26 and 27 (page 20)
Photo 22: Neutralizer Agitator taken February 22, 2012
Page 17
ScaleBlaster Case Study
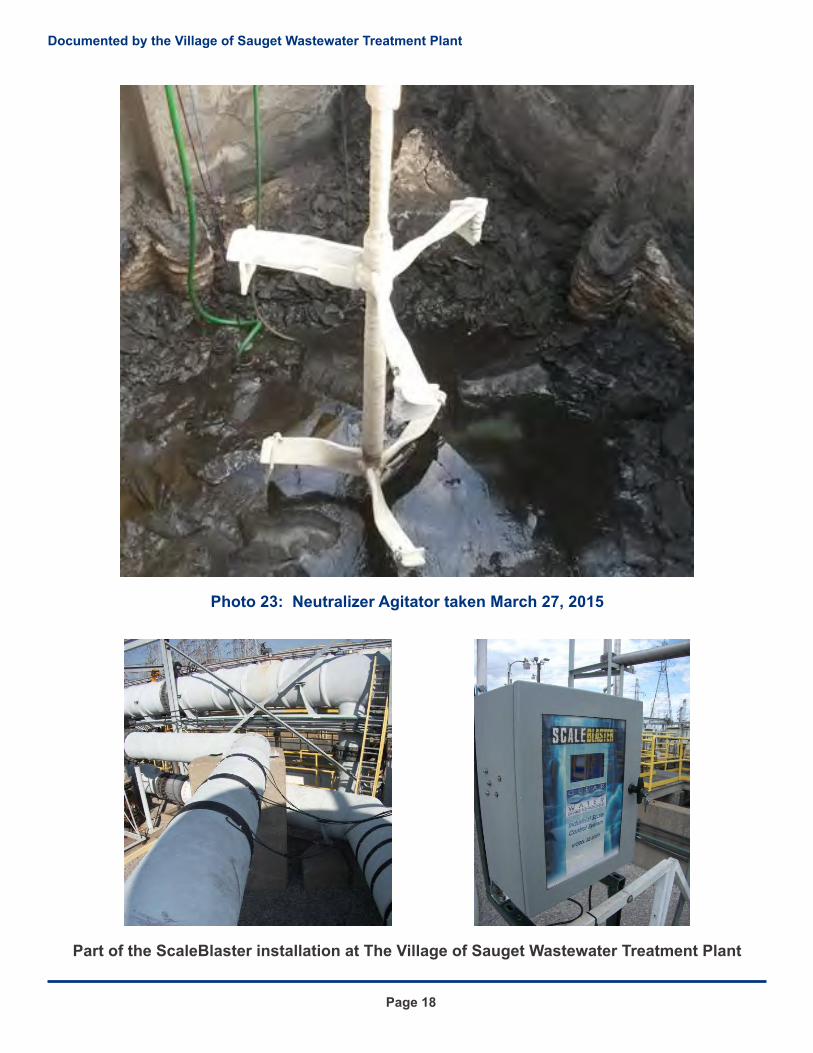
Photo 23: Neutralizer Agitator taken March 27, 2015
Page 18
Part of the ScaleBlaster installation at The Village of Sauget Wastewater Treatment Plant
Documented by the Village of Sauget Wastewater Treatment Plant
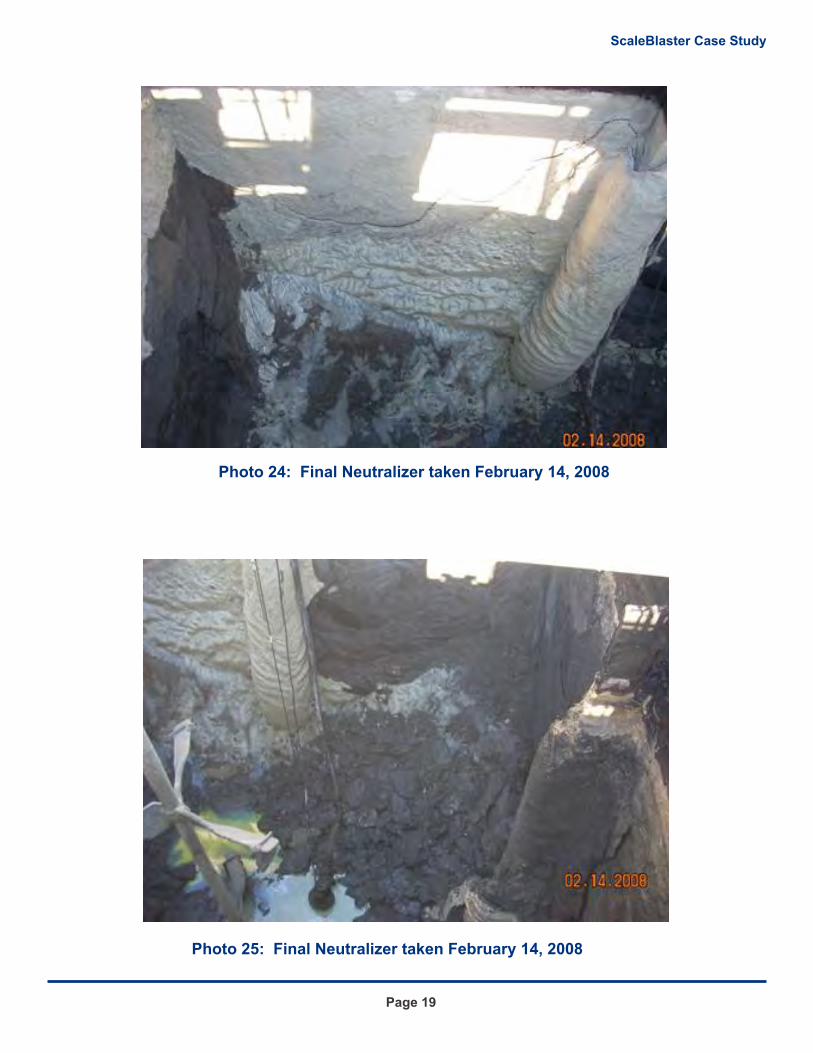
Photo 25: Final Neutralizer taken February 14, 2008
Page 19
Photo 24: Final Neutralizer taken February 14, 2008
ScaleBlaster Case Study
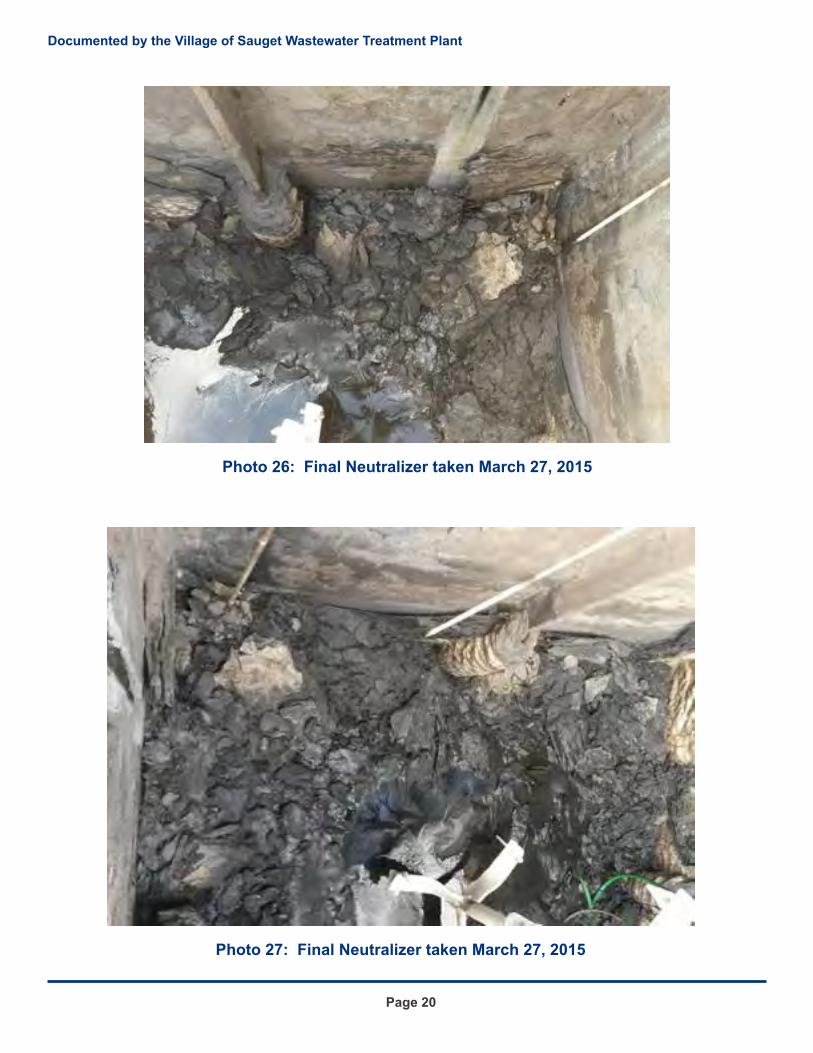
Photo 27: Final Neutralizer taken March 27, 2015
Page 20
Photo 26: Final Neutralizer taken March 27, 2015
Documented by the Village of Sauget Wastewater Treatment Plant
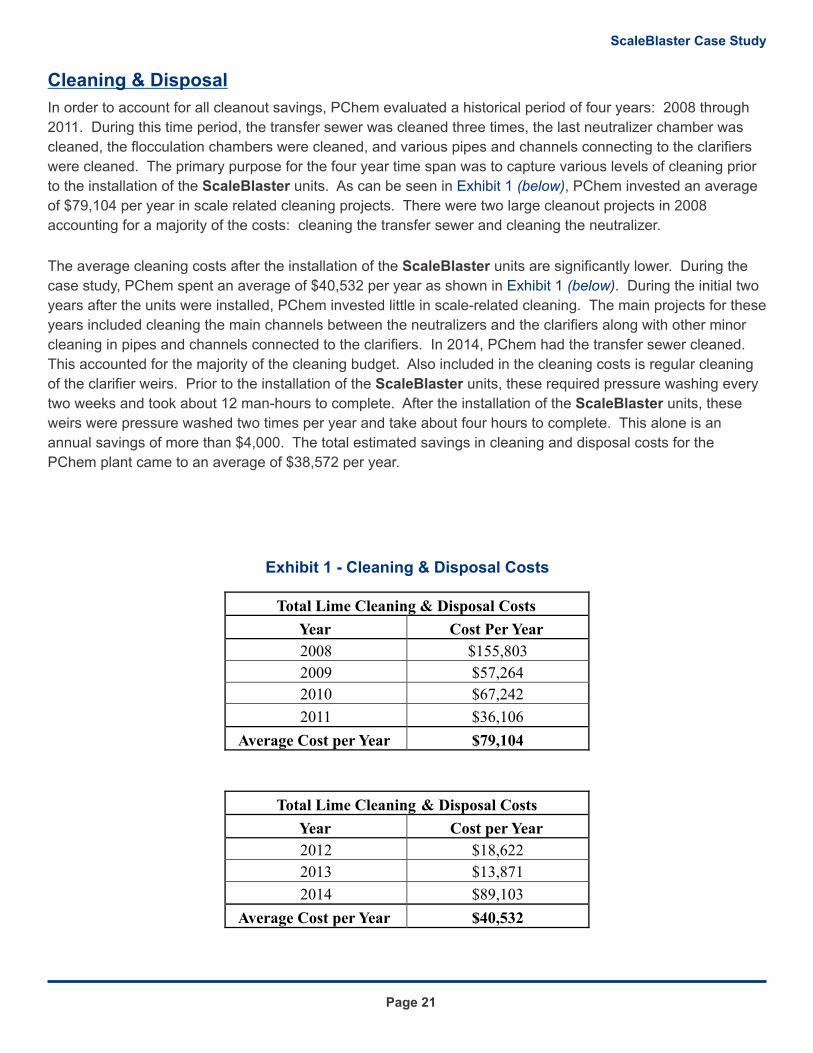
In order to account for all cleanout savings, PChem evaluated a historical period of four years: 2008 through
2011. During this time period, the transfer sewer was cleaned three times, the last neutralizer chamber was
cleaned, the flocculation chambers were cleaned, and various pipes and channels connecting to the clarifiers
were cleaned. The primary purpose for the four year time span was to capture various levels of cleaning prior
to the installation of the ScaleBlaster units. As can be seen in , PChem invested an average
of $79,104 per year in scale related cleaning projects. There were two large cleanout projects in 2008
accounting for a majority of the costs: cleaning the transfer sewer and cleaning the neutralizer.
The average cleaning costs after the installation of the ScaleBlaster units are significantly lower. During the
case study, PChem spent an average of $40,532 per year as shown in . During the initial two
years after the units were installed, PChem invested little in scale-related cleaning. The main projects for these
years included cleaning the main channels between the neutralizers and the clarifiers along with other minor
cleaning in pipes and channels connected to the clarifiers. In 2014, PChem had the transfer sewer cleaned.
This accounted for the majority of the cleaning budget. Also included in the cleaning costs is regular cleaning
of the clarifier weirs. Prior to the installation of the ScaleBlaster units, these required pressure washing every
two weeks and took about 12 man-hours to complete. After the installation of the ScaleBlaster units, these
weirs were pressure washed two times per year and take about four hours to complete. This alone is an
annual savings of more than $4,000. The total estimated savings in cleaning and disposal costs for the
PChem plant came to an average of $38,572 per year.
Cleaning & Disposal
Exhibit 1 (below)
Exhibit 1 (below)
Total Lime Cleaning & Disposal Costs
Year Cost Per Year
2008 $155,803
2009 $57,264
2010 $67,242
2011 $36,106
Average Cost per Year $79,104
Total Lime Cleaning & Disposal Costs
Year Cost per Year
2012 $18,622
2013 $13,871
2014 $89,103
Average Cost per Year $40,532
Exhibit 1 - Cleaning & Disposal Costs
Page 21
ScaleBlaster Case Study
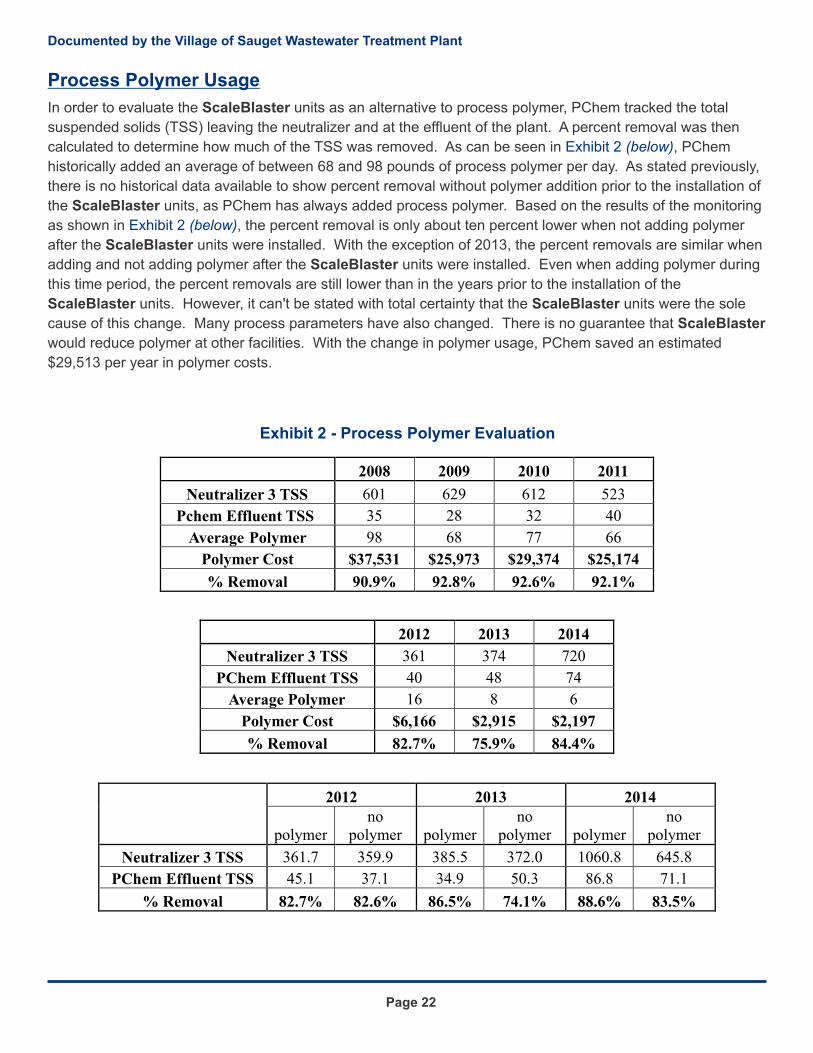
In order to evaluate the ScaleBlaster units as an alternative to process polymer, PChem tracked the total
suspended solids (TSS) leaving the neutralizer and at the effluent of the plant. A percent removal was then
calculated to determine how much of the TSS was removed. As can be seen in , PChem
historically added an average of between 68 and 98 pounds of process polymer per day. As stated previously,
there is no historical data available to show percent removal without polymer addition prior to the installation of
the ScaleBlaster units, as PChem has always added process polymer. Based on the results of the monitoring
as shown in , the percent removal is only about ten percent lower when not adding polymer
after the ScaleBlaster units were installed. With the exception of 2013, the percent removals are similar when
adding and not adding polymer after the ScaleBlaster units were installed. Even when adding polymer during
this time period, the percent removals are still lower than in the years prior to the installation of the
ScaleBlaster units. However, it can't be stated with total certainty that the ScaleBlaster units were the sole
cause of this change. Many process parameters have also changed. There is no guarantee that ScaleBlaster
would reduce polymer at other facilities. With the change in polymer usage, PChem saved an estimated
$29,513 per year in polymer costs.
Process Polymer Usage
Exhibit 2 (below)
Exhibit 2 (below)
2012 2013 2014
polymer no
polymer polymer no
polymer polymer no
polymer
Neutralizer 3 TSS 361.7 359.9 385.5 372.0 1060.8 645.8
PChem Effluent TSS 45.1 37.1 34.9 50.3 86.8 71.1
% Removal 82.7% 82.6% 86.5% 74.1% 88.6% 83.5%
2012 2013 2014
Neutralizer 3 TSS 361 374 720
PChem Effluent TSS 40 48 74
Average Polymer 16 8 6
Polymer Cost $6,166 $2,915 $2,197
% Removal 82.7% 75.9% 84.4%
2008 2009 2010 2011
Neutralizer 3 TSS 601 629 612 523
Pchem Effluent TSS 35 28 32 40
Average Polymer 98 68 77 66
Polymer Cost $37,531 $25,973 $29,374 $25,174
% Removal 90.9% 92.8% 92.6% 92.1%
Exhibit 2 - Process Polymer Evaluation
Page 22
Documented by the Village of Sauget Wastewater Treatment Plant
Conclusions
Total Savings Per Year Average
$68,085 per year average
Overall, the ScaleBlaster units have reduced the scale buildup in the PChem Plant, resulting in an annual
savings of $38,572 per year in cleaning and disposal costs. The need for regular cleaning of historically
problematic areas has been reduced along with the difficulty level of the cleaning. Large cleaning projects
were not required as frequently; however, the ScaleBlaster units have not completely eliminated the lime scale
buildup. PChem does continue to have some problem areas, such as the main channels. It appears as
though polymer used for settling in the clarifiers was also reduced from the use of the ScaleBlaster
technology. There were no observed adverse effects on the BNR plant downstream.
Lime Cleaning, disposal cost and polymer savings
Page 23
ScaleBlaster Case Study
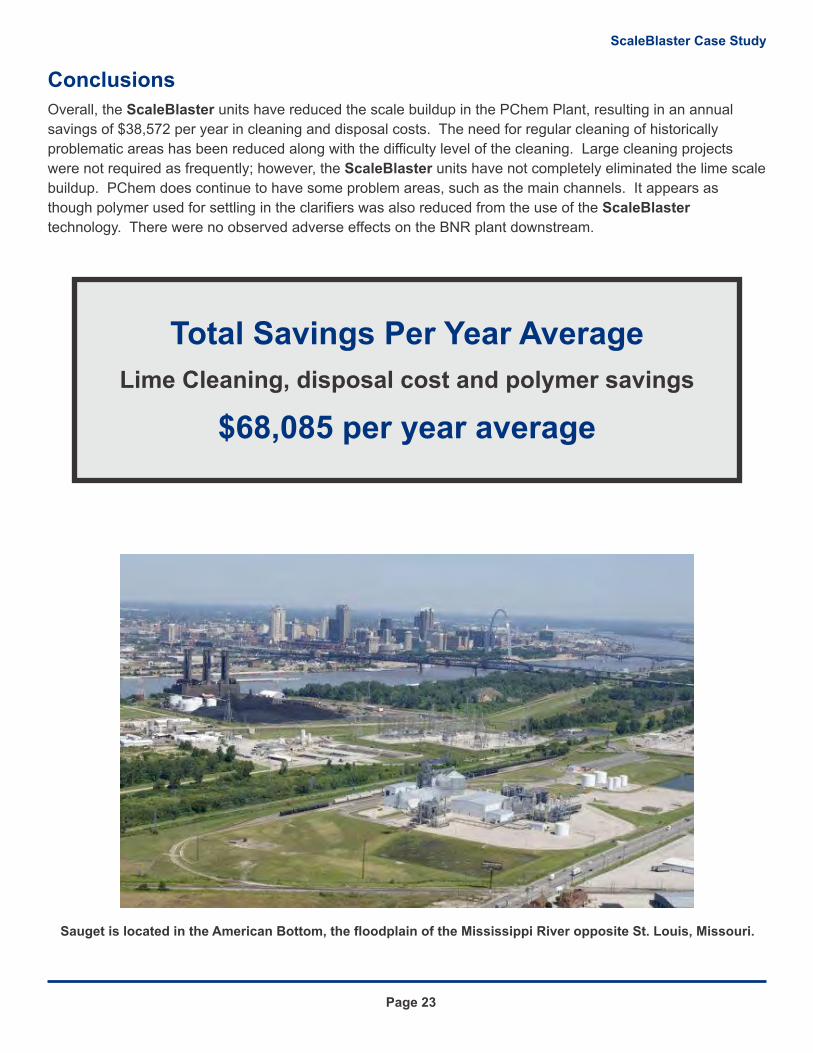
Sauget is located in the American Bottom, the floodplain of the Mississippi River opposite St. Louis, Missouri.
About The Village of Sauget Physical / Chemical Treatment Plant
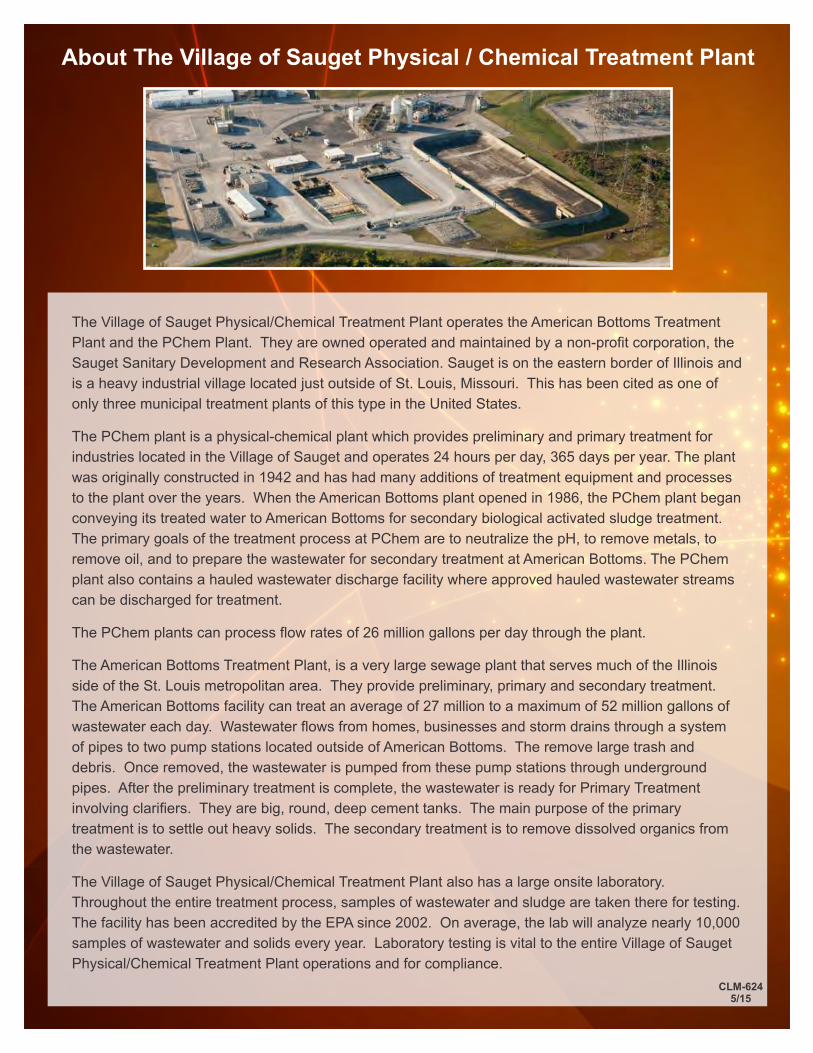
The Village of Sauget Physical/Chemical Treatment Plant operates the American Bottoms Treatment
Plant and the PChem Plant. They are owned operated and maintained by a non-profit corporation, the
Sauget Sanitary Development and Research Association. Sauget is on the eastern border of Illinois and
is a heavy industrial village located just outside of St. Louis, Missouri. This has been cited as one of
only three municipal treatment plants of this type in the United States.
The PChem plants can process flow rates of 26 million gallons per day through the plant. The American Bottoms Treatment Plant, is a very large sewage plant that serves much of the Illinois
side of the St. Louis metropolitan area. They provide preliminary, primary and secondary treatment.
The American Bottoms facility can treat an average of 27 million to a maximum of 52 million gallons of
wastewater each day. Wastewater flows from homes, businesses and storm drains through a system
of pipes to two pump stations located outside of American Bottoms. The remove large trash and
debris. Once removed, the wastewater is pumped from these pump stations through underground
pipes. After the preliminary treatment is complete, the wastewater is ready for Primary Treatment
involving clarifiers. They are big, round, deep cement tanks. The main purpose of the primary
treatment is to settle out heavy solids. The secondary treatment is to remove dissolved organics from
the wastewater.
The Village of Sauget Physical/Chemical Treatment Plant also has a large onsite laboratory.
Throughout the entire treatment process, samples of wastewater and sludge are taken there for testing.
The facility has been accredited by the EPA since 2002. On average, the lab will analyze nearly 10,000
samples of wastewater and solids every year. Laboratory testing is vital to the entire Village of Sauget
Physical/Chemical Treatment Plant operations and for compliance.
The PChem plant is a physical-chemical plant which provides preliminary and primary treatment for
industries located in the Village of Sauget and operates 24 hours per day, 365 days per year. The plant
was originally constructed in 1942 and has had many additions of treatment equipment and processes
to the plant over the years. When the American Bottoms plant opened in 1986, the PChem plant began
conveying its treated water to American Bottoms for secondary biological activated sludge treatment.
The primary goals of the treatment process at PChem are to neutralize the pH, to remove metals, to
remove oil, and to prepare the wastewater for secondary treatment at American Bottoms. The PChem
plant also contains a hauled wastewater discharge facility where approved hauled wastewater streams
can be discharged for treatment.
CLM-6245/15


![VARIABILITY IN LIME-MUD FEED RATE INDUCED IN THE LIME … · in the lime kiln [3]. Furthermore, perfor-mance variations in the lime-mud filter are known to influence reburned lime](https://img.pdfslide.us/doc/110x75/5e24a26d6df10c05af5ee33b/variability-in-lime-mud-feed-rate-induced-in-the-lime-in-the-lime-kiln-3-furthermore.jpg)