Embed Size (px)
DESCRIPTION
Utilizing Data from a Science Mission in an Operational Environment Prospects for NASA/STEREO. D.A. Biesecker NOAA/Space Environment Center. Outline. Lessons learned from previous missions SOHO ACE STEREO overview Instruments, orbit, schedule Real-time beacon What we expect from STEREO - PowerPoint PPT Presentation
Citation preview
Utilizing Data from a Science Mission in an Operational
Environment Prospects for NASA/STEREO
D.A. Biesecker
NOAA/Space Environment Center
Outline
• Lessons learned from previous missions– SOHO– ACE
• STEREO overview– Instruments, orbit, schedule– Real-time beacon
• What we expect from STEREO– Immediate impact; longer term utility
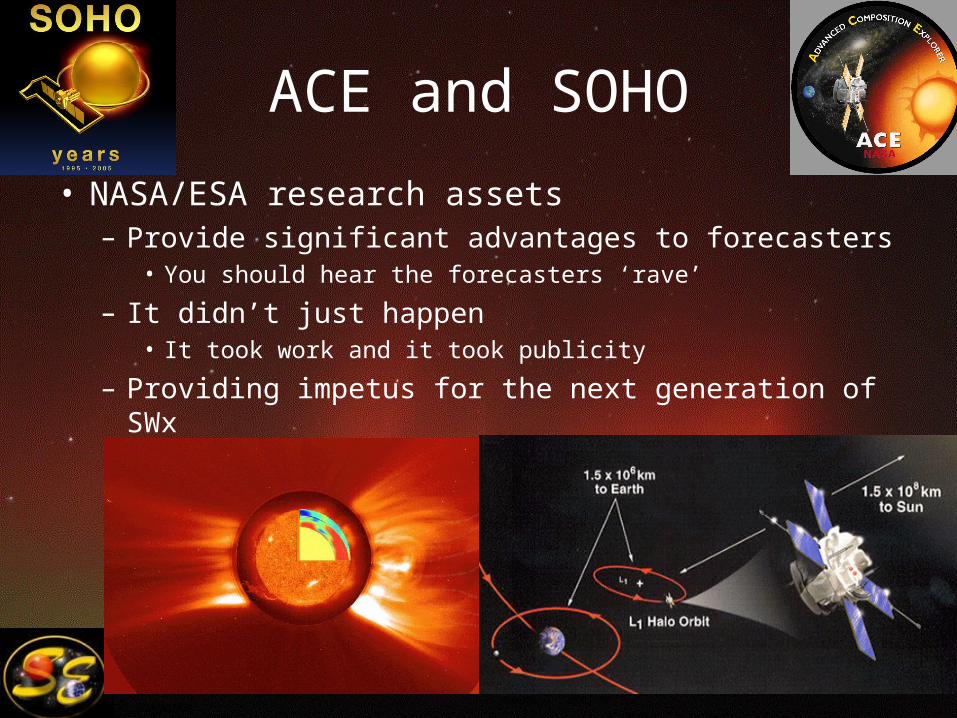
ACE and SOHO
• NASA/ESA research assets– Provide significant advantages to forecasters
• You should hear the forecasters ‘rave’
– It didn’t just happen• It took work and it took publicity
– Providing impetus for the next generation of SWx
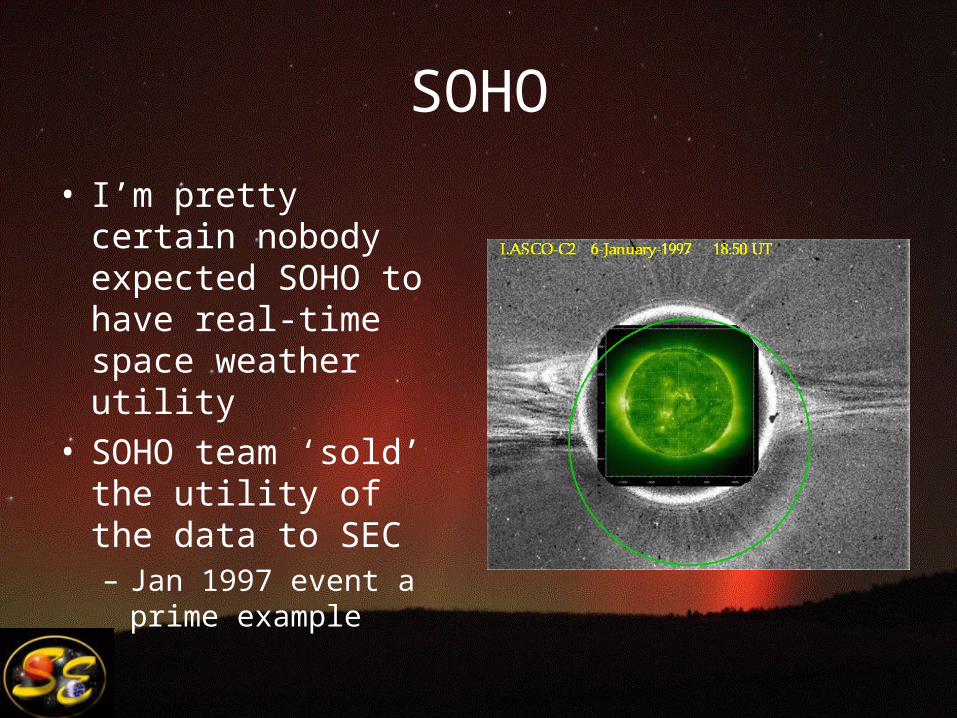
SOHO
• I’m pretty certain nobody expected SOHO to have real-time space weather utility
• SOHO team ‘sold’ the utility of the data to SEC– Jan 1997 event a
prime example
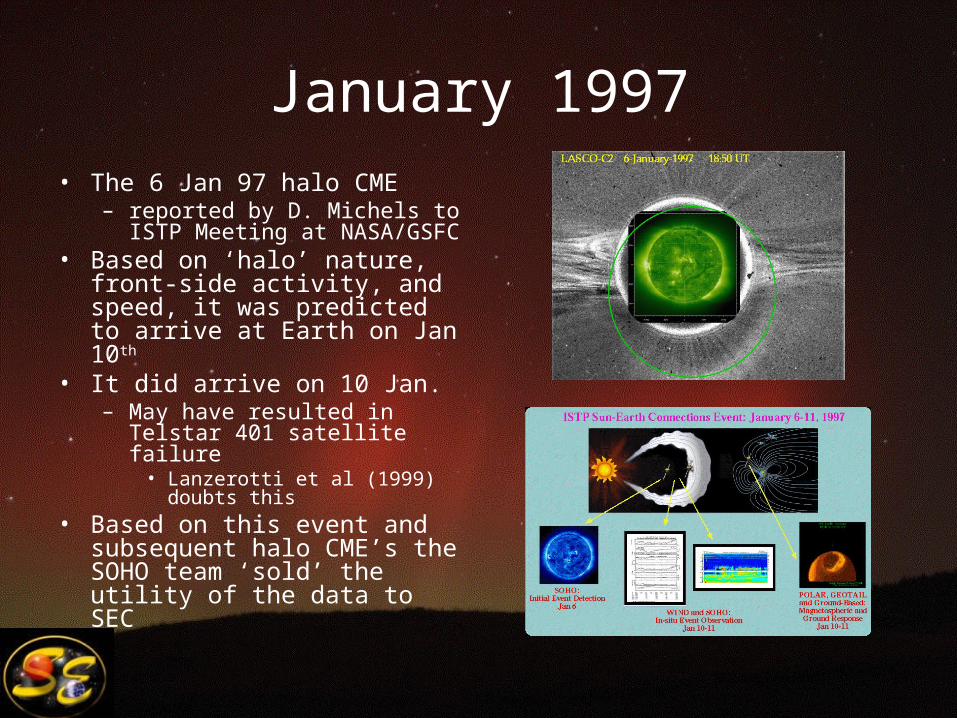
January 1997• The 6 Jan 97 halo CME
– reported by D. Michels to ISTP Meeting at NASA/GSFC
• Based on ‘halo’ nature, front-side activity, and speed, it was predicted to arrive at Earth on Jan 10th
• It did arrive on 10 Jan.– May have resulted in Telstar
401 satellite failure• Lanzerotti et al (1999) doubts
this• Based on this event and
subsequent halo CME’s the SOHO team ‘sold’ the utility of the data to SEC
SOHO – Lessons Learned• Even though the utility was clear, would it work for forecasters?• Reliability
– The ground data processing system is ‘robust enough’– LASCO team works hard to ensure SEC needs are met
• Latency– 1-4 day arrival means that lack of continuous contact is not a problem
• Worked with SOHO teams to ensure rapid access to data and for simple analysis tools– LASCO team issues Halo CME alerts with relevant measurements
• In a format consistent with existing SEC systems• Not always in the time needed, so SEC sometimes does its own analysis
– LASCO team assisted SEC with setting this up
• Currently use EIT, LASCO and MDI
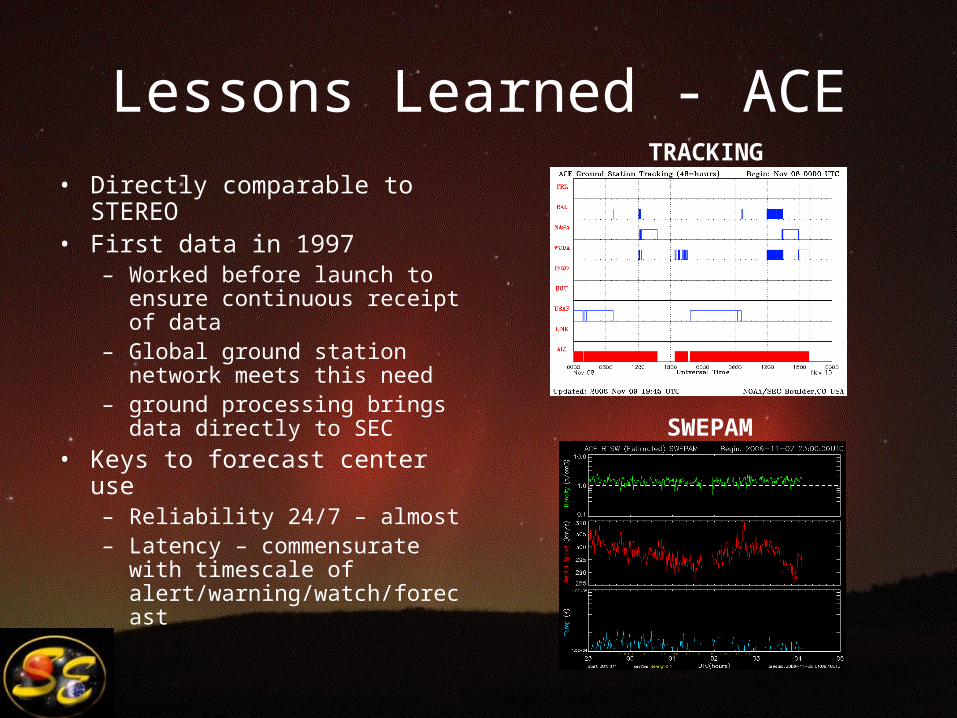
Lessons Learned - ACE
• Directly comparable to STEREO
• First data in 1997– Worked before launch to
ensure continuous receipt of data
– Global ground station network meets this need
– ground processing brings data directly to SEC
• Keys to forecast center use– Reliability 24/7 – almost– Latency – commensurate with
timescale of alert/warning/watch/forecast
TRACKING
SWEPAM
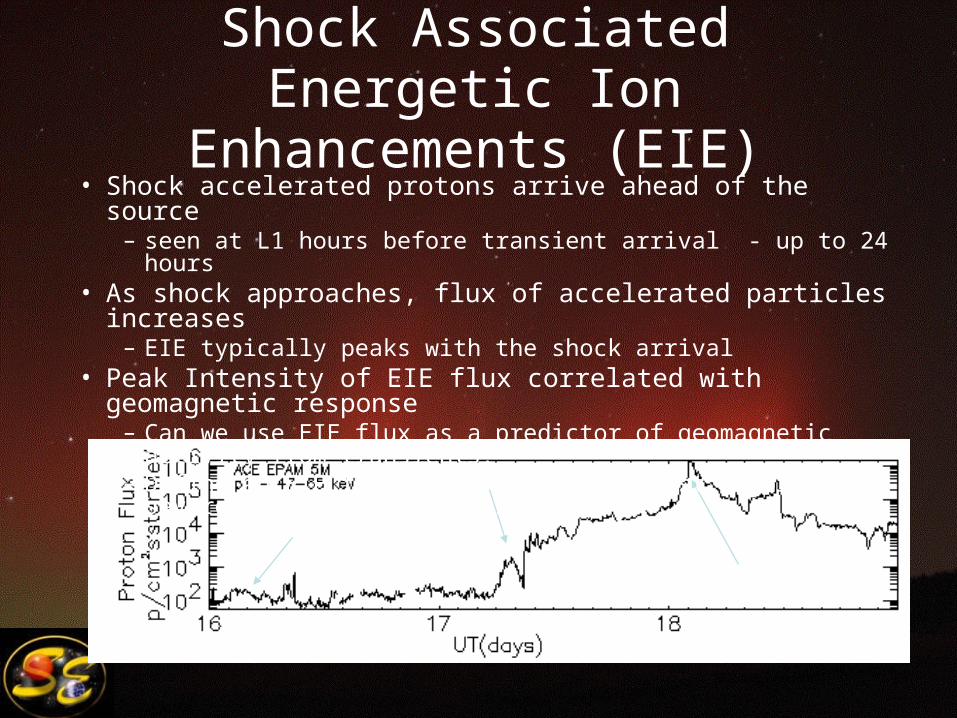
Shock Associated Energetic Ion Enhancements (EIE)
Shock Arrival
CME Observed
EIE Begins
• Shock accelerated protons arrive ahead of the source– seen at L1 hours before transient arrival - up to 24 hours
• As shock approaches, flux of accelerated particles increases – EIE typically peaks with the shock arrival
• Peak Intensity of EIE flux correlated with geomagnetic response– Can we use EIE flux as a predictor of geomagnetic activity from
transients?– Define an EIE flux threshold to forecast major to severe geomagnetic
storming
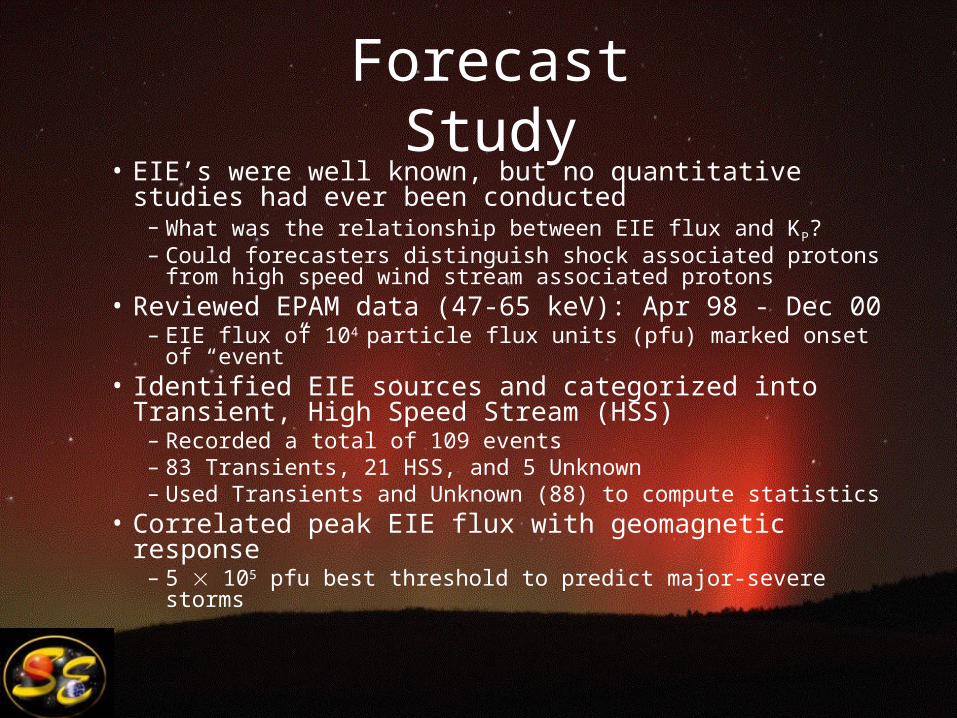
Forecast Study• EIE’s were well known, but no quantitative studies had
ever been conducted– What was the relationship between EIE flux and KP?– Could forecasters distinguish shock associated protons from
high speed wind stream associated protons• Reviewed EPAM data (47-65 keV): Apr 98 - Dec 00
– EIE flux of 104 particle flux units (pfu) marked onset of “event”• Identified EIE sources and categorized into Transient,
High Speed Stream (HSS)– Recorded a total of 109 events– 83 Transients, 21 HSS, and 5 Unknown– Used Transients and Unknown (88) to compute statistics
• Correlated peak EIE flux with geomagnetic response– 5 105 pfu best threshold to predict major-severe storms
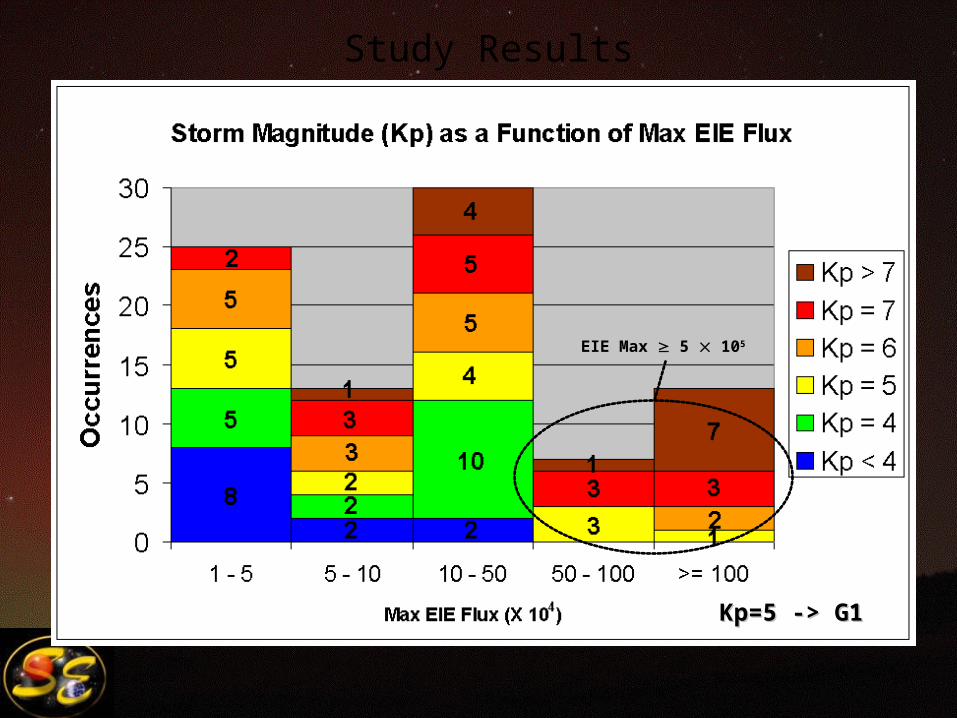
Study Results
EIE Max 5 105
Kp=5 -> G1Kp=5 -> G1
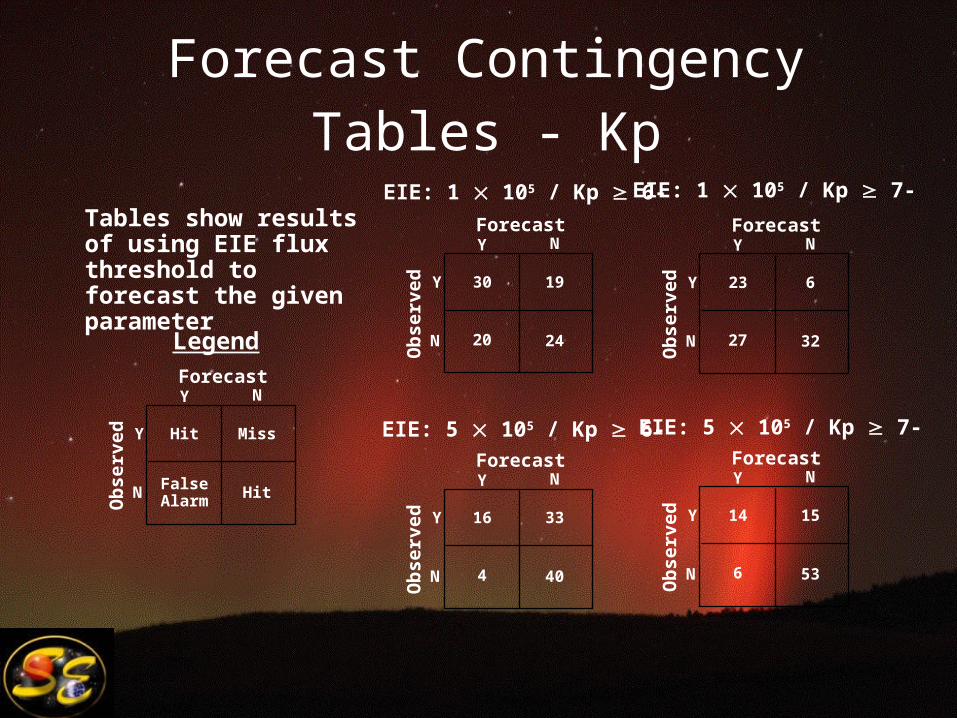
Forecast Contingency Tables - Kp
14
6
15
53
ForecastY N
Y
N
Ob
serv
ed
EIE: 5 105 / Kp 7-
16
4
33
40
ForecastY N
Y
N
Ob
serv
edEIE: 5 105 / Kp 6-
23
27
6
32
ForecastY N
Y
N
Ob
serv
ed
EIE: 1 105 / Kp 7-
30
20
19
24
ForecastY N
Y
N
Ob
serv
ed
EIE: 1 105 / Kp 6-
Hit
False Alarm
Miss
Hit
ForecastY N
Y
N
Ob
serv
ed
Legend
Tables show results of using EIE flux threshold to forecast the given parameter
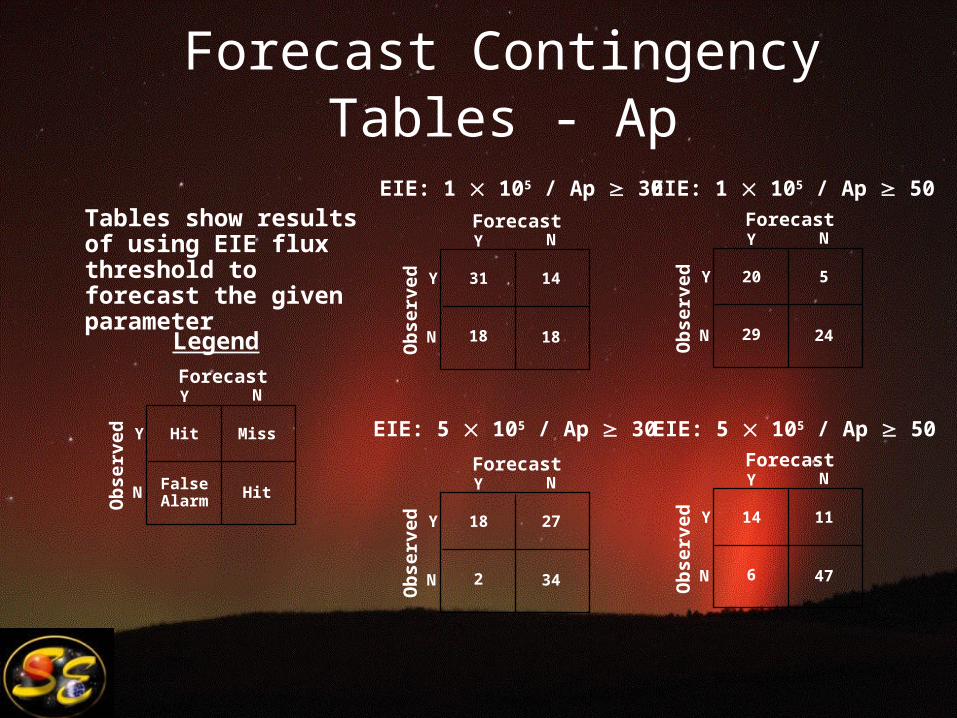
Forecast Contingency Tables - Ap
14
6
11
47
ForecastY N
Y
N
Ob
serv
ed
EIE: 5 105 / Ap 50
20
29
5
24
ForecastY N
Y
N
Ob
serv
ed
EIE: 1 105 / Ap 50
18
2
27
34
ForecastY N
Y
N
Ob
serv
edEIE: 5 105 / Ap 30
31
18
14
18
ForecastY N
Y
N
Ob
serv
ed
EIE: 1 105 / Ap 30
Hit
False Alarm
Miss
Hit
ForecastY N
Y
N
Ob
serv
ed
Legend
Tables show results of using EIE flux threshold to forecast the given parameter
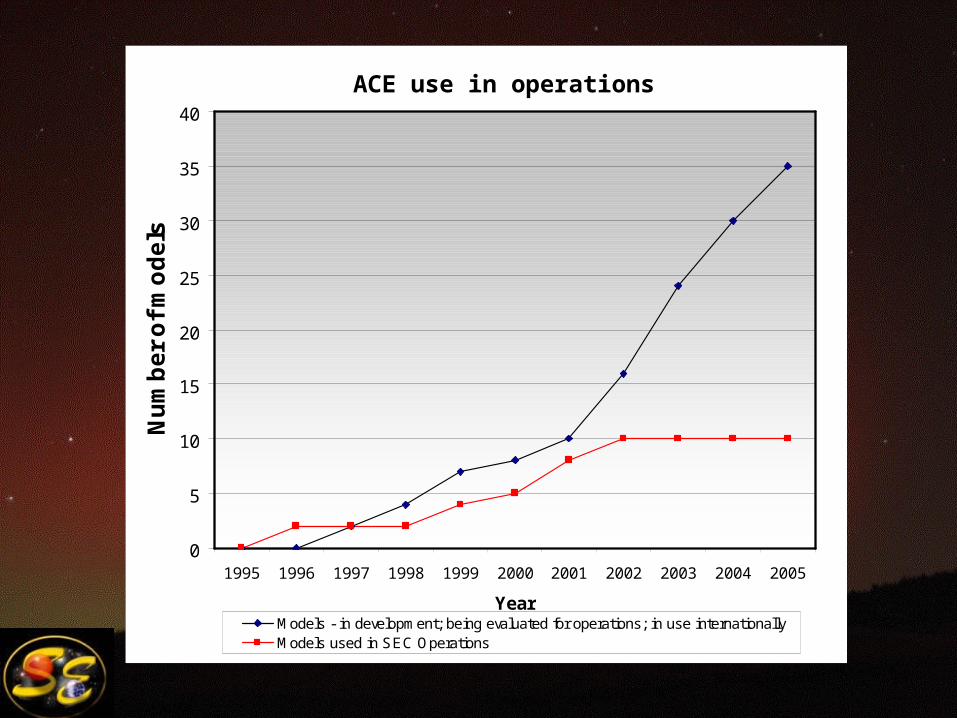
0
5
10
15
20
25
30
35
40
1995 1996 1997 1998 1999 2000 2001 2002 2003 2004 2005
Year
Nu
mb
er
of
mo
de
ls
Models - in development; being evaluated for operations; in use internationallyModels used in SEC Operations
ACE use in operations
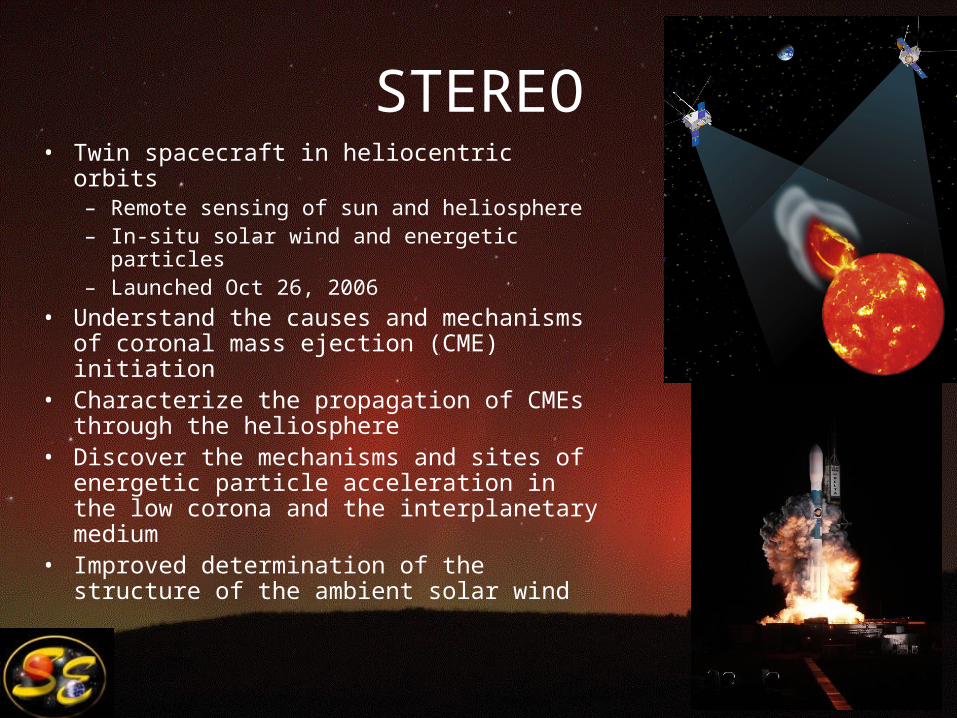
STEREO• Twin spacecraft in heliocentric orbits
– Remote sensing of sun and heliosphere– In-situ solar wind and energetic particles– Launched Oct 26, 2006
• Understand the causes and mechanisms of coronal mass ejection (CME) initiation
• Characterize the propagation of CMEs through the heliosphere
• Discover the mechanisms and sites of energetic particle acceleration in the low corona and the interplanetary medium
• Improved determination of the structure of the ambient solar wind
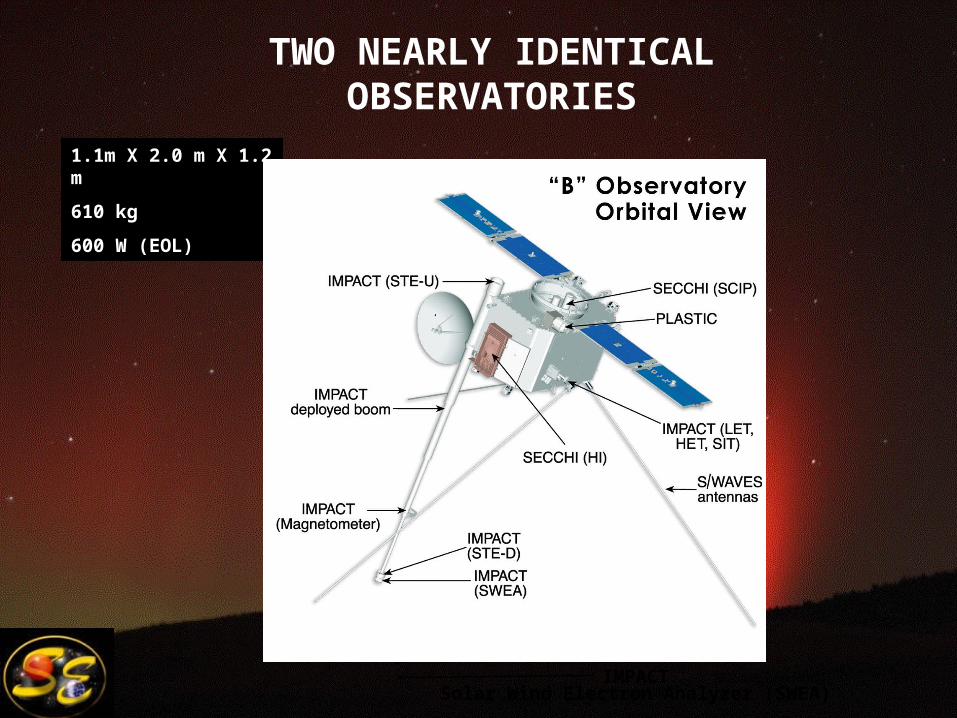
TWO NEARLY IDENTICAL OBSERVATORIES
IMPACTSolar Wind Electron Analyzer (SWEA)
1.1m X 2.0 m X 1.2 m
610 kg
600 W (EOL)
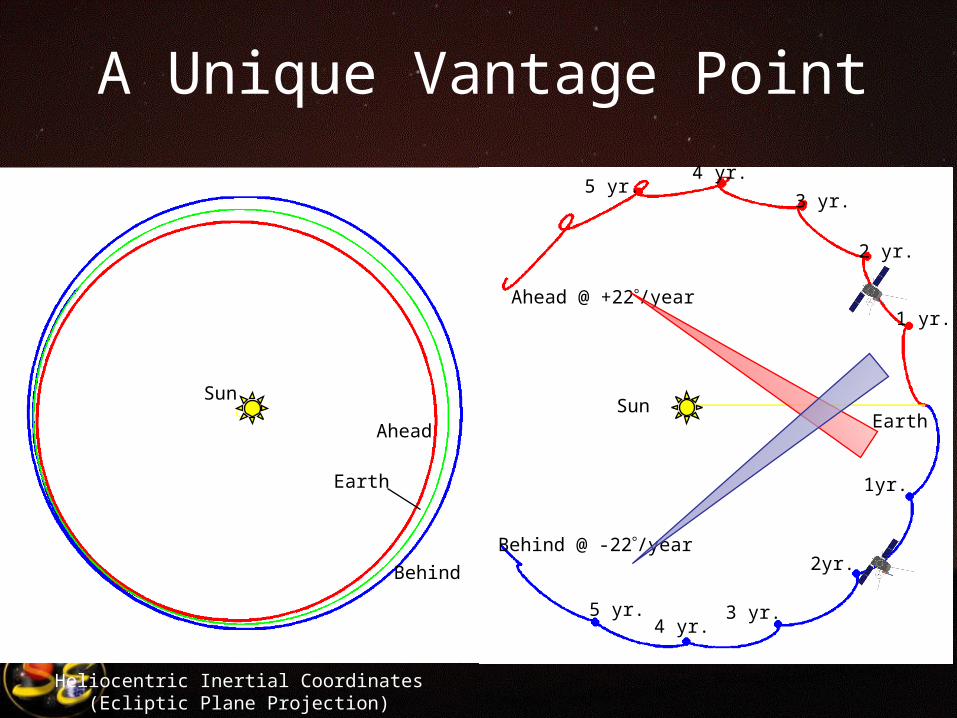
A Unique Vantage Point
SunSun
Earth
Ahead @ +22/year
Behind @ -22/year
Heliocentric Inertial Coordinates(Ecliptic Plane Projection)
Ahead
Behind
Earth
1 yr.
2 yr.
3 yr.
4 yr.
1yr.
2yr.
3 yr.4 yr.
5 yr.
5 yr.
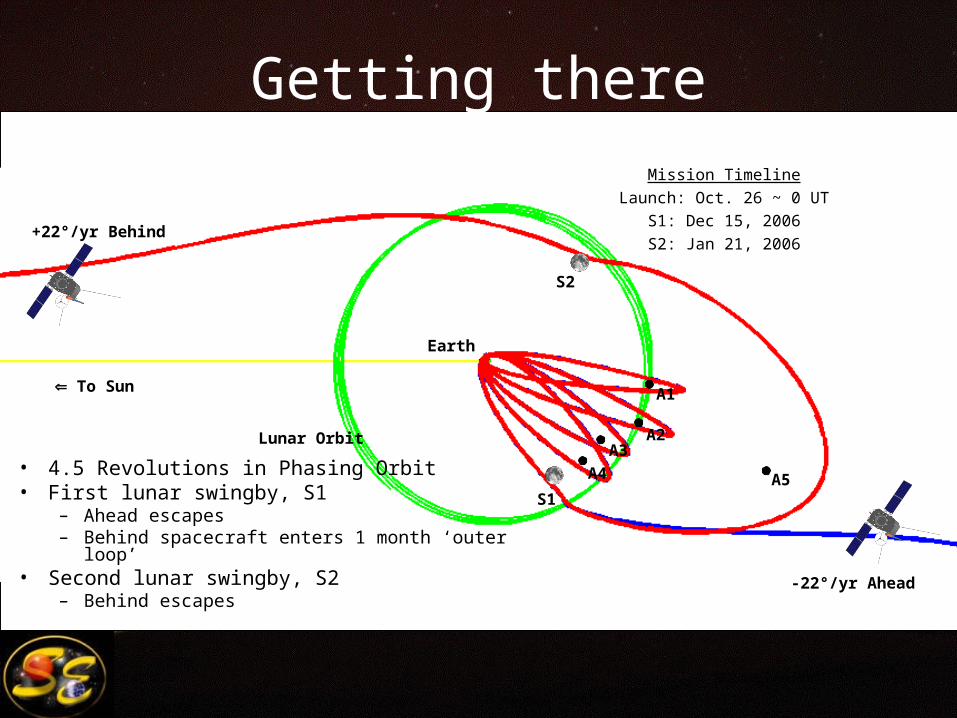
Getting thereMission Timeline
Launch: Oct. 26 ~ 0 UTS1: Dec 15, 2006S2: Jan 21, 2006
Lunar Orbit
+22°/yr Behind
-22°/yr Ahead
• 4.5 Revolutions in Phasing Orbit• First lunar swingby, S1
– Ahead escapes– Behind spacecraft enters 1 month ‘outer loop’
• Second lunar swingby, S2– Behind escapes
To Sun A1
A2A3
A4 A5S1
S2
Earth
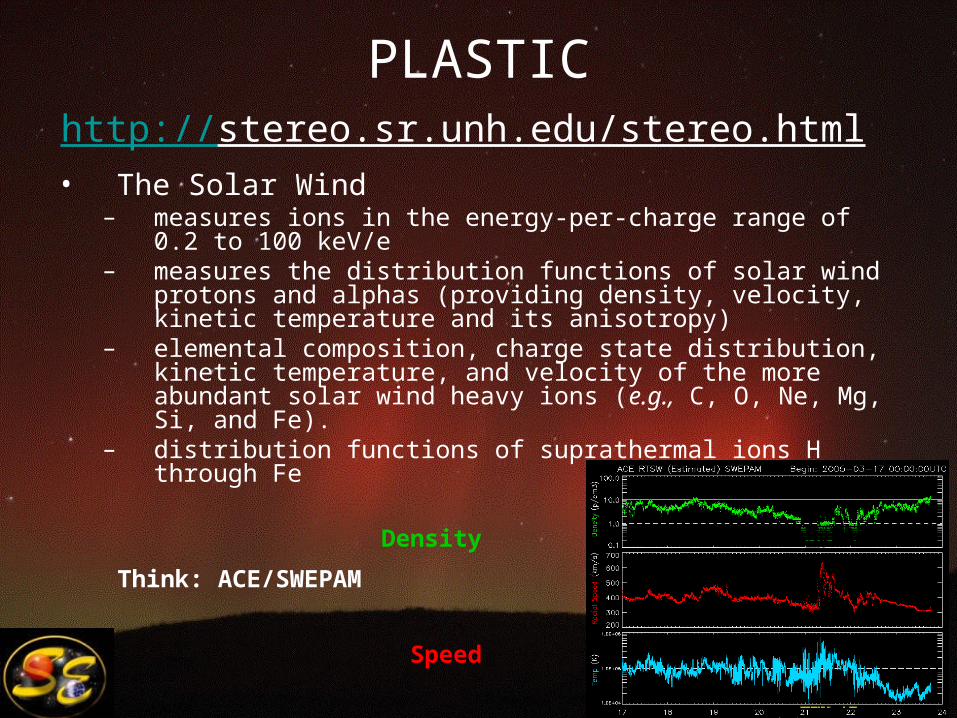
PLASTIChttp://stereo.sr.unh.edu/stereo.html
• The Solar Wind– measures ions in the energy-per-charge range of 0.2 to 100
keV/e– measures the distribution functions of solar wind protons and
alphas (providing density, velocity, kinetic temperature and its anisotropy)
– elemental composition, charge state distribution, kinetic temperature, and velocity of the more abundant solar wind heavy ions (e.g., C, O, Ne, Mg, Si, and Fe).
– distribution functions of suprathermal ions H through Fe
Density
Speed
Temperature
Think: ACE/SWEPAM
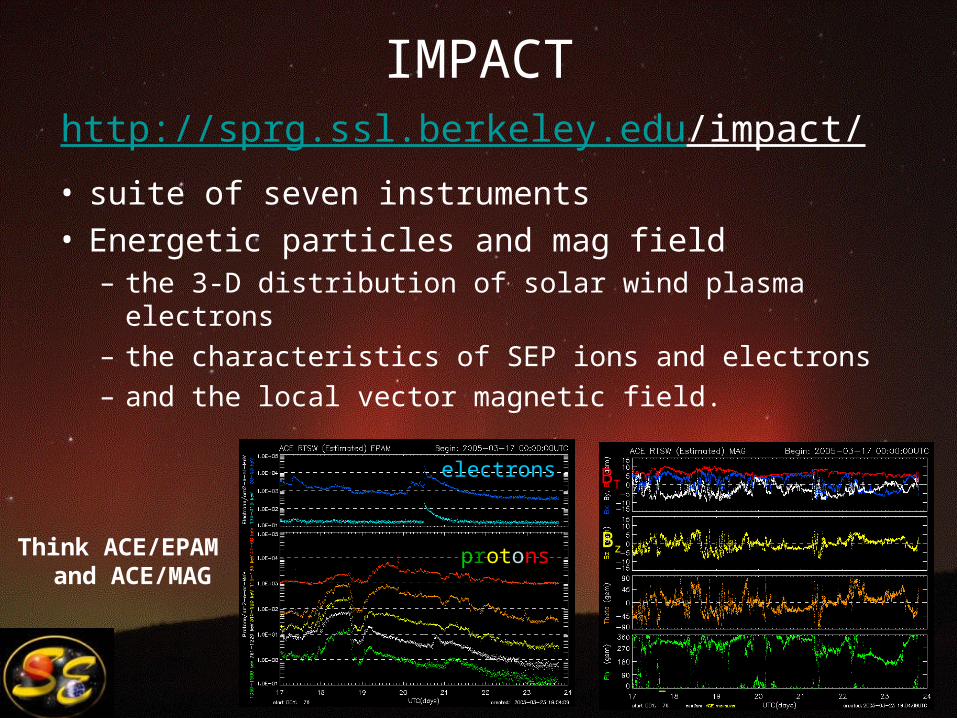
IMPACThttp://sprg.ssl.berkeley.edu/impact/
• suite of seven instruments• Energetic particles and mag field
– the 3-D distribution of solar wind plasma electrons– the characteristics of SEP ions and electrons– and the local vector magnetic field.
Think ACE/EPAM and ACE/MAG
BT
Bz
electrons
protons
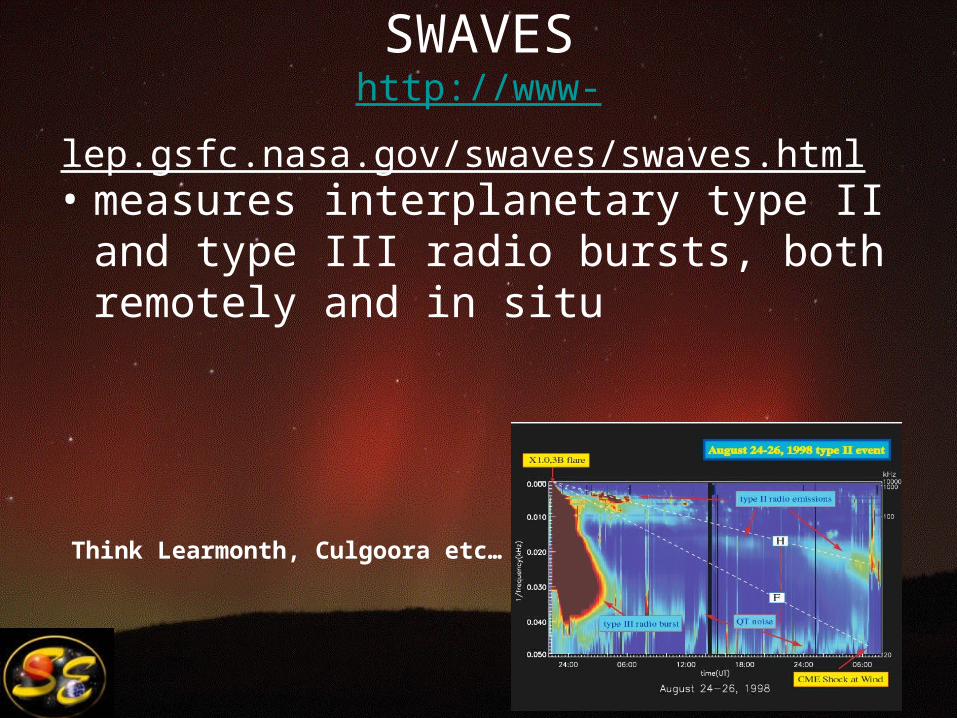
SWAVEShttp://www-lep.gsfc.nasa.gov/swaves/swaves.html • measures interplanetary type II and type III
radio bursts, both remotely and in situ
Think Learmonth, Culgoora etc…
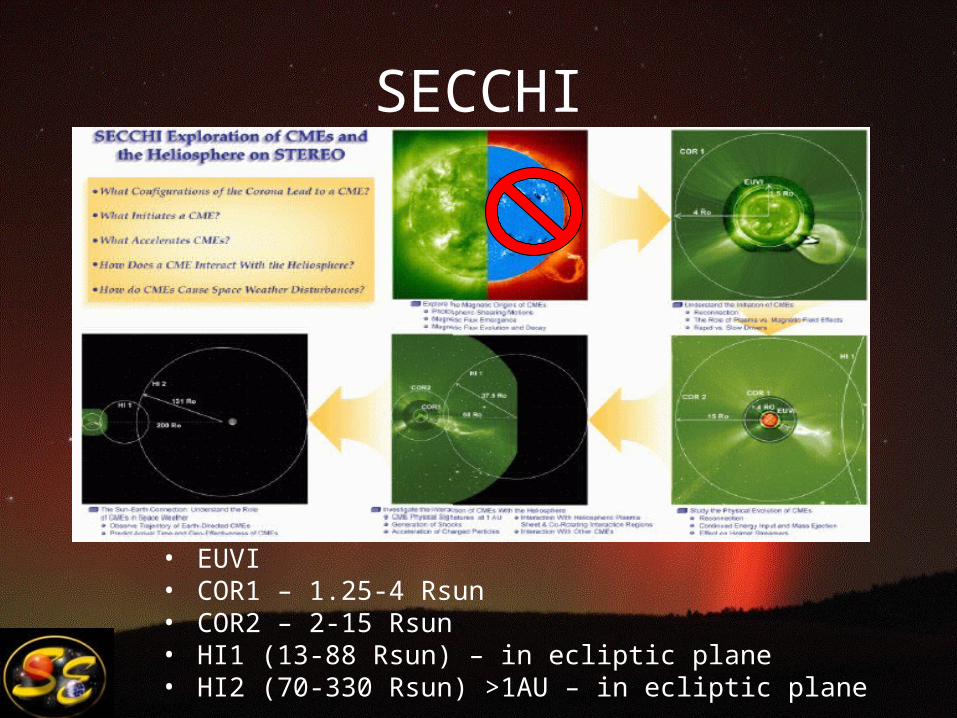
SECCHI
• EUVI• COR1 – 1.25-4 Rsun• COR2 – 2-15 Rsun• HI1 (13-88 Rsun) – in ecliptic plane• HI2 (70-330 Rsun) >1AU – in ecliptic plane
STEREO Beacon
• All instruments will be sending down a subset of their science data in a real-time, broadcast mode– 633 bps
• These data will be processed at the STEREO Science Center (SSC) at GSFC– http://stereo-ssc.nascom.nasa.gov/– data will then be available to SEC (and everyone else)
• We ‘control’ the STEREO/SECCHI beacon data content.– That is, the image data sent in real-time can be changed at any
time
• The PLASTIC, IMPACT, and SWAVES data are fixed– 1 and 5 minute averages
SP
ICE
ker
nel
s
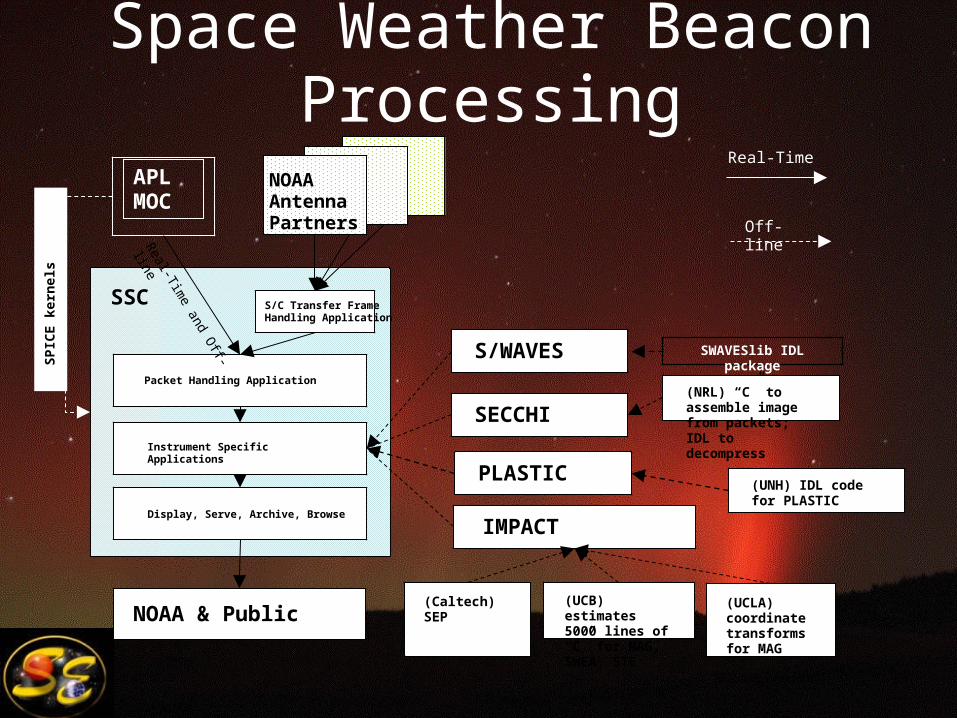
Space Weather Beacon Processing
APL MOC
Packet Handling Application
Instrument Specific Applications
Display, Serve, Archive, Browse
S/C Transfer Frame Handling Application
NOAA & Public
SSC
S/WAVES
SECCHI(NRL) “C” to assemble image from packets; IDL to decompress
IMPACT
(UCB) estimates 5000 lines of “C” for MAG, SWEA, STE
(Caltech) SEP
(UNH) IDL code for PLASTIC
(UCLA) coordinate transforms for MAG
Real-Time
Off-line
NOAA Antenna Partners
Real-Tim
e and Off-line
PLASTIC
SWAVESlib IDL package
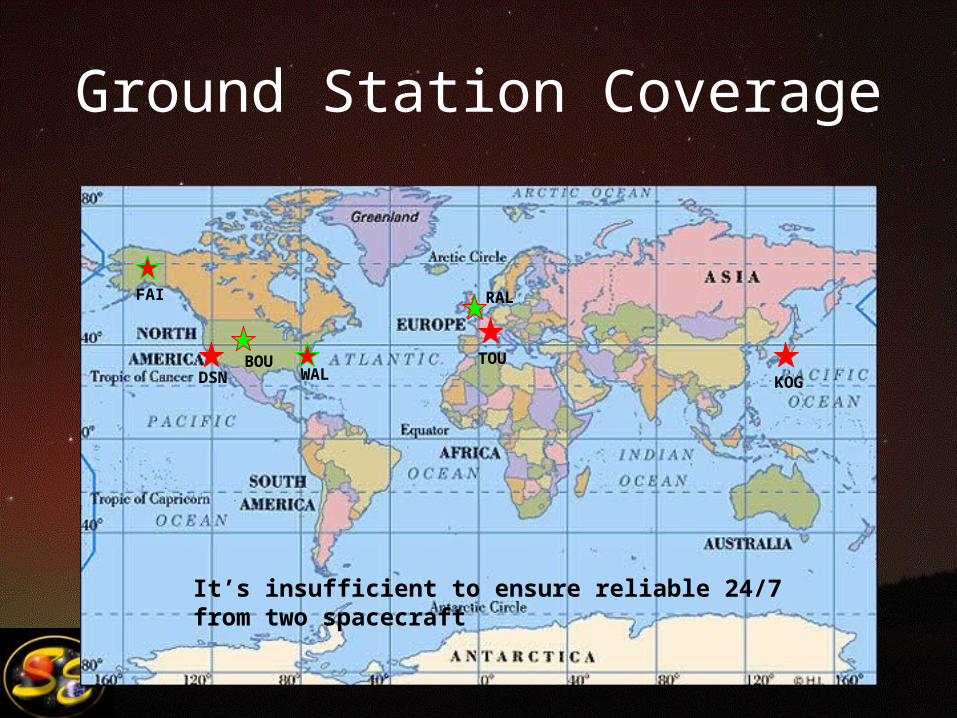
Ground Station Coverage
DSN
FAI
BOUWAL
TOU
KOG
RAL
It’s insufficient to ensure reliable 24/7 from two spacecraft
STEREO Schedule
• Dec 5, 2006– SECCHI Ahead First Light– Beacon turned on, though not permanently
• Dec 13, 2006– SECCHI Behind First Light– Beacon turned on, though not permanently
• Jan 22, 2007– Prime science mission begins– Beacon turned on permanently
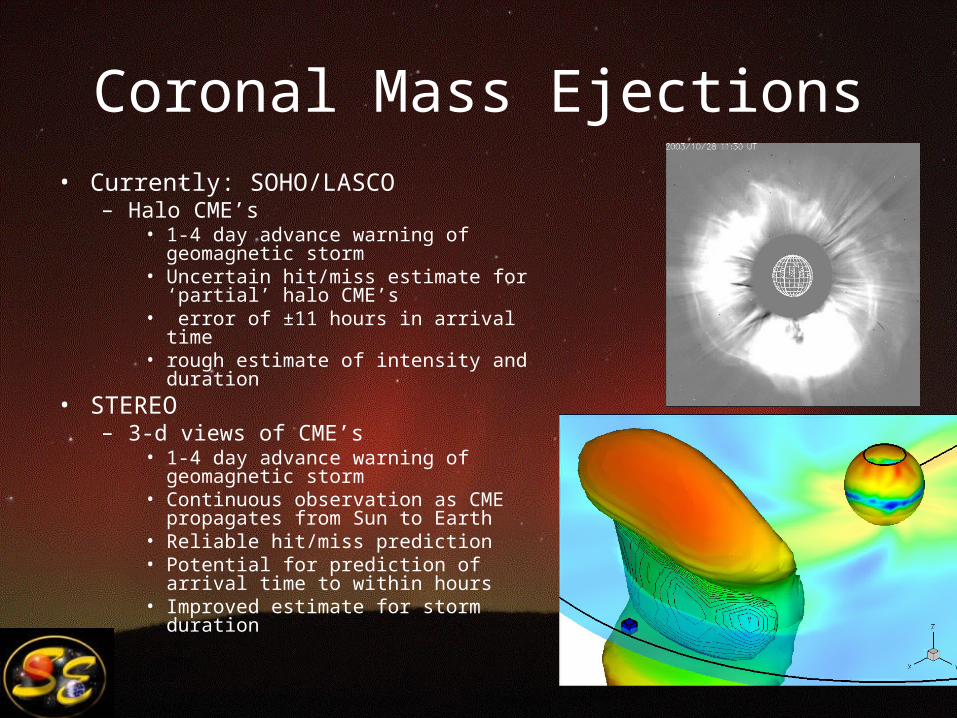
Coronal Mass Ejections• Currently: SOHO/LASCO
– Halo CME’s• 1-4 day advance warning of
geomagnetic storm• Uncertain hit/miss estimate for ‘partial’
halo CME’s• error of ±11 hours in arrival time• rough estimate of intensity and duration
• STEREO– 3-d views of CME’s
• 1-4 day advance warning of geomagnetic storm
• Continuous observation as CME propagates from Sun to Earth
• Reliable hit/miss prediction • Potential for prediction of arrival time to
within hours • Improved estimate for storm duration
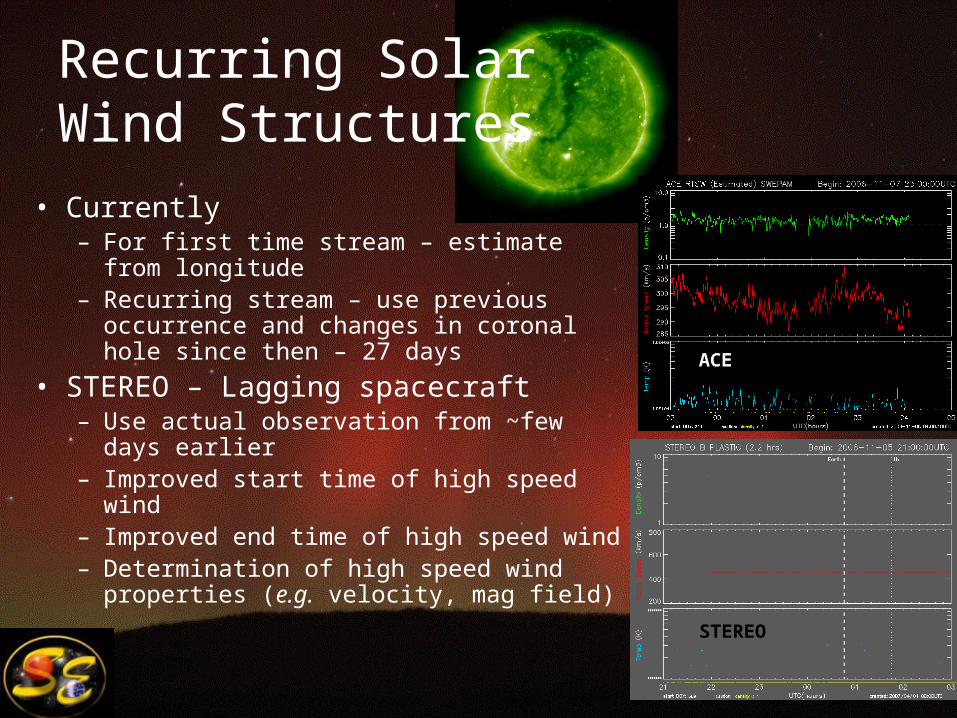
Recurring SolarWind Structures
• Currently– For first time stream – estimate from
longitude – Recurring stream – use previous
occurrence and changes in coronal hole since then – 27 days
• STEREO – Lagging spacecraft– Use actual observation from ~few days
earlier– Improved start time of high speed wind– Improved end time of high speed wind– Determination of high speed wind
properties (e.g. velocity, mag field)STEREO
ACE
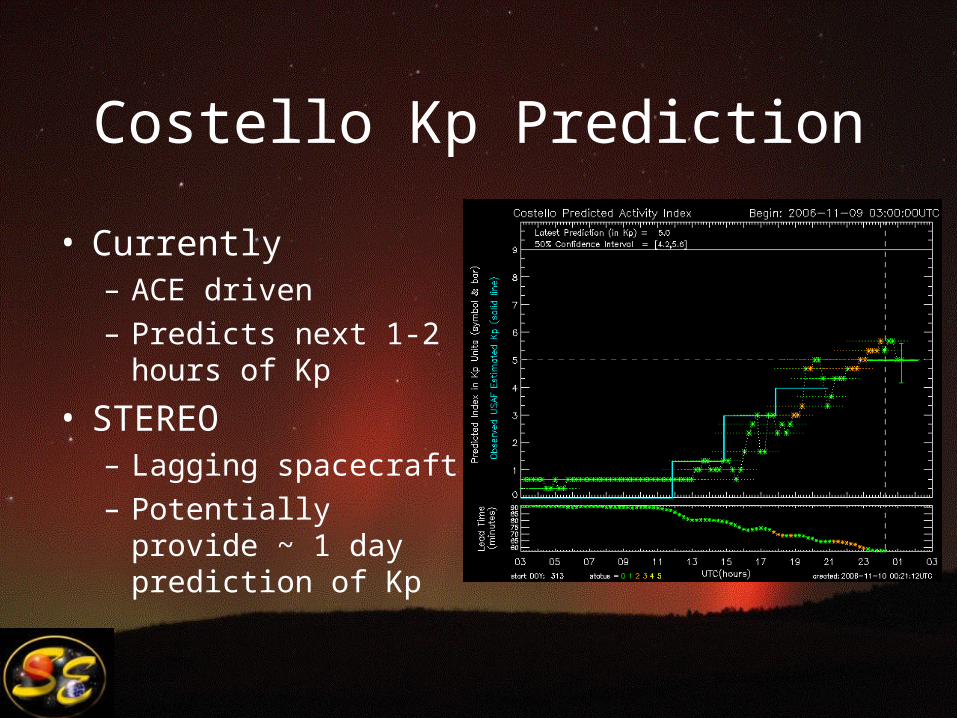
Costello Kp Prediction
• Currently– ACE driven– Predicts next 1-2
hours of Kp
• STEREO– Lagging spacecraft– Potentially provide ~ 1
day prediction of Kp
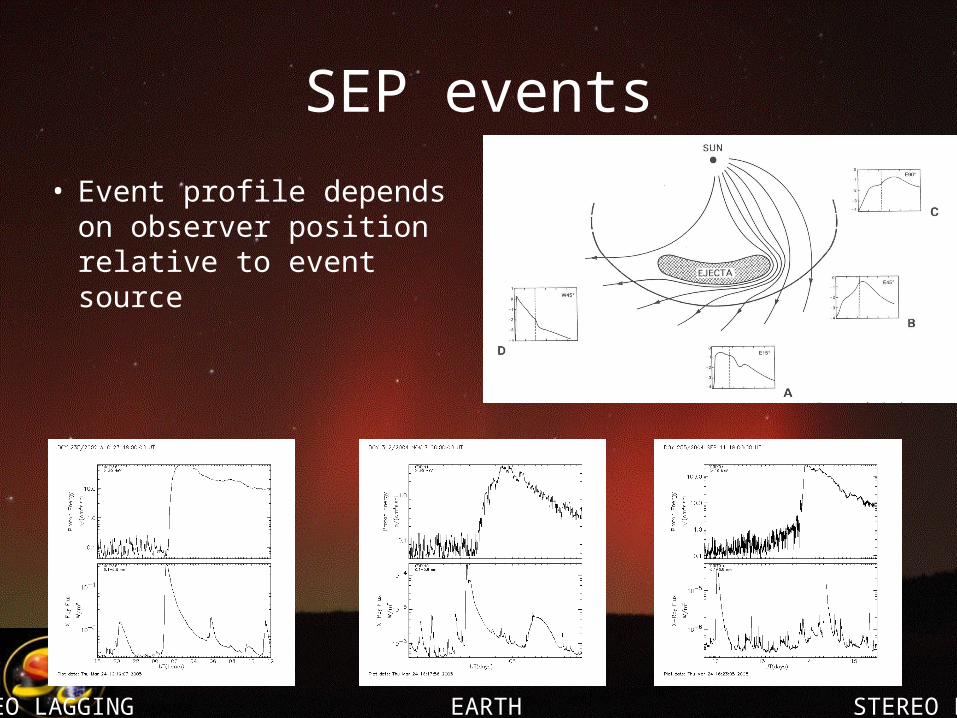
SEP events
• Event profile depends on observer position relative to event source
STEREO LAGGING EARTH STEREO LEADINGW90 W17 E42
Long-term Forecasts
• Current – up to 7 day lead
• STEREO – 14 or more day lead– EUV Flux– New equatorial coronal holes– New active regions
• Helioseismology backside imaging
– Level of flaring activity• Get an estimate from backsided CME’s
The Far Future
• STEREO will be of ‘limited’ operational use in forecasting – due to short mission lifetime (2+3yrs)– But it should take current capabilities to
• I think of this as a proof of concept for future NOAA observations.– Advances of understanding will enable us to
determine requirements for future NOAA missions– When technologies such as solar sails are mature,
missions like STEREO could be common.• e.g. L5
Thank you
Backup Slides
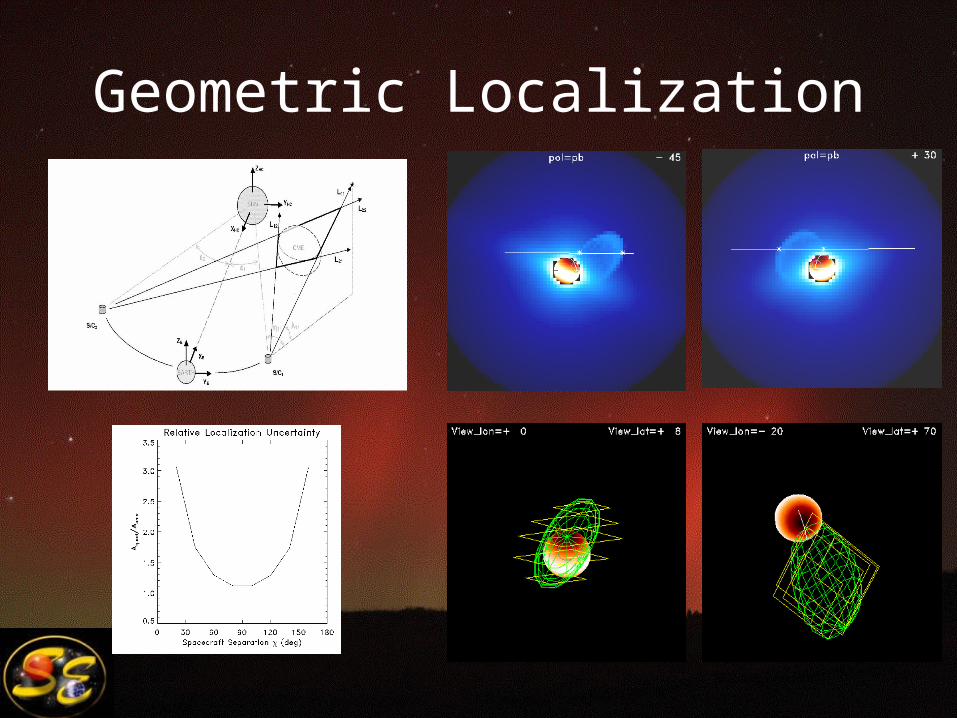
Geometric Localization
SECCHIRuss Howard (NRL)
• Suite of imaging telescopes– EUVI (4 channels: 171, 195, 284, 304)– COR1 – inner coronagraph (~1.5-4 Rsun)– COR2 – outer coronagraph (2-15 Rsun)– HI-1 and HI-2 – Heliospheric imagers
• Imaging of flares, coronal holes, and CME’s, EUV dimmings and waves…– Tracking CME’s from Sun to Earth
SECCHI Beacon Data
• SECCHI Beacon data rate is 633 bps• That allows 7 (256x256 pixel) images per hour,
using H-compress (a factor of 5x)– And we could download image statistics, such as
brightest pixels or CME detection flag– Can fit a lot more 128x128 pixel images per hour
• We don’t determine which data are taken– We pick beacon data from what’s available in the
daily observing plan– Pick from EUVI, COR1, COR2, HI-1, HI-2
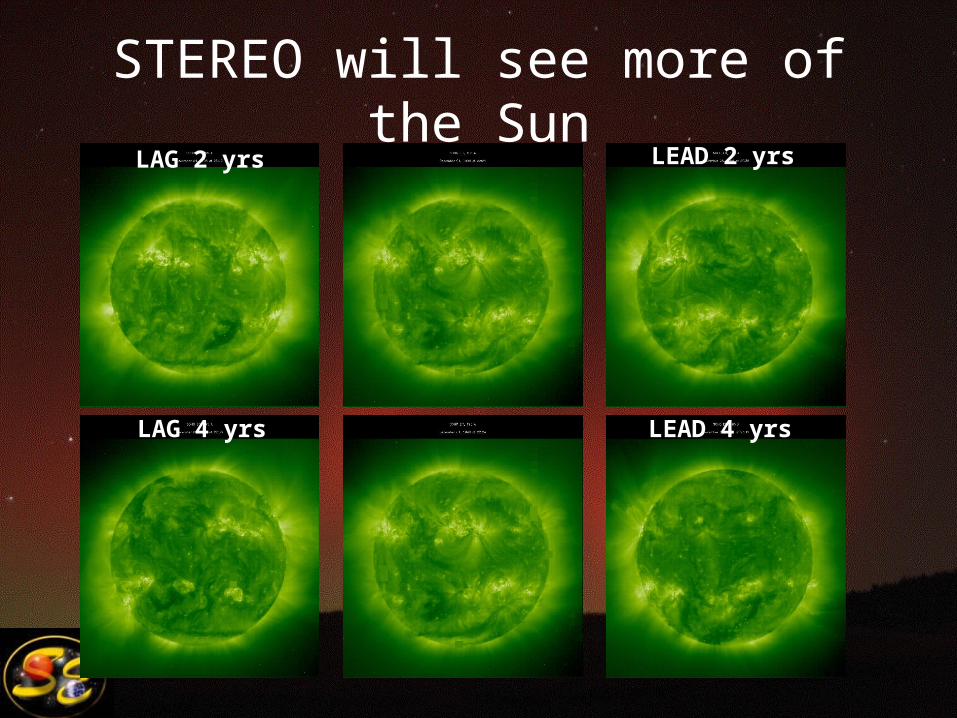
STEREO will see more of the SunLAG 2 yrs LEAD 2 yrs
LAG 4 yrs LEAD 4 yrs
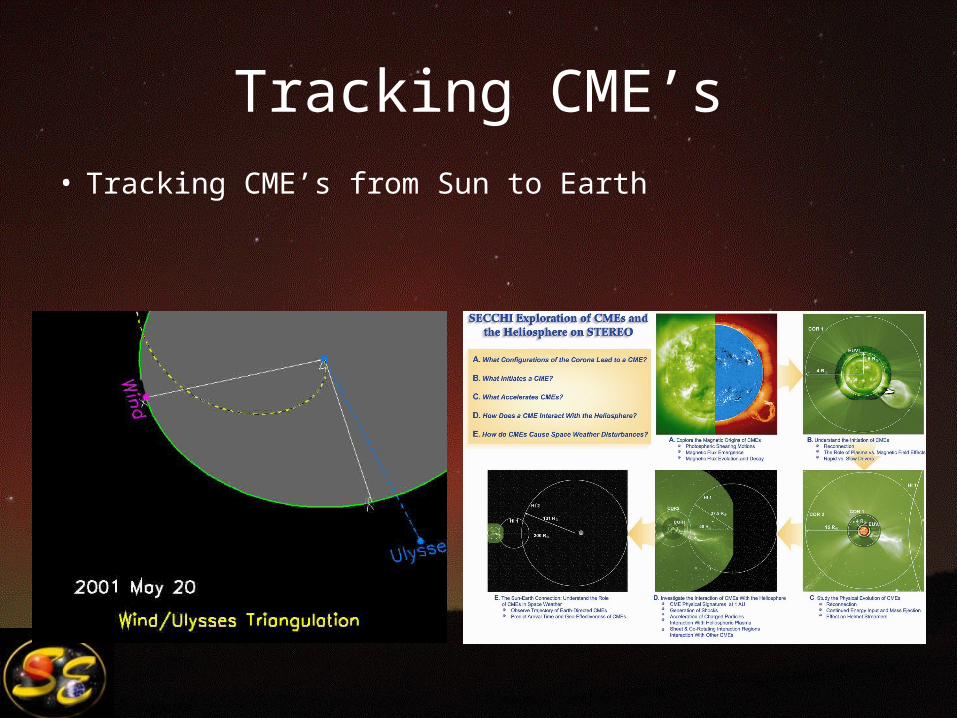
Tracking CME’s• Tracking CME’s from Sun to Earth
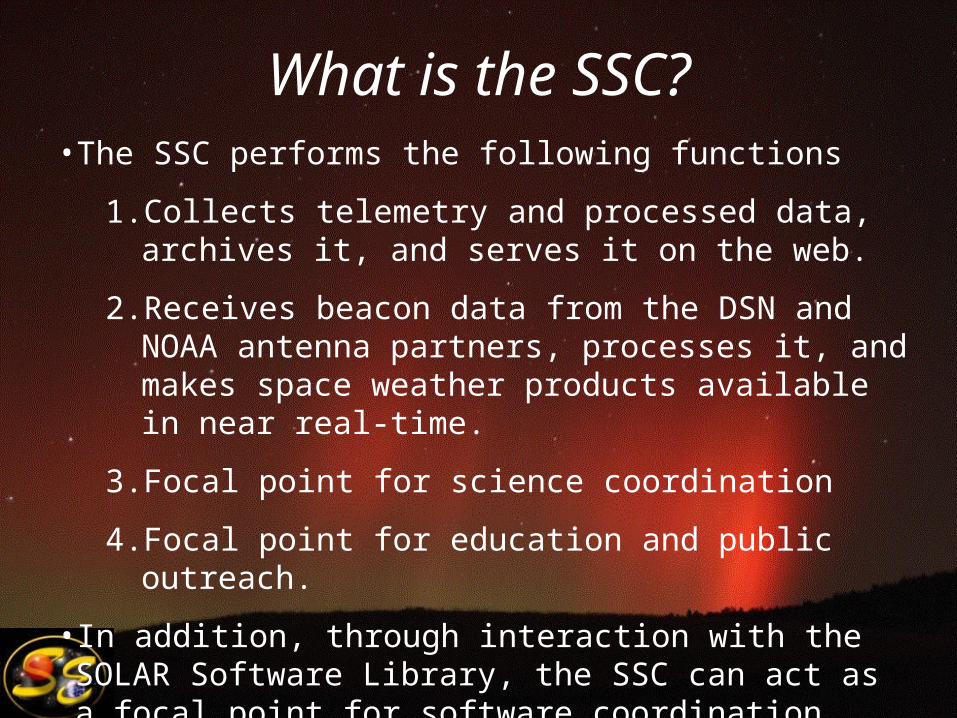
What is the SSC?• The SSC performs the following functions
1. Collects telemetry and processed data, archives it, and serves it on the web.
2. Receives beacon data from the DSN and NOAA antenna partners, processes it, and makes space weather products available in near real-time.
3. Focal point for science coordination
4. Focal point for education and public outreach.
• In addition, through interaction with the SOLAR Software Library, the SSC can act as a focal point for software coordination.
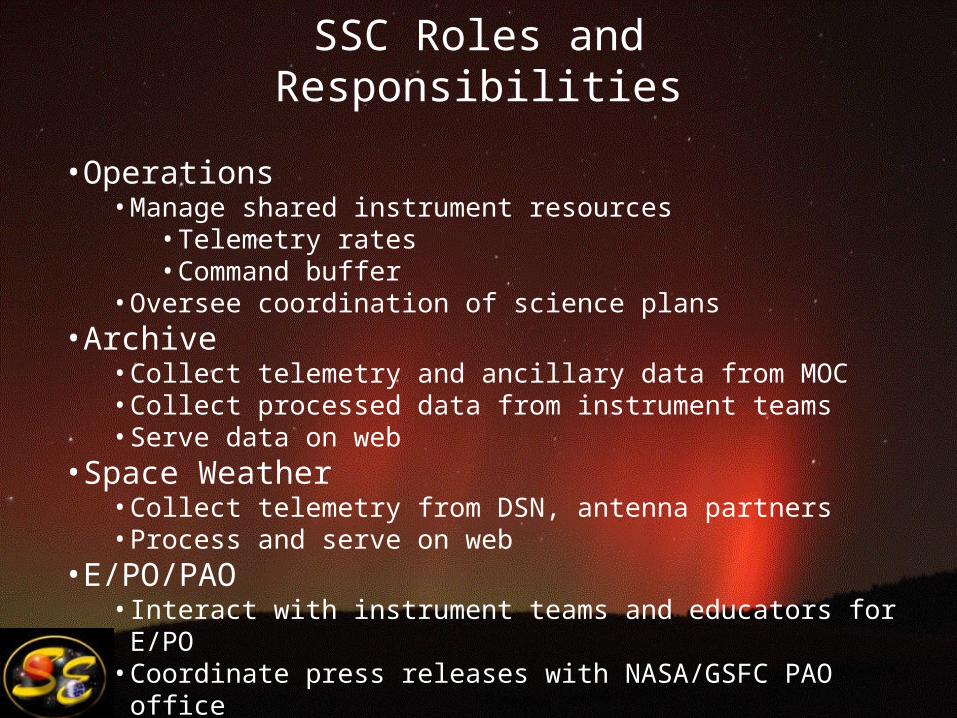
SSC Roles and Responsibilities
• Operations• Manage shared instrument resources
• Telemetry rates• Command buffer
• Oversee coordination of science plans• Archive
• Collect telemetry and ancillary data from MOC• Collect processed data from instrument teams• Serve data on web
• Space Weather• Collect telemetry from DSN, antenna partners• Process and serve on web
• E/PO/PAO• Interact with instrument teams and educators for E/PO• Coordinate press releases with NASA/GSFC PAO office
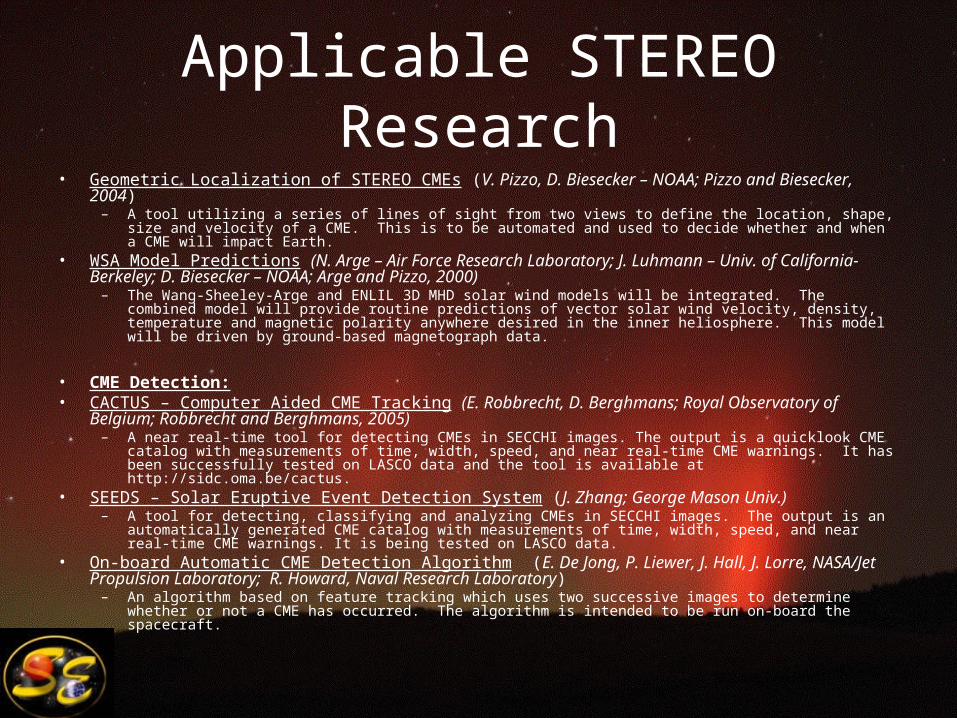
Applicable STEREO Research• Geometric Localization of STEREO CMEs (V. Pizzo, D. Biesecker – NOAA; Pizzo and Biesecker,
2004)– A tool utilizing a series of lines of sight from two views to define the location, shape, size and velocity of a
CME. This is to be automated and used to decide whether and when a CME will impact Earth.• WSA Model Predictions (N. Arge – Air Force Research Laboratory; J. Luhmann – Univ. of
California-Berkeley; D. Biesecker – NOAA; Arge and Pizzo, 2000)– The Wang-Sheeley-Arge and ENLIL 3D MHD solar wind models will be integrated. The combined model
will provide routine predictions of vector solar wind velocity, density, temperature and magnetic polarity anywhere desired in the inner heliosphere. This model will be driven by ground-based magnetograph data.
• CME Detection:• CACTUS – Computer Aided CME Tracking (E. Robbrecht, D. Berghmans; Royal Observatory of
Belgium; Robbrecht and Berghmans, 2005)– A near real-time tool for detecting CMEs in SECCHI images. The output is a quicklook CME catalog with
measurements of time, width, speed, and near real-time CME warnings. It has been successfully tested on LASCO data and the tool is available at http://sidc.oma.be/cactus.
• SEEDS – Solar Eruptive Event Detection System (J. Zhang; George Mason Univ.)– A tool for detecting, classifying and analyzing CMEs in SECCHI images. The output is an automatically
generated CME catalog with measurements of time, width, speed, and near real-time CME warnings. It is being tested on LASCO data.
• On-board Automatic CME Detection Algorithm (E. De Jong, P. Liewer, J. Hall, J. Lorre, NASA/Jet Propulsion Laboratory; R. Howard, Naval Research Laboratory)
– An algorithm based on feature tracking which uses two successive images to determine whether or not a CME has occurred. The algorithm is intended to be run on-board the spacecraft.
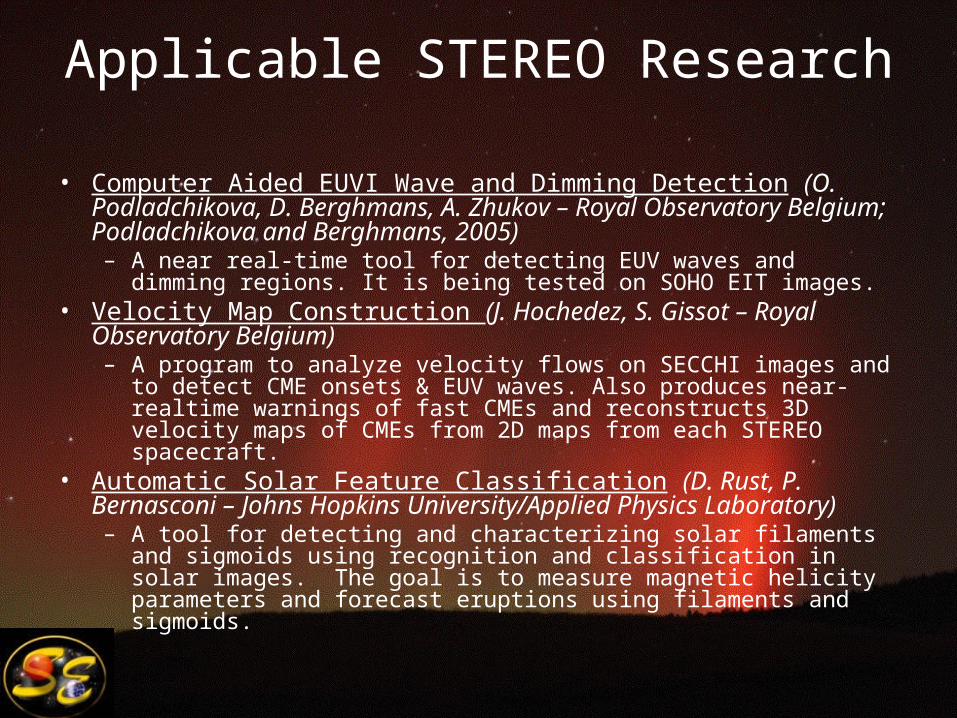
Applicable STEREO Research
• Computer Aided EUVI Wave and Dimming Detection (O. Podladchikova, D. Berghmans, A. Zhukov – Royal Observatory Belgium; Podladchikova and Berghmans, 2005)– A near real-time tool for detecting EUV waves and dimming regions. It is
being tested on SOHO EIT images.• Velocity Map Construction (J. Hochedez, S. Gissot – Royal
Observatory Belgium)– A program to analyze velocity flows on SECCHI images and to detect
CME onsets & EUV waves. Also produces near-realtime warnings of fast CMEs and reconstructs 3D velocity maps of CMEs from 2D maps from each STEREO spacecraft.
• Automatic Solar Feature Classification (D. Rust, P. Bernasconi – Johns Hopkins University/Applied Physics Laboratory)– A tool for detecting and characterizing solar filaments and sigmoids
using recognition and classification in solar images. The goal is to measure magnetic helicity parameters and forecast eruptions using filaments and sigmoids.
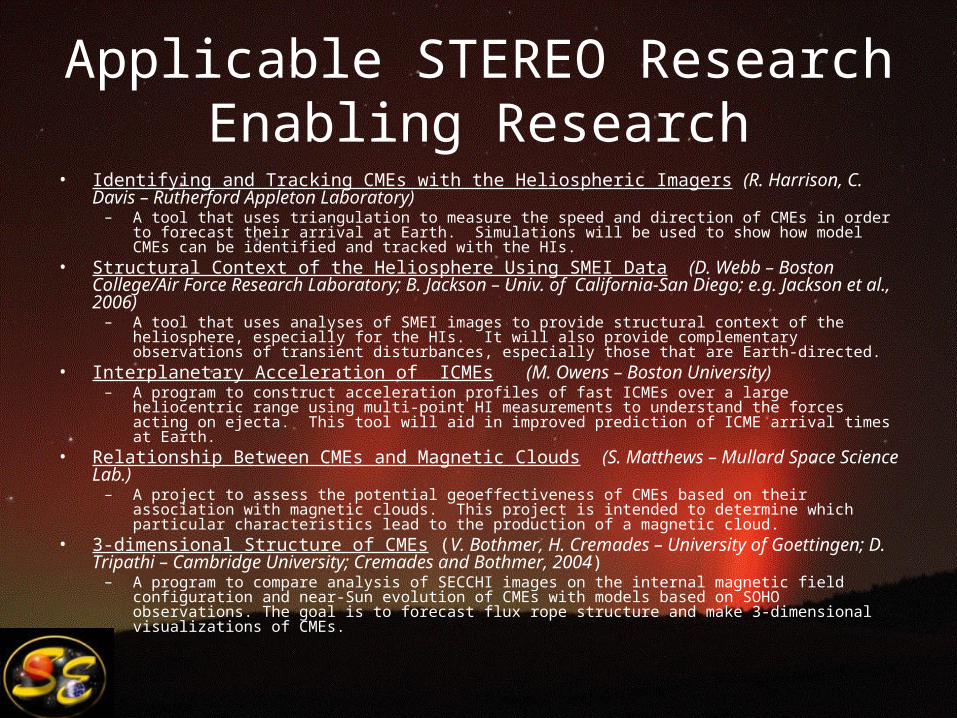
Applicable STEREO ResearchEnabling Research
• Identifying and Tracking CMEs with the Heliospheric Imagers (R. Harrison, C. Davis – Rutherford Appleton Laboratory)
– A tool that uses triangulation to measure the speed and direction of CMEs in order to forecast their arrival at Earth. Simulations will be used to show how model CMEs can be identified and tracked with the HIs.
• Structural Context of the Heliosphere Using SMEI Data (D. Webb – Boston College/Air Force Research Laboratory; B. Jackson – Univ. of California-San Diego; e.g. Jackson et al., 2006)
– A tool that uses analyses of SMEI images to provide structural context of the heliosphere, especially for the HIs. It will also provide complementary observations of transient disturbances, especially those that are Earth-directed.
• Interplanetary Acceleration of ICMEs (M. Owens – Boston University)– A program to construct acceleration profiles of fast ICMEs over a large heliocentric range using multi-point
HI measurements to understand the forces acting on ejecta. This tool will aid in improved prediction of ICME arrival times at Earth.
• Relationship Between CMEs and Magnetic Clouds (S. Matthews – Mullard Space Science Lab.)– A project to assess the potential geoeffectiveness of CMEs based on their association with magnetic
clouds. This project is intended to determine which particular characteristics lead to the production of a magnetic cloud.
• 3-dimensional Structure of CMEs (V. Bothmer, H. Cremades – University of Goettingen; D. Tripathi – Cambridge University; Cremades and Bothmer, 2004)
– A program to compare analysis of SECCHI images on the internal magnetic field configuration and near-Sun evolution of CMEs with models based on SOHO observations. The goal is to forecast flux rope structure and make 3-dimensional visualizations of CMEs.
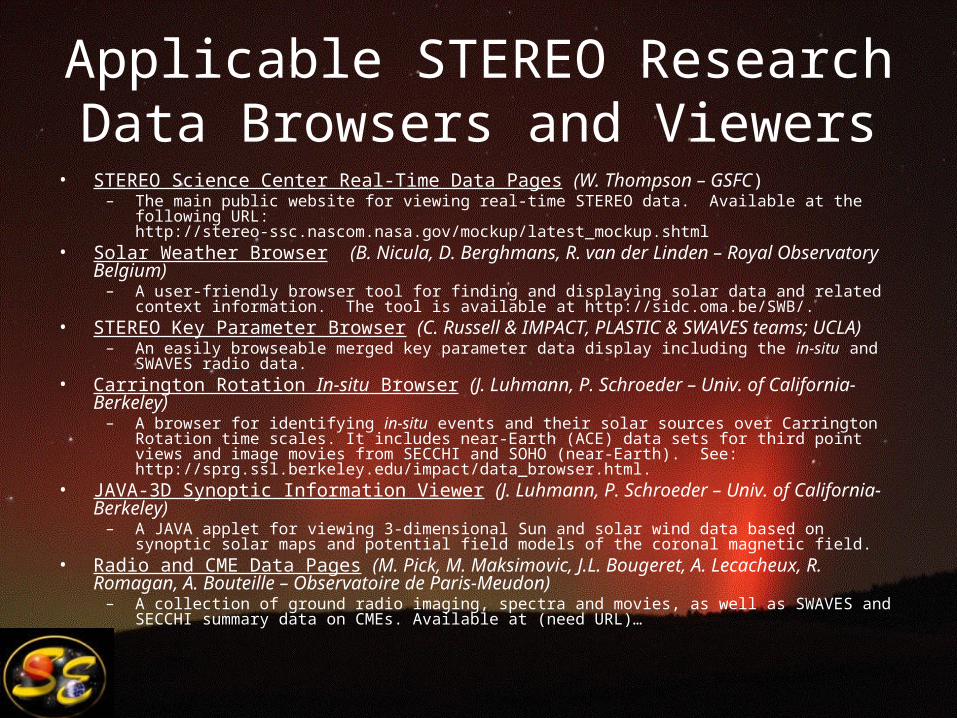
Applicable STEREO ResearchData Browsers and Viewers
• STEREO Science Center Real-Time Data Pages (W. Thompson – GSFC)– The main public website for viewing real-time STEREO data. Available at the following URL:
http://stereo-ssc.nascom.nasa.gov/mockup/latest_mockup.shtml• Solar Weather Browser (B. Nicula, D. Berghmans, R. van der Linden – Royal Observatory
Belgium)– A user-friendly browser tool for finding and displaying solar data and related context information. The tool is
available at http://sidc.oma.be/SWB/.• STEREO Key Parameter Browser (C. Russell & IMPACT, PLASTIC & SWAVES teams; UCLA)
– An easily browseable merged key parameter data display including the in-situ and SWAVES radio data.• Carrington Rotation In-situ Browser (J. Luhmann, P. Schroeder – Univ. of California-Berkeley)
– A browser for identifying in-situ events and their solar sources over Carrington Rotation time scales. It includes near-Earth (ACE) data sets for third point views and image movies from SECCHI and SOHO (near-Earth). See: http://sprg.ssl.berkeley.edu/impact/data_browser.html.
• JAVA-3D Synoptic Information Viewer (J. Luhmann, P. Schroeder – Univ. of California-Berkeley)– A JAVA applet for viewing 3-dimensional Sun and solar wind data based on synoptic solar maps and
potential field models of the coronal magnetic field.• Radio and CME Data Pages (M. Pick, M. Maksimovic, J.L. Bougeret, A. Lecacheux, R.
Romagan, A. Bouteille – Observatoire de Paris-Meudon)– A collection of ground radio imaging, spectra and movies, as well as SWAVES and SECCHI summary data
on CMEs. Available at (need URL)…
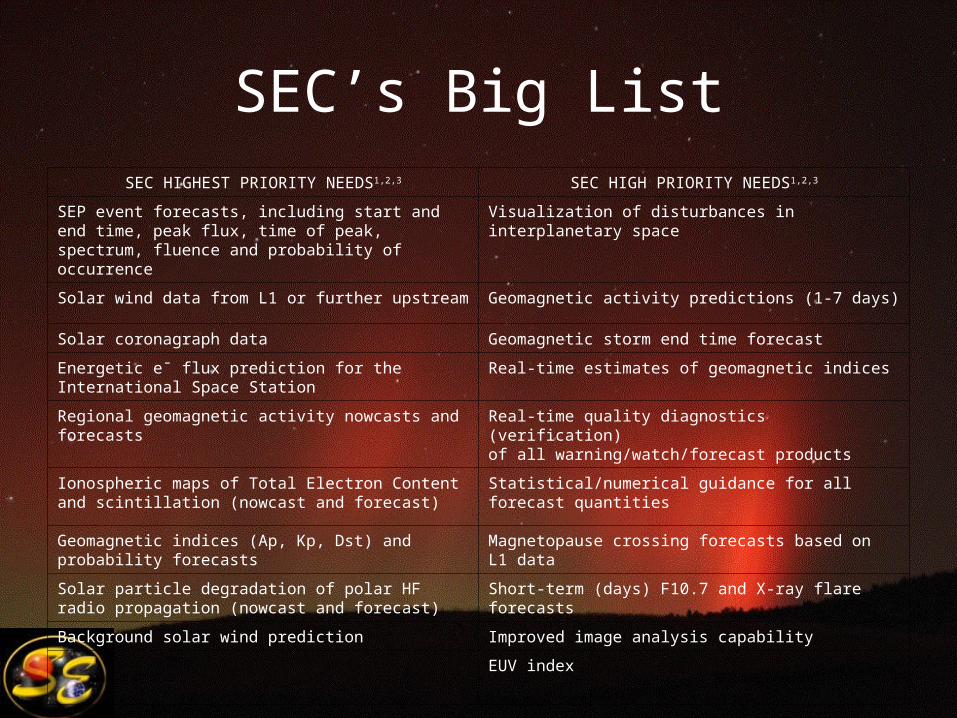
SEC’s Big ListSEC HIGHEST PRIORITY NEEDS1,2,3 SEC HIGH PRIORITY NEEDS1,2,3
SEP event forecasts, including start and end time, peak flux, time of peak, spectrum, fluence and probability of occurrence
Visualization of disturbances ininterplanetary space
Solar wind data from L1 or further upstream Geomagnetic activity predictions (1-7 days)
Solar coronagraph data Geomagnetic storm end time forecast
Energetic e‾ flux prediction for the International Space Station Real-time estimates of geomagnetic indices
Regional geomagnetic activity nowcasts and forecasts Real-time quality diagnostics (verification)of all warning/watch/forecast products
Ionospheric maps of Total Electron Content and scintillation (nowcast and forecast)
Statistical/numerical guidance for allforecast quantities
Geomagnetic indices (Ap, Kp, Dst) and probability forecasts Magnetopause crossing forecasts based onL1 data
Solar particle degradation of polar HF radio propagation (nowcast and forecast)
Short-term (days) F10.7 and X-ray flare forecasts
Background solar wind prediction Improved image analysis capability
EUV index


![Lecture 8 Active stereo& - Stanford UniversitySilvio Savarese Lecture 7 - 12-Feb-18 Lecture 8 Active stereo& Volumetric stereo Reading: [Szelisky] Chapter 11 “Multi-view stereo”](https://img.pdfslide.us/doc/110x75/5f0f7f2f7e708231d444745e/lecture-8-active-stereo-stanford-university-silvio-savarese-lecture-7-12-feb-18.jpg)