Embed Size (px)
Citation preview
5th International Conference and Exhibition on Mass Mining, Luleå Sweden 9-11 June 2008
Utilization of secondary sizing data for improved block cave mine
planning
A. Sinuhaji University of Arizona
S. Dessureault University of Arizona
E. Rubio Universidad de Chile
T. Casten Freeport McMoran
ABSTRACT
Commercial software products collect and store data necessary to fulfil their specific functions such
as production reporting, mine planning, and cost accounting. Information Technologies named
Data Warehousing (DW) and Data Mining (DM), developed in other industries, are designed
specifically to integrate multi-vendor, multi-purpose databases into a structured logical data
infrastructure, then apply analytical tools to facilitate the extraction and/or quantification of
unrecognized patterns and behaviours. A DW specifically for block cave investigation was
developed with real data and tested through the investigation of secondary blasting requirements as
an indicator of draw point reliability. DM and Object quantified a relationship that also generally
identified that rock type, location, Height of Draw, and volume mucked are the leading factors that
influence secondary explosives consumption for oversize.
1 Introduction
Draw point flow reliability is one of the key variables in block cave mine planning. Reliable flow is
dependent on rock fragmentation. Accurate prediction of the drawpoint reliability at the draw points
at the different heights of draws (HOD) would lead to a more reliable short-term mine plan. The
mine plan includes setting manpower levels, equipment selection, explosives inventories, and other
important decisions. Relatively recent open-source developments in information technology would
allow new prediction tools to empirically determine draw point reliability to compliment the
commercial fragmentation distribution prediction tools.
Most block cave operations use several operational and mine planning information technologies to
support their mining operation, such as Fleet Management Systems (i.e. Dispatch®), Planning
Packages (i.e. PCBC), Enterprise Systems (i.e. Ellipse), etc. Most operations also collect and record
important variables such as: rock fragmentation measurements at the draw points, hang-up
occurrences and types, and amount of explosives used to clear the hang-ups and oversize. This vast
amount of data is often kept in separate unlinked databases. However, the data contains valuable
information. Data integration and data mining can be used to reveal the valuable information hidden
in historical operational and planning data through the discovery of patterns and relationships.
Improvements in mine planning can be developed using the knowledge extracted from this
uncovered information.
The following is a description of ongoing research to develop the tools and techniques necessary to
enrich data into information, from which knowledge can be gained which in turn can be used the
reengineer work processes to sustainably induce fact-based action. This particular research project
established a data warehouse of block cave mine records which can be used as the kernel of a larger
empirical data-driven infrastructure for block cave research. Real operational data from the PT
248
Freeport Indonesia DOZ mine was integrated into a flexible data warehouse. The design of the data
warehouse was then tested by applying analytical tools (data mining).
2 Block Cave Fragmentation
Gaining the ability to predict fragmentation reporting to draw points is crucial because many
engineering decisions are based on this key variable (Brown, 2000). According to Laubscher
(1994), these include: draw point size and spacing, equipment selection, draw control procedures,
operational blasting requirements (hang-ups and oversize), in-draw-column comminution processes,
and costs. Achievable production schedules/budgeting is particularly affected by draw point
reliability which is arguably largely controlled by fragmentation. The importance of this issue has
resulted in many commercial fragmentation prediction packages for mine planning such as:
Simblock, MakeBlock, StereoBlock, Block Caving Fragmentation (BCF), Core2Frag, FracMan,
JKFrag among others. Some direct fragmentation distribution measurement techniques through
digital photo analysis and subjective assessments have also been used. According to Brown (2000),
existing prediction tools and techniques show significant discrepancies when compared with actual
(Brown, 2000). More empirically-based modeling may be available due to the accumulation of vast
quantities of detailed production records.
3 Secondary sizing practice in DOZ mine and data collection
There are four mechanisms for handling rock fragments of different sizes in the DOZ mine (Flint,
2005):
1. Direct dumping ore (< 1m3): rock fragments that pass directly through the grizzly are
dumped directly into the orepass by the LHDs.
2. Medium rock fragments (1 - 2 m3): small enough to be loaded and transported by the
LHD but require the rock breaker at the grizzly to further reduce the boulders so that
they can pass through the grizzly openings.
3. Big rock fragments (> 2m3): too large to be trammed by the LHD but safely accessible
from the draw point entry by the secondary blasting machines. These rocks are drilled
with Sandvik Tamrock Commando drills, then loaded with 32 mm cartridge explosives
(henceforth referred to as E32).
4. Hang-up: occurs due to large interlocking fragments in the draw bell. A bundle of
explosive containing 4 to 5 sticks of 55 mm cartridge explosives (henceforth referred to
as E55) are placed next to the possible weakest interlocking point then blasted from a
safe distance.
The time, date, number and type of explosives used for secondary blasting in the DOZ Mine is
recorded and stored in a centralized database named DOZBase. LHD production records are
collected by Dispatch®
are also copied and stored in DOZbase. Several other important variables
are kept in this database. DOZbase is a locally developed centralized database designed for
centralized web-based reporting and is used for data transfer between systems such as PCBC or
CMS with Dispatch®. When this centralized data source is conceptually mapped then integrated
and other data sources added, it can become a data warehouse available for complex analyses. For
example, using production and secondary blasting data to determine likely draw point reliability
(DPR). However, these two data sources alone have many potential variables that may impact on
DPR. Due to the massive volume of data, most of human brains are not able to correlate and
analyze these mountains of data sets, effectively and efficiently, without the help of artificial
intelligence systems (Han, 2006). Data mining is a source of analytical tools that can enable mine
249
planners to do complex and non-linear analyses on multiple large data sets collected from
contemporary block cave mine operations, effectively and efficiently.
4 Data Warehouse (DW) and Data Mining (DM)
Data warehousing technology was developed to store massive data sets and enable the linking and
analysis of tables from different source systems (multi-vendor environments), for example, linking
accounting information with FMS. The automated functions used in populating a data warehouse
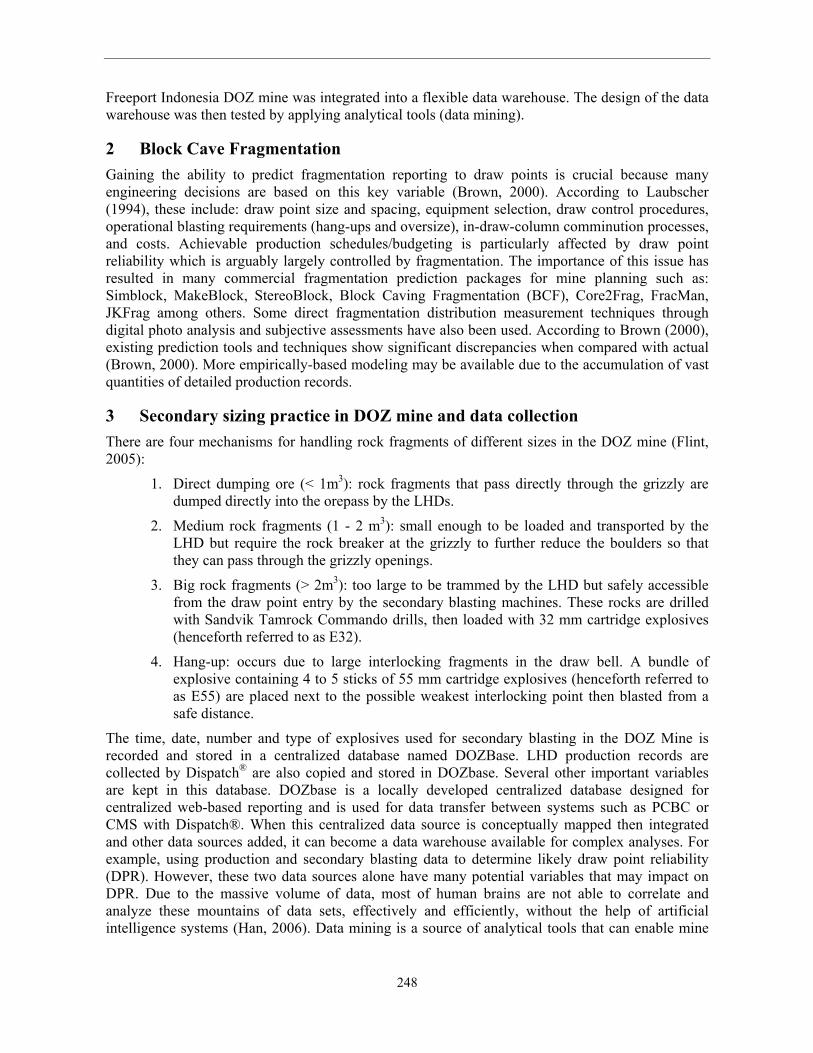
are known as Extract Transform Load (ETL) or Data Transformation Services (DTS). Figure 1
illustrates this process. The source data is initially extracted from commercial source systems at
defined periods into temporary staging tables. The data is then transformed by correcting errors and
translating the data into a consistent conceptual model and format. For example, in source data from
different systems, the date can be textual (July 1st, 2006), numeric (07/01/06), or in code (37809).
Unless otherwise told, the database would not know that these are the same dates. Similarly, the
conceptual links between two previously disparate tables are programmed. For example, the date of
a secondary blast in a particular location (draw point in a particular panel), is linked to a date and
location concept that is also present in the production records tables, although perhaps stored in a
different format. DWs work in conjunction with DM to help centralize and organize information
(Savelieva, et al., 2005 and Chapple, 2006). The design process of a DW begins with data
characterization whose tasks include:
understanding the data by creating a data dictionary (called metadata) and entity relationship
diagram (graphical representation of the relationships between tables) of the original source
system (this information is often unavailable even from commercial software vendors);
identifying common conceptual links and designs how such links can be coded;
identifies errors, omissions, and inconsistencies in the data and resulting corrective actions.
Figure 1 General Concepts in DW and its relation to DM (Dessureault, 2005)
If the data in the DW contains significant error, the inputs used in DM is consequently invalid and
may lead to incorrect business decisions (De Ville, 2001). For example, the blasting tables in
DOZBase recorded shift name as: “Swing” or “Afternoon” for the shift between day and night shift.
In the production table, shift is recorded as “d”, “s”, or “n” (denoting day, swing, and night shifts).
Therefore, “Swing” and “Afternoon” had to be combined and all shift names had to be changed to
lower-case and only one letter so that they could be linked. In general, data characterization is often
the most important and time consuming steps.

250
The next step prior to DM is data integration, where the common concepts (such as time, location,
equipment, person, etc…) are identified and programmed into the DW. There are different
approaches (known as schemas) for structuring DWs, one of the most popular being the Star
schema. A Star schema typically consists of a single “fact” table (centrally located) and one or more
dimensional tables radiating outward from the fact table as illustrated in Figure 2. This approach
facilitates integration where multiple fact tables can be linked together through common dimension
tables, known as the Constellation of Stars schema.
Figure 2 Star Schema
The main objective of a DW is to bring together information from disparate sources and put the
information into a format that is conducive to making business decisions. “DM, also known as
Knowledge Discovery in Databases (KDD), is the process of exploration and analysis, by automatic
or semiautomatic means, of large quantities of data in order to discover meaningful patterns and
rules” (Berry, 2000) that can be applied to making business decisions. DM combines the use of
large data sets, algorithms, and visualization to help analysts better understand their systems.
There are many new and old algorithms used in DM (Tang and MacLennan, 2005), including:
artificial neural networks, genetic algorithms, decision trees, nearest neighbor method, rule
induction, etc. These techniques are primarily for prediction, pattern recognition, and discovery.
Different analysis cases may have different algorithms that would most suit the analysis problem.
Therefore, understanding the nature of the analytical problem and selecting the proper mining
algorithm is necessary (De Ville, 2001) (Tang and MacLennan, 2005).
5 DM examples
This research tested the validity of the DW design and approach by applying DM to create
analytical products. The analysis focused on developing an empirical model for secondary blasting
requirements. The data characterization process identified and characterized three key data tables:
Production: stores production related information such as number of buckets pulled,
LHD, mucking location, crew, date, shift, predicted HOD, etc
Secondary blasting: stores secondary blasting information such as number and type of
explosive used, blasting location, date and time, etc
Rock prediction: stores the prediction of rock types and metal grades pulled by date,
location, etc…
251
Data characterization found that most mucking records from draw points with Heights of Draw
(HOD) between 0 and 20 meters were not recorded consistently. The mucking records for this part
of the ore column were recorded as “draw bell” rather than allocating that production to a particular
named draw point, HOD, rock type, etc.... Therefore, some potentially important information about
cave fragment behaviors and explosive consumption patterns when mucking the undercut and draw
bells are missing.
A second key consideration was that not all draw points have reached an HOD higher than 350
meters, either because they were not planned to do so or had not reached the end of their life cycle.
A full draw point life cycle live is necessary to study the block cave fragment behavior and
explosive consumption patterns throughout its entire range of HOD. Therefore, to make an accurate
analysis, draw points which have not reached an HOD of a particular height were filtered-out of
most analyses (only those draw points with a full set of records from 20 to 350 were included in the
analysis set). Other filtering of erroneous records or record inconsistencies were applied. The
subsequent analytical approaches used tools, such as: DM algorithms, OLAP Cubes, and OBDC-
linked SQL Server View-driven pivot tables and pivot charts (note: all graphs shown use OBDC-
linked data).
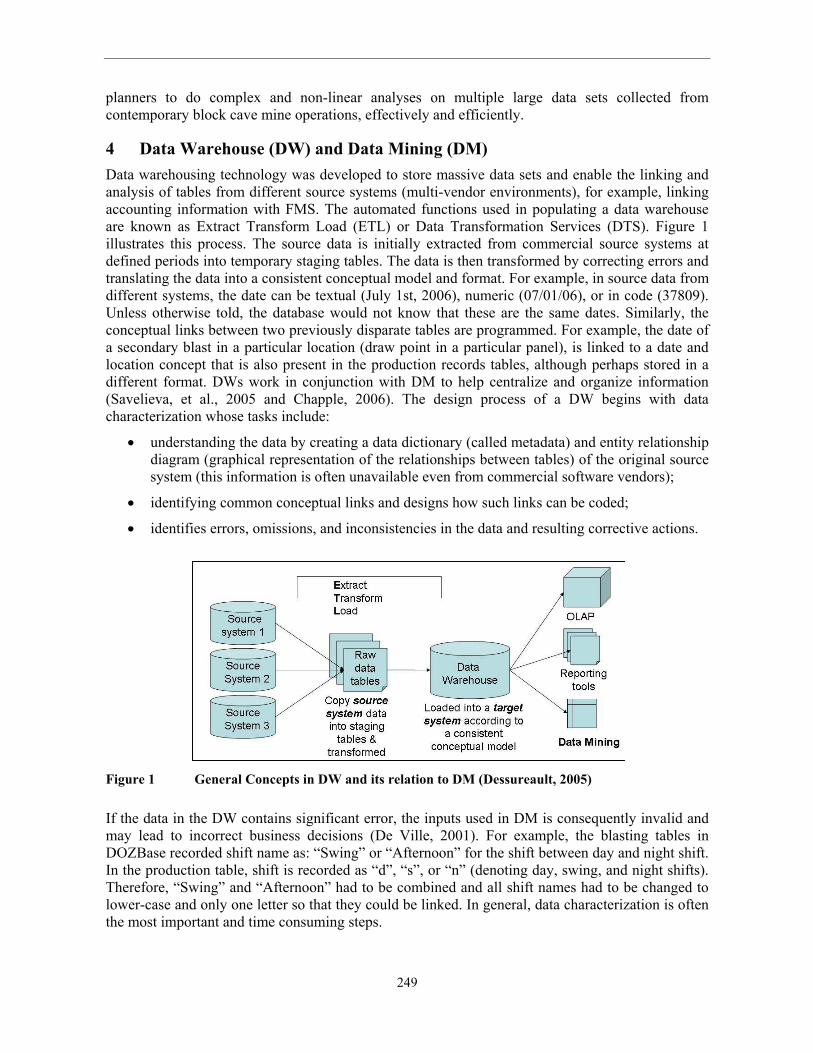
Figure 3 shows the production performance and explosive consumption for secondary blasting for
then entire life cycle of draw points (HOD of 20 to 350) by increments of 10 meters of HOD. The
left Y axis shows the sum of tons (both planned/”target” and actual) and sum of explosives
cartridges used of each type (E32 and E55) for increments of 10 HOD. For example, between 40
and 50 HOD, actual tons mucked from all draw points that have completed their life cycle amount
to 1.1 million tons and 4800 cartridges of type E32 (to clear boulders/oversize) and 1100 cartridges
of type E55 (to clear hang-ups). Unexplained is how the tonnages can vary at these different levels
of draw, although the presumed shape of the draw (presumed to be shaped as elongated ovals of
particle flow theory in cave mass) may account for this shape.
0
1000
2000
3000
4000
5000
6000
7000
0
200
400
600
800
1000
1200
1400
0 50 100 150 200 250 300 350 400
Su
m o
f E
xplo
sive
Use
d
Su
m T
ons
by H
OD
(in
1000
)
HOD (m)
Prod. Actual
Prod. Plan
Expls. 32
Expls. 55
Figure 3 Sum of Production tons and Explosives Cartridges versus 10 m increments of HOD.
The graph shows that actual production closely follows the draw order. The draw order (a daily
plan) is frequently adjusted to account for productive capacity of the draw points (i.e. if the draw
point cannot produce, its draw order is reduced) and to control the cave front shape. The earliest

252
product rate (HOD 20-30 m and likely even earlier, < 20 m) was relatively high until the production
blasting-induced fragmented undercut rings were mined-out. Production dropped as undercut ore
was mucked out and replaced by the oversize boulders of early cave propagation. This caused an
increase in explosives consumption for secondary blasting activities. The explosives consumption
parallels production tonnage although with a sharper peak at an HOD between 150m and 170m.
Afterward, the explosive consumption level decreases much more sharply than production
curtailment (HOD 170 – 270). One of the possible reasons for this reduction is the comminution
effect: when rock flows through many meters of HOD, it is crushed into smaller fragments. The
degree of secondary fragmentation depends on several factors such as the stress regime in the cave
mass, draw rate, rock properties, etc (Brown, 2004).
Figure 4 shows the relationship between production performance versus total hang up days at
different draw columns. The pattern closely mirrors figure 6.1 where explosives consumption
generally increases and decreases with tonnage, however, the variability in the explosives
consumption records when compared to the relatively smooth tonnage rates in both graphs would
indicate a that other variable(s) likely play an important role in draw point reliability (aside from the
obvious production levels). Further investigation is required to define the most significant factors
for secondary blasting explosive cartridge consumption (being an indicator of draw point
reliability). Other key variables such as rock type, production target, etc; were included in the
integration but cannot be adequately represented on a two-dimensional graph. When there are
multiple potential controlling variables, DM can be used to determine the relative strength of
correlation between known input variables and a desired output variable.
Figure 4 Production performance and hang up days versus HOD
Determining Correlation between Variables.
A key objective of this body of work is to demonstrate the ease with which novel analyses can be
undertaken through data warehousing such as the application of DM algorithms. For example, the
‘Dependency Network’ (DN) is a DM algorithm that can be used as an alternative to Bayesian
networks which represents probabilistic relationships. It can be used in density estimation,
collaborative filtering (the task of predicting preferences), and the visualization of predictive
relationships. It does not denote causality. In this application, the algorithm is used for collaborative
filtering: probabilistically ranking the factors that show correlations from historical data, the first
case is to determine the network for the available variables showing correlation with explosives
253
consumption. The variables are selected as those that can be used in engineering to schedule or
budget explosives use, namely: full list of variables is:
HOD @ 10 (meters range)
Average tons / day
Rock type
Panel location (name, i.e. Panel 16, 17, etc…)
Originally there were 13 rock types tracked by the DOZ mine, however, in order to simplify the
analysis, the rock types were regrouped into 6 similar rock types. The grouping is based on the
presence of similar dominant rock types in the ore.
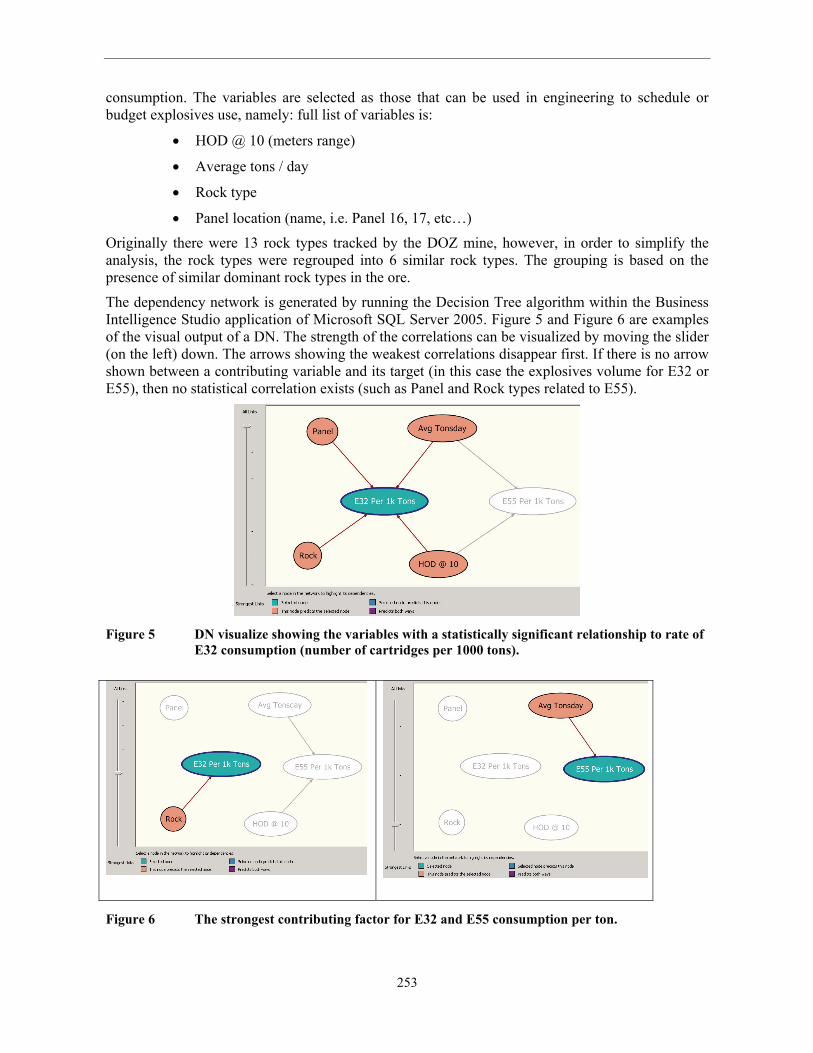
The dependency network is generated by running the Decision Tree algorithm within the Business
Intelligence Studio application of Microsoft SQL Server 2005. Figure 5 and Figure 6 are examples
of the visual output of a DN. The strength of the correlations can be visualized by moving the slider
(on the left) down. The arrows showing the weakest correlations disappear first. If there is no arrow
shown between a contributing variable and its target (in this case the explosives volume for E32 or
E55), then no statistical correlation exists (such as Panel and Rock types related to E55).
Figure 5 DN visualize showing the variables with a statistically significant relationship to rate of
E32 consumption (number of cartridges per 1000 tons).
Figure 6 The strongest contributing factor for E32 and E55 consumption per ton.
254
As can be seen in Figure 6, the variable having the strongest correlation (i.e. ‘dependency’) to E32
consumption is ‘Rock’, the column name that stores rock type. The three other variables with the
highest correlation in order of strongest to weakest are HOD, average tons per day, panel location.
Panel location is likely closely associated to rock type. Hence, the relatively high variability of E32
when compared to tonnage as recognized in Figure 3 is most likely due to geological factors.
Regarding E55, the DN shows only two block caving variables with statistically relevant correlation
between E55, strongest being the average tons produced per day and weakest (but still statistically
relevant) being HOD.
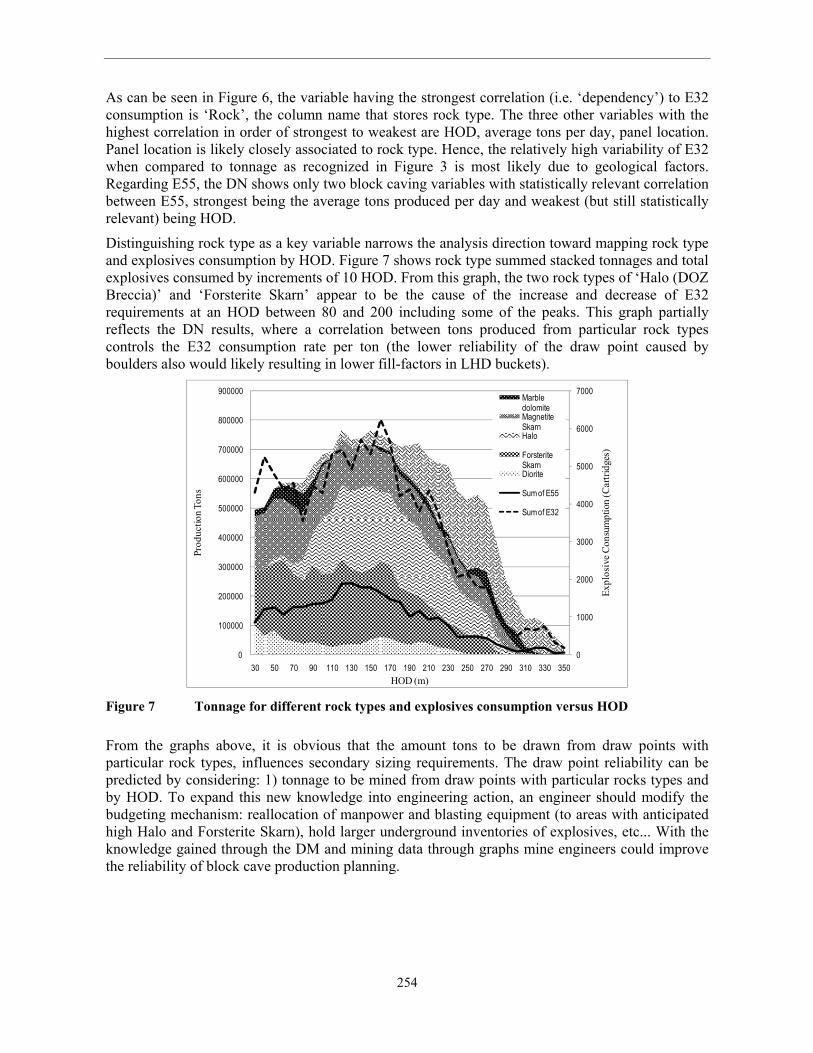
Distinguishing rock type as a key variable narrows the analysis direction toward mapping rock type
and explosives consumption by HOD. Figure 7 shows rock type summed stacked tonnages and total
explosives consumed by increments of 10 HOD. From this graph, the two rock types of ‘Halo (DOZ
Breccia)’ and ‘Forsterite Skarn’ appear to be the cause of the increase and decrease of E32
requirements at an HOD between 80 and 200 including some of the peaks. This graph partially
reflects the DN results, where a correlation between tons produced from particular rock types
controls the E32 consumption rate per ton (the lower reliability of the draw point caused by
boulders also would likely resulting in lower fill-factors in LHD buckets).
0
1000
2000
3000
4000
5000
6000
7000
0
100000
200000
300000
400000
500000
600000
700000
800000
900000
30 50 70 90 110 130 150 170 190 210 230 250 270 290 310 330 350
Ex
plo
sive C
on
sum
pti
on
(C
art
rid
ges
)
Pro
du
cti
on T
on
s
HOD (m)
Marble dolomiteMagnetite SkarnHalo
Forsterite SkarnDiorite
Sum of E55
Sum of E32
Figure 7 Tonnage for different rock types and explosives consumption versus HOD
From the graphs above, it is obvious that the amount tons to be drawn from draw points with
particular rock types, influences secondary sizing requirements. The draw point reliability can be
predicted by considering: 1) tonnage to be mined from draw points with particular rocks types and
by HOD. To expand this new knowledge into engineering action, an engineer should modify the
budgeting mechanism: reallocation of manpower and blasting equipment (to areas with anticipated
high Halo and Forsterite Skarn), hold larger underground inventories of explosives, etc... With the
knowledge gained through the DM and mining data through graphs mine engineers could improve
the reliability of block cave production planning.

255
6 Conclusions and Recommendations
The research project successfully proved that a block cave DW for facilitating multiple DM
analyses for block caving is possible. A DW infrastructure was created from which several analyses
were rapidly created (once the DW was built, the analyses took relatively little time). These
analyses took advantage of the huge amount of block cave operational data generated and used at
the mine site for use in commercial products. Potential patterns, behaviors, and knowledge relating
to secondary blasting as an indicator of draw point reliability were identified through data
warehousing, which integrates this multi-vendor data environment, and DM, which provides
analytical and visualization tools,
This research was performed using exclusively DOZ mine data, similar research could be applied
by incorporating other block cave mine data. This could help model and quantify general block cave
behaviors rather than the particularities of a single operation. A second recommendation for the
future is to incorporate not only operational and planning data, but also other key data sources such
as geological, costing, metal price, safety, equipment maintenance, etc. Having these data sources
integrated in a common DW would enable future researchers to investigate not only technical
aspects but also economics and budgeting. The ultimate objective of this research is to incorporate
the knowledge obtained through the research into the engineering and management work flow.
Therefore, a systematic approach to reengineer block cave mine planning and management should
be developed permitting a sustainable change toward a knowledge-driven mine planning and
control process.
Acknowledgements
The authors would like to thank the MIS group at PT Freeport Indonesia, Tim Casten of Freeport
McMoRan Copper and Gold, and Frank Russell of Rio Tinto who provided the data, permission,
and opportunity to make this research possible.
References:
Barber, J., 2000. Freeport Indonesia’s Deep Ore Zone Mine. Proceedings MassMin 2000, Brisbane, (Ed: G Chitombo),
289- 294. Australasian Institute of Mining and Metallurgy: Melbourne
Berry, M. and Linoff, G., 2000, Mastering Data Mining, Wiley Computer Publishing, pp 7 – 20
Brown, E.T., 2000, Block Caving Geomechanics, JKMRC Monograph Series in Mining and Mineral Processing 3.
Chapple, M., 2006, Data Mining: An Introduction. Available at:
http://databases.about.com/od/datamining/a/datamining.htm. Accessed on June 29, 2006
De Ville, B., 2001, Microsoft Data Mining, Digital press, pp 44 – 45.
Dessureault,S and Sinuhaji, A, 2008, Data Mining Mine Safety Data, Mining Engineering Journal, August 2007.
Diering, T., 2004, Computational Considerations for Production Scheduling of Block Cave Mines, Massmin 2004
proceedings, Santiago, August 2004, pp 135 – 140
Flint, D., et al., 2006, Secondary Breakage Practice at the DOZ Block Cave Mine, 9th Underground Operator
Conference, AusIMM, Perth
Han, J. and Lamber, M., 2006, Data Mining, Concept and Techniques, Morgan Kaufman Publisher.
Laubscher D. H., 2001, Cave Mining – The State of the Art, Underground Mining Methods, pp 455 - 464.
Rubio, E., and Scoble M, 2004. Toward an Integration Approach to Block Cave Planning, Massmin 2004 proceedings,
Santiago, August 2004, pp 128 – 134
Tang, Z. and MacLennan, J., 2005, Data Mining with SQL Server 2005, Wiley Publishing, pp 145 – 167
Savelieva, E. et al, 2005, Data Mining Approach for Environmental Data Predictions and Classification, Application of
Computers and Operations Research in the Minerals Industry, Tucson, USA, pp 253– 258