Embed Size (px)
Citation preview
Utility-scale renewable energy – 2017Market Intelligence Report–
18 Roeland Street, Cape Town, 8001, South Africa
Editorial and review: Salomé Bronkhorst, Bruce Raw, Mike MulcahyImages: GreenCapeLayout and design: Deep Agency
GreenCapeGreenCape is a non-profit organisation that drives the widespread adoption of economically viable green economy solutions from the Western Cape. Our vision is for South Africa to be the green economic hub of Africa.
We work with businesses, investors, academia and government to help unlock the investment and employment potential of green technologies and services, and to support a transition to a resilient green economy.
AcknowledgementsWe thank Maloba G. Tshehla for the time and effort that went into compiling this Market Intelligence Report (MIR).
DisclaimerWhile every attempt was made to ensure that the information published in this report is accurate, no responsibility is acceptedfor any loss or damage that may arise out of the reliance of any person or entity upon any of the information contained in this report.
GreenCape does not endorse or directly support any one company, brand or enterprise. We provide free market intelligence, an advocacy platform and networking opportunities for all our stakeholders across several sectors.
Copyright © GreenCape 2017
This document may be downloaded at no charge from www.greencape.co.za. All rights reserved.
Subscribe to receive e-mail alerts or GreenCape news, events and publications by registering as a member on our website: www.greencape.co.za. Image courtesy of: Acciona Energy (South Africa)Caption: Gouda wind farm embodies the transformation of South Africa’s electricity sector. Gouda is the country’s first concrete tower wind farm, with concrete units manufactured locally and assembled on site, achieving stipulated local content requirements.
IIIII Utility-Scale Renewable Energy: Market Intelligence Report 2017Utility-Scale Renewable Energy: Market Intelligence Report 2017
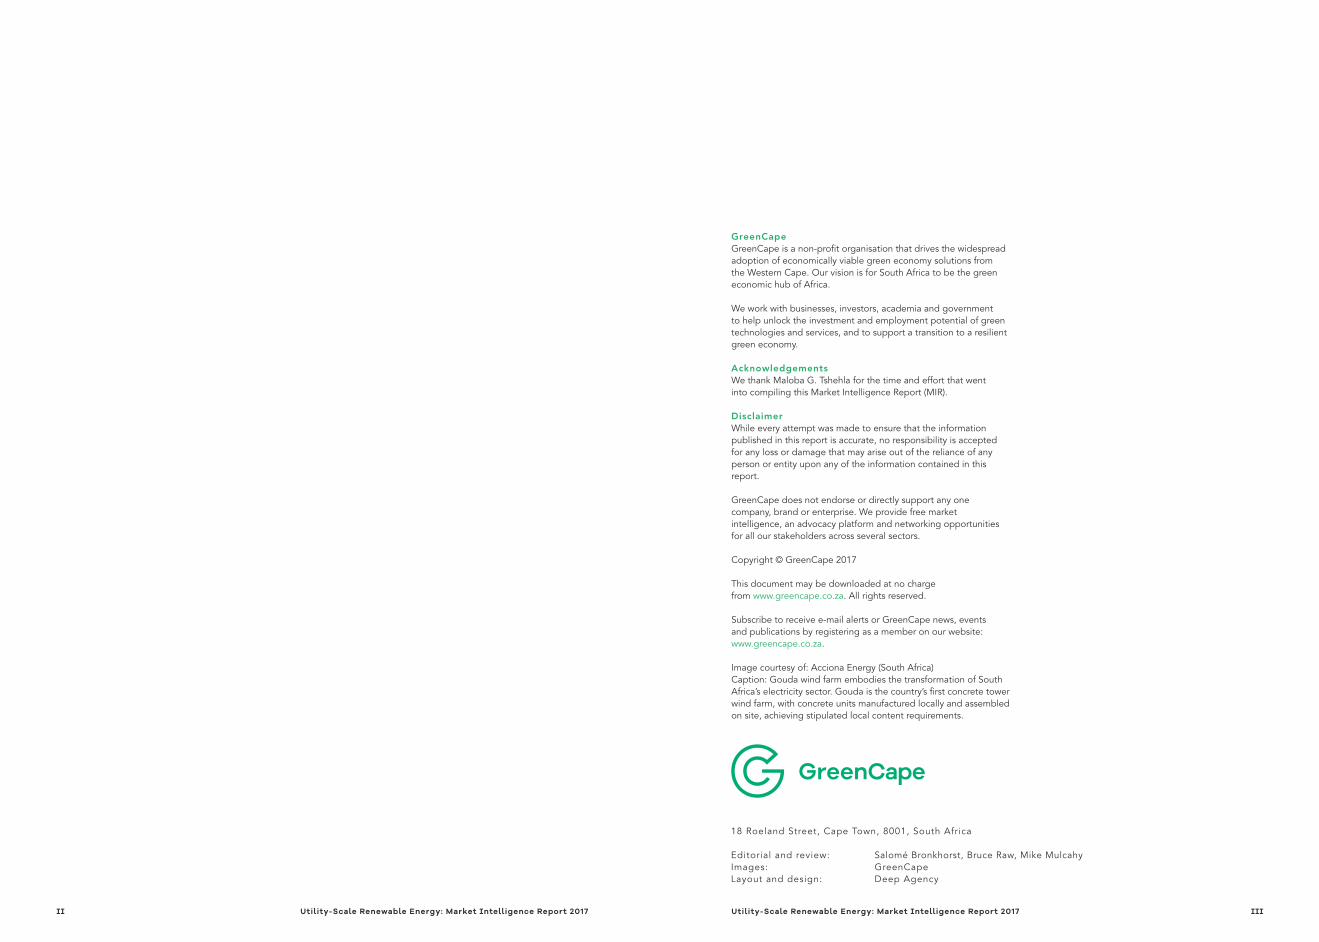
List of figures VList of tables VIList of acronyms and abbreviations VIIExecutive summary 8
11121213141518222223252529293235353737424448
Introduction and purposeIndustry overview2.1. Context2.2. The REIPPPP2.3. Key players2.4. Market size2.5. Beyond kWhs towards developmentPolicies and regulation3.1. Guiding policies3.2. Government departments involved in the energy and electricity sectorOpportunities and barriers4.1. Growth forecast4.2. Local government power procurement4.3. Economic development presents strategic advantage for bidding 4.4. Market uncertaintiesFunding and incentives5.1. Local content and manufacturing5.2. A conducive project development eco-system5.3. Available general funding solutions for green economic activity5.4. Renewable energy-related funding mechanisms and optionsThe Western Cape: Africa’s green economy hubGreenCape’s support to businesses and investors
51
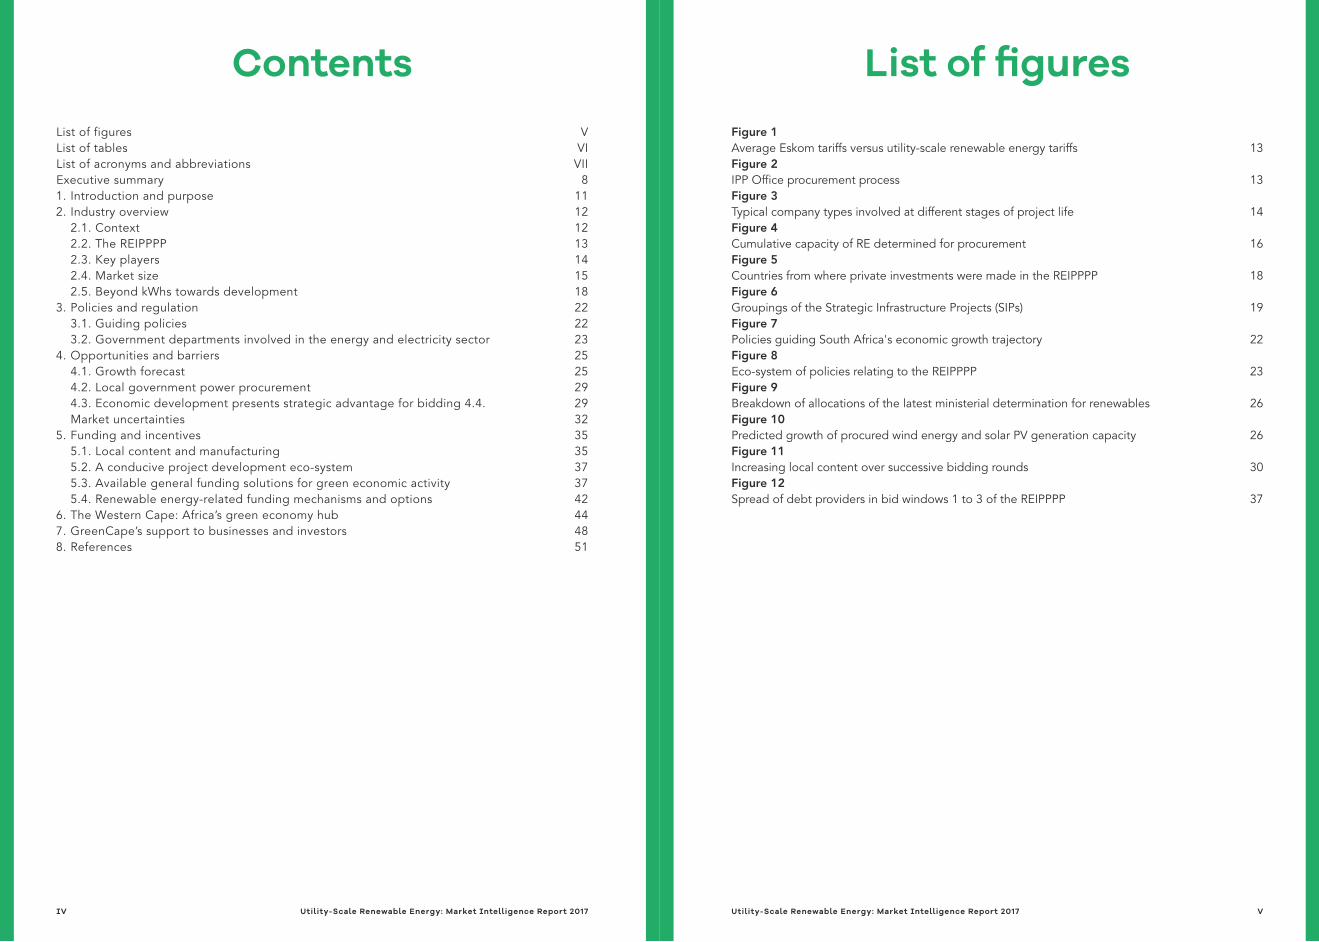
Figure 1Average Eskom tariffs versus utility-scale renewable energy tariffs 13Figure 2IPP Office procurement process 13Figure 3Typical company types involved at different stages of project life 14Figure 4Cumulative capacity of RE determined for procurement 16Figure 5Countries from where private investments were made in the REIPPPP 18Figure 6Groupings of the Strategic Infrastructure Projects (SIPs) 19Figure 7Policies guiding South Africa's economic growth trajectory 22Figure 8Eco-system of policies relating to the REIPPPP 23Figure 9Breakdown of allocations of the latest ministerial determination for renewables 26Figure 10Predicted growth of procured wind energy and solar PV generation capacity 26Figure 11Increasing local content over successive bidding rounds 30Figure 12Spread of debt providers in bid windows 1 to 3 of the REIPPPP 37
Contents List of figures
VIV Utility-Scale Renewable Energy: Market Intelligence Report 2017Utility-Scale Renewable Energy: Market Intelligence Report 2017
Table 1Actual procured generation capacities per REIPPPP bid window 17Table 2Tariffs offered by solar PV, wind and CSP projects over bid windows 17Table 3Private financiers participating in the REIPPPP 38Table 4Energy services and renewable energy-specific funding mechanisms available 42
AUW African Utility WeekCCA customers controlled areaCOD commercial operation dateCPUT Cape Peninsular University of TechnologyCSIR Council for Scientific and Industrial ResearchCSP concentrated solar powerDBSA Development Bank of Southern AfricaDEA department of environmental affairsDoE department of energydti department of trade and industryED enterprise developmentEKF Denmark Export Credit AgencyEPC Engineering procurement and constructionETI employment tax incentiveGWp Gigawatt peakIRP integrated resource planIDC Industrial Development CorporationIFC International Finance CorporationICN International Cleantech NetworkIEP Integrated Energy PlanIPP independent power producerkWh kilowatt-hourLNG Liquefied natural gasMWp Megawatt peakNDP National Development PlanOEM original equipment manufacturerO&M operation and maintenancePPA power purchase agreementPV photovoltaicRE renewable energyREIPPPP Renewable Energy Independent Power Producer Procurement ProgrammeRECP Renewable Energy Cooperation ProgrammeRMB Rand Merchant BankSAPVIA South African Photovoltaic Industry AssociationSARETEC South African Renewable Energy Technology CentreSAWEA South African Wind Energy AssociationSED socio-economic development
List of tables List of acronyms and abbreviations
Utility-Scale Renewable Energy: Market Intelligence Report 2017Utility-Scale Renewable Energy: Market Intelligence Report 2017 VIIVI
The global rise in the uptake of renewable energy (RE) continues, with a mix of firsts and biggests taking place in 2016. These range from record-breaking solar PV plant
sizes to the longest manufactured wind blade yet.
Executive summary
South Africa’s green economy, partly driven by the country’s utility-scale Renewable Energy Independent Power Production Procurement Programme (REIPPPP), reflects these trends and is leading the way in some areas. According to Moody’s, South Africa had the fastest growing green economy in the world in 2015.
The REIPPPP, a key factor in this growth, is in its sixth year and has achieved remarkable successes. To date, the programme has:
■ Procured over 6 300 MWp of RE generation capacity, of which over 2 500 MWp has been connected and is feeding electricity into the national grid1.
■ Selected 102 preferred bidders to develop utility-scale projects across the country – with projects in every province across South Africa.
■ Received a ministerial determination to procure a further 6 300 MWp of generation capacity. This is the second time capacity to the programme has been doubled – a testimony to its success.
■ Attracted over R195 billion of investment into South Africa, with over 25% from foreign investors2. In doing so, the programme, through local content requirements, has successfully stimulated the development of a local RE technology components manufacturing sector. Given the additional 6 300 MWp still to be procured, this sector is set to grow further.
■ Achieved significant technology price reductions, with South Africa boasting some of the world’s lowest clean energy costs3.
Beyond these successes, the programme and, consequently, the utility-scale RE industry, is well positioned to continue contributing to South Africa’s national development as enshrined in the government’s strategic infrastructure projects (SIP) and the National Development Plan (NDP).
The programme’s socio-economic development (SED) and enterprise development (ED) mechanisms give successful project developers a unique opportunity to be competitive in their bidding strategy, while contributing meaningfully to the local and national economy.
■ Project developers have fully embraced the SED/ED component of the REIPPPP, resulting in numerous inspiring contributions to priority areas on the government’s developmental agenda.
■ Among other areas, these contributions span community development, local economic development, skills development and early childhood development.
The recent uncertainties involving the state-owned utility, Eskom, highlight the need for reforms in an evolving energy sector, where electricity generation, transmission and distribution systems require unbundling. The interest from local municipalities in procuring RE generation capacity from independent power producers (IPPs) contributes further to the shift in the structure of the country’s power sector.
Evidently, the South African government is committed to ensuring that the country’s model for public-private power procurement, widely rated as world-class, continues. For instance, during the impasse with Eskom, the Presidency, the Deputy President, the Minister of Energy and the Finance Minister all expressed explicit support for RE procurement. This was finally resolved when the President made a directive during the 2017 State of the Nation Address for Eskom to sign outstanding PPAs. A week later, Eskom stated that those agreements would be signed.
Government policy also continues to strongly favour and support the inclusion of RE resources, as demonstrated by the release, in 2016, of the Integrated Resource Plan (IRP) update4. Though not finalised, the updated IRP provides continued policy certainty, while the 6 300 MWp that has been allocated for further RE procurement provides an accurate estimate of the potential market size.
Without doubt, the changes brought about by the finalisation of the IRP and the resolution of outstanding issues involving Eskom will create numerous opportunities for investors and businesses in the utility- and embedded generation-scale RE sector.
—The updated Integrated Resource Plan provides a good estimate of the market size, with a further 6 300MWp allocated for RE procurement.
—The interest by municipalities to procure energy from independent power producers signals a further change to the energy sector.
4 This document, at the time of writing, was out for public comment
1 As of June 2016 2 The REIPPPP has, in total over its four bid windows, attracted more than double the total foreign direct investment (FDI) that flowed into South Africa in 20153 Based on the tariffs offered by projects in the latest rounds of the REIPPPP
Utility-Scale Renewable Energy: Market Intelligence Report 2017 98 Utility-Scale Renewable Energy: Market Intelligence Report 2017
1 –Introduction and purpose
Globally, renewable energy (RE) has gained momentum, with a significant rise in the uptake of various RE technologies such as solar photovoltaics (PV), wind energy, biogas and other biofuels, hydroelectricity, landfill gas, geothermal energy, and concentrated solar power (CSP).
The key drivers of this global shift are also what are powering and providing a great deal of momentum to the evolution of South Africa’s energy sector:
■ government policy support and procurement programmes;
■ sustainability and energy security concerns; ■ cheaper renewable energy technologies;
and ■ conventional/ traditional electricity
becoming more expensive.
Ministerial determinations by the South African government to procure RE — such as the Integrated Resource Plan (IRP) for Electricity 2010-2030, which lays out the country’s electricity future — have given growth in the renewable energy sector a significant boost. At the time of writing the IRP was out for public comment, with likelihood of changes to the document given the various industry concerns around assumptions made in the modelling exercise. The IRP is discussed in more detail in later sections of this report.
In what follows, Section 2 gives an overview of the market, describes market size and key players. Section 3 details the general legislative and regulatory framework governing RE; while Section 4 highlights opportunities and barriers in the market. Section 5 focuses on funding and incentives, followed by an overview of the Western Cape as Africa’s growing greentech hub in Section 6. Section 7 focuses on the free services provided by GreenCape to its members, including businesses and investors in the green economy.
Note: GreenCape’s Energy Services Market Intelligence Report explores the energy services market, including the embedded generation RE market and energy efficiency.
For queries or to access our services, contact our Renewable Energy Sector Desk at [email protected]
This report provides potential investors and businesses in the utility-scale RE space with a greater understanding of market
opportunities in South Africa.
Utility-Scale Renewable Energy: Market Intelligence Report 2017 1110 Utility-Scale Renewable Energy: Market Intelligence Report 2017
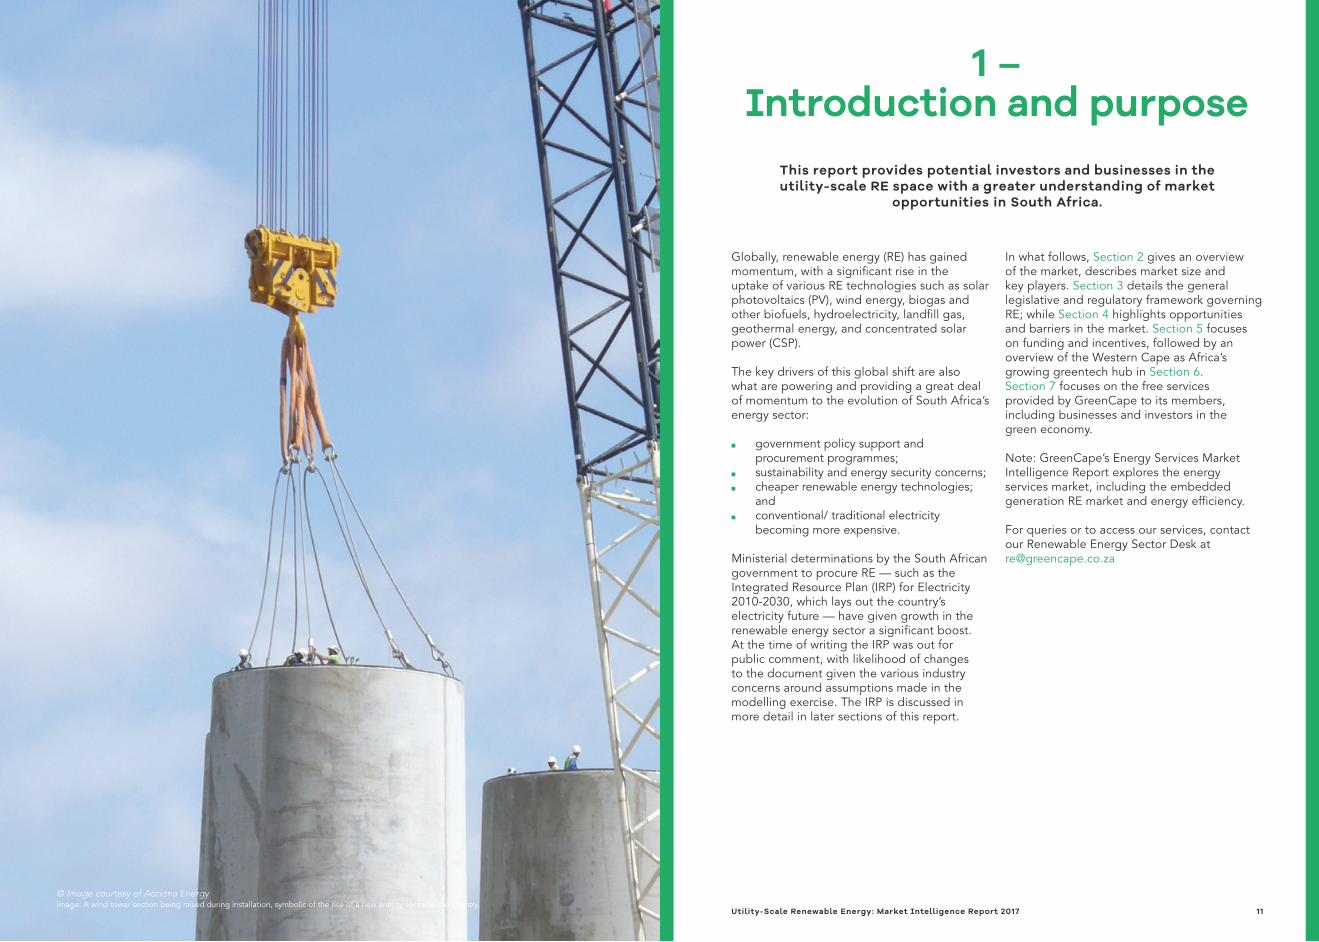
© Image courtesy of Acciona EnergyImage: A wind tower section being raised during installation, symbolic of the rise of a new energy sector in the country.
2 –Sector overview
Accounting for nearly 5% of installed capacity, the South African renewable energy sector is showing rapid growth and significant potential. Every month new projects reach commercial operation,
with over 2 GWp of projects connected and operational to date.
2.1. ContextSouth Africa’s generation capacity is dominated by coal-fired generation stations with a net output of 35.6 GWp, which represents over 85% of the country’s total installed capacity of over 44 GWp. Nuclear generation capacity comprises 5% of generation capacity, and comes from the only nuclear generation facility on the African continent, Koeberg power station. As noted, RE accounts for 5% of generation capacity after very rapid growth since 2011.
This growth is the result of several factors:
■ Proactive government leadership in procuring RE capacity;
■ Increases in electricity tariffs charged by the national utility, Eskom;
■ Global decreases in RE technology prices; ■ Economic shifts towards sustainability
practices.
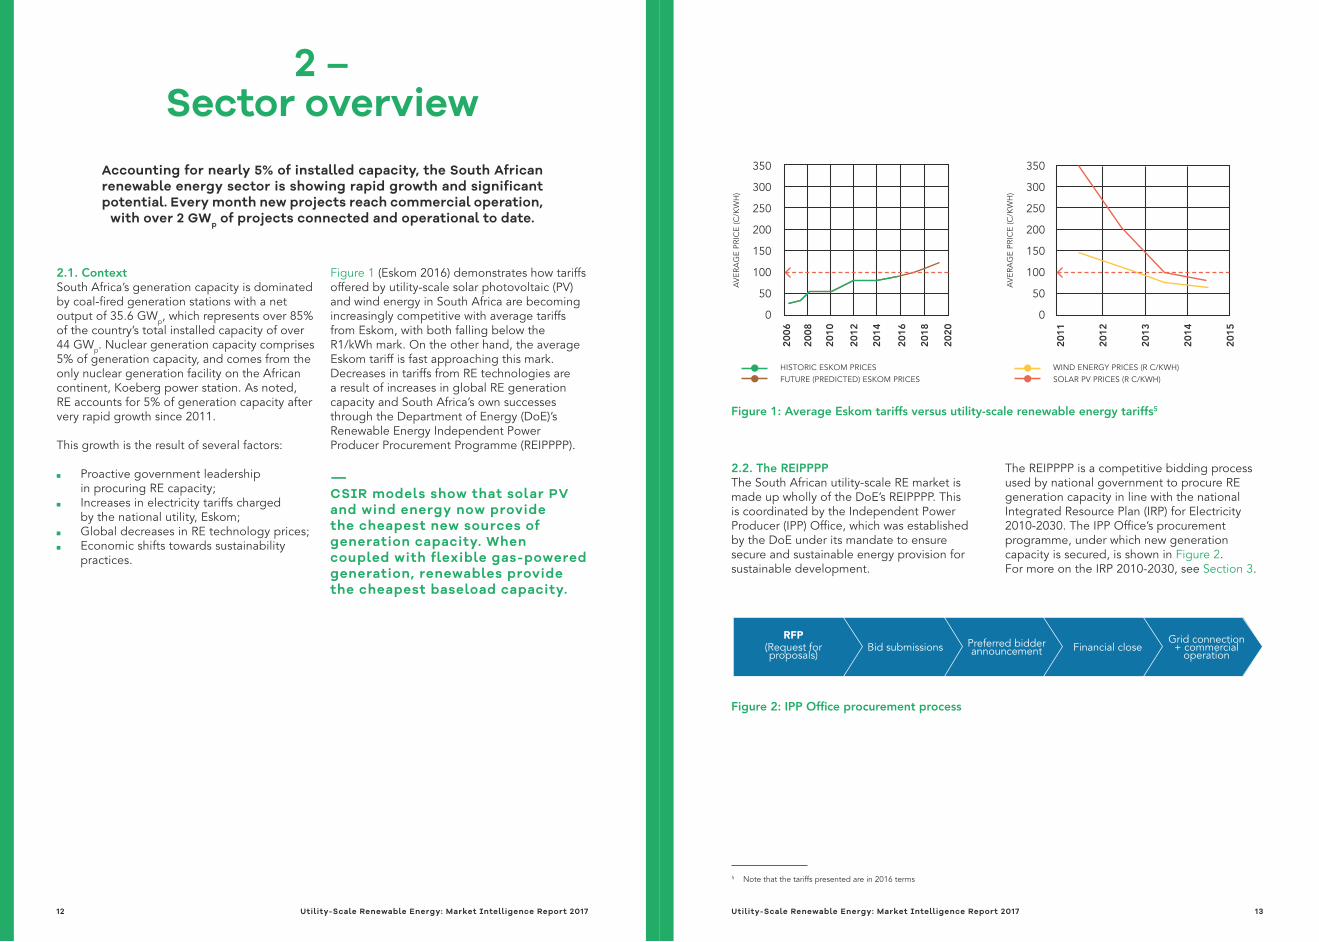
Figure 1 (Eskom 2016) demonstrates how tariffs offered by utility-scale solar photovoltaic (PV) and wind energy in South Africa are becoming increasingly competitive with average tariffs from Eskom, with both falling below the R1/kWh mark. On the other hand, the average Eskom tariff is fast approaching this mark. Decreases in tariffs from RE technologies are a result of increases in global RE generation capacity and South Africa’s own successes through the Department of Energy (DoE)’s Renewable Energy Independent Power Producer Procurement Programme (REIPPPP).
—CSIR models show that solar PV and wind energy now provide the cheapest new sources of generation capacity. When coupled with flexible gas-powered generation, renewables provide the cheapest baseload capacity.
2.2. The REIPPPPThe South African utility-scale RE market is made up wholly of the DoE’s REIPPPP. This is coordinated by the Independent Power Producer (IPP) Office, which was established by the DoE under its mandate to ensure secure and sustainable energy provision for sustainable development.
The REIPPPP is a competitive bidding process used by national government to procure RE generation capacity in line with the national Integrated Resource Plan (IRP) for Electricity 2010-2030. The IPP Office’s procurement programme, under which new generation capacity is secured, is shown in Figure 2. For more on the IRP 2010-2030, see Section 3.
5 Note that the tariffs presented are in 2016 terms
Figure 1: Average Eskom tariffs versus utility-scale renewable energy tariffs5
350
300
250
200
150
100
50
0
350
300
250
200
150
100
50
0
2006
2008
2010
2012
2014
2016
2018
2020
HISTORIC ESKOM PRICESFUTURE (PREDICTED) ESKOM PRICES
WIND ENERGY PRICES (R C/KWH)SOLAR PV PRICES (R C/KWH)
2011
2012
2013
2014
2015
AVE
RAG
E PR
ICE
(C/K
WH
)
AVE
RAG
E PR
ICE
(C/K
WH
)
Figure 2: IPP Office procurement process
RFP(Request for proposals)
Bid submissions Preferred bidder announcement Financial close
Grid connection + commercial
operation
Utility-Scale Renewable Energy: Market Intelligence Report 2017 1312 Utility-Scale Renewable Energy: Market Intelligence Report 2017
The IPP Office has also launched a small IPP programme (IPP Office 2016c), which procures generation capacity from projects of less than 5 MWp. The first round of selected small IPP bidders was announced in October 2015 and are approaching financial close. A second round of bids was submitted in June 2016 and successful projects were announced in January 2017 – a sure sign of the programme's continuity.
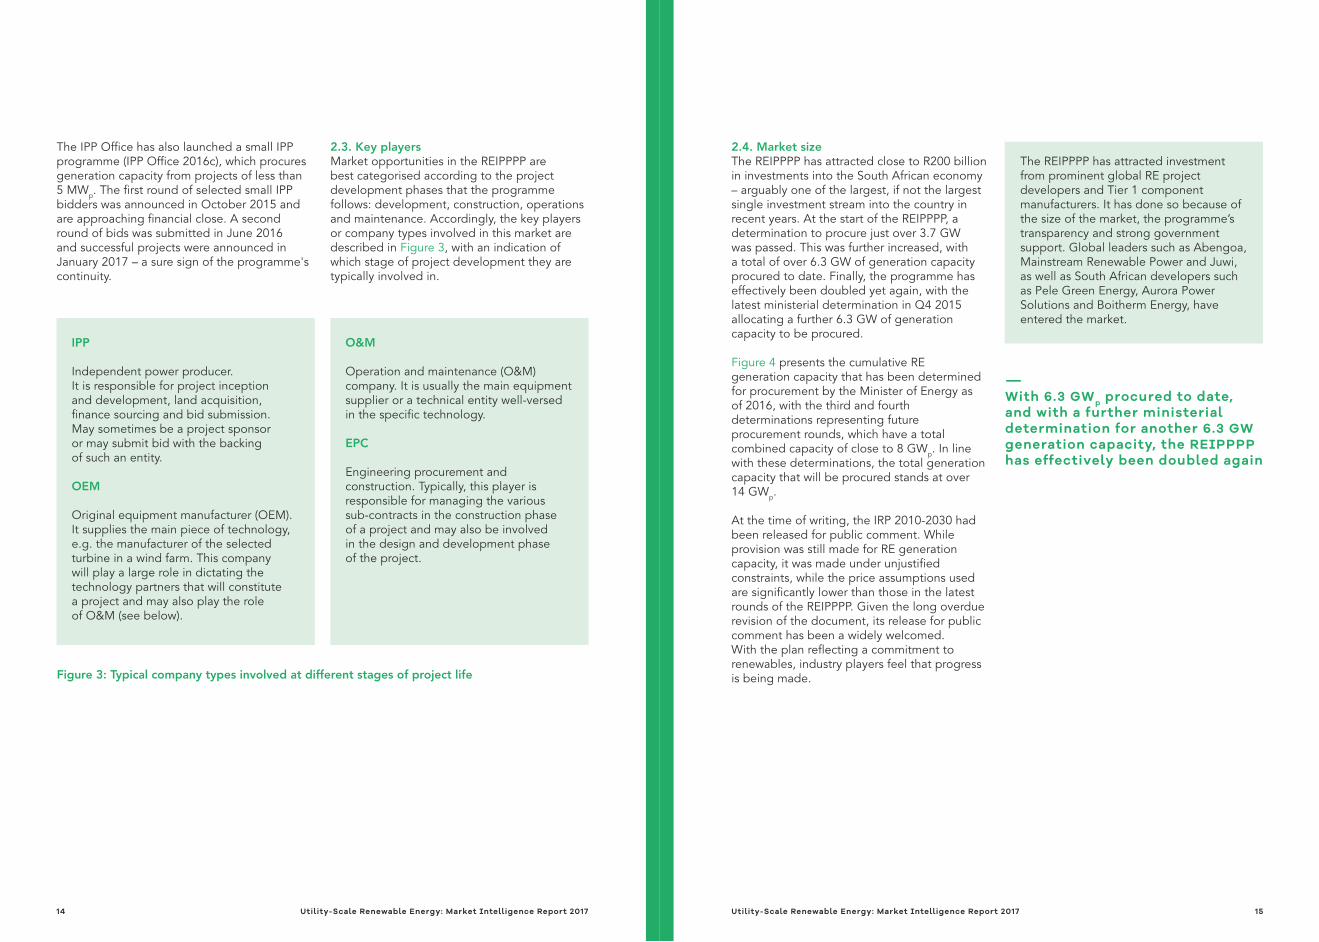
2.3. Key playersMarket opportunities in the REIPPPP are best categorised according to the project development phases that the programme follows: development, construction, operations and maintenance. Accordingly, the key players or company types involved in this market are described in Figure 3, with an indication of which stage of project development they are typically involved in.
IPP
Independent power producer. It is responsible for project inception and development, land acquisition, finance sourcing and bid submission. May sometimes be a project sponsor or may submit bid with the backing of such an entity.
OEM
Original equipment manufacturer (OEM). It supplies the main piece of technology, e.g. the manufacturer of the selected turbine in a wind farm. This company will play a large role in dictating the technology partners that will constitute a project and may also play the role of O&M (see below).
O&M
Operation and maintenance (O&M) company. It is usually the main equipment supplier or a technical entity well-versed in the specific technology.
EPC
Engineering procurement and construction. Typically, this player is responsible for managing the various sub-contracts in the construction phase of a project and may also be involved in the design and development phase of the project.
2.4. Market sizeThe REIPPPP has attracted close to R200 billion in investments into the South African economy – arguably one of the largest, if not the largest single investment stream into the country in recent years. At the start of the REIPPPP, a determination to procure just over 3.7 GW was passed. This was further increased, with a total of over 6.3 GW of generation capacity procured to date. Finally, the programme has effectively been doubled yet again, with the latest ministerial determination in Q4 2015 allocating a further 6.3 GW of generation capacity to be procured.
Figure 4 presents the cumulative RE generation capacity that has been determined for procurement by the Minister of Energy as of 2016, with the third and fourth determinations representing future procurement rounds, which have a total combined capacity of close to 8 GWp. In line with these determinations, the total generation capacity that will be procured stands at over 14 GWp.
At the time of writing, the IRP 2010-2030 had been released for public comment. While provision was still made for RE generation capacity, it was made under unjustified constraints, while the price assumptions used are significantly lower than those in the latest rounds of the REIPPPP. Given the long overdue revision of the document, its release for public comment has been a widely welcomed. With the plan reflecting a commitment to renewables, industry players feel that progress is being made.
The REIPPPP has attracted investment from prominent global RE project developers and Tier 1 component manufacturers. It has done so because of the size of the market, the programme’s transparency and strong government support. Global leaders such as Abengoa, Mainstream Renewable Power and Juwi, as well as South African developers such as Pele Green Energy, Aurora Power Solutions and Boitherm Energy, have entered the market.
—With 6.3 GWp procured to date, and with a further ministerial determination for another 6.3 GW generation capacity, the REIPPPP has effectively been doubled again
Figure 3: Typical company types involved at different stages of project life
Utility-Scale Renewable Energy: Market Intelligence Report 2017 1514 Utility-Scale Renewable Energy: Market Intelligence Report 2017
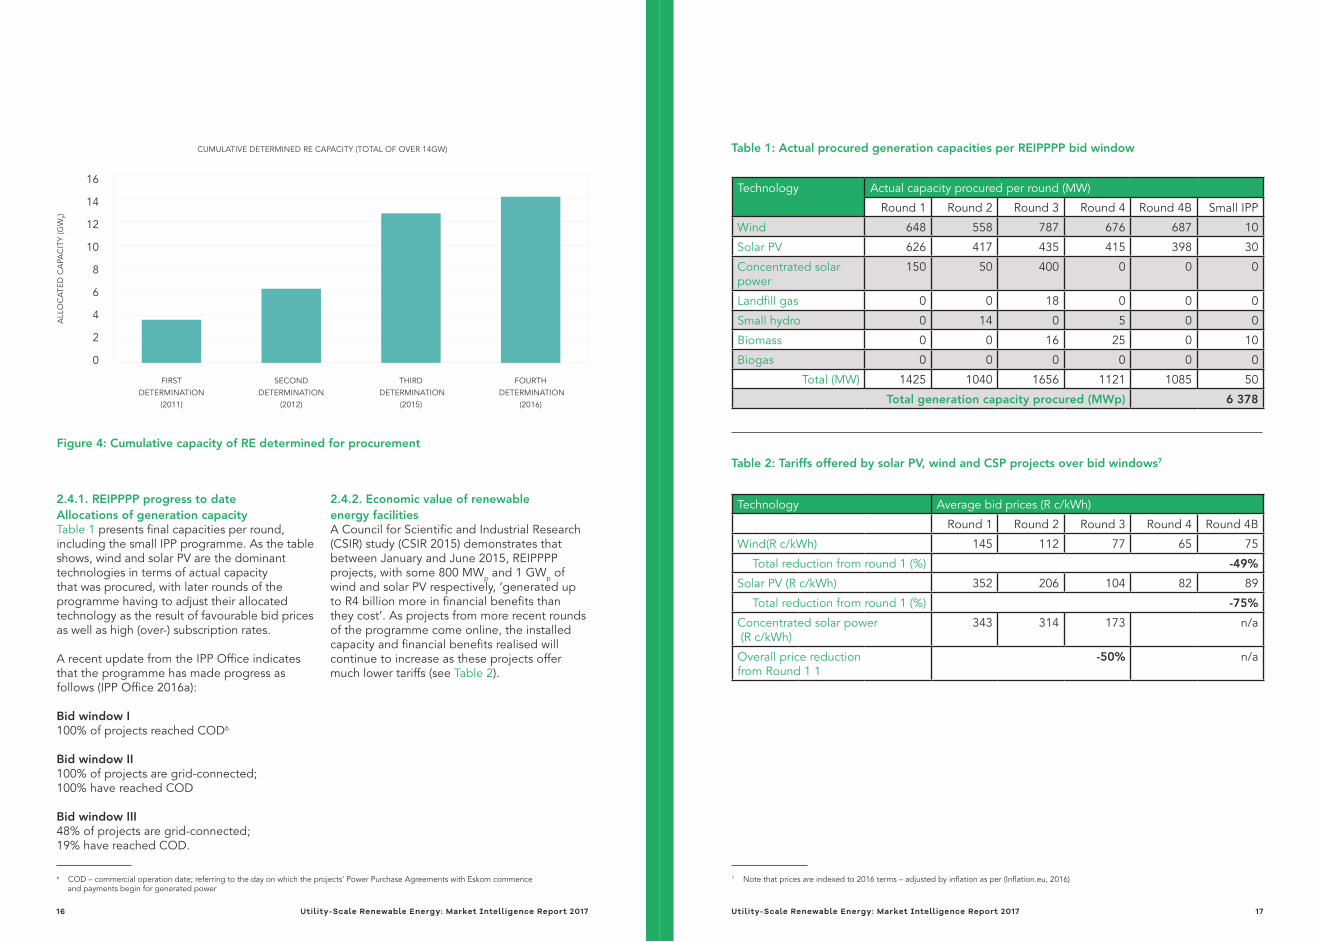
Figure 4: Cumulative capacity of RE determined for procurement
Table 1: Actual procured generation capacities per REIPPPP bid windowCUMULATIVE DETERMINED RE CAPACITY (TOTAL OF OVER 14GW)
FIRST DETERMINATION
(2011)
SECOND DETERMINATION
(2012)
THIRD DETERMINATION
(2015)
FOURTH DETERMINATION
(2016)
ALL
OC
ATED
CA
PAC
ITY
(GW
P)
16
14
12
10
8
6
4
2
0
2.4.1. REIPPPP progress to dateAllocations of generation capacityTable 1 presents final capacities per round, including the small IPP programme. As the table shows, wind and solar PV are the dominant technologies in terms of actual capacity that was procured, with later rounds of the programme having to adjust their allocated technology as the result of favourable bid prices as well as high (over-) subscription rates.
A recent update from the IPP Office indicates that the programme has made progress as follows (IPP Office 2016a):
Bid window I 100% of projects reached COD6
Bid window II 100% of projects are grid-connected; 100% have reached COD
Bid window III 48% of projects are grid-connected; 19% have reached COD.
2.4.2. Economic value of renewable energy facilitiesA Council for Scientific and Industrial Research (CSIR) study (CSIR 2015) demonstrates that between January and June 2015, REIPPPP projects, with some 800 MWp and 1 GWp of wind and solar PV respectively, ‘generated up to R4 billion more in financial benefits than they cost’. As projects from more recent rounds of the programme come online, the installed capacity and financial benefits realised will continue to increase as these projects offer much lower tariffs (see Table 2).
6 COD – commercial operation date; referring to the day on which the projects’ Power Purchase Agreements with Eskom commence and payments begin for generated power
7 Note that prices are indexed to 2016 terms – adjusted by inflation as per (Inflation.eu, 2016)
Technology Actual capacity procured per round (MW)
Round 1 Round 2 Round 3 Round 4 Round 4B Small IPP
Wind 648 558 787 676 687 10
Solar PV 626 417 435 415 398 30
Concentrated solar power
150 50 400 0 0 0
Landfill gas 0 0 18 0 0 0
Small hydro 0 14 0 5 0 0
Biomass 0 0 16 25 0 10
Biogas 0 0 0 0 0 0
Total (MW) 1425 1040 1656 1121 1085 50
Total generation capacity procured (MWp) 6 378
Table 2: Tariffs offered by solar PV, wind and CSP projects over bid windows7
Technology Average bid prices (R c/kWh)
Round 1 Round 2 Round 3 Round 4 Round 4B
Wind(R c/kWh) 145 112 77 65 75
Total reduction from round 1 (%) -49%
Solar PV (R c/kWh) 352 206 104 82 89
Total reduction from round 1 (%) -75%
Concentrated solar power (R c/kWh)
343 314 173 n/a
Overall price reduction from Round 1 1
-50% n/a
Utility-Scale Renewable Energy: Market Intelligence Report 2017 1716 Utility-Scale Renewable Energy: Market Intelligence Report 2017

Investments made to dateTotal investments made into the programme (debt and equity) over the past four bidding windows, excluding the additional round four and accelerated bids, totalled over R194 billion in project value as of June 2016 (IPP Office 2016b). This is split between domestic (73%, R141 billion) and foreign (27%, R53 billion) investments. The programme has been successful not only in attracting significant investments but also in attracting a wide variety of investment sources (see Figure 5.)
—The REIPPPP has attracted investments of R194 billion – R141 billion domestic and R53 billion foreign investments.
2.5. Beyond kWhs towards developmentEnergy security and investment attraction aside, the REIPPPP contributes directly to South Africa’s broader national development agenda. This is both by design – to be credited to the multi-ministerial collaboration between the National Treasury, the DoE, the department of trade and industry dti, (see Section 3.2 for more on related government departments); and through the willingness of industry players who recognise the South African socio-economic context they are developing projects in and are making meaningful contributions.
South Africa’s socio-economic development agenda is outlined in the government’s special infrastructure projects (SIPs) and in the objectives of the National Development Plan (NDP) (see below).
Figure 5: Countries from where private investments were made in the REIPPPP
0 5 000 10 000 15 000 20 000 25 000 30 000 35 000 40 000
Africa
Great Britain + Europe
USA
Middle East and India (Saudi Arabia + India)
Asia (China & Japan + Korea)
• EQUITY (R'MILLION) • DEBT (R'MILLION)
• 1 545 • 127
• 2 571 • 814
• 133 • 1 473
20 684
10 592
5 161
25 351
2.5.1. Government’s strategic infrastructure projectsThrough its economic development selection criteria, the REIPPPP is well aligned with the government’s SIPs. Therefore, it is a strategic programme in achieving the country’s development agenda. The ultimate goal of the SIPs is to address issues of poverty, unemployment and inequality, through 18 focus areas (Government of South Africa 2016), as follows:
Figure 6: Groupings of the Strategic Infrastructure Projects (SIPs)
Specifically related to the REIPPPP’s outputs are the three energy SIPs (SIP 8, SIP 9 and SIP 10), as well as, to some extent, the regional SIP, SIP 18, which focuses on regional integration for African cooperation and development. In terms of the energy SIPs, the REIPPPP fulfils the goal of providing clean and sustainable electricity combined with specifically mandated obligations to deliver socio-economic
development benefits to local communities. Fortuitously, these communities live primarily in rural areas of South Africa.
The programme also has an indirect link to SIP 15 (expanding access to communication technology). Although there is no specific mandate for projects to deliver communications technology infrastructure, there is an opportunity to deliver this infrastructure through the more than R19 billion that has been committed to socio-economic development (SED) and enterprise development (ED) spending by selected projects to date8. Finally, in line with SIP 18, the skills developed and experience gained by South Africans and South African-based companies can be exported to neighbouring regions where the RE sector is on the rise.
—The REIPPP programme contributes to 10 of the 14 national outcomes outlined in the National Development Plan.
According to the IPP Office (IPP Office 2016b), the REIPPPP contributes directly and indirectly to ten of the country’s 14 national outcomes outlined in the NDP, particularly to Outcome 6 – an efficient, competitive and responsive economic infrastructure network. The REIPPPP is directly applicable to two of Outcome 6’s sub-outcomes, as follows:
■ Adequate electricity generation capacity commissioned – with a target of 10 GW to be added by 2019
■ Electricity generation reserve margin increased – with a target to increase this to 19% by 2019 (from 1% in 2010).
All these points combine to demonstrate the strategic significance of the REIPPPP in contributing to a national developmental agenda.
5 x Geographically-focussed SIPs
3 x Social infrastructure SIP
3 x Energy SIPs
2 x Knowledge SIPs
3 x Spatial SIPs
1 x Water and sanitation SIP
1 x Regional integration SIP
8 These figures refer to projects from rounds 1 to 4 and 4B, over the 20-year PPAs of the projects.
Utility-Scale Renewable Energy: Market Intelligence Report 2017 1918 Utility-Scale Renewable Energy: Market Intelligence Report 2017
2.5.2. Economic development through the REIPPPPThe REIPPPP’s economic development component accounts for an essential part of its developmental contribution by ensuring the achievement of objectives such as:
■ Job creation: focused on South African citizens, black South African citizens and those local to projects;
■ Local content: capturing as much of the local project spend as possible;
■ Ownership: advancing ownership by black South Africans and local communities;
■ Management control: increasing the presence of black South Africans in management of the economy;
■ Preferential procurement: empowering small, and black-, women- and youth-owned enterprises;
■ Enterprise development: developing small businesses in local communities and stimulating the local economy;
■ Socio-economic development: addressing some of the socio-economic needs of communities local to projects.
To date, based on selected projects from bid window one to four (including 4B), communities (as part-owners of projects) will earn a net income in excess of R29 billion over the 20 year lifespan of the power purchase agreements. There are numerous inspirational examples of local economic development happening as a direct result of the REIPPPP. These success stories are widely communicated by the various industry associations concerned, including the South African Photovoltaic Industry Association (SAPVIA) and the South African Wind Energy Association (SAWEA). Among many others, highlights include over 24 000 job years created in construction and O&M phases of numerous plants to large investments in manufacturing capacity and equipment.
To truly demonstrate the impact and future benefits of the programme, it is necessary to look at programmes on the ground. One such example is the South African Renewable Energy Technology Centre (SARETEC) (SARETEC 2016) on the Cape Peninsular University of Technology
(CPUT) campus in Bellville, Cape Town. As well as short courses on solar PV systems and biomass technologies, SARTEC now offers internationally accredited courses for:
■ Wind turbine services technicians ■ Solar photovoltaic service technicians.
The institution was specifically founded to cater for the REIPPPP’s skills requirements, particularly in the long-term operation and maintenance phases of projects.
Case study: Kathu Solar PV Facility
In the Northern Cape, during the construction of a 74 MWp solar PV facility, 300 jobs were created, 60% of them filled by local community members; 120 South African companies benefitted from various contracts and supply agreements; and over R657 million was spent with qualifying small enterprises. Of this, R20 million was spent with women-owned enterprises.
—The South African Renewable Energy Technology Centre, or SARETEC, was founded to develop local skills for the operation and maintenance of REIPPPP projects over their 20 year PPAs.
Utility-Scale Renewable Energy: Market Intelligence Report 2017 2120 Utility-Scale Renewable Energy: Market Intelligence Report 2017
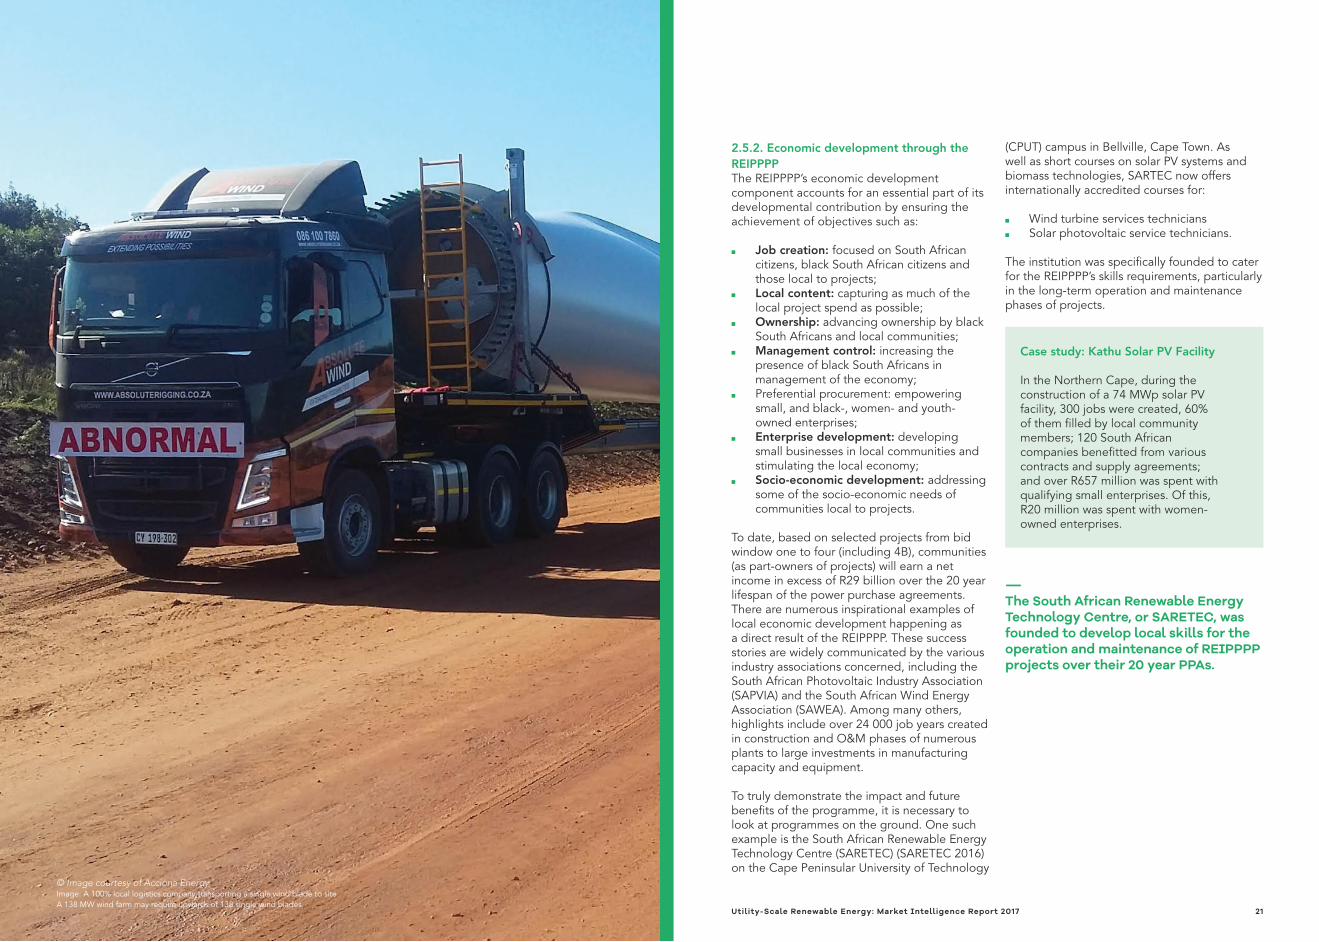
© Image courtesy of Acciona EnergyImage: A 100% local logistics company transporting a single wind blade to site. A 138 MW wind farm may require upwards of 138 single wind blades.
3 –Policies and regulation
This section focuses on policies and regulation that guide and affect procurement in the renewable energy sector.
3.2. Government departments involved in the energy and electricity sectorDifferent government departments are involved in various capacities in executing the policies listed in Section 3.1. The most prominent departments are listed below, with a brief summary of their interaction with the REIPPPP:
National TreasuryEnsuring value for money, affordability of electricity supply and providing sovereign guarantees for the signed PPAs.
Department of Environmental Affairs (DEA) Ensuring environmental custodianship and assessment of environmental impact studies as well as ensuring appropriate land use.
Department of Trade and Industry (dti) Responsible for ensuring industrialisation through the REIPPPP’s economic development component, especially local content; as well as black economic empowerment and development of small businesses.
Department of Public Enterprises Shareholder in Eskom, the sole power off-taker.
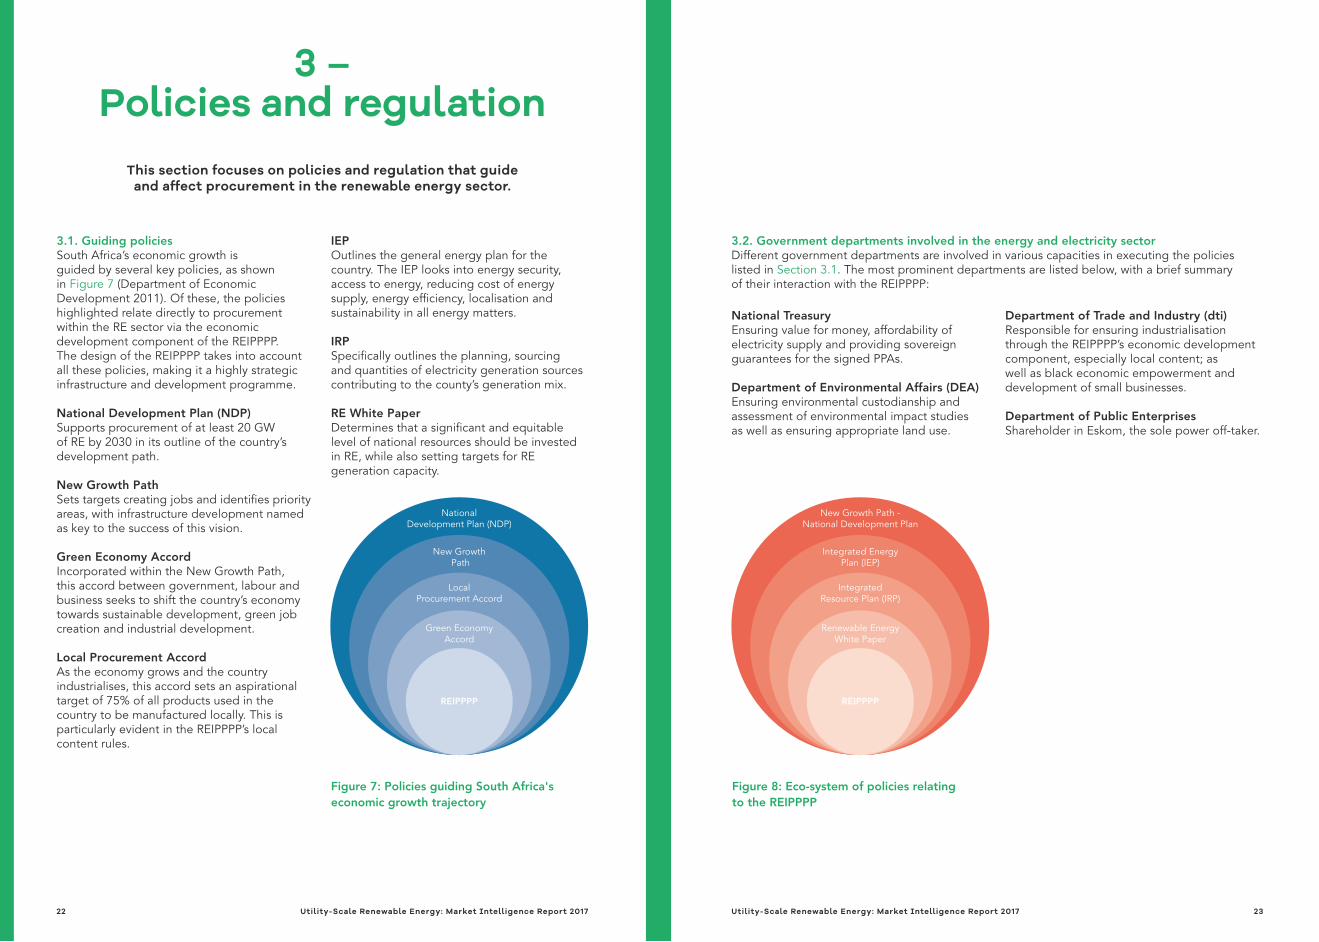
3.1. Guiding policies South Africa’s economic growth is guided by several key policies, as shown in Figure 7 (Department of Economic Development 2011). Of these, the policies highlighted relate directly to procurement within the RE sector via the economic development component of the REIPPPP. The design of the REIPPPP takes into account all these policies, making it a highly strategic infrastructure and development programme.
National Development Plan (NDP) Supports procurement of at least 20 GW of RE by 2030 in its outline of the country’s development path.
New Growth Path Sets targets creating jobs and identifies priority areas, with infrastructure development named as key to the success of this vision.
Green Economy Accord Incorporated within the New Growth Path, this accord between government, labour and business seeks to shift the country’s economy towards sustainable development, green job creation and industrial development.
Local Procurement Accord As the economy grows and the country industrialises, this accord sets an aspirational target of 75% of all products used in the country to be manufactured locally. This is particularly evident in the REIPPPP’s local content rules.
IEPOutlines the general energy plan for the country. The IEP looks into energy security, access to energy, reducing cost of energy supply, energy efficiency, localisation and sustainability in all energy matters.
IRPSpecifically outlines the planning, sourcing and quantities of electricity generation sources contributing to the county’s generation mix.
RE White PaperDetermines that a significant and equitable level of national resources should be invested in RE, while also setting targets for RE generation capacity.
Figure 7: Policies guiding South Africa's economic growth trajectory
Green Economy Accord
Local Procurement Accord
New Growth Path
National Development Plan (NDP)
REIPPPP
Figure 8: Eco-system of policies relating to the REIPPPP
Renewable Energy White Paper
Integrated Resource Plan (IRP)
Integrated Energy Plan (IEP)
New Growth Path - National Development Plan
REIPPPP
Utility-Scale Renewable Energy: Market Intelligence Report 2017 2322 Utility-Scale Renewable Energy: Market Intelligence Report 2017
4 –Opportunities and barriers
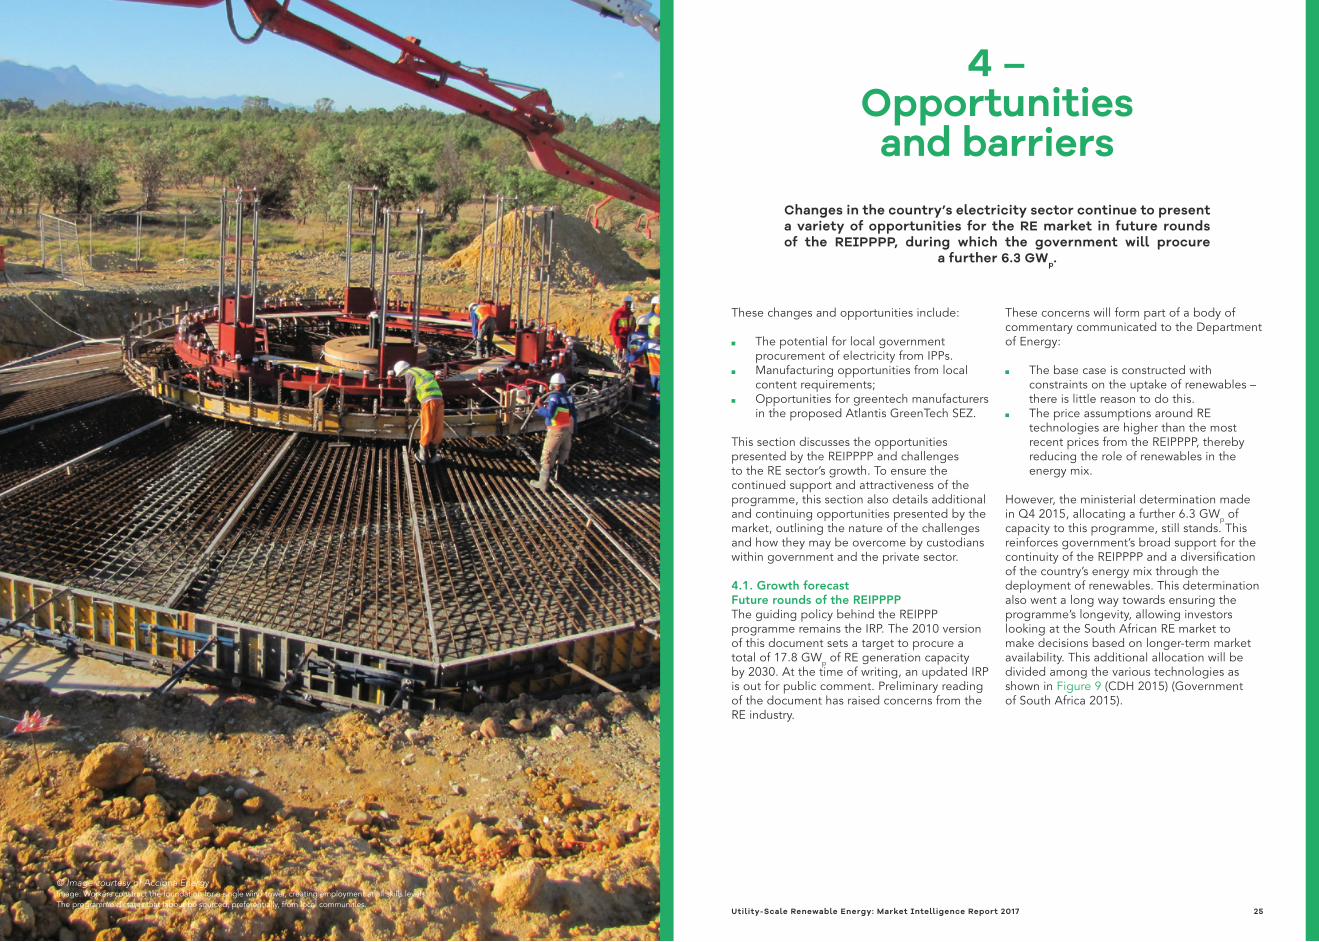
Changes in the country’s electricity sector continue to present a variety of opportunities for the RE market in future rounds of the REIPPPP, during which the government will procure
a further 6.3 GWp.
These changes and opportunities include:
■ The potential for local government procurement of electricity from IPPs.
■ Manufacturing opportunities from local content requirements;
■ Opportunities for greentech manufacturers in the proposed Atlantis GreenTech SEZ.
This section discusses the opportunities presented by the REIPPPP and challenges to the RE sector’s growth. To ensure the continued support and attractiveness of the programme, this section also details additional and continuing opportunities presented by the market, outlining the nature of the challenges and how they may be overcome by custodians within government and the private sector.
4.1. Growth forecastFuture rounds of the REIPPPPThe guiding policy behind the REIPPP programme remains the IRP. The 2010 version of this document sets a target to procure a total of 17.8 GWp of RE generation capacity by 2030. At the time of writing, an updated IRP is out for public comment. Preliminary reading of the document has raised concerns from the RE industry.
These concerns will form part of a body of commentary communicated to the Department of Energy:
■ The base case is constructed with constraints on the uptake of renewables – there is little reason to do this.
■ The price assumptions around RE technologies are higher than the most recent prices from the REIPPPP, thereby reducing the role of renewables in the energy mix.
However, the ministerial determination made in Q4 2015, allocating a further 6.3 GWp of capacity to this programme, still stands. This reinforces government’s broad support for the continuity of the REIPPPP and a diversification of the country’s energy mix through the deployment of renewables. This determination also went a long way towards ensuring the programme’s longevity, allowing investors looking at the South African RE market to make decisions based on longer-term market availability. This additional allocation will be divided among the various technologies as shown in Figure 9 (CDH 2015) (Government of South Africa 2015).
Utility-Scale Renewable Energy: Market Intelligence Report 2017 2524 Utility-Scale Renewable Energy: Market Intelligence Report 2017
© Image courtesy of Acciona EnergyImage: Workers construct the foundation for a single wind tower, creating employment at all skills levels. The programme dictates that labour be sourced, preferentially, from local communities.
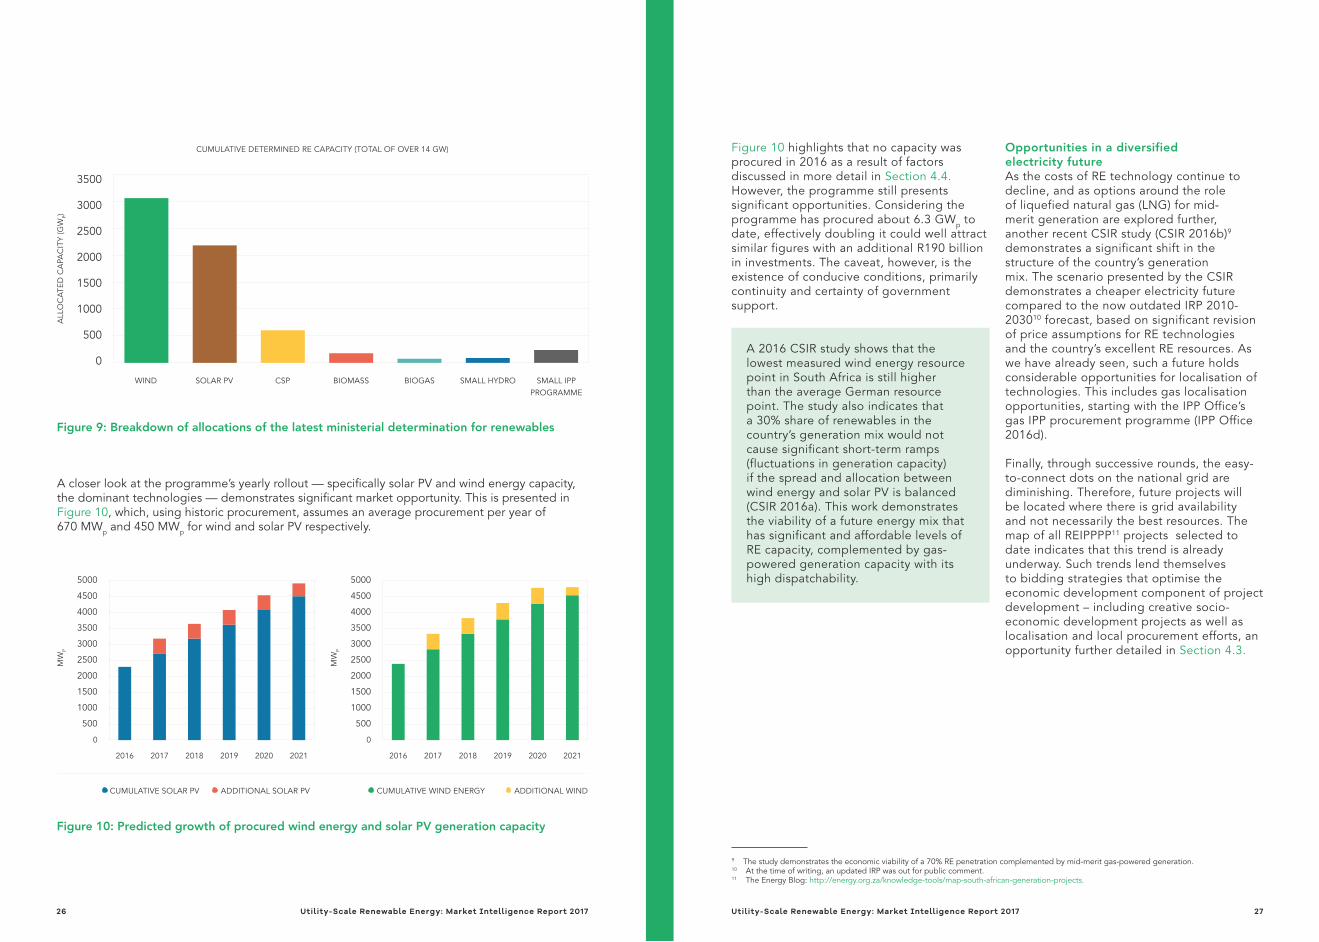
A closer look at the programme’s yearly rollout — specifically solar PV and wind energy capacity, the dominant technologies — demonstrates significant market opportunity. This is presented in Figure 10, which, using historic procurement, assumes an average procurement per year of 670 MWp and 450 MWp for wind and solar PV respectively.
Figure 9: Breakdown of allocations of the latest ministerial determination for renewables
CUMULATIVE DETERMINED RE CAPACITY (TOTAL OF OVER 14 GW)
WIND SOLAR PV CSP BIOMASS BIOGAS SMALL HYDRO SMALL IPP PROGRAMME
ALL
OC
ATED
CA
PAC
ITY
(GW
P)
3500
3000
2500
2000
1500
1000
500
0
Figure 10: Predicted growth of procured wind energy and solar PV generation capacity
2016 2017 2018 2019 2020 2021 2016 2017 2018 2019 2020 2021
MW
P
MW
P
5000
4500
4000
3500
3000
2500
2000
1500
1000
500
0
5000
4500
4000
3500
3000
2500
2000
1500
1000
500
0
• CUMULATIVE SOLAR PV • ADDITIONAL SOLAR PV • CUMULATIVE WIND ENERGY • ADDITIONAL WIND
Figure 10 highlights that no capacity was procured in 2016 as a result of factors discussed in more detail in Section 4.4. However, the programme still presents significant opportunities. Considering the programme has procured about 6.3 GWp to date, effectively doubling it could well attract similar figures with an additional R190 billion in investments. The caveat, however, is the existence of conducive conditions, primarily continuity and certainty of government support.
A 2016 CSIR study shows that the lowest measured wind energy resource point in South Africa is still higher than the average German resource point. The study also indicates that a 30% share of renewables in the country’s generation mix would not cause significant short-term ramps (fluctuations in generation capacity) if the spread and allocation between wind energy and solar PV is balanced (CSIR 2016a). This work demonstrates the viability of a future energy mix that has significant and affordable levels of RE capacity, complemented by gas-powered generation capacity with its high dispatchability.
Opportunities in a diversified electricity futureAs the costs of RE technology continue to decline, and as options around the role of liquefied natural gas (LNG) for mid-merit generation are explored further, another recent CSIR study (CSIR 2016b)9 demonstrates a significant shift in the structure of the country’s generation mix. The scenario presented by the CSIR demonstrates a cheaper electricity future compared to the now outdated IRP 2010-203010 forecast, based on significant revision of price assumptions for RE technologies and the country’s excellent RE resources. As we have already seen, such a future holds considerable opportunities for localisation of technologies. This includes gas localisation opportunities, starting with the IPP Office’s gas IPP procurement programme (IPP Office 2016d).
Finally, through successive rounds, the easy-to-connect dots on the national grid are diminishing. Therefore, future projects will be located where there is grid availability and not necessarily the best resources. The map of all REIPPPP11 projects selected to date indicates that this trend is already underway. Such trends lend themselves to bidding strategies that optimise the economic development component of project development – including creative socio-economic development projects as well as localisation and local procurement efforts, an opportunity further detailed in Section 4.3.
9 The study demonstrates the economic viability of a 70% RE penetration complemented by mid-merit gas-powered generation.10 At the time of writing, an updated IRP was out for public comment.11 The Energy Blog: http://energy.org.za/knowledge-tools/map-south-african-generation-projects.
Utility-Scale Renewable Energy: Market Intelligence Report 2017 2726 Utility-Scale Renewable Energy: Market Intelligence Report 2017
4.2. Local government power procurementAs a result of rising electricity prices plus their efforts to reinforce their energy security and become more sustainable, municipalities — which rely heavily on revenue from the sale of electricity to subsidise other customer services to their customers — have begun exploring options to procure electricity from RE IPPs. This presents a significant market opportunity, potentially for utility-scale projects12, as well as the embedded generation sector.
Until recently, the generation of electricity has been almost exclusively the mandate of national government, through Eskom. The biggest hurdles facing municipal power procurement are the current national regulations governing generation licensing and the need for a ministerial determination. A specific ministerial determination, like the one that enabled the various IPP programmes, is needed to allow municipalities to purchase directly from IPPs. Currently, there is no precedent for this. However, the City of Cape Town (CoCT) has made a request for such a determination and Ekurhuleni municipality released an RFP for IPP generation in the second half of 2016. The success of such a programme would ultimately rest on a ministerial determination being made.
Accordingly, the ongoing changes in legislation around generation licensing and own-use present opportunities for municipalities to increase their participation in the generation sector and, therefore, their energy autonomy.
—Municipal procurement of electricity from independent power producers presents a significant market opportunity for utility-scale projects and the embedded generation sector.
4.3. Economic development presents strategic advantage for bidding
4.3.1 Local economic developmentAs the price points for successful bids bottom out, the strategic advantage for winning bids will shift to those with stronger, more creative economic development programmes, involving:
■ local content, ■ local procurement and ■ community benefits.
There are therefore opportunities for:
■ investors into local manufacturing of RE technology components
■ local enterprises that supply into the RE value chain [please put footnote back in!]
■ community initiatives in and around selected project locations.
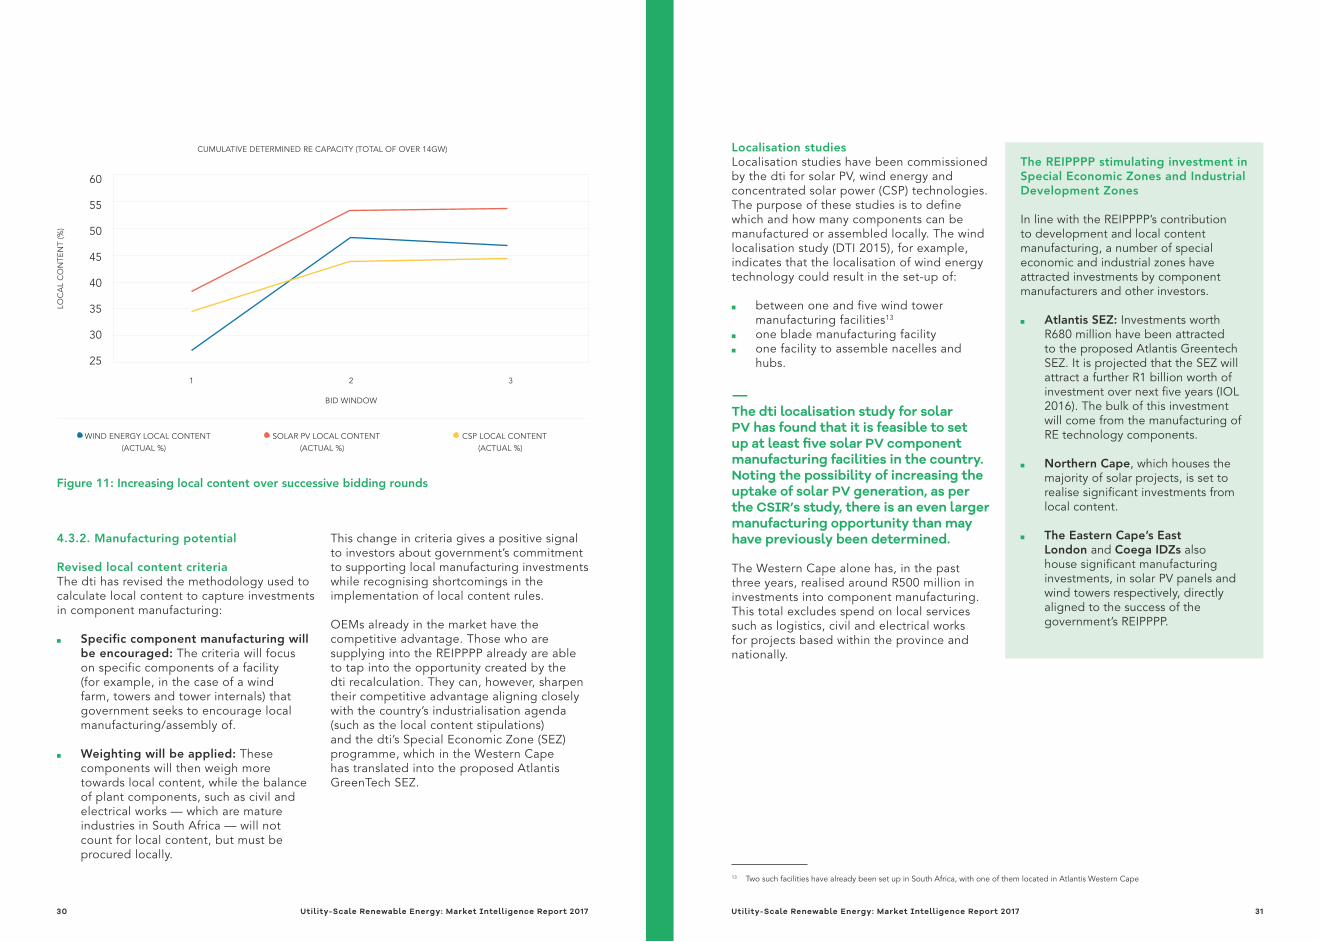
Over successive bid windows, the local content levels required of successful projects have increased as shown in Figure 11. This trend, combined with increasingly competitive tariffs and decreasing grid availability (see above), all contribute to the growing importance of creatively delivered economic development plans, such as local content socio-economic development, in selecting successful projects.
Over the completed bidding windows and selected projects, there is a projected local spend of around R66 billion, while actual local spend from projects that have started construction and operation is reported at over R32 billion. This spend is set to increase significantly once round four projects reach financial close and begin construction (IPP Office 2016b).
12 Utility scale, in this instance, is arbitrarily set at projects above 5 MWp.
Utility-Scale Renewable Energy: Market Intelligence Report 2017 2928 Utility-Scale Renewable Energy: Market Intelligence Report 2017
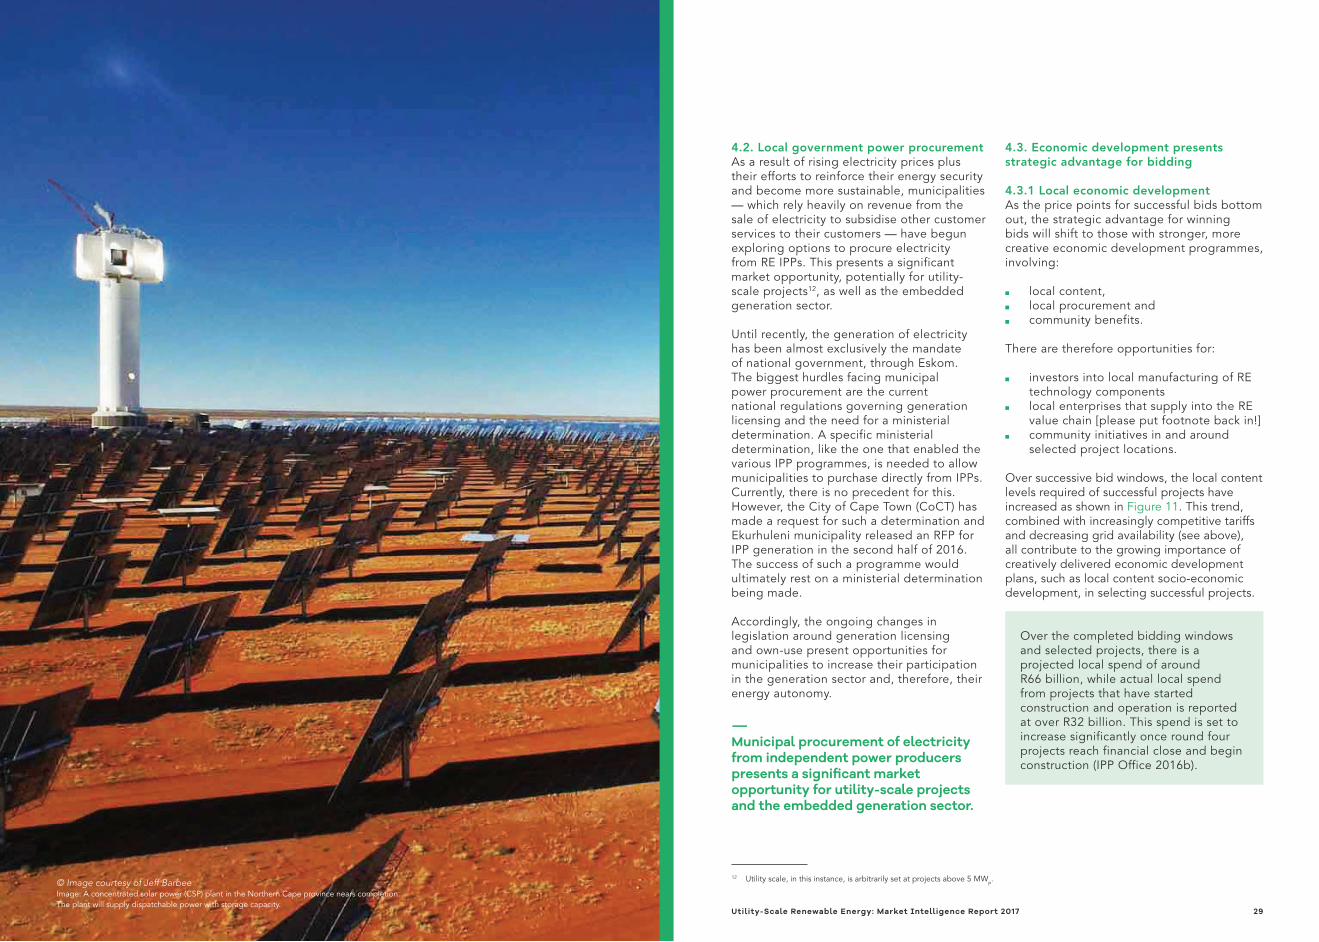
© Image courtesy of Jeff BarbeeImage: A concentrated solar power (CSP) plant in the Northern Cape province nears completion.The plant will supply dispatchable power with storage capacity.
CUMULATIVE DETERMINED RE CAPACITY (TOTAL OF OVER 14GW)
4.3.2. Manufacturing potential
Revised local content criteriaThe dti has revised the methodology used to calculate local content to capture investments in component manufacturing:
■ Specific component manufacturing will be encouraged: The criteria will focus on specific components of a facility (for example, in the case of a wind farm, towers and tower internals) that government seeks to encourage local manufacturing/assembly of.
■ Weighting will be applied: These
components will then weigh more towards local content, while the balance of plant components, such as civil and electrical works — which are mature industries in South Africa — will not count for local content, but must be procured locally.
This change in criteria gives a positive signal to investors about government’s commitment to supporting local manufacturing investments while recognising shortcomings in the implementation of local content rules.
OEMs already in the market have the competitive advantage. Those who are supplying into the REIPPPP already are able to tap into the opportunity created by the dti recalculation. They can, however, sharpen their competitive advantage aligning closely with the country’s industrialisation agenda (such as the local content stipulations) and the dti’s Special Economic Zone (SEZ) programme, which in the Western Cape has translated into the proposed Atlantis GreenTech SEZ.
Localisation studiesLocalisation studies have been commissioned by the dti for solar PV, wind energy and concentrated solar power (CSP) technologies. The purpose of these studies is to define which and how many components can be manufactured or assembled locally. The wind localisation study (DTI 2015), for example, indicates that the localisation of wind energy technology could result in the set-up of:
■ between one and five wind tower manufacturing facilities13
■ one blade manufacturing facility ■ one facility to assemble nacelles and
hubs.
—The dti localisation study for solar PV has found that it is feasible to set up at least five solar PV component manufacturing facilities in the country. Noting the possibility of increasing the uptake of solar PV generation, as per the CSIR’s study, there is an even larger manufacturing opportunity than may have previously been determined.
The Western Cape alone has, in the past three years, realised around R500 million in investments into component manufacturing. This total excludes spend on local services such as logistics, civil and electrical works for projects based within the province and nationally.
The REIPPPP stimulating investment in Special Economic Zones and Industrial Development Zones
In line with the REIPPPP’s contribution to development and local content manufacturing, a number of special economic and industrial zones have attracted investments by component manufacturers and other investors.
■ Atlantis SEZ: Investments worth R680 million have been attracted to the proposed Atlantis Greentech SEZ. It is projected that the SEZ will attract a further R1 billion worth of investment over next five years (IOL 2016). The bulk of this investment will come from the manufacturing of RE technology components.
■ Northern Cape, which houses the majority of solar projects, is set to realise significant investments from local content.
■ The Eastern Cape’s East London and Coega IDZs also house significant manufacturing investments, in solar PV panels and wind towers respectively, directly aligned to the success of the government’s REIPPPP.
Figure 11: Increasing local content over successive bidding rounds
1 2 3
BID WINDOW
LOC
AL
CO
NTE
NT
(%)
60
55
50
45
40
35
30
25
• WIND ENERGY LOCAL CONTENT (ACTUAL %)
• SOLAR PV LOCAL CONTENT (ACTUAL %)
• CSP LOCAL CONTENT(ACTUAL %)
13 Two such facilities have already been set up in South Africa, with one of them located in Atlantis Western Cape
Utility-Scale Renewable Energy: Market Intelligence Report 2017 3130 Utility-Scale Renewable Energy: Market Intelligence Report 2017
4.4. Market uncertaintiesRecent developments have to a large extent removed current uncertainties and the impasse in the RE market. President Zuma’s directive to Eskom to sign outstanding power purchase agreements (PPAs), coupled with the President and other ministers’ expressed commitment to the REIPPPP, has provided clarity on the government’s strategic priorities on energy procurement. Together with the release of the IRP and the announcement of ten successful small IPP bid window 2 projects, these have been welcome developments for the sector.
There is still a critical need for action by government on three levels, namely:
■ Ensuring continuity and continued transparency in the rollout of the REIPPPP.
■ Maintaining the country’s existing manufacturing base and attracting new investments.
■ Prioritising the reform of the country’s electricity sector to reflect South Africa’s wealth of energy resources and the market’s current offering.
Ensuring continuity and transparency in the REIPPPP rollout The success of the REIPPPP has largely hinged on the market size and longevity that the programme has afforded investors, as well as on the lauded transparency in the programme’s execution. Substantial efforts are needed to maintain these conditions, especially in light of recent programme challenges. Such efforts would include:
Finalising the IRP as a priority: It is imperative that the IRP is finalised in a transparent manner. The plan has been released for public comment to take into account public and industry inputs. An appropriate due diligence is necessary, especially relating to assumptions in the modelling of available resources.
Allocated projects should be rolled out immediately, as determined by the Minister of Energy. At the time of writing, round 4 and 4B projects have not yet reached financial close, pending signing of PPAs with Eskom. Expedited round projects have also not yet been announced.
Clear plans on REIPPPP’s future rollout should be announced. This will enable investors (from project developers to manufacturers) to make informed investment decisions and take long-term views on the market.
Markets in other parts of the world are on the rise, which means the local market is facing greater competition for investments. Nevertheless, given the South African RE market’s size, globally recognised effectiveness and transparency, the opportunity is still there for government to secure continued investment flows into the REIPPPP by carrying out its procurement plan.
Maintaining the country’s existing manufacturing baseThe REIPPPP has been highly successful in attracting manufacturing investments. However, because of global shifts and the Eskom impasse, investments have decreased in the past 12 months, especially in the manufacturing of RE technology components.
Local manufacturing is crucial to the success of the REIPPPP’s economic development (local content) component. It contributes to the selection of successful projects and forms part of the programme’s contribution to the national developmental agenda. To ensure that this manufacturing base is maintained, over and above the continuity of the programme, the following is needed:
Successful implementation of the government’s Special Economic Zone programme The SEZ programme is geared towards creating conducive environments for specific economic activities and supports national industrialisation efforts. The proposed Atlantis Greentech SEZ is well positioned to enable local manufacturing of RE technology components. It will form a strategic link in the ecosystem that government is creating to fully realise the opportunities that the REIPPPP presents.
Execution of local content and enterprise development components of the REIPPPP The local content component of economic development has been written into bid submission rules and is well understood. What is now needed is due diligence from both government (specifically the IPP Office) and the private sector to ensure compliance. Monitoring and evaluation are critical to ensure the credibility of the programme. It will also ensure that IPPs make use of local manufacturing capacity that has been set up in the country in response to REIPPPP and other industrialisation efforts.
Ensuring the implementation of SEZs and compliance with local content requirements will strengthen the market. Coupled with the rollout of the additional 6.3 GWp of capacity allocated to RE generation it will also provide the certainty and clarity that are so crucial for sustaining investor confidence.
Reforming the country’s electricity sector The recent tensions involving Eskom as the traditional grid operator point to a need to reform the country’s electricity sector in two ways:
Eskom should be allowed to revise its business model Global trends in electricity sector development show that it is typical for traditional monopolies to resist any sector reform or liberalisation that will reduce their market advantage. This is not a new or unique situation. Introducing competition in the generation space is a healthy market development, which has already achieved (even if only between RE players) significant tariff decreases. Moreover, Eskom’s own business model is now conflicted, with an imbalance between the generation business and the transmission and distribution business. There is an opportunity to split these businesses to achieve effective management and competitiveness of both. Current market developments, particularly the advent of IPPs, have fully exposed this.
New models for electricity generation and RE, gas and coal IPPs should be allowed In the new scheme of things, IPPs should play an increasingly important role. Eskom’s traditional dominance is successfully challenged by new market entrants. This transformation goes beyond the RE programme and includes the simultaneous coal and gas IPP programmes that are now underway. Similar changes are happening in the embedded generation space, with private end-users and municipalities seeking increased levels of autonomy from traditional electricity supply options. Market opportunities in this space are discussed in a separate GreenCape MIR covering the Energy Services market.
Utility-Scale Renewable Energy: Market Intelligence Report 2017 3332 Utility-Scale Renewable Energy: Market Intelligence Report 2017
5 –Funding and Incentives
This section briefly highlights the various incentives available in the utility-scale energy market. Thanks to the certainty and market view that it offers, the REIPPPP itself is an incentive. In addition, the South African government has put in place a number of other mechanisms to ensure the RE opportunities the country
continues to offer remain competitive and attractive.
5.1. Local content and manufacturingThe local content mechanism — which is core to the REIPPPP and highlighted in section 4.2 — is a significant incentive for investment in manufacturing. As we have already noted, South Africa has seen significant investment into RE manufacturing, with most of it landing in the Western Cape.
The Western Cape’s success at attracting green technology manufacturing and, more specifically, the manufacturing of RE components — such as solar PV panels, inverters, wind towers and wind tower internals — is the result of the eco-system of supporting institutions highlighted in Section 6 along with the proposed Atlantis SEZ, which will focus on greentech manufacturing.
More broadly, the SEZ programme sets out to designate specific areas in which pre-defined economic activities will be incentives. The aim is to have an SEZ in each province, with the selected economic activity positioned well within the province’s current or envisaged competitive advantage. The incentives on offer include:
■ Reduced corporate income tax rate: Qualifying companies will receive a reduced corporate tax of 15%, instead of the current 28% headline rate.
■ Employment Tax Incentive (ETI): Aimed at encouraging employers to hire young and less-experienced work seekers, the ETI will reduce the cost to employers of hiring young people through a cost sharing mechanism with government.
■ Building allowance: Qualifying companies will be eligible for an accelerated depreciation allowance on capital structures (buildings). This rate will equal 10% per annum over 10 years.
■ VAT and customs relief: Companies located within a customs-controlled area (CCA) will be eligible for VAT and customs relief in line with the relevant legislation (dti, 2015c).
Other incentives available to investments into a designated SEZ will include:
■ 12I Tax Allowance Incentive (12I TAI) Deadline for applications is 31 December 2017.
■ One-stop shop facility within designated SEZ area
■ SEZ fund for infrastructure development within the designated area.
It is crucial to exploit the symbiotic relationship between local content and the designation of RE-related SEZs. This applies to the need for the effective execution of local content as well as the designation of appropriate SEZs – such as the proposed Atlantis GreenTech SEZ and the Northern Cape’s proposed solar SEZ.
Utility-Scale Renewable Energy: Market Intelligence Report 2017 3534 Utility-Scale Renewable Energy: Market Intelligence Report 2017
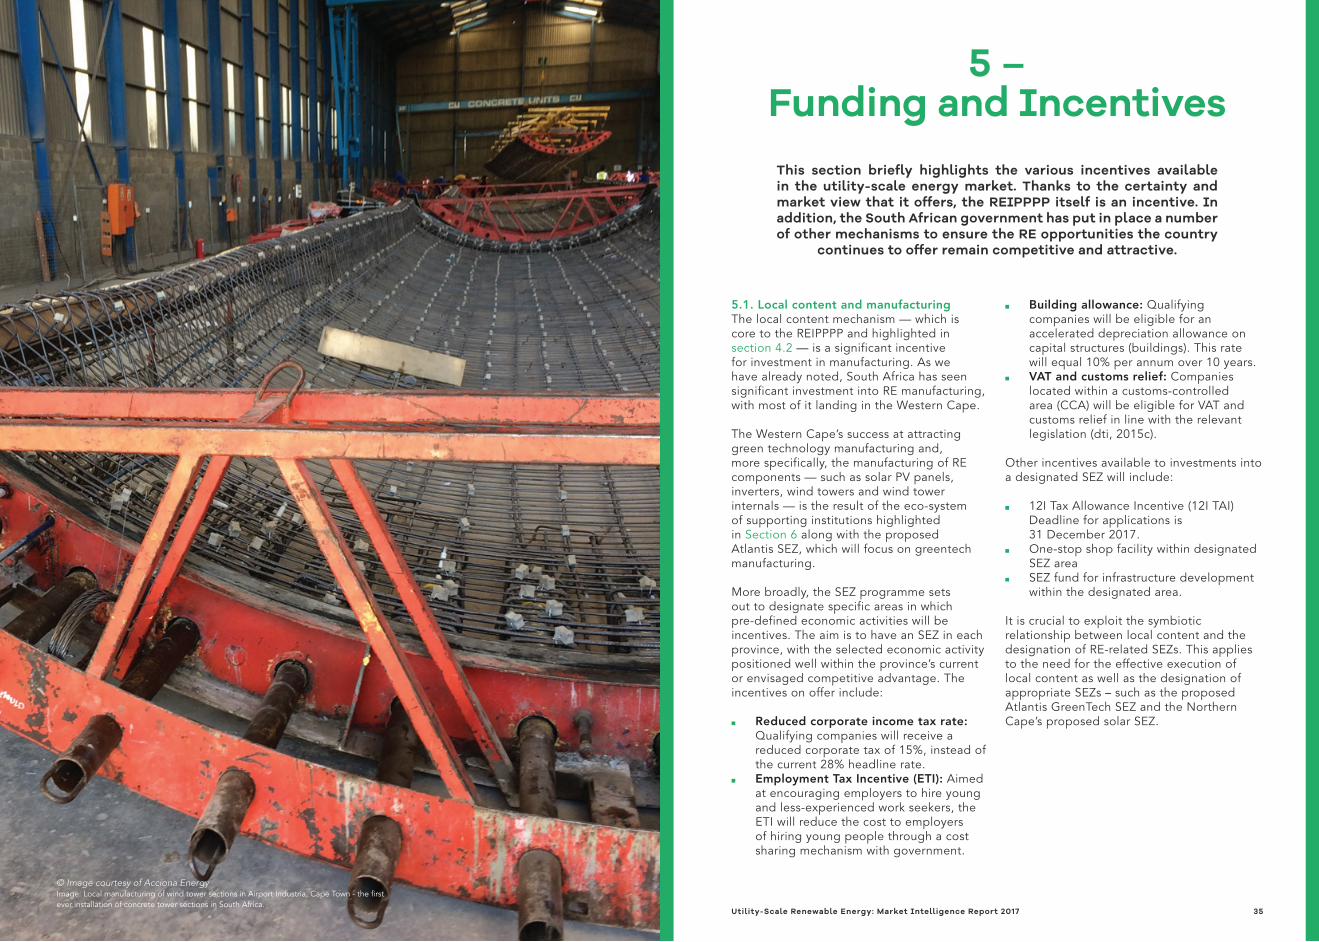
© Image courtesy of Acciona EnergyImage: Local manufacturing of wind tower sections in Airport Industria, Cape Town - the first ever installation of concrete tower sections in South Africa.
5.2. A conducive project development eco-systemAvailability of finance and a solid financial regime are essential to the successful development of utility scale projects, and South Africa’s financial system participated significantly in financing the REIPPPP. South Africa’s big four banks — Standard Bank, FirstRand Bank, Nedbank and ABSA — have all financed projects, especially in the early rounds. In later rounds, private financiers have moved in and the market has seen an increase in funders interested in the REIPPPP. GreenCape’s members include a wide variety of these financiers as well as project sponsors.
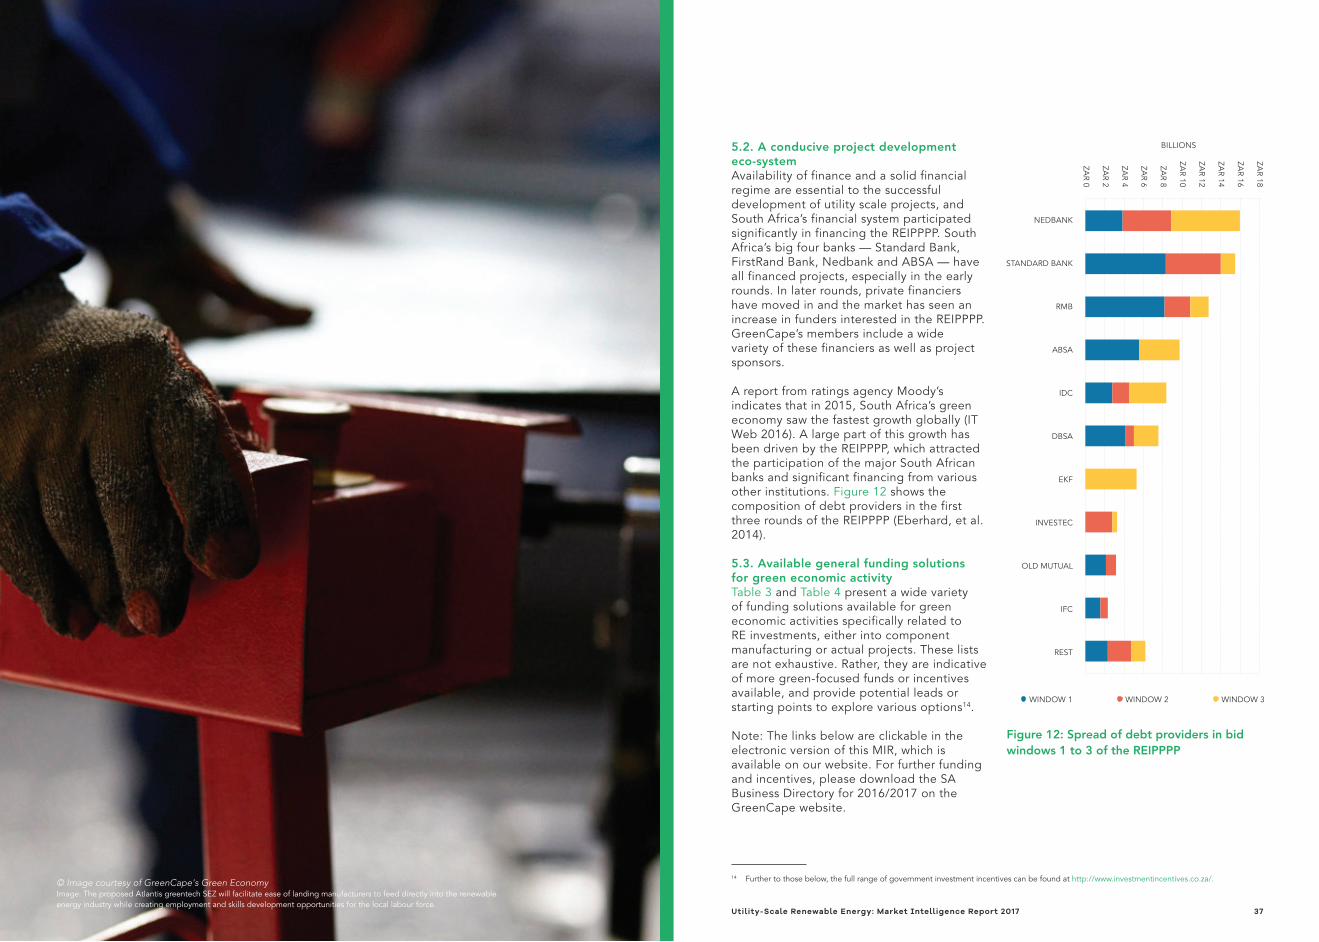
A report from ratings agency Moody’s indicates that in 2015, South Africa’s green economy saw the fastest growth globally (IT Web 2016). A large part of this growth has been driven by the REIPPPP, which attracted the participation of the major South African banks and significant financing from various other institutions. Figure 12 shows the composition of debt providers in the first three rounds of the REIPPPP (Eberhard, et al. 2014).
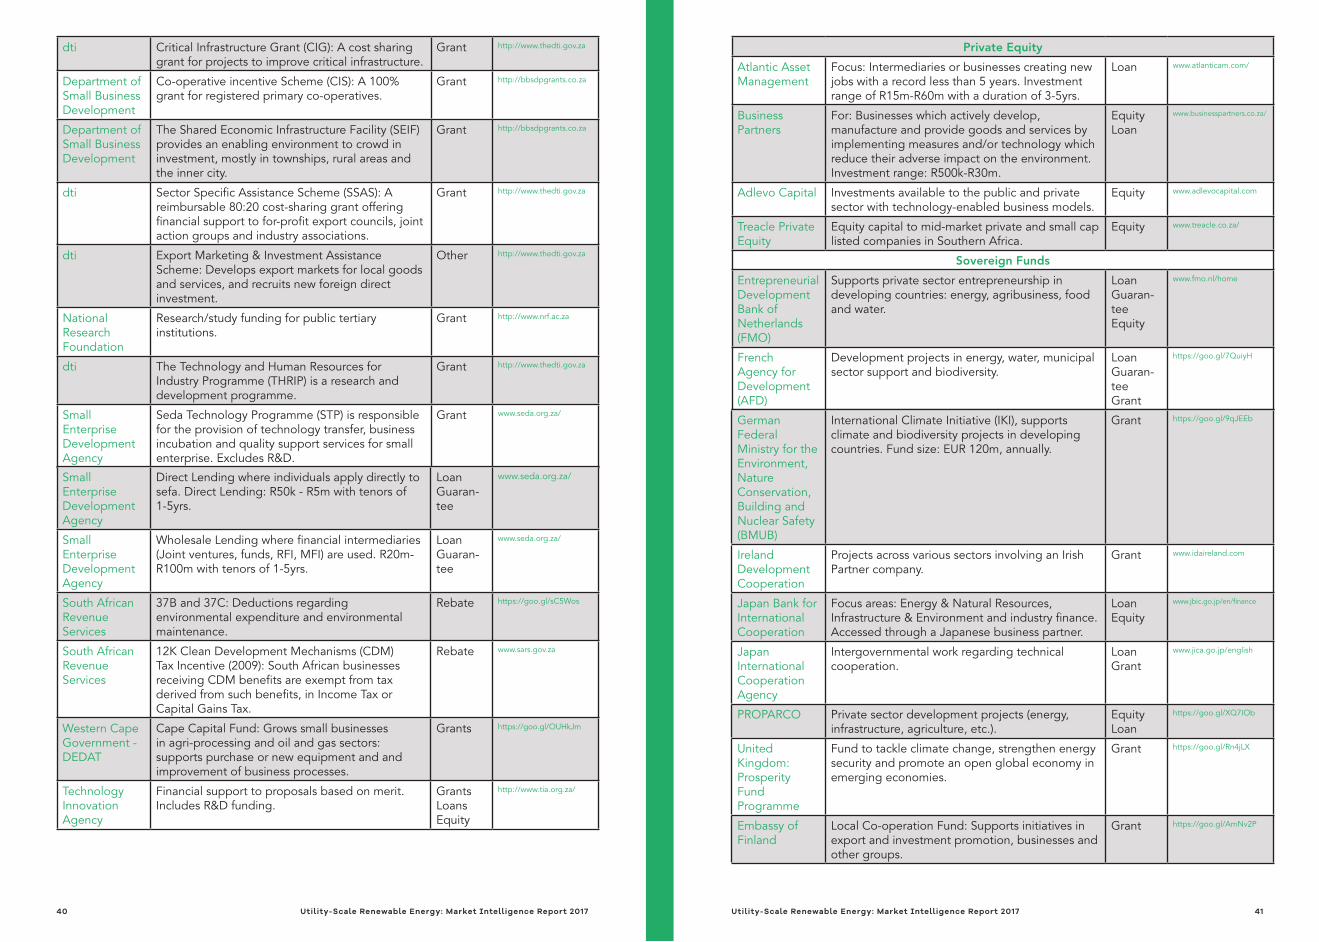
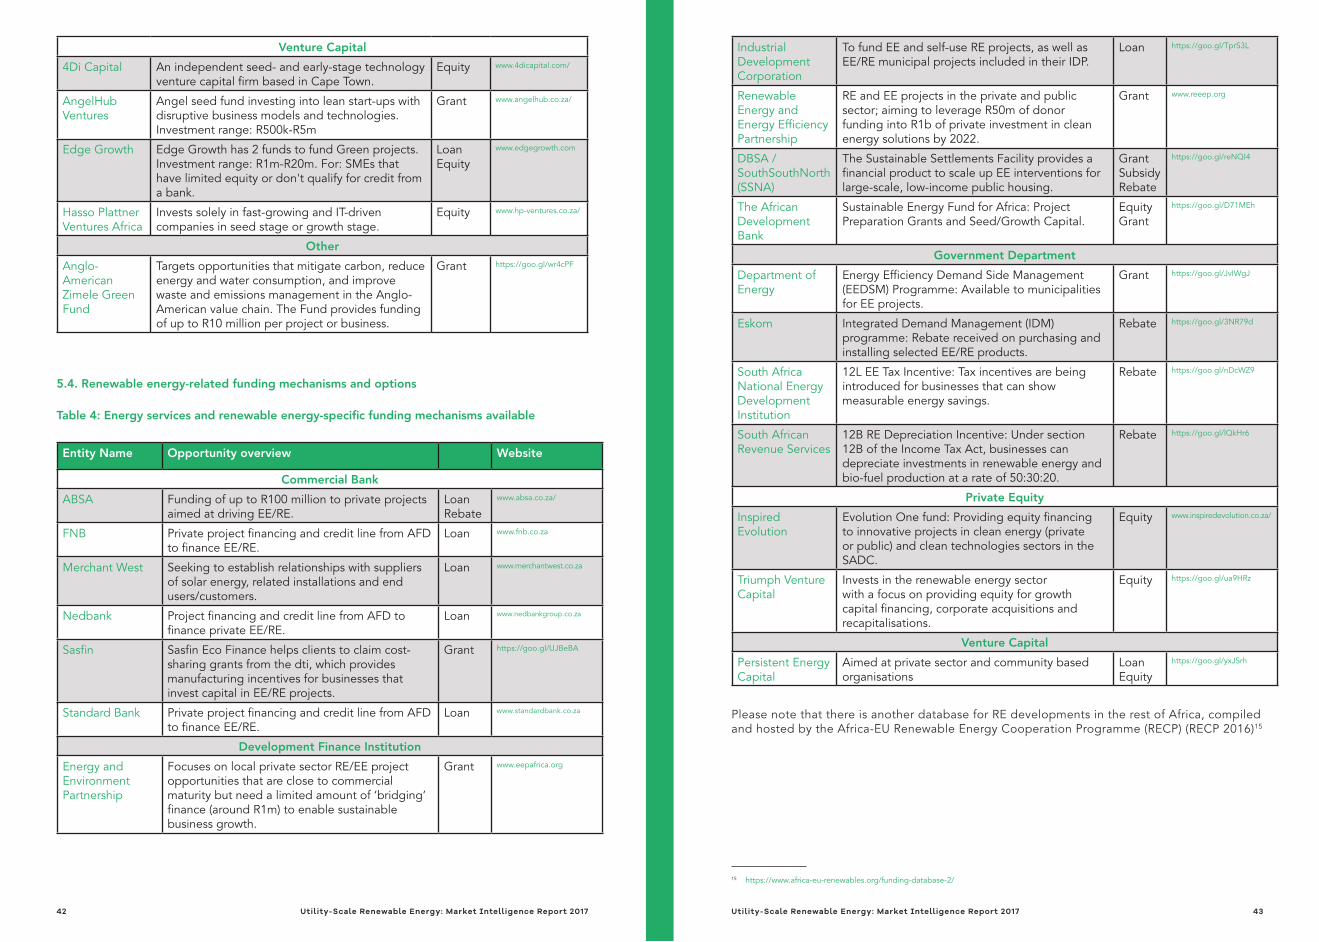
5.3. Available general funding solutions for green economic activityTable 3 and Table 4 present a wide variety of funding solutions available for green economic activities specifically related to RE investments, either into component manufacturing or actual projects. These lists are not exhaustive. Rather, they are indicative of more green-focused funds or incentives available, and provide potential leads or starting points to explore various options14.
Note: The links below are clickable in the electronic version of this MIR, which is available on our website. For further funding and incentives, please download the SA Business Directory for 2016/2017 on the GreenCape website.
Figure 12: Spread of debt providers in bid windows 1 to 3 of the REIPPPP
BILLIONS
• WINDOW 1 • WINDOW 2 • WINDOW 3
ZAR 18
ZAR 16
ZAR 14
ZAR 12
ZAR 10
ZAR 8
ZAR 6
ZAR 4
ZAR 2
ZAR 0
NEDBANK
STANDARD BANK
RMB
ABSA
IDC
DBSA
EKF
INVESTEC
OLD MUTUAL
IFC
REST
14 Further to those below, the full range of government investment incentives can be found at http://www.investmentincentives.co.za/.
Utility-Scale Renewable Energy: Market Intelligence Report 2017 3736 Utility-Scale Renewable Energy: Market Intelligence Report 2017
© Image courtesy of GreenCape's Green Economy Image: The proposed Atlantis greentech SEZ will facilitate ease of landing manufacturers to feed directly into the renewable energy industry while creating employment and skills development opportunities for the local labour force.
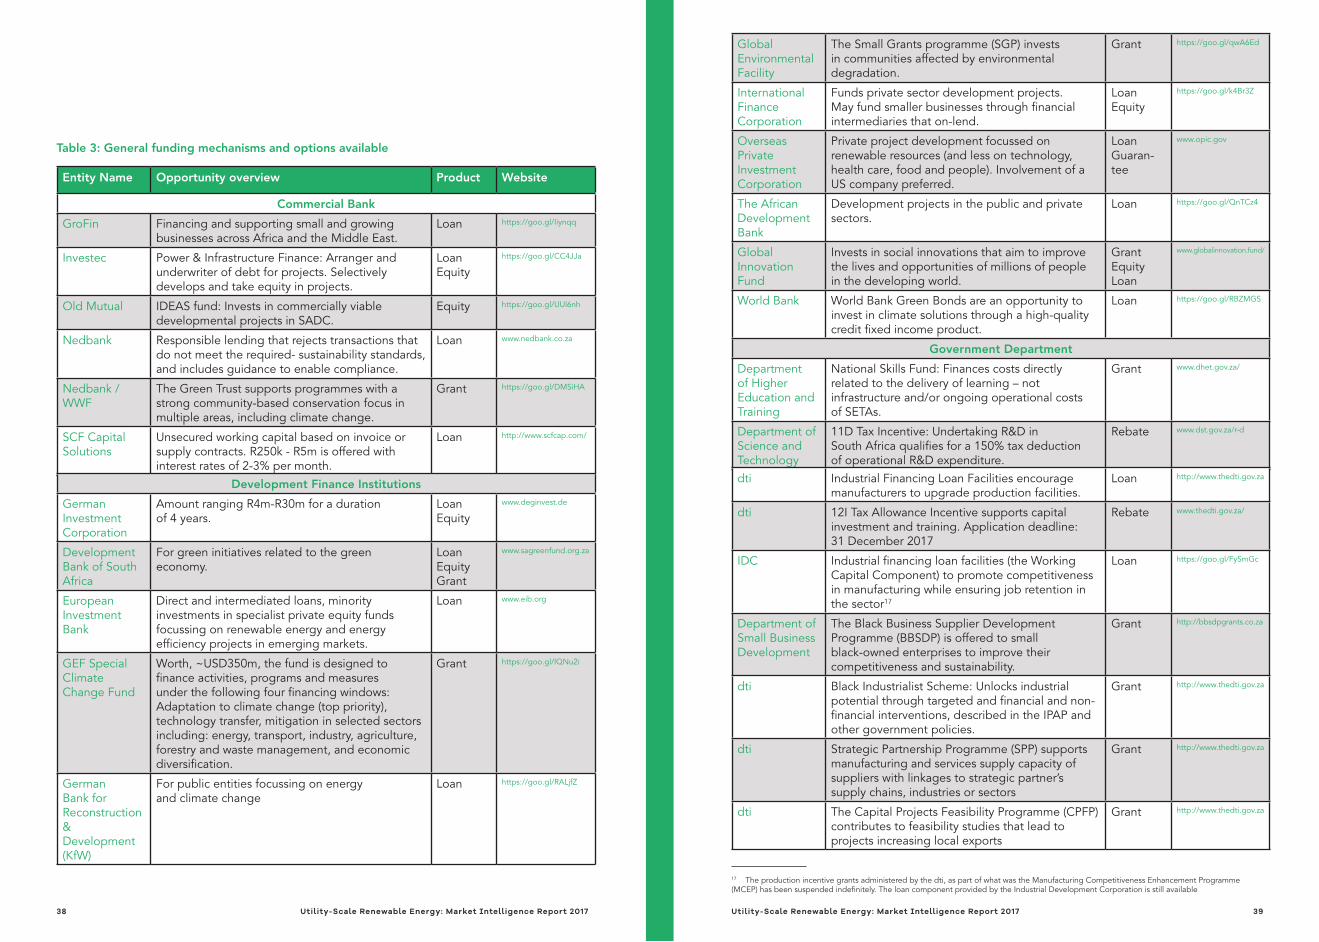
Table 3: General funding mechanisms and options available
Entity Name Opportunity overview Product Website
Commercial Bank
GroFin Financing and supporting small and growing businesses across Africa and the Middle East.
Loan https://goo.gl/Iiynqq
Investec Power & Infrastructure Finance: Arranger and underwriter of debt for projects. Selectively develops and take equity in projects.
Loan Equity
https://goo.gl/CC4JJa
Old Mutual IDEAS fund: Invests in commercially viable developmental projects in SADC.
Equity https://goo.gl/UUl6nh
Nedbank Responsible lending that rejects transactions that do not meet the required- sustainability standards, and includes guidance to enable compliance.
Loan www.nedbank.co.za
Nedbank / WWF
The Green Trust supports programmes with a strong community-based conservation focus in multiple areas, including climate change.
Grant https://goo.gl/DMSiHA
SCF Capital Solutions
Unsecured working capital based on invoice or supply contracts. R250k - R5m is offered with interest rates of 2-3% per month.
Loan http://www.scfcap.com/
Development Finance Institutions
German Investment Corporation
Amount ranging R4m-R30m for a duration of 4 years.
Loan Equity
www.deginvest.de
Development Bank of South Africa
For green initiatives related to the green economy.
Loan Equity Grant
www.sagreenfund.org.za
European Investment Bank
Direct and intermediated loans, minority investments in specialist private equity funds focussing on renewable energy and energy efficiency projects in emerging markets.
Loan www.eib.org
GEF Special Climate Change Fund
Worth, ~USD350m, the fund is designed to finance activities, programs and measures under the following four financing windows: Adaptation to climate change (top priority), technology transfer, mitigation in selected sectors including: energy, transport, industry, agriculture, forestry and waste management, and economic diversification.
Grant https://goo.gl/lQNu2i
German Bank for Reconstruction & Development (KfW)
For public entities focussing on energy and climate change
Loan https://goo.gl/RALjfZ
Global Environmental Facility
The Small Grants programme (SGP) invests in communities affected by environmental degradation.
Grant https://goo.gl/qwA6Ed
International Finance Corporation
Funds private sector development projects. May fund smaller businesses through financial intermediaries that on-lend.
Loan Equity
https://goo.gl/k4Br3Z
Overseas Private Investment Corporation
Private project development focussed on renewable resources (and less on technology, health care, food and people). Involvement of a US company preferred.
Loan Guaran-tee
www.opic.gov
The African Development Bank
Development projects in the public and private sectors.
Loan https://goo.gl/QnTCz4
Global Innovation Fund
Invests in social innovations that aim to improve the lives and opportunities of millions of people in the developing world.
GrantEquityLoan
www.globalinnovation.fund/
World Bank World Bank Green Bonds are an opportunity to invest in climate solutions through a high-quality credit fixed income product.
Loan https://goo.gl/RBZMGS
Government Department
Department of Higher Education and Training
National Skills Fund: Finances costs directly related to the delivery of learning – not infrastructure and/or ongoing operational costs of SETAs.
Grant www.dhet.gov.za/
Department of Science and Technology
11D Tax Incentive: Undertaking R&D in South Africa qualifies for a 150% tax deduction of operational R&D expenditure.
Rebate www.dst.gov.za/r-d
dti Industrial Financing Loan Facilities encourage manufacturers to upgrade production facilities.
Loan http://www.thedti.gov.za
dti 12I Tax Allowance Incentive supports capital investment and training. Application deadline: 31 December 2017
Rebate www.thedti.gov.za/
IDC Industrial financing loan facilities (the Working Capital Component) to promote competitiveness in manufacturing while ensuring job retention in the sector17
Loan https://goo.gl/FySmGc
Department of Small Business Development
The Black Business Supplier Development Programme (BBSDP) is offered to small black-owned enterprises to improve their competitiveness and sustainability.
Grant http://bbsdpgrants.co.za
dti Black Industrialist Scheme: Unlocks industrial potential through targeted and financial and non-financial interventions, described in the IPAP and other government policies.
Grant http://www.thedti.gov.za
dti Strategic Partnership Programme (SPP) supports manufacturing and services supply capacity of suppliers with linkages to strategic partner’s supply chains, industries or sectors
Grant http://www.thedti.gov.za
dti The Capital Projects Feasibility Programme (CPFP) contributes to feasibility studies that lead to projects increasing local exports
Grant http://www.thedti.gov.za
17 The production incentive grants administered by the dti, as part of what was the Manufacturing Competitiveness Enhancement Programme (MCEP) has been suspended indefinitely. The loan component provided by the Industrial Development Corporation is still available
Utility-Scale Renewable Energy: Market Intelligence Report 2017 3938 Utility-Scale Renewable Energy: Market Intelligence Report 2017
dti Critical Infrastructure Grant (CIG): A cost sharing grant for projects to improve critical infrastructure.
Grant http://www.thedti.gov.za
Department of Small Business Development
Co-operative incentive Scheme (CIS): A 100% grant for registered primary co-operatives.
Grant http://bbsdpgrants.co.za
Department of Small Business Development
The Shared Economic Infrastructure Facility (SEIF) provides an enabling environment to crowd in investment, mostly in townships, rural areas and the inner city.
Grant http://bbsdpgrants.co.za
dti Sector Specific Assistance Scheme (SSAS): A reimbursable 80:20 cost-sharing grant offering financial support to for-profit export councils, joint action groups and industry associations.
Grant http://www.thedti.gov.za
dti Export Marketing & Investment Assistance Scheme: Develops export markets for local goods and services, and recruits new foreign direct investment.
Other http://www.thedti.gov.za
National Research Foundation
Research/study funding for public tertiary institutions.
Grant http://www.nrf.ac.za
dti The Technology and Human Resources for Industry Programme (THRIP) is a research and development programme.
Grant http://www.thedti.gov.za
Small Enterprise Development Agency
Seda Technology Programme (STP) is responsible for the provision of technology transfer, business incubation and quality support services for small enterprise. Excludes R&D.
Grant www.seda.org.za/
Small Enterprise Development Agency
Direct Lending where individuals apply directly to sefa. Direct Lending: R50k - R5m with tenors of 1-5yrs.
Loan Guaran-tee
www.seda.org.za/
Small Enterprise Development Agency
Wholesale Lending where financial intermediaries (Joint ventures, funds, RFI, MFI) are used. R20m-R100m with tenors of 1-5yrs.
Loan Guaran-tee
www.seda.org.za/
South African Revenue Services
37B and 37C: Deductions regarding environmental expenditure and environmental maintenance.
Rebate https://goo.gl/sC5Wos
South African Revenue Services
12K Clean Development Mechanisms (CDM) Tax Incentive (2009): South African businesses receiving CDM benefits are exempt from tax derived from such benefits, in Income Tax or Capital Gains Tax.
Rebate www.sars.gov.za
Western Cape Government - DEDAT
Cape Capital Fund: Grows small businesses in agri-processing and oil and gas sectors: supports purchase or new equipment and and improvement of business processes.
Grants https://goo.gl/OUHkJm
Technology Innovation Agency
Financial support to proposals based on merit. Includes R&D funding.
GrantsLoansEquity
http://www.tia.org.za/
Private Equity
Atlantic Asset Management
Focus: Intermediaries or businesses creating new jobs with a record less than 5 years. Investment range of R15m-R60m with a duration of 3-5yrs.
Loan www.atlanticam.com/
Business Partners
For: Businesses which actively develop, manufacture and provide goods and services by implementing measures and/or technology which reduce their adverse impact on the environment. Investment range: R500k-R30m.
Equity Loan
www.businesspartners.co.za/
Adlevo Capital Investments available to the public and private sector with technology-enabled business models.
Equity www.adlevocapital.com
Treacle Private Equity
Equity capital to mid-market private and small cap listed companies in Southern Africa.
Equity www.treacle.co.za/
Sovereign Funds
Entrepreneurial Development Bank of Netherlands (FMO)
Supports private sector entrepreneurship in developing countries: energy, agribusiness, food and water.
Loan Guaran-tee Equity
www.fmo.nl/home
French Agency for Development (AFD)
Development projects in energy, water, municipal sector support and biodiversity.
Loan Guaran-tee Grant
https://goo.gl/7QuiyH
German Federal Ministry for the Environment, Nature Conservation, Building and Nuclear Safety (BMUB)
International Climate Initiative (IKI), supports climate and biodiversity projects in developing countries. Fund size: EUR 120m, annually.
Grant https://goo.gl/9qJEEb
Ireland Development Cooperation
Projects across various sectors involving an Irish Partner company.
Grant www.idaireland.com
Japan Bank for International Cooperation
Focus areas: Energy & Natural Resources, Infrastructure & Environment and industry finance. Accessed through a Japanese business partner.
Loan Equity
www.jbic.go.jp/en/finance
Japan International Cooperation Agency
Intergovernmental work regarding technical cooperation.
Loan Grant
www.jica.go.jp/english
PROPARCO Private sector development projects (energy, infrastructure, agriculture, etc.).
EquityLoan
https://goo.gl/XQ7IOb
United Kingdom: Prosperity Fund Programme
Fund to tackle climate change, strengthen energy security and promote an open global economy in emerging economies.
Grant https://goo.gl/Rn4jLX
Embassy of Finland
Local Co-operation Fund: Supports initiatives in export and investment promotion, businesses and other groups.
Grant https://goo.gl/AmNv2P
Utility-Scale Renewable Energy: Market Intelligence Report 2017 4140 Utility-Scale Renewable Energy: Market Intelligence Report 2017
Venture Capital
4Di Capital An independent seed- and early-stage technology venture capital firm based in Cape Town.
Equity www.4dicapital.com/
AngelHub Ventures
Angel seed fund investing into lean start-ups with disruptive business models and technologies. Investment range: R500k-R5m
Grant www.angelhub.co.za/
Edge Growth Edge Growth has 2 funds to fund Green projects. Investment range: R1m-R20m. For: SMEs that have limited equity or don't qualify for credit from a bank.
Loan Equity
www.edgegrowth.com
Hasso Plattner Ventures Africa
Invests solely in fast-growing and IT-driven companies in seed stage or growth stage.
Equity www.hp-ventures.co.za/
Other
Anglo-American Zimele Green Fund
Targets opportunities that mitigate carbon, reduce energy and water consumption, and improve waste and emissions management in the Anglo-American value chain. The Fund provides funding of up to R10 million per project or business.
Grant https://goo.gl/wr4cPF
5.4. Renewable energy-related funding mechanisms and options
Table 4: Energy services and renewable energy-specific funding mechanisms available
Entity Name Opportunity overview Website
Commercial Bank
ABSA Funding of up to R100 million to private projects aimed at driving EE/RE.
Loan Rebate
www.absa.co.za/
FNB Private project financing and credit line from AFD to finance EE/RE.
Loan www.fnb.co.za
Merchant West Seeking to establish relationships with suppliers of solar energy, related installations and end users/customers.
Loan www.merchantwest.co.za
Nedbank Project financing and credit line from AFD to finance private EE/RE.
Loan www.nedbankgroup.co.za
Sasfin Sasfin Eco Finance helps clients to claim cost-sharing grants from the dti, which provides manufacturing incentives for businesses that invest capital in EE/RE projects.
Grant https://goo.gl/UJBeBA
Standard Bank Private project financing and credit line from AFD to finance EE/RE.
Loan www.standardbank.co.za
Development Finance Institution
Energy and Environment Partnership
Focuses on local private sector RE/EE project opportunities that are close to commercial maturity but need a limited amount of ‘bridging’ finance (around R1m) to enable sustainable business growth.
Grant www.eepafrica.org
Industrial Development Corporation
To fund EE and self-use RE projects, as well as EE/RE municipal projects included in their IDP.
Loan https://goo.gl/TprS3L
Renewable Energy and Energy Efficiency Partnership
RE and EE projects in the private and public sector; aiming to leverage R50m of donor funding into R1b of private investment in clean energy solutions by 2022.
Grant www.reeep.org
DBSA / SouthSouthNorth (SSNA)
The Sustainable Settlements Facility provides a financial product to scale up EE interventions for large-scale, low-income public housing.
Grant Subsidy Rebate
https://goo.gl/reNQI4
The African Development Bank
Sustainable Energy Fund for Africa: Project Preparation Grants and Seed/Growth Capital.
Equity Grant
https://goo.gl/D71MEh
Government Department
Department of Energy
Energy Efficiency Demand Side Management (EEDSM) Programme: Available to municipalities for EE projects.
Grant https://goo.gl/JvIWgJ
Eskom Integrated Demand Management (IDM) programme: Rebate received on purchasing and installing selected EE/RE products.
Rebate https://goo.gl/3NR79d
South Africa National Energy Development Institution
12L EE Tax Incentive: Tax incentives are being introduced for businesses that can show measurable energy savings.
Rebate https://goo.gl/nDcWZ9
South African Revenue Services
12B RE Depreciation Incentive: Under section 12B of the Income Tax Act, businesses can depreciate investments in renewable energy and bio-fuel production at a rate of 50:30:20.
Rebate https://goo.gl/lQkHr6
Private Equity
Inspired Evolution
Evolution One fund: Providing equity financing to innovative projects in clean energy (private or public) and clean technologies sectors in the SADC.
Equity www.inspiredevolution.co.za/
Triumph Venture Capital
Invests in the renewable energy sector with a focus on providing equity for growth capital financing, corporate acquisitions and recapitalisations.
Equity https://goo.gl/ua9HRz
Venture Capital
Persistent Energy Capital
Aimed at private sector and community based organisations
Loan Equity
https://goo.gl/yxJSrh
Please note that there is another database for RE developments in the rest of Africa, compiled and hosted by the Africa-EU Renewable Energy Cooperation Programme (RECP) (RECP 2016)15
15 https://www.africa-eu-renewables.org/funding-database-2/
Utility-Scale Renewable Energy: Market Intelligence Report 2017 4342 Utility-Scale Renewable Energy: Market Intelligence Report 2017
44 Utility-Scale Renewable Energy: Market Intelligence Report 2017
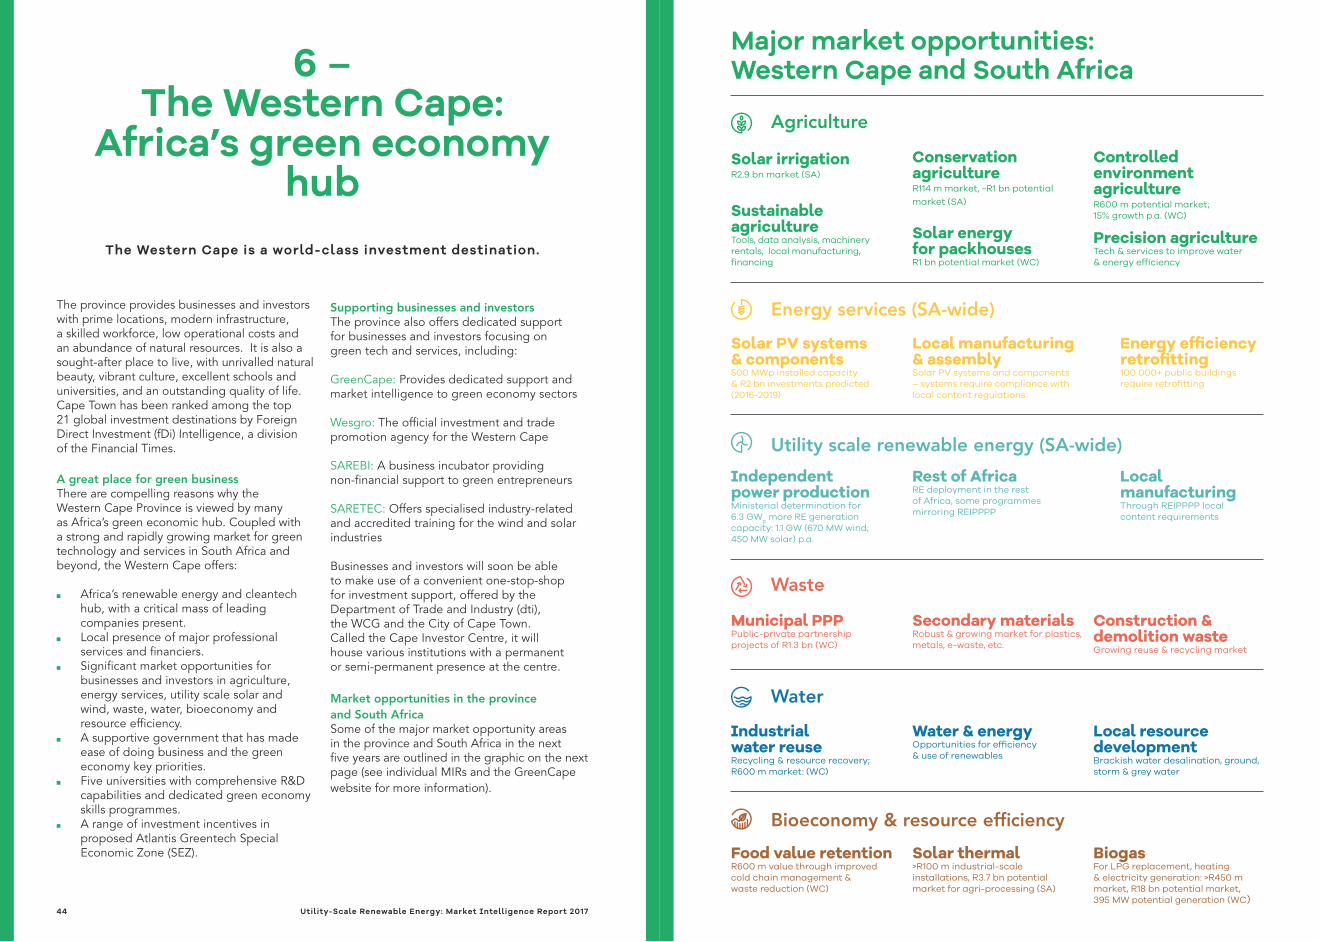
6 –The Western Cape:
Africa’s green economy hub
The Western Cape is a world-class investment destination.
The province provides businesses and investors with prime locations, modern infrastructure, a skilled workforce, low operational costs and an abundance of natural resources. It is also a sought-after place to live, with unrivalled natural beauty, vibrant culture, excellent schools and universities, and an outstanding quality of life. Cape Town has been ranked among the top 21 global investment destinations by Foreign Direct Investment (fDi) Intelligence, a division of the Financial Times.
A great place for green businessThere are compelling reasons why the Western Cape Province is viewed by many as Africa’s green economic hub. Coupled with a strong and rapidly growing market for green technology and services in South Africa and beyond, the Western Cape offers:
■ Africa’s renewable energy and cleantech hub, with a critical mass of leading companies present.
■ Local presence of major professional services and financiers.
■ Significant market opportunities for businesses and investors in agriculture, energy services, utility scale solar and wind, waste, water, bioeconomy and resource efficiency.
■ A supportive government that has made ease of doing business and the green economy key priorities.
■ Five universities with comprehensive R&D capabilities and dedicated green economy skills programmes.
■ A range of investment incentives in proposed Atlantis Greentech Special Economic Zone (SEZ).
Supporting businesses and investorsThe province also offers dedicated support for businesses and investors focusing on green tech and services, including:
GreenCape: Provides dedicated support and market intelligence to green economy sectors
Wesgro: The official investment and trade promotion agency for the Western Cape
SAREBI: A business incubator providing non-financial support to green entrepreneurs
SARETEC: Offers specialised industry-related and accredited training for the wind and solar industries
Businesses and investors will soon be able to make use of a convenient one-stop-shop for investment support, offered by the Department of Trade and Industry (dti), the WCG and the City of Cape Town. Called the Cape Investor Centre, it will house various institutions with a permanent or semi-permanent presence at the centre.
Market opportunities in the province and South AfricaSome of the major market opportunity areas in the province and South Africa in the next five years are outlined in the graphic on the next page (see individual MIRs and the GreenCape website for more information).
Major market opportunities: Western Cape and South Africa
Agriculture
Energy services (SA-wide)
Utility scale renewable energy (SA-wide)
Solar irrigation R2.9 bn market (SA)
Controlled environment agricultureR600 m potential market; 15% growth p.a. (WC)
Conservation agricultureR114 m market, ~R1 bn potential market (SA)
Solar energy for packhousesR1 bn potential market (WC)
Sustainable agricultureTools, data analysis, machinery rentals, local manufacturing, financing
Precision agriculture Tech & services to improve water & energy efficiency
Solar PV systems & components 500 MWp installed capacity & R2 bn investments predicted (2016-2019)
Local manufacturing & assemblySolar PV systems and components – systems require compliance with local content regulations
Energy efficiency retrofitting 100 000+ public buildings require retrofitting
Independent power production Ministerial determination for 6.3 GWp more RE generation capacity: 1.1 GW (670 MW wind; 450 MW solar) p.a.
Local manufacturing Through REIPPPP local content requirements
Rest of Africa RE deployment in the rest of Africa, some programmes mirroring REIPPPP
Waste
Municipal PPPPublic-private partnership projects of R1.3 bn (WC)
Construction & demolition wasteGrowing reuse & recycling market
Secondary materials Robust & growing market for plastics, metals, e-waste, etc.
Water
Industrial water reuseRecycling & resource recovery; R600 m market: (WC)
Local resource developmentBrackish water desalination, ground, storm & grey water
Water & energy Opportunities for efficiency & use of renewables
Food value retention R600 m value through improved cold chain management & waste reduction (WC)
Biogas For LPG replacement, heating & electricity generation: >R450 m market, R18 bn potential market, 395 MW potential generation (WC)
Solar thermal>R100 m industrial-scale installations, R3.7 bn potential market for agri-processing (SA)
Bioeconomy & resource efficiency
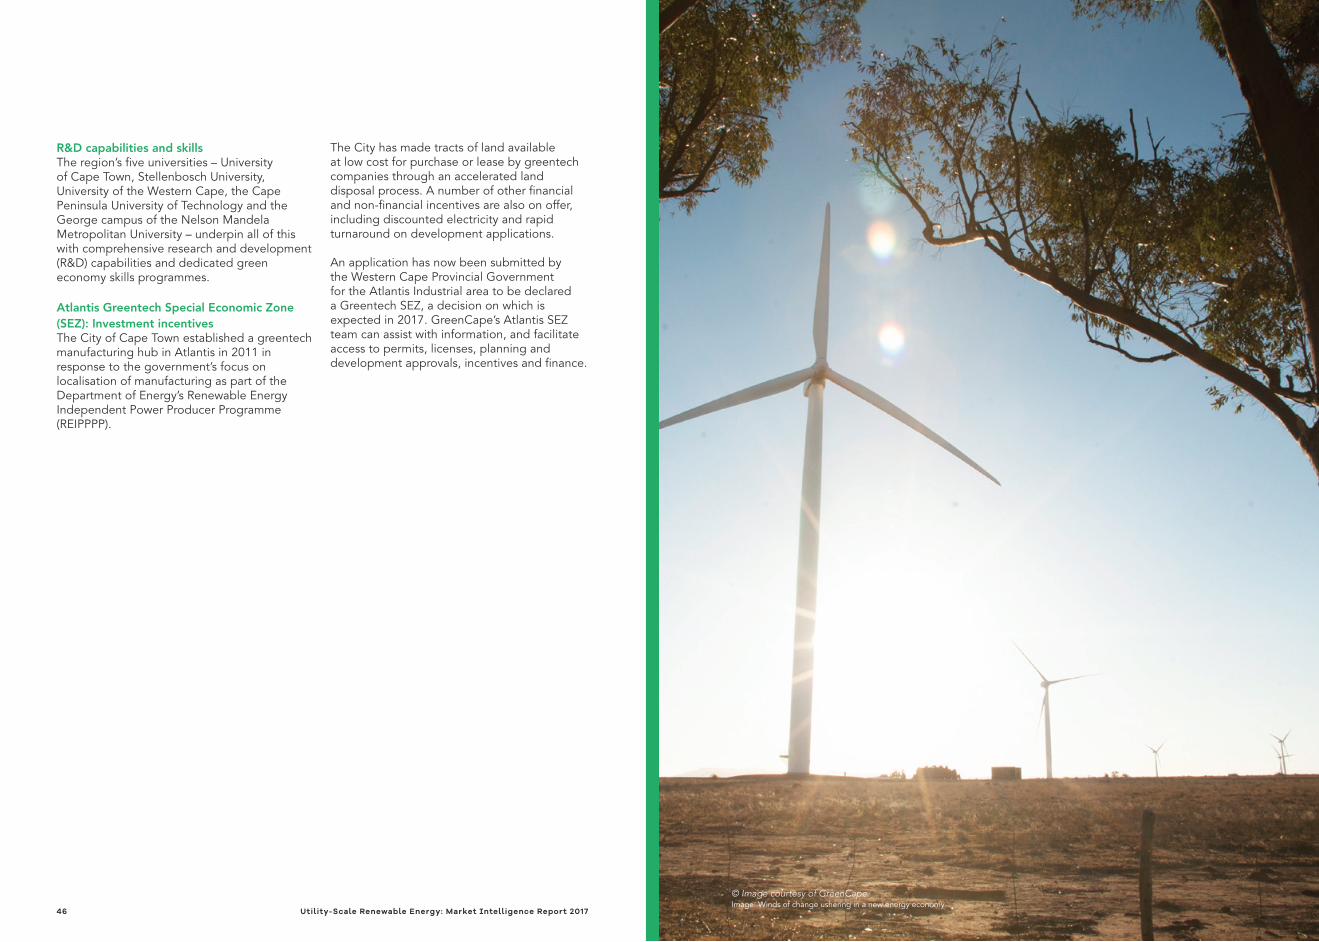
46 Utility-Scale Renewable Energy: Market Intelligence Report 2017
R&D capabilities and skills The region’s five universities – University of Cape Town, Stellenbosch University, University of the Western Cape, the Cape Peninsula University of Technology and the George campus of the Nelson Mandela Metropolitan University – underpin all of this with comprehensive research and development (R&D) capabilities and dedicated green economy skills programmes.
Atlantis Greentech Special Economic Zone (SEZ): Investment incentivesThe City of Cape Town established a greentech manufacturing hub in Atlantis in 2011 in response to the government’s focus on localisation of manufacturing as part of the Department of Energy’s Renewable Energy Independent Power Producer Programme (REIPPPP).
The City has made tracts of land available at low cost for purchase or lease by greentech companies through an accelerated land disposal process. A number of other financial and non-financial incentives are also on offer, including discounted electricity and rapid turnaround on development applications.
An application has now been submitted by the Western Cape Provincial Government for the Atlantis Industrial area to be declared a Greentech SEZ, a decision on which is expected in 2017. GreenCape’s Atlantis SEZ team can assist with information, and facilitate access to permits, licenses, planning and development approvals, incentives and finance.
© Image courtesy of GreenCapeImage: Winds of change ushering in a new energy economy.
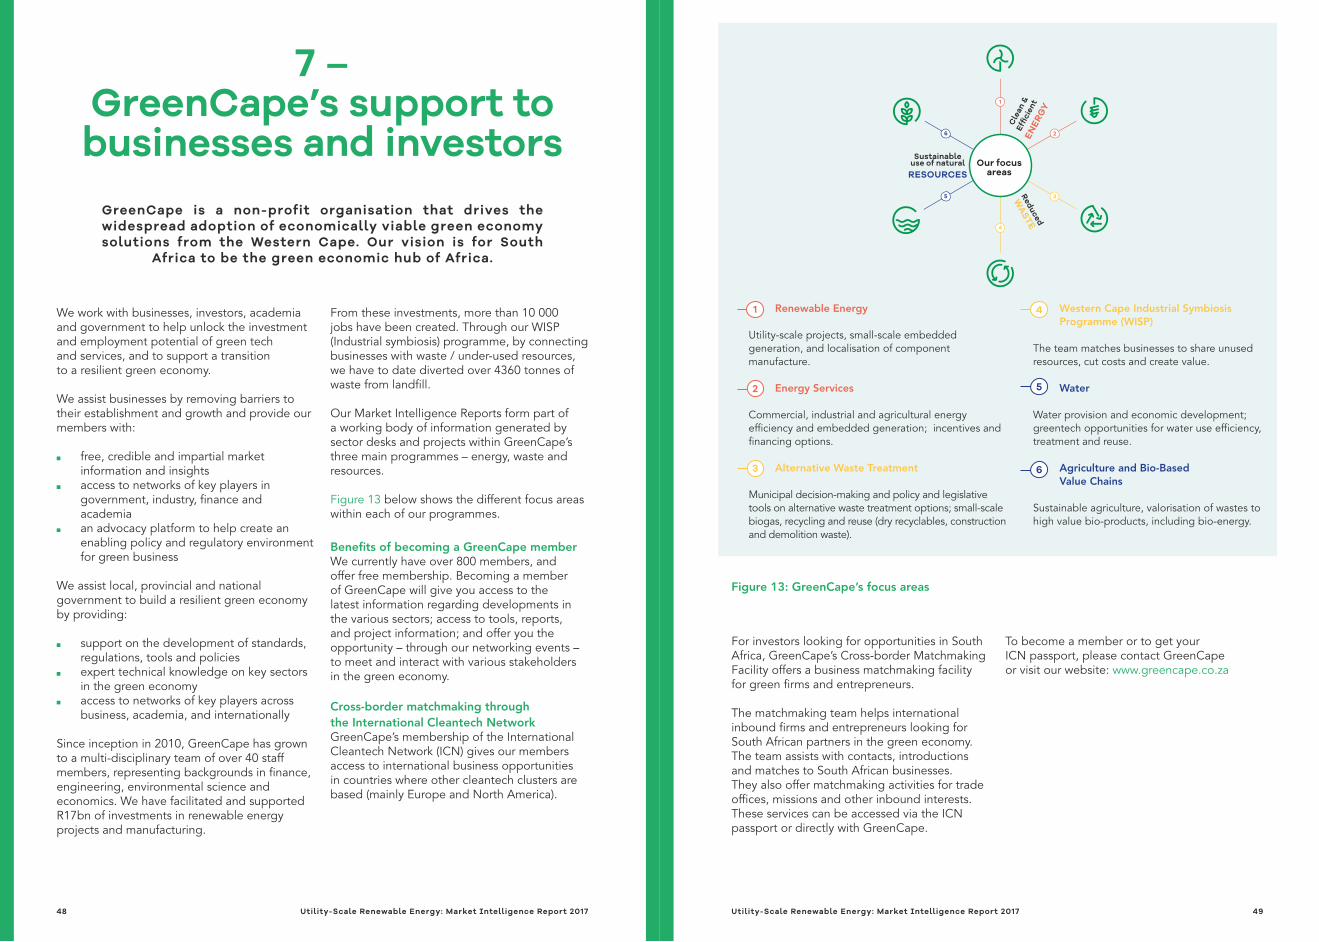
Utility-Scale Renewable Energy: Market Intelligence Report 2017 4948 Utility-Scale Renewable Energy: Market Intelligence Report 2017
7 –GreenCape’s support to businesses and investors
GreenCape is a non-profit organisation that drives the widespread adoption of economically viable green economy solutions from the Western Cape. Our vision is for South
Africa to be the green economic hub of Africa.
We work with businesses, investors, academia and government to help unlock the investment and employment potential of green tech and services, and to support a transition to a resilient green economy.
We assist businesses by removing barriers to their establishment and growth and provide our members with:
■ free, credible and impartial market information and insights
■ access to networks of key players in government, industry, finance and academia
■ an advocacy platform to help create an enabling policy and regulatory environment for green business
We assist local, provincial and national government to build a resilient green economy by providing:
■ support on the development of standards, regulations, tools and policies
■ expert technical knowledge on key sectors in the green economy
■ access to networks of key players across business, academia, and internationally
Since inception in 2010, GreenCape has grown to a multi-disciplinary team of over 40 staff members, representing backgrounds in finance, engineering, environmental science and economics. We have facilitated and supported R17bn of investments in renewable energy projects and manufacturing.
From these investments, more than 10 000 jobs have been created. Through our WISP (Industrial symbiosis) programme, by connecting businesses with waste / under-used resources, we have to date diverted over 4360 tonnes of waste from landfill.
Our Market Intelligence Reports form part of a working body of information generated by sector desks and projects within GreenCape’s three main programmes – energy, waste and resources.
Figure 13 below shows the different focus areas within each of our programmes.
Benefits of becoming a GreenCape memberWe currently have over 800 members, and offer free membership. Becoming a member of GreenCape will give you access to the latest information regarding developments in the various sectors; access to tools, reports, and project information; and offer you the opportunity – through our networking events – to meet and interact with various stakeholders in the green economy.
Cross-border matchmaking through the International Cleantech NetworkGreenCape’s membership of the International Cleantech Network (ICN) gives our members access to international business opportunities in countries where other cleantech clusters are based (mainly Europe and North America).
1
5
6 2
4
Our focus areas
3Reduced
WASTE
Cle
an &
Effic
ient
EN
ERG
Y
Sustainableuse of naturalRESOURCES
Western Cape Industrial Symbiosis Programme (WISP)
The team matches businesses to share unused resources, cut costs and create value.
Water
Water provision and economic development; greentech opportunities for water use efficiency, treatment and reuse.
Agriculture and Bio-Based Value Chains
Sustainable agriculture, valorisation of wastes to high value bio-products, including bio-energy.
Renewable Energy
Utility-scale projects, small-scale embedded generation, and localisation of component manufacture.
Energy Services
Commercial, industrial and agricultural energy efficiency and embedded generation; incentives and financing options.
Alternative Waste Treatment
Municipal decision-making and policy and legislative tools on alternative waste treatment options; small-scale biogas, recycling and reuse (dry recyclables, construction and demolition waste).
1
2
3
4
5
6
For investors looking for opportunities in South Africa, GreenCape’s Cross-border Matchmaking Facility offers a business matchmaking facility for green firms and entrepreneurs.
The matchmaking team helps international inbound firms and entrepreneurs looking for South African partners in the green economy. The team assists with contacts, introductions and matches to South African businesses. They also offer matchmaking activities for trade offices, missions and other inbound interests. These services can be accessed via the ICN passport or directly with GreenCape.
To become a member or to get your ICN passport, please contact GreenCapeor visit our website: www.greencape.co.za
Figure 13: GreenCape’s focus areas
8 –References
CDH, 2015. New ministerial determinations issued by South Africa's Minister of Energy. [Online] Available at: https://www.cliffedekkerhofmeyr.com/en/news/publications/2015/projects/projects-and-infrastructure-alert-31-august-new-ministerial-determinations-issued-by-south-africas-minister-of-energy.html [Accessed September 2016]
CSIR, 2015. Financial benefits of Wind and PV 2015. [Online] Available at: http://www. csir.co.za/media_releases/ docs/Financial%20benefits%20 of%20Wind%20and%20PV%20 2015.pdf [Accessed November 2016]
CSIR, 2016a. Wind and Solar PV Resource Aggregation Study for South Africa, Pretoria: CSIR.
CSIR, 2016b. Least-cost electricity mix for South Africa by 2040 - Scenarios for South Africa's future electricity mix, s.l.: CSIR.
Department of Economic Development, 2011. The New Growth Path: Framework, s.l.: s.n.
DTI, 2015. The Wind Energy Industry Localisation Roadmap in Support of Large-Scale Rollout in South Africa, Pretoria: dti.
Eberhard, A., Kolker, J. & Leigland, J., 2014. South Africa’s Renewable Energy IPP Procurement Programme: Success factors and lessons, s.l.: PPIAF.
Engineering News, 2016. Investec says release of updated IRP could ease IPP frustration and uncertainty. [Online] Available at: http://www.engineeringnews.co.za/article/investec-says-release-of-updated-irp-could-ease-ipp-frustration-and-uncertainty-2016-09-07/rep_id:4136 [Accesed October 2016]
Eskom, 2016. Tariff History. [Online] Available at: http://www.eskom.co.za/CustomerCare/TariffsAndCharges/Pages/Tariff_History.aspx [Accessed on October 2016]
Government of South Africa, 2015. Newsroom. [Online] Available at: http://www.gov.za/speeches/minister-tina-joemat-pettersson-briefing-expansion-and-acceleration-independent-power [Accessed November 2016]
Government of South Africa, 2016. National Infrastructure Plan. [Online] Available at: http://www.gov.za/issues/national-infrastructure-plan [Accessed 20th September 2016].
Inflation.eu, 2016. Historic inflation South Africa - CPI Inflaction. [Online] Available at: http://www.inflation.eu/inflation-rates/south-africa/historic-inflation/cpi-inflation-south-africa.aspx [Accessed November 2016]
Infrastructurene.ws, 2016. Atlantis can expect R1bn boost over next five years. [Online] Available at: http://www.infrastructurene.ws/2016/05/30/atlantis-can-expect-r1bn-boost-over-next-five-years/ [Accessed August 2016]
IOL, 2016. Atlantis set for R1bn injection. [Online] Available at: http://www.iol.co.za/business/news/atlantis-set-for-r1bn-injection-2028297 [Accessed August 2016]
IPP Office, 2016a. IPPPP Milestones, Pretoria: IPP Office.
IPP Office, 2016b. IPPPP - An overview, June 2016, s.l.: s.n.
IPP Office, 2016c. Small Projects Renewable Energy. [Online] Available at: https://www.ipp-smallprojects.co.za/ [Accessed November 2017]
Utility-Scale Renewable Energy: Market Intelligence Report 2017 5150 Utility-Scale Renewable Energy: Market Intelligence Report 2017
7.1. More on GreenCape’s work in the renewable energy sectorThe Renewable Energy sector desk is part of GreenCape’s Energy Programme. The programme aims to encourage economic development and job creation through the transformation of the energy sector – both by increasing energy efficiency and the supply of cleaner energy. These two paths towards a lower carbon energy economy form the basis of GreenCape’s work in this area.
Information sharing and networking platformThroughout the year, GreenCape hosts networking functions that provide a unique platform for industry to engage experts and government on issues affecting their sector. Typically, these events are hosted at a neutral, accessible venue, free of charge to GreenCape members16, who enjoy easy access to good quality information and great networking opportunities. Topics covered in 2016 included: a change in the dti’s local content evaluation criteria – which now focuses on comparing local content for specific components around each bid round, encouraging the localisation of pre-determined technology components; and RE market opportunities across the rest of the African continent. Beyond this, the organisation has been closely involved in supporting the continuation of the REIPPPP as well as developing a conducive environment for small-scale embedded generation.
International networks and the African renewable energy opportunityAs part of GreenCape’s membership within the International Cleantech Network (ICN)17, we hosted a delegation of ICN members and their visiting member companies at the 2016 African Utility Week (AUW), where the organisation held its AGM. Over the course of that week (16-20 May 2016), a networking function hosting ICN member companies as well as GreenCape
members, took place, encouraging international collaboration. Similarly, business-to-business engagements were organised around AUW activities. GreenCape members are encouraged to make use of the ICN passport concept, which gives all our members seeking to do business in other ICN member states access to facilitated meetings, market intelligence and working facilities – as far as possible for the hosting ICN member organisation.
Continuing the international theme, significant focus has been put, this year, on developing an understanding of the African RE market opportunity. Our members are invited to collaborate in developing and reinforcing market understanding to enable market entry into the rest of the continent.
AdvocacyGreenCape is also involved in advocacy at both national and provincial government levels. Our role has been strategic input of facts and figures as well as an understanding of green economy developments at the ground level in public discourse around the country’s energy future.Another example of our advocacy involves working with provincial commenting authorities for environmental authorisation of projects. The ultimate aim is to see an increased number of Western Cape-based RE projects, while reconciling this development with the need to protect the province’s sensitive ecosystems.Benefits of becoming a GreenCape memberWe offer free membership and we currently have nearly 800. Becoming a member of GreenCape will give you access to the latest information about developments in various sectors; access to tools, reports, and project information. Our networking events for members will also offer you the opportunity to meet and interact with various stakeholders in the green economy.
16 To register as a member visit our website http://greencape.co.za/membership/members/show/17 http://internationalcleantechnetwork.com/
IPP Office, 2016d. IPP Gas. [Online] Available at: https://www.ipp-gas.co.za/ [Accessed December 2016].
IT Web, 2016. SA boasts of fastest growing green economy. [Online] Available at: http://www.itweb.co.za/index.php?option=com_content&view=article&id=156129 [Accessed October 2016]
Mail & Guardian, 2015. Metros wake up to energy shift. [Online] Available at: http://mg.co.za/article/2015-05-07-metros-wake-up-to-energy-shifts [Accessed September 2016].
Moneyweb, 2015. Eskom decision puts government renewable programme at risk. [Online] Available at: http://www.moneyweb.co.za/news/south-africa/eskom-decision-puts-government-renewable-programme-at-risk/ [Accessed October 2016]
RECP, 2016. Funding database. [Online] Available at: https://www.africa-eu-renewables.org/funding-database-2/ [Accessed December 2016].
SARETEC, 2016. South African Renewable Energy Technology Centre. [Online] Available at: http://www.saretec.co.za/ [Accessed September 2016].
Sishen Solar Facility, 2016. Newsletter Issue 1: Construction Successes, s.l.: Sishes Solar Facility.
Utility-Scale Renewable Energy: Market Intelligence Report 2017 5352 Utility-Scale Renewable Energy: Market Intelligence Report 2017