Embed Size (px)
Citation preview

E n e r g y R e s e a r c h a n d D e v e l o p m e n t D i v i s i o n F I N A L P R O J E C T R E P O R T
UTILITY SCALE ENERGY STORAGE Grid-Saver™ Fast Energy Storage System
FEBRUARY 2015 CEC-500-2015-020
Prepared for: California Energy Commission Prepared by: Transportation Power, Inc.

PREPARED BY: Primary Authors: Paul B. Scott Michael Simon Transportation Power, Inc. 13000 Danielson Street Poway, CA 92064 Phone: 858-248-4405 | Fax: 858-408-4347 www.transpowerusa.com Contract Number: 500-10-058 Prepared for: California Energy Commission Ghasem Edalati Contract Manager Aleecia Gutierrez Office Manager Energy Generation Research Office Laurie ten Hope Deputy Director ENERGY RESEARCH AND DEVELOPMENT DIVISION Robert P. Oglesby Executive Director
DISCLAIMER This report was prepared as the result of work sponsored by the California Energy Commission. It does not necessarily represent the views of the Energy Commission, its employees or the State of California. The Energy Commission, the State of California, its employees, contractors and subcontractors make no warranty, express or implied, and assume no legal liability for the information in this report; nor does any party represent that the uses of this information will not infringe upon privately owned rights. This report has not been approved or disapproved by the California Energy Commission nor has the California Energy Commission passed upon the accuracy or adequacy of the information in this report.

ACKNOWLEDGEMENTS
The authors thank Mr. Edalati and Mr. Gravely, key proponents for their continued interest and support from within the Energy Commission.
Advisor committee members Dr. Leo Holland, Prof. Andy Burke, Tom Gage, Monte Goodell, Randy Shimka, and Hank McGlynn helped furfill key contractual obligations and were key to advising of related developments outside our daily purview.
We are indebted to Sandia energy systems leaders including Stan Atcitty, Dan Borneo, and David Rosewater for developing the Sandia Energy Storage Test Pad and making it available to provide a test site suitable for the capabilities of the GridSaver.
Vendor support is essential; in particular, the detailed and timely availability of Andrew and Chris Ewert and Ryan Smith guided us in making their BMS and ICU systems work for this implementation. Subcontractor staff including Sam Gurol, Reza Esmaili, Troy Strand, and Jason Strauch made key contributions in implementation of the test program.
The daily expertise of TransPower staff, particularly Lucas Ireland, David Ticonchuk, Harry Meyer and Ameya Jathar was essential in moving from concept to implementation. We look forward to their further involvement in the further development of what they have built.
i

PREFACE
The California Energy Commission Energy Research and Development Division supports public interest energy research and development that will help improve the quality of life in California by bringing environmentally safe, affordable, and reliable energy services and products to the marketplace.
The Energy Research and Development Division conducts public interest research, development, and demonstration (RD&D) projects to benefit California.
The Energy Research and Development Division strives to conduct the most promising public interest energy research by partnering with RD&D entities, including individuals, businesses, utilities, and public or private research institutions.
Energy Research and Development Division funding efforts are focused on the following RD&D program areas:
• Buildings End-Use Energy Efficiency
• Energy Innovations Small Grants
• Energy-Related Environmental Research
• Energy Systems Integration
• Environmentally Preferred Advanced Generation
• Industrial/Agricultural/Water End-Use Energy Efficiency
• Renewable Energy Technologies
• Transportation
UTILITY SCALE ENERGY STORAGE, Grid-Saver™ Fast Energy Storage is the final report for the Grid-Saver™ Fast Energy Storage Demonstration project (contract number 500-10-058) conducted by Transportation Power, Inc. (“TransPower”). The information from this project contributes to the Energy Research and Development Division’s Energy Systems Integration Program.
For more information about the Energy Research and Development Division, please visit the Energy Commission’s website at www.energy.ca.gov/research/ or contact the Energy Commission at 916-327-1551.
ii

ABSTRACT
Transportation Power, Inc. evaluated using advanced batteries to achieve grid-scale fast energy storage. They developed a battery energy storage system - Grid-Saver™, designed to provide a modular, flexible, low-cost energy storage option for commercial and utility-scale energy storage requirements. Two prototype energy storage systems based on the Grid-Saver™ design concept were built and tested – a 500 kilowatt system consisting of two parallel strings of batteries, with a nameplate energy storage capacity of more than 300 kilowatt-hours; and a 1 megawatt system consisting of four parallel battery strings, with a storage capacity of more than 600 kilowatt-hours. Both prototype systems used an automated Battery Control Unit. Using identical battery cells, modules, inverters, and system controls in both prototype systems validated using interchangeable, modular elements in energy storage systems of different sizes, and provided a fair degree of confidence that such systems can be scaled up to power levels of 10 MW or greater.
Keywords: California Energy Commission, energy storage, battery, lithium-ion, inverter
Please use the following citation for this report:
Scott, Paul B.; Simon, Michael (Transportation Power, Inc.). 2014. Grid-Saver™ Fast Energy Storage System. California Energy Commission. Publication number: CEC-500-2015-020.
iii

TABLE OF CONTENTS
Acknowledgements ................................................................................................................................... i
PREFACE ................................................................................................................................................... ii
ABSTRACT .............................................................................................................................................. iii
TABLE OF CONTENTS ......................................................................................................................... iv
LIST OF FIGURES .................................................................................................................................. vi
LIST OF TABLES ................................................................................................................................... vii
EXECUTIVE SUMMARY ........................................................................................................................ 1
Introduction ........................................................................................................................................ 1
Project Approach ................................................................................................................................ 1
Project Results ..................................................................................................................................... 1
Benefits for California ........................................................................................................................ 2
CHAPTER 1: Electrical Energy Storage Assessment Study ............................................................. 3
1.1 System Requirement Analysis .................................................................................................. 3
1.1.1 Candidate System Architectures ...................................................................................... 4
1.1.2 Cost Estimates ..................................................................................................................... 5
1.1.3 Expectations for further cost reduction ........................................................................... 6
1.2 Cost-Benefit Analysis ................................................................................................................ 7
1.2.1 Improving Cost Factors ..................................................................................................... 8
1.2.2 Variability of Benefits ........................................................................................................ 8
1.2.3 Overview of the Ancillary Services (AS) Market and the Developing Market Software 13
CHAPTER 2: Integration of the Grid-Saver™ Prototype ................................................................ 15
2.1 Component Selection and Module Design ........................................................................... 15
2.1.1 Module Assembly Procedures & Fabrication .............................................................. 18
2.1.2 Module Qualification ....................................................................................................... 20
2.2 Integration of Modules into a High Voltage String ............................................................. 26
2.2.1 The Prototype Two String System ................................................................................. 26
iv

2.2.2 Integration of the Megawatt Scale Prototype ............................................................... 28
2.2.3 BCU Software Development ........................................................................................... 32
2.2.4 Setup for Final Commissioning, Test and Validation ................................................. 32
2.2.5 The Sandia Energy Storage Test Pad (ESTP) ................................................................ 34
CHAPTER 3: System Tests and Validation Testing ......................................................................... 36
3.1 Commissioning and Related Tests ........................................................................................ 36
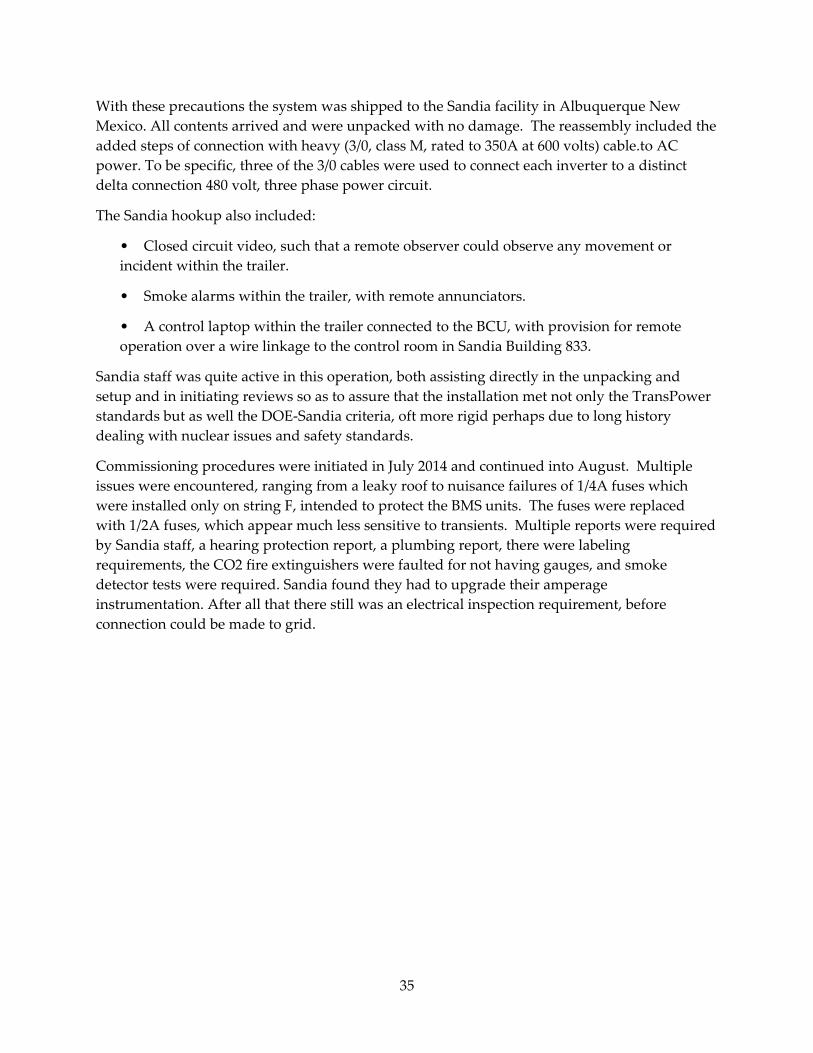
3.2 Data from Validation Testing ................................................................................................. 38
3.3 Validation Testing Conclusions ............................................................................................. 47
CHAPTER 4: Technology Transfer Activities ................................................................................... 49
4.1 Wayside Energy Storage - NYCT ........................................................................................... 49
4.2 Further Strategies for Technology Transfer ......................................................................... 50
4.2.1 Demonstration and Validation Testing, the Sandia Laboratory Example ............... 50
4.2.2 Professional Presentations .............................................................................................. 50
4.2.3 Marketing to large customers ......................................................................................... 50
4.2.4 Expectations for further cost reduction ......................................................................... 50
CHAPTER 5: Production Readiness Plan ........................................................................................... 51
5.1 Forms of Grid Energy Storage Being Considered ............................................................... 52
5.1.1 TransPower Products - Electric Trucks and GridSaver .............................................. 52
5.2 Ground Rules for Production Readiness Plan ..................................................................... 54
5.3 Critical Technical Issues – Focal Areas for the 2015 Product ............................................. 55
5.4 Critical Production Processes, Equipment and Facilities ................................................... 55
5.5 Manufacturing Facilities, Constraints ................................................................................... 56
5.6 Cost Estimates........................................................................................................................... 56
5.7 Investment Requirement ......................................................................................................... 57
5.8 Implementation Plan ............................................................................................................... 57
GLOSSARY .............................................................................................................................................. 58
REFERENCES .......................................................................................................................................... 60
v

LIST OF FIGURES Figure 1: Eyre & Cory Presentation of the Benefits of Electrical Energy Storage ........................... 11
Figure 2: Regulation Up/Regulation Down Pricing ............................................................................ 12
Figure 3: Example of Sample Cell Testing ............................................................................................ 15
Figure 4: An Early Module with Orion BS and Wiring ...................................................................... 16
Figure 5: AC (Left), Inverter, Pre-charger and Battery String. ........................................................... 17
Figure 6: Installation of the ICU in the Trailer. .................................................................................... 18
Figure 7: Module Boxes as Delivered by Contractor’s Vendor. ........................................................ 19
Figure 8: Cells and Interconnects in Box, with 350A Connector and High and Low Voltage Cables Overlaid ........................................................................................................................................ 19
Figure 9: Andersen 400A Connector Detail .......................................................................................... 21
Figure 10: A 24 Cell CALB Module ....................................................................................................... 22
Figure 11: Flat (Constant Voltage) Characteristic of the CALB Cells ............................................... 22
Figure 12: Module Testing with the AV-900 ........................................................................................ 23
Figure 13: A Rack to Support up to 24 Modules Built into TransPower 20’ Test Trailer ............... 26
Figure 14: Placing Module in Supportive Structure ............................................................................ 27
Figure 15: String B with Some of the Wiring to Interconnect Strings ............................................... 27
Figure 16: Two strings in assembly in test trailer - one module not yet in place. ........................... 28
Figure 17: Plan View Layout of Large Trailer on Sandia ESTP ......................................................... 29
Figure 18: Structure for Support of Strings D & E Before Moving into Trailer ............................... 29
Figure 19: Photo of Inverters During Installation ................................................................................ 30
Figure 20: Wiring of the EnerDel Backplane String ............................................................................ 31
Figure 21: Complete Connected CALB Strings in Trailer .................................................................. 31
Figure 22: Removing a module of String F, the Backplane Design. .................................................. 32
Figure 23: Shipping Boxes Were Used to Protect Each Module ........................................................ 33
Figure 24: Crated Modules and Support Structure Filled the 45’ Trailer ......................................... 33
Figure 25: Sandia Project Director David Rosewater Making the Final Connection to AC .......... 34
Figure 26: BCU Control is Established, One Quadrant per String .................................................... 37
Figure 27: First Discharge of 1MW Output .......................................................................................... 38
vi

Figure 28: The First Five Minutes of the Discharge ............................................................................. 39
Figure 29: Current Limits for CALB Strings ......................................................................................... 41
Figure 30: Power and Temperature Data .............................................................................................. 42
Figure 31: Currents, Highest and Lowest Cell Temperatures for each String ................................ 43
Figure 32: Extended Discharge of One Hour Controlled by BCU .................................................... 44
Figure 33: Recharge Following the Discharge of Fig 32 ..................................................................... 46
Figure 34 - Total Power and Temperatures for the Recharge Following the Discharge. ............... 47
Figure 35: Illustration the Wayside Energy Storage Concept ............................................................ 49
Figure 36: This Community Energy Storage System is Available in sizes to 75kWH .................... 53
Figure 37: TransPower vertically integrated business model. ........................................................... 54
Figure 38: Double Walled Air Conditioned Fireproof Enclosure (designed for NYCT) ............... 56
LIST OF TABLES
Table 1: Summary of Grid-Saver™ System Requirements. ................................................................ 3
Table 2: Summary Results of Cost Analysis ........................................................................................... 6
Table 3: Summary of Qualification Results .......................................................................................... 25
Table 4: Programmers Current, Temperature and Power Limits ..................................................... 44
Table 5: Grid-Saver™ Production Implementation Plan .................................................................... 57
vii

EXECUTIVE SUMMARY
Introduction During the last decade, California has experienced unprecedented levels of renewable energy development. Renewable energy, however, is intermittent and not considered as reliable as a fossil fuel facility which can provide electricity on demand. To help integrate renewable energy into the grid system, utilities typically use batteries to store electricity when production from renewable technology exceeds consumption. Battery energy storage also increases power quality and reliability for residential, commercial and industrial customers providing an uninterruptible supply of electricity while correcting voltage sags, flickers and surges or other imbalances. When coupled with demand response technologies, energy storage can reduce peak load demand at the same performance with enhanced system response at lower cost. Although lead-acid has been the standard battery type used in energy storage, sodium-sulfur and lithium-ion batteries are fast becoming the preferred technology. Transportation Power, Inc. evaluated cost effective utility-scale electrical energy storage using advanced large format lithium- ion battery cells.
Project Approach Battery energy development has been impressive in the past decade, resulting in laptop computers and pocket phones which can operate for hours as well as electric cars and battery-powered drone aircraft. Electric utility application of batteries is investigated using the least expensive and most cost effective lithium-ion batteries for storing large amounts of energy (on the megawatt-hour scale) and megawatt utility connected power transfer. Studies confirmed that reducing battery cost and using a modular approach are key to making energy storage systems commercially viable. Two prototype systems, one rated at 500 kilowatts and one rated at 1 megawatt were constructed. Twenty-four large format prismatic lithium iron phosphate (LiFePO4) cells were integrated into 79 volt modules and formatted into 11 strings, each providing 157 kilowatt-hours of storage capacity. Each string of cells was connected to a bi-directional, high power density inverter specially designed for this project. Battery measurement and Battery Control Units allowing supervisory management were used so the multiple strings could be connected to the electrical grid. To test, demonstrate, and validate the approach, two prototype systems were built – one consisting of two battery strings and two inverters, rated at 500 kilowatts, and one consisting of four battery strings and four inverters, rated at one megawatt. Both prototype systems were housed in trailers with air conditioning units designed to remove heat and provide safe continual operation. During the last few months of the project, grid-connected validation testing was performed at the U.S. Department of Energy Sandia Energy Storage Test Pad.
Project Results After feasibility and market analyses, followed by system testing of the Grid-Saver™, Transportation Power, Inc concluded that a modular battery system using low-cost lithium-ion cells could help meet growing stationary energy storage demand in a safe and cost-effective manner. The two-string system described above was tested successfully in TransPower’s battery test lab, validating basic capabilities of the 500 kW system; including use of the bidirectional
1

inverters to transfer battery charge from one string to another. More extensive tests of the 1 megawatt string at Sandia demonstrated that power could be transferred between the Grid-Saver™ system and the grid.
As a result of this research, the New York City Transit contracted with Transportation Power, Inc. for a fast energy storage battery system capable of storing 800 kilowatt hours of energy which can charge and discharge at rates in excess of 1 megawatt. This battery system, which will be installed in Manhattan early 2015, will capture energy from subway trains during braking and provide energy for traction assist during subway acceleration, improving the energy efficiency of subway operations. The high capacity of the subway traction energy storage system will also provide sufficient backup energy to move 10 subway trains to the nearest station in the event of a power failure. The Grid-Saver™ project also led to discussions with other potential customers for fast energy storage systems, including other rail system operators and independent power producers.
Benefits for California Fast energy storage system using the Grid-Saver™ approach, utilizing lithium-ion batteries and modern inverter topologies, can be safe, efficient, and cost competitive. System costs of a dollar per watt can be achieved using currently available technologies, providing an economic advantage over many competing grid energy storage concepts. The modular design of the Grid-Saver™ system makes this approach compatible with a broad range of grid energy storage needs, including demand response, frequency regulation, backup power, and peak-shaving to help facilitate renewables integration.
2

CHAPTER 1: Electrical Energy Storage Assessment Study 1.1 System Requirement Analysis The Grid-Saver™ concept includes electrical energy storage using a large lithium ion battery system (ESS, Energy Storage System) with automated charging and discharging in response to the needs of the grid. The objective is to provide fully responsive grid ramping and ancillary services at attractive cost, as well as active support of renewable energy installations that may benefit by energy storage over periods of minutes to hours. Grid-Saver™ system requirements are summarized in Table 1.
Table 1: Summary of Grid-Saver™ System Requirements.
Title Function Discussion
Cells Electrical energy storage Choice is Li-phosphate, large format cell, based on safety and lowest cost per kw-hr. 264 cells are used per string.
Support structure
Physical support even during earthquake
Battery modules shall be enclosed in structure such that system is protected from rain and dust
Fuses Protects cells and wiring Using 200A, 1500VDC rated fuses Contactor Opens circuit instantly at any
fault One or more in each series string.
Battery Management System (BMS)
Voltage & temperature measurement, cell balancing
Present system choice uses resistive dissipation, drawing 0.2A from cells, will operate 24-7
BCU Battery Control Unit)
Communicates with BMS and inverters, commands contactors, limits cell depletion
Apportions current between multiple strings of cells making best use of the strings most able to provide or sink current.
(Inverter Charger Unit (ICU)
Converts battery DC to AC to grid, and line AC to DC suitable for battery charging
250 kW ICU is derived from electric vehicle ICU co-developed by TransPower and EPC Power Corp. to minimize R&D costs and maximize economies of scale in production
Grid-Saver™ Control Unit (GCU), independent or ISO connected)
Either controls the Grid-Saver™ unit in accord with self-contained control logic, or in larger cases commanded by CAISO to provide energy as needed, with recharging of battery when solar or line energy available.
Small Grid-Saver™ units may be placed with solar or other alternative energy generators with algorithms designed to store energy and use it advantageously at peak demand times. Alternatively, communicates with ADS (Automated Dispatch System), exercises algorithms to optimize return from sale of energy or charging, commands ICU.
Grid-Saver™ Housekeeper (GH)
Monitors and logs temperature, ADS communication, line voltage
Responsible for assuring Grid-Saver™ environment is suitable for operation. Incorporates alarms for failed communication, line voltage, smoke and temperature alarms. Will call for help giving diagnostic information as needed.
3
Notable features of this system include:
1. A large (100kWh or larger) lithium ion ESS, using large format storage cells. The cells are connected in series to form a high voltage string.
2. The ESS includes a BMS (Battery Management System) suitable to maintaining the cells at near equal state of charge and reporting cell condition to a master controller (BCU, Battery Control Unit).
3. An Inverter-Charger Unit (ICU) suitable for taking power from the battery and putting it on the grid as AC of correct voltage and phase, and later recharging the battery from available energy on the grid. This ICU is commanded by the BCU.
4. Capability of operating multiple strings, forming an ESS with central BCU command and expandability to the extent the control system could accommodate.
5. Structure to support and protect from the elements.
1.1.1 Candidate System Architectures Lithium iron phosphate (LiFePO4), the primary battery chemistry tested during the Grid-Saver™ project, are available in cells ranging from 60 to 700 ampere-hours (Ah), typically with a nominal voltage of 3.3 volts. As the system is to be connected to the grid with a 480 volt, three phase connection, the inverter architecture requires a DC voltage from 792 to 960 volts. This suggests a string of series connected cells to provide a voltage near 900 volts. Based on these considerations, TransPower elected to use series strings of 264 cells, supplying a nominal voltage of 871 volts.
A major trade study was performed to select the appropriate size battery cell for use in the Grid-Saver™ system architecture. The simplest such architecture would utilize a single string of relatively large cells. This would minimize the number of cells to integrate and monitor. However, to meet the project goal of supplying at least one megawatt of power, a single string would require cells at the large end of the available range (700 Ah), which were found to vary in manufacturing quality and consistency. A large, megawatt-scale inverter would also be required, as connecting multiple smaller inverters to a single battery string was deemed to be problematic. Another disadvantage of the singe-string approach is that the minimum energy capacity for a system operating in the range of 700 amperes and 900 volts would be on the order of 600 kilowatt-hours, making it impossible to address markets for smaller capacity, more compact or portable systems. For these reasons, it was decided to utilize multiple series strings of cells in parallel, each string linked to a separate inverter. Power to or from the four inverters would be aggregated in accordance with total system power requirements.
4
To implement this approach, cells rated at 180 Ah were selected, each connected to a bi-directional inverter rated at 250 kW. Four such strings grouped in parallel would meet the 1 megawatt power requirement, and scalability to higher power levels could be achieved by using groups of four. The benefits of the multi-string approach included the following:
• Enables use of smaller cells that are higher in quality and easier to handle.
• Enables use of smaller inverters that are cost-effective to manufacture and also easy to handle.
• Provides a viable solution for smaller installations down to storage capacities of about 150 kilowatt-hours.
Inverter current is limited, with the use of 250 kW capable inverters the nominal current is up to 287A.1 To provide independent operation of inverters each inverter is coupled to a single string of cells. The selected 180 Ah cells can be discharged at rates to 2C (360 A), above the nominal inverter rating.2
The BCU is then charged with control of individual strings and given a request for X kW will assign that power among N strings proportionally. Should one or more strings be weak or overheated, the BCU can request more power from other healthy strings.
1.1.2 Cost Estimates One can break the costs into three categories, nonrecurring engineering (NRE) – which dominates an effort such as this involving design, first time implementation and commissioning and validation -- cell cost, and balance of system (BOS). The cell cost will now dominate for any large system, but as cell costs reduce it may be difficult to reduce BOS in proportion.3
For the current study, the Grid-Saver™ design was used, which is described in detail including costs incurred and, as available, recent costs of critical components. To make appropriate estimates for a commercial sized installation, a 10 MW system was fabricated, ten times the size of the larger system built and validated under this contract. The contractor also considered two variants, one designed for short term, high power operation, and one designed for storage for several hours and then a discharge for three or more hours.
1.1.2.1 10MW Short Term High Power System This system is intended to provide the capability of high power for short periods, a minute in duration at peak power or longer periods at reduced power, basic capability for providing
1 Calculated at the nominal voltage, as the battery is drawn down the current will increase.
2 The 180 Ah rated cells do have a limitation on charge rate, to 1C for continuous duty, such that rated power can be achieved only on discharge.
3 With annual increases in cell production one can expect costs to drop. By analogy with the photovoltaic panel cost reduction experience, one might expect a reduction of 22% for each doubling in production. Our primary supplier has indicated that a large order next year might be filled at a cell cost of $300/kWh. This suggests that by 2020 costs could drop to below $160/kWh.
5

ancillary services. The component cost breakdown shows two large cost items, inverters and batteries with similar cost for the 10 megawatt (MW) system. Conservative assumptions include the inverters are rated at 300 kW, a 20% growth over current capability, and that the design uses 35 strings and 35 inverters. This is a straightforward scale-up of the design described in the following chapter. The cost is estimated at $4.4 million from the factory, plus appropriate costs for transportation, commissioning, profit and warranty reserve.
1.1.2.2 10MW, 42MWh Energy Storage system The Energy Storage scenario uses large cells and moderate current. The design is focused on providing the capability of absorbing power for over three hours at an average power of 10 MWh4. To conservatively do so a rated power of 250 kW from each of 40 strings is assumed. Table 2 compare these two systems and compares their costs.
1.1.3 Expectations for further cost reduction TransPower presently believes that it can supply large multi-megawatt systems for prices of approximately $600/kWh. This is triple a California Energy Commission objective noted in a recent solicitation. Since California energy storage expenditures over the next decade are estimated to be in the billion dollar range over the next decade, cost reduction and system longevity are key issues.
Table 2: Summary Results of Cost Analysis
Costs of High Power and High Energy Storage Systems
System Purpose Cost $/KW $/KWh
10MW, 5MWh Ancillary Services $4.4M $440 $880
10MW, 42MWh Solar, Wind smoothing
$16.7M $1,667 $389
4 The cost analysis for this large energy storage system assumed 40 strings of nominal 1200Ah, 871 volt rating, each coupled to a 250kW inverter.
6

The key expenditure is for the electrical energy storage cells, typically of nominal 3.3 to 3.6 volts per cell. Pricing is currently under $400/kWh for quality large format cells, with suggestion of a price below $300/kWh with a large order. It is noted that nearly as much money is now tied up in the Balance of System (boxes and structure to support the cells, interconnect and inverters, and the contractors have recently proposed further work to reduce these costs.
a. Based on the experience of the similar solar photovoltaic industry, with each doubling in production will go a corresponding reduction in cost, likely at a rate similar to the PV experience which suggests a 22% cost reduction per doubling. Thus with three doublings of production cell costs of $160/kWh are expected.
b. As a related example, recent pronouncements about the Tesla Gigafactory suggest a 30% reduction with that installation. From the publications one can infer a present cost of $240/kWh and a projected cost of $168/kWh.
1.2 Cost-Benefit Analysis Storing electrical energy, the most fleeting form of energy, has always been a challenge. In the past decade, the rapid development of lithium ion batteries and their unique and favorable properties, coupled with the development of rotating mass electrical energy storage to unprecedented capabilities, has led to the consideration of these technologies as one component of the SmartGrid. SmartGrid is a priority topic with the DOE (US Department of Energy) following being mandated by the 2007 EISA (Energy Independence and Security Act). The DOE took the lead in distributing American Reinvestment and Recovery Act (ARRA) funds in support of SmartGrid projects, including energy storage funding of $185 million, substantial amounts of which went to battery storage development.
More recently California Senate Bill 17 of 2009 codified the EISA into California law as well as adding some elements such as requiring Smart Grid Deployment Plans of California investor owned utilities (IOU). Defining the benefits has become a major effort, even while the technologies are in development and hence the capabilities assessment is in a state of flux. EPRI (Electric Power and Research Institute) Report 10203425, although now four years old, summarizes some of this work and presents a most comprehensive survey employing both monetary and non-monetary quantification of the benefits.
Herein TransPower has a much narrower scope, focused only on the benefits of megawatt scale electrical energy storage systems. The California Public Utilities Commission (CPUC) and the Energy Commission as well have narrowed the scope, as directed by the legislature’s AB2514. However, the Energy Commission presentation to the March 9, 2011 Preliminary Workshop on Energy Storage made clear the long history of interest of the Energy Commission in energy storage by a number of technologies starting with pumped hydro. The $13 million of matching
5 Methodological Approach for Estimating the Benefits and Costs of Smart Grid Demonstration Projects, EPRI Report 1020342 by Mike Wakefield, January 2010 http://www.smartgridnews.com/artman/uploads/1/1020342EstimateBCSmartGridDemo2010_1_.pdf
7

funds by the PIER Program for ARRA projects was matched 100:1, including $427 million from the DOE, directed towards 18 projects in northern and southern California.
Even within this relatively narrow scope of electrical energy storage by batteries, the Cost/Benefit analysis involves a complex range of variables for both costs and benefits.
1.2.1 Improving Cost Factors The 2020 Strategic Analysis of Energy Storage in California6 report details possible financial incentives that may buy down the cost of energy storage systems. Of particular interest:
1. Investment tax credit: This is subject to Congressional action. Presently it applies to generation facilities such as wind farms and solar electric systems, but not to storage systems. For a party with profits to offset and funds to invest, such as banks, the renewable energy tax credit can effectively reduce the investment cost by 30%7. Considering the improbability of any constructive congressional action in this election year, the possible benefits of an investment tax credit are not included in our analysis.
2. SGIP (Small Generation Incentive Program): The SGIP is operated by the IOUs in carrying out the direction of the CPUC and certain legislative directives. Incentives are available in support (on a dollar/watt basis) of renewable and waste energy capture, combined heat and power (CHP) systems, and emerging technologies that include Advanced Energy Storage (AES). The SGIP incentive for AES is presently $1.62/Watt storage unit power. The AES unit must be able to discharge its rated capacity for 2 hours, hence the incentive is somewhat less than $1/Watthour of rated storage. Rating for 80% depth of discharge, the incentive is 64 cents/rated Watthour. A megawatt-hr system could thus merit a benefit of $640,000 if ready for deployment.
1.2.2 Variability of Benefits Grid-Saver™ can address at least two local markets and a number of larger markets which are more formally defined through regulatory control by a local independent system operator (ISO):
• Small Grid-Saver™ systems could be co-located with intermittent renewable generators, such as rooftop solar systems, for instance, and smooth the peaks from the output while providing power as needed to reduce grid demand at critical times. Here the Grid-Saver™ is either local to the customer, or is part of the utility distribution system and will act in a transparent way to provide a more continuous flow of power on the grid in response to a controlling algorithm which could either be integral to the Grid-Saver™ or incorporated in a communication device controlling multiple distributed storage units. Similar such local storage units have been referred to as “Community Energy Systems” (CES). San Diego Gas
6 2020 Strategic Analysis of Energy Storage in California, CEC-500-2011-047 November 2011 http://www.energy.ca.gov/2011publications/CEC-500-2011-047/CEC-500-2011-047.pdf
7 http://online.wsj.com/article/BT-CO-20120202-715811.html Feb. 2012
8

and Electric (SDG&E), in their recent Rate Filing, indicated that they have been installing 50kW capable local storage units, with intent to put in 11 in 2011 and 14 more in 2012.
• Grid-Saver™ systems of megawatt or larger could be used by the utility to address either local power flow smoothing or ancillary services. SDG&E is also providing substation energy storage at the rate of 4MW per year for 2011 and 2012. The total budget for these units and the 50kW units has been reported as $25 million and $30 million for the successive years. SDG&E, in its rate case, argues the use of these systems “on circuits with high penetration of customer photovoltaic systems” and “energy storage systems will be strategically located in substations to mitigate the impact of multiple circuits with PV”.
• Large Grid-Saver™ systems may be grid connected with use of a Scheduling Coordinator (SC)8 such that they will be used for regulation energy management as directed by California Independent System Operator (CaISO)9. The rules for this are only in partly in place, as CAISO tariff section 8. As previously discussed, the CAISO is in process of complying with Federal Energy Regulatory Commission (FERC) Order 755, issued October 20, 2011, through a proceeding process “Pay for Performance”. The FERC order observes that current compensation methods for regulation service in organized markets fail to acknowledge the inherently greater amount of frequency regulation service being provided by faster-ramping resources and that some CAISO practices result in economically inefficient dispatch of frequency regulation resources. The order proposes to ensure that providers of frequency regulation receive just and reasonable and neither unduly discriminatory nor preferential rates.
The Energy Commission 2020 Strategic Analysis (Ref. 7, above) provides a slightly different breakdown, offering Scenarios Analyses for:
1. Area and Frequency Regulation,
2. Renewables Grid Integration and
3. Community Energy Storage/Distributed Energy Storage Systems (DESS).
The contractor looked in detail at these and other specific market areas.
A most specific approach is to simply list ways storage could be used and be profitable. The Sandia report10 provides a series of examples, and quantitative evaluation resulting in their
8 Scheduling Coordinators act for an organization, which may be a utility or may be a trader such as Shell or DTE Energy Trading, to interface with CaISO to assure transactions meeting ISO rules.
9 California Independent System Operator, which has recently received FERC approval of proposed tariff revisions that allow direct ISO control of non-generator resources using real-time dispatches to control the resource operating point to support regulation demands. (FERC Docket ER11-4353-000, issued November 30,2011 and effective December 1, 2011) http://www.ferc.gov/EventCalendar/Files/20111130145236-ER11-4353-000.pdf
10 Jim Eyer, Garth Corey, Energy Storage for the Electricity Grid: Benefits and Market Potential Assessment Guide http://prod.sandia.gov/techlib/access-control.cgi/2010/100815.pdf
9
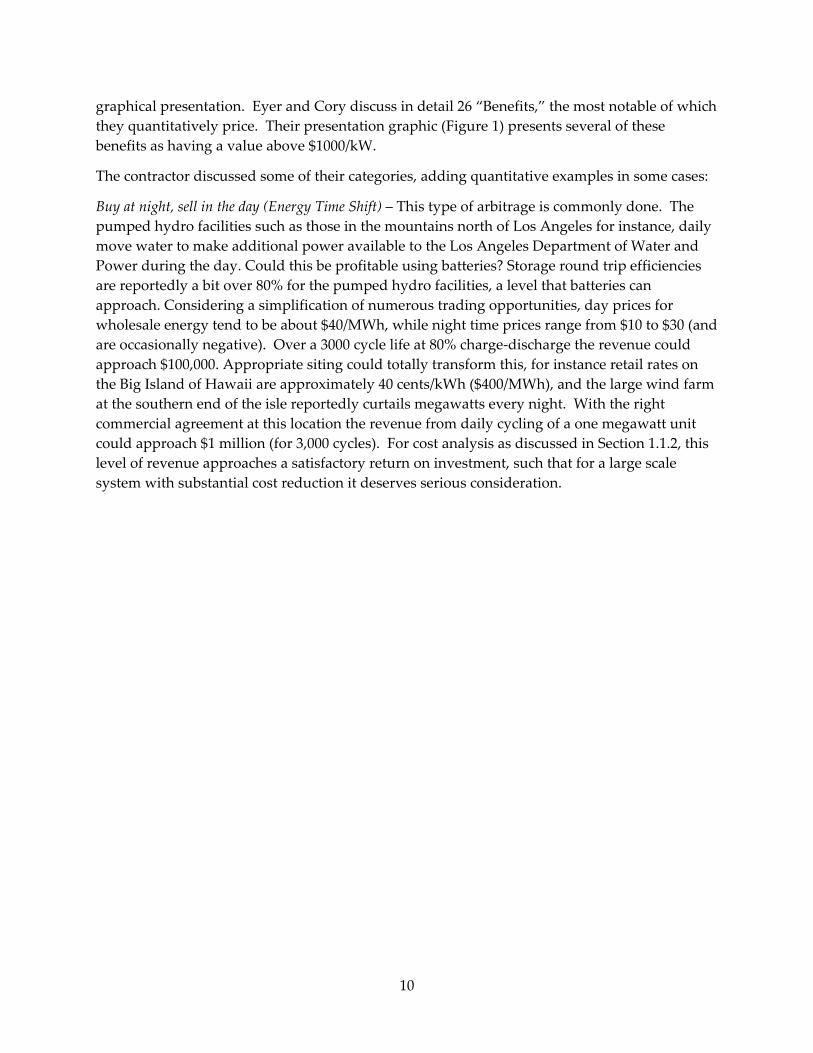
graphical presentation. Eyer and Cory discuss in detail 26 “Benefits,” the most notable of which they quantitatively price. Their presentation graphic (Figure 1) presents several of these benefits as having a value above $1000/kW.
The contractor discussed some of their categories, adding quantitative examples in some cases:
Buy at night, sell in the day (Energy Time Shift) – This type of arbitrage is commonly done. The pumped hydro facilities such as those in the mountains north of Los Angeles for instance, daily move water to make additional power available to the Los Angeles Department of Water and Power during the day. Could this be profitable using batteries? Storage round trip efficiencies are reportedly a bit over 80% for the pumped hydro facilities, a level that batteries can approach. Considering a simplification of numerous trading opportunities, day prices for wholesale energy tend to be about $40/MWh, while night time prices range from $10 to $30 (and are occasionally negative). Over a 3000 cycle life at 80% charge-discharge the revenue could approach $100,000. Appropriate siting could totally transform this, for instance retail rates on the Big Island of Hawaii are approximately 40 cents/kWh ($400/MWh), and the large wind farm at the southern end of the isle reportedly curtails megawatts every night. With the right commercial agreement at this location the revenue from daily cycling of a one megawatt unit could approach $1 million (for 3,000 cycles). For cost analysis as discussed in Section 1.1.2, this level of revenue approaches a satisfactory return on investment, such that for a large scale system with substantial cost reduction it deserves serious consideration.
10

Figure 1: Eyre & Cory Presentation of the Benefits of Electrical Energy Storage
1. Adding to Electrical Supply Capability – To what extent can adding battery storage substitute for building new generation capability? To the extent that offering local grid support can alleviate the need for permitting and building new generators, a modest expenditure for Grid-Saver™ equipment could offset major investment in a generator. This is similar for paying for demand not used, currently an offering of tariff structures. This feature is of interest during peak summer days, however analysis of local market offerings of demand reduction services as compared to a battery system would be appropriate to make this choice.
11

Figure 2: Regulation Up/Regulation Down Pricing
Source: Mike Ferry
2. Load Following –Load Following relates directly to the ability to Ramp Up in the morning and possibly in the summer afternoon as air conditioning demand increases, and Ramp Down in the evening. Increasingly, the ramps are impacted by uncertainties related to the use of wind and solar power, which installations are being built at unprecedented rates. This capacity can more quickly be derived from storage, and the proposal is increasing power being drawn from storage as compared to increasing generator heat of a turbine. Again, this would likely be a once a day use of the battery capacity. However, it could yield payment both for ramp capacity (regulation up) and for energy. The regulation up payment is as low as $4 to 8/MWh during recent (January, February 2011, 2012) winter months, to a monthly average as high as $20 during spring (when hydro plants are being paid for generation from winter runoff). This payment adds to that of the first example, but still uses only one cycle per day. Eyer and Cory run an analysis of the cost of gas turbine powered generation, which is commonly used for these services, and end up pricing the benefit at $800/kW. This being similar to the cost of Grid-Saver™, and being a massive market¸ more detailed analysis will be appropriate at a later time.
3. Area Regulation. The individual home, store, or factory has wide variations of power demand as lights, motors and electric heaters are turned on or off, and one can imagine that the larger community is demanding power from the summation of all these sources. Hence the load following referred to above – slowing climbing for all of California from the 4 am demands through the morning increases to a peak of some 30,000 MW mid-day, and then again peaking after dark only to fall as the community darkens – is accompanied by relative
12

small perturbations about the mean, but relatively small is megawatts and larger (depending on the size of the community one includes in the local grid). Area regulation acts to respond to these ongoing perturbations, maintaining frequency and voltage – quality of service – with response times in seconds or at most minutes. The large generators are of service only in that they have inertia and this rotational momentum is a kinetic energy reserve that can be quickly be converted to electricity, but then quickly that rotational velocity must be maintained by adding turbine power (steam or whatever). The capacitive (or flywheel) energy storage is ideally poised to provide these services to the extent that energy management is available, avoiding total depletion or over charging.
The rules for rewarding these services are in flux, with mileage payments definitely a part of the new paradigm as stipulated by Order 755 and the following tariffs now being developed by various regional ISOs. Fair pricing is ordered by FERC, and based on the experimental results that fast regulation control (by flywheel or battery energy storage) is more than twice as effective as rotating mass means, it appears that reliable and reasonably priced electrical energy storage will be an active part of the new developing electricity infrastructure. It appears too early to do useful analysis of how these payment rules will develop or even how much mileage will be asked of battery storage devices. It may be useful to recollect that fast energy storage was found to be twice as effective as older means of area regulation. Will the remuneration reflect this?
1.2.3 Overview of the Ancillary Services (AS) Market and the Developing Market Software CAISO in recent years has procured four ancillary services (AS) in day-ahead (DAM) and real-time markets (RTM).
• Regulation up – provided by grid synchronized generators which can quickly add power to the grid after receiving automated signals from the ISO (must be synchronized and be able to receive AGC (Automatic Generation Control) signals, and to be able to deliver the AS award power within 10 minutes). Supplies bid a given amount of available energy and are paid for that amount, even if none is demanded.
• Regulation down – the ability to decrease power output at guaranteed rate. An hourly payment is made to online generators that can guarantee this ability.
• Spinning reserve – keeping generators running at reduced power, just to be ready for immediate response. The supplier is paid to keep the bid MW available to ramp up within 10 minutes.
• Non-spinning reserve – generators paid to be ready to start on command (in newer tariffs, demand contracted to shut down on command).
13

1.2.3.1 Recent Valuation of Ancillary Services The CAISO Department of Market Monitoring issues analysis reports weekly, monthly, quarterly and annual Market Issues and Performance Reports, (the 201311 issue is the most recent annual available). The 2010 cost of Ancillary Services (AS) was just under $0.4 per MWhr of load served, but still totaled $84 million total (California ISO ancillary services cost). These monies covered Regulation Up, Regulation Down, Spinning Reserve and Non-Spinning Reserve.
Various reports illustrate the progress made in recent years with Ancillary Service costs dropping from $0.96/MWh (2.4% of the wholesale energy cost) in 2006 to $0.38 (just under 1%) in 2010 and $0.25 in the past year. (The real time services average prices paid in 2013 were $7.09/MW for Regulation Up, $5.86 for Regulation Down, $5.91 for Spinning Reserve and $1.51/MW for Non-Spinning Reserve.)12
It is notable that the cost of ancillary services peaks during the spring, when hydro plants are using the run-off to provide electricity rather than regulation, and during the summer, when high demand makes the operation more critical as previously illustrated in Figure 2.
Continued success might be expected in reducing the AS cost, especially with the increasing availability of designed to serve tools such as real time demand response tools, flywheel storage, battery systems, and the recent attention on designing the ISO system to provide fast response systems. However, the increasing amounts of solar and wind add to the task such that it is not clear that the cost can continue to come down.
Further information on benefits valuation is available in the DOE/EPRI Handbook13, the authors have emphasized that even that recent publication is dated as the pricing data is now two years old and that it should not be used for planning purposes.
It is expected that the most realistic cost benefits assessment must reflect the local conditions as well as the storage system characteristics in the light of recent costing experience. And even that assessment will only be preparation for bidding into the system and seeing the actual month to month performance.
11 http://www.caiso.com/Documents/2013AnnualReport-MarketIssue-Performance.pdf
12 Figure 6.6 of the prior report, 2013.
13 DOE/EPRI 2013 Electricity Storage Handbook in Collaboration with NRECA, SAND2013-5031
14

CHAPTER 2: Integration of the Grid-Saver™ Prototype 2.1 Component Selection and Module Design To realize the megawatt goal of this program, combined with the demands of renewable resource power smoothing, suggesting time scale of an hour or more of storage, the battery cell selection was focused on the largest, most capable and lowest cost Lithium ion cells. As sophisticated test equipment was available, the early evaluations included not only viewing supplier literature but buying small quantities of cells and testing such that researchers could experience the cell qualities first hand and compare with claimed performance. Figure 3 is a photo of a set of 700 Ah cells, the largest size cells tested as part of our cell selection process.
Figure 3: Example of Sample Cell Testing
For simplicity of integration of very large batteries the contractor chose the large format cells available in the Lithium iron phosphate chemistry. Another key reason for choice of these batteries is that they are the most cost competitive, at this time, of the many lithium ion cells offered. In both the heavy duty vehicle and utility applications the contractor are aware of the very cost sensitive nature of these markets, and believe the large market will develop only with competitive pricing.
For the Grid-Saver™ program 180 Ah cells were selected, which mostly measure near 200Ah capacity for a full discharge. The CALB cells are tested for capacity and electrical current impedance before shipping, and the shipment includes documentation of this information in a
15

table arranged by shipping box code and cell serial number. The cell voltage was measured and recorded with the voltage as read before shipping. Over the month of more of shipping and warehouse storage the cell voltage will generally drop by several millivolts. In the rare occasion tens of mv difference were observed, likely indicating electrical leakage in the cell. Generally weeks or months will pass before the cells are used, at which time the voltage will be checked. Any cell with a continued decrease of more than a few mv will be set aside for return, as being a leaker.14
The BMS (Battery Measurement System) is the other key part of the ESS (Energy Storage System). At minimum, a BMS must monitor the voltage of each cell, have means to bring the high voltage cells down to the low or vice versa, and must also track cell temperatures so as to warn if the system becomes over heated. Better, it will access the capability to derate system operation if the cells show signs of over-temperature. Further, for the application the BMS has to be able to work with a string of 264 cells and safely operate at up to 1000 volts.
For this system the Orion BMS was chosen (Figure 4), manufactured by Ewert Energy of Carol Stream, Illinois. The Orion system has the required features and more, it has the best documentation of the BMS industry, and fortunately the Ewert staff has been superb in product support. As the largest BMS unit they manufacture is for 180 cells, the researcher team operated dual BMS units in series on each sting of cells. The slave handles the upper 96 cells of the string and by Controller Area Network (CAN) communication the data from all 264 cells flows from the master BMS. Four Thermal Expansion Units feed thermal data, also as part of the same CAN stream.
Figure 4: An Early Module with Orion BS and Wiring
14 Meaning electrical leakage. Few such cells were found, about one percent of the some 1500 CALB cells processed. There was never any indication of fluid leakage.
16

A second reason for carefully tracking cell voltage is that the system can be sorted by voltage, before building into modules. Ideally, the module will be made up of cells of all the same voltage, or at worst varying by less than a few mv. This helps to assure a balanced module, even before a BMS is attached.
The third essential component is the inverter system, comprising of a bi-directional inverter charger unit (ICU) and the precharge and contactor box which makes the connections of the cell string to the inverter. Figure 5 illustrates the circuit, with the battery string at right, with the dotted lines referring to the 265 voltage sense lines and likewise connections to 264 thermistors. The 500 ohm resistor at top is used to precharge the inverter capacitor before the main contactor is closed. In this program the inverter used is a variant of the inverter developed for the project’s vehicle applications but rated to operate with DC input from 792 to 960 volts, with currents to more than 300 amperes as needed for maximum power of 250kW. The inverter was developed by EPC Corporation, a neighboring Poway firm. The inverter is liquid cooled and quite compact, as is appropriate for vehicle applications. One of the Chokes is within the inverter, one is in the precharge circuit box.
Figure 5: AC (Left), Inverter, Pre-charger and Battery String.
Figure 6 shows one of the ICUs at the time of installation in the megawatt sized trailer; the open hole is to enable making the bolted cable connection and is closed by a cover plate after all cables are connected. DC cable connections can be seen at left from the inverter to the precharge box, above. The wound toroid in the precharge box helps assure high frequency isolation of the inverter from the battery string. The Open Pre-charge Box is Above the Inverter.
17

Figure 6: Installation of the ICU in the Trailer.
2.1.1 Module Assembly Procedures & Fabrication The assembly procedure is as follows:
a. Steel box is fabricated by outside vendor per contractor’s specifications (Figure 7). Note Vent slots allowing forced air cooling of cells.
b. Depending on location in string, some modules will have added fuses, contactors, or a BMS (Battery Management System) or TEM (Thermal Expansion Module). This is a good time to add these units.
c. Cells are selected according to voltage, with cells of like voltage being placed side by side in box
d. Plastic separators are used to provide air passage between cells.
18

Figure 7: Module Boxes as Delivered by Contractor’s Vendor.
e. Cell busbar interconnects are added (Figure 8)
Figure 8: Cells and Interconnects in Box, with 350A Connector and High and Low Voltage Cables Overlaid
19

f. Interconnect bolts are torqued to negative terminals.
g. Circuit board is fabricated and loaded by outside vendors to our design specification.
h. Circuit board is added to module, with screws making mechanical and electrical connections to interconnect busbars.
i. Harnesses are fabricated for the voltage and temperature sense.
j. Circular connectors are added for voltage and thermal sense.
k. Thermistors are added to each positive terminal and bolts are torqued.
l. High current connector is added with 4/0 cables to + and – terminals.
m. The module is connected to test apparatus and with 100A charging the cells, the voltage across each interconnect is measured, bolt head to bolt head. If any connection shows unacceptable impedance, the module is rebuilt.
n. The completed module is charged to full charge, discharged, and recharged to 50% SOC. Balance discrepancies are corrected, the module capacity is recorded.
Twenty-four of the 180 Ah cells will package into a module about 24”x24”x16”hi, which height includes two inches at bottom for a fan for forced cooling, and more like 3” above for intercell connections, then a circuit board mounted on the interconnects, and then above that the connectors and harnesses required for voltage and temperature sensing. A steel box provides structural support for cells and fan. Each cell has voltage sensing and each cell interconnect mounts a thermistor under the positive connection bolt, with a large circuit board providing connections to voltage sensing and thermistors. Separators between cells allow cooling air to flow, forced by the fan below the modules. All low current connections are by Molex connectors, two 4/0 copper cables make connections to the high current terminals. See Figure 9 for detail regarding the connector, supplied by Andersen and rated to 400A.
2.1.2 Module Qualification Figure 10 shows a CALB module during its qualification test. Shown from left to right are power cables, voltage cables, and temperature sensing cables. Figure 11 shows the flat voltage characteristic associated with the cells tested, and Figure 12 shows Aerovironment AV-900 test equipment. The first qualification requirement, following fabrication, was done with a 100A charge current which gives us the first opportunity to find the connection resistance at the bolted high current contacts. Each interconnection was measured bolt head to bolt head; the expectation is that the measured voltage is below 2 mv, suggesting that the total cell to cell interconnection impedance was under 20µΩ. At temperature the cell impedance may be as little as ten times this, the module is rebuilt if the interconnection impedance is unacceptably high.
20

Figure 9: Andersen 400A Connector Detail
21

Figure 10: A 24 Cell CALB Module
Figure 11: Flat (Constant Voltage) Characteristic of the CALB Cells
22

Figure 12: Module Testing with the AV-900
Qualification consists of fully charging the module, where the research team defined full charge as the highest voltage cell at 3.65 volts (cells are shipped at about 50% state of charge (SOC). The module is then fully discharged while integrating the amount of amperage so as to measure the module capacity. This discharge is done at 1C (180A) until such time as the lowest cell gets to 3.00 volts, at which point the research team tapered the discharge, reducing amperes while holding the lowest cell at 3.00 volts. The discharge is said to be complete at such point as the current drops to 0.05C. The charge and discharge is done using the AV-900 test equipment, which is run using a TransPower developed algorithm developed in Labview.15
More recently, in response to requests for American content16, the research team also evaluated cells from EnerDel, supplied in a 2s12p integration of 198Ah by Evolve. These cells have higher voltage, nominally over 3.5 volts per cell. A single string of 240 of these cells is used in our megawatt trailer integration, which also uses 3 CALB strings. The module design for the
15 Similar results can be obtained manually, by stepping the discharge from 1C to 0.5C, and then successively 0.2C, 0.1C and 0.05C as the lowest cell gets down to 3.0 volts. As the team planned the fabrication and test of 66 moduless, the Labview developed automated software to operate the AV-900 appeared warranted.
16 TransPower has been awarded a contract to supply energy storage for a “wayside energy storage system” which will be directly connected to the New York City Transit subway third rail. The source of funds is the U.S. Department of Transportation, and for this reason there has been interest in a USA based supplier of cells.
23

Enerdel cells is different, dictated by different connection design as well by our choice to use a backplane connection for the power and sensing lines, as compared to the foreplane design used for the CALB cells. Six strings were fabricated and qualified in total. Two were used for the initial integration in the 20’ test trailer and four were installed in the megawatt capable trailer.
Table 3 (next page) shows qualification results. The first column is a serial number, related to date of fabrication. The date of qualification is given in year-month-date format. The present disposition (location) of the module is shown in the third column. The fourth, Ah, column indicates the ampere hours yielded during the qualification discharge. Generally these are well under the cell capacity, as the 24 modules of a string are never perfectly in balance. One is a few percentage points higher in charge, another has less capacity and hence limits the string. And if that one is also a bit undercharged a large difference occurs at the lower limits of discharge, limiting the entire module. With the exception of a couple modules, GS05, GS32, the module balance was a very large percentage of the cell ratings.
The fifth column, Vh/Vl, indicates the spread between the voltage Vh of the highest cell and of the lowest cell in that module. The BMS was set up to bring the modules to within 10mv. That criteria is harder to attain with the EnerDel cell modules which have a much steeper voltage – SOC curve, here it is equivalent to have a 30mv spread. The spread was measured several hours after the qualification. As the qualification process progressed more to a production activity in late 2013 generally the module had been moved and was not connected to the BMS by the following morning (when the earlier data was recorded) so there is no record.
Cell impedance is in the final column, it is measured by the BMS automatically if there are large charge-discharge changes. Some judgment is required, as if there has not been proper activity the BMS will present default values. Where the numbers were recorded and seem valid the contractors have included the data. Alternatively, one can infer the data from charge-discharge curves.
24

Table 3: Summary of Qualification Results
S/N date of qual. June '14 label Ah Vh/Vl after50% cg. RijGS01 130425 B1 175+-? 3.304/3.296 0.57-0.64GS02 130613 B2 176.5 3.305/3.297GS03 130614 B3 186.5 3.311/3.303GS04 130608 B4 184.7 3.305/3.297GS05 130618 B5 152 Vavg=3.304GS06 130607 B6 193 3.306/3.297GS07 130620 B7 182 3.303/3.294GS08 130607 B8 174 3.308/3.298GS09 130618, first dat B9 185 3.305/3.297GS10 130622 B10 183 3.305, 3.297GS11 130626 B11 193 --- no noticeGS12 130925 A1 (C1??) 179+- 3.296/3.304GS13 130927 A2 175.8 .22-.57GS14 130928 A3 179.7 3.290-3.297GS15 130926 A4 184.7GS16 130919 A5 177GS17 130930 A6 178.8 3.298-3.306GS18 131001 A7 184 3.294-3.303GS19 131001 A8 173.6 3.298-3.308GS20 A9 178.2 3.297-3.305 .23-.32GS21 131002 A10 176.4 3.297-3.305GS22 131003 A11 179.4 3.308 avg.
GSE1 131024 F1 194.3GS23 131126, 131202 E1 175.9, 174.05GS24 131125, 131202 NY5 173.9GS25 131205 NY3 175.9GS26 131205 NY4 174.4GS27 131203 spare sent to 175.3GS28 130204 NY1 174.6GS29 131204 spare sent to 176GS30 131125 NY6 175GS31 131209 E10 173.8GS32 131209 NY2 168.5GS33 131203 NY8 173.9GS34 131217 NY7 190GS35 131218 NY9 190.2GS36 140213 D1 150.4GS37 140207 D2 188.2GS38 140213 D3 173.2GS39 130206 D4 188GS40 130226 D5 186.2GS41 130206 D6 185.4GS42 140205 D7 193.51, 170.83GS43 140226 D8 184.9GS44 140213 D9 180.7 Δcell volts of 0.01GS45 140326 D10 182.6 .60-.72cold, d GS46 140206 D11 184.3GS47 140317 E2 186.6GS48 140325 E3 184 .54-.63cold, d GS49 140325 E4 183.9 .49-.54 cold, GS50 140307-11 E5 180.4GS51 140326 E6 181.1 .64-.69cold, d GS52 140326 E7 178.3 .47-.57, drop GS53 140313 E8 180.3GS54 140317 E9 187.4 .38-.48 cold, GS55 140314 E11 187.5 3.294-3.302 .46-.51 coldGSE2 140415 F2 198.7 .77-.82mΩ, GSE3 140415 F3 187.01, 203.38 .77-83, dropp GSE4 140520 F4 198.7 .74-.82, drop GSE5 140429 F5 203 .76-.81, drop GSE6 140422 F6 196.3 .76-.83, drop GSE7 140424 F7 204.7 .76-.82, drop GSE8 140506 F8 194.9 1.04-1.07, dro GSE9 140531 F9 182.5 "Power" cellsGSE10 140423 F10 202.4 .76-.81, drop GSE11 140424 F11 199.3 .74-.79, drop GSE12 140529 F12 207.7 Energy "A" cells 1.32, stuck at GSE13 140424 F13 198.1 .75-.82, drop GSE14 140501 F14 205 .49-.59Ah, dr
25

2.2 Integration of Modules into a High Voltage String 2.2.1 The Prototype Two String System The module design provided for interconnection to provide a high voltage string, and then the use of parallel strings to fulfill the modular vision of scalable power and energy storage.
The Grid-Saver™ string size is 264 cells of the Li iron phosphate cells, yielding a string of nominal 871 volts. Eleven battery modules are connected to provide the 871 volt string. Structure was fabricated to support these modules on shelves, as illustrated in Figures 13 and 14. As operation at such high voltages and power levels – potentially 250kW per string, the assembly was done outside the TransPower building in an adjacent test trailer.
Figure 13: A Rack to Support up to 24 Modules Built into TransPower 20’ Test Trailer
Stacked three high on shelves, cables connect the modules such that, electrically, a single string of 264 modules results. The pictures tell the story of integrating the first two strings (A and B) into the 20’ test trailer, which is wired into the AV900 and grid at the side of the TransPower facility.
26

Figure 14: Placing Module in Supportive Structure
Figure 15 shows the Orion BMS module front left, with the beginning of installation of interconnect cables in process. The orange striped cable are the high current conductors, 4/0 2000 volt rated black railway cable with orange electrical tape to mark these as high voltage cables. The 4/0 is daisy chained from module to module, making the connection with the Andersen connectors is the final step in assembly and brings the string to high voltage.
Figure 15: String B with Some of the Wiring to Interconnect Strings
27

Note also that the small voltage sense wire is orange, as it is sensing the cell voltages the wires near the high end of the string is at high voltages. All that wire is high voltage (1000 volt rated minimum, 3000 V Daburn 2525 was used on most of these modules and the harnesses which interconnect the modules.
Figure 16 illustrates the two strings in the small trailer, the cables are complete on String B, at right. Following completion of hookup of the cables the first step was to assure that the system would operate at 900 volts. A 900 volt battery string is a first for TransPower, at best it is not common. The AV-900 was connected by passing the needed cabling through the wall, and with no incident whatsoever the strings were discharged and recharged. The BMS master-slave system operation at these high voltages was also a first, and was done with no incident.
Figure 16: Two strings in assembly in test trailer - one module not yet in place.
Subsequent to these commissioning tests the AC was connected to the inverters, pre-charge circuits installed and testing of the dual-string system was done using EPC test software. Results of the small trailer testing were presented at the February 20, 2014 Critical Progress Review, and the proposal to scale up to megawatt scale, using four strings, was approved.
2.2.2 Integration of the Megawatt Scale Prototype To proceed with the megawatt system, a 45’ refrigerated trailer was purchased and production of additional modules proceeded at once. Figure 17 shows the layout of the trailer, and Figures 18 and 19 show interior contents.
28

Figure 17: Plan View Layout of Large Trailer on Sandia ESTP
Figure 18: Structure for Support of Strings D & E Before Moving into Trailer
Key features of this installation include:
• The battery strings are alternated on the two sides of the trailer, offering better weight distribution.
• Inverters are mounted vertically on frames adjacent to the wall, with the pre-charge box above.
• Provision is made for supplying 300A AC to each inverter
• A single large circulating pump mounted within the trailer provides coolant to all inverters. In Figure 19 the blue hose is the coolant line. The String D Inverter (also shown in Figure 6) is hidden from view behind the modules to the right of technician.
29

• CAN traffic estimates led to the use of three CAN networks, one for the inverter control and one for each pair of battery strings.
Figure 19: Photo of Inverters During Installation
As on the small trailer system, each string was protected by a high voltage, high amperage fuse and by use of contactors (contained in the pre-charge box) connecting top and bottom of the string to the inverters on command from the BCU.
As will be discussed later, a customer request for use of USA battery product led to sampling and acceptance of a quite different product from EnerDel, a firm with principal offices in Indiana. Hence a distinct design of module was qualified and a single EnerDel string, shown during assembly in Fig. 20. Figure 21 shows completed modules using imported CALB cells, contrasted with completed EnerDel modules using a different “backplane” design. The EnerDel string uses 240 cells, the lesser number due to the higher nominal voltage of the EnerDel cells. Four strings (CALB or EnerDel, with inverters) connected in parallel can provide a megawatt of electrical power. Note that, although the CALB strings can provide full power to the inverters they are limited in that they can be charged only (observing the manufacturer limitation of 1C
30

charge rate), at the 180A rate, limiting the charge acceptance power to about 160 kW. The EnerDel cells have the notable advantage of a 2C rating for either charge or discharge.
Figure 20: Wiring of the EnerDel Backplane String
Figure 21: Complete Connected CALB Strings in Trailer
Fabrication of the four string system was followed by early commissioning, performed on site by TransPower. The system was not connected to three phase AC at TransPower, thus the checkout included assuring CAN communication with the inverters, and that the BCU responded to voltage and temperature signals so as to protect the battery cells and modules.
31

Figure 22: Removing a module of String F, the Backplane Design.
2.2.3 BCU Software Development The assembly of the megawatt sized Grid-Saver™ system by TransPower was paralleled by the development of the BCU software which monitors CAN network traffic from the BMS units (2 CAN lines) and a third CAN connection to the ICUs. The BCU (Battery Control Unit) is designed to protect and control the energy storage system, it presents a control display to the operator and processes commands for transmission to the ICUs. The BCU also has automated control of contactors which pre-charge the ICU from battery storage, then make the connections to the battery, and in the case of out of limit reports from the BMS will disconnect a battery string if voltage or temperature limits are exceeded.
2.2.4 Setup for Final Commissioning, Test and Validation The original project intent was for the prototype Grid-Saver™ unit to be transported to a “test cell at General Atomics (GA)” for Task 4 Validation Testing. A visit to the GA facilities in 2013 showed that there was really no appropriate “test cell”, and that the only way the testing could be done would be to tie the Grid-Saver™ to the GA grid, which was in fact the SDGE grid. The GA staff met with SDGE staff, discussed and filed Rule 21 documents, but discussion suggested that as the inverters do not have UL 1741 testing approval, the application would not be accepted.
32

Senior Sandia staff visited the TransPower facilities late in 2013 and showed interest in this system. They indicated that Sandia had invested in development of a test site suitable to the megawatt trailer. Thus application was made for a cooperative program in which Transpower would supply the megawatt trailer, Sandia would supply test facilities (the ESTP – Energy System Test Pad, and related wiring and control systems) and the teams would jointly staff for reassembly, commission and test.
Figure 23: Shipping Boxes Were Used to Protect Each Module
Figure 24: Crated Modules and Support Structure Filled the 45’ Trailer
Following this agreement and the early commissioning procedure at TransPower, the four strings were disassembled and each module was removed from the trailer. Each was crated in a specially made wooden box, equipped with foam padding within and shock mount supports (Figures 23 and 24). This separate packaging of each cell was in part due to the racks not being designed for road travel and the possible occasional 5G loads over the nearly 1,000 miles to the
33
test site. Thus the modules were individually boxed. The support structure was not demounted, to simplify the reassembly of the system.
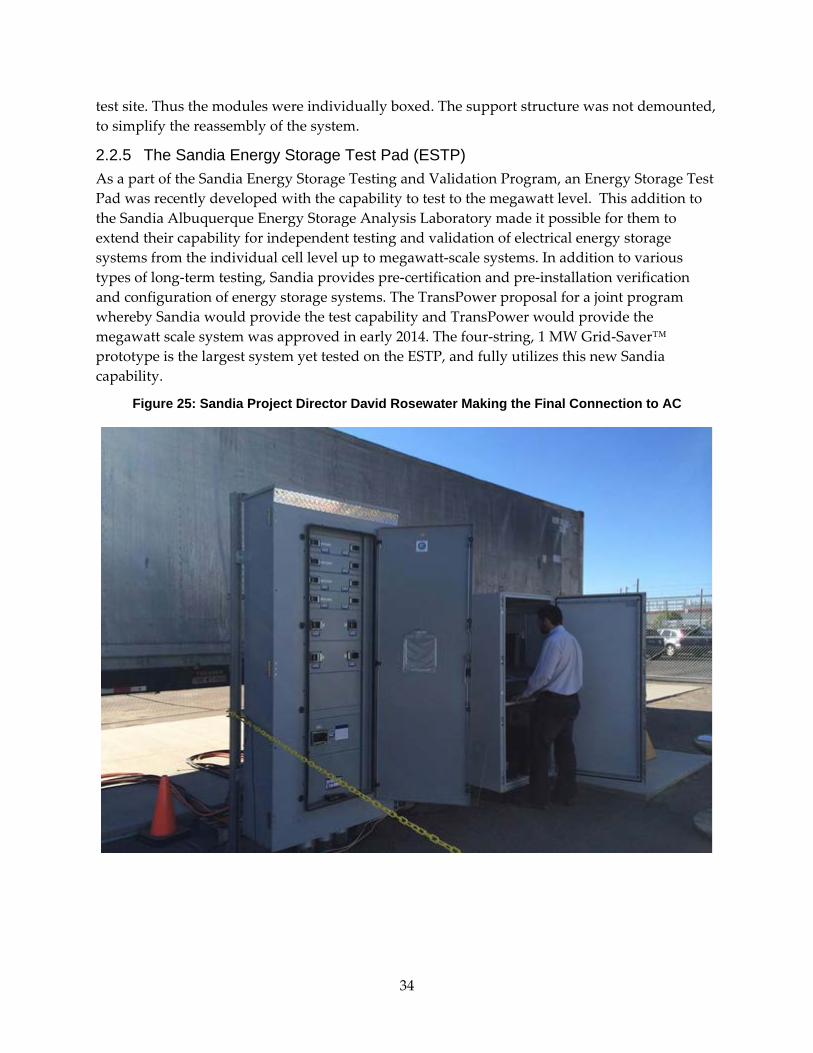
2.2.5 The Sandia Energy Storage Test Pad (ESTP) As a part of the Sandia Energy Storage Testing and Validation Program, an Energy Storage Test Pad was recently developed with the capability to test to the megawatt level. This addition to the Sandia Albuquerque Energy Storage Analysis Laboratory made it possible for them to extend their capability for independent testing and validation of electrical energy storage systems from the individual cell level up to megawatt-scale systems. In addition to various types of long-term testing, Sandia provides pre-certification and pre-installation verification and configuration of energy storage systems. The TransPower proposal for a joint program whereby Sandia would provide the test capability and TransPower would provide the megawatt scale system was approved in early 2014. The four-string, 1 MW Grid-Saver™ prototype is the largest system yet tested on the ESTP, and fully utilizes this new Sandia capability.
Figure 25: Sandia Project Director David Rosewater Making the Final Connection to AC
34
With these precautions the system was shipped to the Sandia facility in Albuquerque New Mexico. All contents arrived and were unpacked with no damage. The reassembly included the added steps of connection with heavy (3/0, class M, rated to 350A at 600 volts) cable.to AC power. To be specific, three of the 3/0 cables were used to connect each inverter to a distinct delta connection 480 volt, three phase power circuit.
The Sandia hookup also included:
• Closed circuit video, such that a remote observer could observe any movement or incident within the trailer.
• Smoke alarms within the trailer, with remote annunciators.
• A control laptop within the trailer connected to the BCU, with provision for remote operation over a wire linkage to the control room in Sandia Building 833.
Sandia staff was quite active in this operation, both assisting directly in the unpacking and setup and in initiating reviews so as to assure that the installation met not only the TransPower standards but as well the DOE-Sandia criteria, oft more rigid perhaps due to long history dealing with nuclear issues and safety standards.
Commissioning procedures were initiated in July 2014 and continued into August. Multiple issues were encountered, ranging from a leaky roof to nuisance failures of 1/4A fuses which were installed only on string F, intended to protect the BMS units. The fuses were replaced with 1/2A fuses, which appear much less sensitive to transients. Multiple reports were required by Sandia staff, a hearing protection report, a plumbing report, there were labeling requirements, the CO2 fire extinguishers were faulted for not having gauges, and smoke detector tests were required. Sandia found they had to upgrade their amperage instrumentation. After all that there still was an electrical inspection requirement, before connection could be made to grid.
35

CHAPTER 3: System Tests and Validation Testing 3.1 Commissioning and Related Tests The commissioning process is a step by step assessment of the system to assure correct connections and operation.
• Voltages are monitored as connections were made; every precaution is taken to assure that all structure is appropriately grounded and that there is no leakage current.
• CAN communications are assured and evaluated.
• The BCU operation is assured and step by step the software is tested and evaluated, assuring that software design intentions are carried out.
• Inverters are connected to AC, and with battery connections being made the operation is assessed at small currents.
At Sandia the trailer was positioned on the ESTP and the boxed modules were removed from the trailer, unpacked, and then returned to correct locations in the trailer. With harnesses connected commissioning resumed, assuring correct connections and communication. The cables were cut and connected for AC, and power checks followed. A laptop in the trailer with the BCU software was set up as the controlling entity, with remote connection to the control room which was about two city blocks away. There were some new and unexpected issues, such as repairing the trailer roof such that it would protect the battery from the New Mexico monsoon season! There were also new issues of certifying to the acceptance of Sandia staff the viability of such systems as the coolant, preparing a “Pressure Data Package”, getting electrical inspections and stickers, and getting monitoring cameras and fire protection to meet local expectations. It was a continuing issue that at this government facility it takes at least two persons to operate at any level, and there were days that work ceased for lack of personnel. Replacing fuses on 65 volt modules required full safety suit and multiple staff working remotely in the sun distant from the trailer, and so days lapsed one by one.
One unique issue arose first at early commissioning and again after arrival at Sandia, resulting from that in the design of String F the research team added 1/4A fuses which were intended to protect the BMS units from damaging connection errors. The fuses were quite sensitive, and would open at unknown provocation. A set of 1/2A fuses were purchased, and step by step disassembled modules, removed the circuit boards, and replaced hundreds of tiny surface mount fuses. This was successful, in that it resolved the blown fuse issue while still allowing protection.
Data from early testing showed the effect of very conservative limitations on automated operation. To assure demonstrating correct operation of the BCU and all affiliated wiring, the trip limits – temperatures and voltages in particular, were set low. One by one these limits were raised as the correct operation of BCU and components was assured.
36

Figure 26: BCU Control is Established, One Quadrant per String
There were other less intentional limits. During the module qualification the charge and discharge was done at 180A (1C) for the CALB strings. Some increase in module temperature was noted. Typically, an increase of 5 to 10 degrees Celsius was noted. BCU software includes developmental and diagnostic screens, but as one progresses to full system operation the above control string, which incorporates all the protective limits, was increasingly used.
Early versions of the BCU software had very limiting control parameters, the first objective was simply to run one string at time and do all reasonable checks to assure that the control could be accomplished safely with no oscillatory tendencies. Some days were required to get BMS and BCU limits meshed so the two would work together and allow the BCU to be the controlling entity. It was weeks after the trailer arrival that the commissioning of strings, requiring two minute charge-discharge cycles at 180A, could be completed.
37

3.2 Data from Validation Testing Early data runs were single channel only, then proceeding to showing that multiple strings could be run simultaneously. The operator uses the BCU display (Figure 26) to command power from each module desired at the level desired. The most severe request is to command full power, which will draw appropriately from each string. Figure 27 shows the result command, with the lower four curves representing currents up to above 300 amperes from the four strings. The upper four curves represent the highest cell temperatures for each of the four strings. The horizontal axis is time in seconds. More than an hour of data is presented, with current peaking very early in the process.
Figure 27: First Discharge of 1MW Output
38
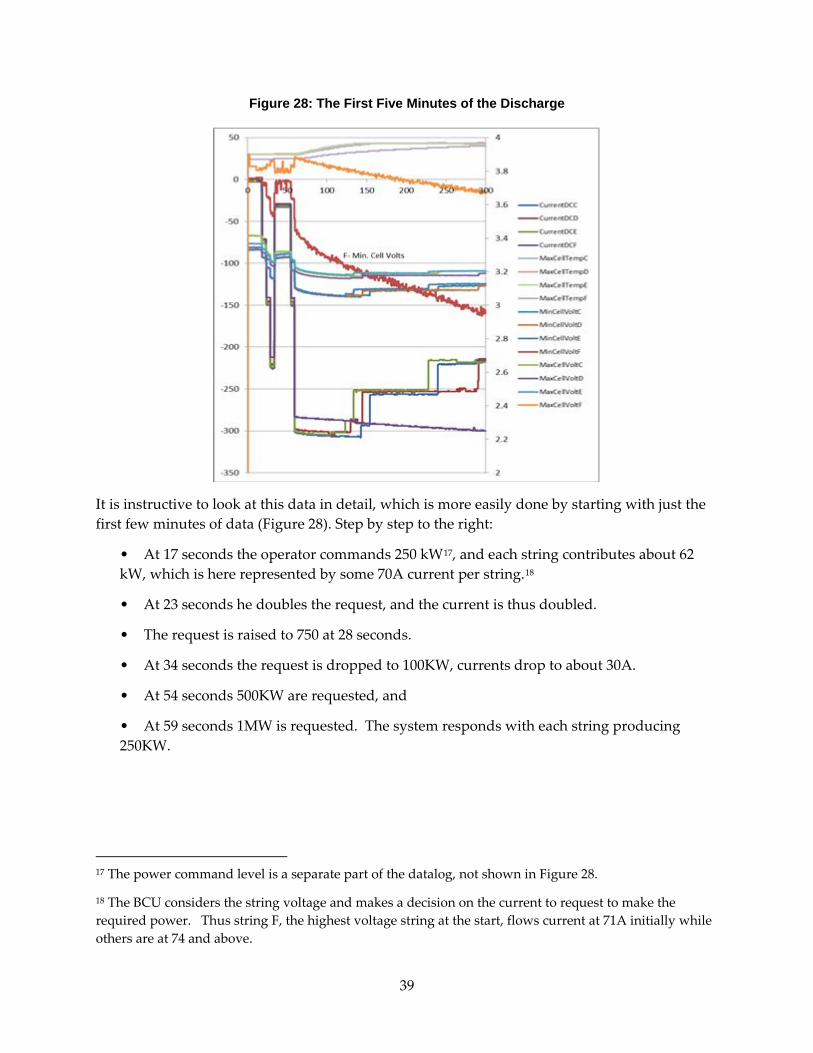
Figure 28: The First Five Minutes of the Discharge
It is instructive to look at this data in detail, which is more easily done by starting with just the first few minutes of data (Figure 28). Step by step to the right:
• At 17 seconds the operator commands 250 kW17, and each string contributes about 62 kW, which is here represented by some 70A current per string.18
• At 23 seconds he doubles the request, and the current is thus doubled.
• The request is raised to 750 at 28 seconds.
• At 34 seconds the request is dropped to 100KW, currents drop to about 30A.
• At 54 seconds 500KW are requested, and
• At 59 seconds 1MW is requested. The system responds with each string producing 250KW.
17 The power command level is a separate part of the datalog, not shown in Figure 28.
18 The BCU considers the string voltage and makes a decision on the current to request to make the required power. Thus string F, the highest voltage string at the start, flows current at 71A initially while others are at 74 and above.
39

The red trace labeled F-Min Cell Volts represents the voltage of the lowest voltage cell in string F. Values are at right, before the discharge started that cell was at 3.76 volts19. Note that this curve drops to about 3.44 volts as current goes to 270A, suggesting a resistance in the cell of about 1.2mΩ. This may be attributed to the cold cells (this being the first run of the day, cell temperatures were reported at 23°C) but it may as well be that this is a more resistive cell than most of the EnerDel based units.
At top of Figures 27 and 28 are four curves representing the cell temperatures. Three at top are grouped as the CALB cells tend to run warmer than the EnerDel. Strings E first, and then D and E have a highest cell temperature rise above 40°C, causing power derating, as can be observed in the current traces below.
Note the three traces which end at the right axis at values of about 3.13. These are the MinCell voltages for the CALB strings, note that as current is de-rated one observes jumps up in cell voltage, this is due to cell impedance, less current less voltage drop. The three traces just above represent the MaxCell voltages, note how the CALB voltage differences are so much less than the EnerDel. Note also the smaller voltage jumps as string currents are derated, a large part of the difference in cell voltages is internal impedance.
Returning to Figure 27, note that first string F and then string D fault out (inverter shuts down with current going to zero) at about 800 and then 1200 seconds. Strings C and E continue a steady discharge to about 2200 seconds, at which point the minimum cell voltages start forcing successive current derates.
Inverter faults have been an issue throughout this development, and appear to be a result of circulating high frequency currents which can be handled by adding inductance to the DC circuit. Thus the inductor in the pre-charge box (Figure 6) and others added later. After several runs showed the system worked well with strings C and E, but repeatedly faulted out for strings D and F, additional inductance was added to those strings, seemingly eliminating the faulting for string D but not for F.
The success in Figures 27 and 28 is that the system operated at full power, if only for just over a minute. That period would have been longer with more permissive temperature limits - they were later expanded once it was clear that the software was indeed doing the limiting correctly – from a 40 degree limit to a 45 degree limit. Further, there will be opportunities to improve cooling with later versions
19 As noted in section 1.1 the EnerDel cells are high voltage cells, this being very evident in the data traces of Fig. 28. It is noteworthy that the lowest and highest cells of that string, at 3.76 and 3.90 volts are about 70% and 84% charged. The wide spread being a result of the string being ignored and not balancing for about three months, until about 3 weeks before this run, and the lack of full charge on even the highest cell being indicative of the effect of the very conservative BCU instruction set, which here limited highest voltage and hence charge level. The team later raised this limit.
40

Figure 29: Current Limits for CALB Strings
The current limits are more complex, as detailed in Figure 29 showing the changes made from software version 095 of the data above to 096, used for the following data.
Figure 30 shows a later data set which shows both power and temperature data, providing a quick intro to the data. Total power discharged to grid is shown in blue, starting at a megawatt but decreasing to about 1/2 MW over the 12 minute run. At these power levels, inverter temperatures rise to over 70°C, while battery temperatures peak at 46°. This is not the first run of the day, note that inverter temperatures as well as CALB cells are well above ambient. The blue represents the system power over the 702 second (11.7 minute) duration.20
Peak power is one megawatt (power on the right axis in watts) while inverter and battery temperatures are shown left axis, in degrees Celsius. Internal inverter temperatures are given by the gradually rising curves in the middle, labeled TempinternalC, TempinternalD etc, where the last digit (C, D, E, F) denotes the string position. C, D and E are stings of CALB cells, string F is the string using Enerdel cells. The IGBT temperatures are given by the bunched curves at top,
20 This discharge was manually terminated, others will be presented that discharge the cells to low voltages over the period of an hour.
41

note that these quickly rise to 65° and above, causing derating21 and reducing power almost immediately. Further, at bottom, cell temperatures22 for the CALB cells got to 45° for strings C and E, while string D got to 46°, and each degree above 44° derates that string by an additional 10%.
Figure 30: Power and Temperature Data
During this run the highest and lowest cell voltages are monitored. That data, along with current data, are shown in Figure 31. Negative sign for the current indicates that current is being drawn from the cells Currents initially increase (fall, in this representation) to peaks of 270-300A. Highest and lowest voltage cells vary due to currents and charge state. The upper two curves represent the voltages of the EnerDel cell string which typically have voltages varying from a 2.5 volt minimum to a high of 4.04 volts at 100% SOC (State of Charge). Note that the lowest voltage drops quickly by nearly 0.4 volt as the current rises to 270A, suggesting
21 Inverter power is derated over the 65 to 75oC range. The team was told to expect at most an 8 degree rise over coolant temperature, which was reported at or below 50C (Ticonchuk, 27 Aug).
22 More correctly, these are the interconnection junction temperatures. The cell temperatures rise and fall quite slowly, the interconnects with only microohms impedance cause notable heating – a 10µΩ resistance at 300A results in a watt of heating. During the qualification testing the team tested each pair of connections by passing 100A current, typically measuring 1.6mv from bolt head to bolt head. This suggests a total of 16 µΩ
42

that the impedance of one cell plus interconnections is about 1.5mΩ.23 The CALB cells start at about 3.33 volts, with voltage dropping to 3.12-3.23 as current rises to 300A, suggesting maximum cell impedance of about 0.7 mΩ. The wide difference between the impedance of CALB and EnerDel cells may be in large part due to the longer cell interconnect bars on the EnerDel units leading to higher impedance.
Figure 31: Currents, Highest and Lowest Cell Temperatures for each String
More detail on the current and power limiting exercised by the BCU is given in Table 4, which represents the present software version 096. The research team envisions opening the cell voltage limits on the EnerDel strings, but only after overcoming remaining faulting issues. The 55° limit on cell temperature is a reflection of manufacturer’s recommendations.
Longer discharges can lead to near complete discharge of the cells. Figure 32 illustrates a discharge with the same system setup as above, showing several phenomena:
1. The inverter rating of 250 kW limits the initial currents to just over 300A for the CALB strings and 281A for string F, which initially has a higher voltage.
2. The contractor has conservatively limited the CALB voltages by current limiting below three volts, this causes the currents to drop to about 250A within the first couple minutes (appears the system was not fully recharged).
23 The initial increase of MaxCellVoltF is thought to result from an improper overcompensation for the busbar voltage drops on string F. This can be corrected with a manual entry to the BMS tables if verified.
43

Table 4: Programmers Current, Temperature and Power Limits
Current, Temperature and Power Limiting
Parameter CALB String EnerDel String Current Charge rate NTE 180A, Discharge rate NTE
360A Charge and Discharge rate NTE 398A
Cell Voltage no cell below 2.92, no cell above 3.60, achieved by tapering current
No cell below 3.00 volts, no cell above 3.90 volts
Power String voltage times current -- at 250kW degrade current by 2% each second until again below limit.
String voltage times current -- at 250kW degrade current by 2% each second until again below limit.
Temperature if cell temperature over 44°C current limit reduced by 10% per degree -- Fault at 55 degrees.
If temperature over 44°C current limit 10% per degree -- Fault at 55 degrees.
Figure 32: Extended Discharge of One Hour Controlled by BCU
44

3. The EnerDel cells have a wider voltage range, contractors observed the current increasing as the voltages drop, until a cell gets below three volts and current limiting begins. Again, this is a very conservative limit and the team could likely delay this limitation by resetting the limit voltage from 3.0 to 2.7 or even 2.6 volts. Manufacturer recommendations are that these cells not be discharged below 2.5 volts.24
4. Note that at about 800 seconds current ceases from string F. During commissioning the team noted that each of these strings were prone to faulting, causing shutdown. This results (in these most obstinate cases) from common mode coupling between inverters causing the inverter controller to sense interference and initiate the fault. These effects were reduced by adding inductance to the high current lines, but string F has been the most reluctant to be tamed by this approach.
5. The three CALB strings continue to have a stable discharge at a total power of approximately 600 kW for 20 minutes, after which time the SOC is depleted to under 50% and the minimum cell voltage begins drop to the point of causing progressive power reduction. Within an hour of operation the charge is depleted to the point of ceasing operation for all four strings and the total discharge recorded is, respectively, 131, 143, 142 and 60 AH for strings C-F. Similar results were observed in other runs, with the CALB cell strings discharging from approximately 92 to 18% SOC. While it might be possible to charge more fully – say to 3.65 volts, and discharge to voltages below three volts, this might be expected to reduce cell life if done consistently. Hence it seems that the use of this range, offering about 74% of rated stored capacity, is both a realistic and reasonable use of the cells. It is notable that 74% of 180Ah ( the rated capacity) is 133Ah, so in fact one is doing a bit better than might be expected for two of the three strings. This vouches for the CALB strings being well balanced, typically in mid-charge region, the spread highest to lowest cell voltage of 8-12mv is seen, where the balancing circuitry was set to bring the cells to within 10 mv.
6. Although opening up voltage and temperature limits could increase the amount of full power operation to some minutes, it is clear that for a system to operate at megawatt power for extended times it will be necessary to use larger cells. Going to 400 Ah (the next step up for CALB cells, beyond the 180 Ah used for the Grid-Saver™ battery) will double the capacity, reduce the cell impedance, and likely make possible megawatt level operation for extended periods, even an hour. Further the larger cells should reduce heating and hence avoid another source of operational derates.
24 Another view suggests that one could bring the discharging voltage even below 2.5 volts by noting that part of the voltage is due to resistive effects. At 300A current one might expect that at least a tenth of a volt drop is due to the resistance. The inverters have both a power limitation (250kW) and a 360A current limit.
45

Following discharge, the cells were recharged, as illustrated in Figure 33. As the CALB cells are rated for recharge at only 180A,25 the power is more limited, a peak of approximately 700KW is seen, with nearly immediate decreases due to string F cells getting to over 3.9 volts. Following ten minutes of discharge at 180A, the CALB strings also show de-rated current, not due to cell voltage or cell heating but due to the inverter IGBT temperatures exceeding 65o. The very slow rise to these temperatures suggest that the issue is not with the inverters but rather with the limited cooling of the circulating coolant, combined with the radiator being in the sun and air temperatures approaching 30C. String F became fully charged mid-cycle, with the inverter heating as well as the cell voltages above 4.05 limiting the current. This can be attributed to the cell charge levels being high at the start of the recharge process – according to the datalog 61% at the start of the recharge.
Figure 33: Recharge Following the Discharge of Fig 32
Note in Figure 34 the very cool StringF cells, designed for cooling, while the CALB cells indicate a peak of 43°.
The IGBT temperatures rise to 68°, causing derating of the CALB strings.
25 The CALB cells are rated at 1C charge, 2C discharge, whereas the EnerDel cells are rated 2C independent of charge or discharge. As discussed below, the team demonstrated short discharges of 3C, which is manufacturer sanctioned for under ten seconds.
46

Figure 34 - Total Power and Temperatures for the Recharge Following the Discharge.
The recharge acceptance was respectively 134, 145,144, and 75 Ah for strings C-F, the limited value for string F being due to never having been fully discharged prior to the charge cycle. This was a result of faulting of string F during the prior discharge, refer back to Figure 25. Review of voltages at the start of this recharge (lowest/highest cells at 3.50-3.55 volts) suggest the charge level was more like 53%, such that the added 75Ah did indeed result in over 90% SOC.
3.3 Validation Testing Conclusions There are several key conclusions one can draw from the foregoing data:
• The control of multiple strings by use of a BCU of our design has been fully successful, in that the resulting actions are a direct result of the coding. The operation is sensitive to inverter faults, which can be triggered by high frequency communication which is snubbed by use of inductance on the high current battery connections.
• The CALB and EnerDel strings have both shown the capability of discharge at 250kW, and the inverters are capable of the charge and discharge. The discharge duration depends on current level as well as heating, being short at the highest currents.
• There is room for continued improvement in cooling design and as well as in moving the current and voltage limits. Commercial application will require a balanced approach which in turn demands additional knowledge on the effects of charge – discharge levels as well as temperature on life.
47

• With present setup, including the limitations imposed by voltage limits, approximately 74% of the cell rating of 180Ah can be drawn from these high voltage strings.
• Further use of the system, preferably at a site which can effectively use the energy storage, will be needed to develop the capabilities.
• In continued use of system (during Q4 2014) Sandia staff have demonstrated the use of the system for frequency regulation of the grid. This work will be detailed in a subsequent publication.
48

CHAPTER 4: Technology Transfer Activities The validation testing shows the use of the large format batteries in high voltage strings is appropriate for large scale energy storage systems. It says little about their durability or about special issues that may arise in 24-7 use of long periods. In moving towards using this developed technology it is appropriate to look at modest sized systems which will be us daily service for extended periods. The New York City Transit (NYCT) opportunity offers just that type of application.
4.1 Wayside Energy Storage - NYCT This program was awarded to TransPower and contracted in early 2013. The proposed scheme is to use multiple strings of cells with 200 cells per string and an operational voltage of approximately 660 Volts directly connected to the subway third rail through a large high current DC contactor (Figure 35).
Figure 35: Illustration the Wayside Energy Storage Concept
The program objectives are to:
i. Allow regenerative power to be stored in the battery and reused during train “launch”, with dual benefits of improving voltage stability and train performance, and
ii. Allow – in case of power disruption in the usual substation power supply – a “bring home the trains” capability which will prevent stranded train cars and passengers.
49

This program has been subject to over a year of design improvements and changes, largely to allow full compatibility with the NYCT systems. It is presently expected that the system will be deployed during 2015.
4.2 Further Strategies for Technology Transfer 4.2.1 Demonstration and Validation Testing, the Sandia Laboratory Example This work was first publicly presented at the EESAT meeting in October 2013, and additional conversations ensued with Stan Atcitty of Sandia Laboratories. Mr. Atcitty visited the contractor’s facilities, and discussions evolved which resulted in the present program of testing the Megawatt Trailer at the Sandia Energy Systems Test Pad (ESTP).
This test program has multiple purposes and benefits. First, it fulfills the contract validation requirement at the nations’ leading battery system test facility. Secondly, the largest battery system ever to be tested at that facility is receiving a lot of attention from key industry professionals. Finally, from this testing will result in a series of technical papers documenting the system capabilities, including grid connected demonstration of ancillary services.
Separately, discussions are directed towards a design evolution directed towards use of the GridSaver system by the Navy in offshore installations where wind and solar are the primary sources of electricity, and battery storage of electricity is a key anchor component of the base microgrid. An initial contract is expected in 2015.
4.2.2 Professional Presentations There is a fast developing community interested in Electrical Energy Storage, one notable professional meeting is the EESAT (Electrical Energy Storage Applications and Technologies) conference, attended by TransPower in 2011 and 2013, most recently presenting the Grid-Saver™ technology in a paper “Utility Energy Storage using Large Format LiFePO4 Batteries”. The project was also presented by Sandia staff at the recent Department of Energy Peer Review, which TransPower staff attended. There was discussion of the possibility of continuing using the megawatt trailer at a working site following the Sandia testing. The work was also discussed at the Institute of Electrical and Electronic Engineers (IEEE) International Electric Vehicle Conference, as a part of the TransPower portfolio.
4.2.3 Marketing to large customers TransPower has been approached by several organizations with interest in megawatt scale storage. The contractors declined to bid a 60 MW system (too much commercial risk, too early in the technology development), but have done sizing studies to 10 MW size for an energy supplier active in California. Proposals have been submitted for funding of smaller systems.
4.2.4 Expectations for further cost reduction TransPower presently believes that it will be able to supply multi-megawatt systems for prices of approximately $600/kWh. This is triple an Energy Commission objective and it appears that California energy storage expenditures over the next decade will be in the billion dollar range with cost reduction and system longevity as key issues.
50

CHAPTER 5: Production Readiness Plan Over the past decade, California has made successive constructive commitments to energy use reduction and living within environmental means:
1. In 2003 the Energy Commission and CPUC collaborated in formulating an Energy Action Plan26 which declared that cost effective energy efficiency is the resource of first choice for meeting California’s energy needs. This policy stemmed from belief that energy efficiency is the least cost, most reliable, and most environmentally sensitive resource, and minimizes our contribution to climate change. The “loading order”, identified energy efficiency as the California’s top priority resource. Utilities were required to first meet their “unmet resource needs through all available energy efficiency and demand reduction resources that are cost effective, reliable and feasible.
2. The 2007 Energy Commission Integrated Energy Policy Report continued that “Energy efficiency will continue to be the keystone of California’s energy strategy. California’s building and appliance standards… will save an additional $23Billion by 2013”.
3. The 2007 Long Term Energy Efficiency Strategic Plan was developed through a collaborative process involving the CPUC’s regulated utilities sets forth a roadmap for energy efficiency in California through the year 2020 and beyond. It articulates a long-term vision and goals for each economic sector and identifies specific near-term, mid-term and long-term strategies to assist in achieving those goals.
4. The California Global Warming Solutions Act of 2006 (AB32, Pavley) focused on developing regulations and programs to encourage energy efficiency to meet these new greenhouse gas emission reduction goals.
In parallel, the developing and implementing renewable energies led to consideration of programs which would encourage the integration of renewables. The 2003 Energy Action Plan dealt not only with energy efficiency, it dramatically accelerated the timeline for renewable resource implementation and implemented open processes that today distinguish this state from all others. The state Renewable Portfolio Standard was aggressively upscaled to a goal of implementing 20% renewables by 2010.
By 2010 it was becoming apparent that the massive implementation of renewables was bringing new stress to the grid. Energy storage was needed, as an alternative to renewables curtailment. The CPUC initiated a rulemaking procedure regarding electrical energy storage, the assigned Commissioner proposed a 1,325 MW energy storage procurement target for the three large IOUs and this was approved October 2013. Consequently each of the primary utilities have
26 The Energy Action Plan was at least in part a reaction to the meltdown of California energy markets resulting from Enron and other firms gaming a poorly thought out system to the detriment of all California electricity customers.
51

target procurements for 2016 and each 2 years thereafter. Southern California Edison, for instance, has a 90M procurement target for the coming 2 years and has submitted documents as to how they intend to meet these procurements. Installation is due within the following 4 years.
5.1 Forms of Grid Energy Storage Being Considered It is worth looking at the various forms that grid energy storage may take. There at least a couple dimensions of breaking this down:
• Technology: Although the primarily focused is on using batteries, much of the 1.3GW purchase will be in various forms:
o Flywheels
o Pumped hydro storage
o Flow batteries, where the storage capacity relates to tank size and the power to the cell size
o Hydrogen storage, with an engine or fuel cell or even vehicles to use the stored energy
o CGS – Compressed gas storage, among many contenders
• Application
o Home applications,
o Utility Distribution
o Utility Transmission
Figure 36 shows a relatively small CES (Community Energy Storage) system, which is located in a housing tract to the end of supporting the power distribution in a desert location which has large solar arrays (and possibly small solar systems on houses). The TransPower system is 10 times this size, and more likely is appropriate to be located at the solar site or either at a distribution or transmission substation.
5.1.1 TransPower Products - Electric Trucks and GridSaver TransPower’s primary products are:
• Components to enable large vehicles such as trucks and buses to operate on battery-electric or hybrid-electric power;
• Integrated vehicles using these components, including Class 8 port trucks, and
• Large battery systems for stationary energy storage applications
52

Figure 36: This Community Energy Storage System is Available in sizes to 75kWH
Figure 37 shows TransPower total system solutions that convert large vehicles to run on electric power and that can store large amounts of energy for stationary uses. The company also designs and manufactures a range of specific components that can be sold independently, or packaged into intermediate “subsystems.” This enables TransPower to support its customers with a greater degree of flexibility than most competitors in the electric vehicle and stationary energy storage markets.
The Grid-Saver™ system capitalizes on these strengths. It is a modular system that will enable meeting peak discharge requirements from the hundreds of kilowatts to the tens of megawatts, with hundreds of kilowatt-hours to tens of megawatt-hours of total energy storage, using common building blocks. It uses key TransPower technologies developed for vehicle applications for utility and commercial.
53
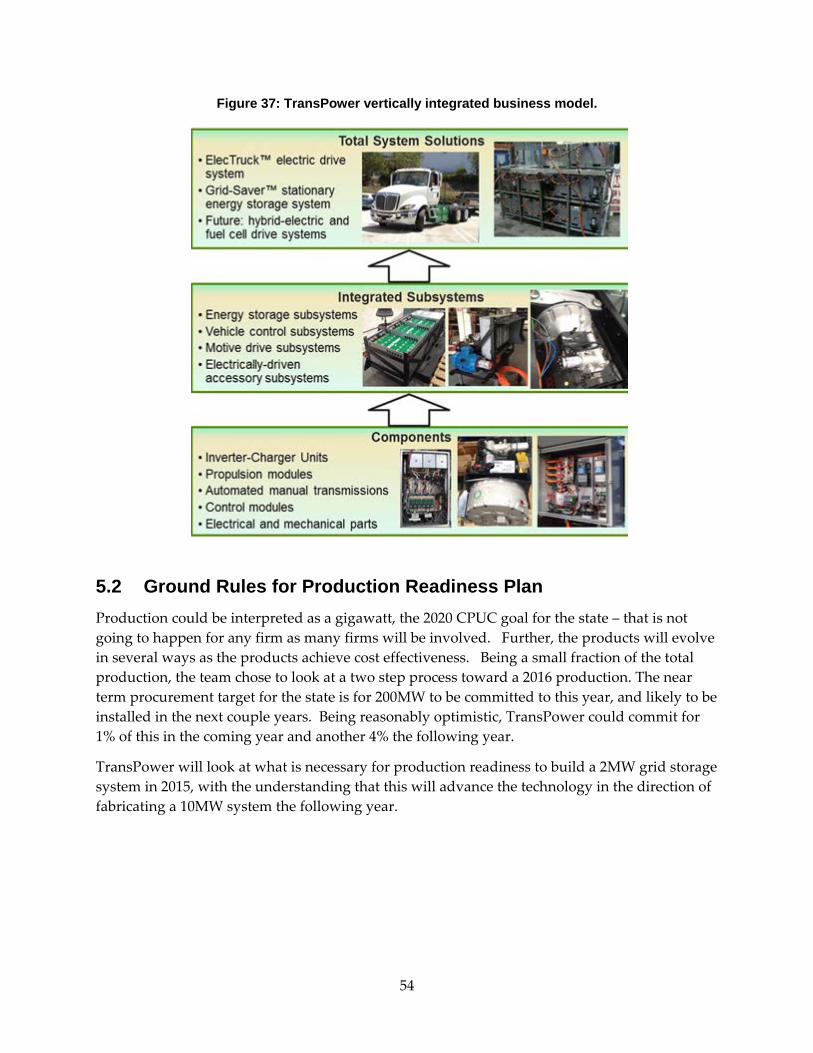
Figure 37: TransPower vertically integrated business model.
5.2 Ground Rules for Production Readiness Plan Production could be interpreted as a gigawatt, the 2020 CPUC goal for the state – that is not going to happen for any firm as many firms will be involved. Further, the products will evolve in several ways as the products achieve cost effectiveness. Being a small fraction of the total production, the team chose to look at a two step process toward a 2016 production. The near term procurement target for the state is for 200MW to be committed to this year, and likely to be installed in the next couple years. Being reasonably optimistic, TransPower could commit for 1% of this in the coming year and another 4% the following year.
TransPower will look at what is necessary for production readiness to build a 2MW grid storage system in 2015, with the understanding that this will advance the technology in the direction of fabricating a 10MW system the following year.
54

5.3 Critical Technical Issues – Focal Areas for the 2015 Product TransPower expects to improve the product, focusing on simplification, making it more suitable to application, and cost reduction:
1. Structural support – the battery is heavy, approximately 2.5 tons of mass per string, or 10 tons per megawatt capability. In the present design this is supported by a simple bolt together structure, which provides static support only. TransPower plans to study what is required to redesign so as to achieve a reinforced support frame which will allow transport, such the system can be fully fabricated in the factory and then shipped by rail or truck, without removing the modules and separately packaging them in expensive wooden boxes. This will also require review of shipping regulations and getting opinion that the shipping plan meets with shipping regulations.
2. CAN bus and BMS simplification – at the least, the team expects to encourage the manufacture of a 264 channel BMS, which will enable a single BMS per string rather than the present Master-Slave configuration. This will also simplify wiring, possibly eliminating one of the CAN serial communication lines.
3. Operational Simplicity – Grid-Saver™ is a complex system incorporating multiple levels of software, and the operation procedures are evolving as the 1MW system is presently used in Albuquerque at the Sandia Laboratory test facility. TransPower will keep this system in operation and continue to simplify and to evolve its control system, with the goals of making it simple to operate, while maintaining the flexibility to operate by remote commands so as to capture multiple benefit modes.
4. Increasing inverter power capability – by software changes and qualification testing the team expects to raise the inverter power capability to 333kW. This will allow discharge power increased by 33%, or cost reductions of similar amounts.
5. Enclosures – TransPower has been modifying refrigeration containers and custom building out large truck size containers to contain these systems. To proceed to cost reduction and a production system the team needed a well defined, easily implemented container. A string container is being designed (figure 38) that allows full access to both sides of the backplane-designed modules, and that could be mass produced as a cabinet to allow front and back access to all electrical connections. Although costly in the prototype configuration, it will lend itself to production and make the Energy Storage System more convenient for customers to use and support than the current method of adapting large containers.
5.4 Critical Production Processes, Equipment and Facilities TransPower and its staff are well equipped for addressing these critical issues, with the exception of the inverter certification and enclosure fabrication. Vendors with these capabilities have been identified and wait funding to proceed.
55

5.5 Manufacturing Facilities, Constraints Although TransPower has tentative plans to add to facilities in the coming year, this is driven by the vehicle business rather than stationary storage production requirements. The key constraints are the continued development of supervisory software and operational capability, the pace of development being limited by funding. There are no hazardous or non-recyclable materials, other than the lithium ion storage cells.
Figure 38: Double Walled Air Conditioned Fireproof Enclosure (designed for NYCT)
5.6 Cost Estimates As part of the cost estimating efforts, TransPower has developed a Work Breakdown Structure summarizing costs by components for a 10 MW system. Reasonable assumptions include progressive reductions of cell costs in accord with recent communications from suppliers, realistic advances on the critical technical issues (which implicitly assumed funding of the program including continuation of the development and use of the present megawatt system) and expected reductions in component costs in line with the increased purchase commitment. A modest reserve for installation, commissioning and warranty is included as a cost.
Note that this system is rated at 10MW based on peak power capability. The limited energy storage can be expected to allow 20-30 minutes operation at peak discharge rate, the charge rate is half that, in accord with cell ratings. A configuration designed for extended energy storage would have several times the energy storage. (Rather than using 35 strings of 180Ah cells, a system with 4 hours storage at a 10 MW charge rate would have at least 115 strings of 400Ah
56

cells.) The specific cost of the example WBS system would be well under the CEC goal of $1000/kW, whereas the $936 cost per kwh is reflective of the design emphasis on power.27
5.7 Investment Requirement The investment expectations include nonrecurring engineering directed towards:
• Structural design and testing,
• Development of a 264 cell monitoring BMS
• Software development directed towards improved diagnostic visibility and ease in commissioning the large system.
• Inverter certification
• Enclosure development.
5.8 Implementation Plan A schedule showing key elements of our plan for implementation is provided in Table 5.
Table 5: Grid-Saver™ Production Implementation Plan
27 In contrast, the energy storage design (able to run 4 hours at 10MW) brings the cost/kWh down to $509/kWh while the cost/kw goes to $2000/kW.
Item Q1 Q2 Q3 Q4 Q1 Q2 Q3 software development using 1MW trailer
continuing software development with UCSD
inverter certification
structural design structural test
264 cell BMS development Enclosure development
2 MW system design fabrication of 2MW system
10MW system design
fabrication, implemtation of 10MW system
57
GLOSSARY Term Definition
ARRA American Recovery and Reinvestment Act
ADS Automatic Dispatch System (issued by ISO)
AES Advanced Energy Storage
AGC Automatic Generation Control
AS Ancillary Services
BCU Battery Control Unit (may consolidate signal from several BMS units to control battery)
BMS Battery Management System
BOS Balance of System
CAISO California Independent System Operator
CaPUC California Public Utility Commission
CALB battery maker China Aviation Lithium Battery
CAN Controller Area Network
CEC California Energy Commission
CES Community Energy System (pg. 45)
DAM Day Ahead Market (pg. 12)
DOE United States Department of Energy
EESAT Electrical Energy Storage and Technologies - annual conference
EISA Energy Independence and Security Act of 2007
EPIC Electric Program investment Charge
EPRI Electric Power Research Institute
ESS Energy Storage System (in this context, electrical energy)
ESTP Energy Systems Test Pad (pg. 26)
FERC Federal Energy Regulatory Commission
58

GA General Atomics
GH GridSaver Housekeeper (pg. 4)
ICU Inverter Charger Unit, also called a bi-directional inverter
IEEE Institute of Electrical and Electronics Engineers
IOU Investor Owned Utility
ISO Independent System Operator, in the USA an operator of an electricity transmission grid
NRE Non-Recurring Engineering
NYCT New York City Transit
PV PhotoVoltaic
RTM Real Time Market (pg. 12)
SC Scheduling Coordinator
SDGE San Diego Gas & Electric
SGIP Small Generation Investment Program (pg. 7)
SOC State of Charge
59

REFERENCES
2020 Strategic Analysis of Energy Storage in California, CEC-500-2011-047 November 2011 http://www.energy.ca.gov/2011publications/CEC-500-2011-047/CEC-500-2011-047.pdf
DOE/EPRI 2013 Electricity Storage Handbook in Collaboration with NRECA, SAND2013-5031
FERC Docket ER11-4353-000, issued November 30,2011 and effective December 1, 2011) http://www.ferc.gov/EventCalendar/Files/20111130145236-ER11-4353-000.pdf
http://online.wsj.com/article/BT-CO-20120202-715811.html Feb. 2012
http://www.caiso.com/Documents/2013AnnualReport-MarketIssue-Performance.pdf
Jim Eyer, Garth Corey, Energy Storage for the Electricity Grid: Benefits and Market Potential Assessment Guide http://prod.sandia.gov/techlib/access-control.cgi/2010/100815.pdf
Methodological Approach for Estimating the Benefits and Costs of Smart Grid Demonstration Projects, EPRI Report 1020342 by Mike Wakefield, January 2010 http://www.smartgridnews.com/artman/uploads/1/1020342EstimateBCSmartGridDemo2010_1_.pdf
60