Embed Size (px)
Citation preview

Utilities and Energy Management Annual Report
Board of Regents Facilities Committee
February 9, 2012

Agenda: What we plan to communicate today:
• Coordinate Campus Updates • Our Principles:
– Reliability • Steam • Electricity • Chilled Water
– Sustainability – Cost Effective
• Questions

Coordinate Campus Update: Duluth (Recently Completed): Steam Systems • Heating Plant and Infrastructure Capacity Study -2009 • Heating Plant Cogeneration Study -2010 • Replace Main Steam Header Piping to Increase Capacity –
2010/2011 • Replace Darland Steam Station – 2011 Chilled Water Systems • Expand Chilled Water Piping Network – 2010/2011 • Chiller Plant Controls Upgrades – 2011 Electrical Systems • New Campus High Voltage Substation – 2009 • Heating Plant Emergency Power Upgrade – 2010 • Replace Campus High Voltage Switches – 2010/2011 • OSHA Arc Flash Safety Analysis – 2010/2011

Coordinate Campus Update: Duluth (Future Upgrades): Steam Systems • Replace Main Steam Header Piping to Increase Capacity – 2012 • Increase Heating Plant Capacity with Additional Boiler – 2015 Chilled Water Systems • Complete Chilled Water System Modeling Study - 2012 • Change Chilled Water Piping Configuration – 2012 • Upgrade Metering and Control Systems – 2012/2013 • Add Chiller Capacity with Additional Chiller Plant – 2012/2013 Electrical Systems • Replace Campus High Voltage Switches – Continuing • OSHA Arc Flash Safety Analysis – Continuing • Campus Fire Alarm Code Upgrades – Continuing • High Voltage Feeder Life Cycle Study - 2013

Coordinate Campus Update: Morris - Renewable Energy: Red Line - Wind Energy Produced
Blue Line - Energy used from Grid
Dec 25 through Jan 24: 67% of campus power from wind, 55% of turbine output sold to grid.

Coordinate Campus Update: Morris: • Electrical
– Projects • Reviewing time of day pricing tariff • Studies show up to 19% reduction in electrical for residence halls • Partnering with Grad students in Electrical Engineering to develop
control strategies for academic buildings – Research
• Working with private Company and UMM Computer Sciences to build web/app development of real time mobile device energy desktop
• Developing infrastructure to do smart grid/consumer behavioral research using real time pricing signals
• Thermal • Running both corn cobs and natural gas. Burned approximately 300
tons of cobs in December

Coordinate Campus Update: Crookston: Undergoing a compliance study and needs assessment on coal fired heating plant. Listed below are some pertinent points in regards to this undertaking:
– What steps need to be taken or modifications made to the current plant to bring the plant into compliance with the current boiler MACT standards
– The first part of the study will focus on mercury emissions and carbon monoxide emissions in the exhaust stream from the coal fired boiler to insure they are under the applicable limits by March of 2014
– What other modifications or improvements are needed to be undertaken to position the Crookston Campus to meet the steam generation and heating needs now and the foreseeable future
– The President’s Climate Commitment initiative will be a cornerstone of this critical activity
– Projects are a joint effort with members of Crookston Facility Management, Twin Cities Energy Management, UMN CPPM along with personnel from Burns and Mac Donnell Consulting Engineers

Coordinate Campus Support: • UMore Park/SAFL
– Wind power project (Design review, commissioning and contracts)
• Crookston – Heating system analysis; production, distribution, fuel sources
and environmental compliance – Water distribution repairs – Design reviews and commissioning
• Morris – Power distribution upgrades – Design reviews and commissioning
• Ash River – NOvA – Final commissioning

Coordinate Campus Update:
FY11 Actual Fuel Costs:
Campus Heating Fuels Electricity
Twin Cities $15,338,213 $28,450,688
Duluth $2,040,276 $2,192,885
Morris $674,095 $590,967
Crookston $299,105 $436,860
Total: $18,351,689 $31,671,400

• Reliability • Steam • Electricity • Chilled Water
• Sustainability • Climate Action Plan • Energy Conservation
• Cost Effective
Twin Cities Campus Principles:

• A new broad based and significant utility master plan was completed in June, 2009
• Secondary plans were detailed for: – Utilities for the Ambulatory Care Clinic – Biomedical Discovery District utility needs – Knoll utility routing for chilled water and power
• A significant update to original plan completed for Minneapolis steam requirements and power production in February, 2011
• Our plans are under constant review!
Utility Master Plans:

Reliability – Steam:

Holiday Steam Demand Control Experiment Reliability – Steam:

• Combined Heat and Power Plant – Update – Recommended in Governor’s Bonding Bill – Engineering and Architecture Firm selected
and began work to design the Plant
Reliability – Steam:

• What we have done – 5,000 feet of 14” steam line added – Replaced 1,000 feet of condensate return
• What we are doing – Rebuilding a drop shaft in Minneapolis
• What we plan to do – Improve ventilation in the deep tunnels and use
the heat as an energy source for buildings – Rebuilding more tunnels in St. Paul – Rebuilding another drop shaft in Minneapolis
Reliability – Steam:

• Distribution upgrades completed: – New connection completed to run from 4th Street to
Fulton Switch Stations – Duct bank completed to feed the additional loads in
the Biomedical Discovery District
Reliability – Electricity:
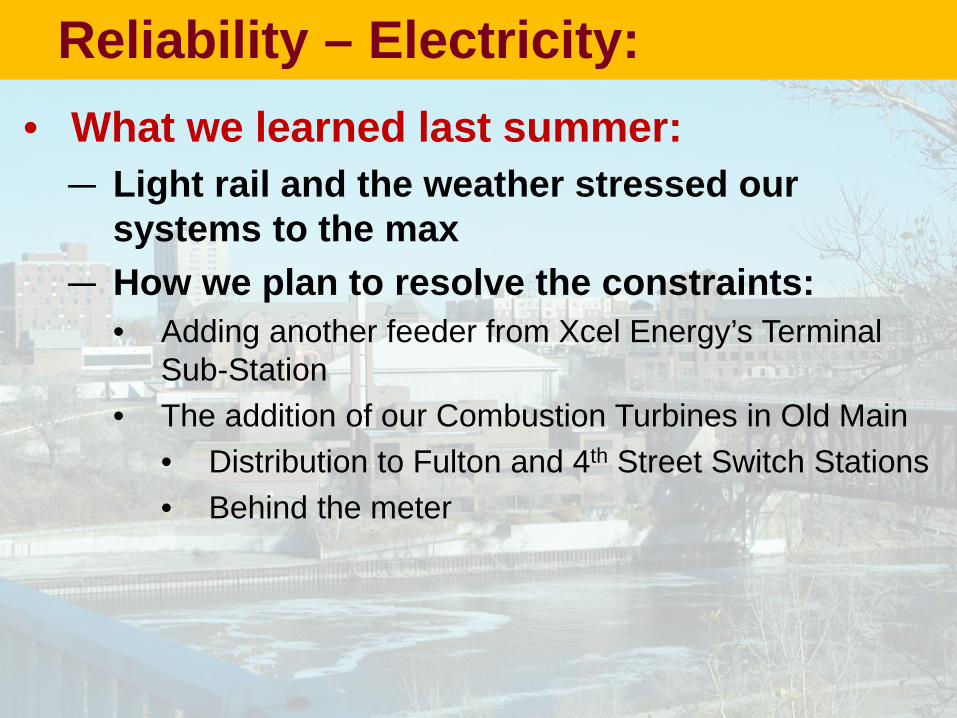
• What we learned last summer: — Light rail and the weather stressed our
systems to the max — How we plan to resolve the constraints:
• Adding another feeder from Xcel Energy’s Terminal Sub-Station
• The addition of our Combustion Turbines in Old Main • Distribution to Fulton and 4th Street Switch Stations • Behind the meter
Reliability – Electricity:

• Past Year Accomplishments: – Health Sciences:
• Installed 1100 tons of steam-driven refrigeration capacity
• Implemented year-round chilled water operations in Health Sciences district
– East Bank: • Expanded east bank chilled water distribution. Annual
savings gained: – Bell Museum: $46,183/year – Nolte Center: $8,373/year – Shepard Labs: $141,066/year – Civil Engineering: $63,532/year – Total Annual Savings from above four projects: $259,154/year
Reliability – Chilled Water:

• Past Year Accomplishments: – West /Bank:
• Developed plans to retire the last three stand-alone cooling systems. When implemented, this will reduce annual energy and maintenance costs by $142,000 annually
– Biomedical Discovery District: • Developing the district chilled water system. Annual savings versus
stand alone systems will exceed $1 million per year
– And more….
Reliability – Chilled Water:

• Next Year’s Plans: – Implement distributed plant operations in the new BDD
district chilled water loop – Complete cooling replacement cost studies for:
• 717 Delaware (19 years beyond useful life) • Bierman Athletic Complex (17 years beyond useful life) • WBOB (reaching end of useful life, but supports mission critical
business and is showing significant signs of aging due to considerable deferred maintenance)
– Expand east bank chilled water production capacity and distribution to connect:
• Physics and Nano • U Rec Center Expansion • 4th Street Housing • Eddy Hall Renovation
– Update the master plans
Reliability – Chilled Water:

Water and Sewer Stewardship Process Improvement
– Storm water modeling for the Biomedical Discovery District was fully developed. Projects built in that district are now evaluated not only for conformance to the University's storm water requirements but also to determine the system capacity impacts. St Paul campus storm water modeling will begin in early 2012.
– A condition assessment of the St Paul water distribution system was performed on the oldest segments of pipe on the campus. The goal of the assessment is to find small leaks and/or capacity constraints in the system to target rehabilitation of the main. This type of targeted approach uses asset management principles to identify the best use of resources for the most life cycle gains.
– Continued to improve the GIS inventory map of the Civil Utilities. Migrated the data to the centrally supported Oracle database. Began to field-collect data for inspections. Began to publish controlled access maps online to project consultants. Began adding drainage area information for the purpose of hydraulic modeling. Using GIS is a highly efficient way to manage these assets.
Reliability – Infrastructure:

Reliability – Infrastructure:

Reliability – Infrastructure:

Reliability – Infrastructure:

Reliability – Infrastructure:

Reliability – Infrastructure:
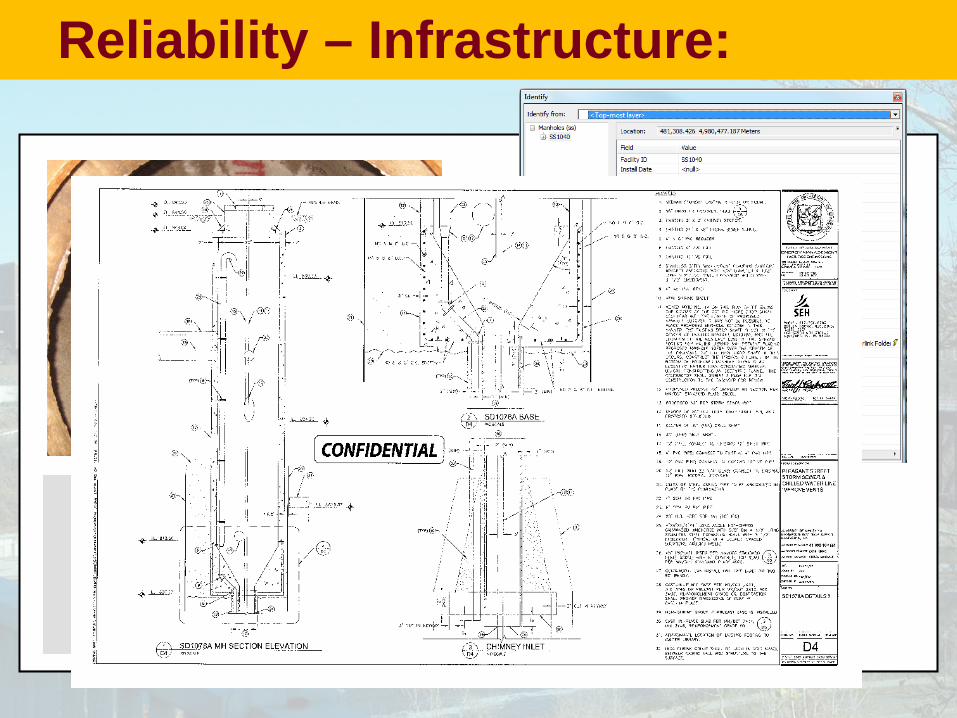
Reliability – Infrastructure:

Reliability – Infrastructure:
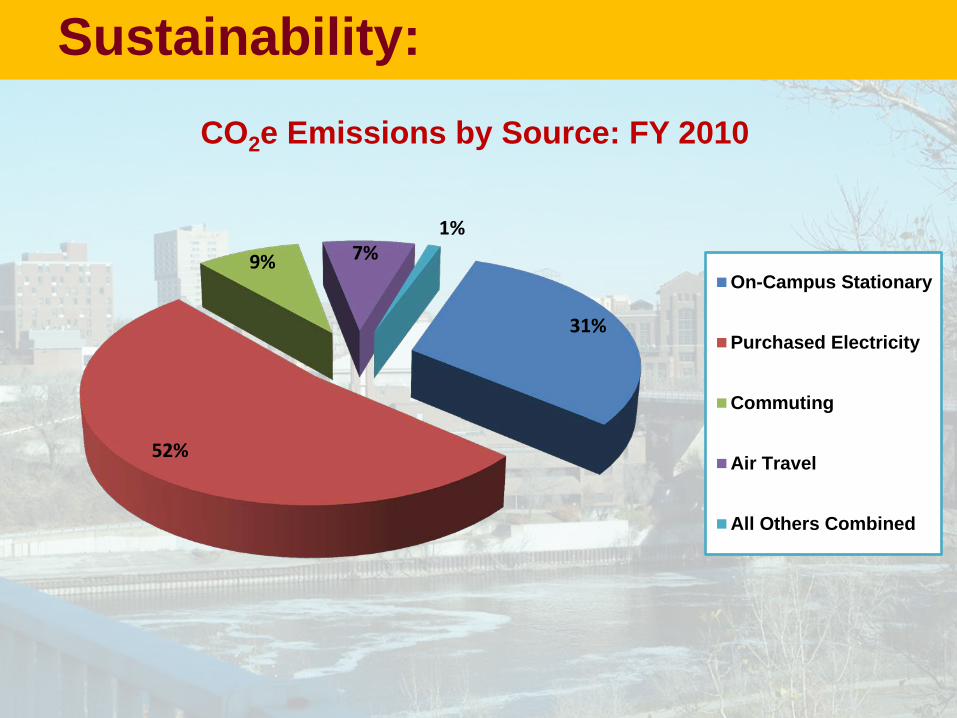
31%
52%
9% 7% 1%
CO2e Emissions by Source: FY 2010
On-Campus Stationary
Purchased Electricity
Commuting
Air Travel
All Others Combined
Sustainability:

Reducing Emissions
• Climate Action Plan –10 Energy Related Strategies –Implemented Over 10 Years –~50% Reduction in CO2
Sustainability:

Negawatts… not Megawatts • Strategy Highlights for 2011 to 2016:
– Computer Energy Efficiency – Lighting Efficiency – Building Recommissioning – Sustainable Building – Laboratory Energy Efficiency – Reduce Campus Size – Renewable Energy Pilot Projects
• CO2 Reduction by 2016: 187,500 MT
Sustainability:
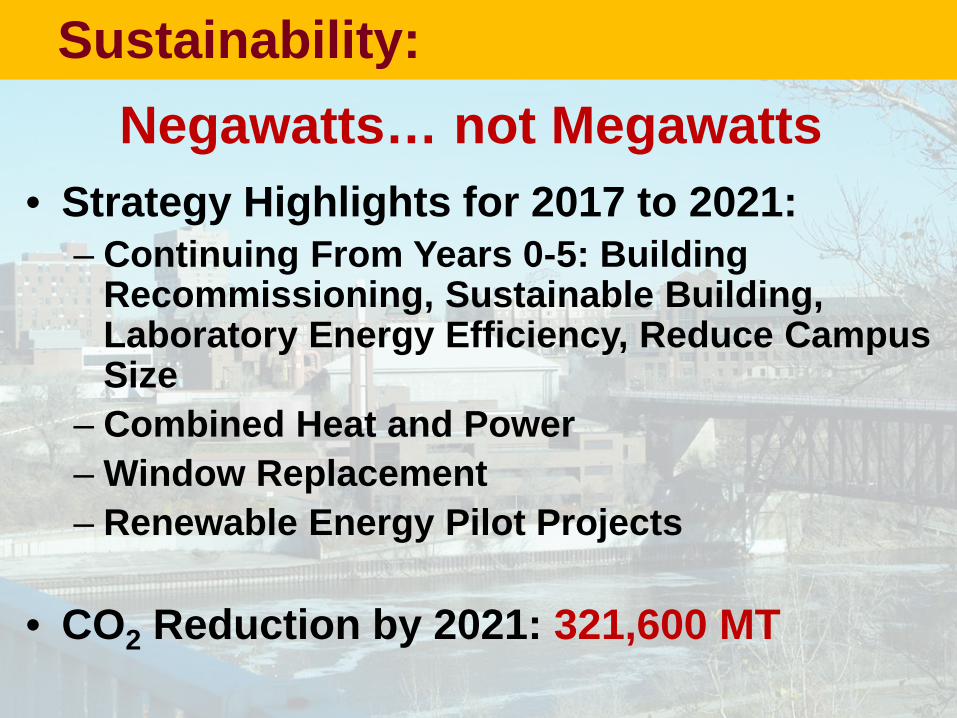
• Strategy Highlights for 2017 to 2021: – Continuing From Years 0-5: Building
Recommissioning, Sustainable Building, Laboratory Energy Efficiency, Reduce Campus Size
– Combined Heat and Power – Window Replacement – Renewable Energy Pilot Projects
• CO2 Reduction by 2021: 321,600 MT
Sustainability: Negawatts… not Megawatts

Energy Conservation & It All Adds Up FY10: Saved $2.6 M & 29,000 tons of CO2
FY11: Saved $2 M & 22,000 tons of CO2
Initiatives Include: • Building Re-Commissioning • Building Hours & Fan Schedules • Lab HVAC Protocols • Green IT • Classroom Utilization • Cultural Campaign
Sustainability:

New Photo Voltaic Solar Array at University Plaza
Sustainability:
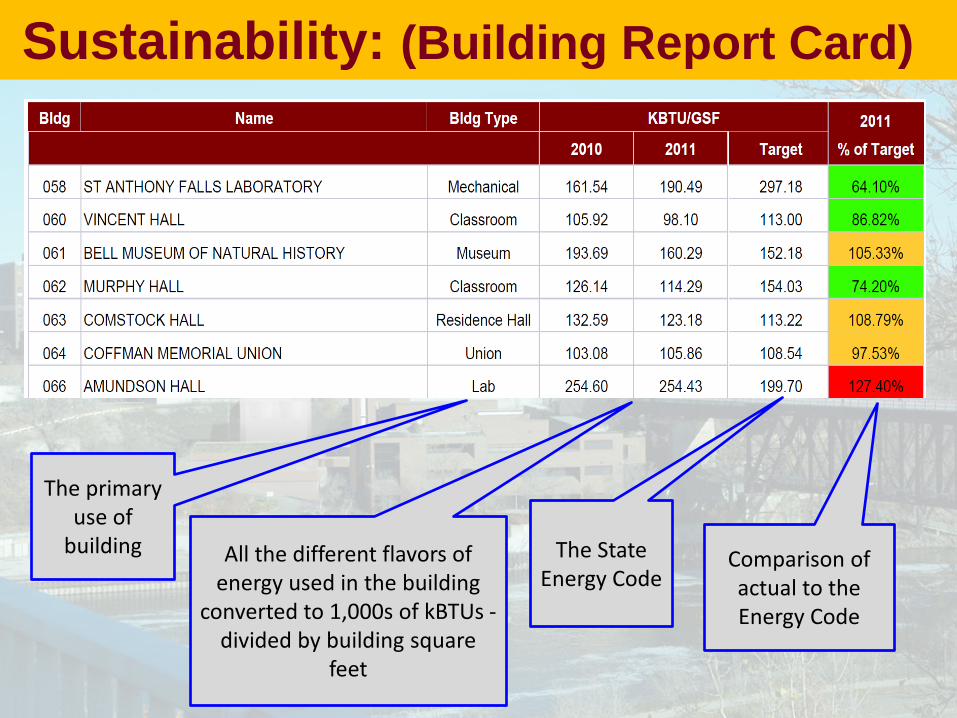
The primary use of
building All the different flavors of energy used in the building
converted to 1,000s of kBTUs - divided by building square
feet
The State Energy Code
Comparison of actual to the Energy Code
Sustainability: (Building Report Card)

Sustainability: (Building Report Card)

Sustainability: Actual vs. “Expected” Consumption

Sustainability: Actual vs. “Expected” Consumption

Steam Efficiency Over Time
• Since 1996: – Campus increased by
3.7M SqFt – Steam Efficiency
increased by 37% – Cumulative savings
due to efficiency gains = $76M (annualized for 2011 = $9.2M)
-
2,000
4,000
6,000
8,000
10,000
12,000
14,000
16,000
17
18
19
20
21
22
23
1996
1997
1998
1999
2000
2001
2002
2003
2004
2005
2006
2007
2008
2009
2010
2011
MM
BTU
/GSF
Twin
City
Cam
pus:
Mill
ion
Gro
ss S
quar
e Fe
et
Mill
ions
Steam Efficiency
Gross Sq Feet (000's) MMBtu/GSF
Cost Effective:

Cost Control: Energy Consumption vs. Peers
FM Peers (Sightlines) Industry (IFMA)
Energy $/GSF $2.21 $2.60 $2.38
Consumption BTU/GSF 171,000 225,000 94,000
Cost Effective:

Continuing to Advance the Utility Master Plan
Questions