Embed Size (px)
Citation preview
Financial Analysis of Usmania Financial Analysis of Usmania Glass Sheet Factory LimitedGlass Sheet Factory Limited
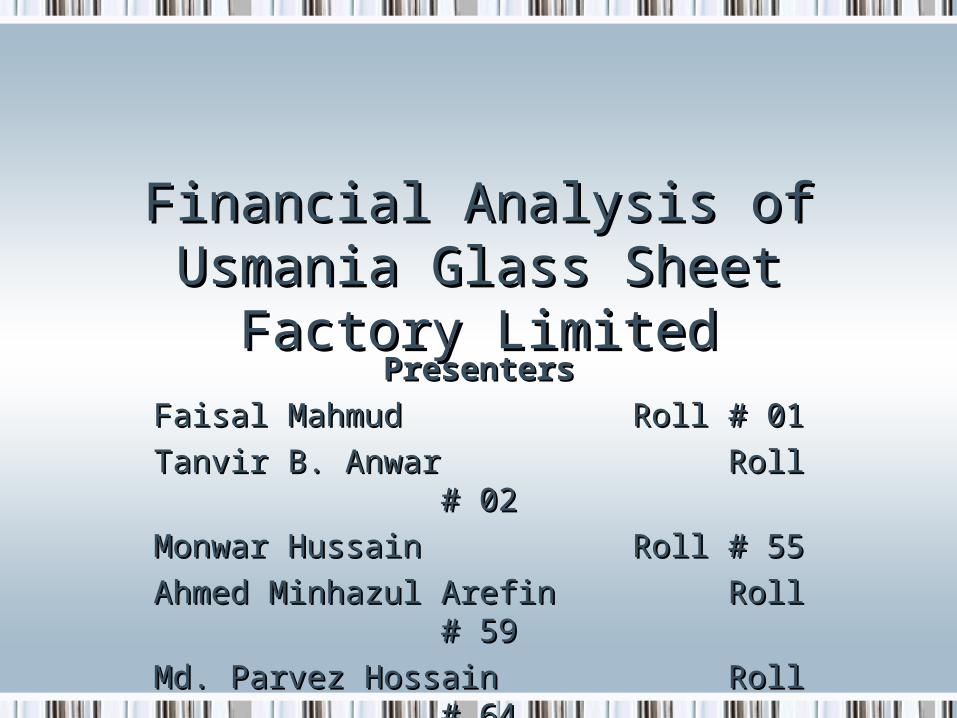
Financial Analysis of Usmania Financial Analysis of Usmania Glass Sheet Factory LimitedGlass Sheet Factory Limited
PresentersPresenters
Faisal MahmudFaisal Mahmud Roll # 01Roll # 01
Tanvir B. AnwarTanvir B. Anwar Roll # 02Roll # 02
Monwar HussainMonwar Hussain Roll # 55Roll # 55
Ahmed Minhazul ArefinAhmed Minhazul Arefin Roll # 59Roll # 59
Md. Parvez HossainMd. Parvez Hossain Roll Roll # 64# 64
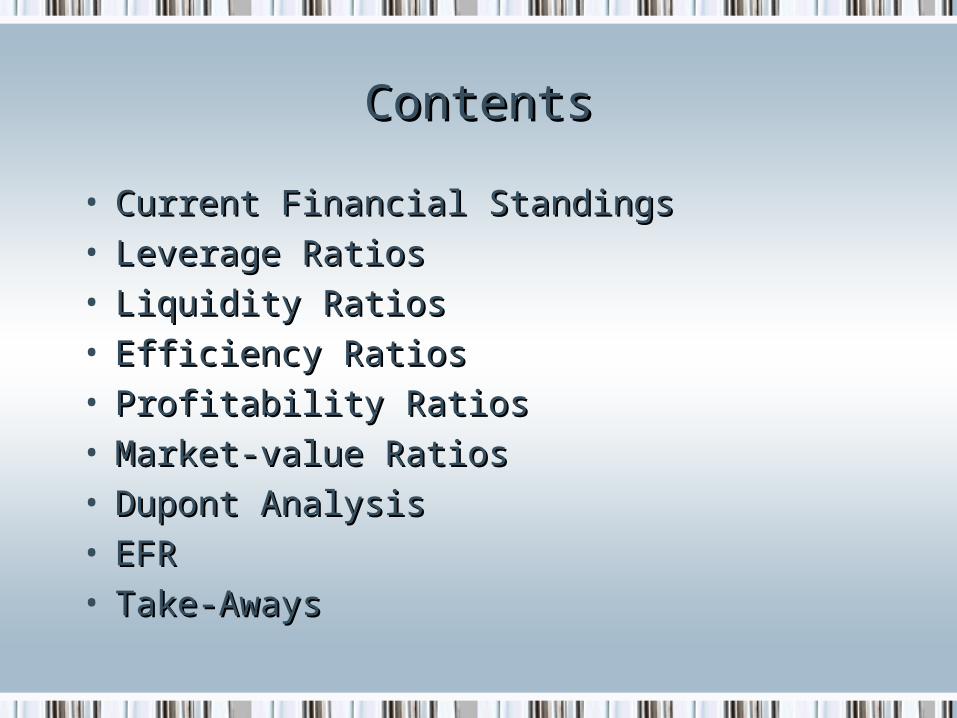
ContentsContents
• Current Financial Standings Current Financial Standings • Leverage RatiosLeverage Ratios• Liquidity RatiosLiquidity Ratios• Efficiency RatiosEfficiency Ratios• Profitability RatiosProfitability Ratios• Market-value RatiosMarket-value Ratios• Dupont AnalysisDupont Analysis• EFREFR• Take-AwaysTake-Aways
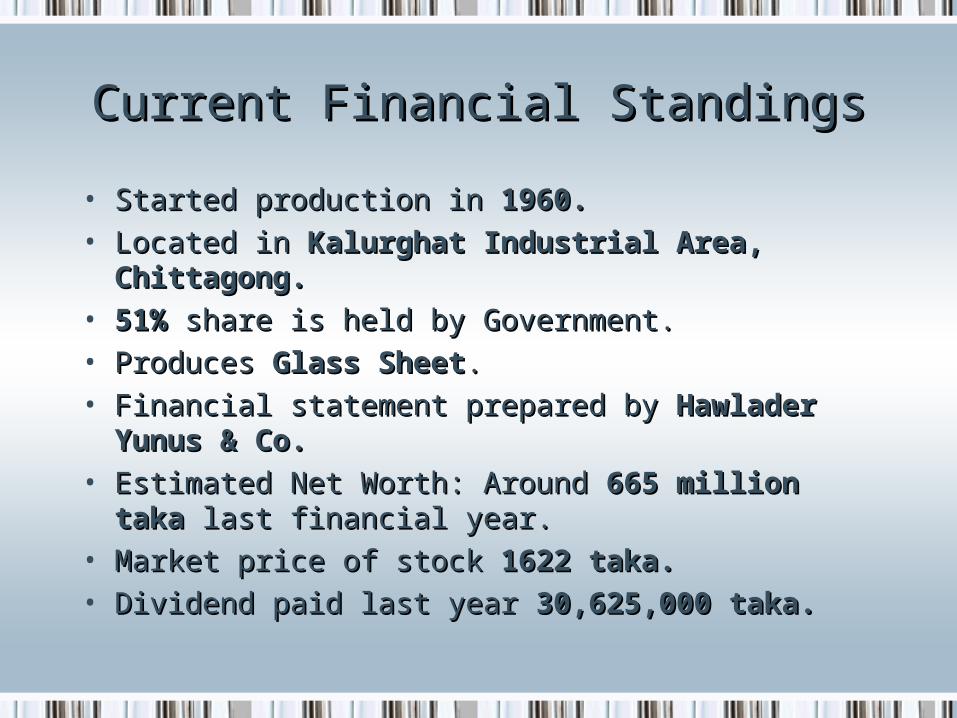
Current Financial StandingsCurrent Financial Standings
• Started production in Started production in 1960.1960.• Located in Located in Kalurghat Industrial Area, Kalurghat Industrial Area,
Chittagong.Chittagong.• 51%51% share is held by Government. share is held by Government.• Produces Produces Glass SheetGlass Sheet..• Financial statement prepared by Financial statement prepared by Hawlader Hawlader
Yunus & Co.Yunus & Co.• Estimated Net Worth: Around Estimated Net Worth: Around 665 million taka665 million taka
last financial year.last financial year.• Market price of stock Market price of stock 1622 taka.1622 taka.• Dividend paid last year Dividend paid last year 30,625,000 taka.30,625,000 taka.
Leverage RatiosLeverage Ratios
• Debt RatioDebt Ratio• Debt Ratio (Including Short Term)Debt Ratio (Including Short Term)• Debt-Equity RatioDebt-Equity Ratio• Times-Interest EarnedTimes-Interest Earned
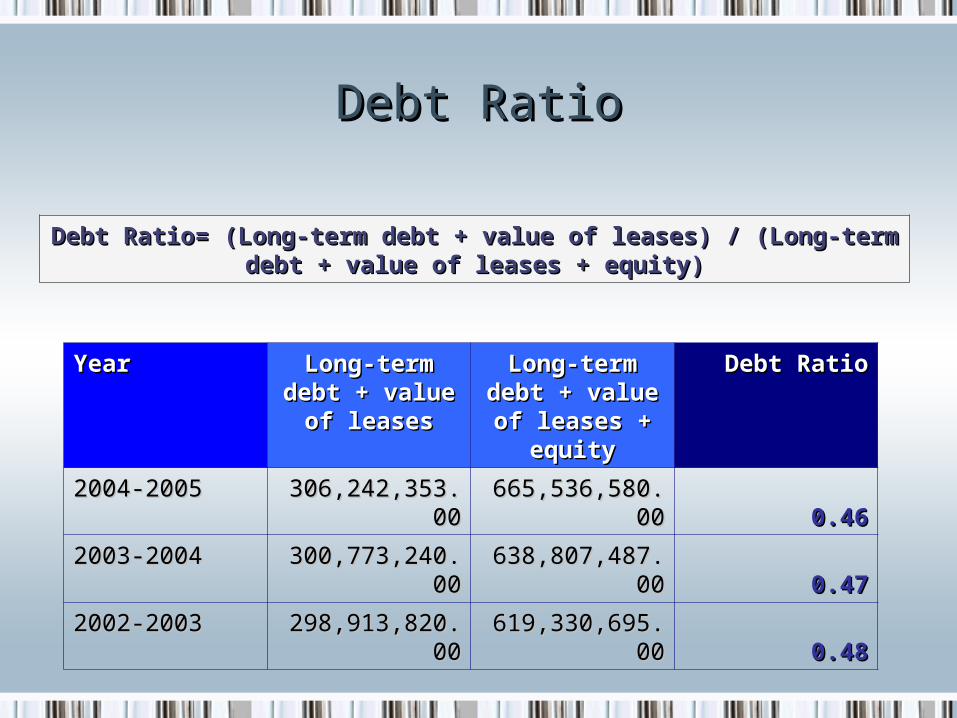
Debt RatioDebt Ratio
Debt Ratio= (Long-term debt + value of leases) / (Long-term debt + value Debt Ratio= (Long-term debt + value of leases) / (Long-term debt + value of leases + equity)of leases + equity)
YearYear Long-term debt Long-term debt + value of + value of
leasesleases
Long-term debt Long-term debt + value of + value of
leases + equityleases + equity
Debt RatioDebt Ratio
2004-20052004-2005 306,242,353.0306,242,353.000
665,536,580.0665,536,580.000 0.460.46
2003-20042003-2004 300,773,240.0300,773,240.000
638,807,487.0638,807,487.000 0.470.47
2002-20032002-2003 298,913,820.0298,913,820.000
619,330,695.0619,330,695.000 0.480.48
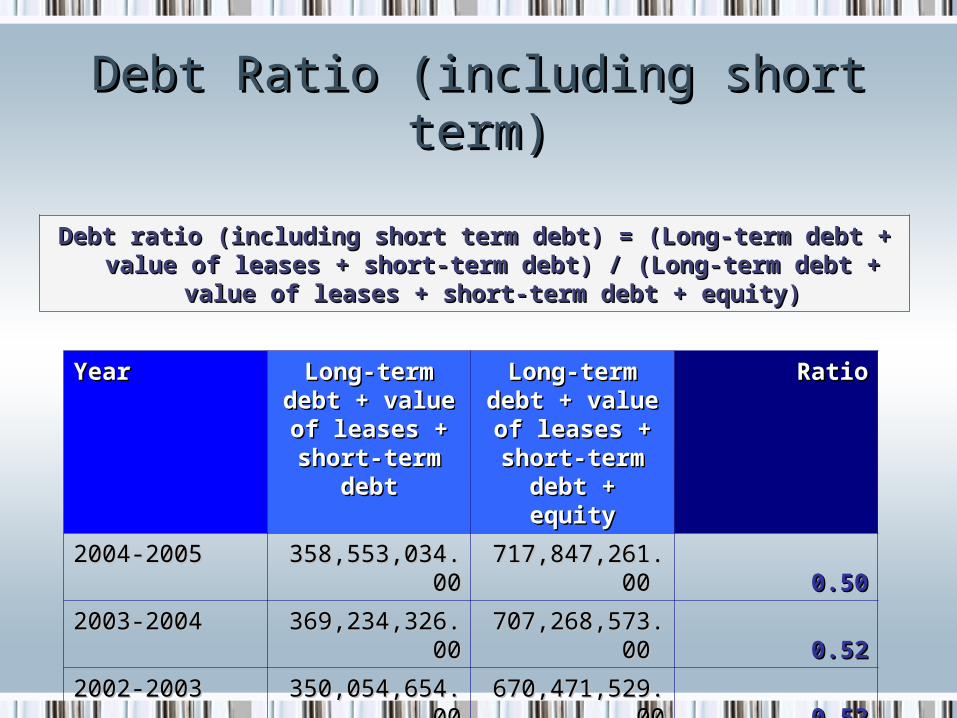
Debt Ratio (including short term)Debt Ratio (including short term)
Debt ratio (including short term debt) = (Long-term debt + value of leases Debt ratio (including short term debt) = (Long-term debt + value of leases + short-term debt) / (Long-term debt + value of leases + short-term debt + short-term debt) / (Long-term debt + value of leases + short-term debt
+ equity)+ equity)
YearYear Long-term debt Long-term debt + value of + value of
leases + short-leases + short-term debtterm debt
Long-term debt Long-term debt + value of + value of
leases + short-leases + short-term debt + term debt +
equityequity
RatioRatio
2004-20052004-2005 358,553,034.0358,553,034.000
717,847,261.0717,847,261.00 0 0.500.50
2003-20042003-2004 369,234,326.0369,234,326.000
707,268,573.0707,268,573.00 0 0.520.52
2002-20032002-2003 350,054,654.0350,054,654.000
670,471,529.0670,471,529.000 0.520.52
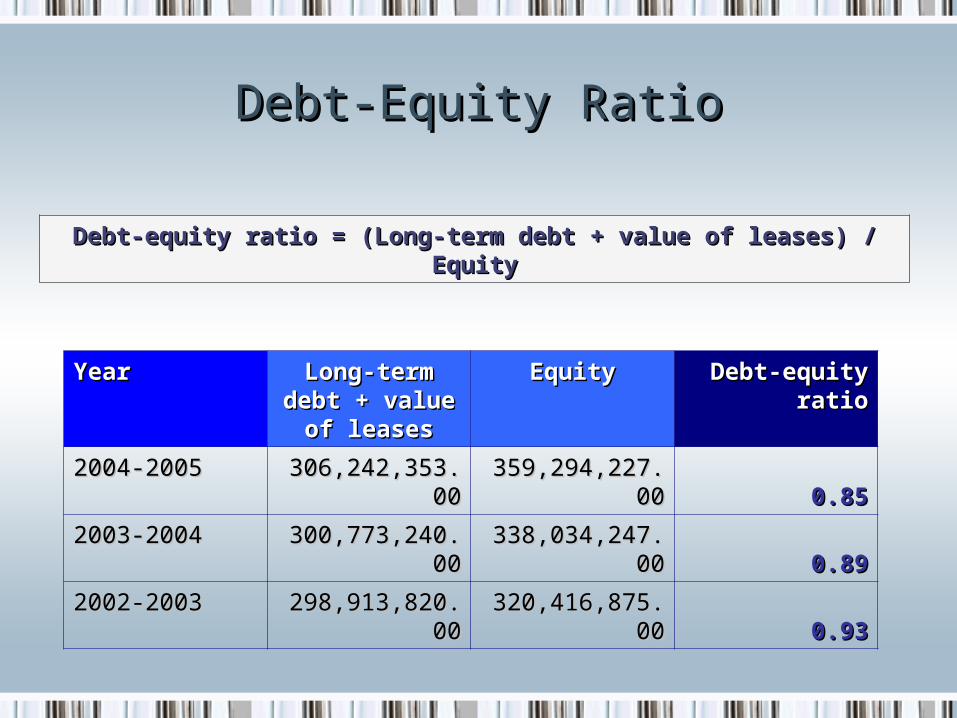
Debt-Equity RatioDebt-Equity Ratio
Debt-equity ratio = (Long-term debt + value of leases) / EquityDebt-equity ratio = (Long-term debt + value of leases) / Equity
YearYear Long-term Long-term debt + value debt + value
of leasesof leases
EquityEquity Debt-equityDebt-equityratioratio
2004-20052004-2005 306,242,353.0306,242,353.000
359,294,227.0359,294,227.000 0.850.85
2003-20042003-2004 300,773,240.0300,773,240.000
338,034,247.0338,034,247.000 0.890.89
2002-20032002-2003 298,913,820.0298,913,820.000
320,416,875.0320,416,875.000 0.930.93
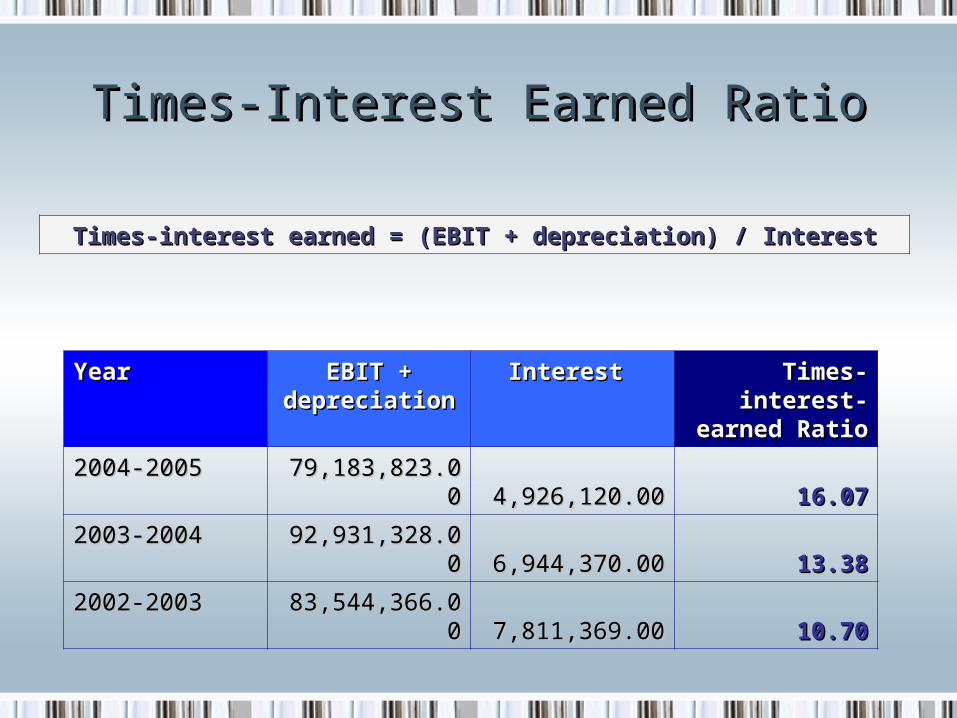
Times-Interest Earned RatioTimes-Interest Earned Ratio
Times-interest earned = (EBIT + depreciation) / InterestTimes-interest earned = (EBIT + depreciation) / Interest
YearYear EBIT + EBIT + depreciation depreciation
Interest Interest Times-Times-interest-interest-
earned Ratioearned Ratio
2004-20052004-2005 79,183,823.0079,183,823.00 4,926,120.004,926,120.00 16.0716.07
2003-20042003-2004 92,931,328.0092,931,328.00 6,944,370.006,944,370.00 13.3813.38
2002-20032002-2003 83,544,366.0083,544,366.00 7,811,369.007,811,369.00 10.7010.70
Liquidity RatiosLiquidity Ratios
• Net Working Capital to Total AssetsNet Working Capital to Total Assets• Current RatioCurrent Ratio• Quick RatioQuick Ratio• Cash RatioCash Ratio• Interval MeasureInterval Measure
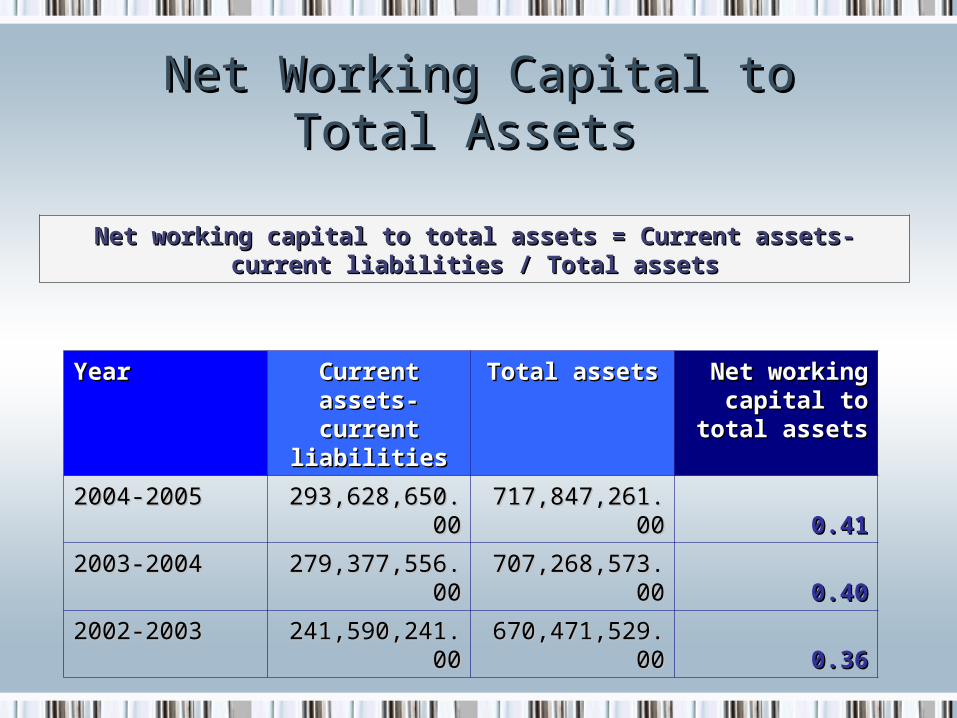
Net Working Capital to Total Net Working Capital to Total Assets Assets
Net working capital to total assets = Current assets-current liabilities / Net working capital to total assets = Current assets-current liabilities / Total assetsTotal assets
YearYear Current assets-Current assets-current current
liabilitiesliabilities
Total assetsTotal assets Net working Net working capital to total capital to total
assetsassets
2004-20052004-2005293,628,650.00293,628,650.00
717,847,261.0717,847,261.000 0.410.41
2003-20042003-2004279,377,556.00279,377,556.00
707,268,573.0707,268,573.000 0.400.40
2002-20032002-2003241,590,241.00241,590,241.00
670,471,529.0670,471,529.000 0.360.36
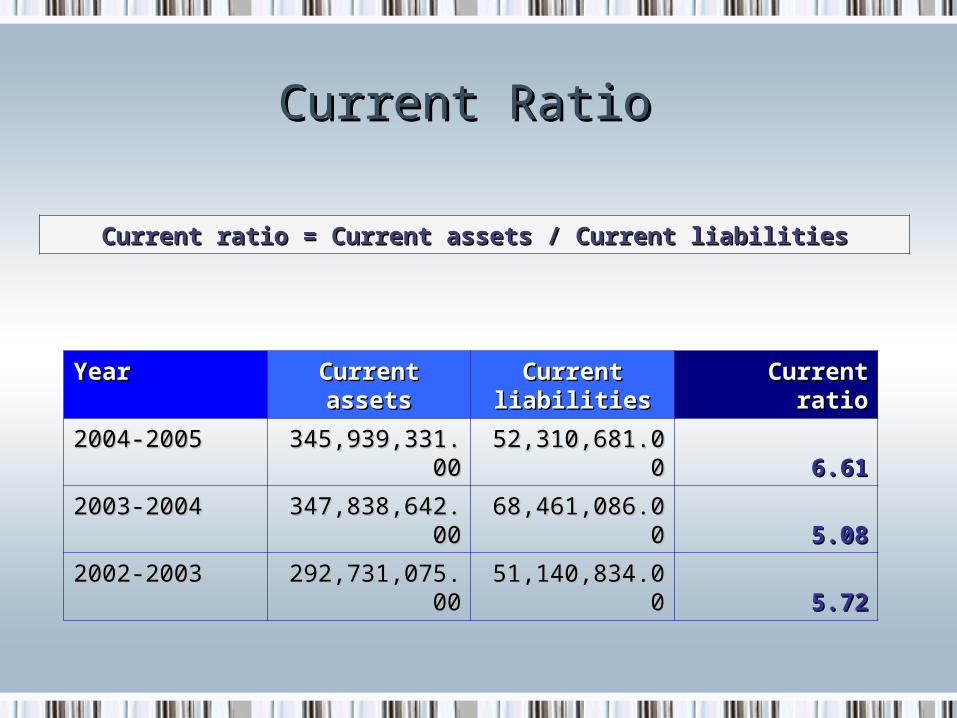
Current Ratio Current Ratio
Current ratio = Current assets / Current liabilitiesCurrent ratio = Current assets / Current liabilities
YearYear Current assetsCurrent assets Current Current liabilitiesliabilities
Current ratioCurrent ratio
2004-20052004-2005 345,939,331.00345,939,331.00 52,310,681.0052,310,681.00 6.616.61
2003-20042003-2004 347,838,642.00347,838,642.00 68,461,086.0068,461,086.00 5.085.08
2002-20032002-2003 292,731,075.00292,731,075.00 51,140,834.0051,140,834.00 5.725.72
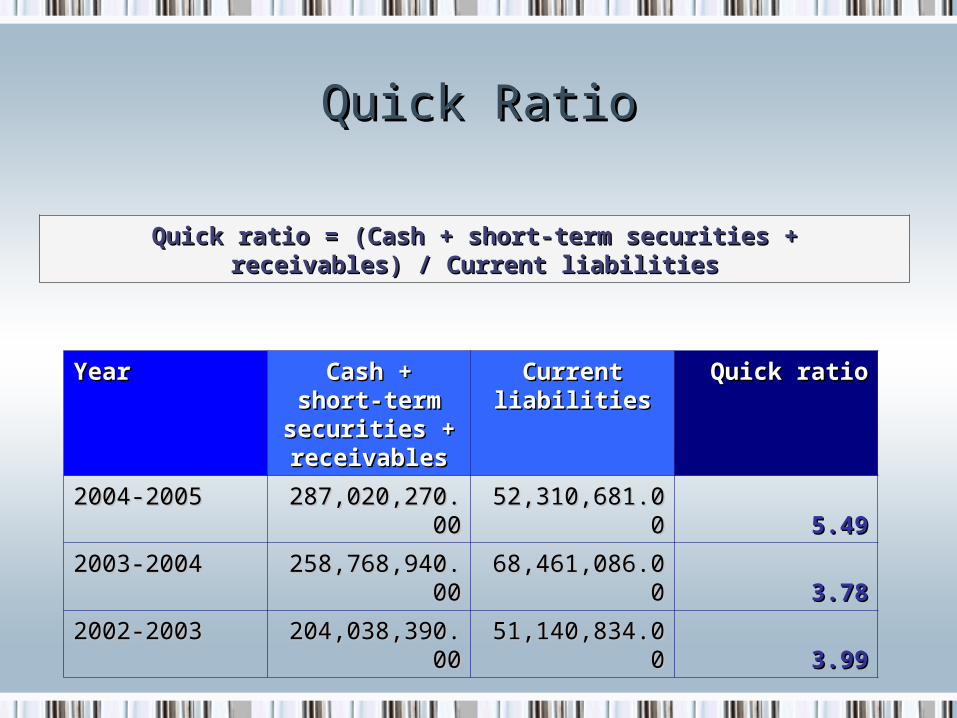
Quick RatioQuick Ratio
Quick ratio = (Cash + short-term securities + receivables) / Current Quick ratio = (Cash + short-term securities + receivables) / Current liabilitiesliabilities
YearYear Cash + short-Cash + short-term securities term securities + receivables+ receivables
Current Current liabilitiesliabilities
Quick ratioQuick ratio
2004-20052004-2005 287,020,270.00287,020,270.00 52,310,681.0052,310,681.00 5.495.49
2003-20042003-2004 258,768,940.00258,768,940.00 68,461,086.0068,461,086.00 3.783.78
2002-20032002-2003 204,038,390.00204,038,390.00 51,140,834.0051,140,834.00 3.993.99
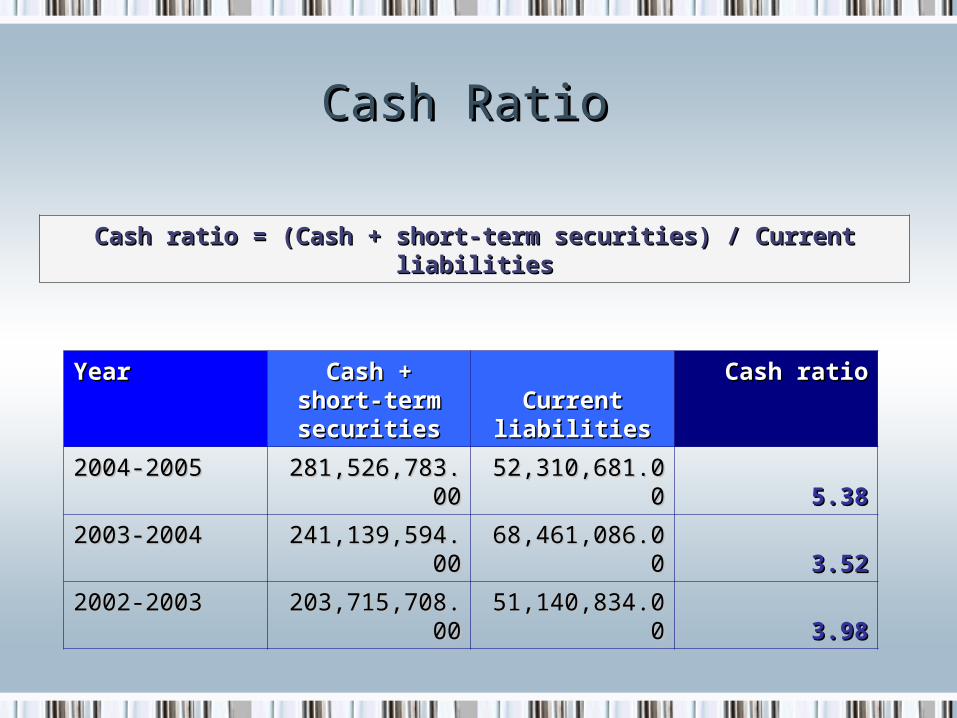
Cash Ratio Cash Ratio
Cash ratio = (Cash + short-term securities) / Current liabilitiesCash ratio = (Cash + short-term securities) / Current liabilities
YearYear Cash + short-Cash + short-term term
securitiessecuritiesCurrent Current
liabilitiesliabilities
Cash ratioCash ratio
2004-20052004-2005 281,526,783.0281,526,783.000 52,310,681.0052,310,681.00 5.385.38
2003-20042003-2004 241,139,594.0241,139,594.000 68,461,086.0068,461,086.00 3.523.52
2002-20032002-2003 203,715,708.0203,715,708.000 51,140,834.0051,140,834.00 3.983.98
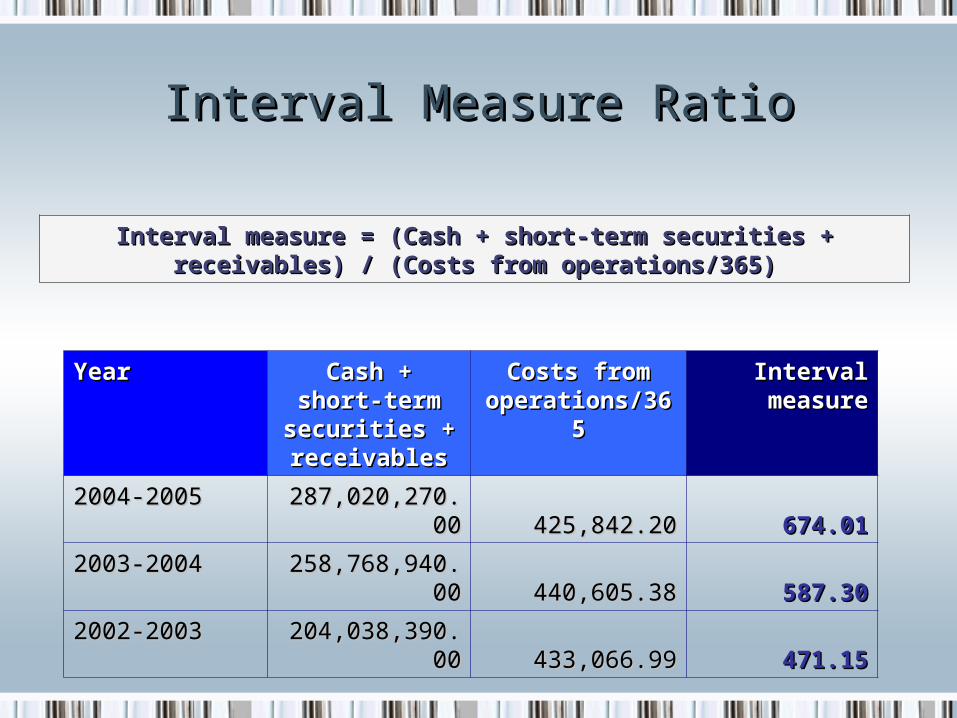
Interval Measure RatioInterval Measure Ratio
Interval measure = (Cash + short-term securities + receivables) / (Costs Interval measure = (Cash + short-term securities + receivables) / (Costs from operations/365)from operations/365)
YearYear Cash + short-Cash + short-term term
securities + securities + receivablesreceivables
Costs from Costs from operations/36operations/36
55
Interval Interval measuremeasure
2004-20052004-2005 287,020,270.0287,020,270.000 425,842.20425,842.20 674.01674.01
2003-20042003-2004 258,768,940.0258,768,940.000 440,605.38440,605.38 587.30587.30
2002-20032002-2003 204,038,390.0204,038,390.000 433,066.99433,066.99 471.15471.15
Efficiency RatiosEfficiency Ratios
• Sales to Asset RatioSales to Asset Ratio• Sales to Net Working CapitalSales to Net Working Capital• Days in InventoryDays in Inventory• Inventory TurnoverInventory Turnover• Average Collection PeriodAverage Collection Period• Receivables TurnoverReceivables Turnover
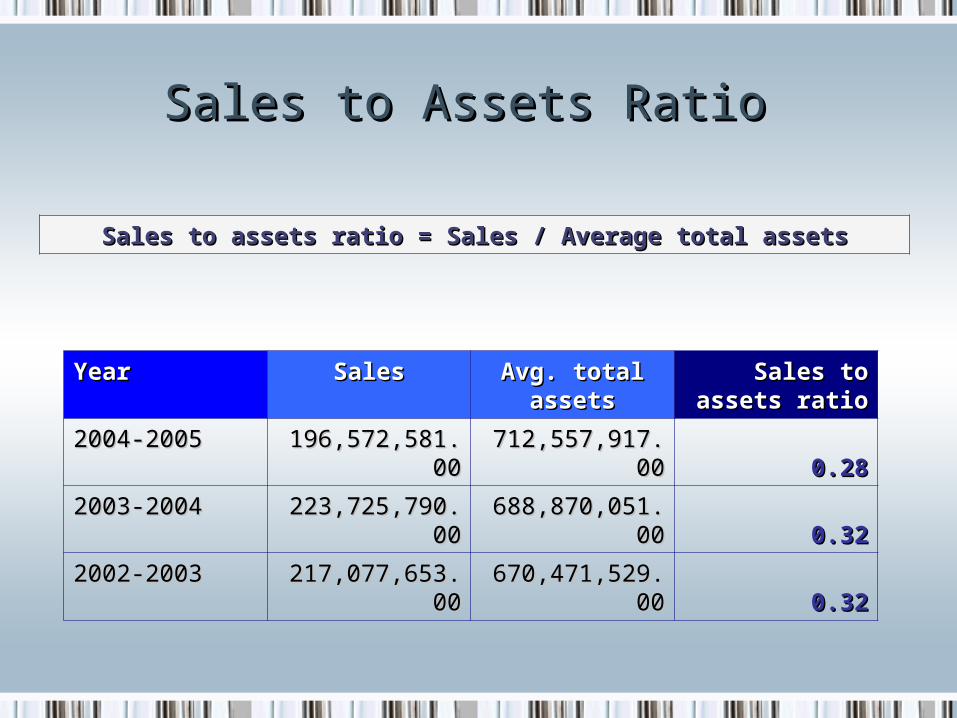
Sales to Assets Ratio Sales to Assets Ratio
Sales to assets ratio = Sales / Average total assetsSales to assets ratio = Sales / Average total assets
YearYear SalesSales Avg. total Avg. total assetsassets
Sales to Sales to assets ratioassets ratio
2004-20052004-2005 196,572,581.0196,572,581.000
712,557,917.0712,557,917.000 0.280.28
2003-20042003-2004 223,725,790.0223,725,790.000
688,870,051.0688,870,051.000 0.320.32
2002-20032002-2003 217,077,653.0217,077,653.000
670,471,529.0670,471,529.000 0.320.32
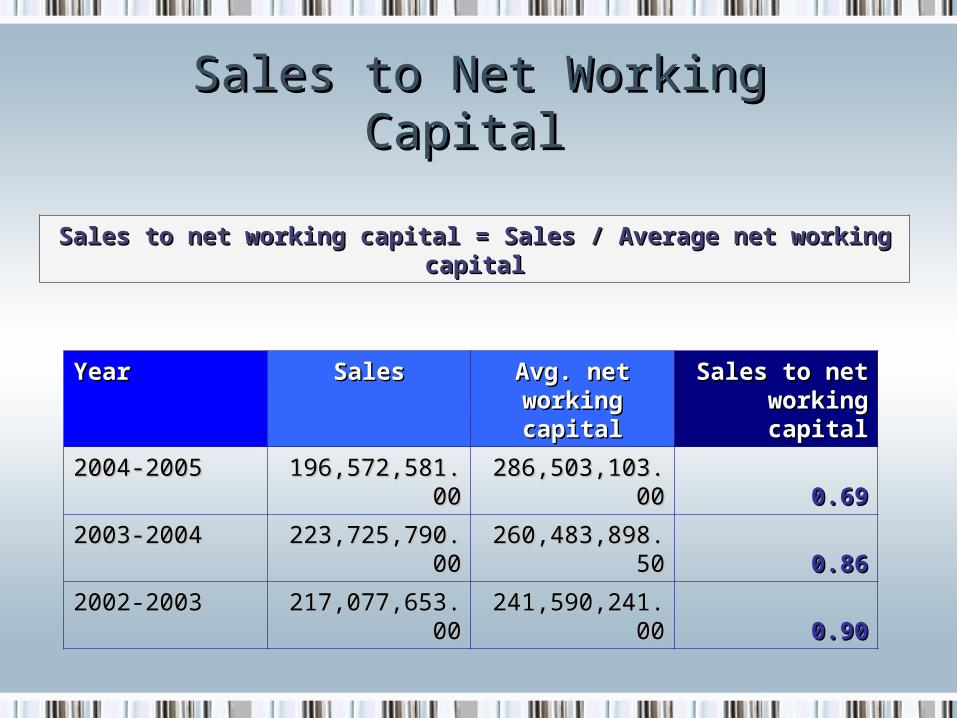
Sales to Net Working Capital Sales to Net Working Capital
Sales to net working capital = Sales / Average net working capitalSales to net working capital = Sales / Average net working capital
YearYear SalesSales Avg. net Avg. net working working capitalcapital
Sales to net Sales to net working working
capitalcapital
2004-20052004-2005 196,572,581.0196,572,581.000
286,503,103.0286,503,103.000 0.690.69
2003-20042003-2004 223,725,790.0223,725,790.000
260,483,898.5260,483,898.500 0.860.86
2002-20032002-2003 217,077,653.0217,077,653.000
241,590,241.0241,590,241.000 0.900.90
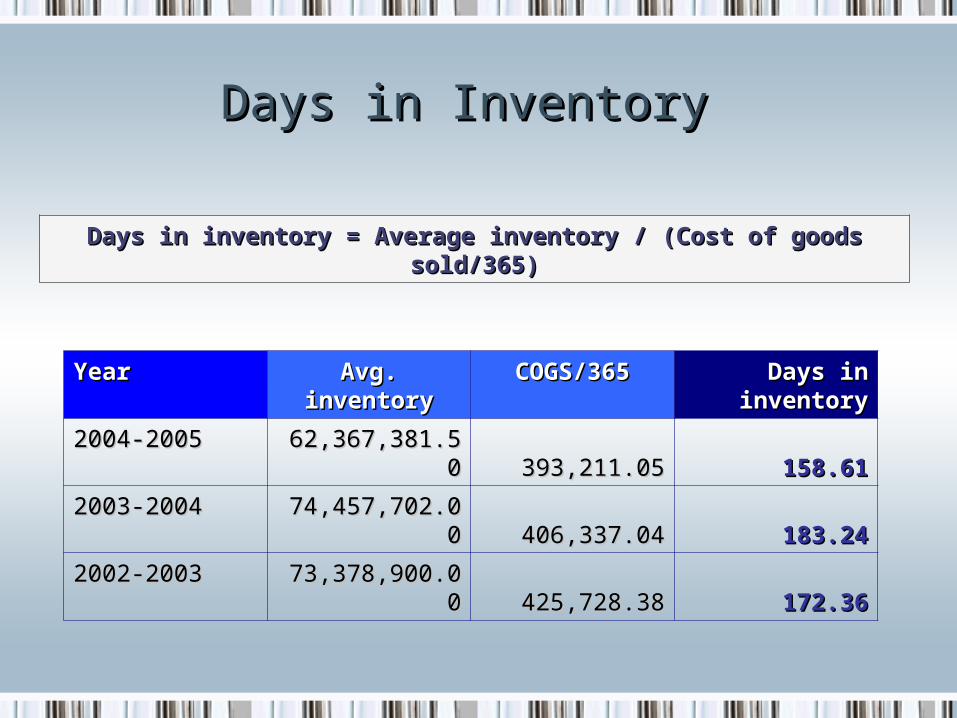
Days in Inventory Days in Inventory
Days in inventory = Average inventory / (Cost of goods sold/365)Days in inventory = Average inventory / (Cost of goods sold/365)
YearYear Avg. Avg. inventoryinventory
COGS/365COGS/365 Days in Days in inventoryinventory
2004-20052004-2005 62,367,381.5062,367,381.50 393,211.05393,211.05 158.61158.61
2003-20042003-2004 74,457,702.0074,457,702.00 406,337.04406,337.04 183.24183.24
2002-20032002-2003 73,378,900.0073,378,900.00 425,728.38425,728.38 172.36172.36
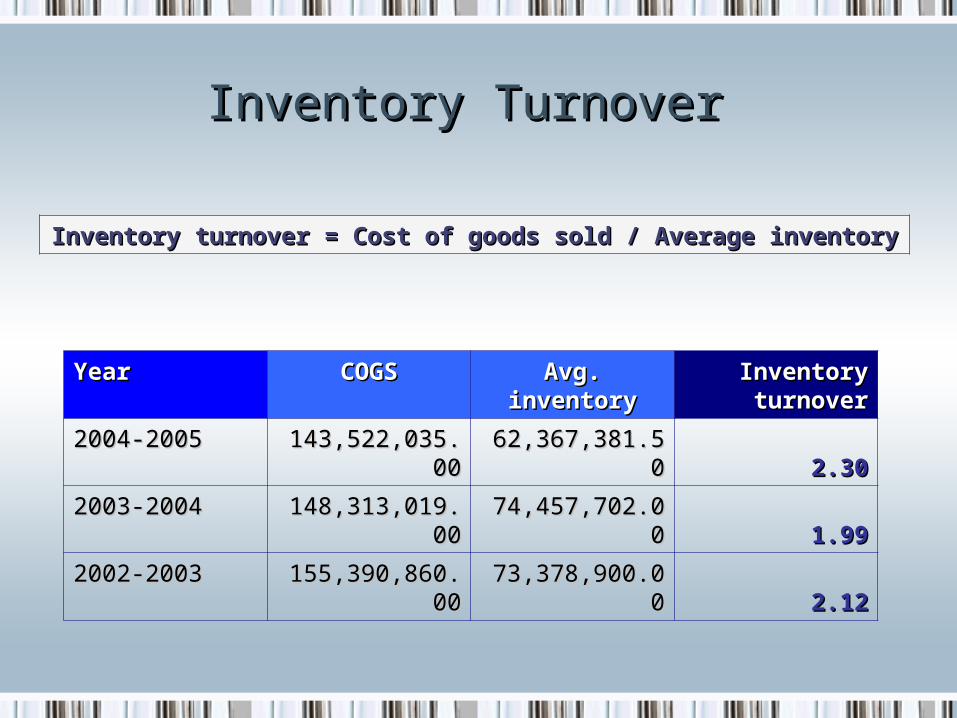
Inventory Turnover Inventory Turnover
Inventory turnover = Cost of goods sold / Average inventory Inventory turnover = Cost of goods sold / Average inventory
YearYear COGSCOGS Avg. Avg. inventoryinventory
Inventory Inventory turnoverturnover
2004-20052004-2005 143,522,035.0143,522,035.000 62,367,381.5062,367,381.50 2.302.30
2003-20042003-2004 148,313,019.0148,313,019.000 74,457,702.0074,457,702.00 1.991.99
2002-20032002-2003 155,390,860.0155,390,860.000 73,378,900.0073,378,900.00 2.122.12
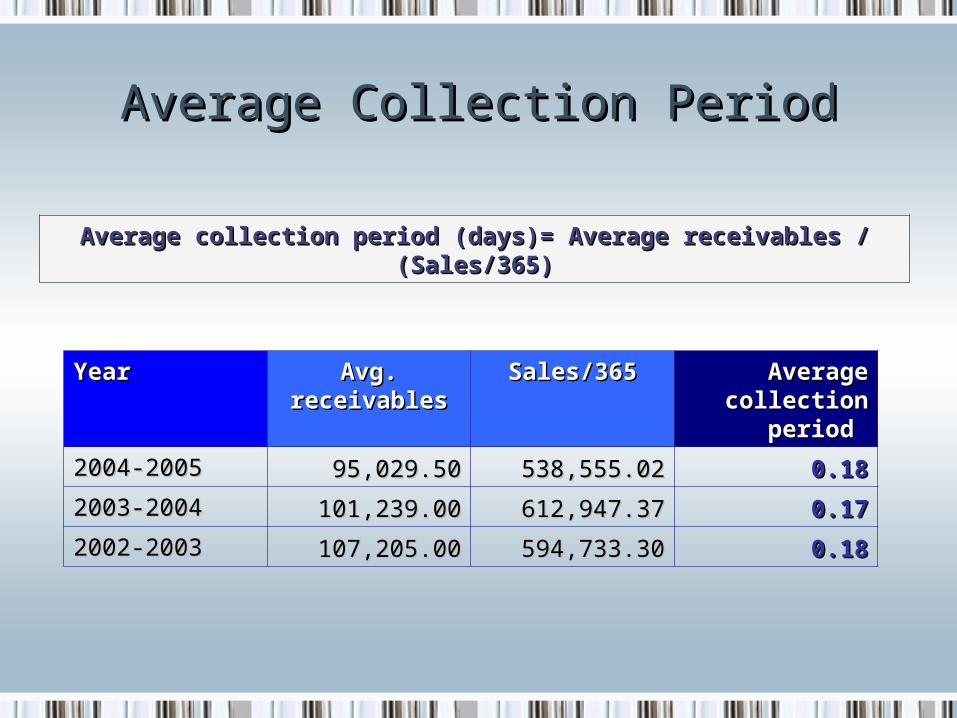
Average Collection PeriodAverage Collection Period
Average collection period (days)= Average receivables / (Sales/365)Average collection period (days)= Average receivables / (Sales/365)
YearYear Avg. Avg. receivablesreceivables
Sales/365Sales/365 Average Average collection collection
period period
2004-20052004-2005 95,029.5095,029.50 538,555.02538,555.02 0.180.18
2003-20042003-2004 101,239.00101,239.00 612,947.37612,947.37 0.170.17
2002-20032002-2003 107,205.00107,205.00 594,733.30594,733.30 0.180.18
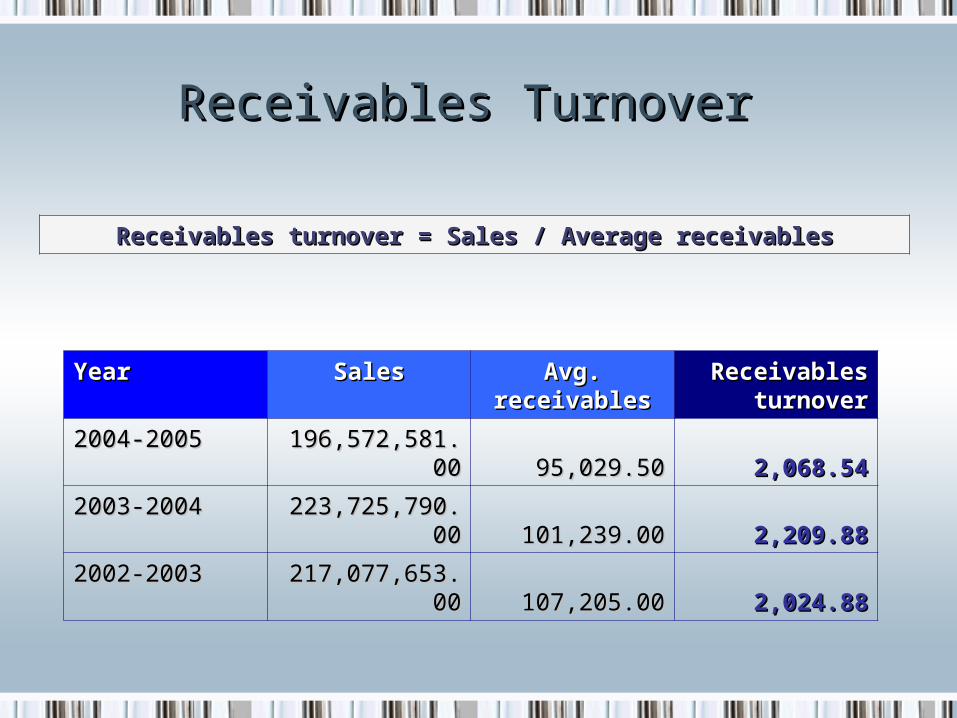
Receivables Turnover Receivables Turnover
Receivables turnover = Sales / Average receivablesReceivables turnover = Sales / Average receivables
YearYear SalesSales Avg. Avg. receivablesreceivables
Receivables Receivables turnoverturnover
2004-20052004-2005 196,572,581.0196,572,581.000 95,029.5095,029.50 2,068.542,068.54
2003-20042003-2004 223,725,790.0223,725,790.000 101,239.00101,239.00 2,209.882,209.88
2002-20032002-2003 217,077,653.0217,077,653.000 107,205.00107,205.00 2,024.882,024.88
Profitability RatiosProfitability Ratios
• Net Profit Margin Ratio Net Profit Margin Ratio • Return on Assets Ratio Return on Assets Ratio • Return on Equity RatioReturn on Equity Ratio• Payout Ratio Payout Ratio
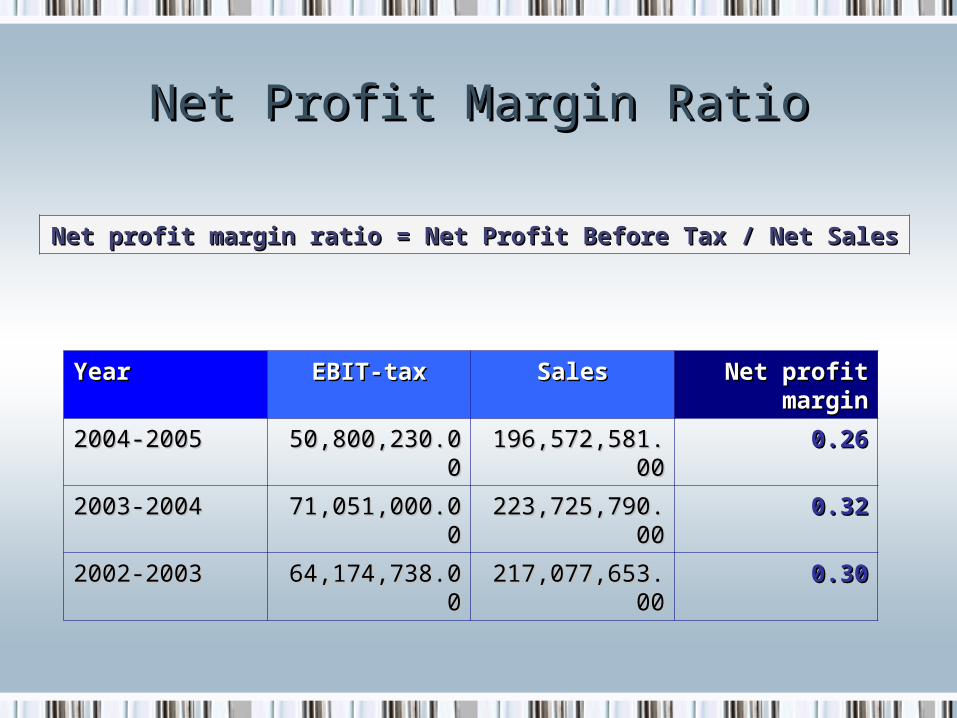
Net Profit Margin RatioNet Profit Margin Ratio
Net profit margin ratio = Net Profit Before Tax / Net SalesNet profit margin ratio = Net Profit Before Tax / Net Sales
YearYear EBIT-taxEBIT-tax SalesSales Net profit Net profit marginmargin
2004-20052004-2005 50,800,230.0050,800,230.00 196,572,581.0196,572,581.000
0.260.26
2003-20042003-2004 71,051,000.0071,051,000.00 223,725,790.0223,725,790.000
0.320.32
2002-20032002-2003 64,174,738.0064,174,738.00 217,077,653.0217,077,653.000
0.300.30
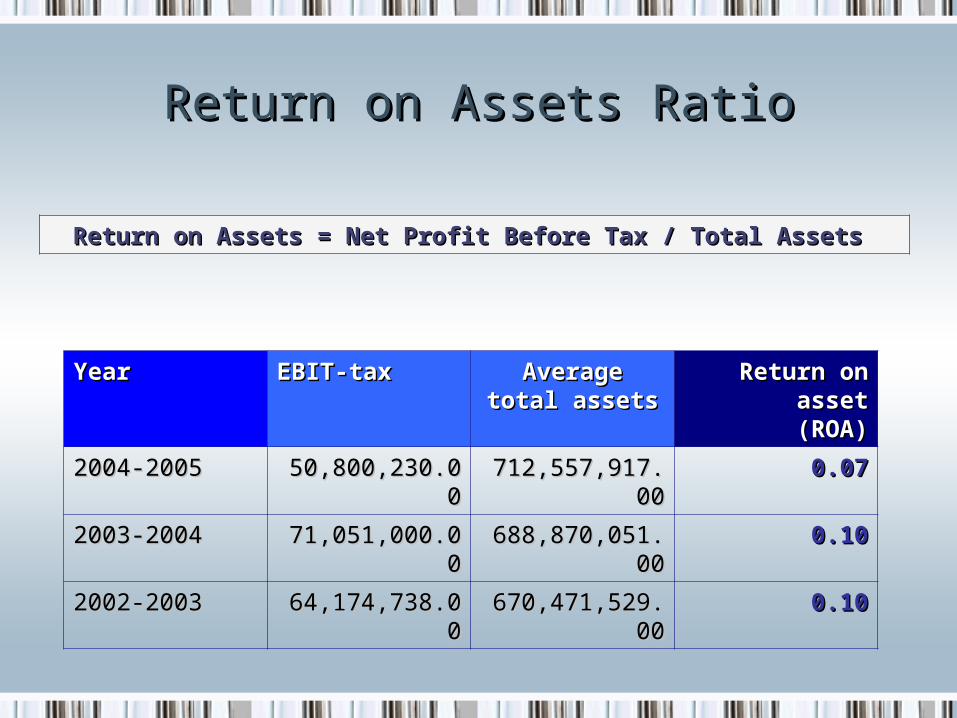
Return on Assets RatioReturn on Assets Ratio
Return on Assets = Net Profit Before Tax / Total Assets Return on Assets = Net Profit Before Tax / Total Assets
YearYear EBIT-taxEBIT-tax Average total Average total assetsassets
Return on Return on assetasset(ROA)(ROA)
2004-20052004-2005 50,800,230.0050,800,230.00 712,557,917.0712,557,917.000
0.070.07
2003-20042003-2004 71,051,000.0071,051,000.00 688,870,051.0688,870,051.000
0.100.10
2002-20032002-2003 64,174,738.0064,174,738.00 670,471,529.0670,471,529.000
0.100.10
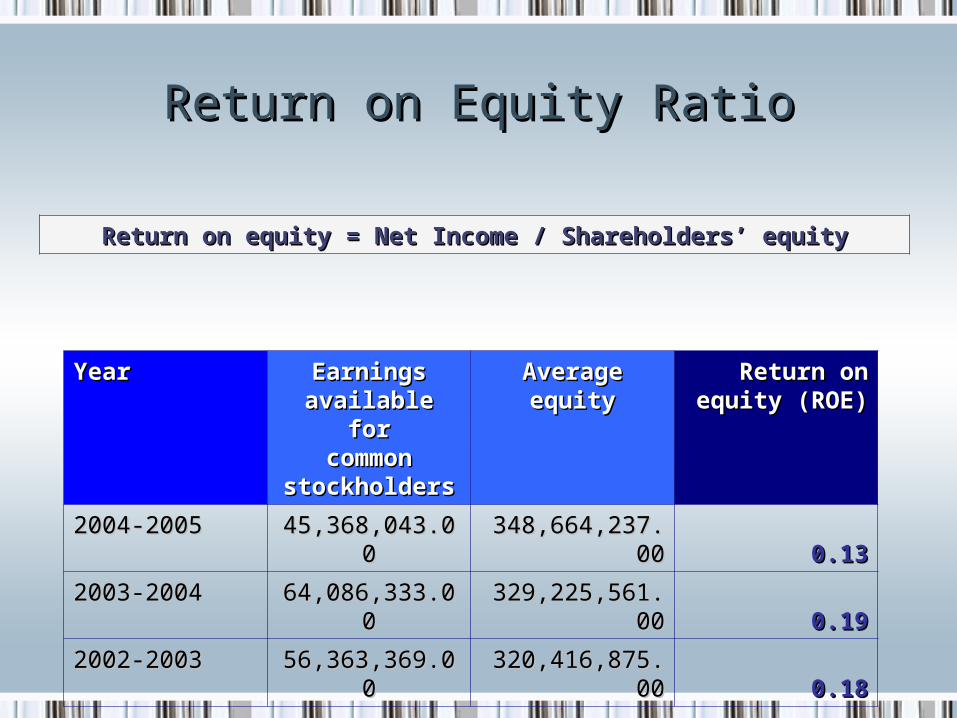
Return on Equity RatioReturn on Equity Ratio
Return on equity = Net Income / Shareholders’ equityReturn on equity = Net Income / Shareholders’ equity
YearYear Earnings Earnings available foravailable for
common common stockholdersstockholders
Average Average equityequity
Return onReturn onequity (ROE)equity (ROE)
2004-20052004-2005 45,368,043.0045,368,043.00 348,664,237.0348,664,237.000 0.130.13
2003-20042003-2004 64,086,333.0064,086,333.00 329,225,561.0329,225,561.000 0.190.19
2002-20032002-2003 56,363,369.0056,363,369.00 320,416,875.0320,416,875.000 0.180.18
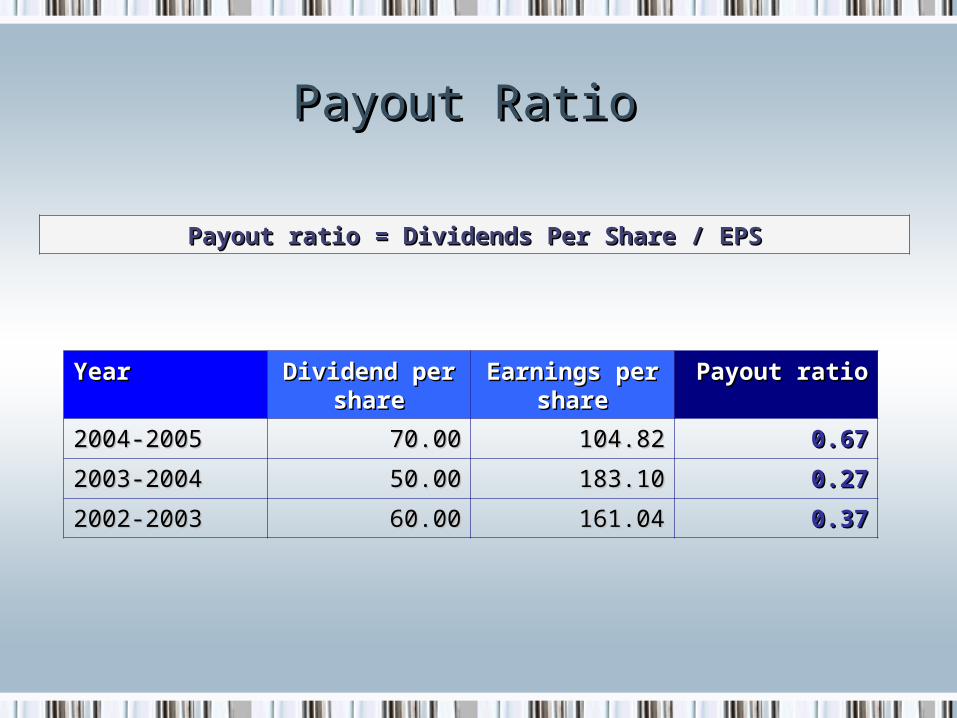
Payout Ratio Payout Ratio
Payout ratio = Dividends Per Share / EPSPayout ratio = Dividends Per Share / EPS
YearYear Dividend per Dividend per shareshare
Earnings per Earnings per shareshare
Payout ratioPayout ratio
2004-20052004-2005 70.0070.00 104.82104.82 0.670.67
2003-20042003-2004 50.0050.00 183.10183.10 0.270.27
2002-20032002-2003 60.0060.00 161.04161.04 0.370.37
Market-value RatioMarket-value Ratio
• Price-earnings RatioPrice-earnings Ratio• Dividend YieldDividend Yield• Market to Book RatioMarket to Book Ratio
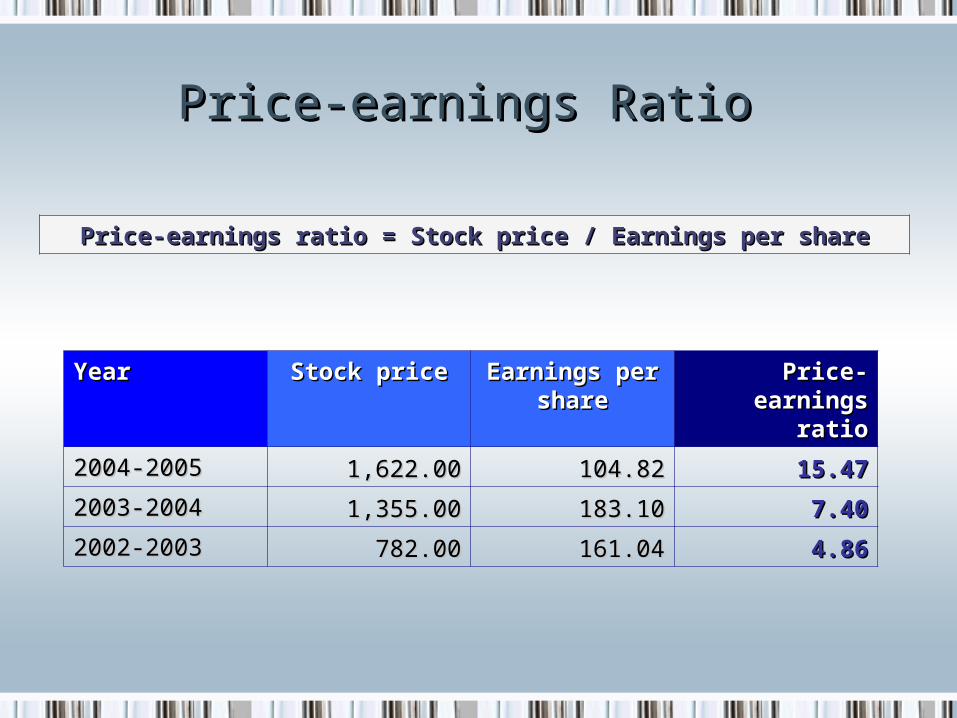
Price-earnings Ratio Price-earnings Ratio
Price-earnings ratio = Stock price / Earnings per sharePrice-earnings ratio = Stock price / Earnings per share
YearYear Stock priceStock price Earnings per Earnings per shareshare
Price-Price-earnings earnings
ratioratio
2004-20052004-2005 1,622.001,622.00 104.82104.82 15.4715.47
2003-20042003-2004 1,355.001,355.00 183.10183.10 7.407.40
2002-20032002-2003 782.00782.00 161.04161.04 4.864.86
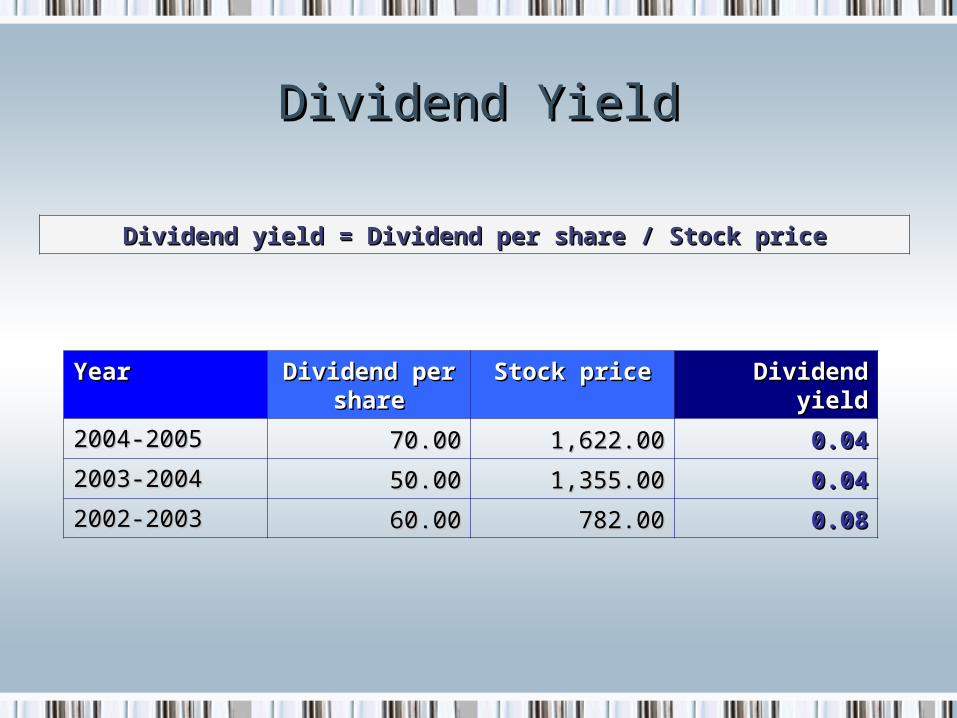
Dividend YieldDividend Yield
Dividend yield = Dividend per share / Stock priceDividend yield = Dividend per share / Stock price
YearYear Dividend per Dividend per shareshare
Stock priceStock price Dividend Dividend yieldyield
2004-20052004-2005 70.0070.00 1,622.001,622.00 0.040.04
2003-20042003-2004 50.0050.00 1,355.001,355.00 0.040.04
2002-20032002-2003 60.0060.00 782.00782.00 0.080.08
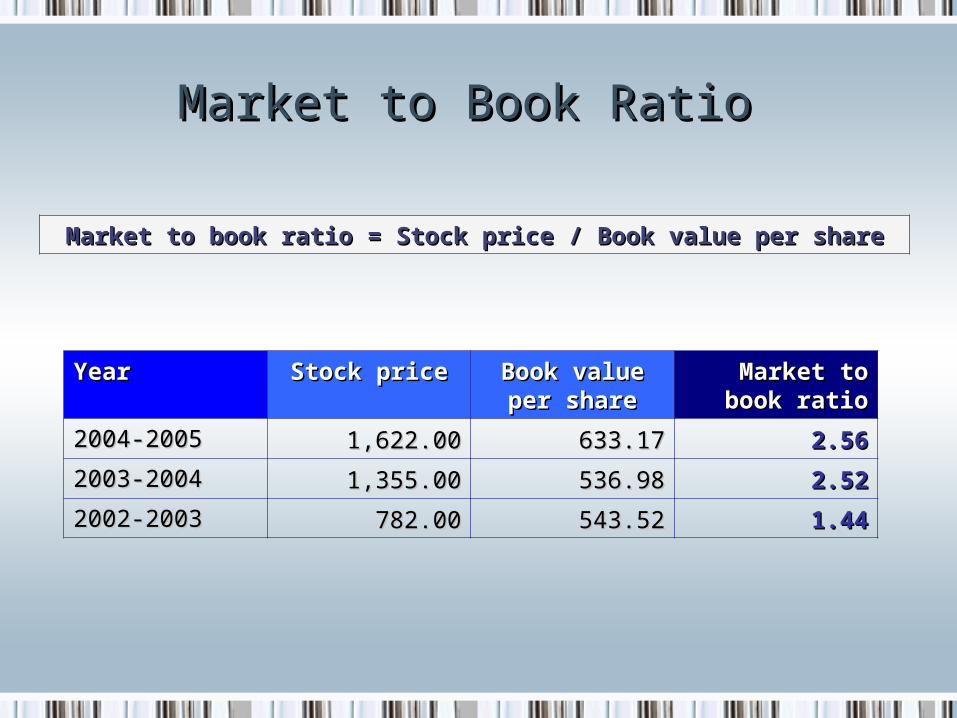
Market to Book Ratio Market to Book Ratio
Market to book ratio = Stock price / Book value per shareMarket to book ratio = Stock price / Book value per share
YearYear Stock priceStock price Book value Book value per shareper share
Market to Market to book ratiobook ratio
2004-20052004-2005 1,622.001,622.00 633.17633.17 2.562.56
2003-20042003-2004 1,355.001,355.00 536.98536.98 2.522.52
2002-20032002-2003 782.00782.00 543.52543.52 1.441.44
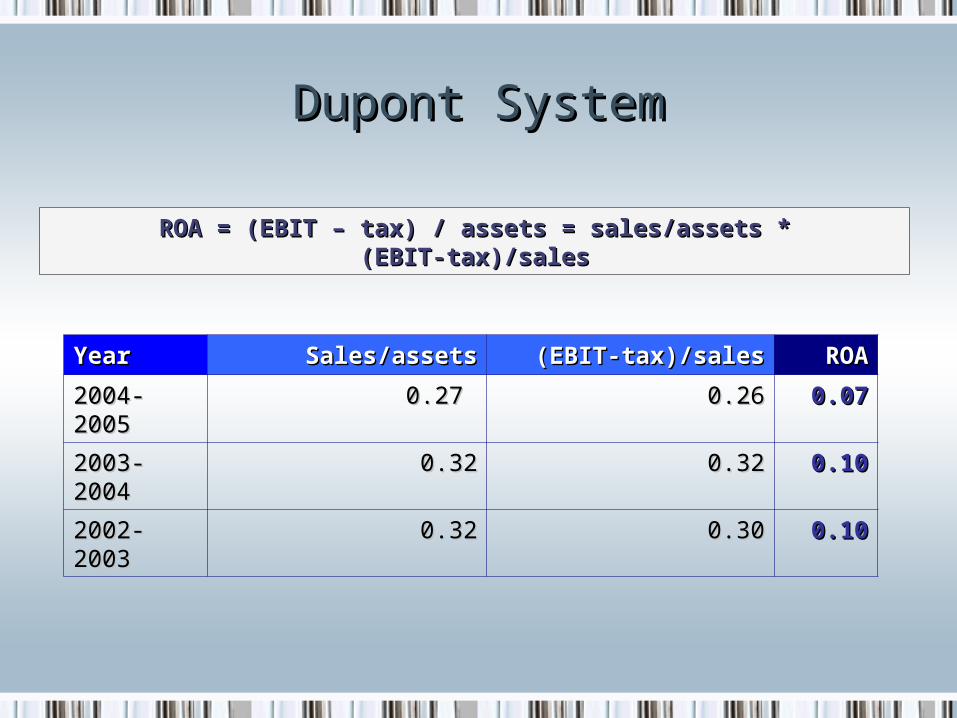
Dupont SystemDupont System
ROA = (EBIT – tax) / assets = sales/assets * (EBIT-tax)/salesROA = (EBIT – tax) / assets = sales/assets * (EBIT-tax)/sales
YearYear Sales/assetsSales/assets (EBIT-tax)/sales(EBIT-tax)/sales ROAROA
2004-2004-20052005
0.27 0.27 0.260.26 0.070.07
2003-2003-20042004
0.320.32 0.320.32 0.100.10
2002-2002-20032003
0.320.32 0.300.30 0.100.10
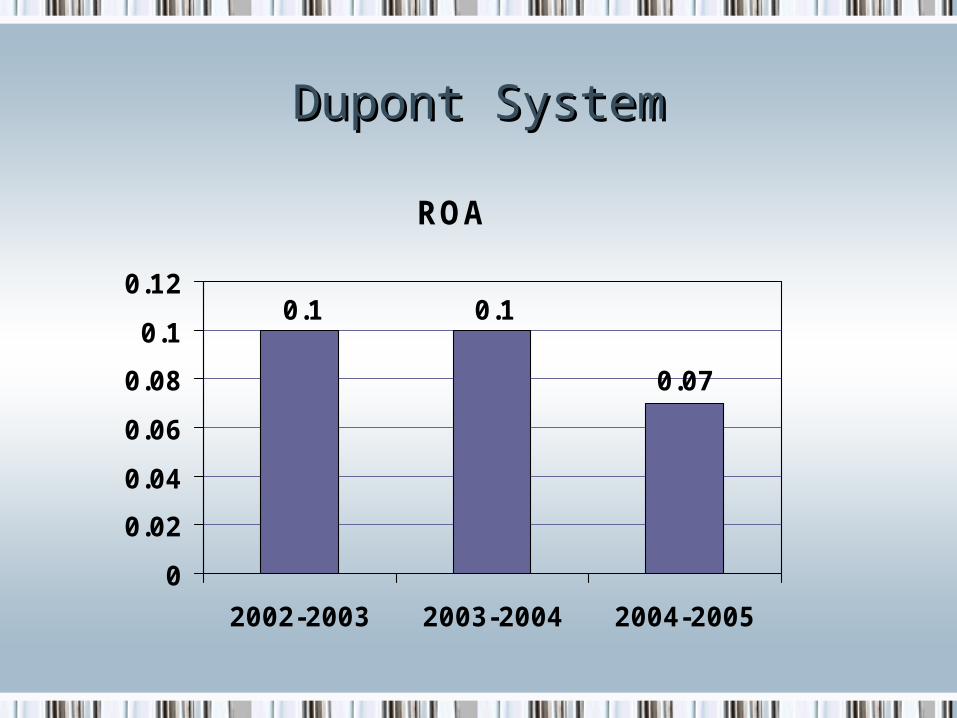
Dupont SystemDupont System
ROA
0.1
0.07
0.1
0
0.02
0.04
0.06
0.08
0.1
0.12
2002-2003 2003-2004 2004-2005
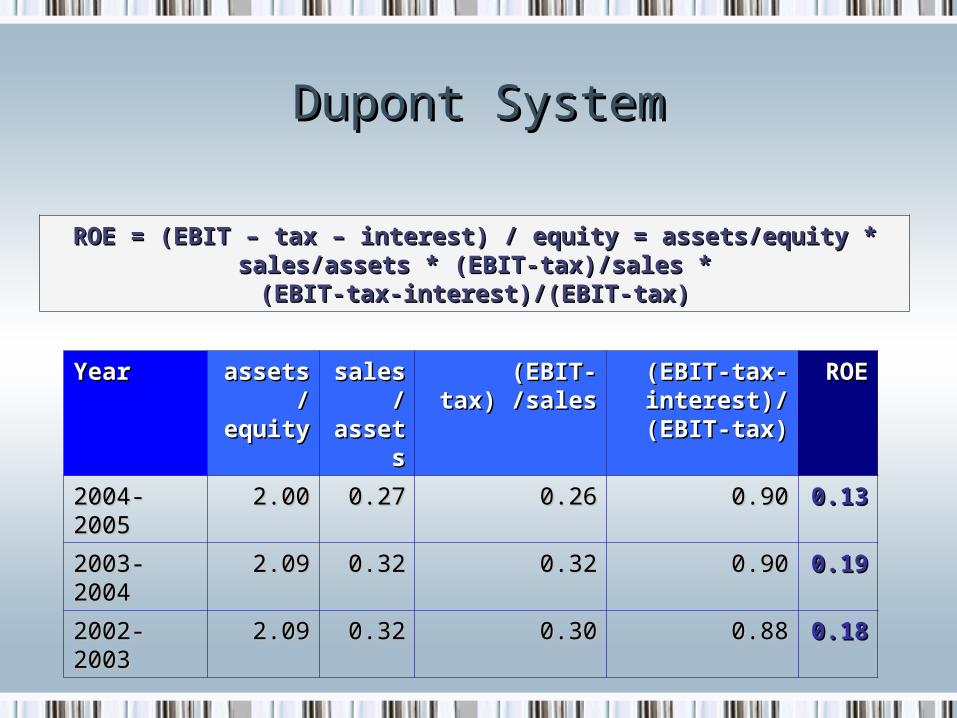
Dupont SystemDupont System
ROE = (EBIT – tax – interest) / equity = assets/equity * sales/assets * (EBIT-ROE = (EBIT – tax – interest) / equity = assets/equity * sales/assets * (EBIT-tax)/sales * (EBIT-tax-interest)/(EBIT-tax)tax)/sales * (EBIT-tax-interest)/(EBIT-tax)
YearYear assetsassets//
equityequity
salessales//
assetassetss
(EBIT-tax) (EBIT-tax) /sales/sales
(EBIT-tax-(EBIT-tax-interest)/interest)/(EBIT-tax)(EBIT-tax)
ROEROE
2004-2004-20052005
2.002.00 0.270.27 0.260.26 0.900.90 0.130.13
2003-2003-20042004
2.092.09 0.320.32 0.320.32 0.900.90 0.190.19
2002-2002-20032003
2.092.09 0.320.32 0.300.30 0.880.88 0.180.18
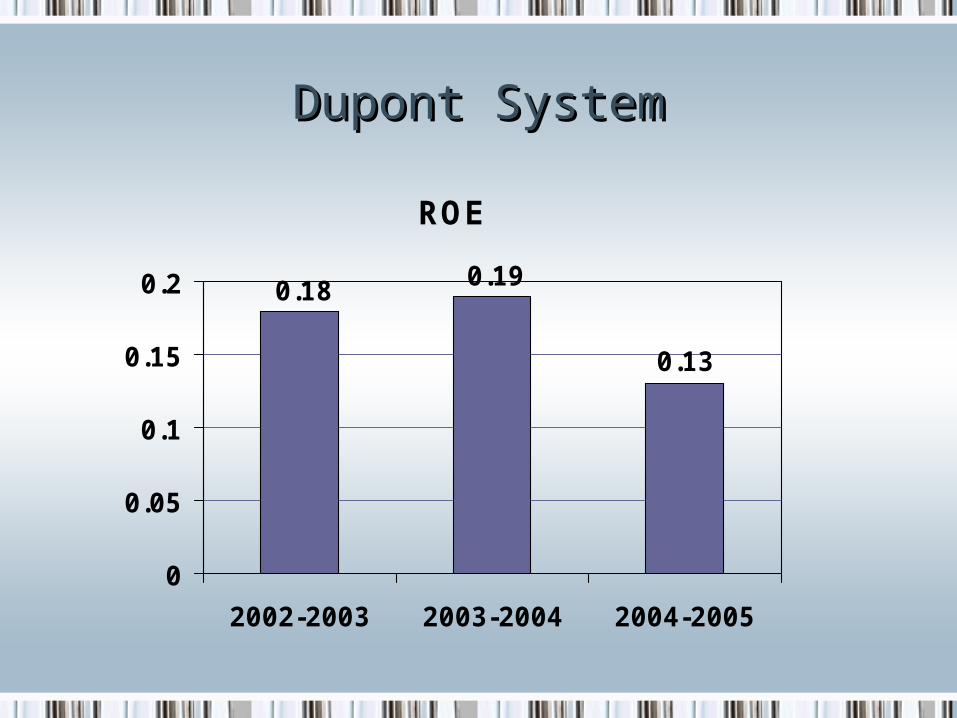
Dupont SystemDupont System
ROE
0.18
0.13
0.19
0
0.05
0.1
0.15
0.2
2002-2003 2003-2004 2004-2005
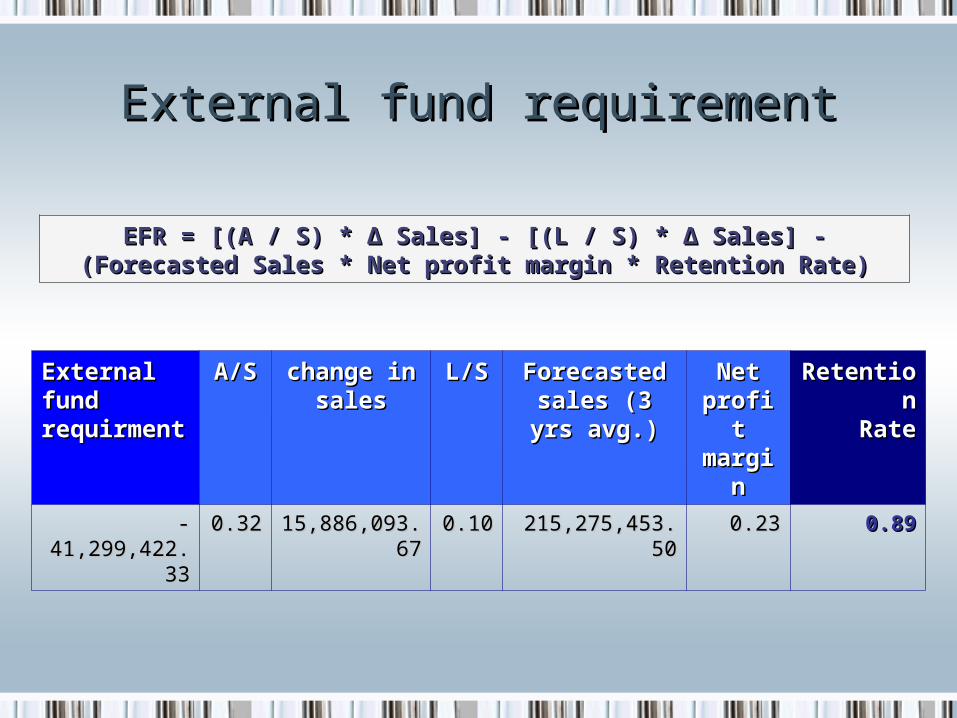
External fund requirementExternal fund requirement
EFR = [(A / S) * Δ Sales] - [(L / S) * Δ Sales] - (Forecasted Sales * Net profit EFR = [(A / S) * Δ Sales] - [(L / S) * Δ Sales] - (Forecasted Sales * Net profit margin * Retention Rate)margin * Retention Rate)
External External fund fund requirment requirment
A/SA/S change in change in salessales
L/SL/S Forecasted Forecasted sales (3 yrs sales (3 yrs
avg.)avg.)
Net Net profit profit
marginmargin
RetentionRetentionRateRate
--41,299,422.341,299,422.3
33
0.320.32 15,886,093.15,886,093.6767
0.100.10 215,275,453.5215,275,453.500
0.230.23 0.890.89
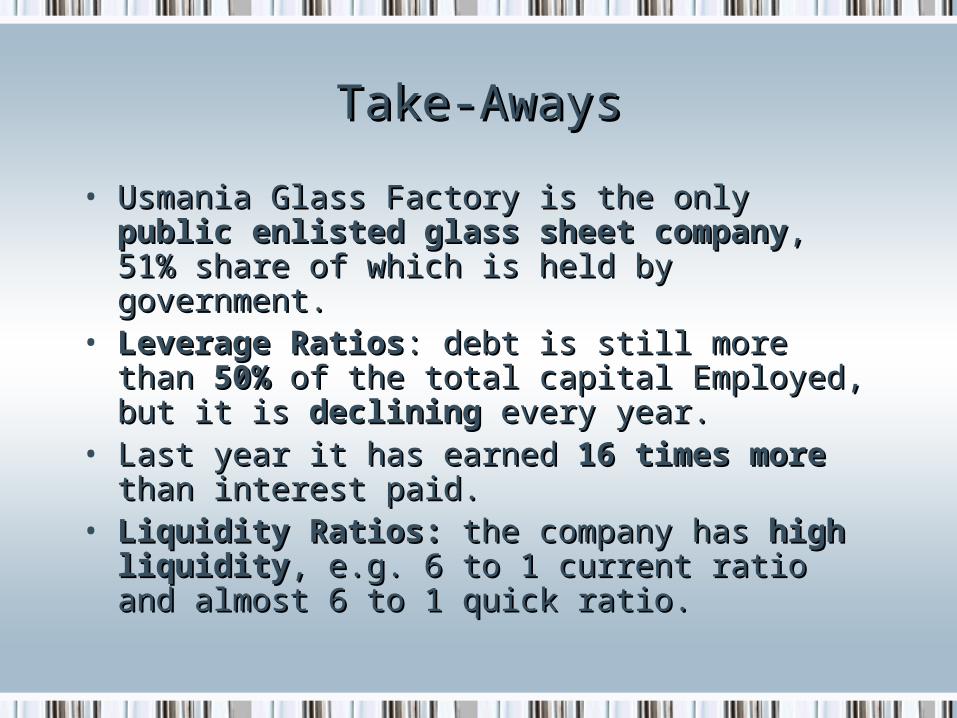
Take-AwaysTake-Aways
• Usmania Glass Factory is the only Usmania Glass Factory is the only public public enlisted glass sheet companyenlisted glass sheet company, 51% share , 51% share of which is held by government.of which is held by government.
• Leverage RatiosLeverage Ratios: debt is still more than : debt is still more than 50%50% of the total capital Employed, but it is of the total capital Employed, but it is decliningdeclining every year. every year.
• Last year it has earned Last year it has earned 16 times more16 times more than than interest paid.interest paid.
• Liquidity Ratios:Liquidity Ratios: the company has the company has high high liquidityliquidity, e.g. 6 to 1 current ratio and almost , e.g. 6 to 1 current ratio and almost 6 to 1 quick ratio.6 to 1 quick ratio.
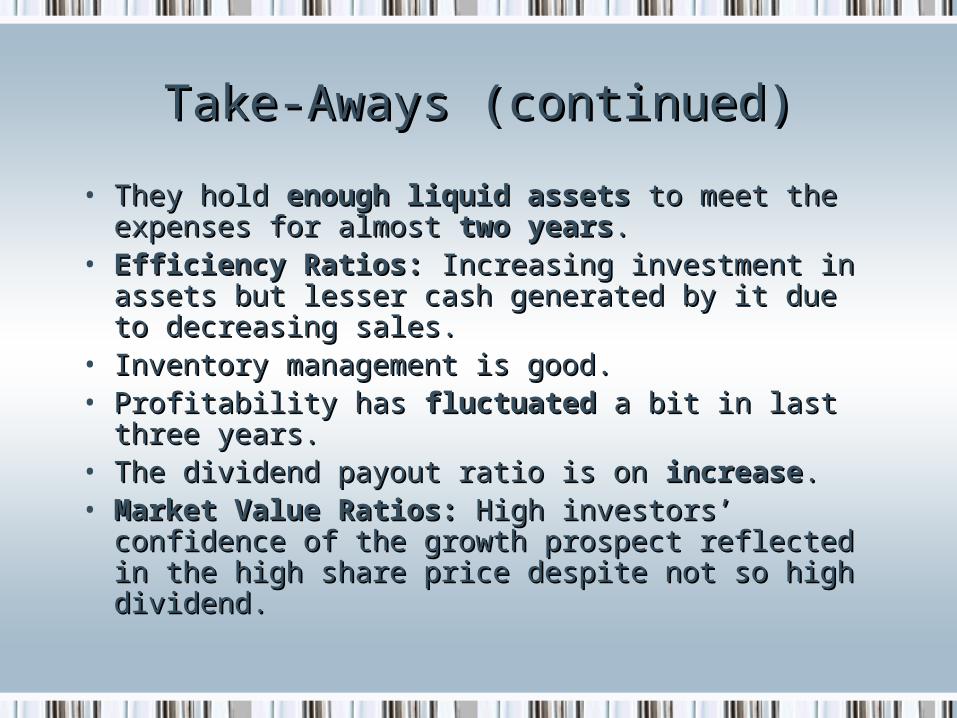
Take-Aways (continued)Take-Aways (continued)
• They hold They hold enough liquid assetsenough liquid assets to meet the to meet the expenses for almost expenses for almost two yearstwo years. .
• Efficiency Ratios:Efficiency Ratios: Increasing investment in Increasing investment in assets but lesser cash generated by it due to assets but lesser cash generated by it due to decreasing sales.decreasing sales.
• Inventory management is good.Inventory management is good.• Profitability has Profitability has fluctuatedfluctuated a bit in last three a bit in last three
years.years.• The dividend payout ratio is on The dividend payout ratio is on increaseincrease. . • Market Value Ratios:Market Value Ratios: High investors’ High investors’
confidence of the growth prospect reflected in confidence of the growth prospect reflected in the high share price despite not so high dividend.the high share price despite not so high dividend.

Thank YouThank You
ContentsContents
• Current Financial Standings Current Financial Standings • Leverage RatiosLeverage Ratios• Liquidity RatiosLiquidity Ratios• Efficiency RatiosEfficiency Ratios• Profitability RatiosProfitability Ratios• Market-value RatiosMarket-value Ratios• Dupont AnalysisDupont Analysis• EFREFR• Take-Take-AwaysAways