Embed Size (px)
Citation preview

IES - Global
5 - Presentation Template 20131104 JC.pptx
IES - Global
Using Wellbore Deformation To
Optimize Drilling Performance
By : Juan Tovar
Innovative Engineering Systems Limited
Devex 2014
6th May 2014
Aberdeen, Scotland
1 Presentation Devex 20140505 JC

IES - Global
Content
2
• Background
• Fundamentals of near wellbore deformation
• Drilling optimisation using near wellbore deformation
1. Wellbore stability
2. Hydraulics and hole cleaning
3. Hole quality
• Zonal isolation and cementing
• Conclusions
• Questions
Presentation Devex 20140505 JC

IES - Global
Background
3
Near wellbore deformation is an old and well established concept; it is the deformation of the rock at the wellbore wall caused by the drilling process
• Widely used in mining since the 19th century
• Used in civil engineering applications such as tunnelling and dam
construction
• Composed of a mechanical, chemical and hydraulic element
• Also known as damaged zone, yield zone or radius of plasticity
For well construction
• Deformation of the near wellbore in well construction can be
predicted and verified using current measurements such as calliper
logs.
Presentation Devex 20140505 JC

IES - Global
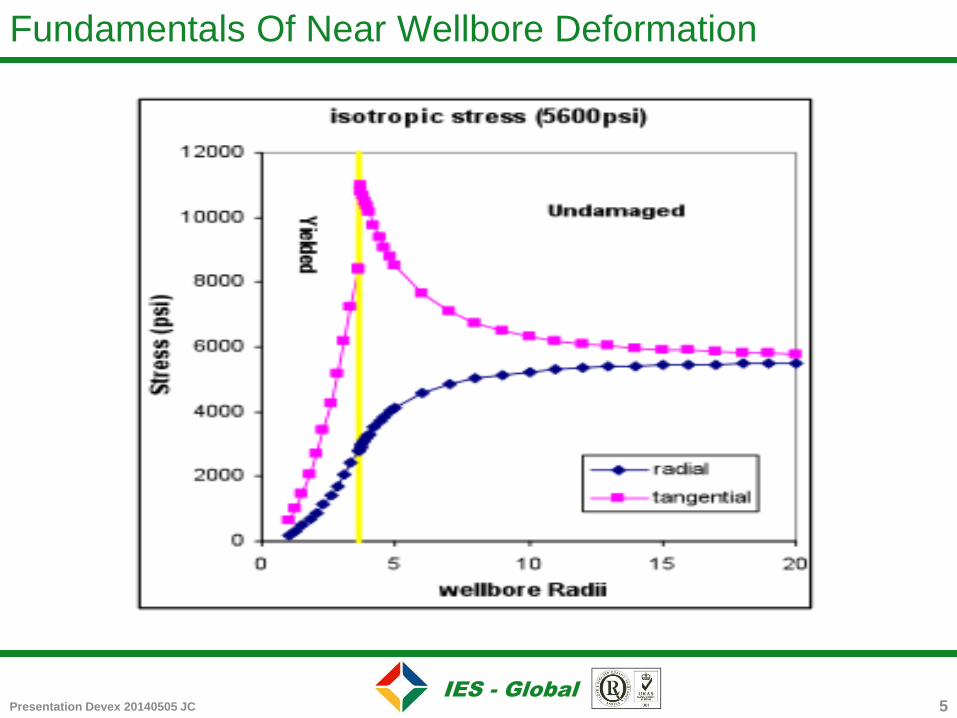
Fundamentals Of Near Wellbore Deformation
4
• Modelling is based on geomechanical principles and therefore
a geomechanical model needs to be built
• In-situ stresses, pore pressure and rock mechanical properties
are required; a temperature element is desired for HP/HT wells
Rp = ro { 2q - So + p’(k + 1) / (p +p’)(k + 1)} 1/k - 1 (Sanfillipo et al 1997)
Where
K Tri-axial stress factor
So Unconfined uni-axial strength
Q Hydrostatic stress field
Rp Radius of plasticity
Presentation Devex 20140505 JC
IES - Global
Fundamentals Of Near Wellbore Deformation
5 Presentation Devex 20140505 JC

IES - Global
0.00
2.00
4.00
6.00
8.00
10.00
12.00
14.00
010
20
30
40
50
60
70
80
90
100
110
120
130
140
150
160170
180190
200
210
220
230
240
250
260
270
280
290
300
310
320
330
340350
Bit Size Series2
7.50
9.50
11.50
13.50
15.50
17.50
19.500
1020
3040
50
60
70
80
90
100
110
120
130
140150
160170
180190
200210
220
230
240
250
260
270
280
290
300
310
320330
340350
100 DD 500 DD 800 DD 1100 DD 1500 DD
3000 DD 4000 DD 5000 DD 5500 DD Bit Size
Drilling Production
Fundamentals Of Near Wellbore Deformation
6 Presentation Devex 20140505 JC

IES - Global
Calliper Four Arms - Dorado 2X
Range (MD) : 6750.00' - 7182.00'
Scale : 1:1000
Depth(ft)
6800
6900
7000
7100
Pore Pressure0 8000psi
Minimum Horizontal Stress0 8000psi
Maximum Horizontal Stress0 8000psi
Overburden Stress0 8000psi
Group
Chonta
ChontaLime
Cetico
AguaCaliente
C18 10in
C28 10in
Bit Size8 10in
Wellbore size is measured
using calliper logs
• 2, 4, 6 arms callipers are used
• Helps to determine stress
anisotropy and orientation
• Callipers reflect the mechanical,
chemical and hydraulic effects of
the drilling process on the finished
wellbore
Fundamentals Of Near Wellbore Deformation
7 Presentation Devex 20140505 JC
IES - Global
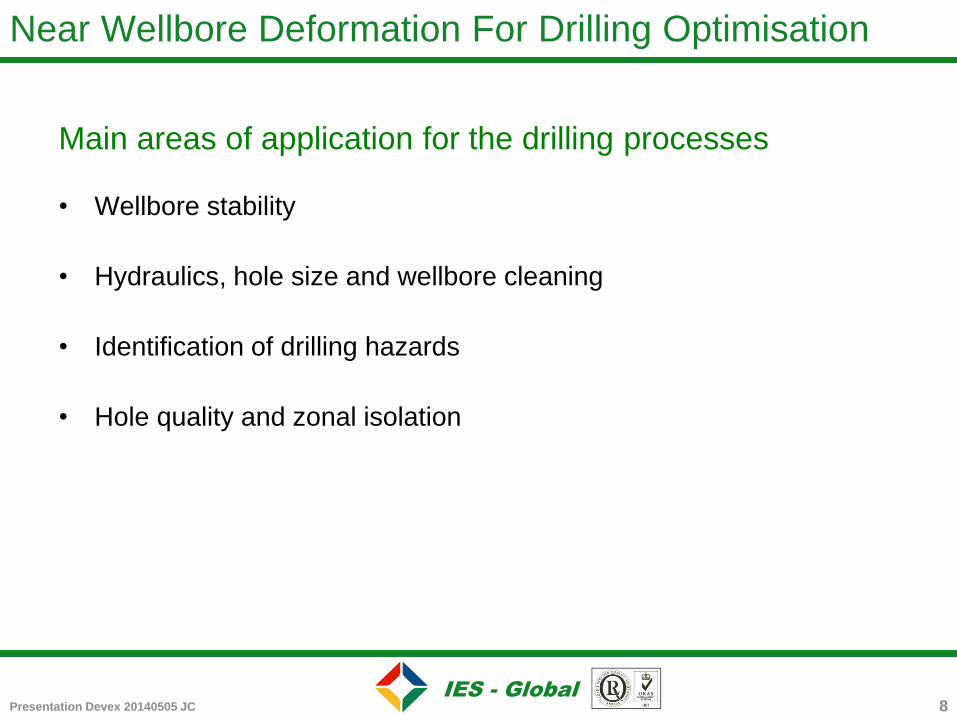
Near Wellbore Deformation For Drilling Optimisation
8
Main areas of application for the drilling processes
• Wellbore stability
• Hydraulics, hole size and wellbore cleaning
• Identification of drilling hazards
• Hole quality and zonal isolation
Presentation Devex 20140505 JC

IES - Global
Drilling Optimisation - Hole Stability
9 Presentation Devex 20140505 JC

IES - Global
Drilling Optimisation – Hole Stability
10
Two (2) main stability components; a chemical and a
mechanical one
• Deformation can be used to calibrate the OMW, contributes to
distinguish the type of collapse mechanism (catastrophic, partial,…)
• Aid in the identification of potential troublesome formations where
certain operations/effects (swab & surge, reaming, ...) must be
controlled
• Contribute to the identification of the magnitude and location of rock-
fluid interaction effects
Presentation Devex 20140505 JC
IES - Global
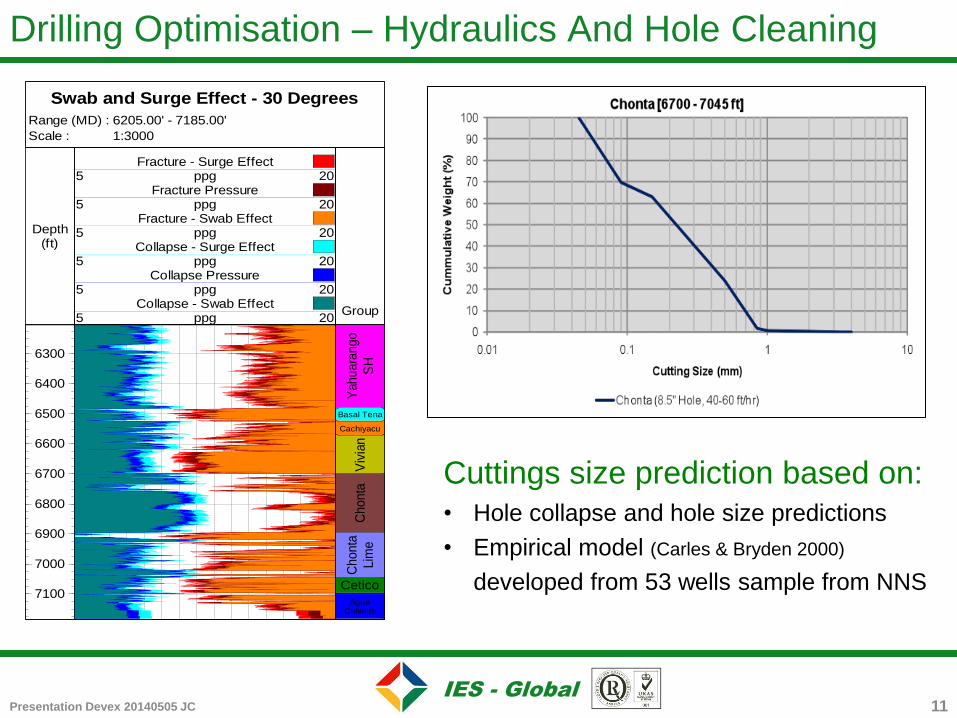
Swab and Surge Effect - 30 Degrees
Range (MD) : 6205.00' - 7185.00'
Scale : 1:3000
Depth(ft)
6300
6400
6500
6600
6700
6800
6900
7000
7100
Fracture - Surge Effect5 20ppg
Fracture Pressure5 20ppg
Fracture - Swab Effect5 20ppg
Collapse - Surge Effect5 20ppg
Collapse Pressure5 20ppg
Collapse - Swab Effect5 20ppg
Group
Yahuara
ngo
SH
Basal Tena
Cachiyacu
Viv
ian
Chonta
Chonta
Lim
e
Cetico
AguaCaliente
Cuttings size prediction based on: • Hole collapse and hole size predictions
• Empirical model (Carles & Bryden 2000)
developed from 53 wells sample from NNS
Drilling Optimisation – Hydraulics And Hole Cleaning
11 Presentation Devex 20140505 JC

IES - Global
Drilling Optimisation – Hydraulics And Hole Cleaning
12
Near wellbore deformation prediction
• Assesses the impact of drilling effects such as swab & surge,
changes in ECD and circulation rates
• Allows a more accurate prediction of the drill cuttings sizes and
volumes
• Drilling fluid type and properties can be optimised to enhance
cuttings transport and hydraulics (e.g. friction…)
• CFD methods can be used if higher accuracy is required for
optimisation of the hydraulics
Presentation Devex 20140505 JC
IES - Global
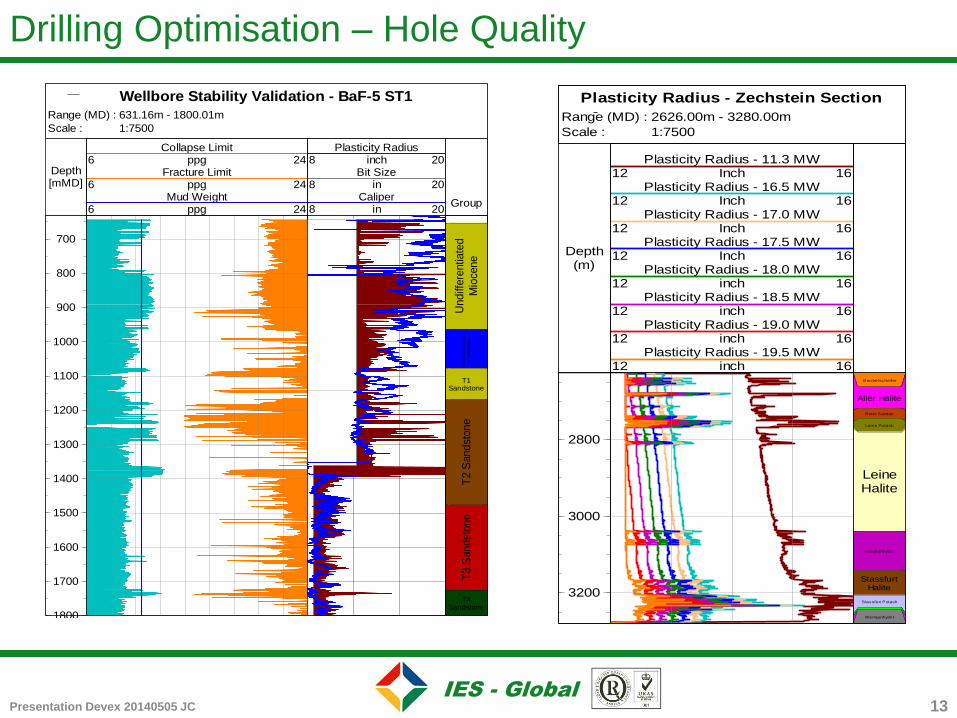
Wellbore Stability Validation - BaF-5 ST1
Range (MD) : 631.16m - 1800.01m
Scale : 1:7500
Depth[mMD]
700
800
900
1000
1100
1200
1300
1400
1500
1600
1700
1800
Collapse Limit6 24ppg
Fracture Limit6 24ppg
Mud Weight6 24ppg
Group
Undiff
ere
ntia
ted
Mio
cene
Base
Cre
tato
us
Low
er
Unco
nfo
rmity
T1Sandstone
T2 S
andst
one
T3 S
andst
one
T4Sandstone
Plasticity Radius8 20inch
Bit Size8 20in
Caliper8 20in
Plasticity Radius - Zechstein Section
Range (MD) : 2626.00m - 3280.00m
Scale : 1:7500
Depth(m)
2800
3000
3200
Plasticity Radius - 11.3 MW12 16Inch
Plasticity Radius - 16.5 MW12 16Inch
Plasticity Radius - 17.0 MW12 16Inch
Plasticity Radius - 17.5 MW12 16Inch
Plasticity Radius - 18.0 MW12 16inch
Plasticity Radius - 18.5 MW12 16inch
Plasticity Radius - 19.0 MW12 16inch
Plasticity Radius - 19.5 MW12 16inch
Brockelscheifer
Aller Halite
Roter Salzton
Leine Potash
LeineHalite
Hauptanhydrit
StassfurtHalite
Stassfurt Potash
BasalanhydritHauptdolomitWerraanhydrit
Drilling Optimisation – Hole Quality
13 Presentation Devex 20140505 JC

IES - Global
Radius of Plasticity - IDM 4
Range (MD) : 1030.00m - 1360.00m
Scale : 1:1500
Depth
(m)
1050
1100
1150
1200
1250
1300
1350
Group
S4M5
S5F
M6
S6.2
M7
Rp
8 20inch
Bit Size
8 20Inch
Caliper
8 20inch
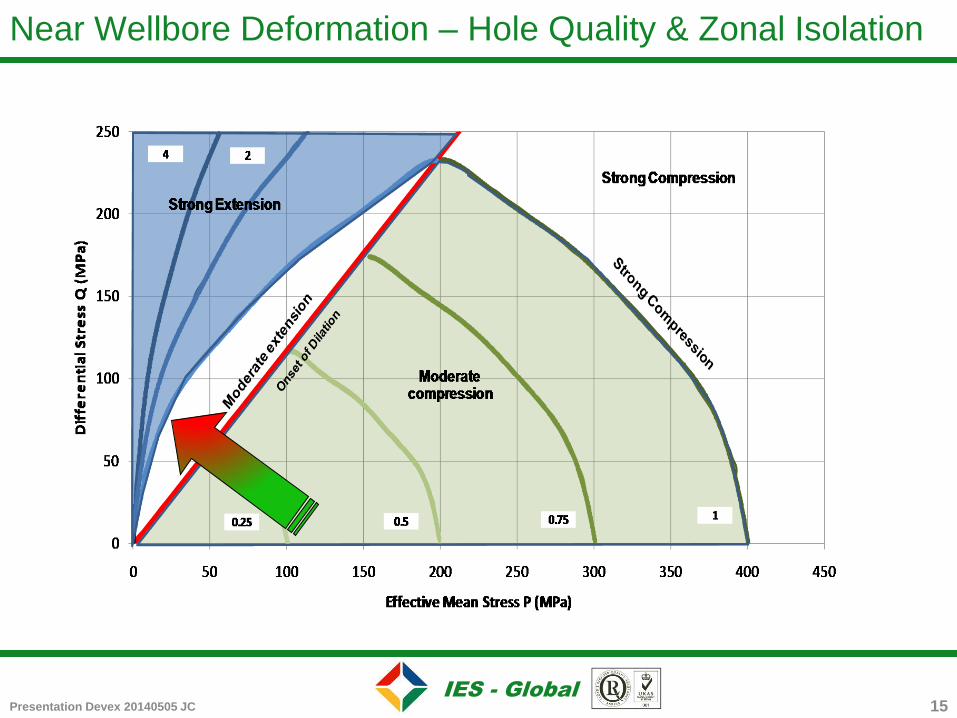
Drilling Optimisation – Hole Quality & Zonal Isolation
14
• A hole drilled in-gauge does not
guarantee near wellbore mechanical
integrity
• Deformation is a permanent and
irreversible process
• Formation’s porosity and
permeability can change as a result
of near wellbore deformation
Presentation Devex 20140505 JC
IES - Global
Near Wellbore Deformation – Hole Quality & Zonal Isolation
15 Presentation Devex 20140505 JC
IES - Global
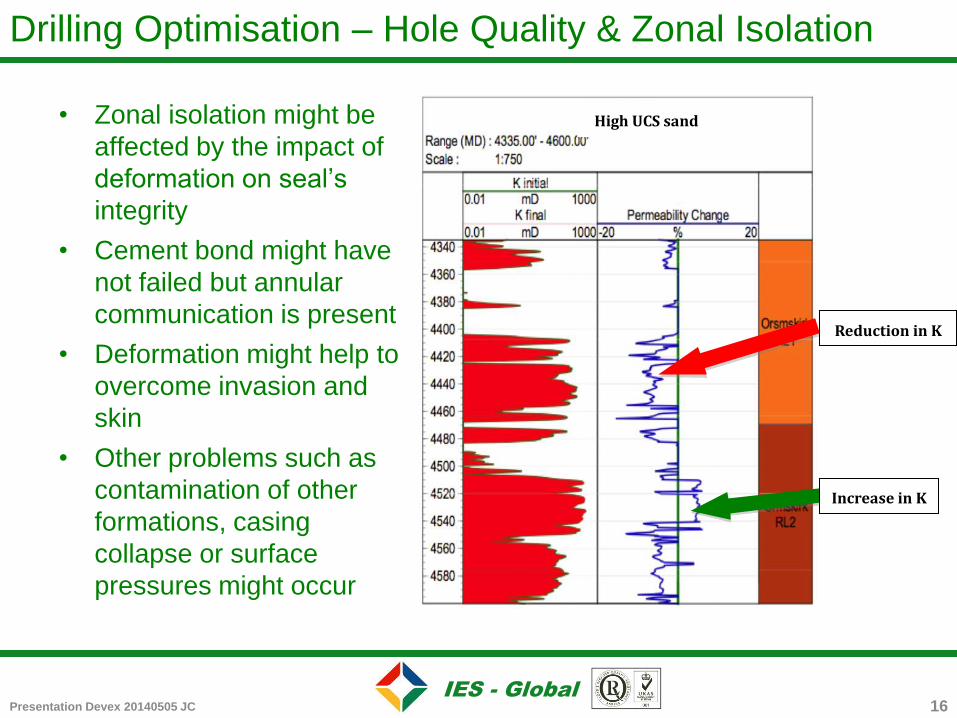
High UCS sand
Reduction in K
Increase in K
Drilling Optimisation – Hole Quality & Zonal Isolation
16
• Zonal isolation might be
affected by the impact of
deformation on seal’s
integrity
• Cement bond might have
not failed but annular
communication is present
• Deformation might help to
overcome invasion and
skin
• Other problems such as
contamination of other
formations, casing
collapse or surface
pressures might occur
Presentation Devex 20140505 JC
IES - Global
Conclusions
17
Using near wellbore deformation to optimise drilling operations is a robust and practical approach to enhance performance and reduce operational risk. It can be measured.
• The concept is widely used in other industries such as mining and civil engineering (tunnelling, dam construction)
• The deformation process consist of three (3) main steps: Compression, Dilatancy and Compaction
• It can be very effective in improving the accuracy of wellbore stability predictions, OMW and fluid design
• Identification of problematic zones can be highlighted so drilling procedures and operations can be improved
• Issues such as rock-fluid interaction, BHA manipulation and circulation rates all impact the magnitude and location of the deformation
Presentation Devex 20140505 JC

IES - Global
Conclusions
Presentation Devex 20140505 JC 18
• Hole quality and zonal isolation can benefit from near wellbore
deformation analysis as invasion and changes in petro-physical
properties can be identified and their impact on the finish wellbore
assessed
• Cementing systems might not be very effective zonal isolation in
areas of where near wellbore deformation is present
• The use of 2, 4 or multiple arm callipers allow a accurate
measurement of the deformation

IES - Global
Using near wellbore deformation for drilling optimisation
19
Thank you for your attention
Any questions ?
Presentation Devex 20140505 JC
IES - Global
Disclaimer
This report is confidential and has been prepared for the exclusive use of the Client and may not be distributed or made
available in whole or in part to any other company or person without the prior knowledge and written consent of IESL.
This report is only for the Client and IESL is not responsible for decisions or outcomes made by the Client or third
parties as a result of this report. This report reflects IESL’s informed and considered judgments based on accepted
standards of investigation, the data and information provided by the Client, the limited scope of engagement and the
time permitted to conduct the evaluation. The opinions expressed herein are subject to and fully qualified by the
generally accepted uncertainties associated with the interpretation of geoscience and engineering data and do not
reflect the totality of circumstances, scenarios and information that could potentially affect decisions made by the
report’s recipients and/or actual results. However, this report does not in any way constitute or make a guarantee or
prediction of results, and no warranty is implied or expressed that actual outcomes will conform to the outcomes
presented herein. Therefore: IESL does not warrant that the judgments or conclusions presented herein are error-free.
IESL has not independently verified any information provided by or at the direction of the Client. IESL is acting in an
advisory capacity only and disclaims all liability for actions or losses derived from any actual or purported reliance on
this report (or any other statements or opinions of IESL) by the Client or by any other person or entity. IESL disclaims
any obligation to update this report or provide any follow-up support except as expressly provided in a written contract.
20 Presentation Devex 20140505 JC