Embed Size (px)
Citation preview
436
For more information about the concepts in this article, please contact Dr. Ippolito at [email protected].
Using Time-Driven Activity-Based Costing to Establish a Tariff System for Home Health Care ServicesAdelaide Ippolito, PhD, consultant, Formez PA, Rome, Italy; Silvia Boni, Dr., head, Health Organization and Social Policy Unit, Formez PA, Rome; Ettore Cinque, professor of accounting, Second University of Naples, Italy, and former acting subcommissioner for health services, Campania Region, Italy; Annarita Greco, Dr., public servant, Health and Social Interventions Unit, Campania Region, Naples; and Salima Salis, Dr., coordinator, Campania Region Activities, Formez PA, Cagliari, Italy
E X E C U T I V E S U M M A R YThe most important societal challenge is aging, often associated with chronic disease and increased multimorbidity; nevertheless, the costs of an aging society will not be sustainable in terms of healthcare and social services. In late 2011, the regional government of Campania, Italy, launched a study with the aim of implementing a tariff system for the provision of home and palliative care services.
To create the tariff system, the regional government set up two working groups: one to identify home and palliative care profiles and the other to propose a tariff system for home and palliative care based on the profiles identified. The second group analyzed the average resources absorbed by each of the care profiles identified using a time-driven activity-based costing (TDABC) system. This study has two distinguishing features: (1) its use to establish a system of tariffs related to services provided over a particular time frame in an individualized care plan, and (2) the method of calculating the daily cost of care (i.e., the cost of a standard day, including access to all healthcare professionals required to care for the patient at home). The authors identified a prospective tariff system based on the average amount of total resources absorbed according to the different levels of care complexity rather than on historical costs. Although the study pertains to an Italian region, it highlights a methodology that can be applied in other countries.
Photocopying or distributing this PDF is prohibited without the permission of Health Administration Press, Chicago, IL.
For permission, please contact the Copyright Clearance Center at www.copyright.com. For reprints, please contact [email protected]
437
tIMe-DrIven actIvIty-baseD costIng
I N T R O D U C T I O N In Italy, as in other major industrialized countries, the recent economic crisis and the current epidemiological trends have highlighted the inadequacy of health systems to respond to the evolution of population requirements. In this regard, the most important societal challenge is aging, often associated with chronic disease and increased multimorbidity; nevertheless, the prospective cost of an aging society will not be sustainable in terms of healthcare and social services (Grabowski & Gruber, 2007; Kuhn & Nuscheler, 2011; Rechel, Doyle, Grundy, & McKee, 2009). The Italian regional administration does not often adopt health service delivery policies that address the challenge presented by the aging of the population. Few policies are aimed at increasing the delivery of local services for the elderly, and even fewer are able to provide for both health and social needs (Network Non Autosuffi-cienza, 2013). This is particularly true for the Campania region, which, over the past several years, has experienced a steady increase in the number of elderly patients (and others) receiving home care; this increase has been accompa-nied by a growing commitment from the regional government to adopt strategies to promote an integrated home care assistance program that will be effective and economically sustainable.
At the end of 2011, the Campania regional government launched a study aimed at implementing a tariff system for the provision of home and palliative care services. The study was carried out with the support of FormezPA (i.e., center services, assistance, studies, and
training for the modernization of public administration; the organization acts for the Department of Public Administra-tion of the Presidency of the Council of Ministers) as part of the POAT Health Project (i.e., the Operative Project for Technical Assistance of the Italian Ministry of Health), with the aim of improving administrative and gover-nance skills in regions identified by the European Union as having high levels of debt. To determine the tariff system, the regional government set up two working groups: one to identify profiles of home care and palliative care activities (i.e., a system for the classification of patient care complexity), and the second to propose a tariff system for home care and palliative care based on the profiles identified. The latter group used a time-driven activity-based costing (TDABC) system to analyze the average resources absorbed by each care profile identified.
The local health authority managers for home care and palliative care services formed the working groups. This study has two distinguishing features: (1) it established a system of tariffs for services provided during a time frame defined by an individualized care plan (i.e., the care plan defined for each patient), and (2) the method of calculating the daily cost of care (i.e., the cost of a standard day, including access by all healthcare professionals needed to care for the patient at home). The daily rate of care forms the basis for calculating the average daily tariff, the monthly tariff, and the tariff for the entire patient cycle.
The aim of this study is to use TDABC to analyze the experience of the Campania regional government in
Photocopying or distributing this PDF is prohibited without the permission of Health Administration Press, Chicago, IL.
For permission, please contact the Copyright Clearance Center at www.copyright.com. For reprints, please contact [email protected]
438
Journal of HealtHcare ManageMent 61:6 noveMber/DeceMber 2016
establishing a tariff system for home health care services delivered.
B A C K G R O U N DObtaining accurate cost information for decision making on strategy, reimburse-ment tariffs, and management is a fundamental challenge for policymak-ers, healthcare administrators, and researchers in healthcare accounting (Cardinaels, Roodhooft, & Van Herck, 2004; Cardinaels & Soderstrom, 2013; Eldenburg & Kallapur, 2000; Gil & Hartmann, 2007; Hovenga, 1996; Hsu & Qu, 2012; Pettersen, 2001). The cost accounting system plays a critical role, but it is difficult to design an effective system because healthcare organizations have different information needs; indeed, any effective cost accounting system is based on an understanding of the information that is needed and what it allows us to do (Cannavacciuolo, Illario, Ippolito, & Ponsiglione, 2015).
The effectiveness of a cost accounting system is, therefore, subjective rather than objective in nature because it depends on the system’s ability to meet the information needs of the organiza-tion. However, this subjectivity does not mean that information requirements cannot be defined. Unfortunately, cost-accounting systems in healthcare organizations focus on the wrong information, reflecting a distorted view of modern health systems. As Porter (2009) pointed out, healthcare systems focus on reducing the costs of services provided, whereas they should focus on creating value for the patient through the adoption of an outcome measurement system that takes into consideration the services delivered, not merely measuring
the volume of services delivered (Porter, 2010). Measuring the value created for the patient is, however, difficult because value is linked to the outcome obtained. In addition, value is directly linked to the complexity of patients’ conditions and circumstances (Porter, 2010). For example, measuring outcomes for chronically ill patients is challenging because their healthcare needs involve both medical and social factors.
If healthcare organizations need effective cost-accounting systems that provide information about the value created for the patient, traditional cost-accounting systems based on cost centers (i.e., providing cost information for each cost center) are not adequate. The information generated by these cost-accounting systems enables manag-ers to calculate the costs arising in organizational units, but they do not allow measurement of the value created for patients through an assessment of outcomes.
Activity-Based CostingThe inadequacy of cost-accounting systems based on cost centers has led to the adoption of sophisticated cost-accounting systems, (Jacobs, Marcon, & Witt, 2004). One such system is activity-based costing (ABC), which is a tool for measuring costs and improvements in activities (e.g., surgery) (Arnaboldi & Lapsley, 2005; Canby, 1995; Cappetini, Chow, & McNamee, 1998; Chan, 1993; Ramsey, 1994; Ross, 2004).
Adoption of ABC has often been limited to small companies (Bjørnenak & Mitchell, 2002); its widespread adoption has often led to failure because of difficulties related to
Photocopying or distributing this PDF is prohibited without the permission of Health Administration Press, Chicago, IL.
For permission, please contact the Copyright Clearance Center at www.copyright.com. For reprints, please contact [email protected]
439
tIMe-DrIven actIvIty-baseD costIng
implementation of this type of cost-accounting system. In fact, as some investigators have pointed out (Kaplan & Anderson, 2004; Kaplan & Anderson, 2009; Kaplan & Porter, 2011; Tse & Gong, 2007), the ABC-based cost-accounting system, although effective, is difficult and expensive to adopt, both in the implementation phase and during the period in which the system is updated. Moreover, as Soderstrom and Noreen (1997) stated, costing systems can overstate overhead costs for the purposes of decision making and performance evaluation.
Time-Driven Activity-Based CostingThese limitations have led to the design and implementation of TDABC, which is more effective than the traditional ABC approach, and appears to be simpler and less expensive (Kaplan & Anderson, 2003; Kaplan & Anderson, 2004; Kaplan & Anderson, 2007; Kaplan & Anderson, 2013; Kaplan & Porter, 2011). TDABC also is able to take into account an organization’s complexity (Demeere, Stouthuysen, & Roodhooft, 2009; Yun et al., 2015) and serve as a useful tool for defining innovative payment reimbursement systems (Kaplan et al., 2014). Although devel-oped relatively recently, TDABC already has been used in healthcare to generate cost information about different aspects of treatment (Balakrishnan, Goico, & Arjmand, 2015; Grant, 2015; Kaplan et al., 2015; Lievens, Obyn, Mertens, Van Halewyck, & Hulstaert, 2015; Mandigo et al., 2015; Misono, Oklu, & Prabhakar, 2015; Thaker, Frank, & Feeley, 2015) and to improve performance (Donovan, Hopkins, Kimmel, Koberna, & Montie,
2014; Erhun et al., 2015; McLaughlin et al., 2014; McLaughlin, Upadhyaya, Buxey, & Martin, 2014).
TDABC assigns costs directly to the object of costing in two phases; in the first phase, TDABC identifies the total cost of resources (e.g., personnel, equip-ment, technology) assigned to a specific process, and in the second phase, the resource costs are assigned to the cost object (e.g., a product) on the basis of the activities required and their duration.
Adoption of TDABC does not preclude the use of a cost accounting system based on cost centers. In fact, the two costing systems can coexist because they have different goals. TDABC focuses on the cost of resources absorbed during the perfor-mance of a service, whereas a cost center system establishes the cost of resources absorbed by a responsibility center. Of course, the effectiveness of the two cost systems depends on the ability of the information system to correctly assign the data to the differ-ent information flows, as well as the ability to generate the information necessary for rapid reorganization of healthcare services.
Using TDABC to Establish a Tariff System for Home and Palliative CareIn late 2011, the Campania region set up two working groups to establish a tariff system for home care. Operating sepa-rately, one group profiled home care and the other group produced a pro-posal for a home care tariff plan related to the profiles identified. When the specific methodology for establishing the tariffs was chosen, the two working groups began operating jointly.
Photocopying or distributing this PDF is prohibited without the permission of Health Administration Press, Chicago, IL.
For permission, please contact the Copyright Clearance Center at www.copyright.com. For reprints, please contact [email protected]
440
Journal of HealtHcare ManageMent 61:6 noveMber/DeceMber 2016
Working Group for Care ProfilesThe working group for the care profiles drew up a grid to assess the complexity of integrated home care services (i.e., health and social care) needed for the various profiles. When drawing up the grid, the working group—composed of home care managers of the regional health authorities and executives of the Campania region health government—took into account the three levels of integrated home care (level I [low complexity], level II [moderate complex-ity], level III [high complexity]) and the complexity of palliative care for termi-nally ill patients identified in accordance with regional laws. The working group tested the grid’s validity on a sample of patients enrolled for integrated home care by two local health authorities in the region.
The final grid shows nine profiles for integrated home care and three profiles for palliative care, with three for each level of integrated home care and three for each level of palliative care. The grid enables working group members to examine the elements that determine a specific level of complexity and the characteristics of a welfare profile (i.e., low, medium, or high complexity). The levels are assigned a score of 1, 2, or 3. Complexity is determined by a combina-tion of factors (i.e., the illness itself, activities of daily living, care require-ments, and social conditions). Each level of complexity translates into a mini-mum and maximum number of visits to the patient’s home by healthcare work-ers, in accordance with regional laws.
The analysis described earlier was done in preparation for the study leading to establishment of the tariffs. In
fact, integrated home care encompasses illnesses with different levels of com-plexity that takes into account the patient’s clinical condition and social circumstances. Therefore, decisions regarding appropriate care profiles involve the careful assessment of the resources absorbed, depending on the level of integrated home/palliative care and specific complexity, referring to the welfare requirements relating to the various aspects of care identified.
Working Group on TariffsThe working group on tariffs focused on the resources absorbed by the care profiles identified earlier. The ad hoc study used TDABC to assess absorption of resources by each care profile TDABC.
TDABC made it possible to establish the average costs attributable to the activities included in the care profiles; these activities were categorized into in-house management (i.e., government agencies) and outsourcing (i.e., private providers). For outsourcing activities in particular, the group considered three types of personnel expenses related to the most common private provider contracts used in the Campania region. The working group examined four types of costs (i.e., one for in-house manage-ment and three for outsourcing activi-ties), to establish the daily cost of home care assistance (according to the level of complexity); this cost, in turn, was used to determine the monthly cost, the total cost of a patient’s treatment, and the average daily tariff.
The actual care day (ACD) is a hypothetical day consisting of access to the patient’s home by all professional caregivers. Specifically, the ACD forms
Photocopying or distributing this PDF is prohibited without the permission of Health Administration Press, Chicago, IL.
For permission, please contact the Copyright Clearance Center at www.copyright.com. For reprints, please contact [email protected]
441
tIMe-DrIven actIvIty-baseD costIng
the tool for allocating the time for each resource to be dedicated to the integrated home care estimated for the patient.
In our analysis of the resources used by each profile, we did not include the general practitioner (GP). GPs work under an agreement with the regional health system. Prescription and over-the-counter medications from the local health service pharmacy and any reha-bilitation support were also excluded from consideration, because these costs would have resulted in excessive vari-ability in the costing model. The physi-cian considered for the various care profiles is a specialist or resuscitator, neither of whom has been taken into consideration for the purpose of calcu-lating the tariffs. This process was necessary for us to standardize the different modes of home care delivery. In the Campania region, specialists and resuscitators are never outsourced; they work for a local health authority to which the patient is assigned.
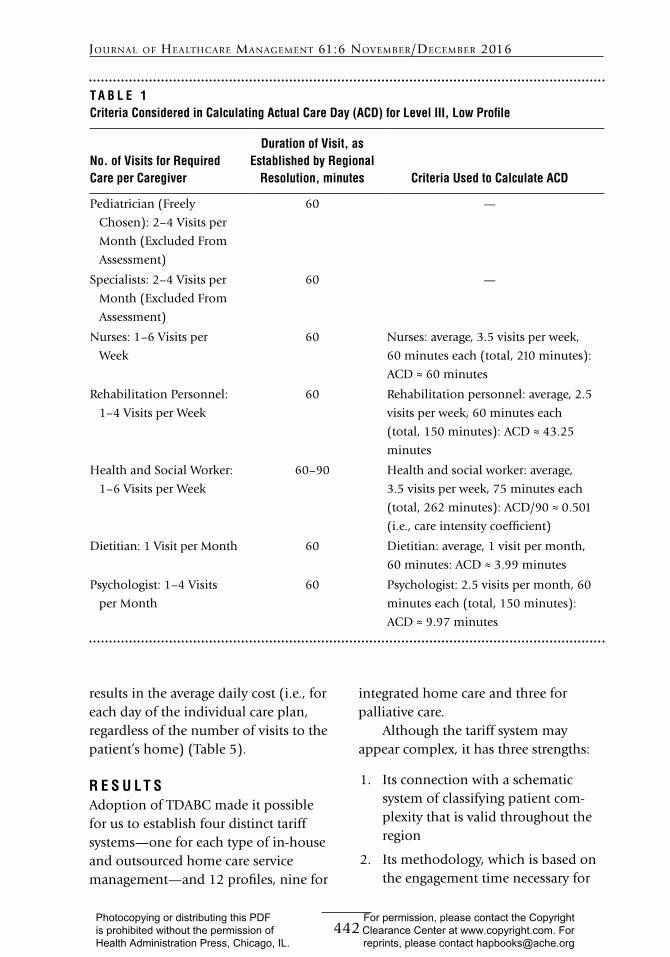
We present examples to illustrate the criteria used to calculate the home care rate for patients at level III (low profile), with outsourcing from the Italian Private Hospital Association. Table 1 presents the criteria used to calculate the ACD. The left-hand column indicates the minimum and maximum number of visits by professional caregivers, as projected by the working group. The middle column shows the average time per visit, as established under regional law. The right-hand column shows the criteria established for the ACD. Specifi-cally, it identifies the caregiver (exclud-ing physicians) with the greatest average number of required visits. The average number of visits per week by this
caregiver is associated with the individ-ual care plan’s duration (in this exam-ple, 3 months); the result is the average number of visits for the period of care, referred to as actual days of assistance. We compared the actual days of assistance by the caregiver who is present most commonly with the total number of days in the care plan to obtain the care intensity coefficient. We then compared the time and number of visits estimated for other caregivers with the average number of visits per week by the care-giver most commonly present to obtain the standard engagement for the actual day of assistance.
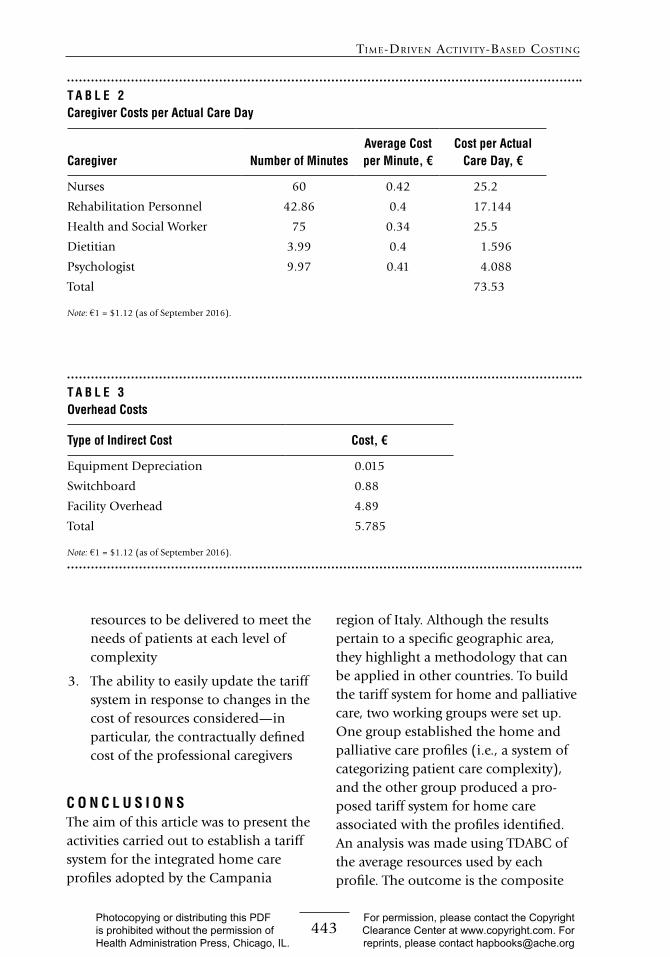
The average access time for each caregiver estimated to establish the ACD was calculated in terms of cost per minute (as stated in their contracts), thus establishing the daily human resources cost per ACD (Table 2).
In addition to the personnel cost per ACD, we needed to include the direct costs of the nursing kit (e.g., disposable gloves, masks, syringes, totaling € 2.21) and the overhead cost based on the time allocated per patient (Table 3).
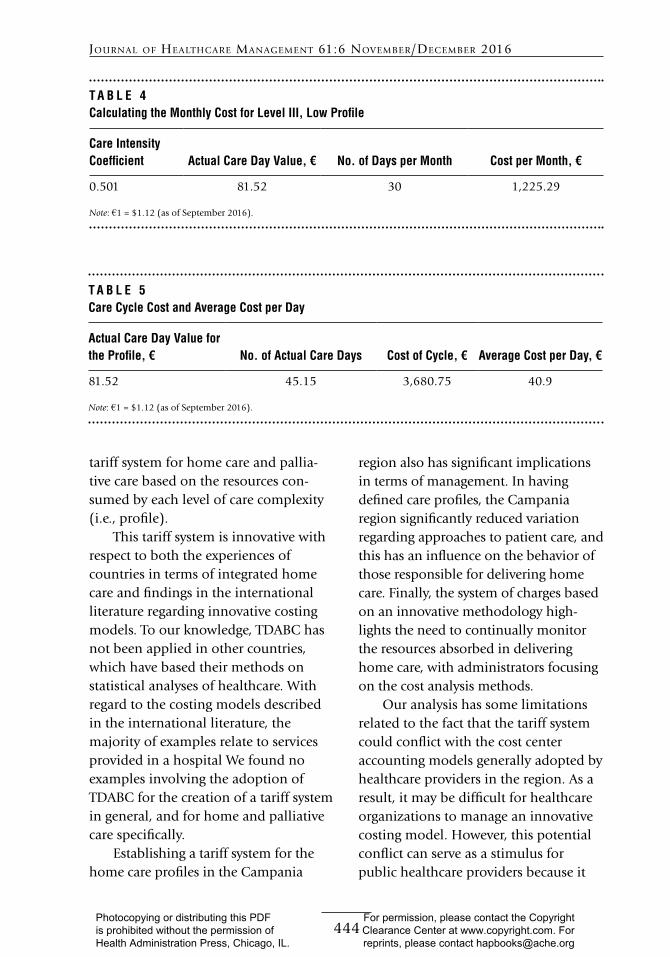
The total cost (€ 81.52) is the value of the ACD, which, when multiplied by the care intensity coefficient (0.501) and by 30 (i.e., days in the month), results in the cost per month (Table 4) for that complexity profile.
Multiplying the value of the ACD by the average number of ACDs estimated for that complexity profile results in the patient’s care cycle cost. Dividing this care cycle cost by the number of days of care estimated for the individual care plan (180 days for levels I and II, 90 days for level III, and 60 days for pallia-tive care for terminally ill patients)
Photocopying or distributing this PDF is prohibited without the permission of Health Administration Press, Chicago, IL.
For permission, please contact the Copyright Clearance Center at www.copyright.com. For reprints, please contact [email protected]
442
Journal of HealtHcare ManageMent 61:6 noveMber/DeceMber 2016
results in the average daily cost (i.e., for each day of the individual care plan, regardless of the number of visits to the patient’s home) (Table 5).
R E S U L T SAdoption of TDABC made it possible for us to establish four distinct tariff systems—one for each type of in-house and outsourced home care service management—and 12 profiles, nine for
integrated home care and three for palliative care.
Although the tariff system may appear complex, it has three strengths:
1. Its connection with a schematic system of classifying patient com-plexity that is valid throughout the region
2. Its methodology, which is based on the engagement time necessary for
T A B L E 1Criteria Considered in Calculating Actual Care Day (ACD) for Level III, Low Profile
No. of Visits for Required Care per Caregiver
Duration of Visit, as Established by Regional
Resolution, minutes Criteria Used to Calculate ACD
Pediatrician (Freely
Chosen): 2–4 Visits per
Month (Excluded From
Assessment)
60 —
Specialists: 2–4 Visits per
Month (Excluded From
Assessment)
60 —
Nurses: 1–6 Visits per
Week
60 Nurses: average, 3.5 visits per week,
60 minutes each (total, 210 minutes):
ACD ≈ 60 minutes
Rehabilitation Personnel:
1–4 Visits per Week
60 Rehabilitation personnel: average, 2.5
visits per week, 60 minutes each
(total, 150 minutes): ACD ≈ 43.25
minutes
Health and Social Worker:
1–6 Visits per Week
60–90 Health and social worker: average,
3.5 visits per week, 75 minutes each
(total, 262 minutes): ACD/90 ≈ 0.501
(i.e., care intensity coefficient)
Dietitian: 1 Visit per Month 60 Dietitian: average, 1 visit per month,
60 minutes: ACD ≈ 3.99 minutes
Psychologist: 1–4 Visits
per Month
60 Psychologist: 2.5 visits per month, 60
minutes each (total, 150 minutes):
ACD ≈ 9.97 minutes
Photocopying or distributing this PDF is prohibited without the permission of Health Administration Press, Chicago, IL.
For permission, please contact the Copyright Clearance Center at www.copyright.com. For reprints, please contact [email protected]
443
tIMe-DrIven actIvIty-baseD costIng
resources to be delivered to meet the needs of patients at each level of complexity
3. The ability to easily update the tariff system in response to changes in the cost of resources considered—in particular, the contractually defined cost of the professional caregivers
C O N C L U S I O N S The aim of this article was to present the activities carried out to establish a tariff system for the integrated home care profiles adopted by the Campania
region of Italy. Although the results pertain to a specific geographic area, they highlight a methodology that can be applied in other countries. To build the tariff system for home and palliative care, two working groups were set up. One group established the home and palliative care profiles (i.e., a system of categorizing patient care complexity), and the other group produced a pro-posed tariff system for home care associated with the profiles identified. An analysis was made using TDABC of the average resources used by each profile. The outcome is the composite
T A B L E 2Caregiver Costs per Actual Care Day
Caregiver Number of MinutesAverage Cost per Minute, €
Cost per Actual Care Day, €
Nurses 60 0.42 25.2
Rehabilitation Personnel 42.86 0.4 17.144
Health and Social Worker 75 0.34 25.5
Dietitian 3.99 0.4 1.596
Psychologist 9.97 0.41 4.088
Total 73.53
Note: €1 = $1.12 (as of September 2016).
T A B L E 3 Overhead Costs
Type of Indirect Cost Cost, €
Equipment Depreciation 0.015
Switchboard 0.88
Facility Overhead 4.89
Total 5.785
Note: €1 = $1.12 (as of September 2016).
Photocopying or distributing this PDF is prohibited without the permission of Health Administration Press, Chicago, IL.
For permission, please contact the Copyright Clearance Center at www.copyright.com. For reprints, please contact [email protected]
444
Journal of HealtHcare ManageMent 61:6 noveMber/DeceMber 2016
tariff system for home care and pallia-tive care based on the resources con-sumed by each level of care complexity (i.e., profile).
This tariff system is innovative with respect to both the experiences of countries in terms of integrated home care and findings in the international literature regarding innovative costing models. To our knowledge, TDABC has not been applied in other countries, which have based their methods on statistical analyses of healthcare. With regard to the costing models described in the international literature, the majority of examples relate to services provided in a hospital We found no examples involving the adoption of TDABC for the creation of a tariff system in general, and for home and palliative care specifically.
Establishing a tariff system for the home care profiles in the Campania
region also has significant implications in terms of management. In having defined care profiles, the Campania region significantly reduced variation regarding approaches to patient care, and this has an influence on the behavior of those responsible for delivering home care. Finally, the system of charges based on an innovative methodology high-lights the need to continually monitor the resources absorbed in delivering home care, with administrators focusing on the cost analysis methods.
Our analysis has some limitations related to the fact that the tariff system could conflict with the cost center accounting models generally adopted by healthcare providers in the region. As a result, it may be difficult for healthcare organizations to manage an innovative costing model. However, this potential conflict can serve as a stimulus for public healthcare providers because it
T A B L E 4Calculating the Monthly Cost for Level III, Low Profile
Care Intensity Coefficient Actual Care Day Value, € No. of Days per Month Cost per Month, €
0.501 81.52 30 1,225.29
Note: €1 = $1.12 (as of September 2016).
T A B L E 5Care Cycle Cost and Average Cost per Day
Actual Care Day Value for the Profile, € No. of Actual Care Days Cost of Cycle, € Average Cost per Day, €
81.52 45.15 3,680.75 40.9
Note: €1 = $1.12 (as of September 2016).
Photocopying or distributing this PDF is prohibited without the permission of Health Administration Press, Chicago, IL.
For permission, please contact the Copyright Clearance Center at www.copyright.com. For reprints, please contact [email protected]
445
tIMe-DrIven actIvIty-baseD costIng
points to the need to implement a suitable monitoring system, not only for economic factors but for the tariff system itself. In particular, the need to implement effective economic monitor-ing has already had the effect of encour-aging analysis of financial statements and management control data of local health service providers in the Campa-nia region to allow the traceability of resources used for home and palliative care delivery.
Future research should focus on (1) comparing the tariff system developed in the region with other tariff systems for home and palliative care used in countries in which activity-based costing systems are routinely adopted, and (2) analyzing the organizational changes and transformations in financial moni-toring that adoption of the tariff system will bring about in local health authori-ties run by the Campania regional government. This means that Italian regional governments will need to develop increasingly sophisticated systems for monitoring the costs of health services to ensure they are in line with the costing standards laid down at the ministerial level. Governmental healthcare agencies will also need to implement advanced costing systems based on the resources used to deliver healthcare services.
R E F E R E N C E SArnaboldi, M., & Lapsley, I. (2005). Activity
based costing in healthcare: A UK case study. Research in Healthcare Financial Management, 10(1), 61–75.
Balakrishnan, K., Goico, B., & Arjmand, E. M. (2015). Applying cost accounting to operating room staffing in otolaryngology time-driven activity-based costing and outpatient adenotonsillectomy.
Otolaryngology—Head and Neck Surgery, 152(4), 684–690.
Bjørnenak, T., & Mitchell, F. (2002). The development of activity-based costing journal literature, 1987-2000. European Accounting Review, 11(3), 481–508.
Canby, J. IV. (1995). Applying activity-based costing to healthcare settings. Healthcare Financial Management, 49(2), 50–56.
Cannavacciuolo, L., Illario, M., Ippolito, A., & Ponsiglione, C. (2015). An activity-based costing approach for detecting inefficien-cies of healthcare processes. Business Process Management Journal, 21(1), 55–79.
Cappetini, R., Chow, C., & McNamee, A. (1998). On the need and opportunities for improving costing and cost management in healthcare organizations. Managerial Finance, 24(8), 46–59.
Cardinaels, E., Roodhooft, F., & Van Herck, G. (2004). Drivers of cost system develop-ment in hospitals: Result of a survey. Health Policy, 69(2), 239–245.
Cardinaels, E., & Soderstrom, N. (2013). Managing in a complex world: Accounting and governance choices in hospitals. European Accounting Review, 22(4), 647–684.
Chan, Y. C. (1993). Improving hospital cost accounting with activity-based costing. Health Care Management Review, 18(1), 71–77.
Demeere, N., Stouthuysen, K., & Roodhooft, F. (2009). Time-driven activity-based costing in an outpatient clinic environment: Development, relevance and managerial impact. Health Policy, 92(2), 296–304.
Donovan, C. J., Hopkins, M., Kimmel, B. M., Koberna, S., & Montie, C. A. (2014). How Cleveland Clinic used TDABC to improve value. Healthcare Financial Management, 68(6), 84–88.
Eldenburg, L., & Kallapur, S. (2000). The effects of changes in cost allocations on the assessment of cost containment regulation in hospitals. Journal of Accounting and Public Policy, 19(1), 97–112.
Erhun, F., Mistry, B., Platchek, T., Milstein, A., Narayanan, V. G., & Kaplan, R. S. (2015). Time-driven activity-based costing of multivessel coronary artery bypass grafting across national boundaries to identify improvement opportunities: Study protocol. BMJ, 5(8), e008765.
Gil, D., & Hartmann, F. (2007). How CEOs use management information systems for
Photocopying or distributing this PDF is prohibited without the permission of Health Administration Press, Chicago, IL.
For permission, please contact the Copyright Clearance Center at www.copyright.com. For reprints, please contact [email protected]
446
Journal of HealtHcare ManageMent 61:6 noveMber/DeceMber 2016
strategy implementation in hospitals. Health Policy, 81(1), 29–41.
Grabowski, D. C., & Gruber, J. (2007). Moral hazard in nursing home use. Journal of Health Economics, 26(3), 560–577.
Grant, P. (2015). How much does a diabetes out-patient appointment actually cost? An argument for PLICS. Journal of Health Organization and Management, 29(2), 154–169.
Hovenga, E. J. (1996). Casemix and informa-tion systems. In E. J. Hovenga, M. Kidd, & B. Cesnik (Eds.), Health informatics: An overview (pp. 313–338). Melbourne, Australia: Churchill Livingstone.
Hsu, S. H., & Qu, S. Q. (2012). Strategic cost management and institutional changes in hospitals. European Accounting Review, 21(3), 499–531.
Jacobs, K., Marcon, G., & Witt, D. (2004). Cost and performance information for doctors: An international comparison. Management Accounting Research, 15(3), 337–354.
Kaplan, A. L., Agarwal, N., Setlur, N. P., Tan, H. J., Niedzwiecki, D., McLaughlin, N., . . . Saigal, C. S. (2015). Measuring the cost of care in benign prostatic hyperplasia using time-driven activity-based costing (TDABC). Healthcare, 3(1), 43–48.
Kaplan, R. S., & Anderson, S. (2003). Time-driven activity-based costing. Retrieved from http://papers.ssrn.com/sol3/papers .cfm?abstract_id=485443.
Kaplan, R. S., & Anderson, S. (2004). Time-driven activity-based costing. Harvard Business Review, 82(11), 131–138.
Kaplan, R. S., & Anderson, S. (2007). The innovation of time-driven activity-based costing. Journal of Cost Management, 21(2), 5–15.
Kaplan, R. S., & Anderson, S. (2013). Time-driven activity-based costing: A simpler and more powerful path to higher profits. Boston, MA: Harvard Business Publishing.
Kaplan, R. S., & Porter, M. E. (2011). How to solve the cost crises in health care. Harvard Business Review, 89(9), 47–64.
Kaplan, R. S., Witkowski, M., Abbott, M., Guzman, A. B., Higgins, L. D., Meara, J. G., . . . Feeley, T. W. (2014). Using time-driven activity-based costing to identify value improvement. Journal of Healthcare Management, 59(6), 399–412.
Kuhn, M., & Nuscheler, R. (2011). Optimal public provision of nursing homes and the
role of information. Journal of Health Economics, 30(4), 795–810.
Lievens, Y., Obyn, C., Mertens, A. S., Van Halewyck, D., & Hulstaert, F. (2015). Stereotactic body radiotherapy for lung cancer: How much does it really cost? Journal of Thoracic Oncology, 10(3), 454–461.
Mandigo, M., O’Neill, K., Mistry, B., Mundy, B., Millien, C., Nazaire, Y., . . . Kaplan, R. S. (2015). A time-driven activity-based costing model to improve health-care resource use in Mirebalais, Haiti (Special issue). The Lancet, 385, S22.
McLaughlin, N., Burke, M. A., Setlur, N. P., Niedzwiecki, D. R., Kaplan, A. L., Saigal, C., . . . Kaplan, R. S. (2014). Time-driven activity-based costing: A driver for provider engagement in costing activities and redesign initiatives. Neurosurgical Focus, 37(5), E3.
McLaughlin, N., Upadhyaya, P., Buxey, F., & Martin, N. A. (2014). Value-based neuro-surgery: Measuring and reducing the cost of microvascular decompression surgery: Clinical article. Journal of Neurosurgery, 121(3), 700–708.
Misono, A. S., Oklu, R., & Prabhakar, A. M. (2015). Time-driven activity-based costing trumps traditional cost accounting for radiologists. American Journal of Roent-genology, 204(2), W217–W217.
Network Non Autosufficienza. (2013). L’assistenza agli anziani non autosufficienti in Italia, IV Rapporto. Rimini, Italy: Maggioli Eds.
Pettersen, I. J. (2001). Implementing manage-ment accounting reforms in the public sector: The difficult journey from inten-tions to effects. European Accounting Review, 10(3), 561–581.
Porter, M. E. (2009). A strategy for health care reform: Toward a value-based system. New England Journal of Medicine, 361(2), 109–112.
Porter, M. E. (2010). What is value in health care? New England Journal of Medicine, 363(26), 2477–2481.
Ramsey, R. IV. (1994). Activity based costing for hospitals. Hospital and Health Service Administration, 39(3), 385–396.
Rechel, B., Doyle, Y., Grundy, E., & McKee, M. (2009). How can health systems respond to population ageing? Policy Brief 10. Copenhagen, Denmark: World Health Organization Regional Office for Europe.
Photocopying or distributing this PDF is prohibited without the permission of Health Administration Press, Chicago, IL.
For permission, please contact the Copyright Clearance Center at www.copyright.com. For reprints, please contact [email protected]
447
tIMe-DrIven actIvIty-baseD costIng
Ross, T. (2004). Analyzing health care opera-tions using ABC. Journal of Health Care Finance, 30(3), 1–20.
Soderstrom, N. S., & Noreen, E. W. (1997). The accuracy of proportional cost models: Evidence from hospital service depart-ments. Review of Accounting Studies, 2(1), 89–114.
Thaker, N. G., Frank, S. J., & Feeley, T. W. (2015). Comparative costs of advanced proton and photon radiation therapies: Lessons from time-driven activity-based costing in head and neck cancer. Journal of
Comparative Effectiveness Research, 4(4), 297–301.
Tse, M., & Gong, M. (2009). Recognition of idle resources in time-driven activity-based costing and resource consumption accounting models. Journal of Applied Management Accounting Research, 7(2), 41–54.
Yun, B. J., Prabhakar, A. M., Warsh, J., Kaplan, R. S., Brennan, J., Dempsey, K. E., & Raja, A. S. (2015). Time-driven activity-based costing in emergency medicine. Annals of Emergency Medicine, 67(6), 765–772.
P R A C T I T I O N E R A P P L I C A T I O N
Nicolas Carmona III, senior administrative manager of cardiac surgery, Johns Hopkins University, Baltimore, Maryland
H ealthcare providers, administrators, researchers, and other stakeholders generally recognize that methods of calculating costs can be flawed. They differ by institu-
tions and types of patient care. Variability in patient outcomes and disjointed pro-cesses also make integration and measurement of data from different sources difficult.
Ippolito et al. expose the limitations of cost centers. By exploring time-driven activity-based costing (TDABC) for the establishment of tariffs on home care services, they show that granularity in measuring cost is achievable. They used levels of patient complexity, types of care delivered, and provider types to calculate cost per actual care day. Moreover, the study design allows for adjustment of the tariff when needed on the basis of changes in the cost of resources. This type of surveillance is also important for other types of healthcare services to identify costing opportunities. For example, Laviana et al. (2016) conducted a study in which they identified the most expensive procedures to treat prostate cancer, as well as the sources of variability in costs. They found a higher supply cost and lengthier inpatient stay for one procedure.
Combining TDABC and cost centers to accurately measure healthcare costs is possible. At The Johns Hopkins Hospital, our surgery administrator has implemented a method of cost accounting that combines the two. If I follow a cardiac patient from the operating room (OR) to the intensive care unit, measuring cost on the basis of time depends on the data available. For example, we are able to use TDABC in the OR to allocate costs accumulated in each cost center. Direct nursing costs are allo-cated on the basis of actual number of minutes in the OR when we are able to track them. However, achieving such granularity is not easy in an inpatient unit where actual nursing time spent in patient care remains an estimate. Therefore, our direct
Photocopying or distributing this PDF is prohibited without the permission of Health Administration Press, Chicago, IL.
For permission, please contact the Copyright Clearance Center at www.copyright.com. For reprints, please contact [email protected]

448
Journal of HealtHcare ManageMent 61:6 noveMber/DeceMber 2016
nursing costs in the intensive care unit are allocated on the basis of inpatient days, which is different from the method used in the OR.
Ippolito et al. also take into account the variability in complexity of patients’ conditions. Cost centers alone do not allow one to dissect the cost of care according to patient profiles, as the authors suggest. It is possible to use time as a measure of complexity and tie it to cost center allocation. Most industries can accurately base the cost of activities on their processes. Healthcare is increasingly sensitive to outcomes. According to Kaplan and Porter (2011), cost and complexity are inherently related. The problem lies in our inability to accurately correlate the two. The complexity of an activity usually does not vary in most industries. Thus, calculating a cost driver on the basis of total cost and time is accurate. However, in healthcare I have found that when the complexity changes by patient, the cost and time per patient can become skewed.
Identifying useful costing methods such as TDABC in tariff systems for home care or any other healthcare setting is essential to observe trends and accurately charge fees for services delivered.
R E F E R E N C E SKaplan, R. S., & Porter, M. E. (2011). How to solve the cost crisis in health care. Harvard Business
Review, 89(9), 46–61.Laviana, A. A., Ilg, A. M., Veruttipong, D., Tan, H. J., Burke, M. A., Niedzwiecki, D. R., . . . Saigal, C.
S. (2016). Utilizing time-driven activity-based costing to understand the short- and long-term costs of treating localized, low-risk prostate cancer. Cancer, 122(3), 447–455.
Photocopying or distributing this PDF is prohibited without the permission of Health Administration Press, Chicago, IL.
For permission, please contact the Copyright Clearance Center at www.copyright.com. For reprints, please contact [email protected]


![Regional Integration and Non-Tariff Measures in the ...by [..] removing non-tariff barriers to establish a free trade area at the community level [… and] the removal, among Member](https://img.pdfslide.us/doc/110x75/5e73720ac08bb279cb3cd618/regional-integration-and-non-tariff-measures-in-the-by-removing-non-tariff.jpg)