Embed Size (px)
Citation preview

International Journal of
Molecular Sciences
Article
Using Thermography to Confirm Genotypic Variationfor Drought Response in Maize
Raphael A. C. N. Casari 1, Dayane S. Paiva 1, Vivianny N. B. Silva 1,2 , Thalita M. M. Ferreira 1,2,Manoel T. Souza, Junior 1,2 , Nelson G. Oliveira 1, Adilson K. Kobayashi 1,Hugo B. C. Molinari 1 , Thiago T. Santos 3 , Reinaldo L. Gomide 4, Paulo C. Magalhães 4 andCarlos A. F. Sousa 1,5,*
1 Embrapa Agroenergia, Parque Estação Biológica (PqEB), Avenida W3 Norte (Final), Brasília 70.770-901, DF,Brazil; [email protected] (R.A.C.N.C.); [email protected] (D.S.P.);[email protected] (V.N.B.S.); [email protected] (T.M.M.F.);[email protected] (M.T.S.J.); [email protected] (N.G.O.);[email protected] (A.K.K.); [email protected] (H.B.C.M.)
2 Universidade Federal de Lavras, Campus Universitário, Lavras 37.200-000, MG, Brazil3 Embrapa Informática, Av. Dr. André Tosello, 209 - Cidade Universitária, Campinas 13.083-886, SP, Brazil;
[email protected] Embrapa Milho e Sorgo, Rod. MG 424 km 45, Zona Rural, Sete Lagoas 35.701-970, MG, Brazil;
[email protected] (R.L.G.); [email protected] (P.C.M.)5 Embrapa Meio-Norte, Av. Duque de Caxias 5650, Teresina 64.006-245, PI, Brazil* Correspondence: [email protected]; Tel.: +51-61-34481581; Fax: +51-61-34481589
Received: 28 February 2019; Accepted: 3 April 2019; Published: 8 May 2019�����������������
Abstract: The feasibility of thermography as a technique for plant screening aiming atdrought-tolerance has been proven by its relationship with gas exchange, biomass, and yield.In this study, unlike most of the previous, thermography was applied for phenotyping contrastingmaize genotypes whose classification for drought tolerance had already been established in the field.Our objective was to determine whether thermography-based classification would discriminate themaize genotypes in a similar way as the field selection in which just grain yield was taken into accountas a criterion. We evaluated gas exchange, daily water consumption, leaf relative water content,aboveground biomass, and grain yield. Indeed, the screening of maize genotypes based on canopytemperature showed similar results to traditional methods. Nevertheless, canopy temperature onlypartially reflected gas exchange rates and daily water consumption in plants under drought. Part ofthe explanation may lie in the changes that drought had caused in plant leaves and canopy structure,altering absorption and dissipation of energy, photosynthesis, transpiration, and partitioning rates.Accordingly, although there was a negative relationship between grain yield and plant canopytemperature, it does not necessarily mean that plants whose canopies were maintained cooler underdrought achieved the highest yield.
Keywords: abiotic stress; canopy temperature; plant phenotyping; thermal image; water deficit;Zea mays
1. Introduction
The advancement and intensification of abiotic stresses over traditional areas of crops has increasedinterest in studies leading to the understanding of the effects of such stresses on plants. The foremostgoal behind these studies is aimed at exploring traits capable of making genotypes increasingly tolerantwith satisfactory productivity under increasing environmental pressures. In line with these new
Int. J. Mol. Sci. 2019, 20, 2273; doi:10.3390/ijms20092273 www.mdpi.com/journal/ijms

Int. J. Mol. Sci. 2019, 20, 2273 2 of 22
challenges, water deficit stress is one of the most intensely studied for its importance, which arisesfrom the damage caused and its extent [1–7].
Maize (Zea mays) is a key crop for food and feed security and income generation for millions ofsmallholder farmers in sub-Saharan Africa, Asia, and Latin America [8]. In the USA, besides these morecommon uses, it has also long been used for ethanol production [9]. In Brazil, the maize productionchain has been traditionally focused on food and feed. Until recently, the Brazilian biofuels programdepended exclusively on sugarcane, especially for ethanol production [10]. Since 2012, due to problemsrelated to grain commercialization and storage, the Brazilian government authorized the production ofethanol from maize in the Central-West region of the country. In addition to the drought problemsalready faced by maize in some regions, this new perspective of use for the grain will generate ademand for higher yielding genotypes more tolerant to drought and other stresses in order to meet thenew challenges.
Maize is a crop that has been widely studied for increased drought tolerance as a result ofrecurrent grain yield losses related to water deficit in several traditional agricultural areas around theworld [4,8,11–14]. Due to its importance for human consumption, especially in developing countries,maize was chosen as one of the crops to be studied under the Generation Challenge Programme (GCP)aiming at tolerance to environmental stress (https://www.generationcp.org/). GCP was an initiative ofConsultative Group on International Agricultural Research (CGIAR), which is a global partnershipthat unites organizations engaged in research for a food-secured future.
The National Maize and Sorghum Research Center (CNPMS) from the Brazilian AgriculturalResearch Corporation (Embrapa) participated in the GCP by evaluating hundreds of maize genotypesunder drought conditions in the target environment. Due to the number and size of trials spreadthroughout several environments and also the complexity and interconnection of the research network,grain yield was the only measurable trait. Thus, grain yield under drought was used as the onlycriterion for drought tolerance screening of maize genotypes in study. Genotypes with the highestyield were classified as drought-tolerant, while the lowest ones were classified as drought-sensitive.Those genotypes with grain yield between the two extremes were considered as intermediate.
There are several reports in the literature showing that, under water deficit, there is a significantnegative correlation between canopy temperature and yield [15–17]. Many quantitative trait loci forcanopy temperature have been mapped which also have pleiotropic effects for biomass and yield [18,19].For maize, in particular, it has been found that genotypes selected as most drought tolerant in termsof yield showed lower canopy temperature, as well as higher stomatal conductance [16,20]. Theseresults indicate that thermography may be applied to maize genetic breeding in the screening fordrought tolerance.
The screening of hundreds or even thousands of genotypes in different environments is a commontask in a plant breeding program. For drought, plants are cultivated under environments in whichstress occurs at different growth stages, varying in both duration and intensity. Due to the increasingdemand for phenotyping, which normally requires celerity, precision, reliability, reproducibility, andreduction of labor and costs, the traditional methods of plant phenotyping are limited [20–22]. Tomeet such high requirements, new and modern methods have been developed to complement oreven replace the traditional ones, especially those using images that correlate with parameters ofinterest. Thermal imaging has been widely used in studies on characterization of plants subjected towater deprivation, whether due to drought or salinity stress. It showed a high correlation with gasexchange [15,23,24] and, to a lesser extent, to biomass accumulation and yield [15,17,20,21].
In this study, thermography was applied for phenotyping of contrasting maize genotypes whoseclassification for drought tolerance had already been established in previous studies carried out byEmbrapa/CNPMS within the scope of the GCP, as previously mentioned. For this, the most contrastinggenotypes discriminated on that occasion were chosen. For maize drought tolerance classificationby thermography, it was assumed that plants whose canopies showed a lower temperature underwater deficit stress are more tolerant to drought than those with higher canopy temperature. Thus,
Int. J. Mol. Sci. 2019, 20, 2273 3 of 22
the objective of this study was to determine whether thermography-based classification for droughttolerance in maize would discriminate the genotypes in a similar way as that previous selection inwhich just grain yield was taken into account.
2. Results
2.1. Drought Effect on Visual Aspect, Leaf Thermal Pixels and Canopy Temperature of Maize Plants
Figure 1 shows RGB and thermal images of the maize plants used in this study. Such images arecomposed of plants from BRS 1030, BRS 1010, 2B 707 and DKB 390 genotypes, which were selectedfrom hundreds of phenotyped materials under field conditions. In the field phenotyping process, onlythe grain yield was considered as a screening criterion. Thus, the higher the grain yield the greater thetolerance, and the lower the grain yield the greater the sensitivity to drought. Based on this premise,BRS 1010 was classified as sensitive, while 2B 707 and DKB 390 were considered as drought tolerant.BRS 1030 was classified as intermediate because it showed a grain yield as low as a sensitive or as highas a tolerant, depending on the phenotyping site.
Int. J. Mol. Sci. 2019, 20, x 3 of 22
2. Results
2.1. Drought Effect on Visual Aspect, Leaf Thermal Pixels and Canopy Temperature of Maize Plants
Figure 1 shows RGB and thermal images of the maize plants used in this study. Such images are composed of plants from BRS 1030, BRS 1010, 2B 707 and DKB 390 genotypes, which were selected from hundreds of phenotyped materials under field conditions. In the field phenotyping process, only the grain yield was considered as a screening criterion. Thus, the higher the grain yield the greater the tolerance, and the lower the grain yield the greater the sensitivity to drought. Based on this premise, BRS 1010 was classified as sensitive, while 2B 707 and DKB 390 were considered as drought tolerant. BRS 1030 was classified as intermediate because it showed a grain yield as low as a sensitive or as high as a tolerant, depending on the phenotyping site.
Both raw visible (Figure 1A,B) and thermal images (Figure 1C,D) taken on the 4th and 12th day of drought stress made possible visual discrimination of controls from stressed plants. Thus, controls showed green, turgid, and erect leaves, while drought-stressed plants showed characteristic symptoms, such as leaf paleness in the 4th day (Figure 1A) and subsequently, leaf wilting and bending in the 12th day (Figure 1B). False color thermal images, visualized by means of a rainbow color scale, showed drought-stressed plants as light blue, while control plants had dark blue canopies (Figure 1C,D).
Figure 1. (A,B) RGB and (C,D) thermal images of maize plants taken on the 4th (A,C) and 12th (B,D) day of drought stress. The upper (A,C) and left hand side (B,D) rows of dark green (RGB) and dark blue (thermal) are controls, while the lower and right hand side rows of pale green and light blue are drought-stressed plants.
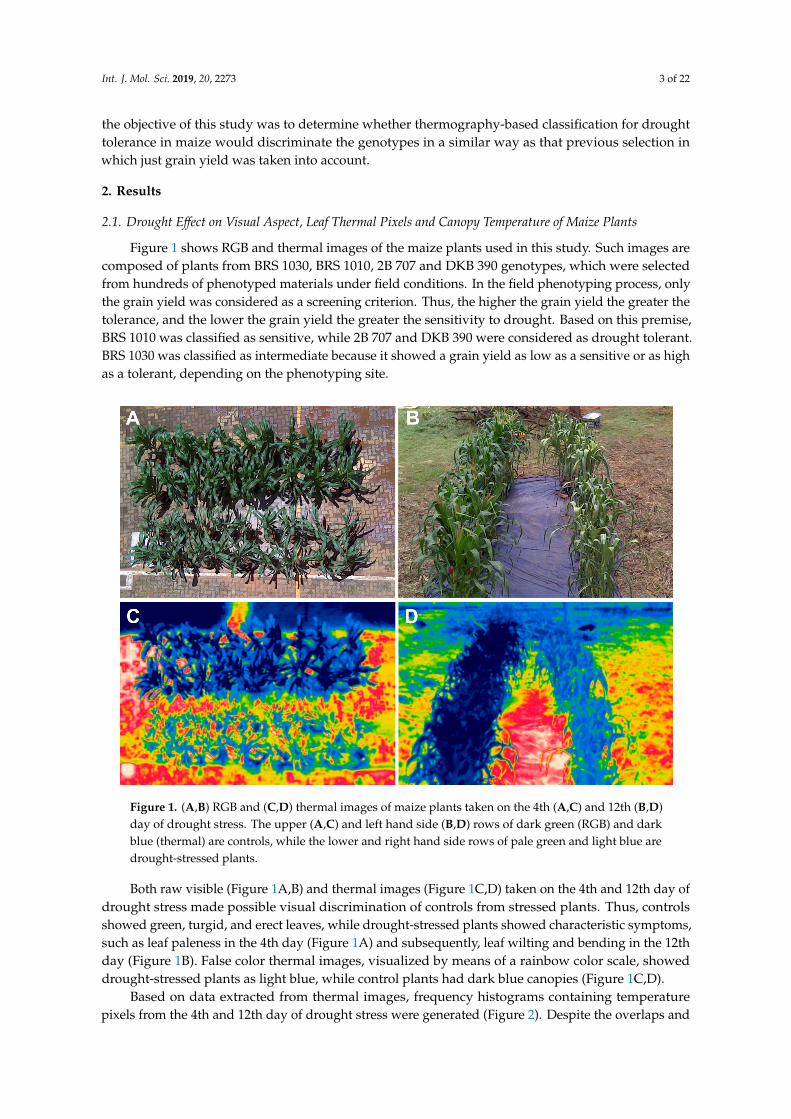
Based on data extracted from thermal images, frequency histograms containing temperature pixels from the 4th and 12th day of drought stress were generated (Figure 2). Despite the overlaps and the presence of outliers in both measurements, the ranges of canopy temperature were quite different
Figure 1. (A,B) RGB and (C,D) thermal images of maize plants taken on the 4th (A,C) and 12th (B,D)day of drought stress. The upper (A,C) and left hand side (B,D) rows of dark green (RGB) and darkblue (thermal) are controls, while the lower and right hand side rows of pale green and light blue aredrought-stressed plants.
Both raw visible (Figure 1A,B) and thermal images (Figure 1C,D) taken on the 4th and 12th day ofdrought stress made possible visual discrimination of controls from stressed plants. Thus, controlsshowed green, turgid, and erect leaves, while drought-stressed plants showed characteristic symptoms,such as leaf paleness in the 4th day (Figure 1A) and subsequently, leaf wilting and bending in the 12thday (Figure 1B). False color thermal images, visualized by means of a rainbow color scale, showeddrought-stressed plants as light blue, while control plants had dark blue canopies (Figure 1C,D).
Based on data extracted from thermal images, frequency histograms containing temperaturepixels from the 4th and 12th day of drought stress were generated (Figure 2). Despite the overlaps and
Int. J. Mol. Sci. 2019, 20, 2273 4 of 22
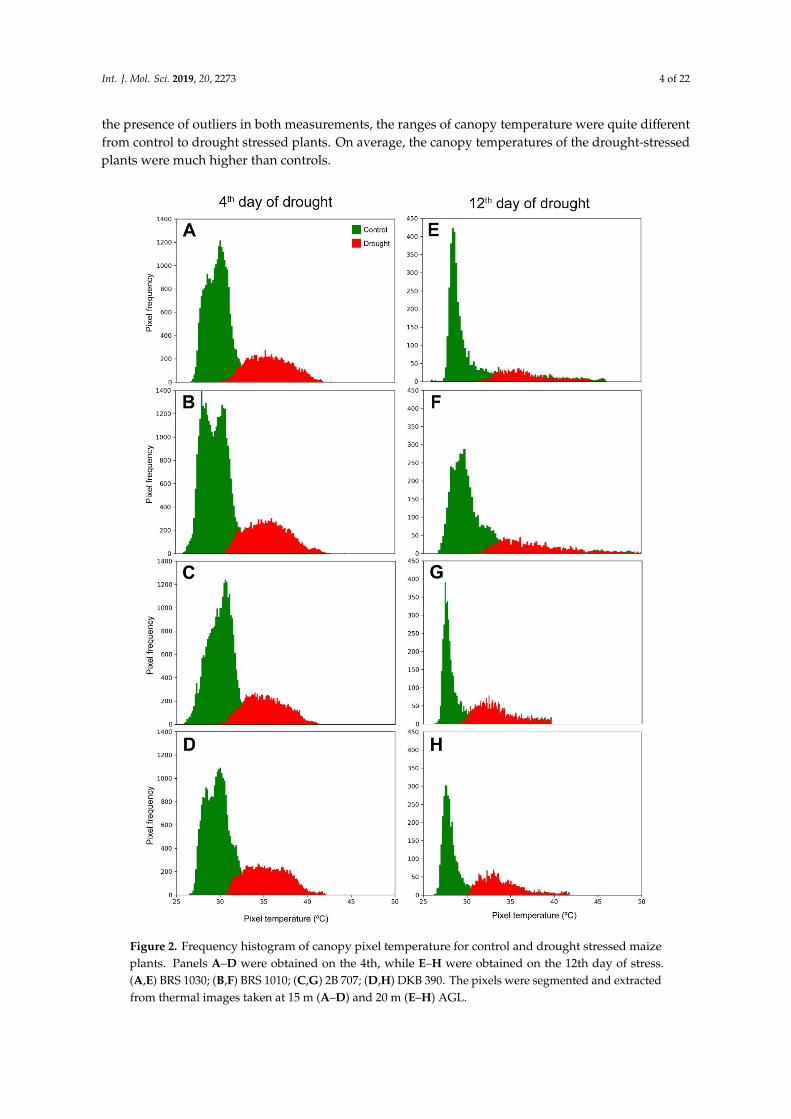
the presence of outliers in both measurements, the ranges of canopy temperature were quite differentfrom control to drought stressed plants. On average, the canopy temperatures of the drought-stressedplants were much higher than controls.
Int. J. Mol. Sci. 2019, 20, x 4 of 22
from control to drought stressed plants. On average, the canopy temperatures of the drought-stressed plants were much higher than controls.
Figure 2. Frequency histogram of canopy pixel temperature for control and drought stressed maize plants. Panels A–D were obtained on the 4th, while E–H were obtained on the 12th day of stress. (A,E) BRS 1030; (B,F) BRS 1010; (C,G) 2B 707; (D,H) DKB 390. The pixels were segmented and extracted from thermal images taken at 15 m (A–D) and 20 m (E–H) AGL.
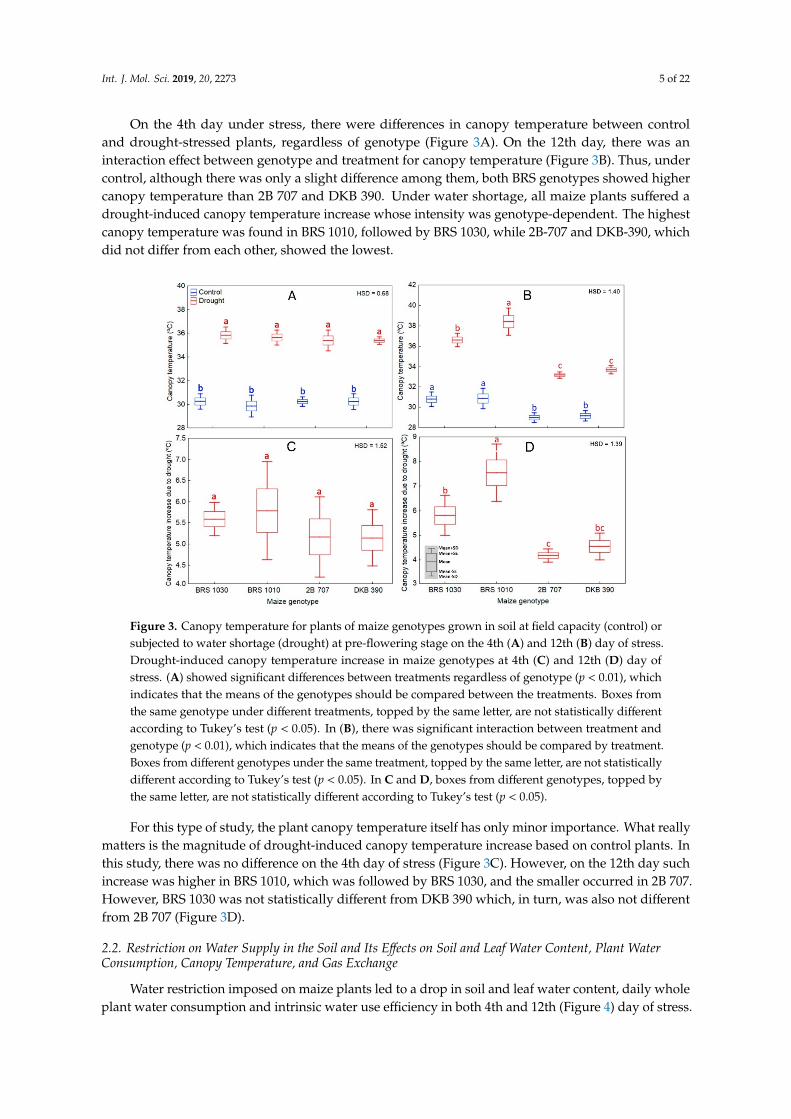
On the 4th day under stress, there were differences in canopy temperature between control and drought-stressed plants, regardless of genotype (Figure 3A). On the 12th day, there was an interaction
Figure 2. Frequency histogram of canopy pixel temperature for control and drought stressed maizeplants. Panels A–D were obtained on the 4th, while E–H were obtained on the 12th day of stress.(A,E) BRS 1030; (B,F) BRS 1010; (C,G) 2B 707; (D,H) DKB 390. The pixels were segmented and extractedfrom thermal images taken at 15 m (A–D) and 20 m (E–H) AGL.
Int. J. Mol. Sci. 2019, 20, 2273 5 of 22
On the 4th day under stress, there were differences in canopy temperature between controland drought-stressed plants, regardless of genotype (Figure 3A). On the 12th day, there was aninteraction effect between genotype and treatment for canopy temperature (Figure 3B). Thus, undercontrol, although there was only a slight difference among them, both BRS genotypes showed highercanopy temperature than 2B 707 and DKB 390. Under water shortage, all maize plants suffered adrought-induced canopy temperature increase whose intensity was genotype-dependent. The highestcanopy temperature was found in BRS 1010, followed by BRS 1030, while 2B-707 and DKB-390, whichdid not differ from each other, showed the lowest.
Int. J. Mol. Sci. 2019, 20, x 5 of 22
effect between genotype and treatment for canopy temperature (Figure 3B). Thus, under control, although there was only a slight difference among them, both BRS genotypes showed higher canopy temperature than 2B 707 and DKB 390. Under water shortage, all maize plants suffered a drought-induced canopy temperature increase whose intensity was genotype-dependent. The highest canopy temperature was found in BRS 1010, followed by BRS 1030, while 2B-707 and DKB-390, which did not differ from each other, showed the lowest.
For this type of study, the plant canopy temperature itself has only minor importance. What really matters is the magnitude of drought-induced canopy temperature increase based on control plants. In this study, there was no difference on the 4th day of stress (Figure 3C). However, on the 12th day such increase was higher in BRS 1010, which was followed by BRS 1030, and the smaller occurred in 2B 707. However, BRS 1030 was not statistically different from DKB 390 which, in turn, was also not different from 2B 707 (Figure 3D).
Figure 3. Canopy temperature for plants of maize genotypes grown in soil at field capacity (control) or subjected to water shortage (drought) at pre-flowering stage on the 4th (A) and 12th (B) day of stress. Drought-induced canopy temperature increase in maize genotypes at 4th (C) and 12th (D) day of stress. (A) showed significant differences between treatments regardless of genotype (p < 0.01), which indicates that the means of the genotypes should be compared between the treatments. Boxes from the same genotype under different treatments, topped by the same letter, are not statistically different according to Tukey’s test (p < 0.05). In (B), there was significant interaction between treatment and genotype (p < 0.01), which indicates that the means of the genotypes should be compared by treatment. Boxes from different genotypes under the same treatment, topped by the same letter, are not statistically different according to Tukey’s test (p < 0.05). In C and D, boxes from different genotypes, topped by the same letter, are not statistically different according to Tukey’s test (p < 0.05).
2.2. Restriction on Water Supply in the Soil and Its Effects on Soil and Leaf Water Content, Plant Water Consumption, Canopy Temperature, and Gas Exchange
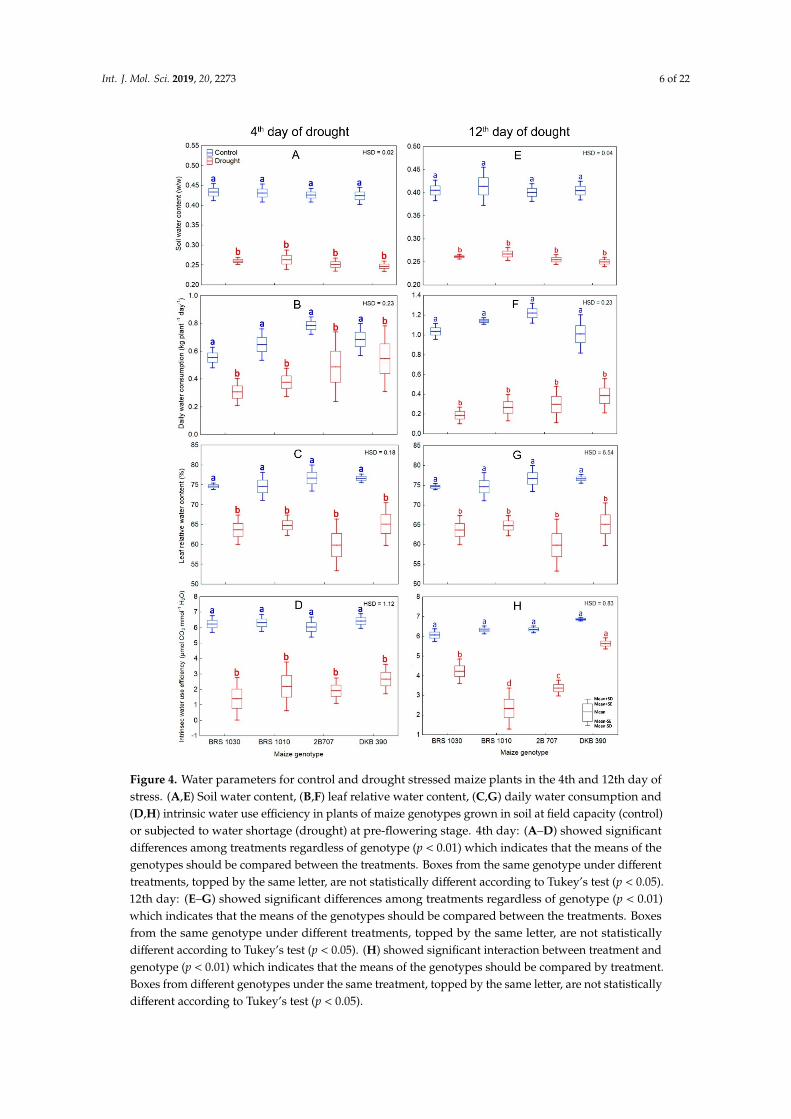
Water restriction imposed on maize plants led to a drop in soil and leaf water content, daily whole plant water consumption and intrinsic water use efficiency in both 4th and 12th (Figure 4) day of stress.
Figure 3. Canopy temperature for plants of maize genotypes grown in soil at field capacity (control) orsubjected to water shortage (drought) at pre-flowering stage on the 4th (A) and 12th (B) day of stress.Drought-induced canopy temperature increase in maize genotypes at 4th (C) and 12th (D) day ofstress. (A) showed significant differences between treatments regardless of genotype (p < 0.01), whichindicates that the means of the genotypes should be compared between the treatments. Boxes fromthe same genotype under different treatments, topped by the same letter, are not statistically differentaccording to Tukey’s test (p < 0.05). In (B), there was significant interaction between treatment andgenotype (p < 0.01), which indicates that the means of the genotypes should be compared by treatment.Boxes from different genotypes under the same treatment, topped by the same letter, are not statisticallydifferent according to Tukey’s test (p < 0.05). In C and D, boxes from different genotypes, topped bythe same letter, are not statistically different according to Tukey’s test (p < 0.05).
For this type of study, the plant canopy temperature itself has only minor importance. What reallymatters is the magnitude of drought-induced canopy temperature increase based on control plants. Inthis study, there was no difference on the 4th day of stress (Figure 3C). However, on the 12th day suchincrease was higher in BRS 1010, which was followed by BRS 1030, and the smaller occurred in 2B 707.However, BRS 1030 was not statistically different from DKB 390 which, in turn, was also not differentfrom 2B 707 (Figure 3D).
2.2. Restriction on Water Supply in the Soil and Its Effects on Soil and Leaf Water Content, Plant WaterConsumption, Canopy Temperature, and Gas Exchange
Water restriction imposed on maize plants led to a drop in soil and leaf water content, daily wholeplant water consumption and intrinsic water use efficiency in both 4th and 12th (Figure 4) day of stress.
Int. J. Mol. Sci. 2019, 20, 2273 6 of 22Int. J. Mol. Sci. 2019, 20, x 6 of 22
Figure 4. Water parameters for control and drought stressed maize plants in the 4th and 12th day of stress. (A,E) Soil water content, (B,F) leaf relative water content, (C,G) daily water consumption and (D,H) intrinsic water use efficiency in plants of maize genotypes grown in soil at field capacity (control) or subjected to water shortage (drought) at pre-flowering stage. 4th day: (A–D) showed significant differences among treatments regardless of genotype (p < 0.01) which indicates that the means of the genotypes should be compared between the treatments. Boxes from the same genotype under different treatments, topped by the same letter, are not statistically different according to Tukey’s test (p < 0.05). 12th day: (E–G) showed significant differences among treatments regardless of genotype (p < 0.01) which indicates that the means of the genotypes should be compared between the treatments. Boxes from the same genotype under different treatments, topped by the same letter, are not statistically different according to Tukey’s test (p < 0.05). (H) showed significant interaction between treatment and genotype (p < 0.01) which indicates that the means of the genotypes should
Figure 4. Water parameters for control and drought stressed maize plants in the 4th and 12th day ofstress. (A,E) Soil water content, (B,F) leaf relative water content, (C,G) daily water consumption and(D,H) intrinsic water use efficiency in plants of maize genotypes grown in soil at field capacity (control)or subjected to water shortage (drought) at pre-flowering stage. 4th day: (A–D) showed significantdifferences among treatments regardless of genotype (p < 0.01) which indicates that the means of thegenotypes should be compared between the treatments. Boxes from the same genotype under differenttreatments, topped by the same letter, are not statistically different according to Tukey’s test (p < 0.05).12th day: (E–G) showed significant differences among treatments regardless of genotype (p < 0.01)which indicates that the means of the genotypes should be compared between the treatments. Boxesfrom the same genotype under different treatments, topped by the same letter, are not statisticallydifferent according to Tukey’s test (p < 0.05). (H) showed significant interaction between treatment andgenotype (p < 0.01) which indicates that the means of the genotypes should be compared by treatment.Boxes from different genotypes under the same treatment, topped by the same letter, are not statisticallydifferent according to Tukey’s test (p < 0.05).

Int. J. Mol. Sci. 2019, 20, 2273 7 of 22
In parallel, a strong reduction in leaf gas exchange occurred (Figure 5A–C,E–G). Furthermore,drought caused an increase in internal CO2 concentration (Ci) in all genotypes (Figure 5D,H). Differencesin gas exchange rates between control and drought stressed plants were generally considerably higherthan those in canopy temperature. The severity at which these characteristics were affected by droughtwas not genotype-dependent in the 4th day. However, in the 12th day of stress all the parameters derivedfrom gas exchange showed interaction between treatment and genotype (Figure 4H, Figure 5E–H).
Int. J. Mol. Sci. 2019, 20, x 7 of 22
be compared by treatment. Boxes from different genotypes under the same treatment, topped by the same letter, are not statistically different according to Tukey’s test (p < 0.05).
In parallel, a strong reduction in leaf gas exchange occurred (Figure 5A–C; 5E–G). Furthermore, drought caused an increase in internal CO2 concentration (Ci) in all genotypes (Figure 5D,H). Differences in gas exchange rates between control and drought stressed plants were generally considerably higher than those in canopy temperature. The severity at which these characteristics were affected by drought was not genotype-dependent in the 4th day. However, in the 12th day of stress all the parameters derived from gas exchange showed interaction between treatment and genotype (Figure 4H, Figure 5E–H).
Figure 5. Gas exchange measurements for control and drought stressed maize plants in the 4th and 12thday of stress. (A,E) Net CO2 assimilation rate, (B,F) Conductance to water vapor, (C,G) Transpiration

Int. J. Mol. Sci. 2019, 20, 2273 8 of 22
rate, (D,H) Internal CO2 concentration in plants of maize genotypes grown in soil at field capacity(control) or subjected to water shortage (drought) at pre-flowering stage. 4th day: (A–D) showedsignificant differences among treatments regardless of genotype (p < 0.01) which indicates that themeans of the genotypes should be compared between the treatments. Boxes from the same genotypeunder different treatments, topped by the same letter, are not statistically different according to Tukey’stest (p < 0.05). 12th day: (A–D) showed significant interaction between treatment and genotype(p < 0.01) which indicates that the means of the genotypes should be compared by treatment. Boxesfrom different genotypes under the same treatment, topped by the same letter, are not statisticallydifferent according to Tukey’s test (p < 0.05).
2.3. Effect of Drought on Biomass, Grain Yield and Main Yield-Correlated Variables
Under control conditions, the maize genotype BRS 1010 presented higher aboveground biomassthan DKB 390, while the others did not differ among them. Under drought, the genotypes showedno difference in aboveground biomass (Figure 6A). Regarding grain yield, it did not differ amongmaize genotypes under control. However, it was strongly reduced at a genotype-dependent intensitylevel under drought (Figure 6B). The highest reduction in grain yield was noticed in BRS 1030 (33%),followed by BRS 1010 (23%), and the lowest occurred in 2B 707 (12%). No statistically significantreduction in grain yield was observed in DKB 390 due to drought.
Int. J. Mol. Sci. 2019, 20, x 8 of 22
Figure 5. Gas exchange measurements for control and drought stressed maize plants in the 4th and 12th day of stress. (A,E) Net CO2 assimilation rate, (B,F) Conductance to water vapor, (C,G) Transpiration rate, (D,H) Internal CO2 concentration in plants of maize genotypes grown in soil at field capacity (control) or subjected to water shortage (drought) at pre-flowering stage. 4th day: (A–D) showed significant differences among treatments regardless of genotype (p < 0.01) which indicates that the means of the genotypes should be compared between the treatments. Boxes from the same genotype under different treatments, topped by the same letter, are not statistically different according to Tukey’s test (p < 0.05). 12th day: (A–D) showed significant interaction between treatment and genotype (p < 0.01) which indicates that the means of the genotypes should be compared by treatment. Boxes from different genotypes under the same treatment, topped by the same letter, are not statistically different according to Tukey’s test (p < 0.05).
2.3. Effect of Drought on Biomass, Grain Yield and Main Yield-Correlated Variables
Under control conditions, the maize genotype BRS 1010 presented higher aboveground biomass than DKB 390, while the others did not differ among them. Under drought, the genotypes showed no difference in aboveground biomass (Figure 6A). Regarding grain yield, it did not differ among maize genotypes under control. However, it was strongly reduced at a genotype-dependent intensity level under drought (Figure 6B). The highest reduction in grain yield was noticed in BRS 1030 (33%), followed by BRS 1010 (23%), and the lowest occurred in 2B 707 (12%). No statistically significant reduction in grain yield was observed in DKB 390 due to drought.
Figure 6. Aboveground biomass and grain yield for control and drought stressed maize plants. (A) Aboveground biomass and (B) grain yield in plants of maize genotypes grown in soil at field capacity (control) or subjected to water shortage (drought) at pre-flowering stage. A and B showed significant interaction between treatment and genotype (p < 0.01) which indicates that the means of the genotypes should be compared by treatment. Boxes from different genotypes under the same treatment, topped by the same letter, are not statistically different according to Tukey’s test (p < 0.05).
At the 12th day of stress, soil and leaf water content, daily water consumption, and gas exchange measurements (represented by E), except intercellular CO2 concentration, showed a high positive relationship to each other, but a high negative relationship to plant canopy temperature (Figure 7). Those same variables correlated positively with aboveground biomass and grain yield, mostly in a high or moderate way. Intercellular CO2 concentration, in turn, correlated positively with canopy temperature, but negatively with the other variables. The relationship of canopy temperature to aboveground biomass and grain yield was negative and considered as moderate.
Figure 6. Aboveground biomass and grain yield for control and drought stressed maize plants. (A)Aboveground biomass and (B) grain yield in plants of maize genotypes grown in soil at field capacity(control) or subjected to water shortage (drought) at pre-flowering stage. A and B showed significantinteraction between treatment and genotype (p < 0.01) which indicates that the means of the genotypesshould be compared by treatment. Boxes from different genotypes under the same treatment, toppedby the same letter, are not statistically different according to Tukey’s test (p < 0.05).
At the 12th day of stress, soil and leaf water content, daily water consumption, and gas exchangemeasurements (represented by E), except intercellular CO2 concentration, showed a high positiverelationship to each other, but a high negative relationship to plant canopy temperature (Figure 7).Those same variables correlated positively with aboveground biomass and grain yield, mostly in ahigh or moderate way. Intercellular CO2 concentration, in turn, correlated positively with canopytemperature, but negatively with the other variables. The relationship of canopy temperature toaboveground biomass and grain yield was negative and considered as moderate.

Int. J. Mol. Sci. 2019, 20, 2273 9 of 22Int. J. Mol. Sci. 2019, 20, x 9 of 22
Figure 7. Relationship between variables measured in the experiment for control and drought stressed maize plants in the 12th day of stress, which are represented using regression lines in the plots. The numerical figures displayed provide the correlation coefficients. The p values was <0.01 for all the plotted variables. E – Transpiration rate, Ci – Intercellular CO2 concentration, iWUE – Intrinsic water use efficiency; LRWC – Leaf relative water content; DWC – Daily water consumption (water lost by evapotranspiration); SWC – Soil water content; AGB – Aboveground biomass; GY – Grain yield; CT – Canopy temperature.
2.4. Water Deficit Stress and Its Effects on Maize Plant Leaf and Canopy Architecture
Maize control plants maintained green, turgid, and erected leaves, keeping canopy morphological characteristics typical of plants grown under non-stressing conditions (Figure 8A–D; Figure 9A–C). In agreement with the visual observations, these plants had leaves with high values of chlorophyll content index and their photochemical variables clearly differed from those of the stressed plants (Figure 10A–H). However, drought at the pre-flowering stage affected leaves and canopy architecture in an intensity depending on the genotype. Such effects visually seemed less drastic for BRS 1030 which most of the leaves were greener than other genotypes, although they were rolled, wilted and bent (Figures 8A and 9B). For BRS 1010, drought caused an acceleration of leaf senescence process of the canopy (Figures 8B and 9C). For both 2B 707 (Figure 8C) and DKB 390 (Figure 8D), practically no wilting or leaf rolling occurred (Figure 9B). For these genotypes, leaf senescence was just noticed in the lower older leaves, while leaf paleness was its hallmark under drought.
Clearly, there was chlorophyll breakdown (Figure 10A,E) since the leaves were pale, which was gradually manifested along the experiment. In addition, there was an increase in the minimum fluorescence yield on dark-adapted leaf (Fo) for all maize genotypes under drought, especially in BRS 1010 at the 12th day of stress (Figure 10B,F). Although drought has not caused much changes in the maximum fluorescence yield on dark-adapted leaf (Fm), it was smaller in DKB 390 at the 4th (Figure 10C) and in both 2B 707 and DKB 390 at the 12th (Figure 10G) day of stress. The consequence was a reduction in the maximum photosystem II quantum yield (Fv/Fm), but just for DKB 390 in relation
Figure 7. Relationship between variables measured in the experiment for control and drought stressedmaize plants in the 12th day of stress, which are represented using regression lines in the plots. Thenumerical figures displayed provide the correlation coefficients. The p values was <0.01 for all theplotted variables. E – Transpiration rate, Ci – Intercellular CO2 concentration, iWUE – Intrinsic wateruse efficiency; LRWC – Leaf relative water content; DWC – Daily water consumption (water lost byevapotranspiration); SWC – Soil water content; AGB – Aboveground biomass; GY – Grain yield; CT –Canopy temperature.
2.4. Water Deficit Stress and Its Effects on Maize Plant Leaf and Canopy Architecture
Maize control plants maintained green, turgid, and erected leaves, keeping canopy morphologicalcharacteristics typical of plants grown under non-stressing conditions (Figure 8A–D; Figure 9A–C).In agreement with the visual observations, these plants had leaves with high values of chlorophyllcontent index and their photochemical variables clearly differed from those of the stressed plants(Figure 10A–H). However, drought at the pre-flowering stage affected leaves and canopy architecturein an intensity depending on the genotype. Such effects visually seemed less drastic for BRS 1030which most of the leaves were greener than other genotypes, although they were rolled, wilted andbent (Figures 8A and 9B). For BRS 1010, drought caused an acceleration of leaf senescence process ofthe canopy (Figures 8B and 9C). For both 2B 707 (Figure 8C) and DKB 390 (Figure 8D), practically nowilting or leaf rolling occurred (Figure 9B). For these genotypes, leaf senescence was just noticed in thelower older leaves, while leaf paleness was its hallmark under drought.
Clearly, there was chlorophyll breakdown (Figure 10A,E) since the leaves were pale, which wasgradually manifested along the experiment. In addition, there was an increase in the minimumfluorescence yield on dark-adapted leaf (Fo) for all maize genotypes under drought, especially inBRS 1010 at the 12th day of stress (Figure 10B,F). Although drought has not caused much changesin the maximum fluorescence yield on dark-adapted leaf (Fm), it was smaller in DKB 390 at the 4th(Figure 10C) and in both 2B 707 and DKB 390 at the 12th (Figure 10G) day of stress. The consequencewas a reduction in the maximum photosystem II quantum yield (Fv/Fm), but just for DKB 390 in

Int. J. Mol. Sci. 2019, 20, 2273 10 of 22
relation to BRS 1030 e 2B 707 at the 4th day (Figure 10D) and in relation to BRS 1030 at the 12th day(Figure 10H).
Int. J. Mol. Sci. 2019, 20, x 10 of 22
to BRS 1030 e 2B 707 at the 4th day (Figure 10D) and in relation to BRS 1030 at the 12th day (Figure 10H).
Figure 8. Drought effects on leaf characteristics and canopy architecture of maize plants. (A) BRS 1030, (B) BRS 1010, (C) 2B 707, (D) DKB 390. Plants on the left hand side were grown in soil at field capacity (control), while those on the right hand side were subjected to soil water shortage (drought) for 12 consecutive days at pre-flowering stage. Images were taken on the 12th day under drought.
Figure 8. Drought effects on leaf characteristics and canopy architecture of maize plants. (A) BRS 1030,(B) BRS 1010, (C) 2B 707, (D) DKB 390. Plants on the left hand side were grown in soil at field capacity(control), while those on the right hand side were subjected to soil water shortage (drought) for 12consecutive days at pre-flowering stage. Images were taken on the 12th day under drought.

Int. J. Mol. Sci. 2019, 20, 2273 11 of 22Int. J. Mol. Sci. 2019, 20, x 11 of 22
Figure 9. Drought effects on total, wilted and dead leaves of maize genotypes. (A) Number of total (B) wilted and (C) dead leaves in plants of maize genotypes grown in soil at field capacity (control) or subjected to water shortage (drought) at pre-flowering stage. (A–C) showed significant interaction between treatment and genotype (p < 0.05) which indicates that the means of the genotypes should be compared by treatment. Boxes from different genotypes under the same treatment, topped by the same letter, are not statistically different according to Tukey’s test (p < 0.05).
Figure 9. Drought effects on total, wilted and dead leaves of maize genotypes. (A) Number of total (B)wilted and (C) dead leaves in plants of maize genotypes grown in soil at field capacity (control) orsubjected to water shortage (drought) at pre-flowering stage. (A–C) showed significant interactionbetween treatment and genotype (p < 0.05) which indicates that the means of the genotypes should becompared by treatment. Boxes from different genotypes under the same treatment, topped by the sameletter, are not statistically different according to Tukey’s test (p < 0.05).

Int. J. Mol. Sci. 2019, 20, 2273 12 of 22Int. J. Mol. Sci. 2019, 20, x 12 of 22
Figure 10. Chlorophyll content and variables derived from chlorophyll fluorescence measurements for control and drought stressed maize plants in the 4th and 12th day of stress. (A,E) Chlorophyll content index (CCI), (B,F) minimum fluorescence yield on dark-adapted leaf (Fo), (C,G) maximum fluorescence yield on dark-adapted leaf (Fm), (D,H) maximum photosystem II quantum yield (Fv/Fm) in plants of maize genotypes grown in soil at field capacity (control) or subjected to water shortage (drought) at pre-flowering stage. 4th day: (A,B) showed significant differences among treatments regardless of genotype (p < 0.01), which indicates that the means of the genotypes should be compared between the treatments. Boxes from the same genotype under different treatments, topped by the same letter, are not statistically different according to Tukey’s test (p < 0.05); C–D showed significant interaction between treatment and genotype (p < 0.05) which indicates that the means of the genotypes should be compared by treatment. Boxes from different genotypes under the same treatment, topped by the same letter, are not statistically different according to Tukey’s test (p < 0.05). 12th day: (E) showed significant differences among treatments regardless of genotype (p < 0.01),
Figure 10. Chlorophyll content and variables derived from chlorophyll fluorescence measurements forcontrol and drought stressed maize plants in the 4th and 12th day of stress. (A,E) Chlorophyll contentindex (CCI), (B,F) minimum fluorescence yield on dark-adapted leaf (Fo), (C,G) maximum fluorescenceyield on dark-adapted leaf (Fm), (D,H) maximum photosystem II quantum yield (Fv/Fm) in plantsof maize genotypes grown in soil at field capacity (control) or subjected to water shortage (drought)at pre-flowering stage. 4th day: (A,B) showed significant differences among treatments regardless ofgenotype (p < 0.01), which indicates that the means of the genotypes should be compared betweenthe treatments. Boxes from the same genotype under different treatments, topped by the same letter,are not statistically different according to Tukey’s test (p < 0.05); C–D showed significant interactionbetween treatment and genotype (p < 0.05) which indicates that the means of the genotypes should becompared by treatment. Boxes from different genotypes under the same treatment, topped by the same

Int. J. Mol. Sci. 2019, 20, 2273 13 of 22
letter, are not statistically different according to Tukey’s test (p < 0.05). 12th day: (E) showed significantdifferences among treatments regardless of genotype (p < 0.01), which indicates that the means of thegenotypes should be compared between the treatments. Boxes from the same genotype under differenttreatments, topped by the same letter, are not statistically different according to Tukey’s test (p < 0.05);(F–H) showed significant interaction between treatment and genotype (p < 0.01) which indicates thatthe means of the genotypes should be compared by treatment. Boxes from different genotypes underthe same treatment, topped by the same letter, are not statistically different according to Tukey’s test(p < 0.05).
3. Discussion
3.1. Relationship Among Canopy Temperature, Gas Exchange, Leaf Water Content, Water Consumption, andYield for Maize Plants under Water Restriction
The first line of defense of plants against water stress is stomatal closure, with a consequentdecrease in water vapor and CO2 conductance [25,26]. In fact, concomitantly with an increase incanopy temperature (Figures 1–3), there was a strong and proportional reduction in water parametersand gas exchange rates both at the beginning (4th day; Figure 4A–D; Figure 5A–C) and at the end (12thday; Figure 4E,F and Figure 5E,F) of the stress. In both time periods of drought, the discriminationbetween control and stressed plants could be performed by canopy temperature. However, only at theend of the experiment could the genotypes submitted to drought be discriminated from each otherbased on that trait (Figure 3B,D).
On the 4th day, the leaves of the stressed plants presented only a slight wilt and paleness(Figure 1A), but there was no difference in canopy temperature between them (Figure 3C). Canopytemperature difference among stressed plant genotypes only occurred on the 12th day (Figure 3D),when there were already signs that additional mechanisms to cope with the stressful condition weremanifesting. Most likely, the regulation of plant canopy temperature depended almost totally onstomata at the onset of stress, while at the end of stress other physiological mechanisms were triggered.Such mechanisms work in all the levels of organization [27]. At the organ level, we visually observedleaf senescence, wilting, and rolling, as well as leaf angle changes.
Although we are dealing with measurements taken on different scales (Figures 3–6), on a smallscale, leaf relative water content (Figure 4B,F) and gas exchange (Figure 5A–C,E–G) were obtainedin the more metabolically active leaves. We assumed that they represent the plant as a whole. Thus,being an isohydric species, maize close their stomata in response to a decrease in soil water and/oran increase in vapor pressure deficit to control plant water potential [28]. Accordingly, stomatalconductance has been considered as a better indicator of soil moisture than water potential underdrought conditions [29]. Since stomatal closure raises canopy temperature, drought tolerance screeningbased on thermal imaging can be suited to maize. However, some authors [30,31] have shown that therelationship between stomatal conductance and leaf temperature (or derived parameters), in spite ofthe difference in scales, is not always as strong as that obtained in a highly controlled environment [15].This means that the scale of the measurements may even have some influence, but it is probably not adeterminant factor. In our study, whole plant water consumption (Figure 4C,G) or leaf gas exchange(Figure 5A–C,E–G) were not different among maize genotypes under drought, although there weredifferences in canopy temperature among them, but only in the 12th day. Furthermore, neither dailywater consumption nor gas exchange individually were highly correlated to the increase in canopytemperature of maize genotypes as a function of drought (Figure 7). This implies that in addition tothose already mentioned, other traits that help regulate leaf temperature in plants as a whole may beacting under a prolonged drought.
It should be kept in mind that, by the energy balance equation, the two most important variablesfor leaf temperature regulation are absorbed radiation and stomatal conductance [28,29]. The former

Int. J. Mol. Sci. 2019, 20, 2273 14 of 22
adds energy and heats the leaf [30,32]; the latter acts to cool it down [15,23,28,29]. Leaf heat loss occursmainly due to stomatal transpiration [15,23,28,29]. Therefore, stomatal conductance accounts for mostof the change in canopy temperature [20]. However, besides stomatal conductance and transpiration,there are additional mechanisms involved in leaf temperature regulation [32,33]. Instead of leaf cooling,such mechanisms probably avoid leaf heating [34–38].
Both transpiration cooling and avoidance of excessive leaf heating strategies work to regulatecanopy temperature. The former has been usually related to yield, while the latter is primarily aimedat survival. It turned out that the maize genotypes that had the highest grain yield under drought(Figure 6B) were those that also showed lower canopy temperature increase in the 12th day of stress(Figure 3D). As under drought, the levels of daily water consumption (Figure 4C,G) or gas exchangerates (Figure 5A–C,E–G) remained remarkably low and there was practically no difference amongthem, it was assumed that the cooling rate due to plant water loss was similar for all. Therefore, itis likely that maize genotypes showing lower canopy temperatures under drought benefited fromavoidance of excessive leaf heating in a correlated way to grain yield (Figure 7).
3.2. Implications of Water Deficit Stress in the Plant Leaves and Canopy Architecture
Under drought, BRS 1030 showed delayed leaf senescence, leaf wilting, and rolling, which wereassociated with a change in leaf angle (Figures 8A and 9B,C). These last traits have been cited in theliterature as strategies to reduce light energy absorption and preventing canopy overheating [36,37]. Onthe other hand, BRS 1010 showed a senescence acceleration in most of the leaves (Figure 8B; Figure 9C;Figure 10F), leading to dysfunction of the stomata and, consequently, loss or severe restriction of themain mechanism responsible for leaf cooling. We suppose that such distinct and contrasting strategiesworked for both genotypes, but they led to an increase in canopy temperature and representedadditional costs, which resulted in a drop in the yield at different intensities. BRS 1030 probably spenta lot of energy to keep your leaves alive, while BRS 1010 early lost part of its photosynthetically activeleaf surface.
The results obtained in this study corroborate the statement that there are several traits recognizedfor conferring drought tolerance in plants, but the performance of each of them depends on thescenario [2]. According to [3], the strategy used by genotypes like BRS 1030 can be adequate whengrown in soils with appreciable water reserves so that their roots could explore as they extend throughthe soil profile. It is also useful for plants grown in regions subject to short drought period undervegetative phase, in which plant growth could rapidly be resumed after a rainfall, since its leavesare kept green. However, in this study, since the roots were confined in pots under water limitation,such a strategy was not effective. Most of the leaves of 2B 707 and DKB 390 become very pale. Mostlikely, this strategy reduced light energy absorption, avoiding excessive canopy heating. Probably,by mainly reducing the synthesis of photosynthetic pigments, they were able to maintain a positivecarbon balance, which could be directed to obtain higher grain yields.
For the before-mentioned reasons, it does not necessarily mean that the coldest genotypes will bethe highest yielding and the hottest, the least. In this type of study, the correlation between temperatureand biomass has been much lower than for gas exchange [15] and even lower for yield [17,20]). Thisimplies that for more integrative characteristics, additional factors are involved, such as respirationrate [39] and partitioning of assimilates [40]. Even so, based on the results obtained in this study, wecan state that thermography can be considered as a potential tool for selecting drought-tolerant plantsin the early stages of a plant-breeding program. The technique is capable of selecting plants whosecanopies heat less, which can lead to a higher yield under drought stress. However, one should beaware of the physiological responses of the plants to drought in order to choose the right momentto assess the canopy temperature. This is important because most of the mechanisms involved inregulating canopy temperature should be active at the time of canopy temperature assessment.

Int. J. Mol. Sci. 2019, 20, 2273 15 of 22
4. Materials and Methods
4.1. Plant Material and Growth Conditions
The experiments were carried out in a greenhouse at the National Agroenergy Research Center(https://www.embrapa.br/en/agroenergia), in Brasilia, Brazil (S—15.732◦, W—47.900◦) from December8, 2016 (sowing) to May 2, 2017 (harvesting). Light intensity, temperature, and air relative humidityfluctuated accordingly to environment. Such weather variables were monitored and recorded duringthe most important maize plant growth stages (Supplementary File 1).
We used four maize genotypes showing contrasting drought responses (BRS1010, BRS-1030,2B-707, and DKB-390). Such genotypes had previously been screened based on results obtained inthe target environment in a 5-year series of field experiments carried out by Embrapa/CNPMS. Thus,based purely on grain yield, they were classified as sensitive, intermediate, and tolerant. BRS-1010was classified as sensitive because it showed the lowest yield. 2B-707 and DKB 390 were consideredas tolerant because they showed the highest yield. BRS 1030 was considered intermediate because itshowed yield as high as a tolerant or as low as a sensitive, depending on the phenotyping site [41,42].Seeds were sown in pots (20 kg) filled with typical soil used for maize growing in Brazil (dystrophicRed Latosol according to Brazilian Soil Classification). Based on some soil physical–chemical analyses,lime and fertilizer were added to provide optimal plant growth. Two maize plants were held per pot.They were grown on a daily replenishment of water at field capacity (100% of the available water).
4.2. Measured Variables
4.2.1. Soil and Leaf Water Content for Control and Drought Stress Maize Plants
Water supply to the soil was rigorously managed throughout the experiment for both control anddrought stressed plants. Soil moisture was daily returned to the level according to the water regimeto which they were submitted. For drought-stressed plants, water supply was withheld at 54 daysafter sowing (1 February 2017), when they reached V12 growth stage (12th leaf collar visible). Theplants became actually stressed two days later (3 February 2017), when gas-exchange rates approachedzero. The drought stress level was maintained for 12 consecutive days (until 14 February 2017), whileanother group of plants remained with water replenished to field capacity (control).
Determination of soil water holding capacity was performed by watering the pots with excesswater until saturation. Then, the excess of water was naturally allowed to drain, avoiding evaporation.Lastly, the weight of the soil with the maximum amount of water it could retain was obtained. Thisresulting weight was considered as the soil weight at field capacity. Based on this weight, the controlplants were daily watered for replenishment of the evapotranspired water. The plants under droughtstress had water withheld until the gas exchange approached zero. Then, the soil water contentwas determined and maintained at this level. Soil water content (SWC) was measured based on thegravimetric method. Soil sample was oven dried at 105 ◦C until constant weight. The daily waterconsumption (DWC) by evapotranspiration and the remaining soil water content (SWC) was recordedfor both control and drought stressed plants. The amount of water lost was replenished daily to returnto the water levels according to the treatment to which the plants were subjected.
For leaf relative water content (LRWC), a leaf piece was removed from the same portion of aleaf inserted in the same position of the canopy as those used for gas exchange measurements, but inanother plant. Since each pot contained two plants, which were sown at the same time and, therefore,were at the same age and growth stage, they experienced the same soil water content. Accordingly, weassumed that their correspondent leaves had similar relative water content. The fresh weight (FW)of the leaf piece was immediately determined after removal. The leaf piece was then immersed ondistilled water in darkness at 4 ◦C/24 h before determination of turgid weight (TW). It was then placedinto a paper envelope and dried at 65 ◦C/24 h to determine dry weight (DW). RWC was calculated as
in [43] by the following equation: LRWC =(FW−DW)(TW−DW)
× 100

Int. J. Mol. Sci. 2019, 20, 2273 16 of 22
4.2.2. Schedule for Gas Exchange and Thermal Imaging Measurement
Both thermal and gas exchange measurements were taken on the 4th and 12th day of droughtstress nearly simultaneously close to midday. Around this time, the sun is typically close to the zenithposition in the tropics. Under such conditions, transpiration is high for maize, as a C4 plant, whichhelps to enhance differences among genotypes [20,44] and different water regimes [45].
4.2.3. Gas Exchange Measurements
Gas exchange measurements were conducted on the middle third of the healthy and fullyexpanded leaf 12, in a previously marked area. A LI-COR mod. 6400XT (LI-COR, Lincoln, NE,USA) infrared gas analyzer, equipped with a size measuring head with 2 × 3 cm and an artificialLED lighting system model 6400-02B, was used. It was set up to hold relative humidity between50–60% and light intensity of 2000 µmol m−2 s−1 in the measuring head, block temperature at 30 ◦C,and flow rate at 500 µmol s−1. CO2 concentration on the reference cell was controlled at 400 ppmusing a CO2 mixer model 6400-01. The following gas exchange variables were evaluated: net CO2
assimilation rate (A), conductance to water vapor (gs), transpiration rate (E) and intercellular CO2
concentration (Ci). They were calculated based on equations described in the LI-COR 6400XT usermanual (www.licor.com/documents/s8zyqu2vwndny903qutg). A measure of transpiration efficiencyat the leaf level was determined as intrinsic water use efficiency (iWUE). It was calculated as the ratioof instantaneous net CO2 assimilation (A) to transpiration (E) = A/E [46].
4.2.4. Chlorophyll Content Index and Chlorophyll Fluorescence Measures
Both measures were performed on leaf 12, in the same portion used for gas exchange and relativewater content measures. Chlorophyll content index (CCI) was analyzed using a chlorophyll meterOpti-science model CCM-200 Plus (Opti-Sciences Inc., Hudson, NH, USA). Measures were taken infive different points of the selected leaf portion. The averaged values were used. For chlorophyllfluorescence measurements, the maize plants were analyzed by means of the chlorophyll fluorescencetechnique, using a portable fluorometer Walz Mod. Mini-PAM. (Heinz Walz GmbH, Effeltrich, Bavaria,Germany). The device was configured to provide an initial fluorescence measurement light withfrequency of 0.6 Hz and intensity at level 2, with amplifier factor of the detector’s electronic signalset up at level 1. The intensity of the saturating light pulse was set up at level 12. The piece ofthe leaf to be evaluated was previously kept in the dark for at least 1 h with the aid of a leaf clipHeinz Walz Mod. DLC-8. For the measurement procedure, the end of the fluorescence probe wascoupled to the leaf clip, which was attached to the leaf. Then, the leaf clip shutter was opened to allowexposure of the leaf piece to be measured. After 2 s, enough time for the initial fluorescence signal(without influence of actinic light) to stabilize, the “start” button was pressed, triggering the maximumphotosystem II quantum yield (Fv/Fm) by using the WinControl software. Initially, a routine recordedthe minimum fluorescence yield on dark-adapted leaf (Fo), generated by the initial measurement light.Then, the software triggered a pulse of saturating light and recorded the maximum fluorescence yieldon dark-adapted leaf (Fm). From these two variables, the internal algorithm present in the WinControl
software automatically calculated Fv/Fm, according to the equation: FvFm =
(Fm−Fo)Fm .
4.2.5. Total, Wilted, and Dead Leaves
Leaf emission was recorded throughout the cycle of maize plants. At the end of the experiment,we counted the wilted and dead leaves due to the drought. The wilted leaves were visually identified.The dead leaves were those in which more than 50% of the leaf blade area was senescent.
4.2.6. Thermal Image Capturing and Processing
The thermal images on 4th day were taken manually, while those on the 12th day were taken froman unmanned aerial vehicle (UAV). The former were taken at a height of 15 m from the canopy, while
Int. J. Mol. Sci. 2019, 20, 2273 17 of 22
the latter at 20 m. Therefore, each pixel covered an area of, at least, 2.8 × 2.8 cm. A pixel with such sizeis suitable for an adult maize plant as it is less than the average width of a single leaf. Furthermore, itallows an acceptable spatial resolution and accurate temperature measurement of the leaves.
An UAV XFly Mod. X800 (XFly Brasil, Bauru, SP, Brazil) was used to carry the thermal imager(Supplementary File 2). It was equipped with a Pixhawk flight controller, which is able to make GPSwaypoint navigation and altitude control. Its payload was up to 3 kg and was able to fly in autonomousor manual mode. It had a flying autonomy of around 25 min when carrying the thermal imager. BothUAV and thermal imager were controlled from a ground station. The former using a free open-sourcesoftware known as Mission Planner. The latter using a Flir proprietary software remotely operated. Acarbon fiber gimbal was specially developed for attachment of the thermal imager to the UAV. Thissolution allowed remote control, positioning, focusing, and triggering of the camera on the target.Captured images could be transmitted in real time to the monitoring ground station. Both thermal andvisible images were obtained by using a Flir camera mod. T-420 (Flir Systems, Danderyd, Sweden)which had the following characteristics: 320 × 240 pixel of thermal spatial resolution, spectral responsefrom 7.5 to 13 µm, uncooled microbolometer focal-plane array detector, 60 Hz of frame rate, pixelthermal sensitivity of 0.045 ◦C at 30 ◦C, temperature accuracy of ±2 ◦C or 2% of reading (whicheveris greater) at 25 ◦C, equipped with a lens of 25◦, and weight of 0.88 kg including battery. Followingthe principles of infrared thermography [47], the thermal imager was set up for the environmentalconditions at the time of image capture, which included distance of the plant canopies, reflectedtemperature (aluminum foil method), atmospheric temperature, and air relative humidity. Canopyemissivity was set to 0.98. For this purpose, the plant canopies were considered as greybodies in whichemissivity is constant and independent of the wavelength for the spectral range of 7.5–13 µm.
The images used for calculating canopy temperature were captured with the smallest normal viewangle to the ground to avoid any temperature variation due to angular effect [48]. For image capture,the pots containing maize plants were removed from the greenhouse. Then, they were placed on theground and plants were left to acclimate to the external environmental conditions for a few hours.
The poor accuracy of the temperature measurement of thermal cameras, including the one we usedin this work, has not been an issue in this type of study. This is because what really matters is the canopytemperature difference between control and stressed plants and not the accurate canopy temperature.To make sure we were measuring the most precise temperature difference among the plant canopies,we compared several images taken at the same distance and angle to check the repeatability (precision)of the canopy temperature measurement, which was high. In addition, thermal images were takenin a short time interval, which was less than five minutes, to ensure that genetic factors, instead ofweather variables changes, would be responsible for temperature differences among plant canopies.Accordingly, there was no need to use any thermal index or mathematical artifices for data normalizingin order to compare them. Thus, we assumed that differences in mean canopy temperature betweencontrol and drought stressed plants would only reflect traits expressed by the genotypes. Thermalimages were saved in a raw format, as a non-compressed array, while RGB images were saved asJPEG files.
For temperature distribution in the maize plant canopies, RGB images obtained by the visiblesensor of the thermal camera were employed to identify plant leaf pixels in the thermogram. Theprocedure consisted of some steps, which are segmentation, alignment, and masking. In this study,we applied color segmentation. Thus, color images were converted from the original RGB colorspace to the CIELAB space [49] and just the color channels a* and b* in CIELAB were employed inthe segmentation procedure, providing robustness regardless of eventual differences in lightness.Color segmentation was performed using the mean-shift algorithm as Reference [50] (SupplementaryFile 3). Morphological erosion [51] was employed to remove pixels on plant borders, avoiding readingsthat could mix plant and background temperatures. Segmented canopies and masks produced aftermorphological erosion are shown (Supplementary File 4).

Int. J. Mol. Sci. 2019, 20, 2273 18 of 22
The Flir T-420 thermal camera uses two different sensors to generate thermal and visible images.Therefore, such images do not present the same resolution and they are not aligned (SupplementaryFile 5A,B). Thus, we align them by using a projective transform estimated by the least-squaresmethod and a set of corresponding points [52]. A human annotator identified the correspondingpoints (Supplementary File 5C), which were used for the proper alignment of visible (SupplementaryFile 5D) and thermal images (Supplementary File 5E). All the procedures were implemented as aPython computer program. The NumPy package was employed for array manipulation. Mean-shiftimplementation was provided by the Scikit-learn package [53]. Color space conversion, morphologicaloperations, and projective transform estimation were implemented by the Scikit-image package.
4.2.7. Aboveground Biomass and Grain Yield
The maize plants were harvested at the end of the cycle, when all the leaves were alreadycompletely senescent, that is, with the characteristic yellowish color. First, the ears were harvestedand, then, the remainder of the plant aerial parts, including culms and leaves. Freshly harvested aerialparts and grains were forced air oven dried at 70 ◦C/72 h and 105 ◦C/24 h, respectively. Both aerialparts and grain yield were expressed on a dry matter basis.
4.3. Experimental Design and Statistical Analysis
A completely randomized design was used to assign two treatments (control x drought) in fourmaize genotypes (BRS 1030, BRS 1010, 2B 707 and DKB 390) and five replicates. The data of all variables,which included those relative to gas exchange (A, gs, E, Ci, iWUE), photochemical (Fo, Fm, Fv/Fm),leaves (total, wilted, dead), soil water content (SWC), daily water consumption (DWC), leaf relativewater content (LRWC), canopy temperature (CT), aboveground biomass (AGB), and grain yield (GY),were tested for homogeneity of variance and normality of residuals by Cochran’s Q and Shapiro–Wilktests, respectively. Analyzing each treatment alone (control or stress), but not together, data of all thevariables showed homogeneity of variance and normally distributed residuals. Analyzing the variableswithin each factor, there was homogeneity of variance for DWC and AGB (treatment), A, gs, E, LRWC,DWC, SWC, AGB, and CT (genotype) and DWC, AGB, GY, and CT, phtochemical and leaf variables(interaction). When the factors (treatments and genotypes) or their interactions were significant, themeans were compared by Tukey’s test (p ≤ 0.05). All the statistical analyses were performed by usingthe statistical program STATISTICA version 12 (www.statsift.com, Tulsa, OK, USA). Lastly, we correlatethe most important variables to each other. Pearson’s correlation was used to test the strength anddirection of linear relationships between pairs of continuous variables. Pearson’s correlation coefficient(r) was interpreted according to [54]. Thus, r equal to 0.00–0.30 means negligible correlation, while0.30–0.50, 0.50–0.70, 0.70–0.90, and 0.90–1.00 means, respectively, a low, moderate, high, and very highuphill or positive linear relationship. The interpretation for these same values of r, but with negativesign, follows the same logic. The difference is that the linear correlation is negative or downhill.
5. Conclusions
Thermography was able to discriminate the most contrasting maize genotypes for droughttolerance in a similar way to the field phenotyping in a series of previous experiments in the targetenvironment, in which only grain yield has been considered as a criterion. Although there wasa negative correlation between grain yield and plant canopy temperature, it does not necessarilymean that plants whose canopies were maintained cooler under drought achieved the highest yield.Depending on the genotype, drought causes changes in plant leaves and canopy structure, which canalter the absorption and dissipation of energy. Such changes can affect yield and canopy temperatureto different degrees. Therefore, further studies should be addressed for a broader understanding of therelationship between canopy temperature and grain yield in maize. In this context, the study of thevariables expressed under drought, which influence the canopy temperature, more related to yield(e.g., gas exchange) or survival (e.g., wilt and rolling), are of fundamental importance.
Int. J. Mol. Sci. 2019, 20, 2273 19 of 22
Supplementary Materials: Supplementary materials can be found at http://www.mdpi.com/1422-0067/20/9/2273/s1.
Author Contributions: C.A.F.S., R.L.G. and P.C.M. conceived and designed the experiments; R.A.C.N.C., D.S.P.,T.M.M.F. and V.N.B.S. performed the experiments; C.A.F.S., R.A.C.N.C., N.G.O., M.T.S.J., T.T.S. analyzed the data;C.A.F.S., H.B.C.M., A.K.K., T.T.S. and M.T.S.J. wrote the paper.
Funding: This research was funded by FINEP/MCTI (grant number 01.11.0089.01) and Embrapa/Macroprograma5/Projeto Phenocorn.
Acknowledgments: We thank Embrapa Maize and Sorghum, especially. Lauro Guimarães, for supplying themaize seeds. N. G. de Oliveira and V. N. B. Silva thank CAPES for the fellowship grant.
Conflicts of Interest: The authors declare no conflict of interest. The funders had no role in the design of thestudy; in the collection, analyses, or interpretation of data; in the writing of the manuscript, or in the decision topublish the results.
Abbreviations
A Net CO2 Assimilation RateAGB Aboveground BiomassAGL Aboveground LevelBRS An acronym that identifies materials from the breeding program led by EmbrapaCCI Chlorophyll Content IndexCi Intercellular CO2 concentrationCNPMS The National Maize and Sorghum Research CenterCT Canopy TemperatureDKB An acronym that identifies materials from the breeding program led by DEKALBDWC Daily Water ConsumptionE Transpiration rateEmbrapa Brazilian Agricultural Research CorporationFm Maximum quantum yield of dark-adapted leafF0 Minimum quantum yield of dark-adapted leafFv/Fm Maximum quantum yield of photosystem IIgs Stomatal conductance to water vaporGY Grain YieldiWUE Intrinsic Water Use EfficiencyLRWC Leaf Relative Water ContentPSII Photosystem IIRGB Red, Green and Blue color modelSWC Soil Water ContentUAV Unmanned Aerial Vehicle
References
1. Araus, J.L.; Serret, M.D.; Edmeades, G.O. Phenotyping maize for adaptation to drought. Front. Physiol. 2012,3, 305. [CrossRef]
2. Tardieu, F. Any trait or trait-related allele can confer drought tolerance: Just design the right drought scenario.J. Exp. Bot. 2012, 63, 25–31. [CrossRef]
3. Tuberosa, R. Phenotyping for drought tolerance of crops in the genomics era. Front. Physiol. 2012, 3, 347.[CrossRef]
4. Harrison, M.T.; Tardieu, F.; Dong, Z.; Messina, C.D.; Hammer, G.L. Characterizing drought stress and traitinfluence on maize yield under current and future conditions. Glob. Chang. Biol. 2014, 20, 867–878. [CrossRef]
5. Abberton, M.; Batley, J.; Bentley, A.; Bryant, J.; Cai, H.; Cockram, J.; Costa de Oliveira, A.; Cseke, L.J.;Dempewolf, H.; De Pace, C.; et al. Global agricultural intensification during climate change: A role forgenomics. Plant Biotechnol. J. 2016, 14, 1095–1098. [CrossRef]
6. Khan, A.; Sovero, V.; Gemenet, D. Genome-assisted breeding for drought resistance. Curr. Genom. 2016, 17,330–342. [CrossRef]

Int. J. Mol. Sci. 2019, 20, 2273 20 of 22
7. Anjum, S.A.; Ashraf, U.; Tanveer, M.; Khan, I.; Hussain, S.; Shahzad, B.; Zohaib, A.; Abbas, F.; Saleem, M.F.;Ali, I.; et al. Drought induced changes in growth, osmolyte accumulation and antioxidant metabolism ofthree maize hybrids. Front. Plant Sci. 2017, 8, 69. [CrossRef]
8. Prasanna, B.M. Maize research-for-development scenario: Challenges and opportunities for Asia. InProceedings of the 12th Asian Maize Conference and Expert Consultation on Maize for Food, Feed, Nutritionand Environmental Security, Bangkok, Thailand, 30 October–1 November 2014; Prasanna, B.M., Vivek, B.S.,Sadananda, A.R., Jeffers, D.P., Zaidi, P.H., Boeber, C., Erenstein, O., Babu, R., Nair, S.K., Gerard, B., et al., Eds.;APAARI: Bangkok, Thailand; CIMMYT: Bangkok, Thailand; FAO: Bangkok, Thailand; Thailand Departmentof Agriculture: Bangkok, Thailand, 2014; pp. 2–11.
9. Searchinger, T.; Heimlich, R.; Houghton, R.A.; Dong, F.; Elobeid, A.; Fabiosa, J.; Tokgoz, S.; Hayes, D.; Yu, T.H.Use of U.S. croplands for biofuels increases greenhouse gases through emissions from land-use change.Science 2008, 319, 1238–1240. [CrossRef]
10. Goldemberg, J. The Brazilian biofuels industry. Biotechnol. Biofuels 2008, 1, 6. [CrossRef]11. Masuka, B.; Araus, J.L.; Das, B.; Sonder, K.; Cairns, J.E. Phenotyping for abiotic stress tolerance in maize.
J. Integr. Plant Biol. 2012, 54, 238–249. [CrossRef]12. Almeida, G.D.; Makumbi, D.; Magorokosho, C.; Nair, S.; Borém, A.; Ribaut, J.-M.; Bänziger, M.; Prasanna, B.M.;
Crossa, J.; Babu, R. QTL mapping in three tropical maize populations reveals a set of constitutive andadaptive genomic regions for drought tolerance. Theor. Appl. Genet. 2013, 126, 583–600. [CrossRef]
13. Adee, E.; Roozeboom, K.; Balboa, G.R.; Schlegel, A.; Ciampitti, I.A. Drought-tolerant corn hybrids yield morein drought-stressed environments with no penalty in non-stressed environments. Front. Plant Sci. 2016, 7,1534. [CrossRef] [PubMed]
14. Tesfaye, K.; Kruseman, G.; Cairns, J.E.; Zaman-Allah, M.; Wegary, D.; Zaidi, P.H.; Boote, K.J.; Rahut, D.;Erenstein, O. Potential benefits of drought and heat tolerance for adapting maize to climate change in tropicalenvironments. Clim. Risk Manag. 2018, 19, 106–109. [CrossRef]
15. Sirault, X.R.R.; James, R.A.; Furbank, R.T. A new screening method for osmotic component of salinitytolerance in cereals using infrared thermography. Funct. Plant Biol. 2009, 36, 970–977. [CrossRef]
16. Romano, G.; Zia, S.; Spreer, W.; Sanchez, C.; Cairns, J.; Araus, J.L.; Müller, J. Use of thermography for highthroughput phenotyping of tropical maize adaptation in water stress. Comput. Electron. Agric. 2011, 79,67–74. [CrossRef]
17. Prashar, A.; Yildiz, J.; McNicol, J.W.; Bryan, G.J.; Jones, H.G. Infra-red thermography for high throughputfield phenotyping in Solanum tuberosum. PLoS ONE 2013, 8, 6. [CrossRef]
18. Liu, Y.; Subhash, C.; Yan, J.; Song, C.; Zhao, J.; Li, J. Maize leaf temperature responses to drought: Thermalimaging and quantitative trait loci (QTL) mapping. Environ. Exp. Bot. 2011, 71, 158–165. [CrossRef]
19. Rebetzke, G.J.; Rattey, A.R.; Farquhar, G.D.; Richards, R.A.; Condon, A.G. Genomic regions forcanopy temperature and their genetic association with stomatal conductance and grain yield in wheat.Funct. Plant Biol. 2013, 40, 14–33. [CrossRef]
20. Zia, S.; Romano, G.; Spreer, W.; Sanchez, C.; Cairns, J.; Araus, J.L.; Müller, J. Infrared thermal imaging as arapid tool for identifying water-stress tolerant maize genotypes of different phenology. J. Agron. Crop Sci.2013, 199, 75–84. [CrossRef]
21. Liebisch, F.; Kirchgessner, N.; Schneider, D.; Walter, A.; Hund, A. Remote, aerial phenotyping of maize traitswith a mobile multi-sensor approach. Plant Methods 2015, 11, 9. [CrossRef]
22. Deery, D.M.; Rebetzke, G.J.; Jimenez-Berni, J.A.; James, R.A.; Condon, A.G.; Bovill, W.D.; Hutchinson, P.;Scarrow, J.; Davy, R.; Furbank, R.T. Methodology for high-throughput field phenotyping of canopytemperature using airborne thermography. Front. Plant Sci. 2016, 7, 1808. [CrossRef]
23. Merlot, S.; Mustilli, A.-C.; Genty, B.; North, H.; Lefebvre, V.; Sotta, B.; Vavasseur, A.; Giraudat, J. Use ofinfrared thermal imaging to isolate Arabidopsis mutants defective in stomatal regulation. Plant J. 2002, 30,601–609. [CrossRef] [PubMed]
24. García-Tejero, I.F.; Hernández-Cotán, A.; Apolo, O.E.; Durán-Zuazo, V.H.; Portero, M.A.; Rubio-Casal, A.E.Infrared thermography to select commercial varieties of maize in relation to drought adaptation.Quant. InfraRed Thermogr. J. 2017, 14, 54–67. [CrossRef]
25. Chaves, M.M.; Pereira, J.S.; Maroco, J.; Rodrigues, M.L.; Ricardo, C.P.P.; Osorio, M.L.; Carvalho, I.; Faria, T.;Pinheiro, C. How plants cope with water stress in the field. Photosynthesis and growth. Ann. Bot. 2002, 89,907–916. [CrossRef]

Int. J. Mol. Sci. 2019, 20, 2273 21 of 22
26. Xu, Z.; Zhou, G. Responses of leaf stomatal density to water status and its relationship with photosynthesisin a grass. J. Exp. Bot. 2008, 59, 3317–3325. [CrossRef] [PubMed]
27. Fraire-Velázquez, S.; Balderas-Hernández, V.E. Abiotic stress in plants and metabolic responses. In AbioticStress—Plant Responses and Applications in Agriculture; Vahdati, K., Leslie, C., Eds.; INTech: Rijeka, Croatia,2013; pp. 25–48.
28. Costa, J.M.; Grant, O.M.; Chaves, M.M. Thermography to explore plant–environment interactions. J. Exp. Bot.2013, 64, 3937–3949. [CrossRef]
29. Jones, H.G.; Serraj, R.; Loveys, B.R.; Xiong, L.; Wheaton, A.; Price, A.H. Thermal infrared image ofcrop canopies for the remote diagnosis and quantification of plant responses to water stress in the field.Funct. Plant Biol. 2009, 36, 978–989. [CrossRef]
30. Jones, H.G.; Stoll, M.; Santos, T.; Sousa, C.; Chaves, M.M.; Grant, O.M. Use of infrared thermographyfor monitoring stomatal closure in the field: Application to grapevine. J. Exp. Bot. 2002, 53, 2249–2260.[CrossRef]
31. Leinonen, I.; Jones, H.G. Combining thermal and visible imagery for estimating canopy temperature andidentifying plant stress. J. Exp. Bot. 2004, 55, 1423–1431. [CrossRef]
32. Munns, R.; James, R.A.; Sirault, X.R.R.; Furbank, R.T.; Jones, H.G. New phenotyping methods for screeningwheat and barley for beneficial responses to water deficit. J. Exp. Bot. 2010, 61, 3499–3507. [CrossRef]
33. Prashar, A.; Jones, H.G. Infra-red thermography as a high-throughput tool for field phenotyping. Agronomy2014, 4, 397–417. [CrossRef]
34. McClendon, J.H. The micro-optics of leaves. I. Patterns of reflection from the epidermis. Am. J. Bot. 1984, 71,1391–1397. [CrossRef]
35. Zia, S.; Sophrer, K.; Wenyong, D.; Spreer, W.; Romano, G.; He, X.; Joachim, M. Monitoring physiologicalresponses to water stress in two maize varieties by infrared thermography. Int. J. Agric. Biol. Eng. 2011, 4,7–15.
36. Kadioglu, A.; Terzi, R.; Saruhan, N.; Saglam, A. Current advances in the investigation of leaf rolling causedby biotic and abiotic stress factors. Plant Sci. 2012, 182, 42–48. [CrossRef] [PubMed]
37. Saglam, A.; Kadioglu, A.; Demiralay, M.; Terzi, R. Leaf rolling reduces photosynthetic loss in maize undersevere drought. Acta Bot. Croat. 2014, 73, 315–323. [CrossRef]
38. Kothari, S.; Cavender-Bares, J.; Bitan, K.; Verhoeven, A.S.; Wang, R.; Montgomery, R.A.; Gamon, J.Community-wide consequences of variation in photoprotective physiology among prairie plants.Photosynthetica 2018, 56, 455–467. [CrossRef]
39. Medrano, H.; Tomás, M.; Martorell, S.; Flexas, J.; Hernández, E.; Rosselló, J.; Pou, A.; Escalona, J.-M.; Bota, J.From leaf to whole-plant water use efficiency (WUE) in complex canopies: Limitations of leaf WUE as aselection target. Crop J. 2015, 3, 220–228. [CrossRef]
40. Shareef, M.; Gui, D.; Zeng, F.; Ahmed, Z.; Waqas, M.; Zhang, B.; Iqbal, H.; Fiaz, M. Impact of drought onassimilates partitioning associated fruiting physiognomies and yield quality attributes of desert growncotton. Acta Physiol. Plant. 2018, 40, 71. [CrossRef]
41. Souza, T.C.; Castro, E.M.; Magalhães, P.C.; Lino, L.O.; Alves, E.T.; Albuquerque, P.E.P. Morphophysiology,morpho-anatomy and grain yield under field conditions for two maize hybrids with contrasting response todrought stress. Acta Physiol. Plant. 2013, 35, 3201–3211. [CrossRef]
42. Ávila, R.G.; Magalhães, P.C.; Alvarenga, A.A.; Lavinski, A.O.; Campos, C.N.; Souza, T.C.; Gomes Júnior, C.C.Drought-tolerant maize genotypes invest in root system and maintain high harvest index during water stress.Braz. J. Maize Sorghum 2016, 15, 451–461.
43. Woo, N.S.; Badger, M.R.; Pogson, B.J. A rapid, non-invasive procedure for quantitative assessment of droughtsurvival using chlorophyll fluorescence. Plant Methods 2008, 4, 27. [CrossRef]
44. Blum, A.; Shpiler, L.; Golan, G.; Mayer, J. Yield stability and canopy temperature of wheat genotypes underdrought-stress. Field Crops Res. 1989, 22, 289–296. [CrossRef]
45. DeJonge, K.C.; Taghvaeian, S.; Trout, T.J.; Comas, L.H. Comparison of canopy temperature-based waterstress indices for maize. Agric. Water Manag. 2015, 156, 51–62. [CrossRef]
46. Vadez, V.; Kholova, J.; Medina, S.; Kakkera, A.; Anderberg, H. Transpiration efficiency: New insights into anold story. J. Exp. Bot. 2014, 65, 6141–6153. [CrossRef]
47. Usamentiaga, R.; Venegas, P.; Guerediaga, J.; Vega, L.; Molleda, J.; Bulnes, F.G. Infrared thermography fortemperature measurement and non-destructive testing. Sensors 2014, 14, 12305–12348. [CrossRef]

Int. J. Mol. Sci. 2019, 20, 2273 22 of 22
48. Lagouarde, J.P.; Kerr, Y.H.; Bruneta, Y. An experimental study of angular effects on surface temperature forvarious plant canopies and bare soils. Agric. For. Meteorol. 1995, 77, 167–190. [CrossRef]
49. Schanda, J. Colorimetry: Understanding the CIE System; John Wiley & Sons: Hoboken, NJ, USA, 2007; 467p.50. Comaniciu, D.; Meer, P. Mean shift: A robust approach toward feature space analysis. IEEE Trans. Pattern Anal.
2002, 24, 603–619. [CrossRef]51. Dougherty, E.R. Mathematical Morphology in Image Processing; Marcel Dekker: New York, NY, USA, 1992.52. Hartley, R.; Zisserman, A. Multiple View Geometry in Computer Vision, 2nd ed.; Cambridge University Press:
Cambridge, UK, 2003; 655p.53. Pedregosa, F.; Varoquaux, G.; Gramfort, A.; Michel, V.; Thirion, B.; Grisel, O.; Blondel, M.; Prettenhofer, P.;
Weiss, R.; Dubourg, V.; et al. Scikit-learn: Machine learning in Python. J. Mach. Learn. Res. 2011, 12,2825–2830.
54. Mukaka, M.M. Statistics Corner: A guide to appropriate use of Correlation coefficient in medical research.Malawi Med. J. 2012, 24, 69–71.
© 2019 by the authors. Licensee MDPI, Basel, Switzerland. This article is an open accessarticle distributed under the terms and conditions of the Creative Commons Attribution(CC BY) license (http://creativecommons.org/licenses/by/4.0/).