Embed Size (px)
Citation preview
European Journal of Geography Volume 8, Number 2:107 - 120, February 2017
©Association of European Geographers
European Journal of Geography-ISSN 1792-1341 © All rights reserved 107
USING THE SLEUTH MODEL TO SIMULATE FUTURE URBAN GROWTH IN
THE GREATER EASTERN ATTICA AREA, GREECE
Stylianos Mathioulakis National Technical University of Athens, Department of Geography and Regional Planning, Greece
Yorgos N. Photis National Technical University of Athens, Department of Geography and Regional Planning, Greece
Abstract
Urban sprawl is, undoubtedly, a global phenomenon that has been in effect since the dawn of
civilization and has been an intriguing subject, primarily in the research field of geography.
In recent years, the need to forecast and simulate real-world urban processes has led to
advancements in computational methods on modeling these patterns. This paper reviews how
primitive forms of urban settlements have gradually shaped into today’s contemporary cities.
In addition, the causes, types and impacts of urban sprawl are examined given the importance
to predict negative effects when an urban project is built. Lastly, this study includes an
application of a Cellular Automaton (CA) Urban Growth Model (UGM) in order to simulate
future urban growth. For this endeavor, the greater area of Eastern Attica, Greece was chosen
as case study due to the fact that it yet has vast non-urban areas that could be converted to
urban in the foreseeable future. To produce the final simulation output, various sources of
digital imagery were used and then processed according to the model’s specific format. The
final prediction scenario presents urban growth for the year of 2045 on Eastern Attica.
Keywords: Cellular Automata, SLEUTH model, urban sprawl, spatial modeling, GIS.
1. INTRODUCTION
It is a well-known fact that urban sprawl is a global phenomenon that has been active for
centuries. It involves all the underlying processes and patterns that form the shape of cities
and has an impact on its economy, its society and its environment. The increase of population
on a global scale has an inherent repercussion on the rate at which urban sprawl manifests. In
other words, any increase of population is bound to spatially manifest itself in the form of
urban sprawl sooner or later, unless vertical expansion is possible and housing policies allow
for tall buildings. It is imperative that we model and forecast urban sprawl in order to gauge
its trends and patterns and examine its repercussions on existing natural habitats and
ecosystems. Urban sprawl causes a chain reaction when expanding onto adjacent non-urban
land uses that may be antagonistic to each other. For instance, rural land use and urban land
use are rarely seen in adjacent areas due to the fact that the human actions that revolve around
these land uses are in conflict. Lastly, when planners and policy makers forge a plan about
future urban expansion or when they try to find measures to protect natural habitats against
urban sprawl, they could use an Urban Growth Model (UGM) as a tool that can bring out the
Mathioulakis S. and Y. N. Photis / European Journal of Geography 8 2 107–120 (2017)
European Journal of Geography-ISSN 1792-1341 © All rights reserved 108
trends of urban tissue expansion and pinpoint the areas which could be problematic in the
near future. Thus, UGMs play a huge role in the effectiveness of policy making and planning
in order to achieve sustainable growth.
The first attempts on urban modeling were unsuccessful, producing models that were not
accurate and were oversimplifications of the forms and underlying processes that cause cities
to expand. They were lacking the physical, spatial and economic factors that are involved in
the process of urban sprawl and hence were unable to effectively simulate the complexity of
urban systems. However, the last two decades have seen a plethora of models being published
and a whole new era of urban modeling. This is mainly because of the technological
advancements in computer architecture that enabled more robust computational methods and
environments that could facilitate the aforementioned models. In addition, the advent of the
Internet has allowed for an unprecedented dissemination of high quality spatial data that
could be implemented in urban model studies. In 2010, Santé, Garcia, Miranda and Crecente
documented 33 models that had been published by then, presented a structured overview of
their strengths and weaknesses, and highlighted the different approaches to which these
models subscribe.
In this study, the second chapter includes a historical overview of how the first urban
settlements gradually involved into contemporary cities and an examination of urban sprawl
as a distinct and recently developed phenomenon. The third chapter refers to the causes of
urban sprawl, the fourth chapter refers to theory of urban growth models, and the fifth chapter
refers to the implementation of a CA model to forecast urban sprawl in the area of Eastern
Attica, Greece. The final chapter summarizes the conclusions.
2. BACKGROUND
Before examining the urban sprawl phenomenon, one must first examine the “city”
phenomenon as a concept and as an entity and the correlation between ancient cities and
contemporary urban forms. According to Doxiadis (1971) there is a direct correlation
between ancient Greek cities and modern ones through excavation findings which prove that
there is a correspondence of contemporary and ancient times, for 10 ancient settlements have
been found, namely in Thasos, Greece, and there were also 10 modern communities.
Ever since man abandoned the wandering-hunter lifestyle and evolved into a being that
could harvest the land and raise stock, the need for cohabitation became evident and crucial
to his survival, and thus forced him to settle in natural space which, according to his
capability, he modified to facilitate his needs creating the first primitive forms of urban
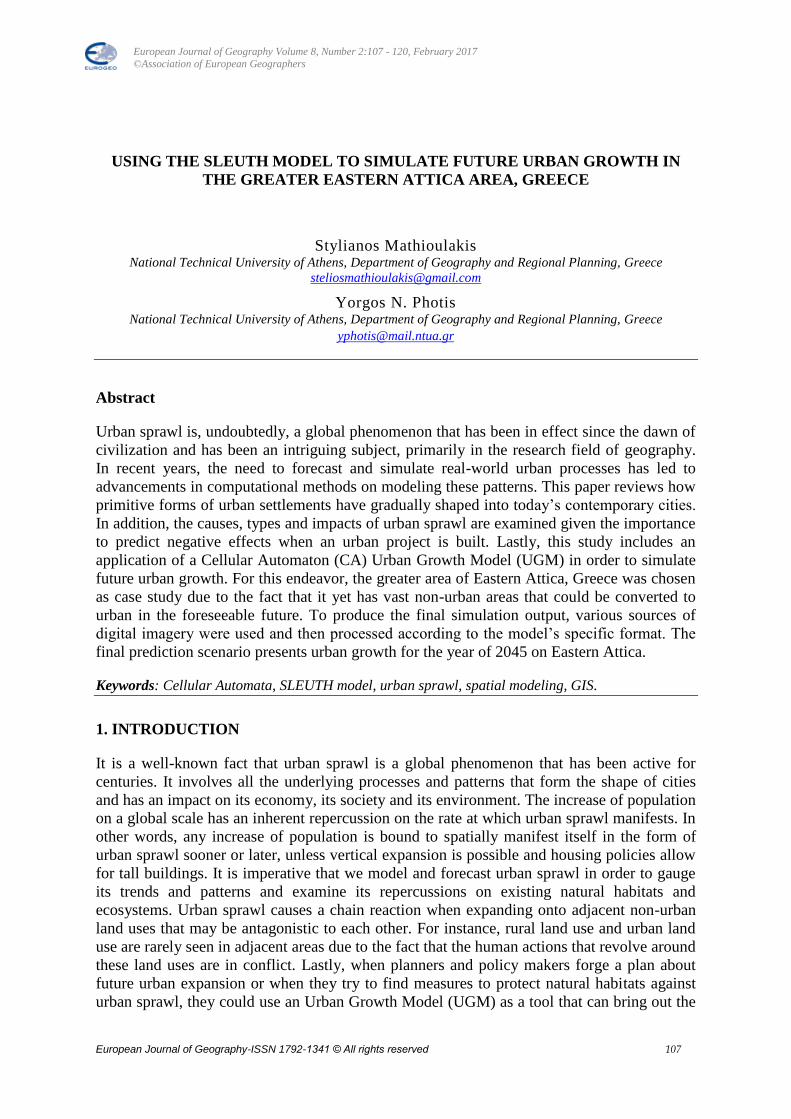
settlement (Aravantinos, 2007). Between 6000 and 4000 B.C. certain inventions -such as the
ox-drawn plow, the sailboat, and the domestication of new plants- allowed for the Neolithic
populations to utilize these inventions in fertile regions (Figure 1), settle close to them, and
form the first towns (Davis, 1955). By 3000 B.C., other inventions including writing and
accountancy, bronze, the beginnings of science, and the solar calendar, made larger
settlements possible in Egypt, Mesopotamia, and India; Davis (1955) coins the term “true”
cities when referring to these settlements (Tsompanoglou & Photis, 2013). The first cities in
Mesopotamia existed around the Tigris and Euphrates rivers, with Ur being one of the earliest
cities which was the capital of the Sumerian Empire from 2300 B.C. to 2180 B.C. (Pacione,
2009).
Mathioulakis S. and Y. N. Photis / European Journal of Geography 8 2 107–120 (2017)
European Journal of Geography-ISSN 1792-1341 © All rights reserved 109
Source: Yoffee, 2005
Figure 1. Earliest states and civilizations
In ancient Greece, cities were small in size –roughly 1.8km2 on average- and their average
population probably did not exceed 10,000 even in some of the major cities of that time, such
as Athens, Corinth, Delos, Priene, Miletus, Piraeus, Olynthos and Selinus (Doxiadis, 1964).
Also, Doxiadis (1964) distinguishes two primitive urban forms that were evident at that time:
cities created though natural growth and cities created with the Hippodameian system.
Doxiadis explains that the former form was seen at the oldest and at the cities of continental
Greece with Athens being the most typical representation of this form. These cities were
developed around a prominent location, usually a hill or a rock, called the Acropolis, where
citizens would take refuge in case of war or attack (Doxiadis, 1964). Gradually, the city
developed around the Acropolis core in wider circles, forming a second core at its lower part,
called the Agora, which acted as a place for political, commercial and social gatherings
(Doxiadis, 1964). The second urban form, according to Doxiadis (1964), is the Hippodameian
system inspired by Hippodamus the Milesian. In this system the city is built based on a grid
of parallel streets that favors simplicity and functionality presenting the simplest solution of
layout with the fewest complications (Doxiadis, 1964).
Although Ancient Greeks significantly contributed to the advancement of urban planning
in their time, it was the Romans who explored the full potentialities of the ancient world to
support a large city (Davis, 1955). Pacione (2009) suggests that the Romans adopted the
Hippodameian system in cities of Western Europe, such as London, Brussels, Seville,
Cologne, Paris, Vienna and Belgrade, that they conquered and that the typical form of a
Roman imperial settlement would be inscribed into a rectangular or square perimeter, have
two main cross streets (the east-west and the north-south), and host the Forum (a place
equivalent to the Greek Agora), the main temple, the theater and the public baths in one of
the angles formed by the intersection of the two aforementioned principal streets.
Fast forwarding to the 19th century, the industrial revolution brought about urbanization at
a much faster rate and reached proportions far greater than ever before, an example that
verifies this assumption could be found in London where its outer ring, since 1861, has been
growing more rapidly than its core (Davis, 1955). Hence, the 19th century witnessed the
flowering of industrial capitalism in Western Europe and the rapid growth of the European
industrial city, which was developed to fulfill the needs of capital (Pacione, 2009).
Meanwhile, in the U.S. industrial cities were also prevalent and forced the department of
urban sociology of the University of Chicago to conduct extensive research on the city of
Chicago, which had recently expanded primarily due to industrialization (Hall, 2005). By
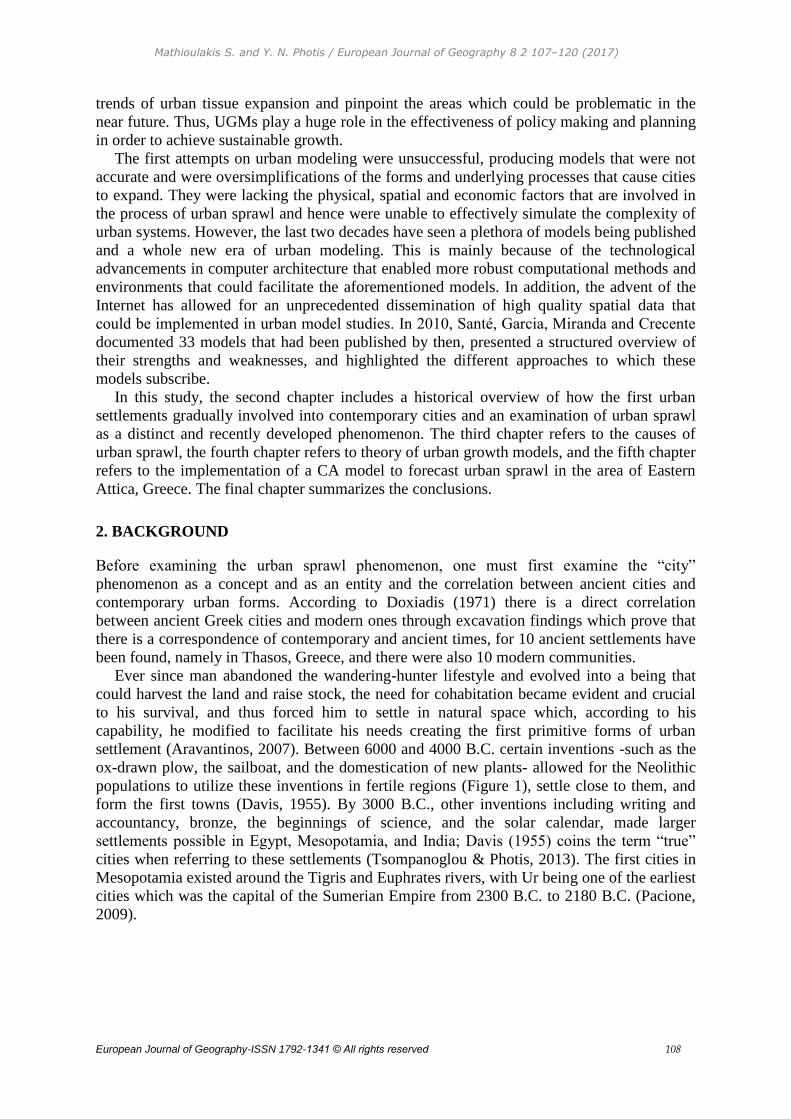
examining the urban patterns of Chicago, Park, Burgess and McKenzie (1925) illustrated the
urban form model that they came up with using a diagram of the city as a series of concentric
circles (Figure 2) where the inner circle contained the central business district (CBD), the
Mathioulakis S. and Y. N. Photis / European Journal of Geography 8 2 107–120 (2017)
European Journal of Geography-ISSN 1792-1341 © All rights reserved 110
next zone housed the poorest citizens and some light manufacture, the third ring area
consisted of housing for the working class, and the outer ring comprised single-family
residential areas where the social elite, which could afford the long commute, lived
(Bruegmann, 2005).
Source: Urban models in MEDCs
Figure 2. Burgess’s model of the industrial city
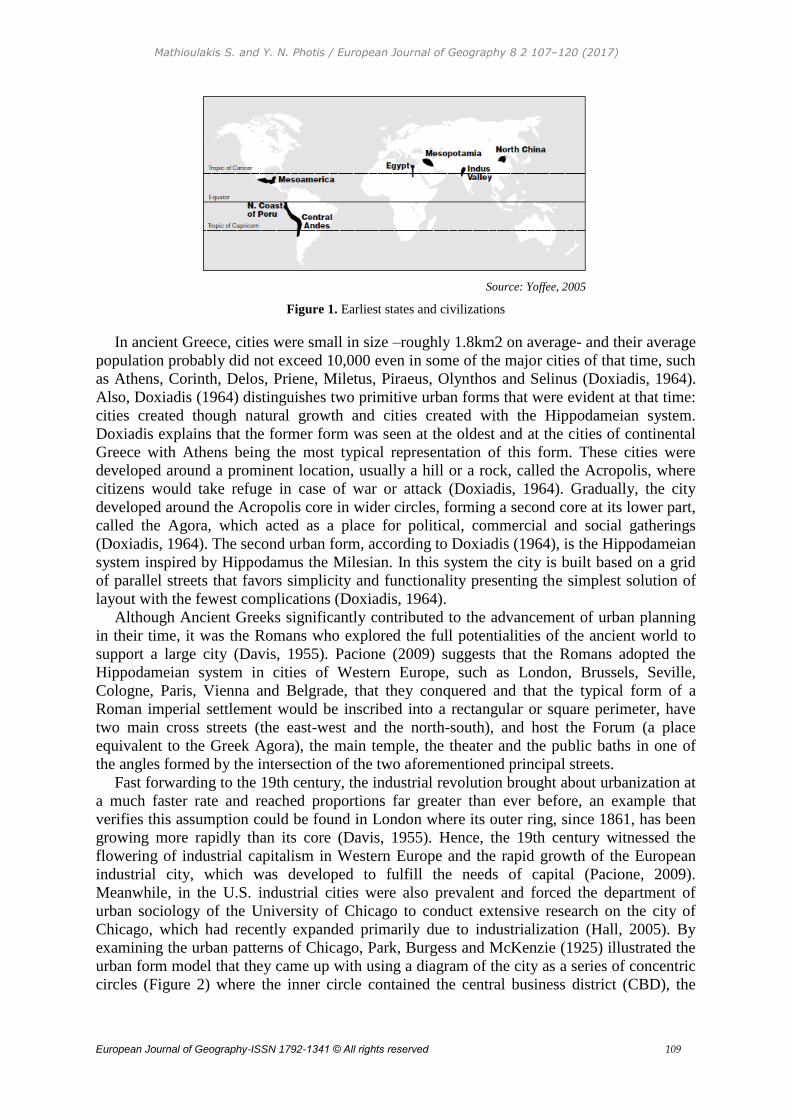
According to Bruegmann (2005), Burgess’s model contained some flaws and limitations,
such as the fact that industry did not concentrate in concentric bands; more likely it followed
lines of water and rail lines. Another flaw that he exposes is that within each ring described in
the model there were actually wide variations of income and social class. So, in order to make
up for the shortcomings of this model, Hoyt (1939), after extensive research on the historical
urban change in major cities of the U.S., came up with a variation of the model in which the
city is clustered into sectors (Figure 3).
Source: Urban models in MEDCs
Figure 3. Hoyt’s model
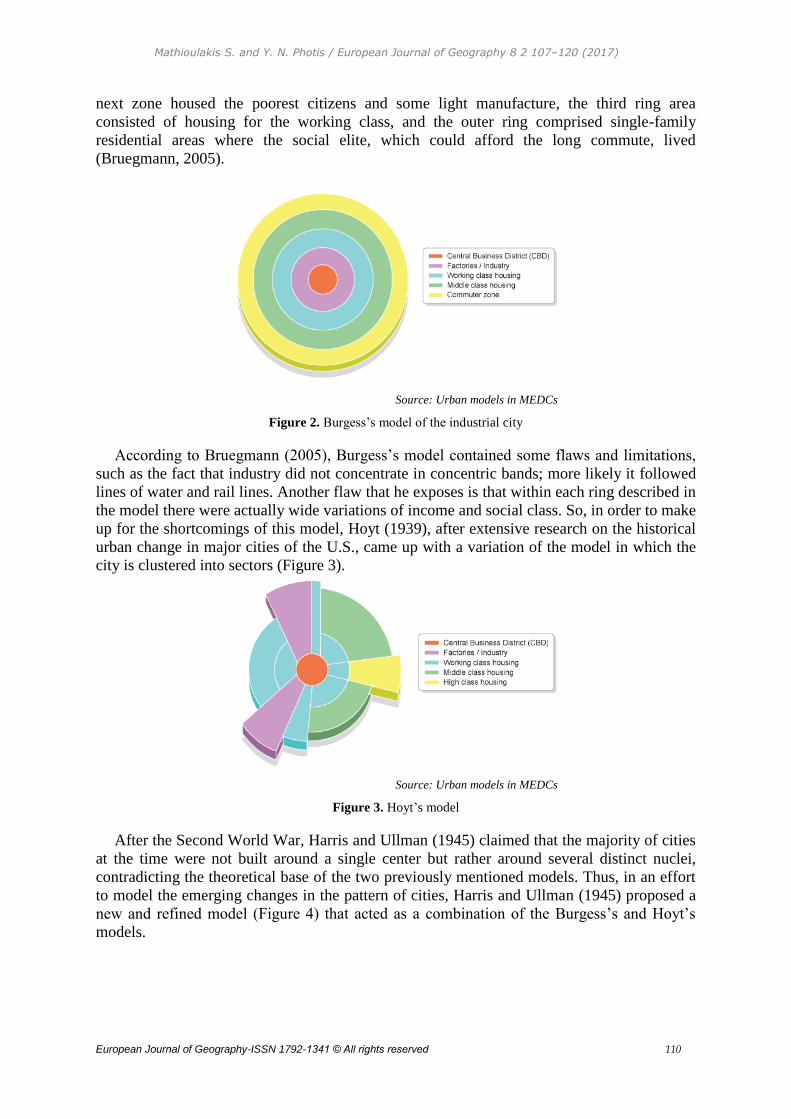
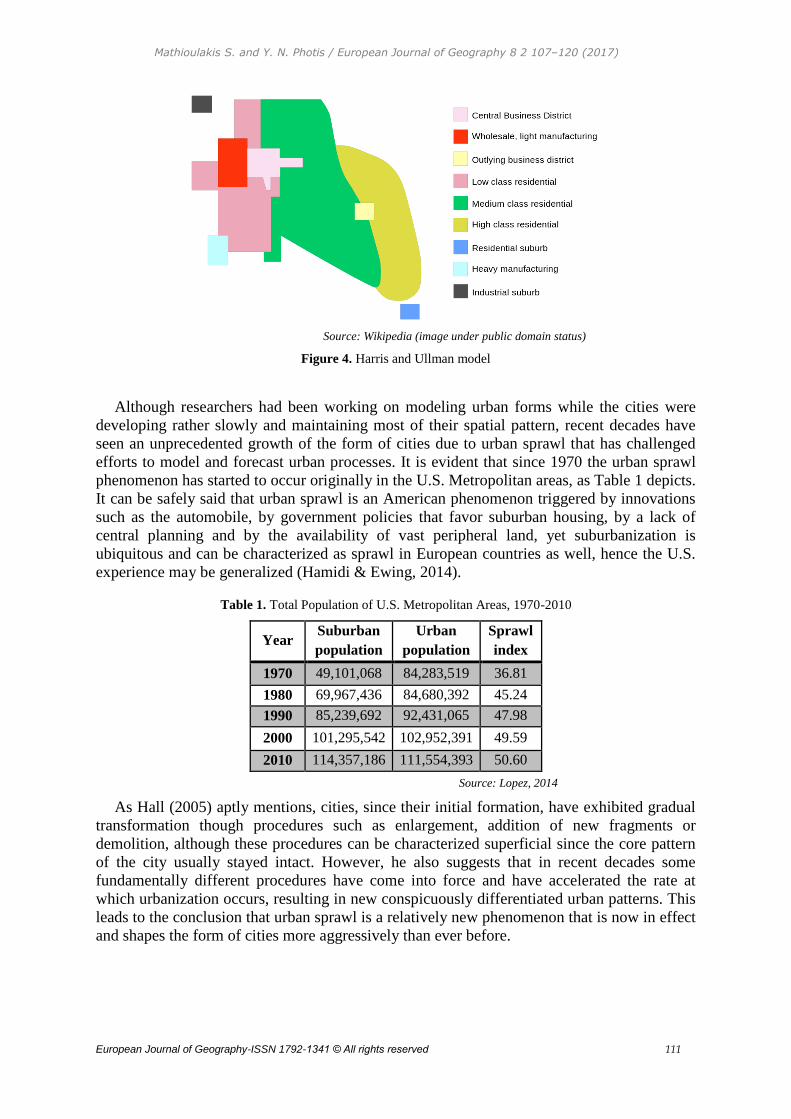
After the Second World War, Harris and Ullman (1945) claimed that the majority of cities
at the time were not built around a single center but rather around several distinct nuclei,
contradicting the theoretical base of the two previously mentioned models. Thus, in an effort
to model the emerging changes in the pattern of cities, Harris and Ullman (1945) proposed a
new and refined model (Figure 4) that acted as a combination of the Burgess’s and Hoyt’s
models.
Mathioulakis S. and Y. N. Photis / European Journal of Geography 8 2 107–120 (2017)
European Journal of Geography-ISSN 1792-1341 © All rights reserved 111
Source: Wikipedia (image under public domain status)
Figure 4. Harris and Ullman model
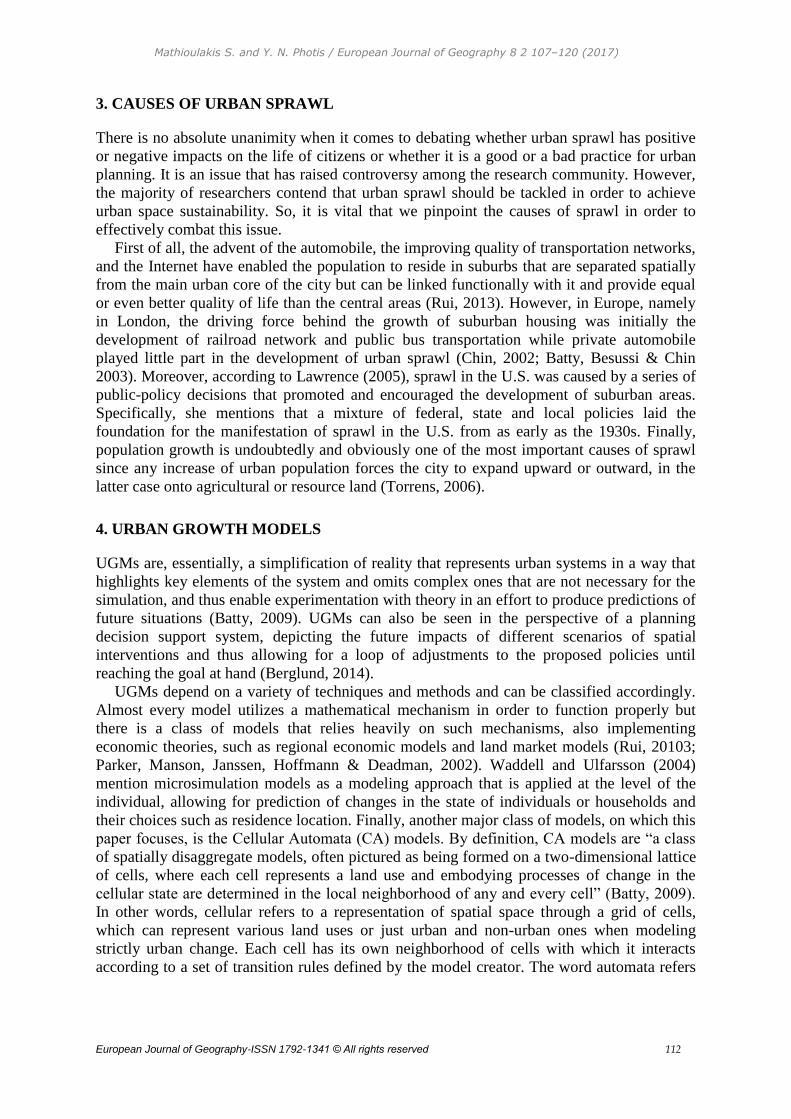
Although researchers had been working on modeling urban forms while the cities were
developing rather slowly and maintaining most of their spatial pattern, recent decades have
seen an unprecedented growth of the form of cities due to urban sprawl that has challenged
efforts to model and forecast urban processes. It is evident that since 1970 the urban sprawl
phenomenon has started to occur originally in the U.S. Metropolitan areas, as Table 1 depicts.
It can be safely said that urban sprawl is an American phenomenon triggered by innovations
such as the automobile, by government policies that favor suburban housing, by a lack of
central planning and by the availability of vast peripheral land, yet suburbanization is
ubiquitous and can be characterized as sprawl in European countries as well, hence the U.S.
experience may be generalized (Hamidi & Ewing, 2014).
Table 1. Total Population of U.S. Metropolitan Areas, 1970-2010
Year Suburban
population
Urban
population
Sprawl
index
1970 49,101,068 84,283,519 36.81
1980 69,967,436 84,680,392 45.24
1990 85,239,692 92,431,065 47.98
2000 101,295,542 102,952,391 49.59
2010 114,357,186 111,554,393 50.60
Source: Lopez, 2014
As Hall (2005) aptly mentions, cities, since their initial formation, have exhibited gradual
transformation though procedures such as enlargement, addition of new fragments or
demolition, although these procedures can be characterized superficial since the core pattern
of the city usually stayed intact. However, he also suggests that in recent decades some
fundamentally different procedures have come into force and have accelerated the rate at
which urbanization occurs, resulting in new conspicuously differentiated urban patterns. This
leads to the conclusion that urban sprawl is a relatively new phenomenon that is now in effect
and shapes the form of cities more aggressively than ever before.
Mathioulakis S. and Y. N. Photis / European Journal of Geography 8 2 107–120 (2017)
European Journal of Geography-ISSN 1792-1341 © All rights reserved 112
3. CAUSES OF URBAN SPRAWL
There is no absolute unanimity when it comes to debating whether urban sprawl has positive
or negative impacts on the life of citizens or whether it is a good or a bad practice for urban
planning. It is an issue that has raised controversy among the research community. However,
the majority of researchers contend that urban sprawl should be tackled in order to achieve
urban space sustainability. So, it is vital that we pinpoint the causes of sprawl in order to
effectively combat this issue.
First of all, the advent of the automobile, the improving quality of transportation networks,
and the Internet have enabled the population to reside in suburbs that are separated spatially
from the main urban core of the city but can be linked functionally with it and provide equal
or even better quality of life than the central areas (Rui, 2013). However, in Europe, namely
in London, the driving force behind the growth of suburban housing was initially the
development of railroad network and public bus transportation while private automobile
played little part in the development of urban sprawl (Chin, 2002; Batty, Besussi & Chin
2003). Moreover, according to Lawrence (2005), sprawl in the U.S. was caused by a series of
public-policy decisions that promoted and encouraged the development of suburban areas.
Specifically, she mentions that a mixture of federal, state and local policies laid the
foundation for the manifestation of sprawl in the U.S. from as early as the 1930s. Finally,
population growth is undoubtedly and obviously one of the most important causes of sprawl
since any increase of urban population forces the city to expand upward or outward, in the
latter case onto agricultural or resource land (Torrens, 2006).
4. URBAN GROWTH MODELS
UGMs are, essentially, a simplification of reality that represents urban systems in a way that
highlights key elements of the system and omits complex ones that are not necessary for the
simulation, and thus enable experimentation with theory in an effort to produce predictions of
future situations (Batty, 2009). UGMs can also be seen in the perspective of a planning
decision support system, depicting the future impacts of different scenarios of spatial
interventions and thus allowing for a loop of adjustments to the proposed policies until
reaching the goal at hand (Berglund, 2014).
UGMs depend on a variety of techniques and methods and can be classified accordingly.
Almost every model utilizes a mathematical mechanism in order to function properly but
there is a class of models that relies heavily on such mechanisms, also implementing
economic theories, such as regional economic models and land market models (Rui, 20103;
Parker, Manson, Janssen, Hoffmann & Deadman, 2002). Waddell and Ulfarsson (2004)
mention microsimulation models as a modeling approach that is applied at the level of the
individual, allowing for prediction of changes in the state of individuals or households and
their choices such as residence location. Finally, another major class of models, on which this
paper focuses, is the Cellular Automata (CA) models. By definition, CA models are “a class
of spatially disaggregate models, often pictured as being formed on a two-dimensional lattice
of cells, where each cell represents a land use and embodying processes of change in the
cellular state are determined in the local neighborhood of any and every cell” (Batty, 2009).
In other words, cellular refers to a representation of spatial space through a grid of cells,
which can represent various land uses or just urban and non-urban ones when modeling
strictly urban change. Each cell has its own neighborhood of cells with which it interacts
according to a set of transition rules defined by the model creator. The word automata refers
Mathioulakis S. and Y. N. Photis / European Journal of Geography 8 2 107–120 (2017)
European Journal of Geography-ISSN 1792-1341 © All rights reserved 113
to an iterative process that stipulates the state of each cell, according to the defined transition
rules, and takes place at initialization, calibration or prediction phase of the model.
5. MODEL IMPLEMENTATION
In this study the SLEUTH model, introduced by Clarke, Hoppen and Gaydos (1997), was
used to forecast urban sprawl in Eastern Attica, Greece. SLEUTH is an acronym of its
required input data, which are the Slope layer, the Landuse layer, the Excluded layer, the
Urban layer, the Transportation network layer and the Hillshade layer (Liu, 2008). In detail,
the model requires landscape data in the form of Slope and Hillshade, although Hillshade is
optional and only used for visualization purposes, Landuse layers, which are also optional, an
Exclusion layer that places constraints on urban growth, at least four historical Urban layers,
and finally, at least two Transportation network layers (Dietzel & Clarke, 2004). These input
data feed the calibration process, a step necessary prior to the prediction phase of the model.
Inarguably, the effectiveness of a model’s calibration is the most crucial factor that affects the
value of its predictions (Clarke, Hoppen & Gaydos, 1996). During calibration, the model
produces Monte Carlo simulations using all possible combinations of the five coefficients
(diffusion, breed, spread, slope resistance and road gravity) that control the system’s behavior
and subsequently compares each simulation to the historical (actual) data that the user
provides as model input (Clarke et al., 1997).
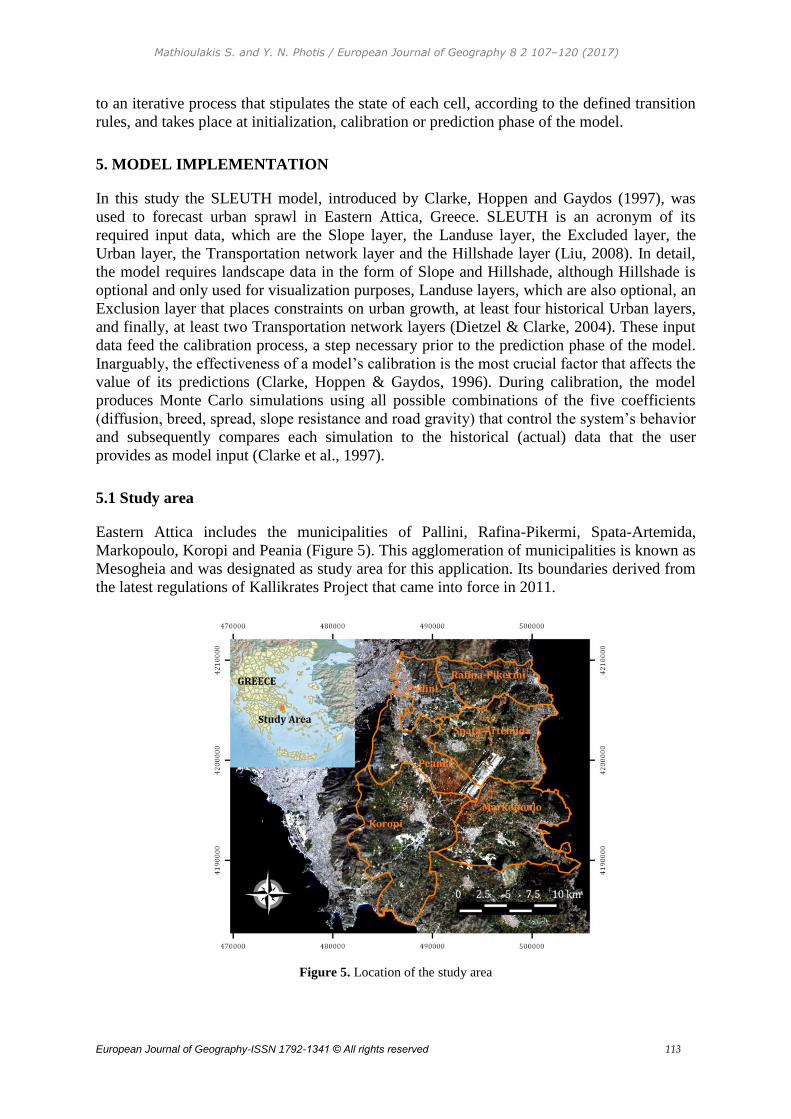
5.1 Study area
Eastern Attica includes the municipalities of Pallini, Rafina-Pikermi, Spata-Artemida,
Markopoulo, Koropi and Peania (Figure 5). This agglomeration of municipalities is known as
Mesogheia and was designated as study area for this application. Its boundaries derived from
the latest regulations of Kallikrates Project that came into force in 2011.
Figure 5. Location of the study area
Mathioulakis S. and Y. N. Photis / European Journal of Geography 8 2 107–120 (2017)
European Journal of Geography-ISSN 1792-1341 © All rights reserved 114
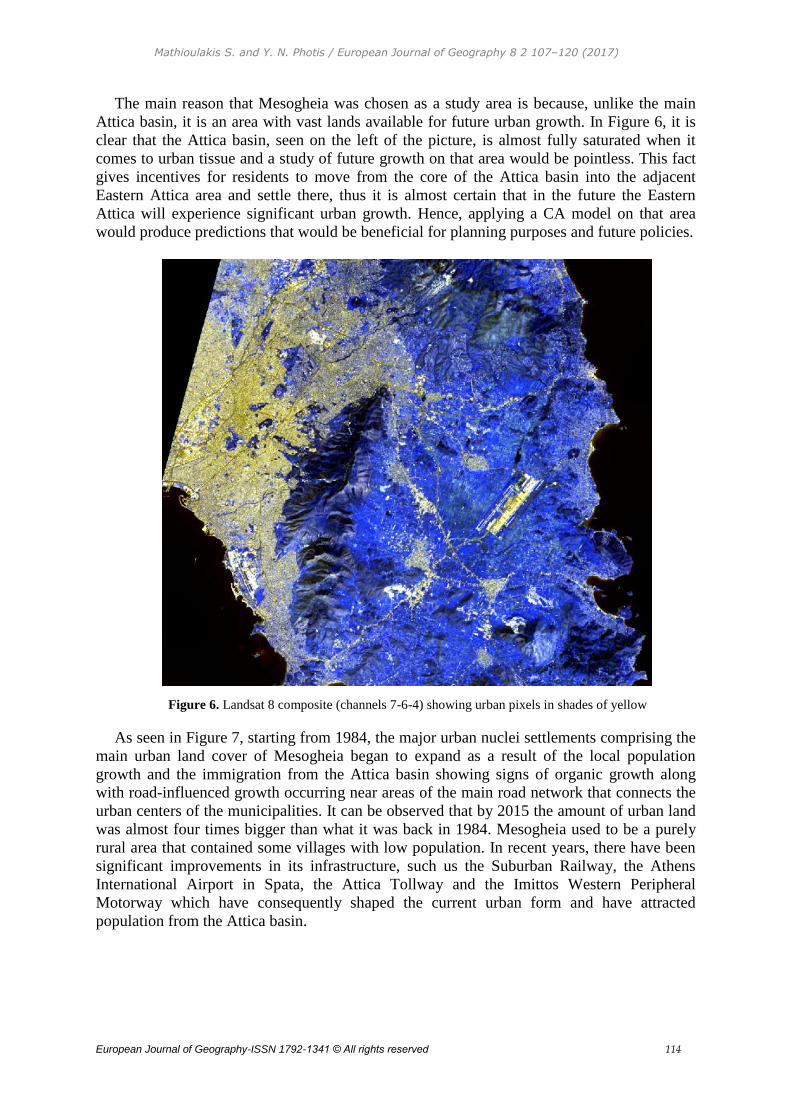
The main reason that Mesogheia was chosen as a study area is because, unlike the main
Attica basin, it is an area with vast lands available for future urban growth. In Figure 6, it is
clear that the Attica basin, seen on the left of the picture, is almost fully saturated when it
comes to urban tissue and a study of future growth on that area would be pointless. This fact
gives incentives for residents to move from the core of the Attica basin into the adjacent
Eastern Attica area and settle there, thus it is almost certain that in the future the Eastern
Attica will experience significant urban growth. Hence, applying a CA model on that area
would produce predictions that would be beneficial for planning purposes and future policies.
Figure 6. Landsat 8 composite (channels 7-6-4) showing urban pixels in shades of yellow
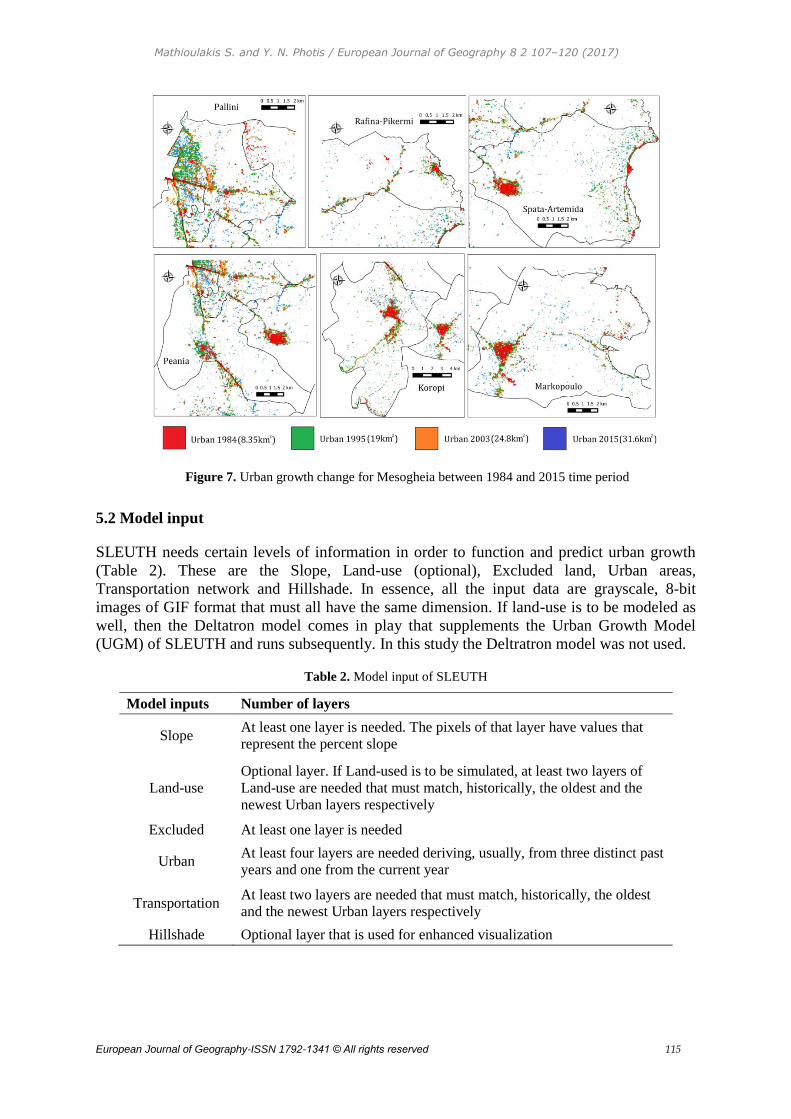
As seen in Figure 7, starting from 1984, the major urban nuclei settlements comprising the
main urban land cover of Mesogheia began to expand as a result of the local population
growth and the immigration from the Attica basin showing signs of organic growth along
with road-influenced growth occurring near areas of the main road network that connects the
urban centers of the municipalities. It can be observed that by 2015 the amount of urban land
was almost four times bigger than what it was back in 1984. Mesogheia used to be a purely
rural area that contained some villages with low population. In recent years, there have been
significant improvements in its infrastructure, such us the Suburban Railway, the Athens
International Airport in Spata, the Attica Tollway and the Imittos Western Peripheral
Motorway which have consequently shaped the current urban form and have attracted
population from the Attica basin.
Mathioulakis S. and Y. N. Photis / European Journal of Geography 8 2 107–120 (2017)
European Journal of Geography-ISSN 1792-1341 © All rights reserved 115
Figure 7. Urban growth change for Mesogheia between 1984 and 2015 time period
5.2 Model input
SLEUTH needs certain levels of information in order to function and predict urban growth
(Table 2). These are the Slope, Land-use (optional), Excluded land, Urban areas,
Transportation network and Hillshade. In essence, all the input data are grayscale, 8-bit
images of GIF format that must all have the same dimension. If land-use is to be modeled as
well, then the Deltatron model comes in play that supplements the Urban Growth Model
(UGM) of SLEUTH and runs subsequently. In this study the Deltratron model was not used.
Table 2. Model input of SLEUTH
Model inputs Number of layers
Slope At least one layer is needed. The pixels of that layer have values that
represent the percent slope
Land-use
Optional layer. If Land-used is to be simulated, at least two layers of
Land-use are needed that must match, historically, the oldest and the
newest Urban layers respectively
Excluded At least one layer is needed
Urban At least four layers are needed deriving, usually, from three distinct past
years and one from the current year
Transportation At least two layers are needed that must match, historically, the oldest
and the newest Urban layers respectively
Hillshade Optional layer that is used for enhanced visualization
Mathioulakis S. and Y. N. Photis / European Journal of Geography 8 2 107–120 (2017)
European Journal of Geography-ISSN 1792-1341 © All rights reserved 116
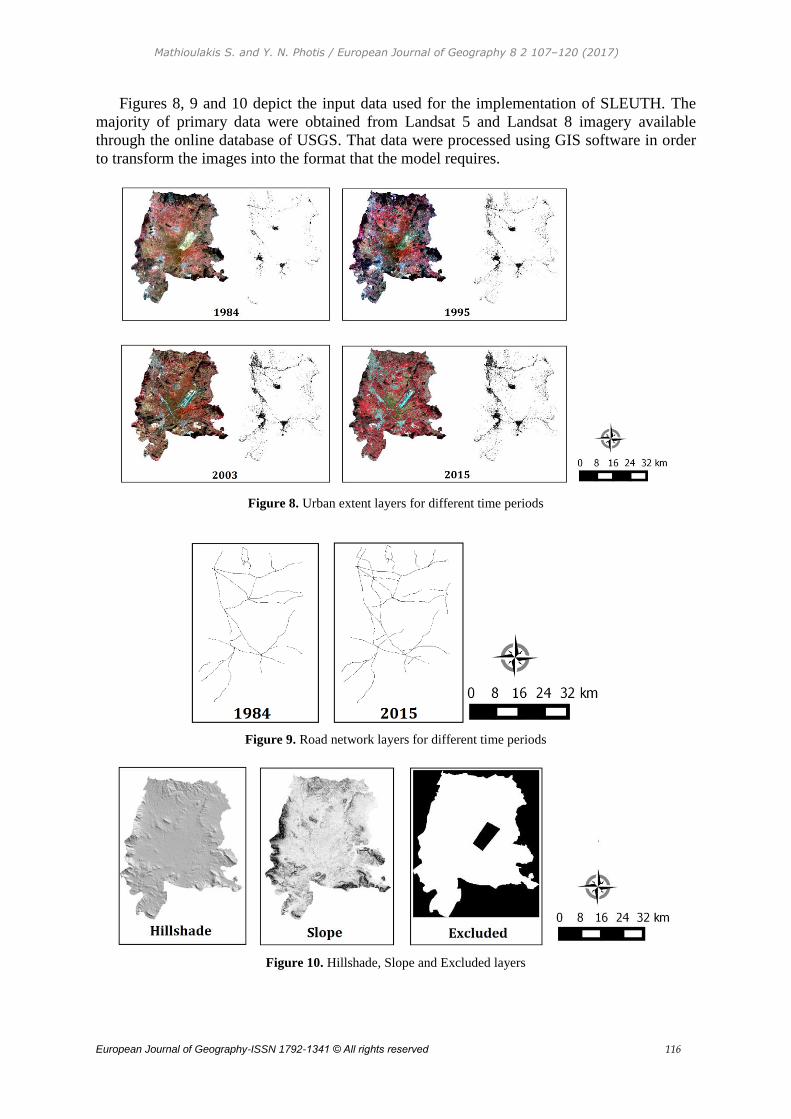
Figures 8, 9 and 10 depict the input data used for the implementation of SLEUTH. The
majority of primary data were obtained from Landsat 5 and Landsat 8 imagery available
through the online database of USGS. That data were processed using GIS software in order
to transform the images into the format that the model requires.
Figure 8. Urban extent layers for different time periods
Figure 9. Road network layers for different time periods
Figure 10. Hillshade, Slope and Excluded layers
Mathioulakis S. and Y. N. Photis / European Journal of Geography 8 2 107–120 (2017)
European Journal of Geography-ISSN 1792-1341 © All rights reserved 117
For the years 1984, 1995, 2003 and 2015, the Urban extend layer was produced by a semi-
automatic classification algorithm so that all pixels of the Landsat images were classified into
urban and non-urban. The transportation network was produced from manual digitization of
Landsat images. The Slope and Hillshade layers were the product of a Digital Elevation
Model provided by the ASTER satellite.
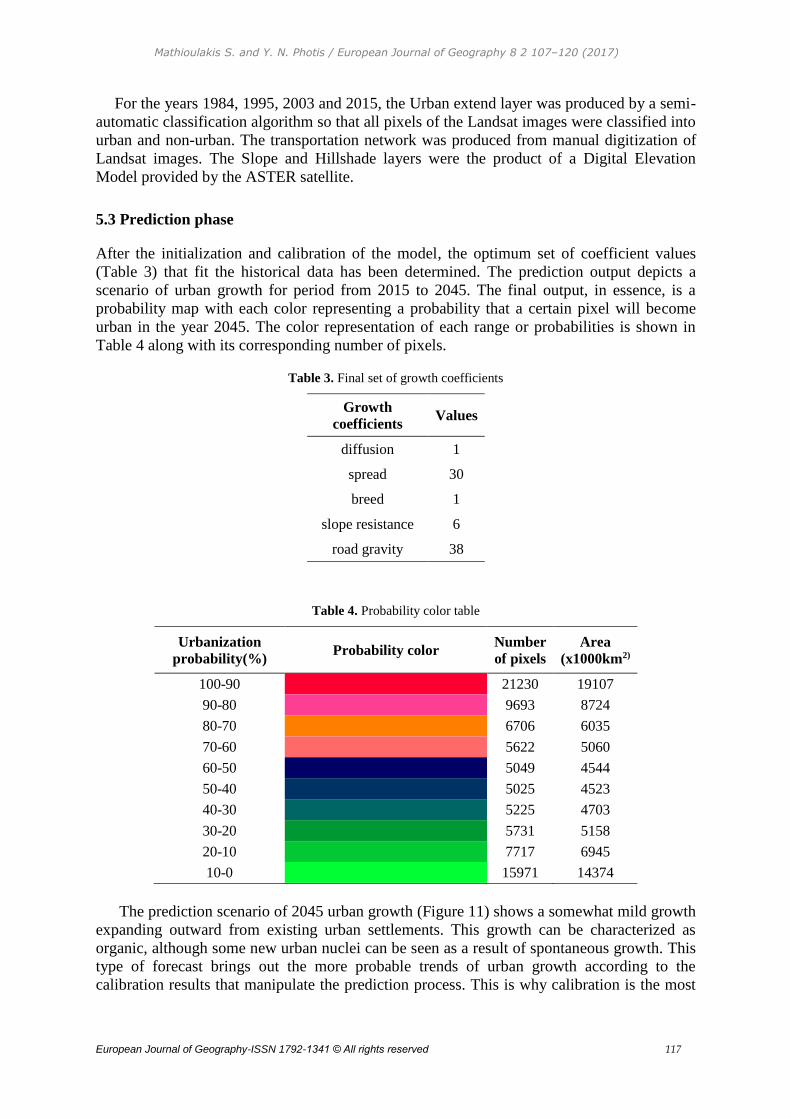
5.3 Prediction phase
After the initialization and calibration of the model, the optimum set of coefficient values
(Table 3) that fit the historical data has been determined. The prediction output depicts a
scenario of urban growth for period from 2015 to 2045. The final output, in essence, is a
probability map with each color representing a probability that a certain pixel will become
urban in the year 2045. The color representation of each range or probabilities is shown in
Table 4 along with its corresponding number of pixels.
Table 3. Final set of growth coefficients
Growth
coefficients Values
diffusion 1
spread 30
breed 1
slope resistance 6
road gravity 38
Table 4. Probability color table
Urbanization
probability(%) Probability color
Number
of pixels
Area
(x1000km2)
100-90 21230 19107
90-80 9693 8724
80-70 6706 6035
70-60 5622 5060
60-50 5049 4544
50-40 5025 4523
40-30 5225 4703
30-20 5731 5158
20-10 7717 6945
10-0 15971 14374
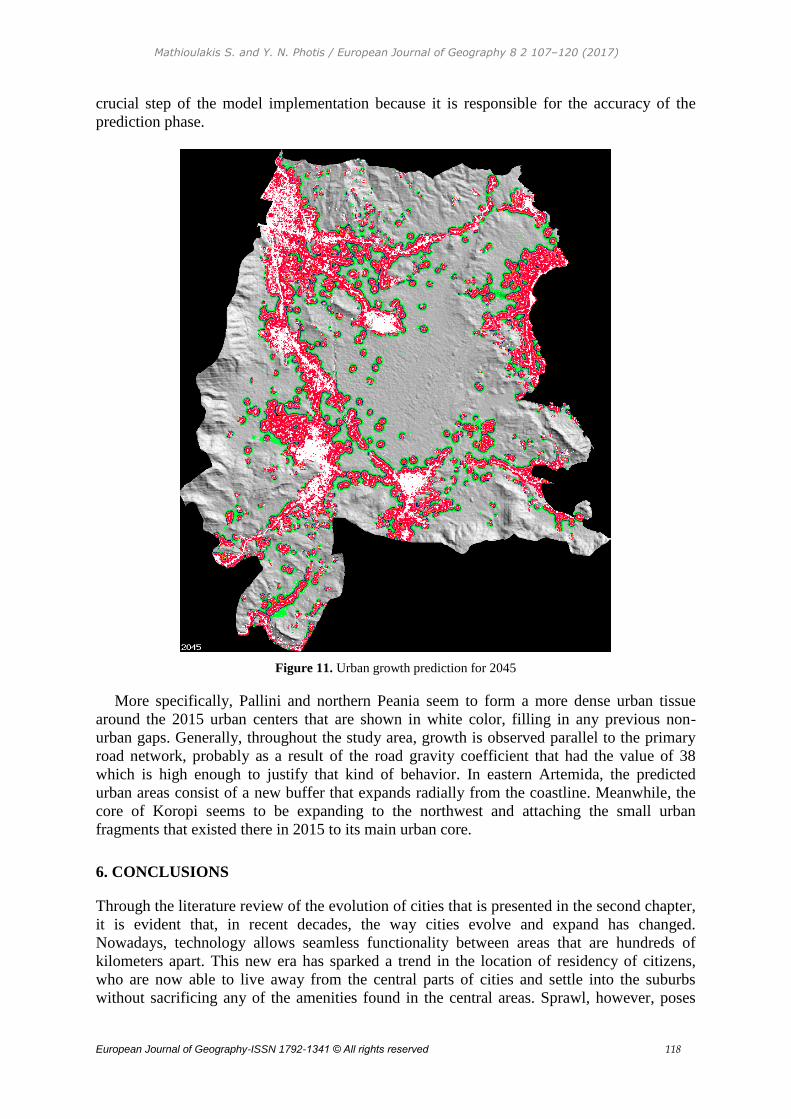
The prediction scenario of 2045 urban growth (Figure 11) shows a somewhat mild growth
expanding outward from existing urban settlements. This growth can be characterized as
organic, although some new urban nuclei can be seen as a result of spontaneous growth. This
type of forecast brings out the more probable trends of urban growth according to the
calibration results that manipulate the prediction process. This is why calibration is the most
Mathioulakis S. and Y. N. Photis / European Journal of Geography 8 2 107–120 (2017)
European Journal of Geography-ISSN 1792-1341 © All rights reserved 118
crucial step of the model implementation because it is responsible for the accuracy of the
prediction phase.
Figure 11. Urban growth prediction for 2045
More specifically, Pallini and northern Peania seem to form a more dense urban tissue
around the 2015 urban centers that are shown in white color, filling in any previous non-
urban gaps. Generally, throughout the study area, growth is observed parallel to the primary
road network, probably as a result of the road gravity coefficient that had the value of 38
which is high enough to justify that kind of behavior. In eastern Artemida, the predicted
urban areas consist of a new buffer that expands radially from the coastline. Meanwhile, the
core of Koropi seems to be expanding to the northwest and attaching the small urban
fragments that existed there in 2015 to its main urban core.
6. CONCLUSIONS
Through the literature review of the evolution of cities that is presented in the second chapter,
it is evident that, in recent decades, the way cities evolve and expand has changed.
Nowadays, technology allows seamless functionality between areas that are hundreds of
kilometers apart. This new era has sparked a trend in the location of residency of citizens,
who are now able to live away from the central parts of cities and settle into the suburbs
without sacrificing any of the amenities found in the central areas. Sprawl, however, poses
Mathioulakis S. and Y. N. Photis / European Journal of Geography 8 2 107–120 (2017)
European Journal of Geography-ISSN 1792-1341 © All rights reserved 119
serious threats to rural areas and natural resources and thus is an unsustainable practice that
must be monitored. To this end, it is highly imperative that future policies on new housing
place constraints to uncontrolled and arbitrary vertical expansion of suburbs. A very useful
tool that can aid in this endeavor is a UGM. A UGM implementation can bring out trends of
urban growth and pinpoint areas where natural resources might be threatened. For instance, if
forest area is to be protected, then planners can experiment with different scenarios of urban
growth constraints in order to find which scenario results in minimum deforestation. UGMs
can model not only urban landuse but also every other landuse that may be significant in
order to achieve sustainability. Overall, UGM implementation should be an integral part of
the decision-making process of urban and regional planning because forecasting can reveal
where negative impacts might occur and can provide feedback for the planning process.
REFERENCES
Aravantinos, Α.Ι. 2007. Urban planning for a sustainable growth of urban space. Athens:
Symmetria.
Batty, M. 2009. Urban modeling. International Encyclopedia of Human Geography. Oxford,
UK: Elsevier.
Batty, M., Besussi, E. and Chin, N. 2003. Traffic, urban growth and suburban sprawl. CASA
Working Paper Series, 70, University College London (UCL), Britain.
Berglund, L. 2014. REPORT: Review of Land-Use Models-Summary and Documentation.
WSP Analysis & Strategy.
Bruegmann, R. 2005. Sprawl: A Compact History. Chicago, London: The University of
Chicago Press.
Chin, N. 2002. Unearthing the Roots of Urban Sprawl: A Critical Analysis of Form, Function
and Methodology. CASA Working Papers Series, 47, University College London
(UCL), Britain.
Clarke, K.C., Hoppen, S. and Gaydos, L. 1996. Methods and techniques for rigorous
calibration of a cellular automaton model of urban growth. Third International
Conference/Workshop on Integrating GIS and Environmental Modeling, Santa Fe, New
Mexico.
Clarke, K.C., Hoppen, S. and Gaydos, L. 1997. A self-modifying cellular automaton model of
historical. Environ Plan B, 24, 247-261.
Davis, K. 1955. The Origin and Growth of Urbanization in the World. American Journal of
Sociology, 60, 429-437.
Dietzel, C. and Clarke, K.C. 2004. Replication of Spatio-Temporal Land Use Patterns at three
levels of Aggregation by an Urban Cellular Automata, P.M.A. Sloot, B. Chopard, and
A.G. Hoekstra (Eds.), ACRI 2004, LNCS 3305, 523–532, Berlin, Heidelberg: Springer.
Doxiadis, C.A. 1964. The Ancient Greek City and the City of the Present. Ekistics, 18, 346-
364.
Doxiadis, C.A. 1971. Ancient Greek Settlements. Ekistics, 31, 4-21.
Hall, T. 2005. Urban Geography (Nikolaos Karachalios Trans). Athens: Kritiki.
Mathioulakis S. and Y. N. Photis / European Journal of Geography 8 2 107–120 (2017)
European Journal of Geography-ISSN 1792-1341 © All rights reserved 120
Hamidi, S. and Ewing, R. 2014. A longitudinal study of changes in urban sprawl between
2000 and 2010 in the United States. Landscape and Urban Planning, 128, 72-82.
Harris, C.D. and Ullman, E.L. 1945. The Nature of Cities. Annals of the American Academy
of Political and Social Science, 242, 7-17, Beverly Hills, CA: SAGE.
Hoyt, H. 1939. The Structure and Growth of Residential Neighbourhoods in American Cities.
Washington: Federal Housing Administration.
Lawrence, B.L. 2005. The context and causes of sprawl. Nature in fragments: the legacy of
sprawl. 3-17, New York, ΝΥ: Columbia University Press.
Liu, Y. 2008. Modelling urban development with geographical information systems and
cellular automata. Boca Raton, FL: CRC Press.
Lopez, R. 2014. Urban Sprawl in the United States: 1970-2010. Cities and the Environment
(CATE), 7(1), 7.
Pacione, M. 2009. Urban Geography: A Global Perspective (3rd ed.). New York, NY:
Routledge
Park, R.E., Burgess, E.W. and McKenzie, R.D. 1925. The City. Chicago, London: The
University of Chicago Press.
Parker, D.C., Manson, S.M., Janssen, M.A., Hoffmann, M.J. and Deadman, P. 2002.
Multi-agent systems for the simulation of land-use and land-cover change: a review.
Annals of the association of American Geographers, 93(2), 314-337.
Rui, Y. 2013. Urban Growth Modeling Based on Land-use Changes and Road Network
Expansion (Doctoral Dissertation). Royal Institute of Technology (KTH), Sweden
Santé, I., García, A.M., Miranda, D. and Crecente, R. 2010. Cellular automata models for the
simulation of real-world urban processes: A review and analysis. Landscape and Urban
Planning, 96(2), 108-122.
Torrens, P.M. 2006. Simulating Sprawl. Annals of the Association of American Geographers,
96(2), 248-275.
Tsompanoglou, S. and Photis, Y.N., 2013. Measuring urban concentration: a spatial cluster
typology based on public and private sector service patterns. World Review of Science,
Technology and Sustainable Development, 10(4), 185-202.
Urban models in MEDCs. (n.d.). Retrieved July 20, 2015, from
http://www.bbc.co.uk/schools/gcsebitesize/geography/urban_environments/urban_model
s_medcs_rev1.shtml
Waddell, P. and Ulfarsson, G.F., 2004. Introduction to Urban Simulation: Design and
Development of Operational Models. Handbook 5: Transport Geography and Spatial
Systems. Oxford: Pergamon Press.
Yoffee, N. 2005. Myths of the Archaic State: Evolution of the Earliest Cities, States, and
Civilizations. New York, NY: Cambridge University Press.