Embed Size (px)
Citation preview

Using The QMLProfiler
Ulf Hermann
Why?
What?
How To
Examples
New Features
1/28
Using The QML Profiler
Ulf Hermann
The Qt Company
October 8, 2014 / Qt Developer Days 2014

Using The QMLProfiler
Ulf Hermann
Why?
What?
How To
Examples
New Features
2/28
Outline
1 Reasons for Using a Specialized Profiler for Qt Quick
2 The QML Profiler
3 Analysing Typical Problems
4 Live Examples of Profiling and Optimization
5 New Features for the QML Profiler

Using The QMLProfiler
Ulf Hermann
Why?
What?
How To
Examples
New Features
3/28
Outline
1 Reasons for Using a Specialized Profiler for Qt Quick
2 The QML Profiler
3 Analysing Typical Problems
4 Live Examples of Profiling and Optimization
5 New Features for the QML Profiler
Using The QMLProfiler
Ulf Hermann
Why?
What?
How To
Examples
New Features
4/28
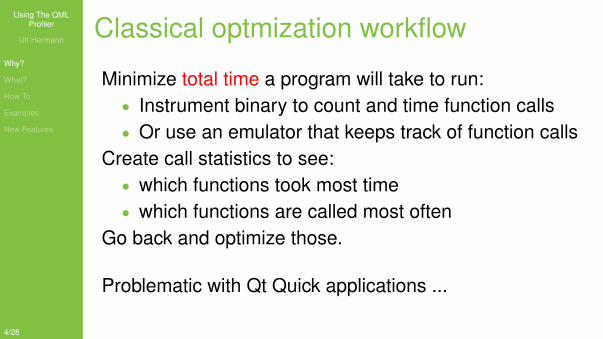
Classical optmization workflow
Minimize total time a program will take to run:• Instrument binary to count and time function calls• Or use an emulator that keeps track of function calls
Create call statistics to see:• which functions took most time• which functions are called most often
Go back and optimize those.
Problematic with Qt Quick applications ...
Using The QMLProfiler
Ulf Hermann
Why?
What?
How To
Examples
New Features
5/28
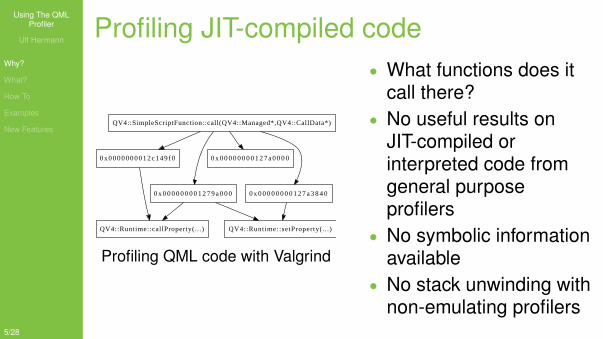
Profiling JIT-compiled code
QV4::SimpleScriptFunction::call(QV4::Managed*,QV4::CallData*)
0 x 0 0 0 0 0 0 0 0 1 2 7 9 a 0 0 0
0 x 0 0 0 0 0 0 0 0 1 2 7 a 0 0 0 00 x 0 0 0 0 0 0 0 0 1 2 c 1 4 9 f 0
0 x 0 0 0 0 0 0 0 0 1 2 7 a 3 8 4 0
QV4::Runtime::setProperty(. . .)QV4::Runtime::callProperty(...)
Profiling QML code with Valgrind
• What functions does itcall there?
• No useful results onJIT-compiled orinterpreted code fromgeneral purposeprofilers
• No symbolic informationavailable
• No stack unwinding withnon-emulating profilers
Using The QMLProfiler
Ulf Hermann
Why?
What?
How To
Examples
New Features
6/28
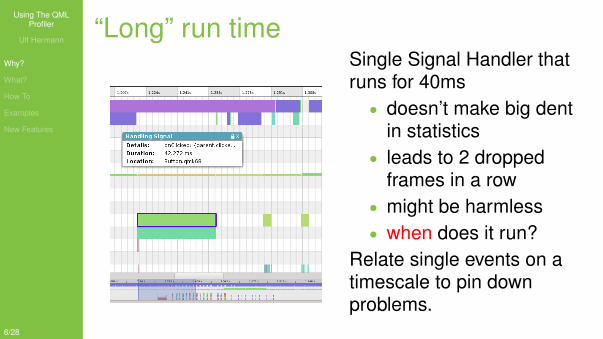
“Long” run timeSingle Signal Handler thatruns for 40ms
• doesn’t make big dentin statistics
• leads to 2 droppedframes in a row
• might be harmless• when does it run?
Relate single events on atimescale to pin downproblems.
Using The QMLProfiler
Ulf Hermann
Why?
What?
How To
Examples
New Features
7/28
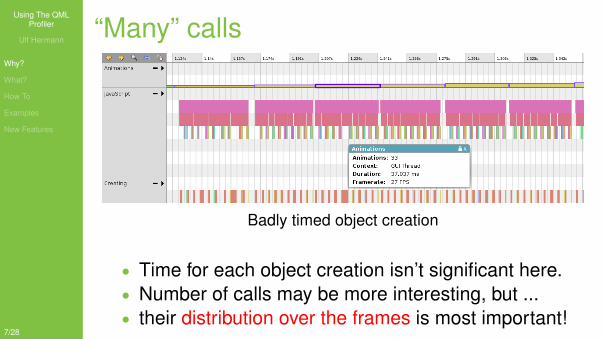
“Many” calls
Badly timed object creation
• Time for each object creation isn’t significant here.• Number of calls may be more interesting, but ...• their distribution over the frames is most important!

Using The QMLProfiler
Ulf Hermann
Why?
What?
How To
Examples
New Features
8/28
Outline
1 Reasons for Using a Specialized Profiler for Qt Quick
2 The QML Profiler
3 Analysing Typical Problems
4 Live Examples of Profiling and Optimization
5 New Features for the QML Profiler
Using The QMLProfiler
Ulf Hermann
Why?
What?
How To
Examples
New Features
9/28
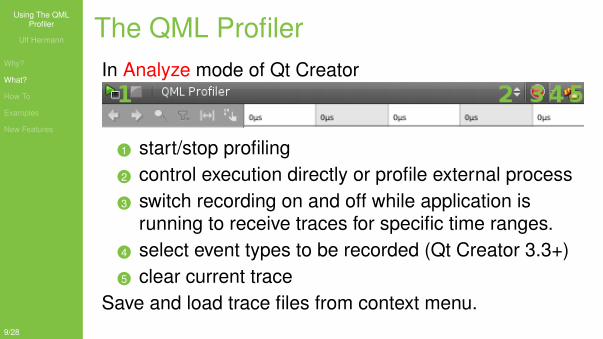
The QML ProfilerIn Analyze mode of Qt Creator
1 start/stop profiling2 control execution directly or profile external process3 switch recording on and off while application is
running to receive traces for specific time ranges.4 select event types to be recorded (Qt Creator 3.3+)5 clear current trace
Save and load trace files from context menu.
Using The QMLProfiler
Ulf Hermann
Why?
What?
How To
Examples
New Features
10/28
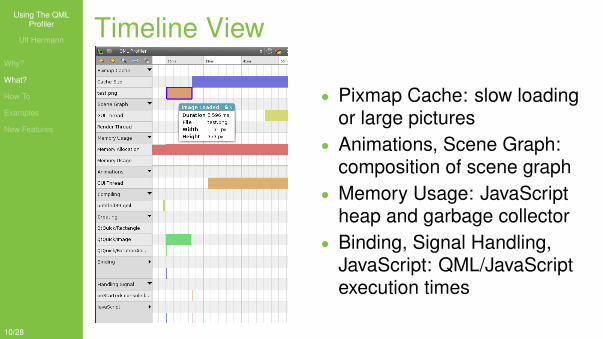
Timeline View
• Pixmap Cache: slow loadingor large pictures
• Animations, Scene Graph:composition of scene graph
• Memory Usage: JavaScriptheap and garbage collector
• Binding, Signal Handling,JavaScript: QML/JavaScriptexecution times
Using The QMLProfiler
Ulf Hermann
Why?
What?
How To
Examples
New Features
11/28
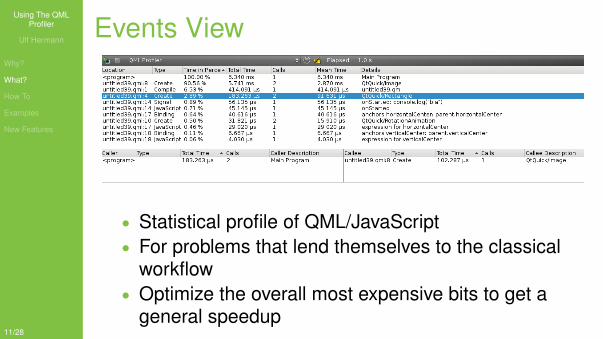
Events View
• Statistical profile of QML/JavaScript• For problems that lend themselves to the classical
workflow• Optimize the overall most expensive bits to get a
general speedup

Using The QMLProfiler
Ulf Hermann
Why?
What?
How To
Examples
New Features
12/28
Outline
1 Reasons for Using a Specialized Profiler for Qt Quick
2 The QML Profiler
3 Analysing Typical Problems
4 Live Examples of Profiling and Optimization
5 New Features for the QML Profiler
Using The QMLProfiler
Ulf Hermann
Why?
What?
How To
Examples
New Features
13/28
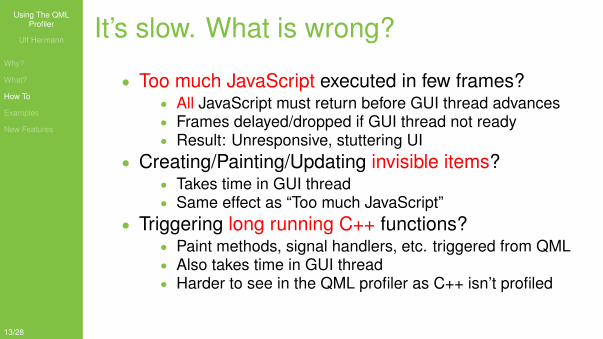
It’s slow. What is wrong?
• Too much JavaScript executed in few frames?• All JavaScript must return before GUI thread advances• Frames delayed/dropped if GUI thread not ready• Result: Unresponsive, stuttering UI
• Creating/Painting/Updating invisible items?• Takes time in GUI thread• Same effect as “Too much JavaScript”
• Triggering long running C++ functions?• Paint methods, signal handlers, etc. triggered from QML• Also takes time in GUI thread• Harder to see in the QML profiler as C++ isn’t profiled
Using The QMLProfiler
Ulf Hermann
Why?
What?
How To
Examples
New Features
14/28
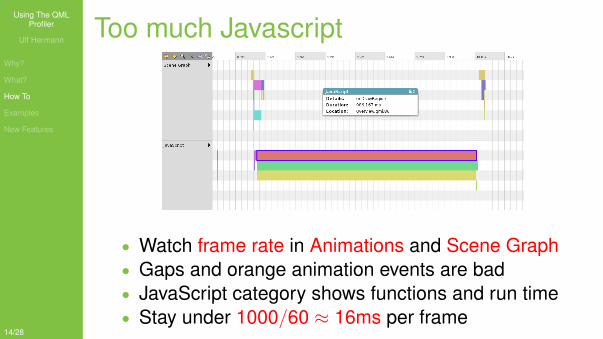
Too much Javascript
• Watch frame rate in Animations and Scene Graph• Gaps and orange animation events are bad• JavaScript category shows functions and run time• Stay under 1000/60 ≈ 16ms per frame
Using The QMLProfiler
Ulf Hermann
Why?
What?
How To
Examples
New Features
15/28
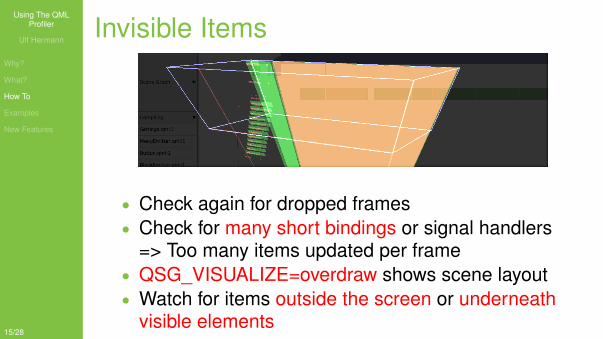
Invisible Items
• Check again for dropped frames• Check for many short bindings or signal handlers
=> Too many items updated per frame• QSG_VISUALIZE=overdraw shows scene layout• Watch for items outside the screen or underneath
visible elements
Using The QMLProfiler
Ulf Hermann
Why?
What?
How To
Examples
New Features
16/28
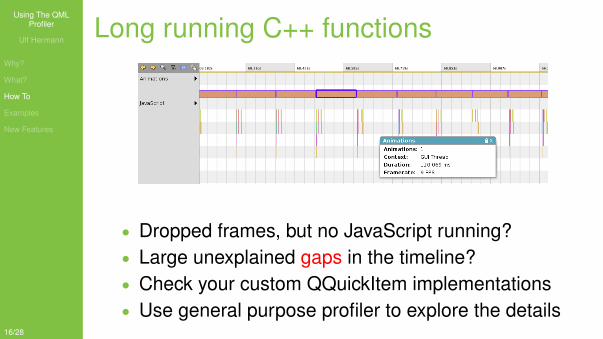
Long running C++ functions
• Dropped frames, but no JavaScript running?• Large unexplained gaps in the timeline?• Check your custom QQuickItem implementations• Use general purpose profiler to explore the details

Using The QMLProfiler
Ulf Hermann
Why?
What?
How To
Examples
New Features
17/28
Outline
1 Reasons for Using a Specialized Profiler for Qt Quick
2 The QML Profiler
3 Analysing Typical Problems
4 Live Examples of Profiling and Optimization
5 New Features for the QML Profiler
Using The QMLProfiler
Ulf Hermann
Why?
What?
How To
Examples
New Features
18/28
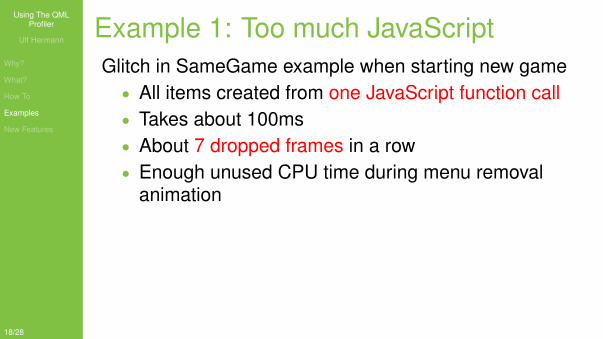
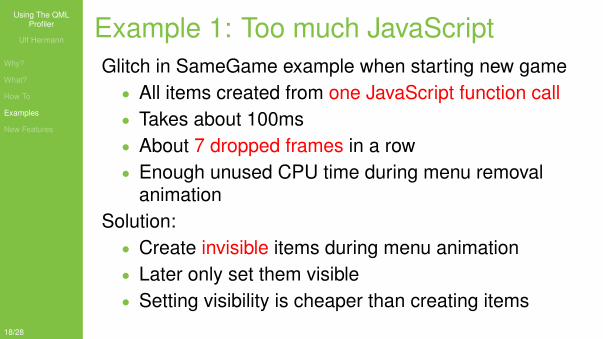
Example 1: Too much JavaScriptGlitch in SameGame example when starting new game
• All items created from one JavaScript function call• Takes about 100ms• About 7 dropped frames in a row• Enough unused CPU time during menu removal
animationSolution:
• Create invisible items during menu animation• Later only set them visible• Setting visibility is cheaper than creating items
Using The QMLProfiler
Ulf Hermann
Why?
What?
How To
Examples
New Features
18/28
Example 1: Too much JavaScriptGlitch in SameGame example when starting new game
• All items created from one JavaScript function call• Takes about 100ms• About 7 dropped frames in a row• Enough unused CPU time during menu removal
animation
Solution:• Create invisible items during menu animation• Later only set them visible• Setting visibility is cheaper than creating items
Using The QMLProfiler
Ulf Hermann
Why?
What?
How To
Examples
New Features
18/28
Example 1: Too much JavaScriptGlitch in SameGame example when starting new game
• All items created from one JavaScript function call• Takes about 100ms• About 7 dropped frames in a row• Enough unused CPU time during menu removal
animationSolution:
• Create invisible items during menu animation• Later only set them visible• Setting visibility is cheaper than creating items
Using The QMLProfiler
Ulf Hermann
Why?
What?
How To
Examples
New Features
19/28
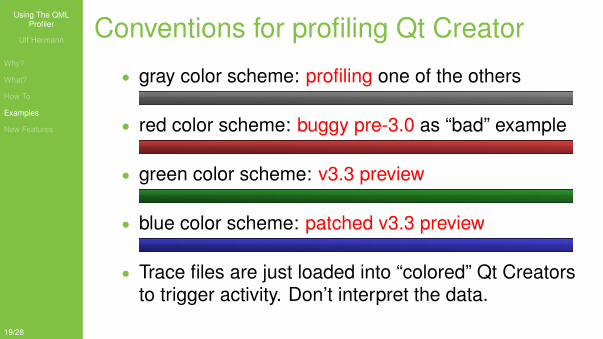
Conventions for profiling Qt Creator
• gray color scheme: profiling one of the others
• red color scheme: buggy pre-3.0 as “bad” example
• green color scheme: v3.3 preview
• blue color scheme: patched v3.3 preview
• Trace files are just loaded into “colored” Qt Creatorsto trigger activity. Don’t interpret the data.
Using The QMLProfiler
Ulf Hermann
Why?
What?
How To
Examples
New Features
20/28
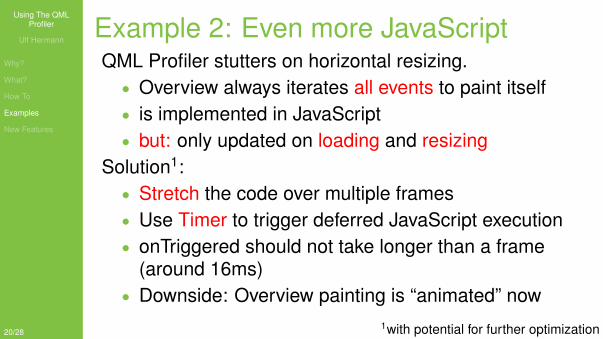
Example 2: Even more JavaScriptQML Profiler stutters on horizontal resizing.
• Overview always iterates all events to paint itself• is implemented in JavaScript• but: only updated on loading and resizing
Solution1:• Stretch the code over multiple frames• Use Timer to trigger deferred JavaScript execution• onTriggered should not take longer than a frame
(around 16ms)• Downside: Overview painting is “animated” now
1with potential for further optimization ...
Using The QMLProfiler
Ulf Hermann
Why?
What?
How To
Examples
New Features
20/28
Example 2: Even more JavaScriptQML Profiler stutters on horizontal resizing.
• Overview always iterates all events to paint itself• is implemented in JavaScript• but: only updated on loading and resizing
Solution1:• Stretch the code over multiple frames• Use Timer to trigger deferred JavaScript execution• onTriggered should not take longer than a frame
(around 16ms)• Downside: Overview painting is “animated” now
1with potential for further optimization ...
Using The QMLProfiler
Ulf Hermann
Why?
What?
How To
Examples
New Features
21/28
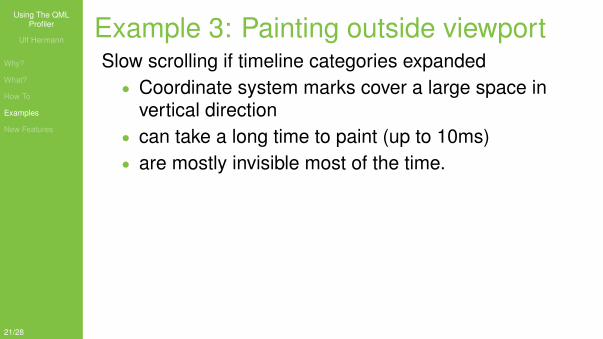
Example 3: Painting outside viewportSlow scrolling if timeline categories expanded
• Coordinate system marks cover a large space invertical direction
• can take a long time to paint (up to 10ms)• are mostly invisible most of the time.
Solution2:• Only paint visible part of coordinate system• Directly set virtual contentHeight on Flickable• Painted area “sliding” in virtual contentHeight• Reduces painting time to about 1 - 2ms
2with potential for further optimization ...
Using The QMLProfiler
Ulf Hermann
Why?
What?
How To
Examples
New Features
21/28
Example 3: Painting outside viewportSlow scrolling if timeline categories expanded
• Coordinate system marks cover a large space invertical direction
• can take a long time to paint (up to 10ms)• are mostly invisible most of the time.
Solution2:• Only paint visible part of coordinate system• Directly set virtual contentHeight on Flickable• Painted area “sliding” in virtual contentHeight• Reduces painting time to about 1 - 2ms
2with potential for further optimization ...
Using The QMLProfiler
Ulf Hermann
Why?
What?
How To
Examples
New Features
22/28
Example 4: Expensive C++Timeline scrolling still slow for some traces
• Timeline data painted for all categories, no matterhow many are visible
• Takes a lot of time, especially in “dense” places.• Hard to see in QML Profiler, as painting is
implemented in C++.• QSG_VISUALIZE=overdraw can help.
Solution3:• Again, only paint visible part of timeline.• Same technique as with coordinate system.
3with potential for further optimization ...
Using The QMLProfiler
Ulf Hermann
Why?
What?
How To
Examples
New Features
23/28
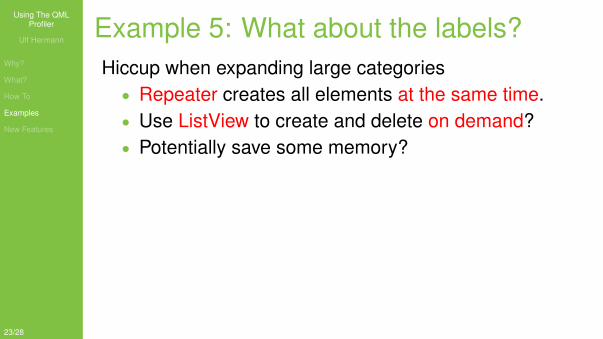
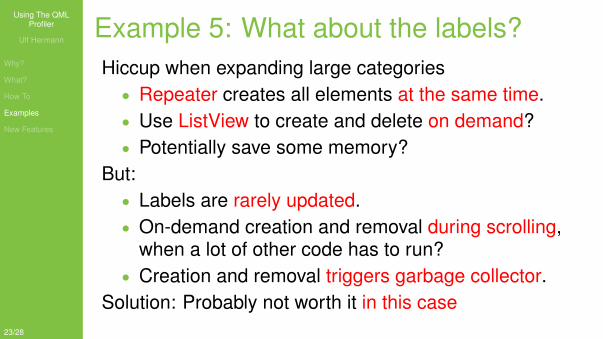
Example 5: What about the labels?Hiccup when expanding large categories
• Repeater creates all elements at the same time.• Use ListView to create and delete on demand?• Potentially save some memory?
But:• Labels are rarely updated.• On-demand creation and removal during scrolling,
when a lot of other code has to run?• Creation and removal triggers garbage collector.
Solution: Probably not worth it in this case
Using The QMLProfiler
Ulf Hermann
Why?
What?
How To
Examples
New Features
23/28
Example 5: What about the labels?Hiccup when expanding large categories
• Repeater creates all elements at the same time.• Use ListView to create and delete on demand?• Potentially save some memory?
But:• Labels are rarely updated.• On-demand creation and removal during scrolling,
when a lot of other code has to run?• Creation and removal triggers garbage collector.
Solution: Probably not worth it in this case

Using The QMLProfiler
Ulf Hermann
Why?
What?
How To
Examples
New Features
24/28
Outline
1 Reasons for Using a Specialized Profiler for Qt Quick
2 The QML Profiler
3 Analysing Typical Problems
4 Live Examples of Profiling and Optimization
5 New Features for the QML Profiler
Using The QMLProfiler
Ulf Hermann
Why?
What?
How To
Examples
New Features
25/28
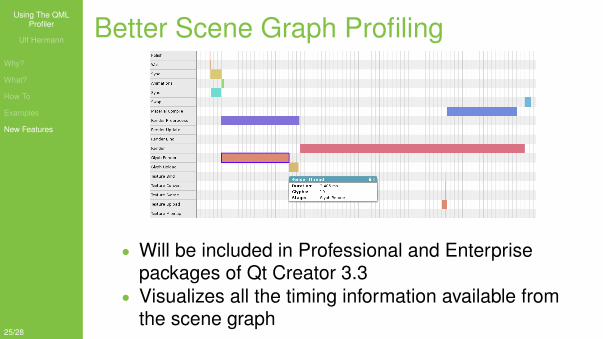
Better Scene Graph Profiling
• Will be included in Professional and Enterprisepackages of Qt Creator 3.3
• Visualizes all the timing information available fromthe scene graph
Using The QMLProfiler
Ulf Hermann
Why?
What?
How To
Examples
New Features
26/28
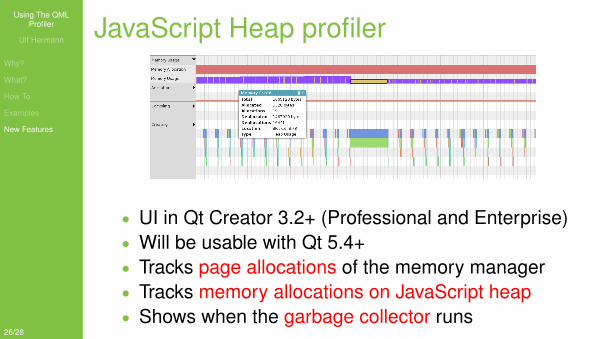
JavaScript Heap profiler
• UI in Qt Creator 3.2+ (Professional and Enterprise)• Will be usable with Qt 5.4+• Tracks page allocations of the memory manager• Tracks memory allocations on JavaScript heap• Shows when the garbage collector runs
Using The QMLProfiler
Ulf Hermann
Why?
What?
How To
Examples
New Features
27/28
Selective recording
• Switch off recording of events you’re not interested in• Reduces amount of data created• Record longer traces without running into memory
bottlenecks• Smaller trace files, faster loading
Using The QMLProfiler
Ulf Hermann
Why?
What?
How To
Examples
New Features
28/28
Various UI improvements
• Drag&Drop reordering of categories• Completely hide categories to reduce height of
timeline• Resize rows in timeline